Article

How Image Acquisition Geometry of UAV Campaigns Affects the Derived Products and Their Accuracy in Areas with Complex Geomorphology

by
Aggeliki Kyriou
,
Konstantinos Nikolakopoulos
* and
Ioannis Koukouvelas
Department of Geology, University of Patras, 265 04 Patras, Greece
*
Author to whom correspondence should be addressed.
ISPRS Int. J. Geo-Inf. 2021, 10(6), 408; https://0-doi-org.brum.beds.ac.uk/10.3390/ijgi10060408
Submission received: 30 March 2021 / Revised: 8 June 2021 / Accepted: 11 June 2021 / Published: 13 June 2021
(This article belongs to the Special Issue GIS and Remote Sensing Applications in Geomorphology)

Abstract

:
The detailed and accurate mapping of landscapes and their geomorphological characteristics is a key issue in hazard management. The current study examines whether the image acquisition geometry of unmanned aerial vehicle (UAV) campaigns affects the accuracy of the derived products, i.e., orthophotos, digital surface models (DSMs) and photogrammetric point clouds, while performing a detailed geomorphological mapping of a landslide area. UAV flights were executed and the collected imagery was organized into three subcategories based on the viewing angle of the UAV camera. The first subcategory consists of the nadir imagery, the second is composed of the oblique imagery and the third category blends both nadir and oblique imagery. UAV imagery processing was carried out using structure-from-motion photogrammetry (SfM). High-resolution products were generated, consisting of orthophotos, DSMs and photogrammetric-based point clouds. Their accuracy was evaluated utilizing statistical approaches such as the estimation of the root mean square error (RMSE), calculation of the geometric mean of a feature, length measurement, calculation of cloud-to-cloud distances as well as qualitive criteria. All the quantitative and qualitative results were taken into account for the impact assessment. It was demonstrated that the oblique-viewing geometry as well as the combination of nadir and oblique imagery could be used effectively for geomorphological mapping in areas with complex topography and steep slopes that overpass 60 degrees. Moreover, the accuracy assessment revealed that those acquisition geometries contribute to the creation of significantly better products compared to the corresponding one arising from nadir-viewing imagery.

1. Introduction

Over the past few decades, scientists have drawn attention to global climate change as the analysis of emissions indicate that greenhouse gases are increasing [1]. The environmental consequences of climate change are felt through differences in climate variability and the occurrence of extreme weather conditions, which could lead to devastating natural disasters (heat waves, hurricanes, floods, landslides, etc.) [2]. Researchers are trying to develop methodologies, practices and plans towards ensuring safety and reducing disaster risk to humans [3,4]. Several studies have been published on the contribution of unmanned aerial vehicles (UAVs) to disaster risk management and mitigation [5,6]. Research of areas prone to natural disasters as well as the construction of protective measures is based on a detailed and accurate mapping of all the geomorphological characteristics of a landform.
Nowadays, mapping takes place with more modern, less time consuming and less costly techniques, which utilize remote sensing data acquired by satellites, airborne platforms or by more innovative systems such as UAVs [7]. The utilization of UAVs in precision mapping seems to be more effective compared to the classical topographic survey, resulting in the creation of orthophotos and digital surface models (DSMs) with extremely fine resolution [8]. In this context, high-resolution and low-cost data obtained by UAVs could potentially be used to create and update maps by providing orthophotos with sub-decimeter accuracy [9]. In addition, UAV-based point clouds and DSMs prove comparable to corresponding products arising from terrestrial laser scanning (TLS) survey [10]. Moreover, the integration of UAV photogrammetric surveys in the traditional geological surveys result in a faster and more comprehensive geomorphological mapping as data from inaccessible areas are also included [11,12].
Several studies feature the advantages of using UAVs to monitor natural hazards. High-precision UAV photogrammetry has already been successfully applied both for the determination of the spatial characteristics of active faults and the measurement of seismic offset [13], as well as for the description of the topographic and morphological changes after a volcanic eruption and the subsequent monitoring of the slope deformation, aiming at detecting instability phenomena [14]. To document natural hazards, UAV images can be used to create ortho-photos, dense clouds, 3D models and digital elevation models [11]. It is recommended that the UAVs should be equipped with a 20 MP camera to acquire images over the site with fixed ground control points for geo-referencing in order to produce a photogrammetric ortho-image and point cloud 3D model of the demonstration site and also for comparison over temporal intervals [6].
Furthermore, orthophotos obtained by a fix-wing UAV were used along with an algorithm based on object-based image analysis technique for the detection and mapping of landslides [15]. A newly developed UAV was tested for its applicability towards an effective mapping and characterization of landslides via the generation of 3D representations of surfaces [16]. An intergraded approach for precise landslide mapping and monitoring was implemented for a four-year period, containing more than twenty UAV photogrammetric surveys and aiming at the evaluation of the landslide activity [17]. Moreover, a study of cultural heritage sites affected by geo-hazards utilized UAVs and photogrammetry to create orthophotos and 3D models in order to identify areas sensitive to natural hazards [18,19].
Nevertheless, some studies focused on more technical parts of UAV photogrammetry, such as image acquisition geometry. In particular, different scenarios in camera combination, i.e., oblique and vertical, were combined with the configuration of the ground control points in order to examine their effect on the accuracy of the extracted digital elevation models (DEMs) [20]. In another study, the incorporation of nadir and oblique orientation of images was led to the creation of high-precision 3D surface models [21]. However, it was also demonstrated that nadir orientation images along with a dense distribution of ground control points (GCPs) exhibited similar accuracy, which is even comparable to the one obtained from a terrestrial laser scanner [21]. In addition, various datasets including different configurations of nadir-oblique imagery were evaluated in terms of point cloud density and accuracy and showed no significant differences [22]. Nadir and off-nadir images were evaluated for high-resolution topography, presenting an accuracy of a few centimeters [23]. Other studies suggested oblique acquisition imagery as a very promising and an effective approach to obtain three-dimensional representations of the surface, especially in areas close to cities, archeological sites and even quarries [24,25]. The combination of oblique and façade-looking imagery enhanced the geometric accuracy of the point clouds and was more suitable for the reconstruction of complex topographies [26].
The current study examines whether the image acquisition geometry of UAV campaigns affects the accuracy of the derived products (orthophotos, DSMs, photogrammetric point clouds), while performing a detailed geomorphological mapping of a landslide area. Four UAV flights were executed and three subcategories for each campaign were created. The subcategories consisted of nadir imagery, oblique imagery and a combination of nadir and oblique imagery. The processing of UAV data was carried out using structure-from-motion photogrammetry (SfM) and high-resolution products were generated, consisting of twelve orthophotos, twelve DSMs and twelve photogrammetric-based point clouds. Then, orthophotos and DSMs were integrated into an ArcGIS environment in order to check their accuracy through statistical approaches such as estimation of the root mean square error (RMSE), calculation of the geometric mean of a feature, etc. Concerning the photogrammetric point clouds, the comparison was based on the calculation of cloud-to-cloud distances (C2C) and the creation of elevation profiles. The impact assessment of different image acquisition geometries of UAV flights, during the detailed mapping of a landform took into account all the quantitative and qualitative results and the outputs of point cloud processing.

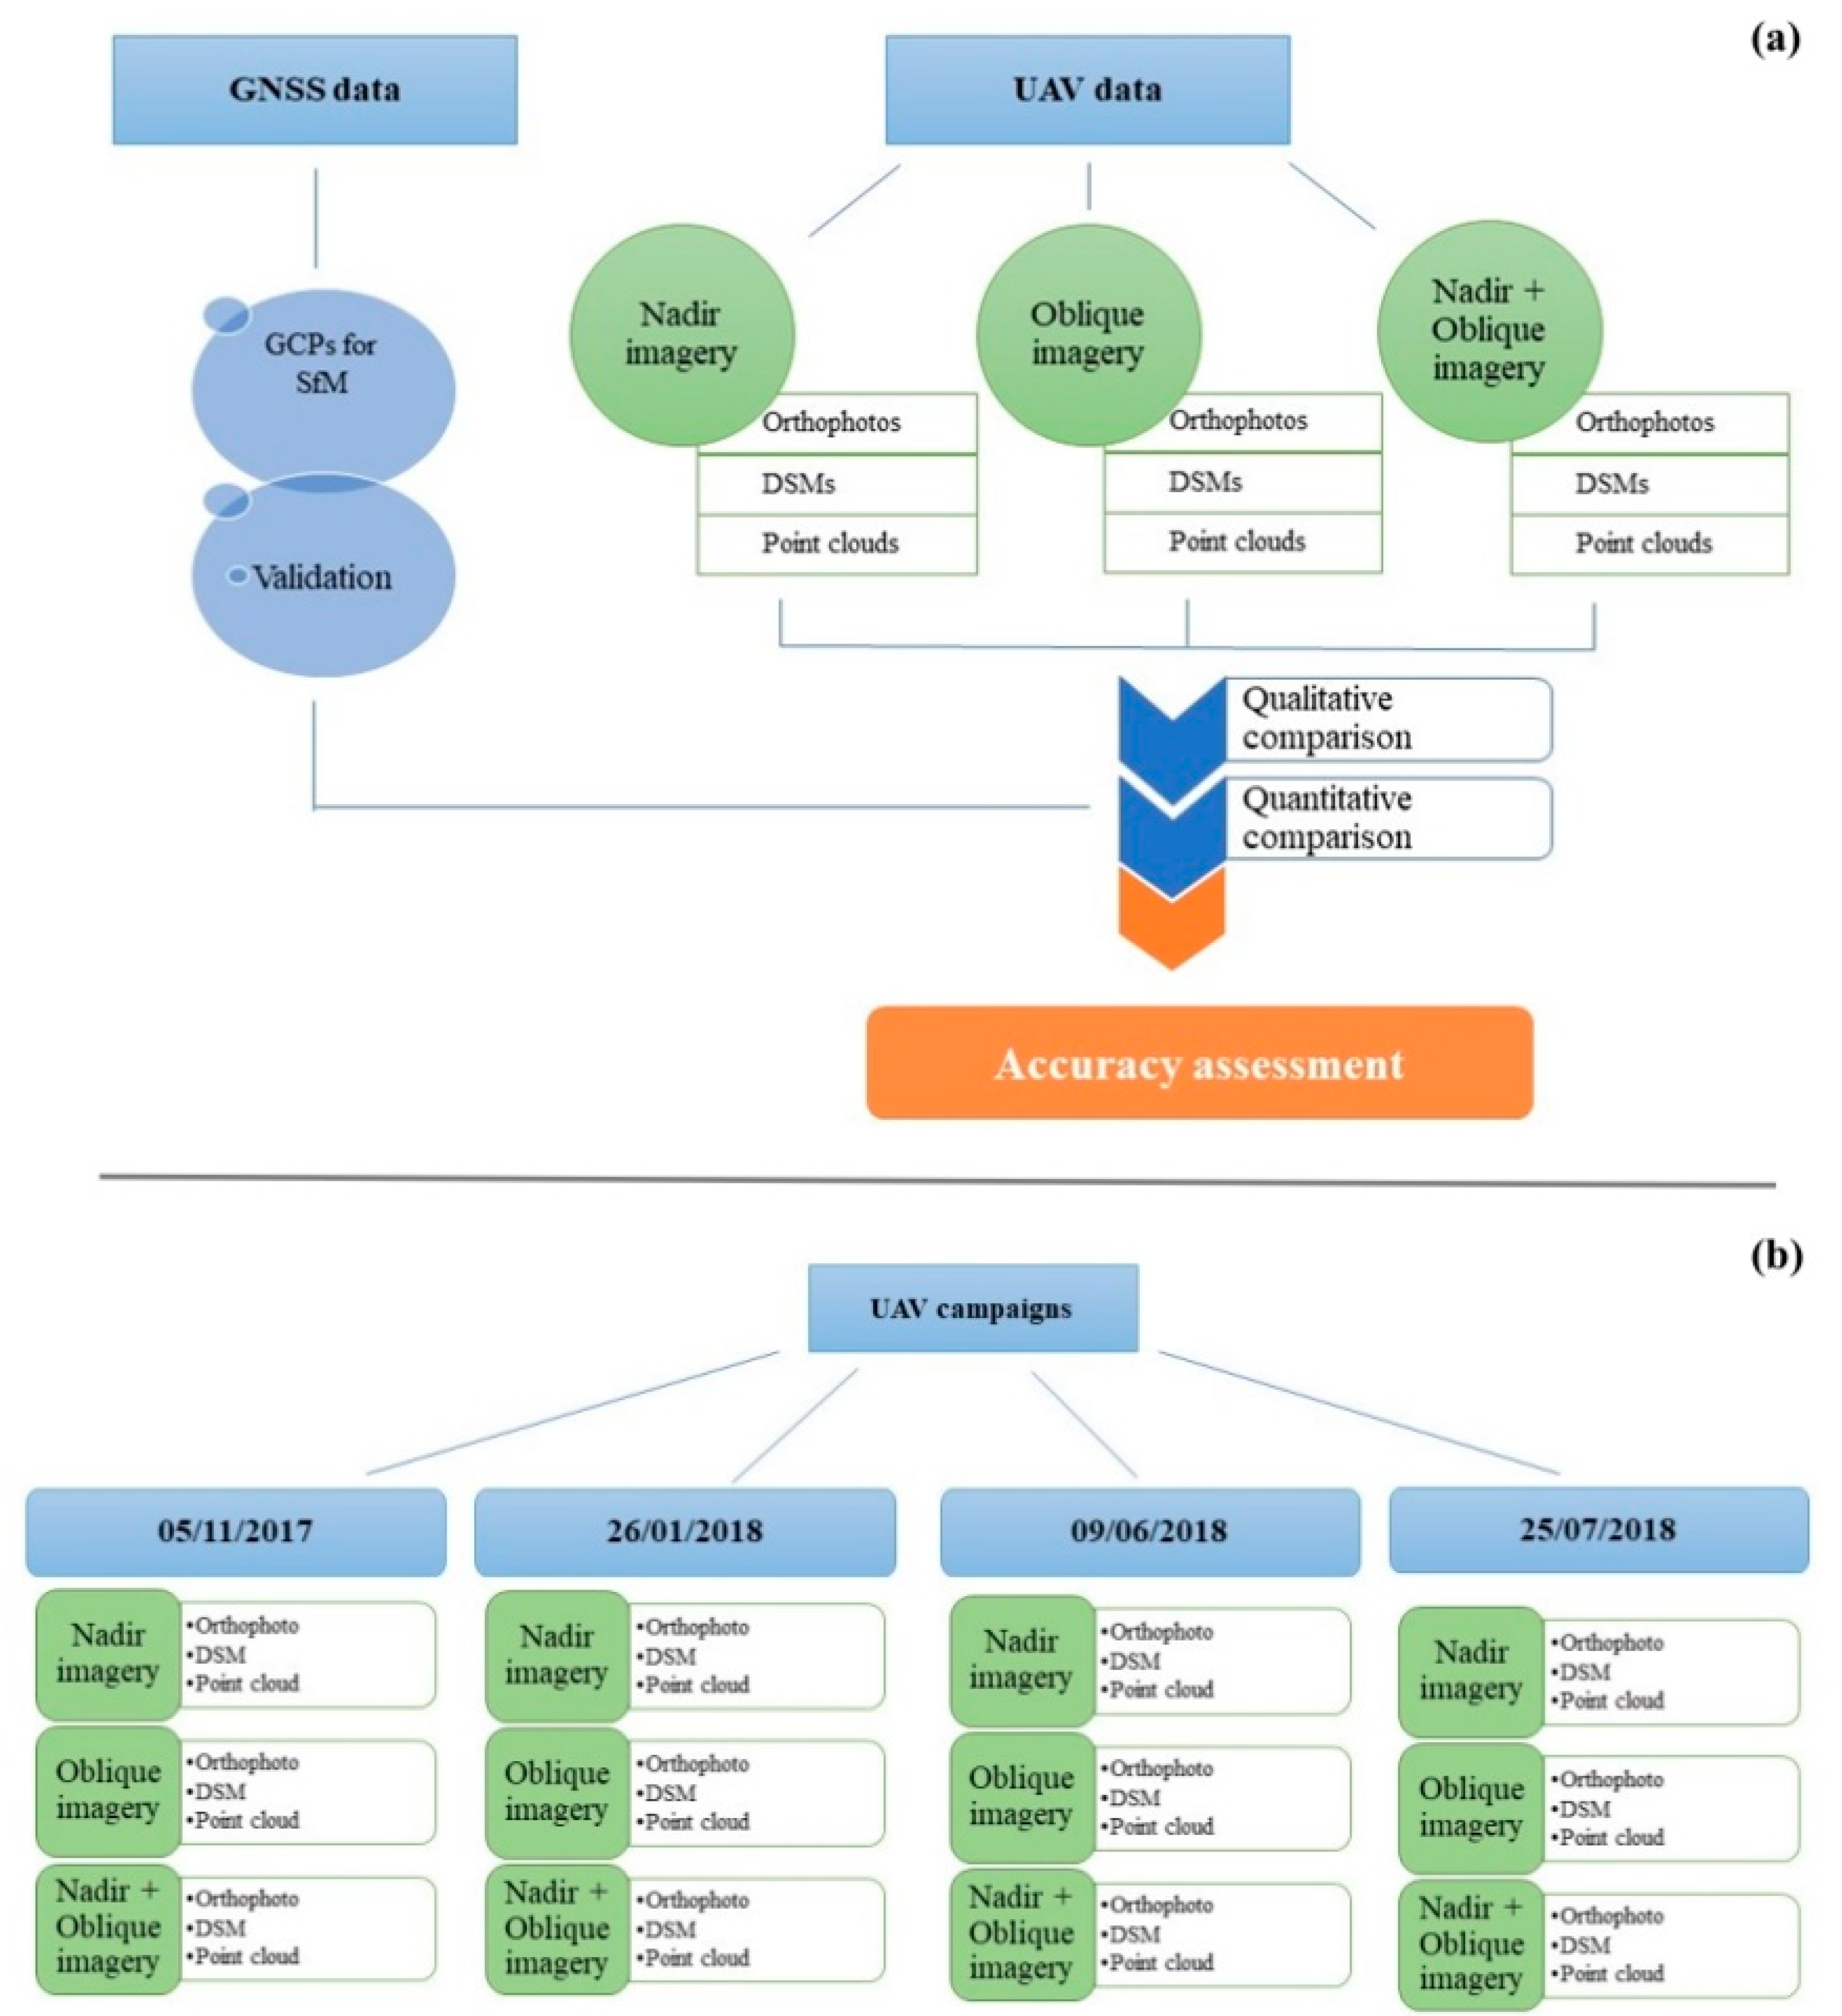
2. Materials and Methods
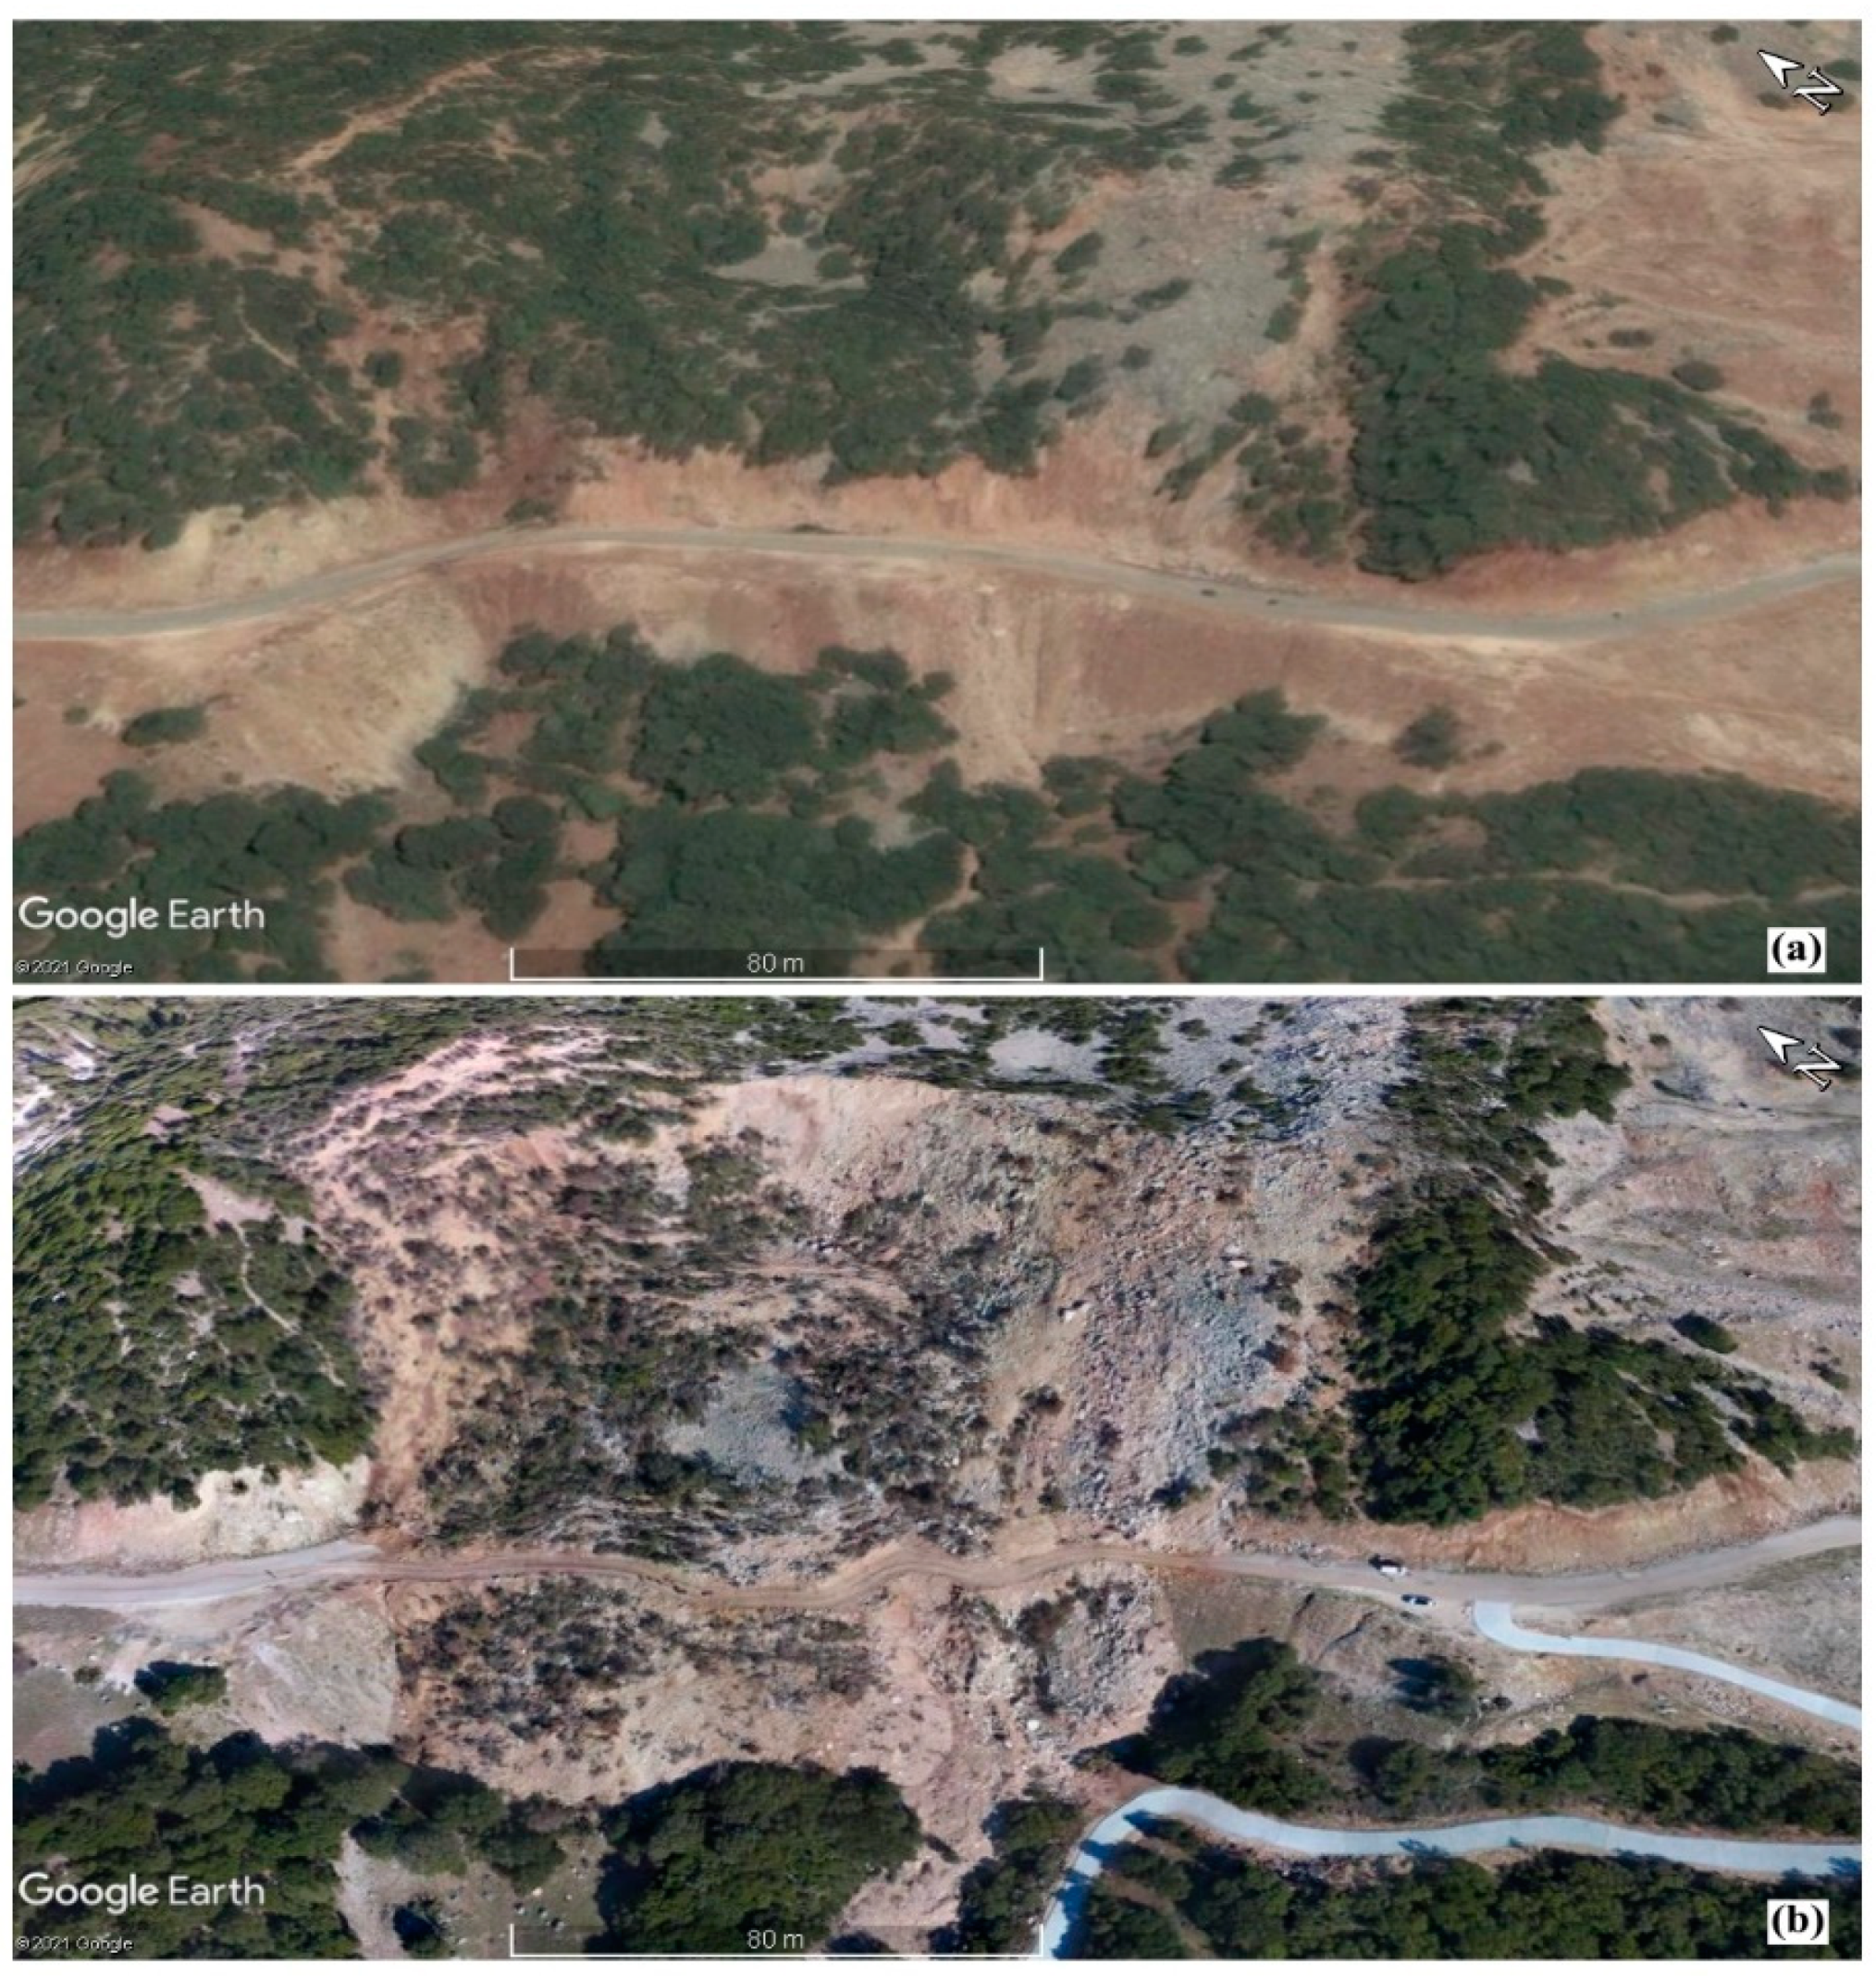
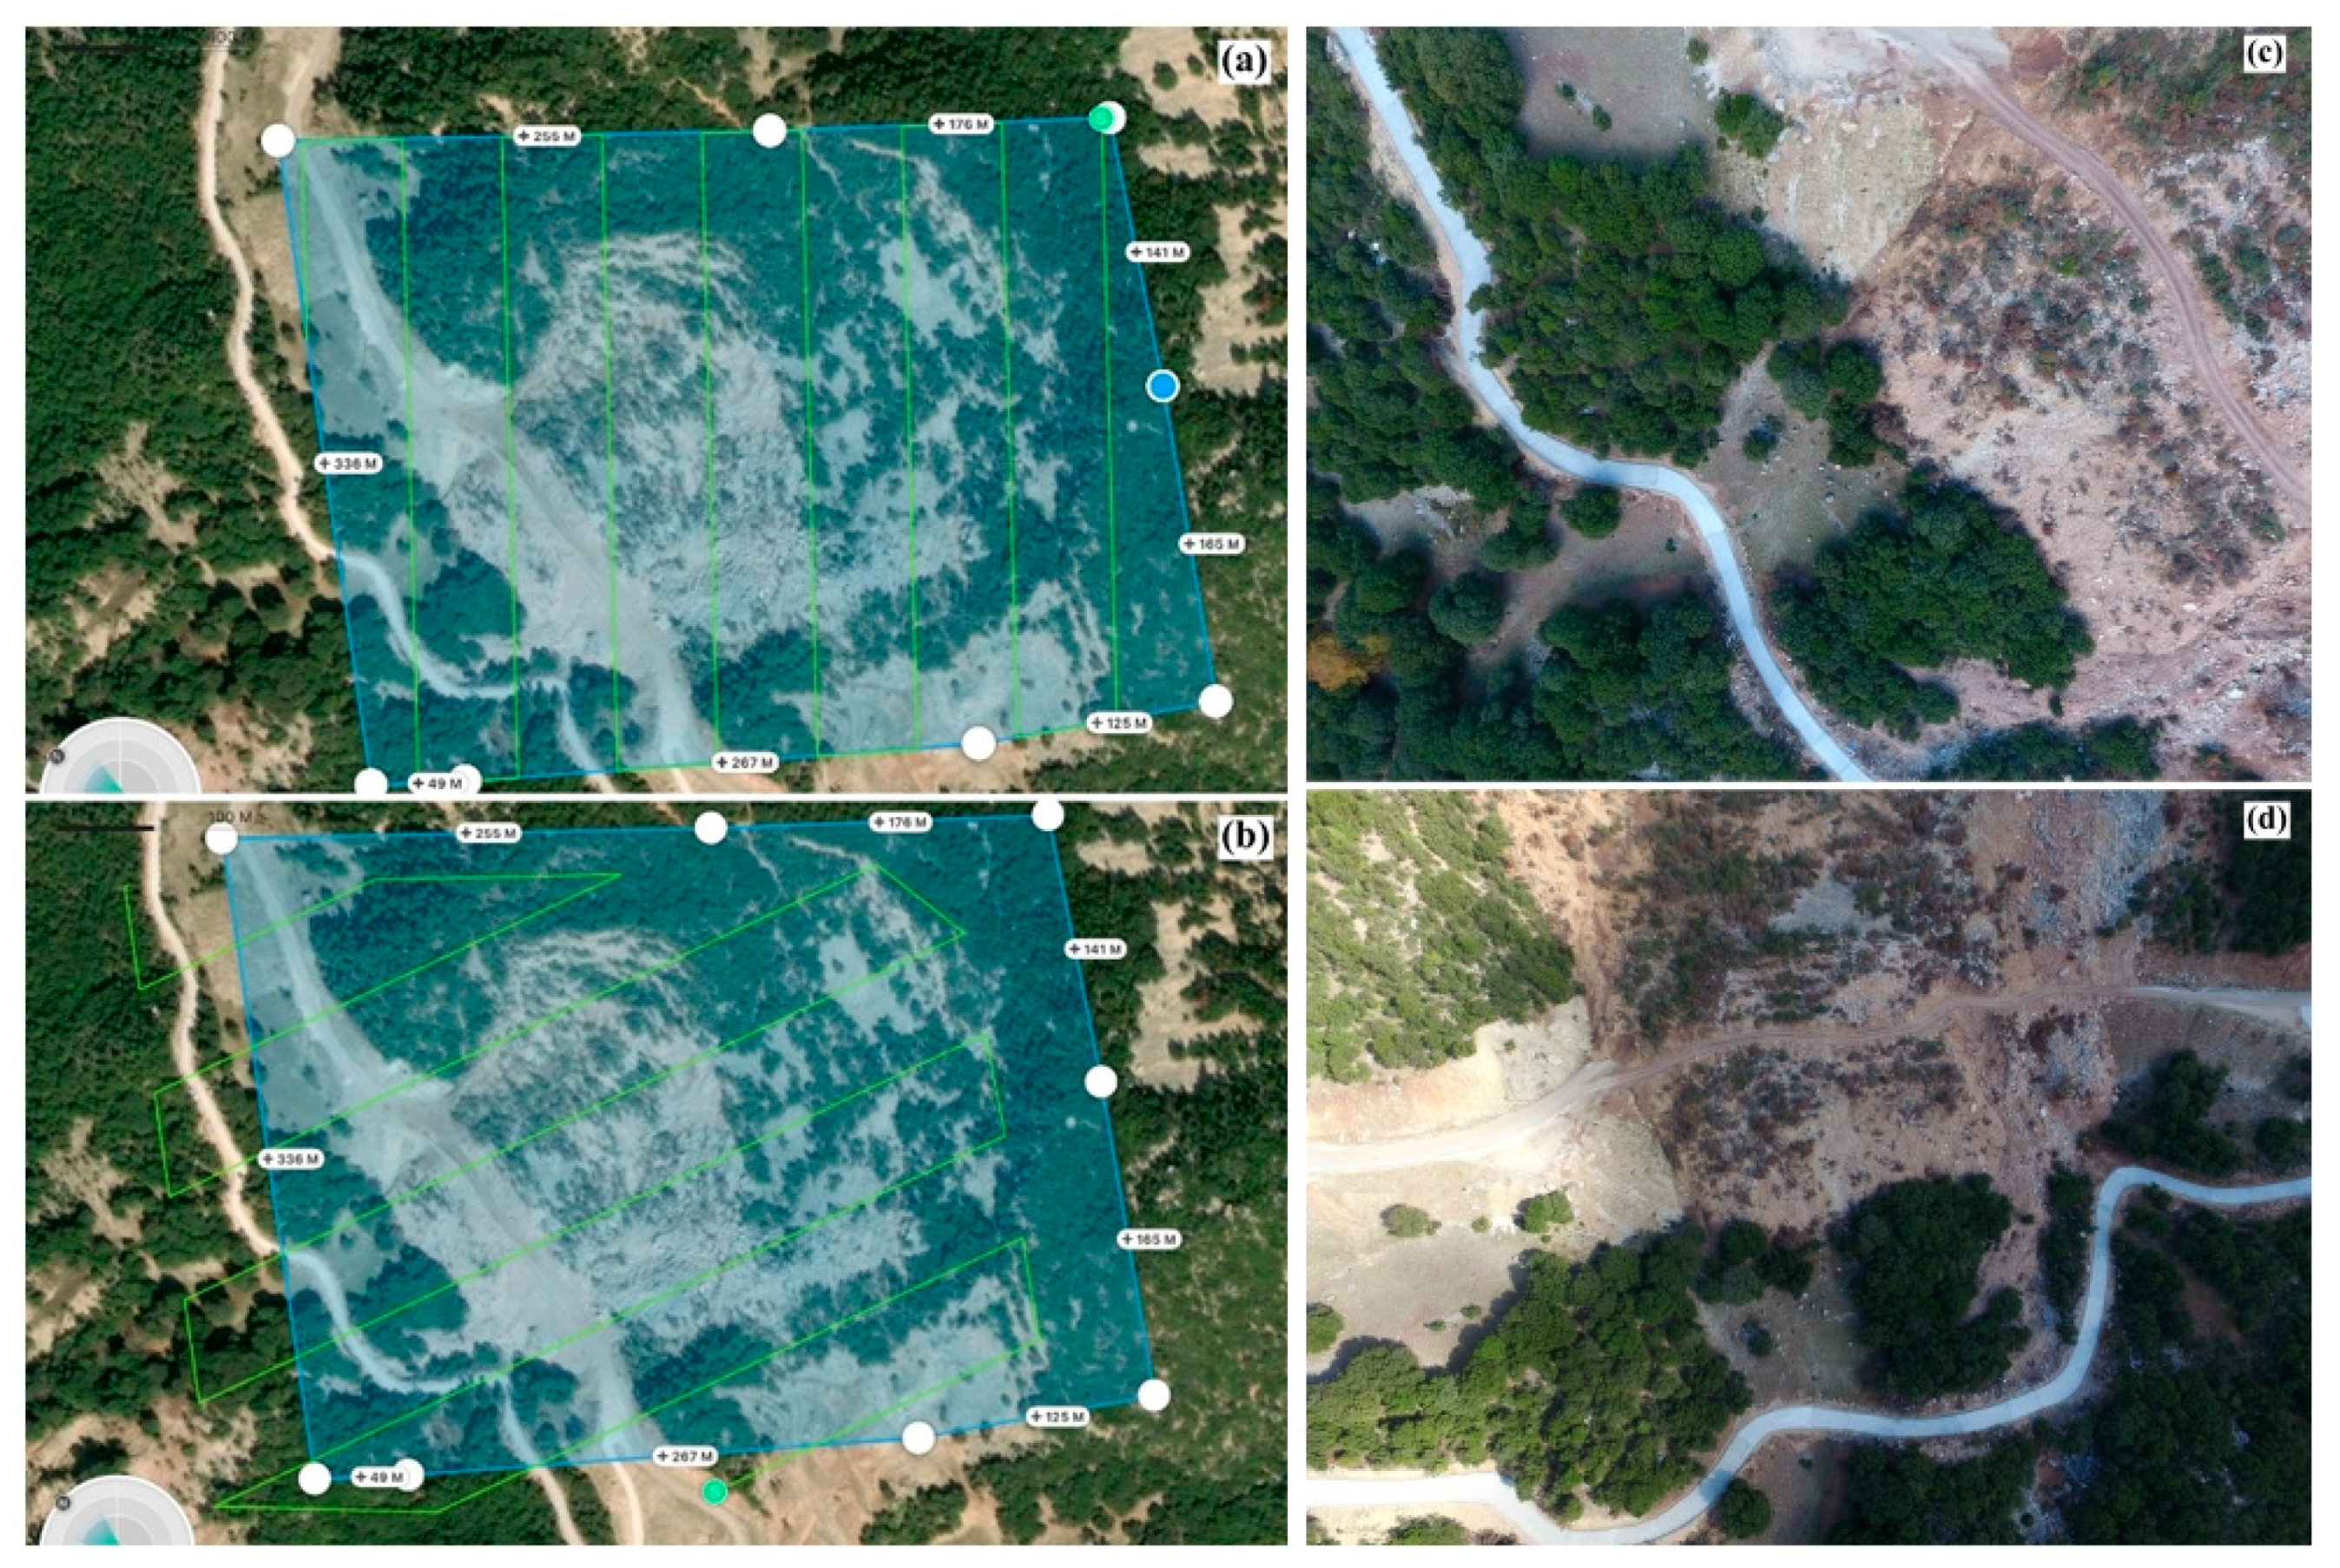
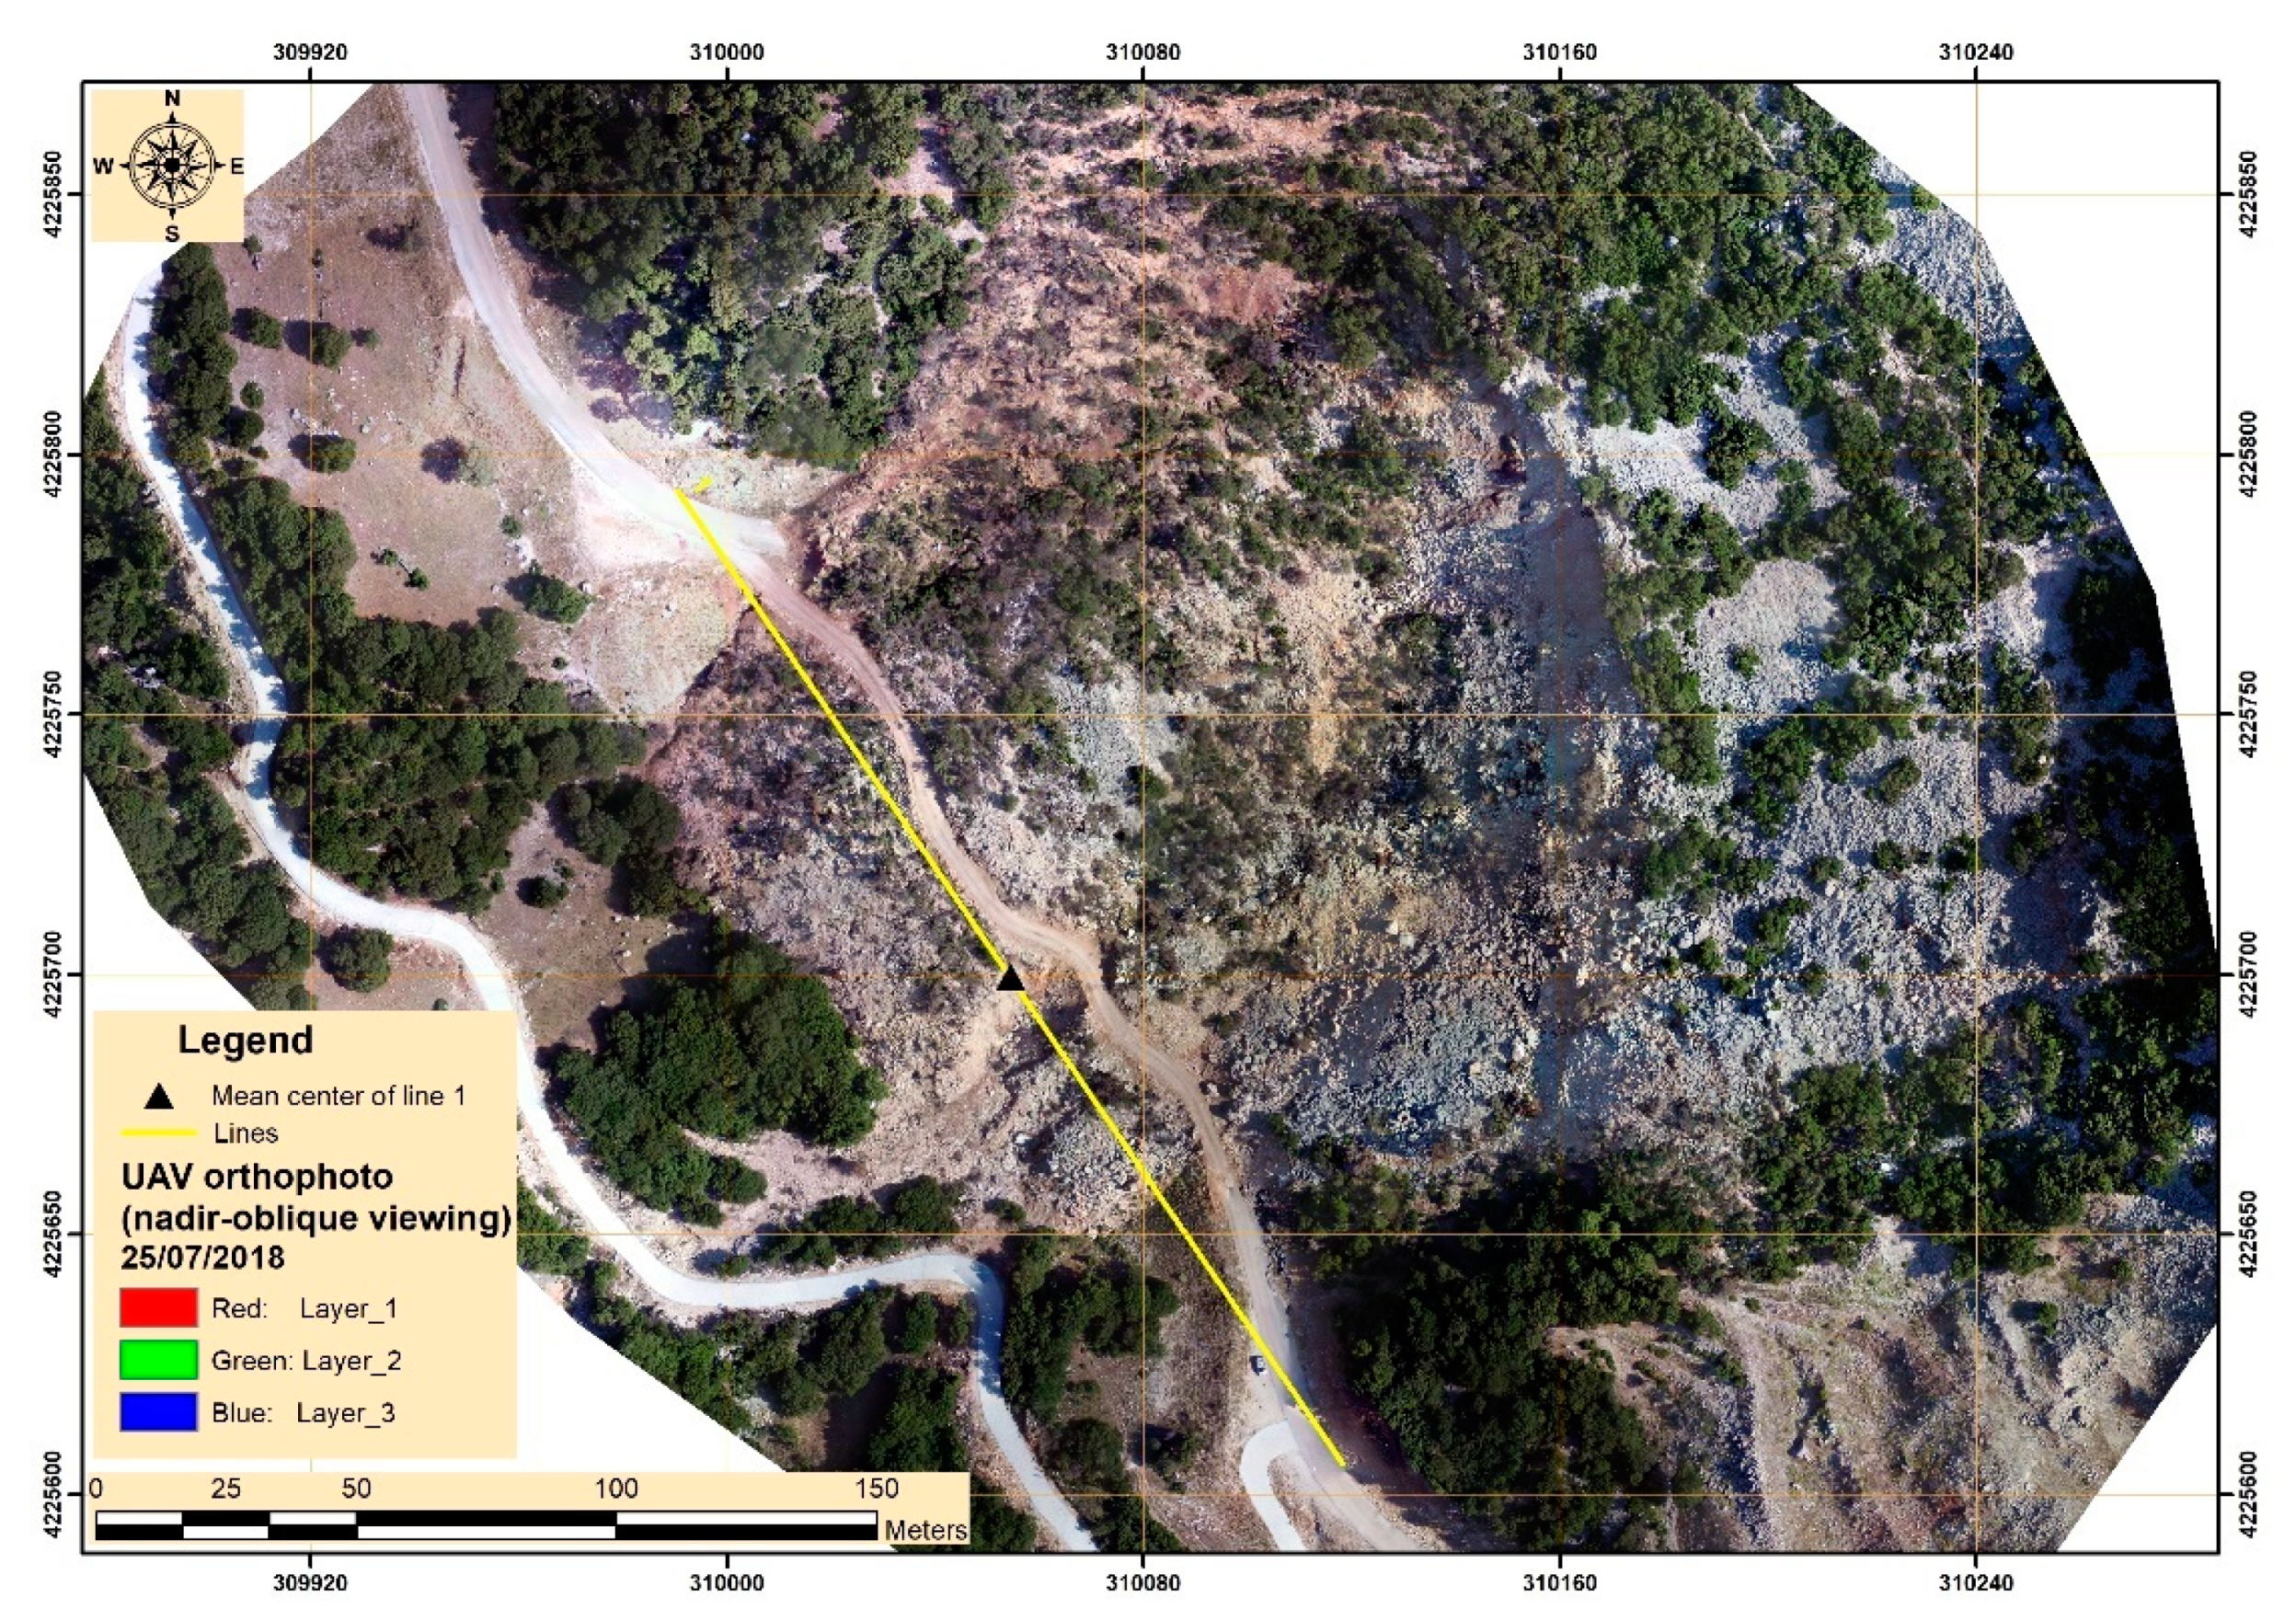
2.1. Case Study

The study area is located in Western Greece, a few kilometers away from the city of Patras and within the boundaries of an active landslide. It covers a mountainous area of approximately 65,569.20 m2, which has a steep topography. The geology of the site is composed of flysch, loose cherts and limestone. The landslide occurred on 20 January 2017 and is characterized as a complex type. It spread 300 m in length and 300 m in width, and rapid snow melting acted a triggering factor. The destruction of the road network was the consequence of the landslide occurrence along with a significant change in the local relief. Specifically, the landslide shaped the relief and made it steeper and more heterogeneous (Figure 1).

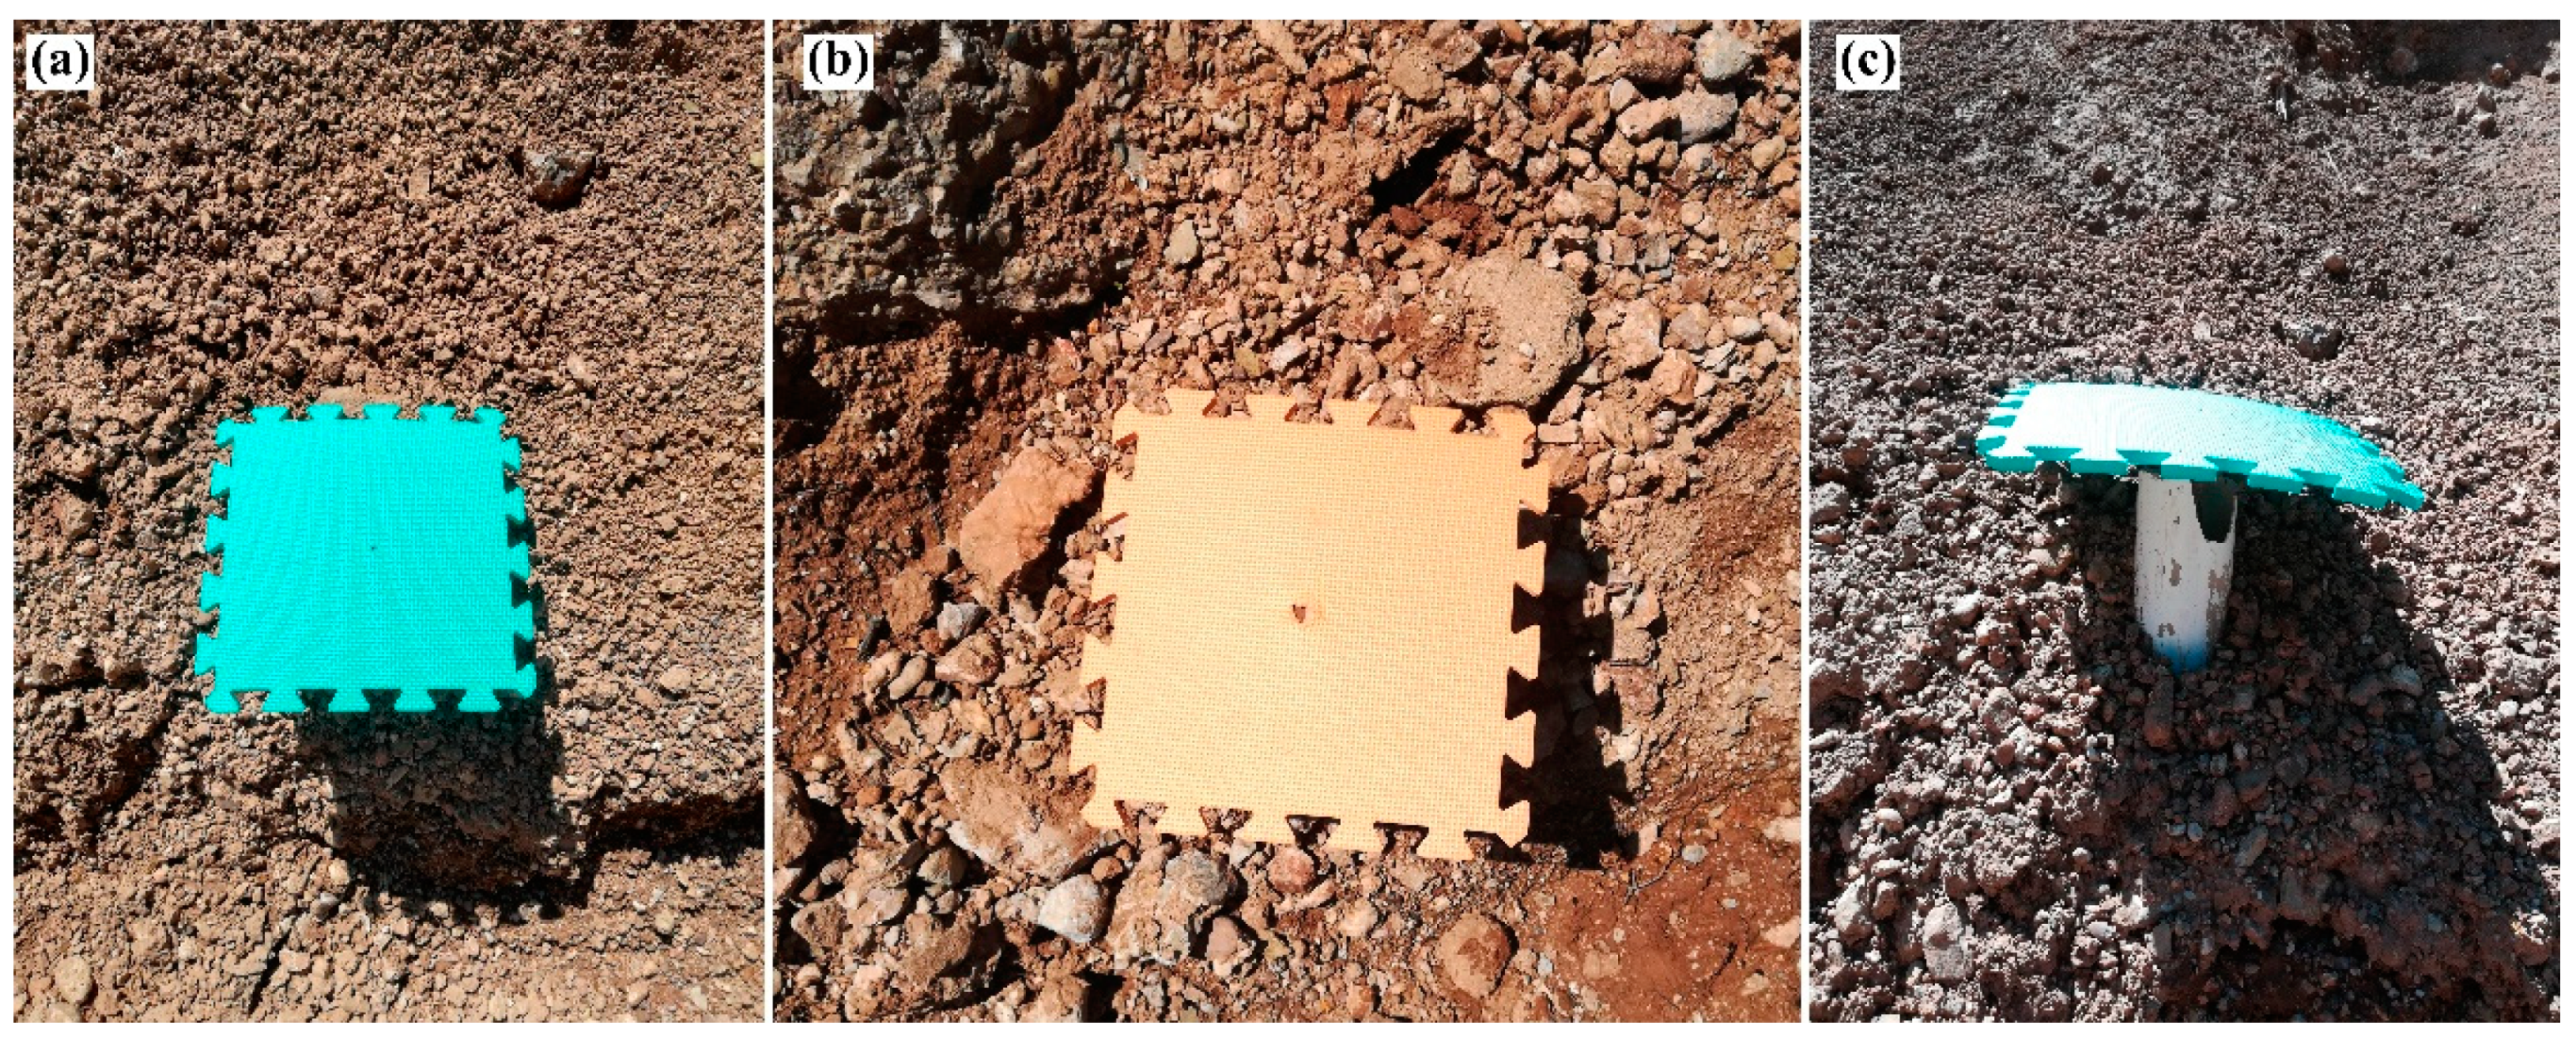
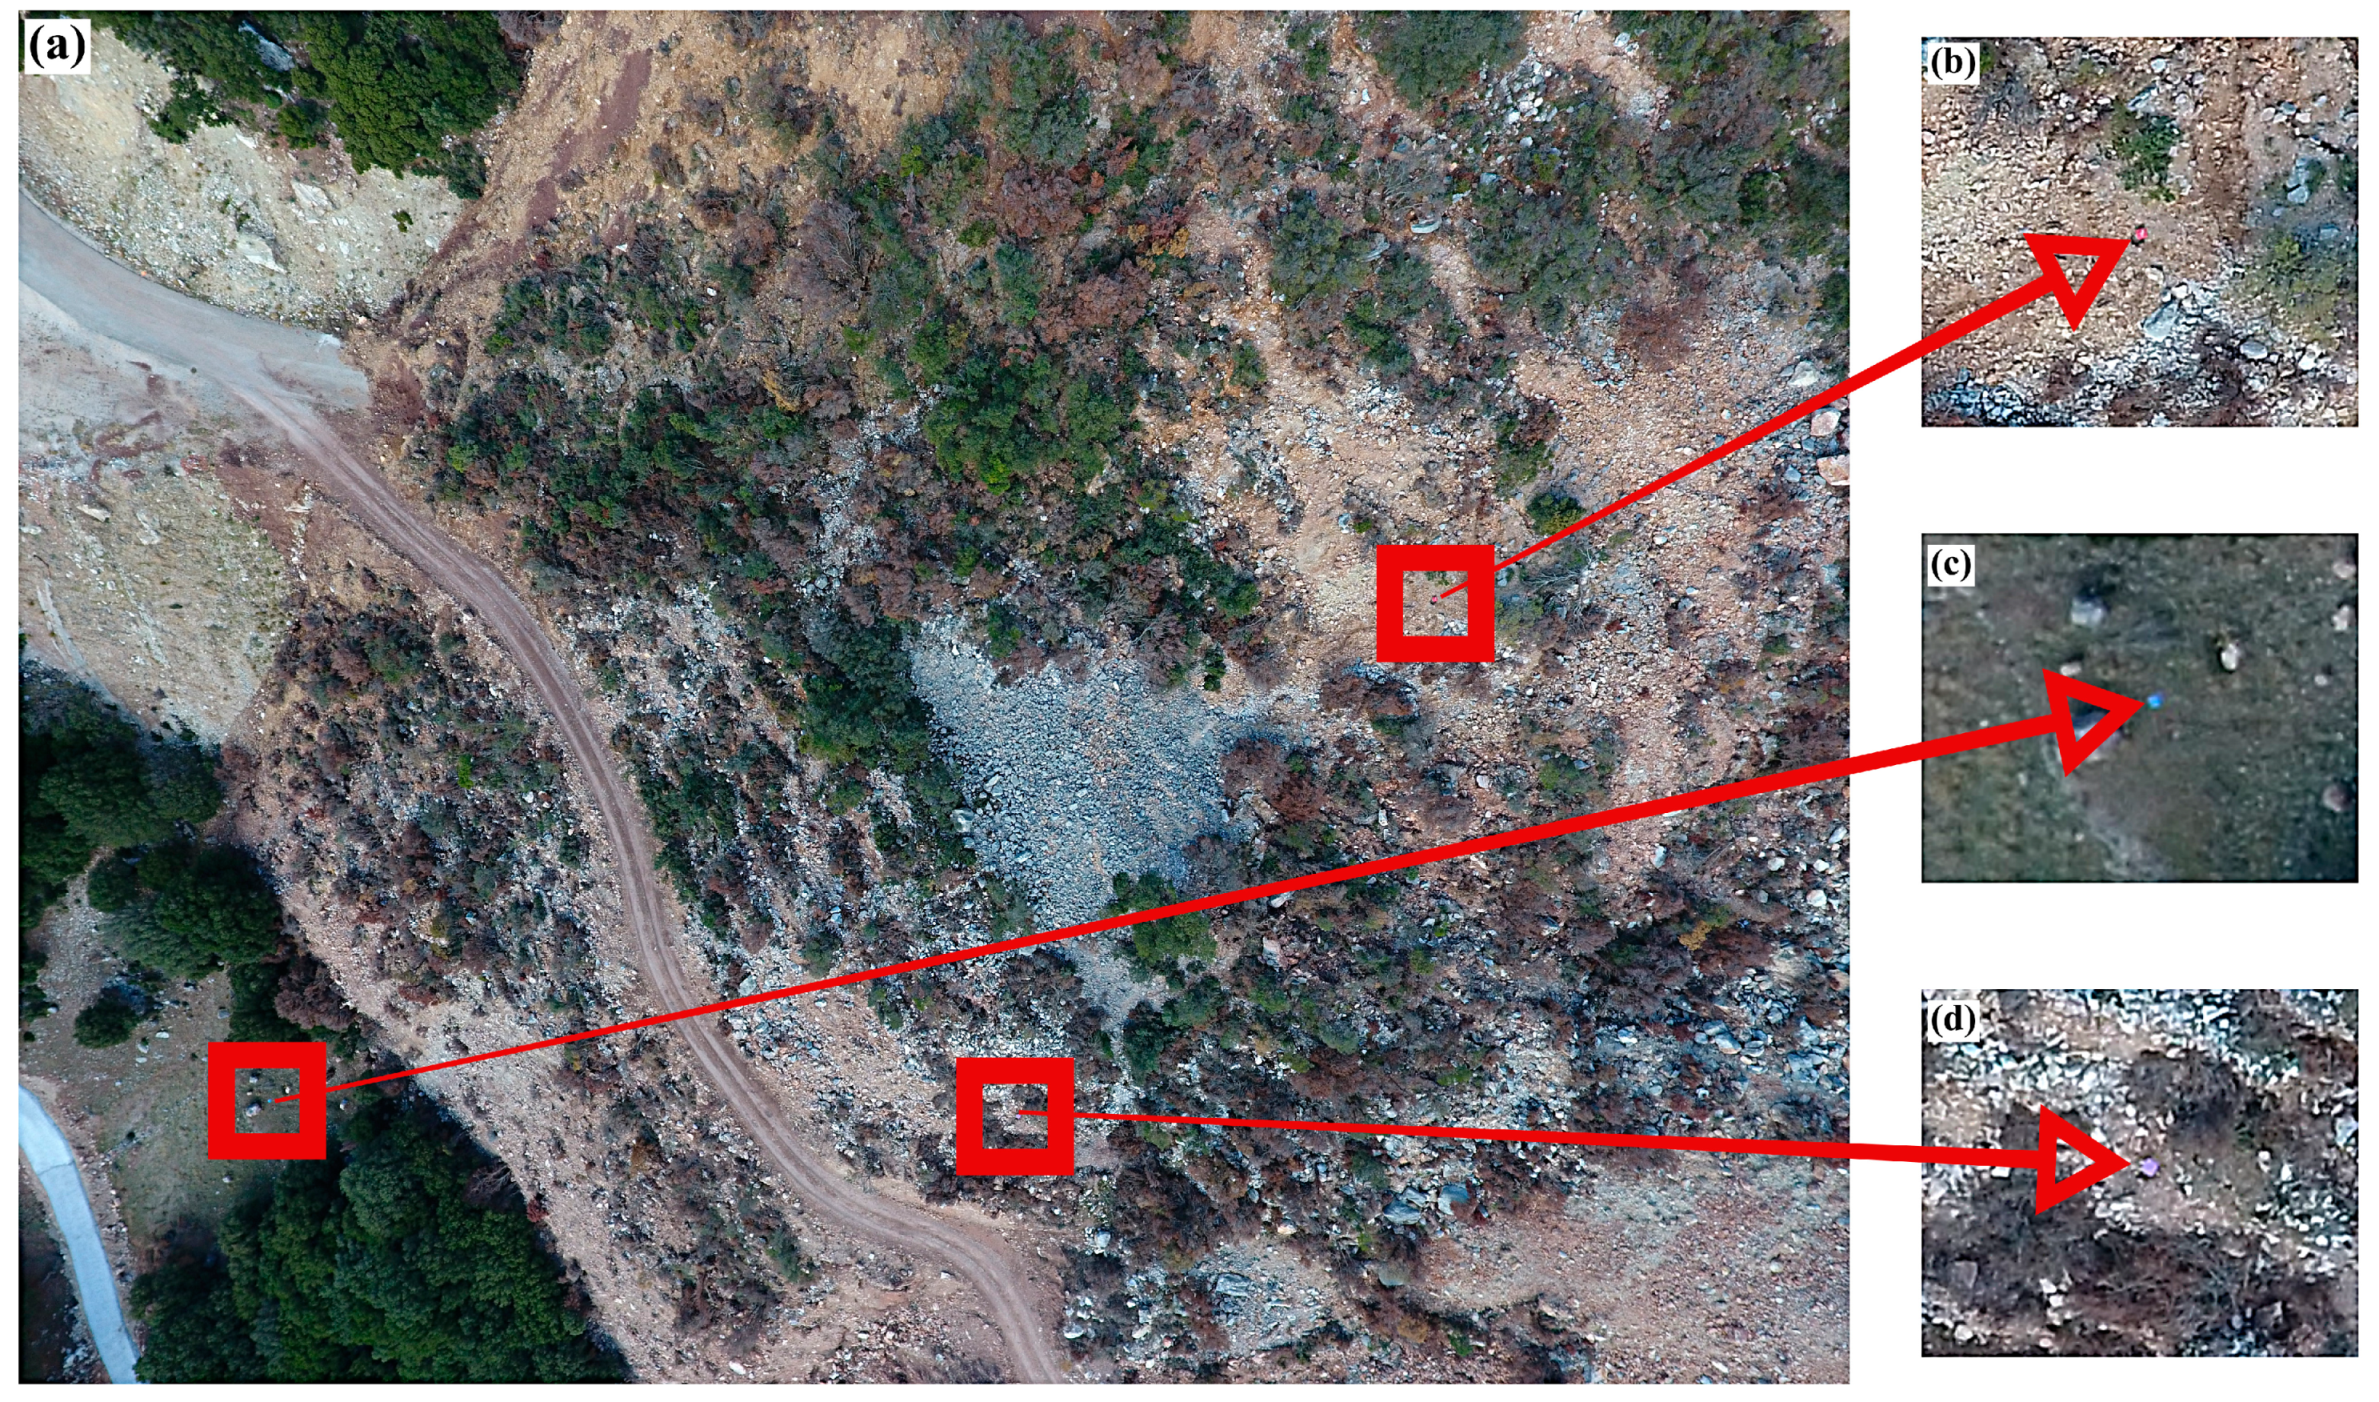
2.2. Equipment and Data Collection

The DJI Phantom 4 was used for the acquisition of UAV imagery. The Phantom 4 carries a 12.4 MP CMOS camera with 4000 × 3000 resolution and an on-board GNSS system. A three-axis gimbal ensures the compensation of the pitch, roll and yaw of the UAV.
Four UAV flights were executed on different days (Table 1), following the same flight grid and maintaining the same flight characteristics (Table 2). In particular, each flight acquisition was performed at an altitude of 110 m with 90% along track overlap and 75% across track overlap. A single photogrammetric grid with a hover and capture option for the acquisition of photos was used. The obtained UAV imagery of each campaign was organized into three data subcategories: (a) nadir imagery with gimbal pitch angle at 90 degrees, (b) oblique imagery with gimbal pitch angle at 65 degrees and (c) a combination of nadir and oblique imagery (Table 3).
Furthermore, a Leica GS08 GNSS Receiver was utilized for the collection of ground control points (GCPs). Square checkers in different colors were selected to be placed throughout the research area (Figure 2). In order to ensure that the same GCPs would be used in each UAV flight, a permanent pillar network was installed. Thirteen permanent pillars were installed inside and outside the landslide area. The square GCPs were integrated on these permanent pillars in order to minimize any error related to the georeferencing procedure [4]. The center of each square target was placed in the 5/8 inch screw at the top of each pillar. The circular bronze screw is easily recognized within the colored square target during the georeferencing procedure in Agisoft software (Agisoft LLC, St. Petersburg, Russia), as presented in Figure 2b. The coordinates of GCPs are displayed in Table 4, while the distribution of the permanent pillars throughout the area of interest is depicted in Figure 3. Another approach for the georeferencing of UAV imagery, which is based on the exploitation of UAVs equipped with RTK capabilities, was suggested by [27]. In that case, no GCPs are required. The specific methodology contributes to the simplification of the construction of the high accuracy digital products of UAV photogrammetry; however, it suffers from the presence of systematic elevation errors [28,29].

2.3. Processing Methodology

The framework of the study is depicted in Figure 4. The purpose of the study is to examine how the acquisition geometry of UAV imagery could potentially affect the accuracy of the photogrammetric processing products during the mapping of a landslide area. UAV surveys were executed and the data were organized in three subcategories. The derived orthophotos, DSMs and point clouds were evaluated qualitatively and quantitatively in terms of their accuracy. In addition, GNSS data were collected in order to be used as GCPs for the photogrammetric processing as well as for validation purposes.
The UAV data was processed using structure-from-motion photogrammetry (SfM), which is a low-cost and easy to apply method for 3D reconstruction of targets [7,11], based on the principles of photogrammetry along with computer vision [30,31,32]. Although SfM shares similar principles with stereoscopic photogrammetry, the main difference is that the geometry of scenes, camera positions and orientation are solved automatically and simultaneously, without known points. Series of 2D images, which are overlapped and offset, are processed using an automatic algorithm of feature matching, integrated into bundle adjustment and therefore fine 3D representations are extracted [30].
The UAV imagery organized in subcategories of nadir imagery, oblique imagery and a combination of nadir and oblique imagery was subjected to SfM photogrammetric processing into Agisoft Photoscan software. Specifically, the alignment of the images was performed in accordance with the highest-quality option, which contribute to a more precise estimation of the camera positions [33]. Furthermore, the specific setting results in the processing of UAV images in their original size, while the images were upscaled by factor of 4. The quality setting is closely related to the quality of the reconstruction. Additionally, build dense cloud and build mesh were created at ultra-high accuracy, resulting in 3.75 cm GSD for nadir and 4.46 cm GSD for oblique images. The measurement accuracy was set up to 10 m for the camera position accuracy and to 0.005 m for the marker accuracy. Although the nominal GNSS position accuracy of the drone was 3 m, we decided to set up a lower accuracy limit due to the fact that diverse flight campaigns were performed during the two-year monitoring period and thus different weather conditions (wind) as well as other uncertainties should be taken into account. The parameters for the image coordinate accuracy were the marker accuracy of 0.1 pixels while the tie point accuracy was 1 pixel. The mean error of the GCPs was less than 0.75 pixels in all the flight campaigns used every time. Thus, the average space error of the GCPs was limited to less than 3 cm in every flight (oblique or nadir). Moreover, camera calibration and optimization were performed using the default values of Agisoft software for the DJI Phantom 4 camera. In particular, the internal orientation parameters [27] were calculated automatically through Agisoft software, as it has the ability to identify the model of the camera and thereafter to set the appropriate parameters. Thus, we kept the specific option, since we believed that no further settings were needed. The Hellenic Geodetic Reference System 1987 was selected as the coordinate system for the generated orthophotos and DSMs.
Figure 5 illustrates UAV acquisition trajectories of the nadir and oblique-viewing flights. Concerning the oblique-viewing acquisition, it is worth noting that the axis of the UAV is perpendicular to the slope and image collection is implemented as the drone moved forward and backward following the line paths.
The UAV data processing led to the creation of orthophotos and DSMs with 4 cm pixel size, as well as to the extraction of dense point clouds. The derived products consisted of:
  • Four orthophotos, four DSMs and four point clouds from nadir-viewing imagery (Figure 4b).
  • Four orthophotos, four DSMs and four point clouds from oblique-viewing imagery (Figure 4b).
  • Four orthophotos, four DSMs and four point clouds from a combination of nadir and oblique imagery (Figure 4b).
Each flight campaign of each subcategory led to the creation of an orthophoto, a DSM and a point cloud. On 5 November 2017, the processing of the imagery of the three subcategories (i.e., nadir-viewing, oblique-viewing and a combination of nadir and oblique imagery) contributed to the generation of three orthophotos, three DSMs and three point clouds. Twelve orthophotos, twelve DSMs and twelve photogrammetric point clouds were generated during the four UAV campaigns.
The aforementioned products were compared qualitative and quantitative using different approaches towards the determination of the most accurate.

3. Results

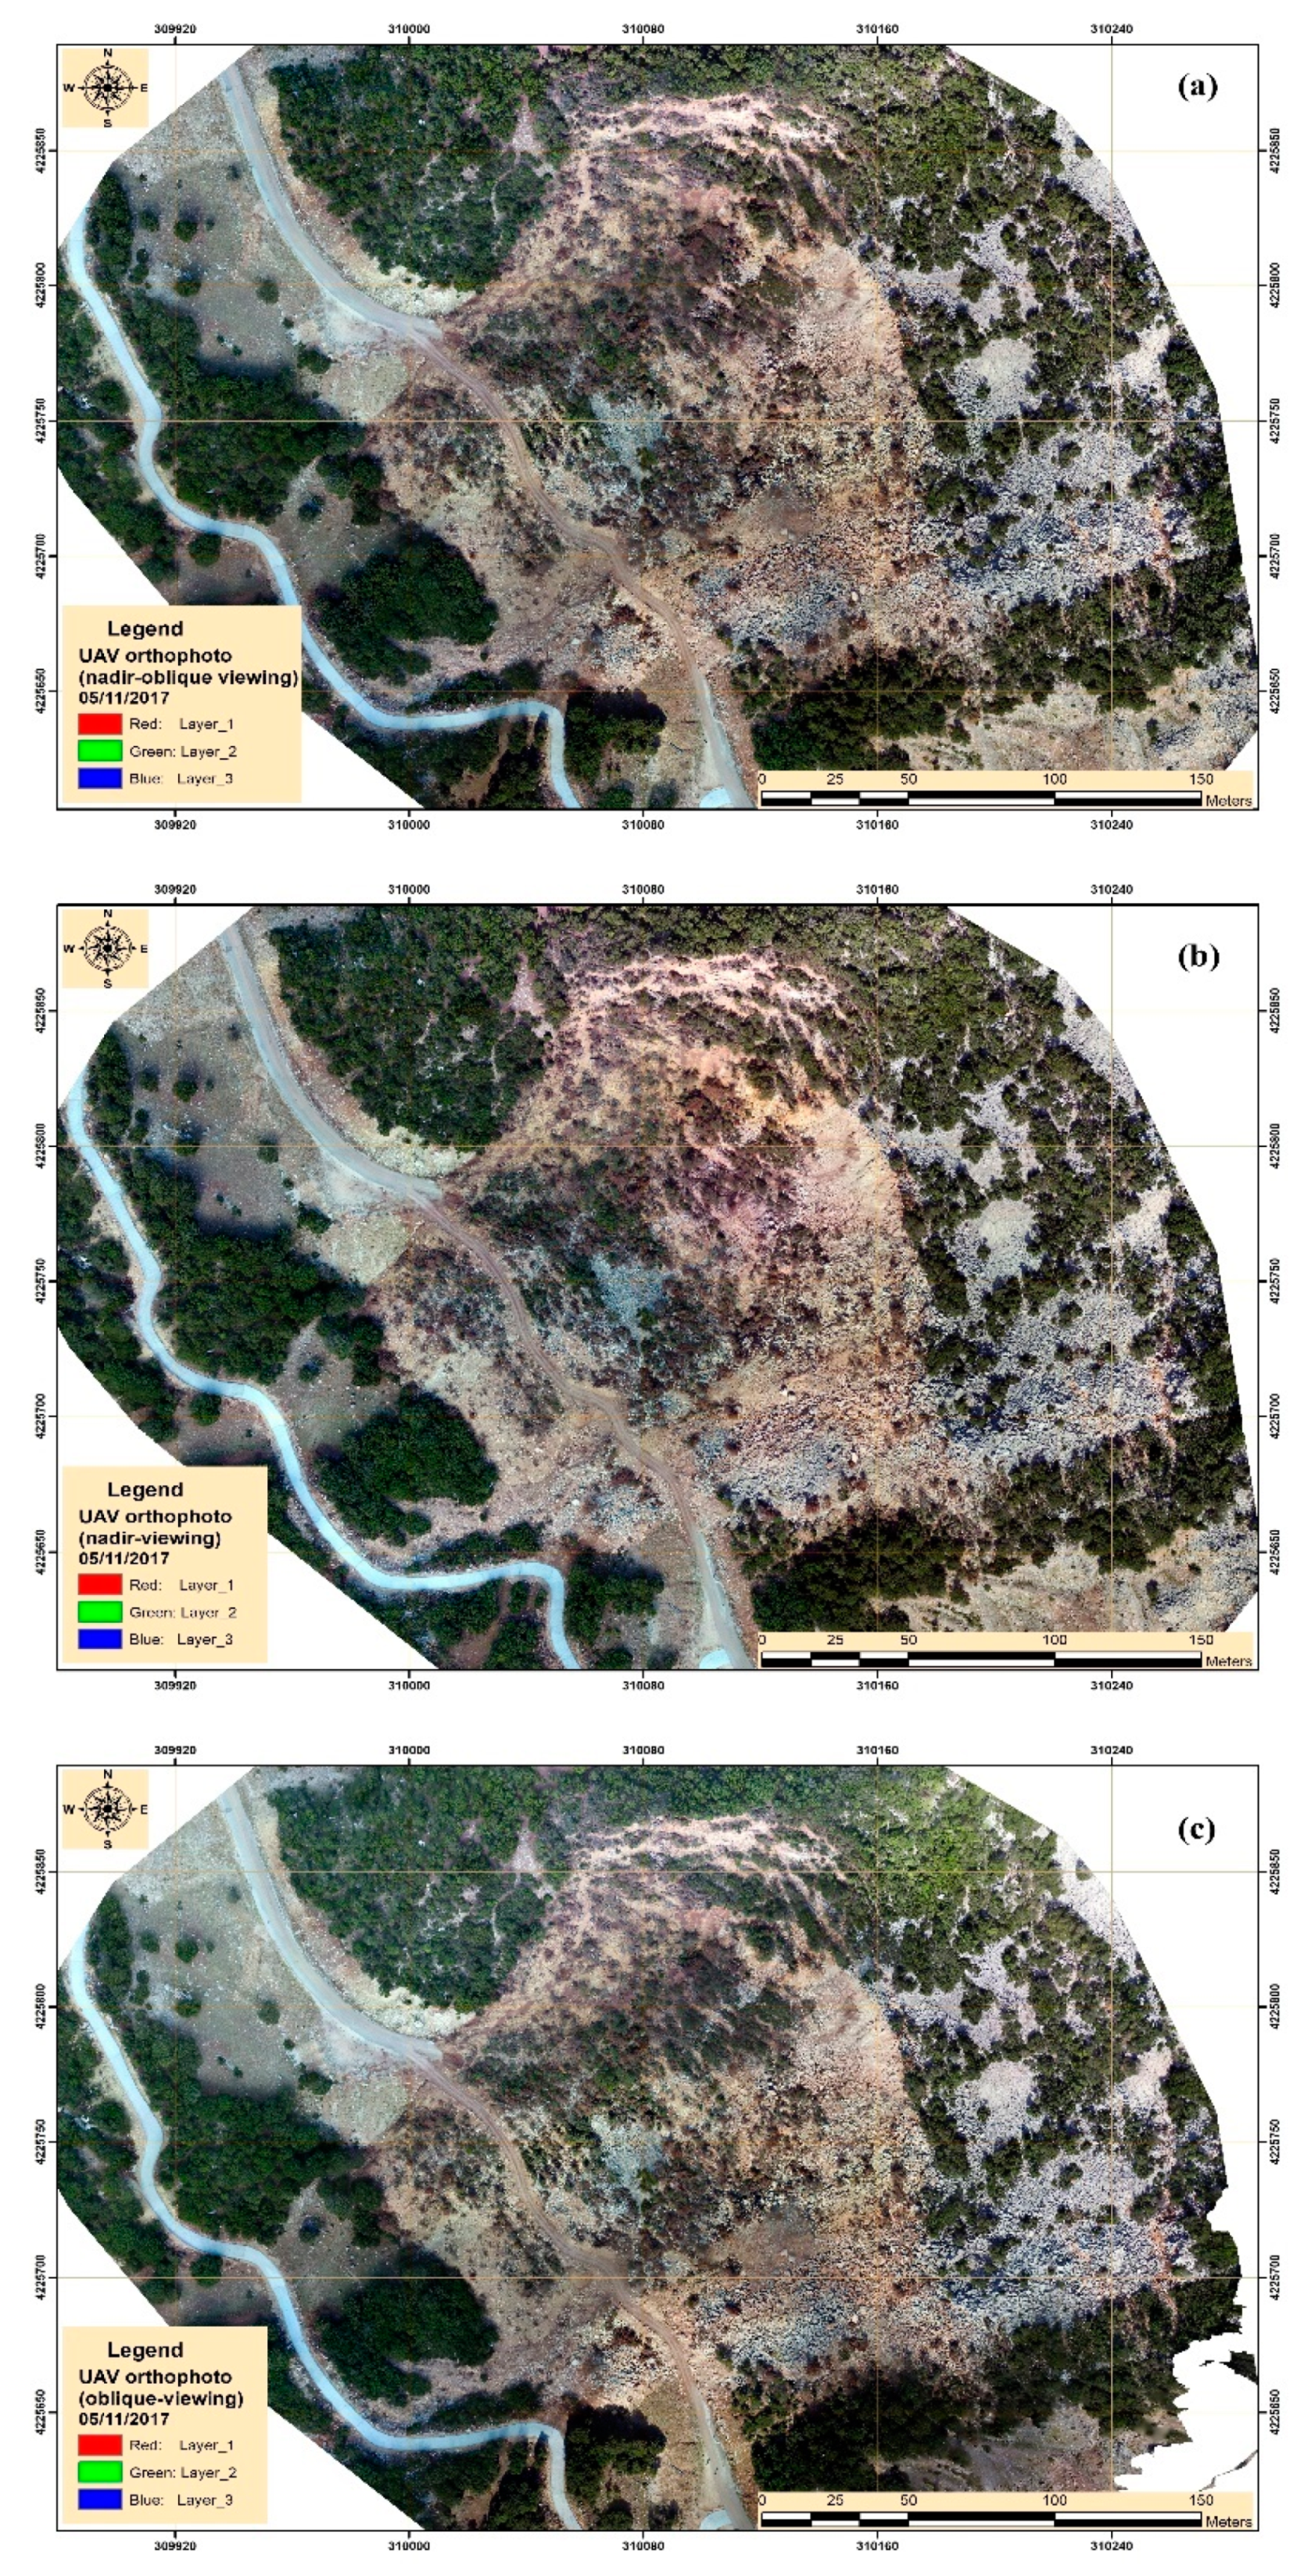
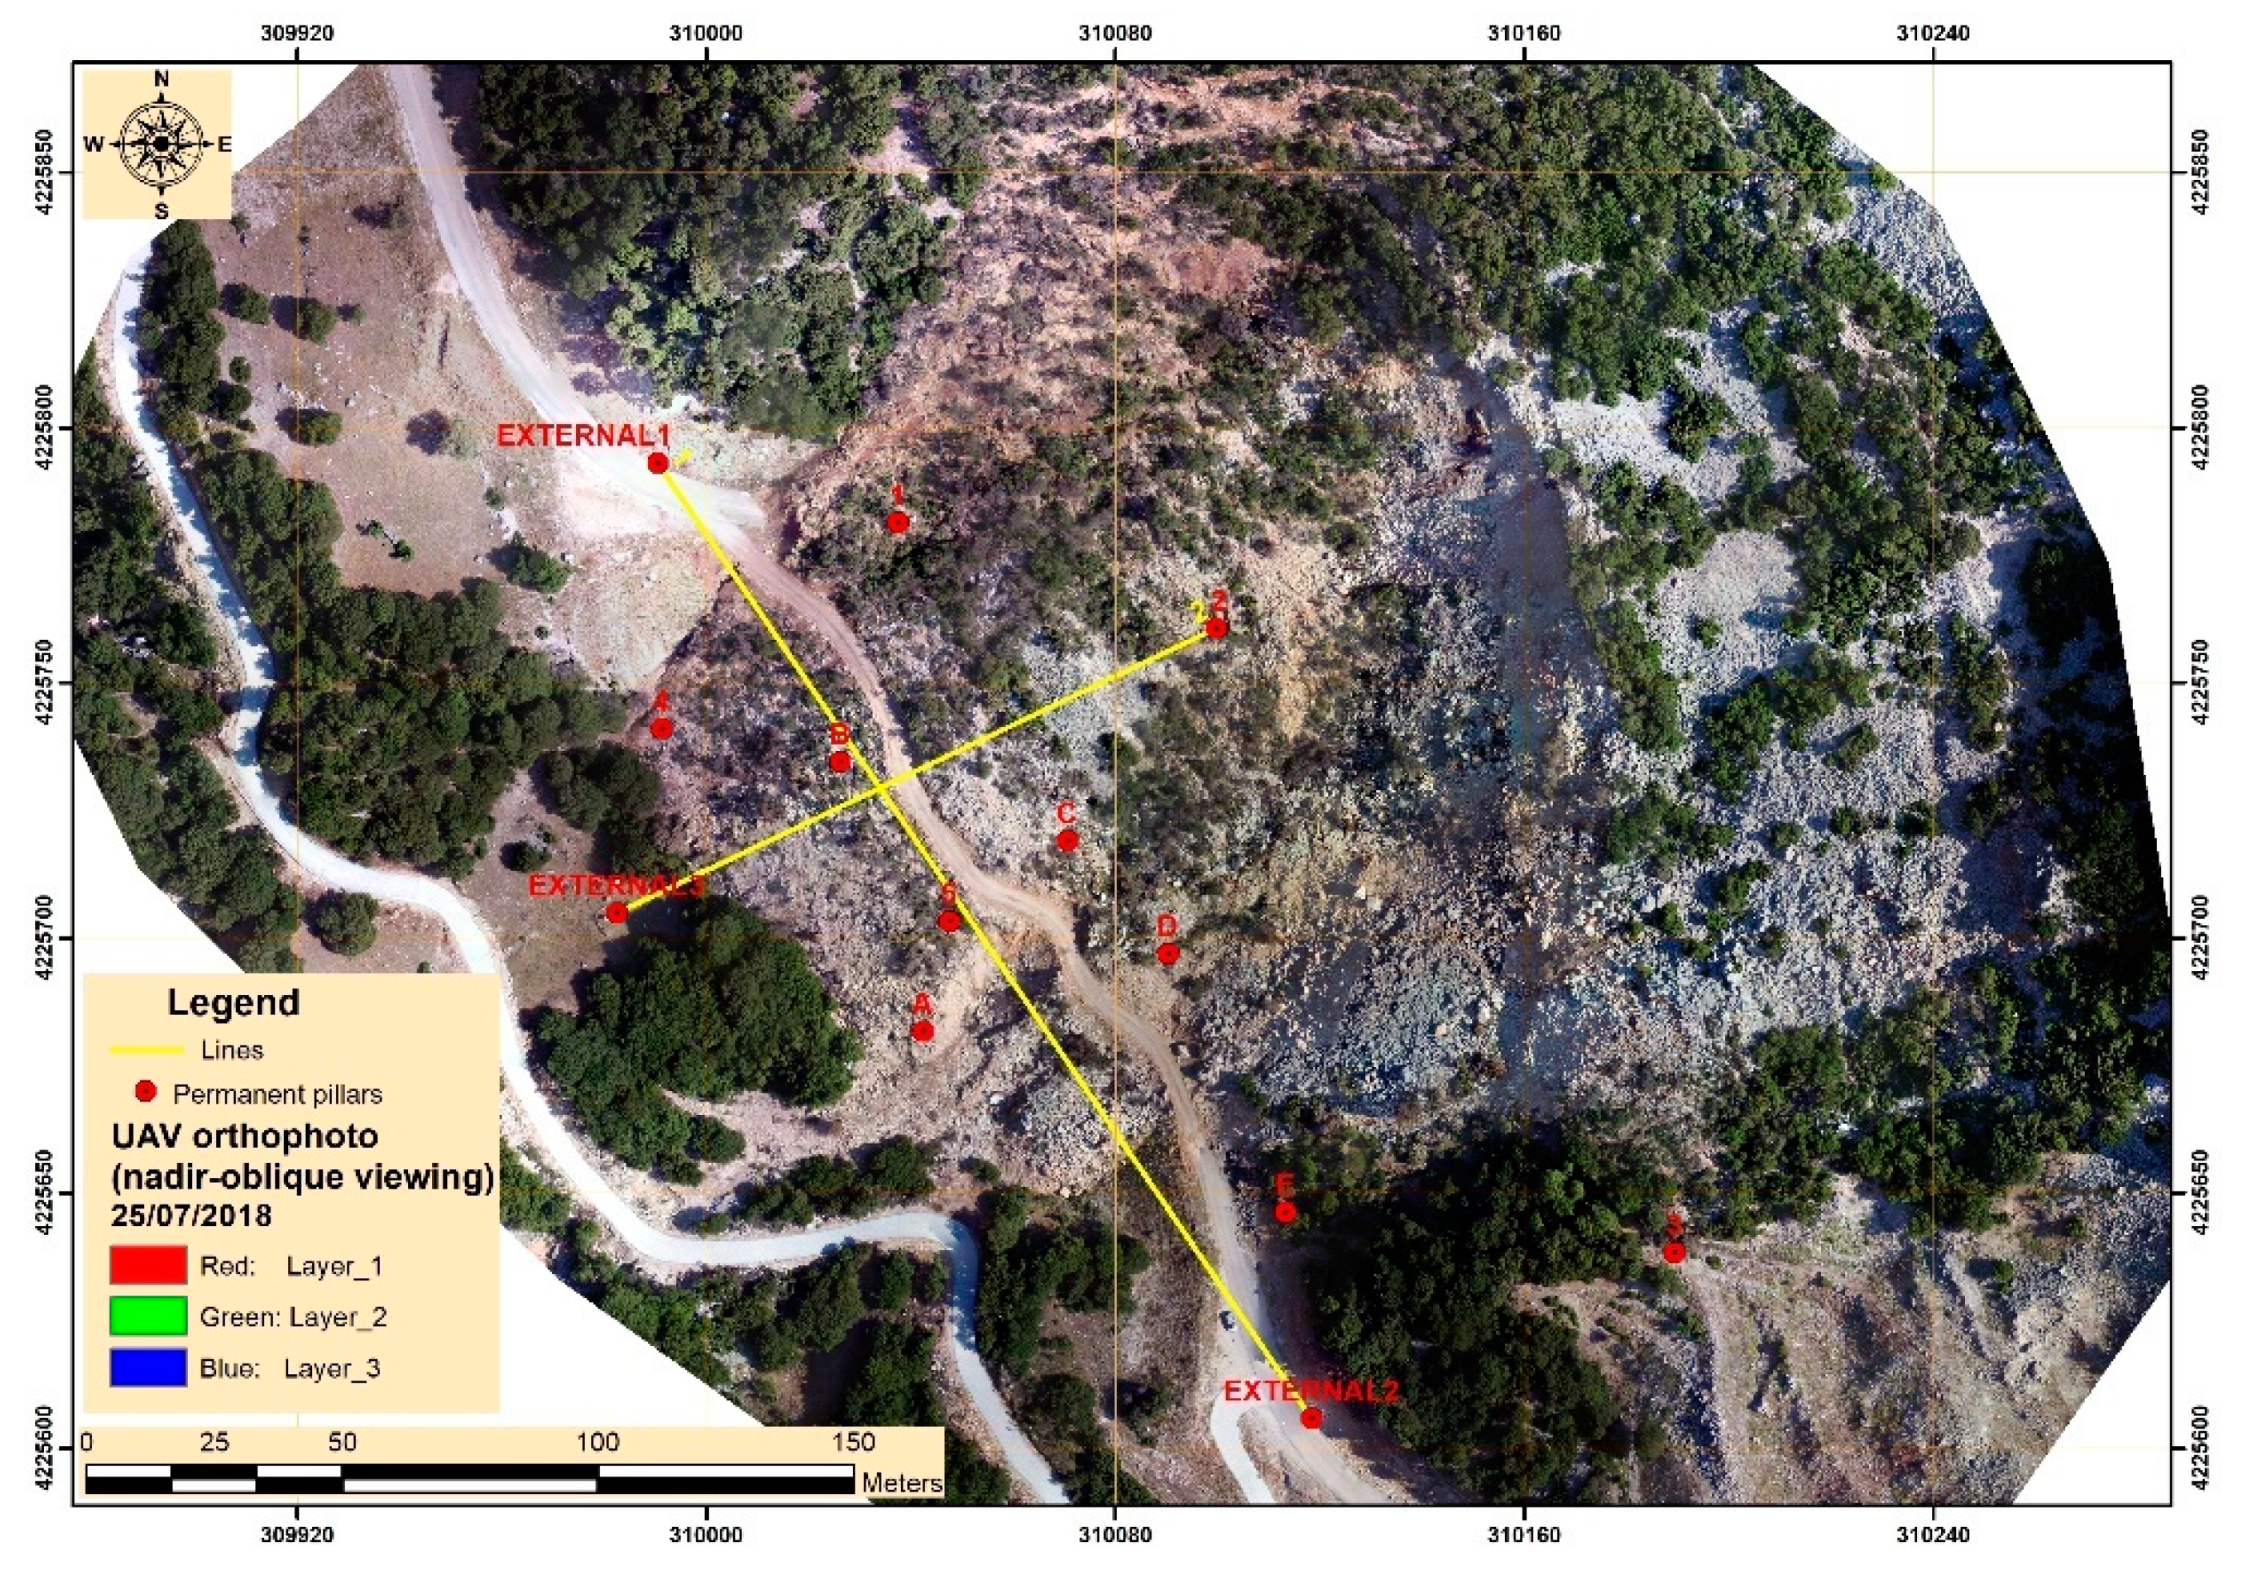
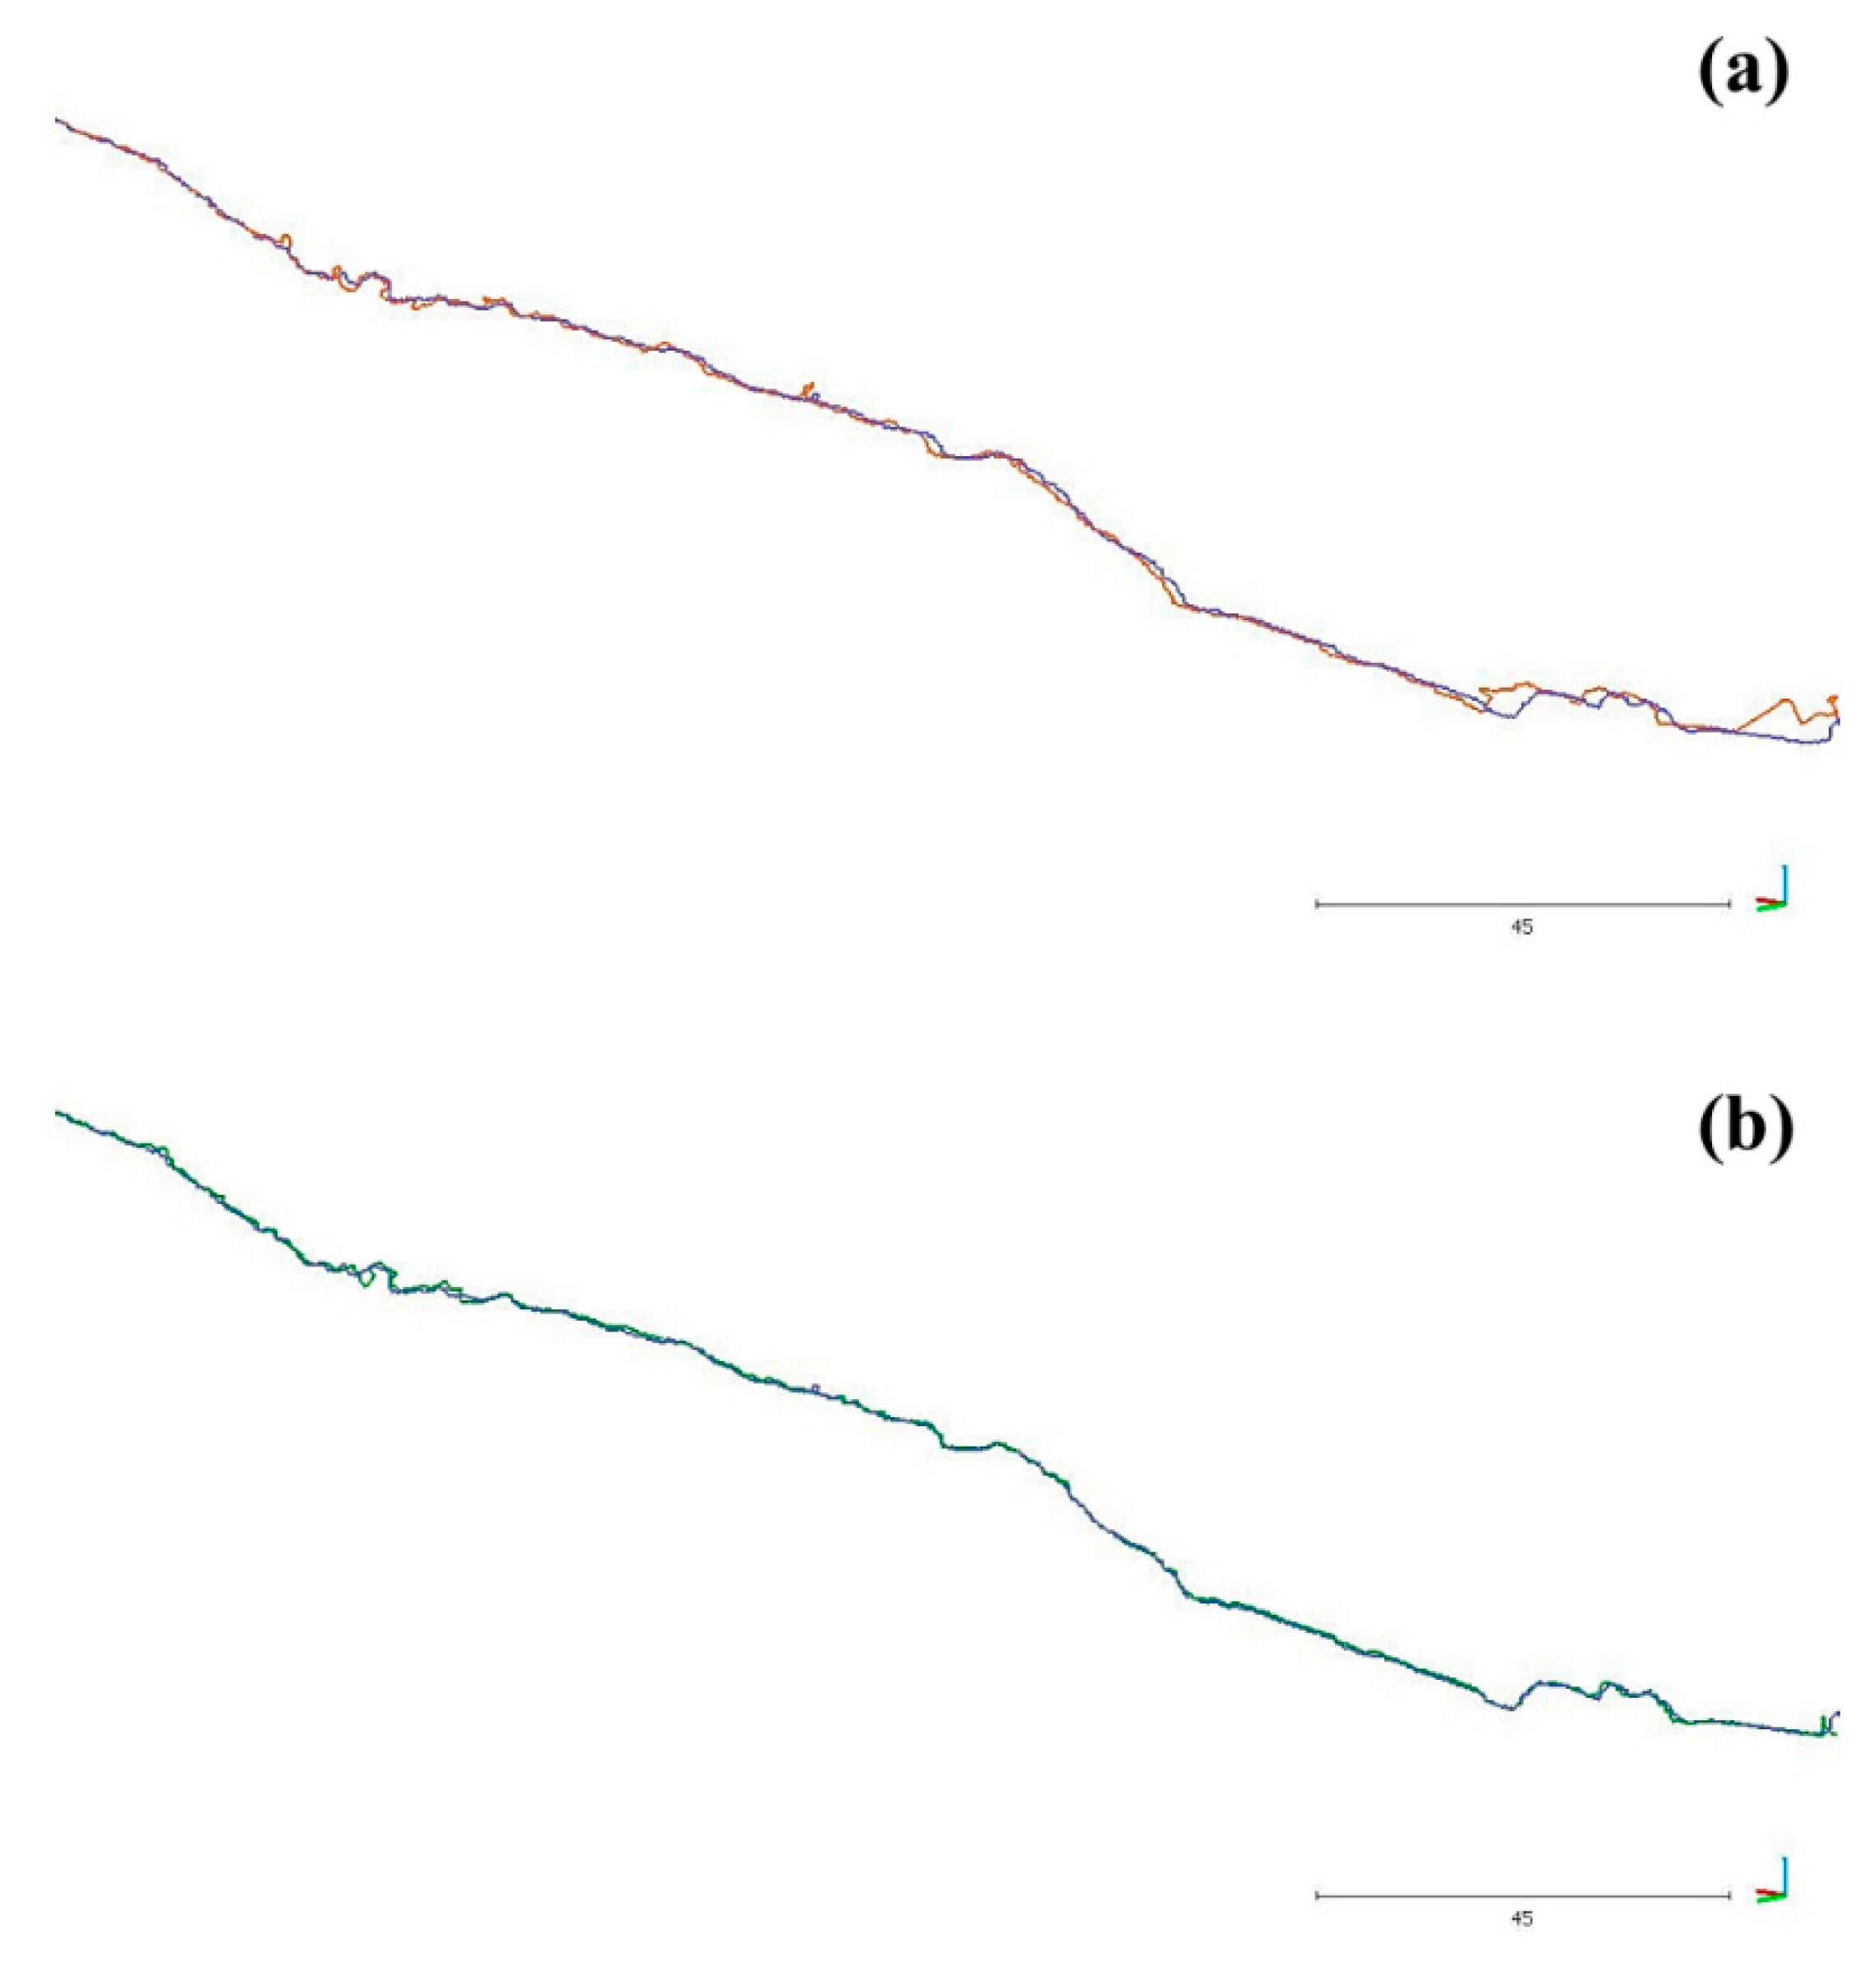
3.1. Orthophotos Accuracy Assessment

Twelve orthophotos were generated using SfM photogrammetric procedure. Figure 6 shows three orthophotos of the study area, which were acquired on 5 November 2017. The difference between them lies in the fact that they were obtained from (a) a combination of nadir and oblique geometry (Figure 6a), (b) nadir-viewing geometry (Figure 6b) and (c) oblique-viewing geometry (Figure 6c). A purely visual comparison between the orthophotos could not be used as they look quite similar and conclusions could not be drawn. Therefore, the accuracy assessment of the orthophotos was based on the performance of a digitization, calculation and comparison approach through an ArcGIS environment. In particular, the GNSS measurements located on the permanent pillars as reference measurements to determine the correct positions were used to generate two geodetic lines from the x-y coordinates of the pillars (Figure 7). Line 1 connects the permanent pillar named external 1 with external 2, while line 2 links permanent pillar 2 with external 3. Lines were formed in two different reliefs, i.e., line 1 intersects a smoother surface in a sense, while line 2 crosses a steeper and more complex one. Afterwards, the same lines were digitized in the derived orthophotos of each subcategory of each flight campaign, according to the visual identification of the same pillars. The length of each digitized line was calculated and compared to the corresponding length of the reference line (Table 5). Regarding the length of line 1, the best results were achieved using either nadir-viewing geometry. Specifically, nadir-viewing geometry showed the lowest values for two of the four campaigns. A combination of nadir and oblique imagery worked better in measuring the length of line 2, where percentage difference reached almost zero in three UAV campaigns. It is worth mentioning that differences were considerably small in general, which is associated with the high-accuracy and -resolution products of UAV photogrammetry [34].
Moreover, the mean center of the reference lines and the digitized lines was estimated in order to further assess the accuracy of each acquisition geometry. The mean center represents the geographical center of a set of features such as a line, resulting from average x and y coordinates [35,36]. It is widely used for tracking changes in distribution or comparing the distributions of features. The mean center is calculated from the following equation (Equation (1)):
X ¯ = i = 1 n x i n ,     Y ¯ = i = 1 n y i n
where xi and yi are the coordinates for a feature i and n is the total number of features. The mean center of line 1 is displaced in Figure 8 and the corresponding mean center of line 2 is depicted in Figure 9. The distance between the reference mean center and the mean center of a digitized line was determined through near tool [37]. The variations of the mean center of each orthophoto in comparison with the reference mean center are displayed in Table 6. The combination of nadir and oblique acquisition geometry have the shortest distances from the reference mean centers of both lines. However, oblique imagery showed a better performance in measuring the near distances from the reference mean center for the geodetic line 2 by achieving values close to zero in 50% of the UAV flights. Generally, nadir-viewing imagery displayed the largest distances, which may be related to the complex terrain.

3.2. Digital Surface Models (DSMs) Accuracy Assessment

The derived DSMs were evaluated for accuracy through the computation of root mean square error (RMSE). Generally, the accuracy and quality assessment procedure should be applied when the reference data are an order better than the data to be evaluated. The GNSS measurements were used as a reference point (Figure 7), which exhibit an accuracy of a few millimeters. RMSE measures the difference between the DSM values and the reference values, provided by a GNSS system [38] and it is given by the following equation (Equation (2)):
R M S E = 1 n i = n n ( h r e f h i ) 2
where href is the reference elevation, hi is the DSM elevation at point i and n is the number of GCPs. The elevation variations, arising from the calculation of RMSE between the refence data and the UAV photogrammetric DSMs are displayed in Table 7. It is evident that the combination of nadir and oblique imagery during the UAV campaigns reached the smallest elevation differences. In addition, oblique imagery featured a good adaptation to DSM generation which is underlined by small RMSE values. Despite the relatively small RMSE values arising from nadir-viewing geometry, the specific acquisition seems to lag behind the others.

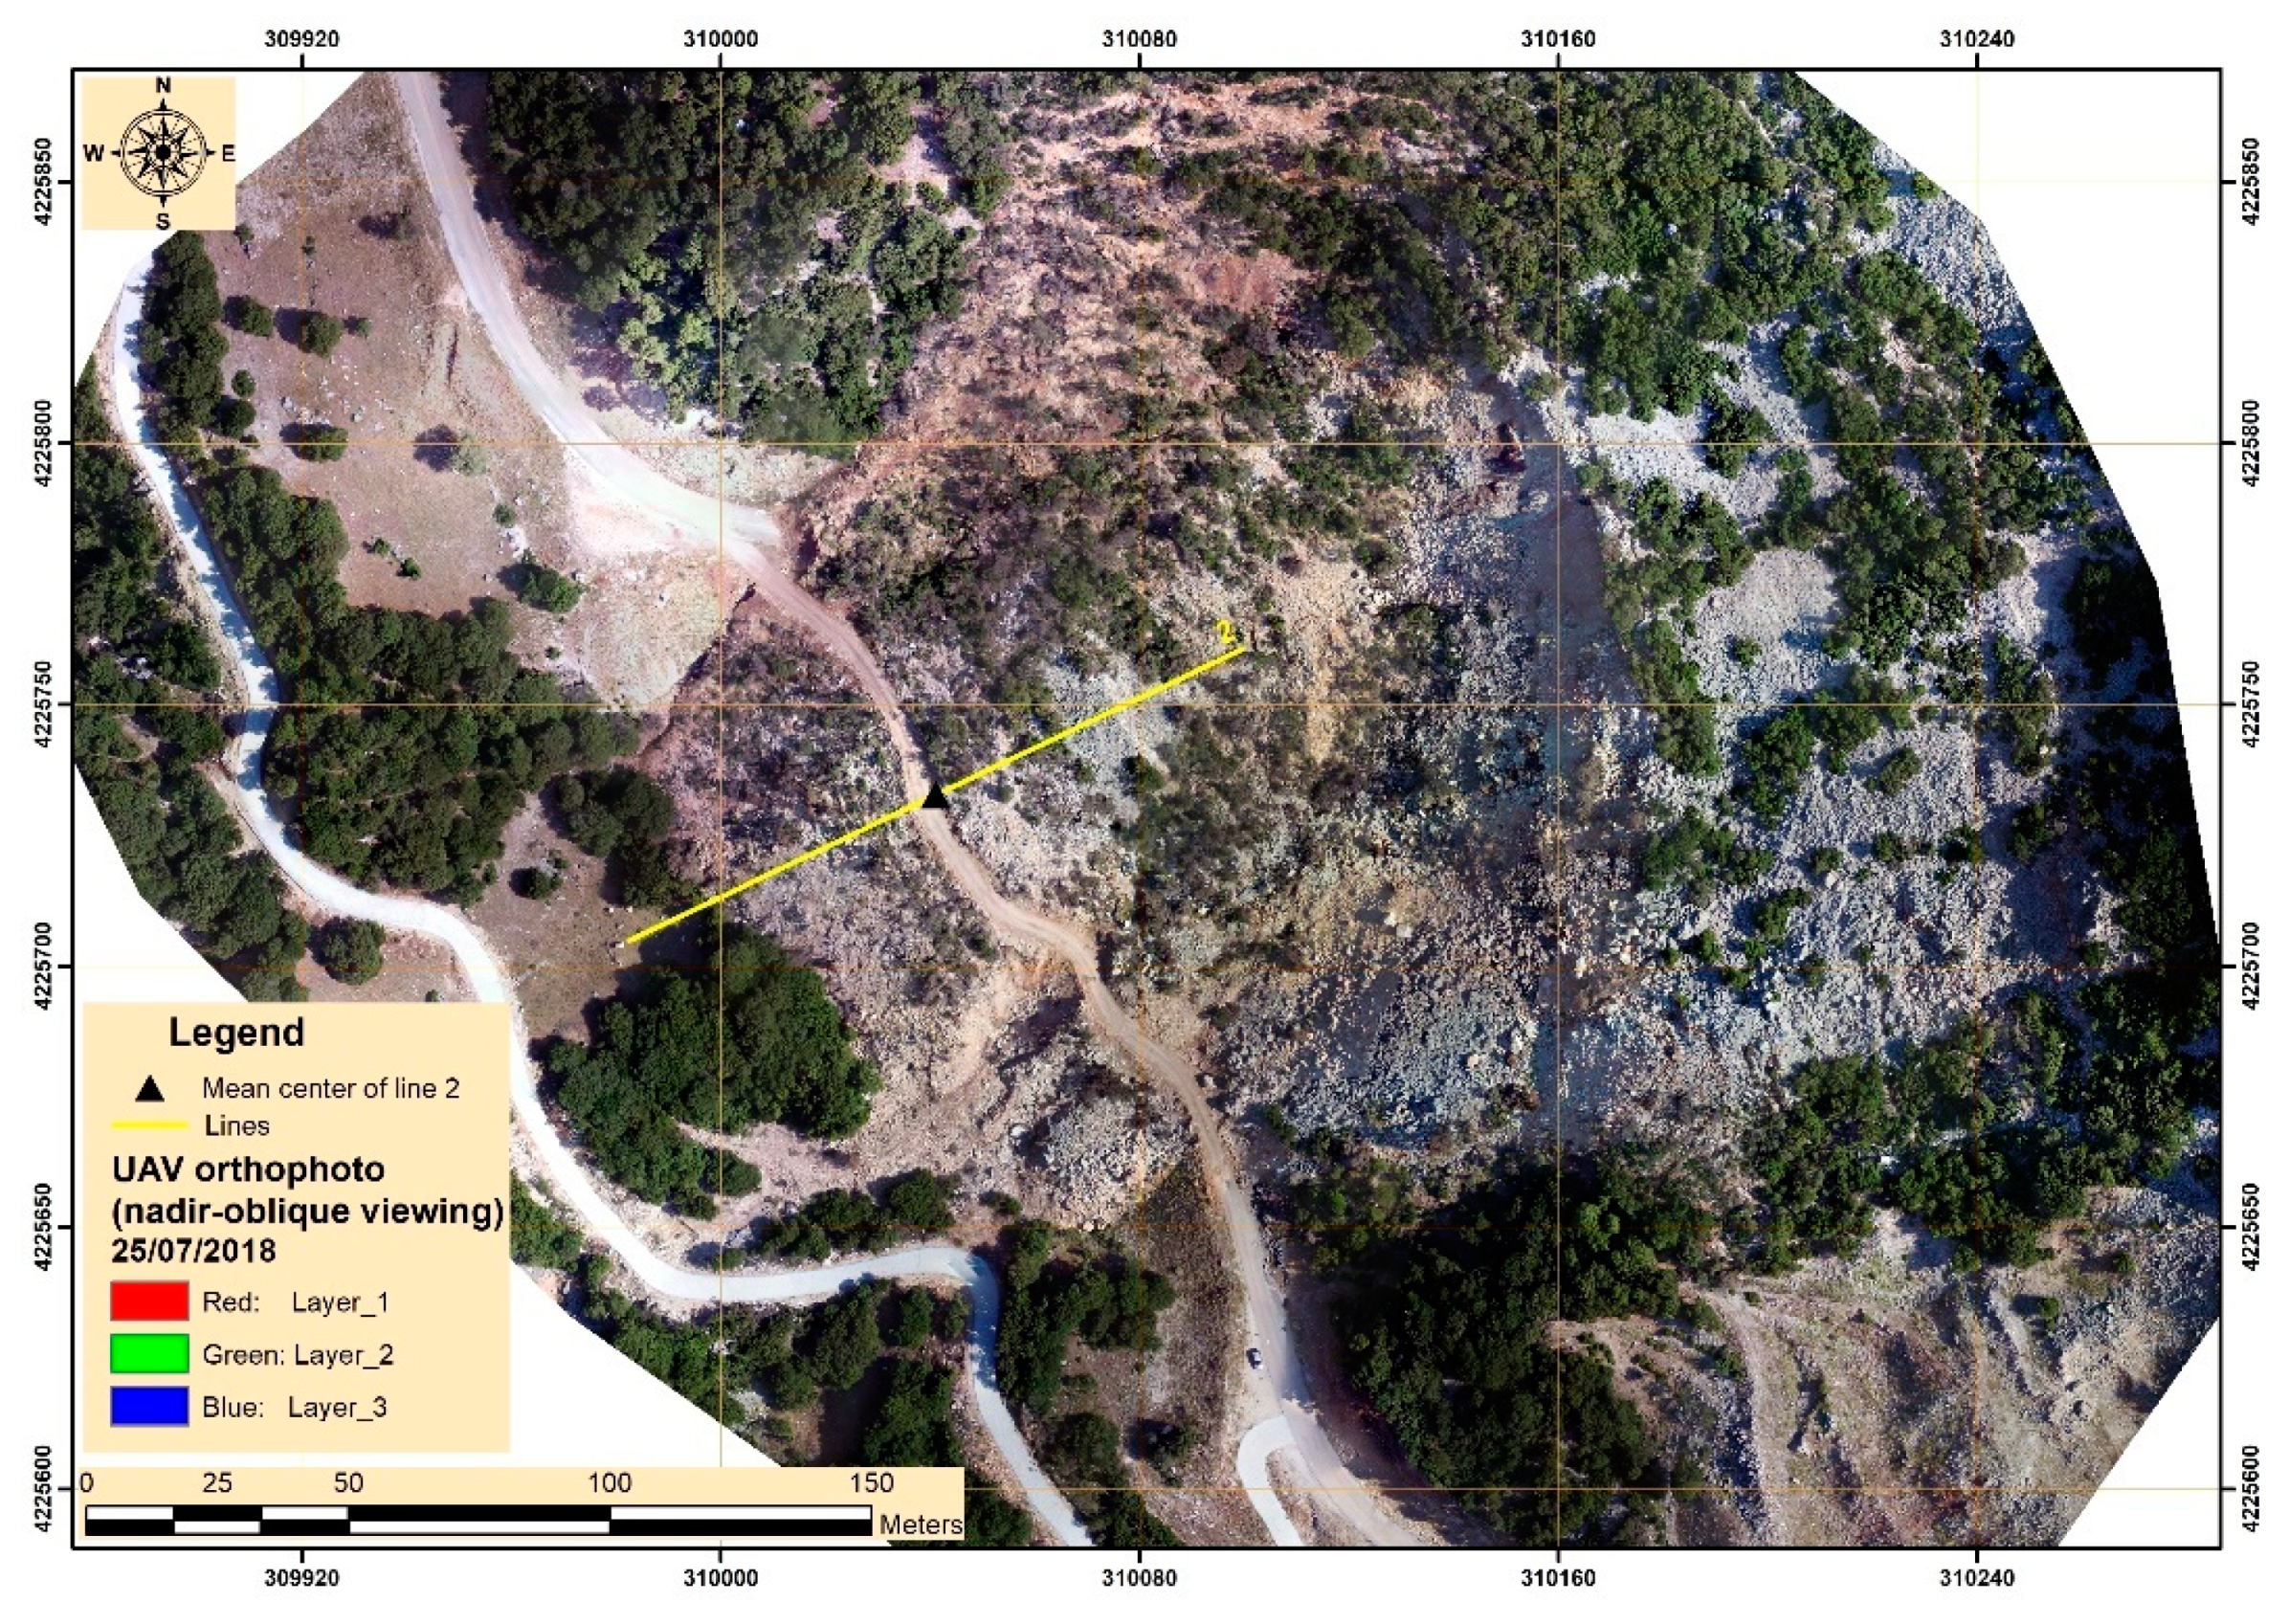
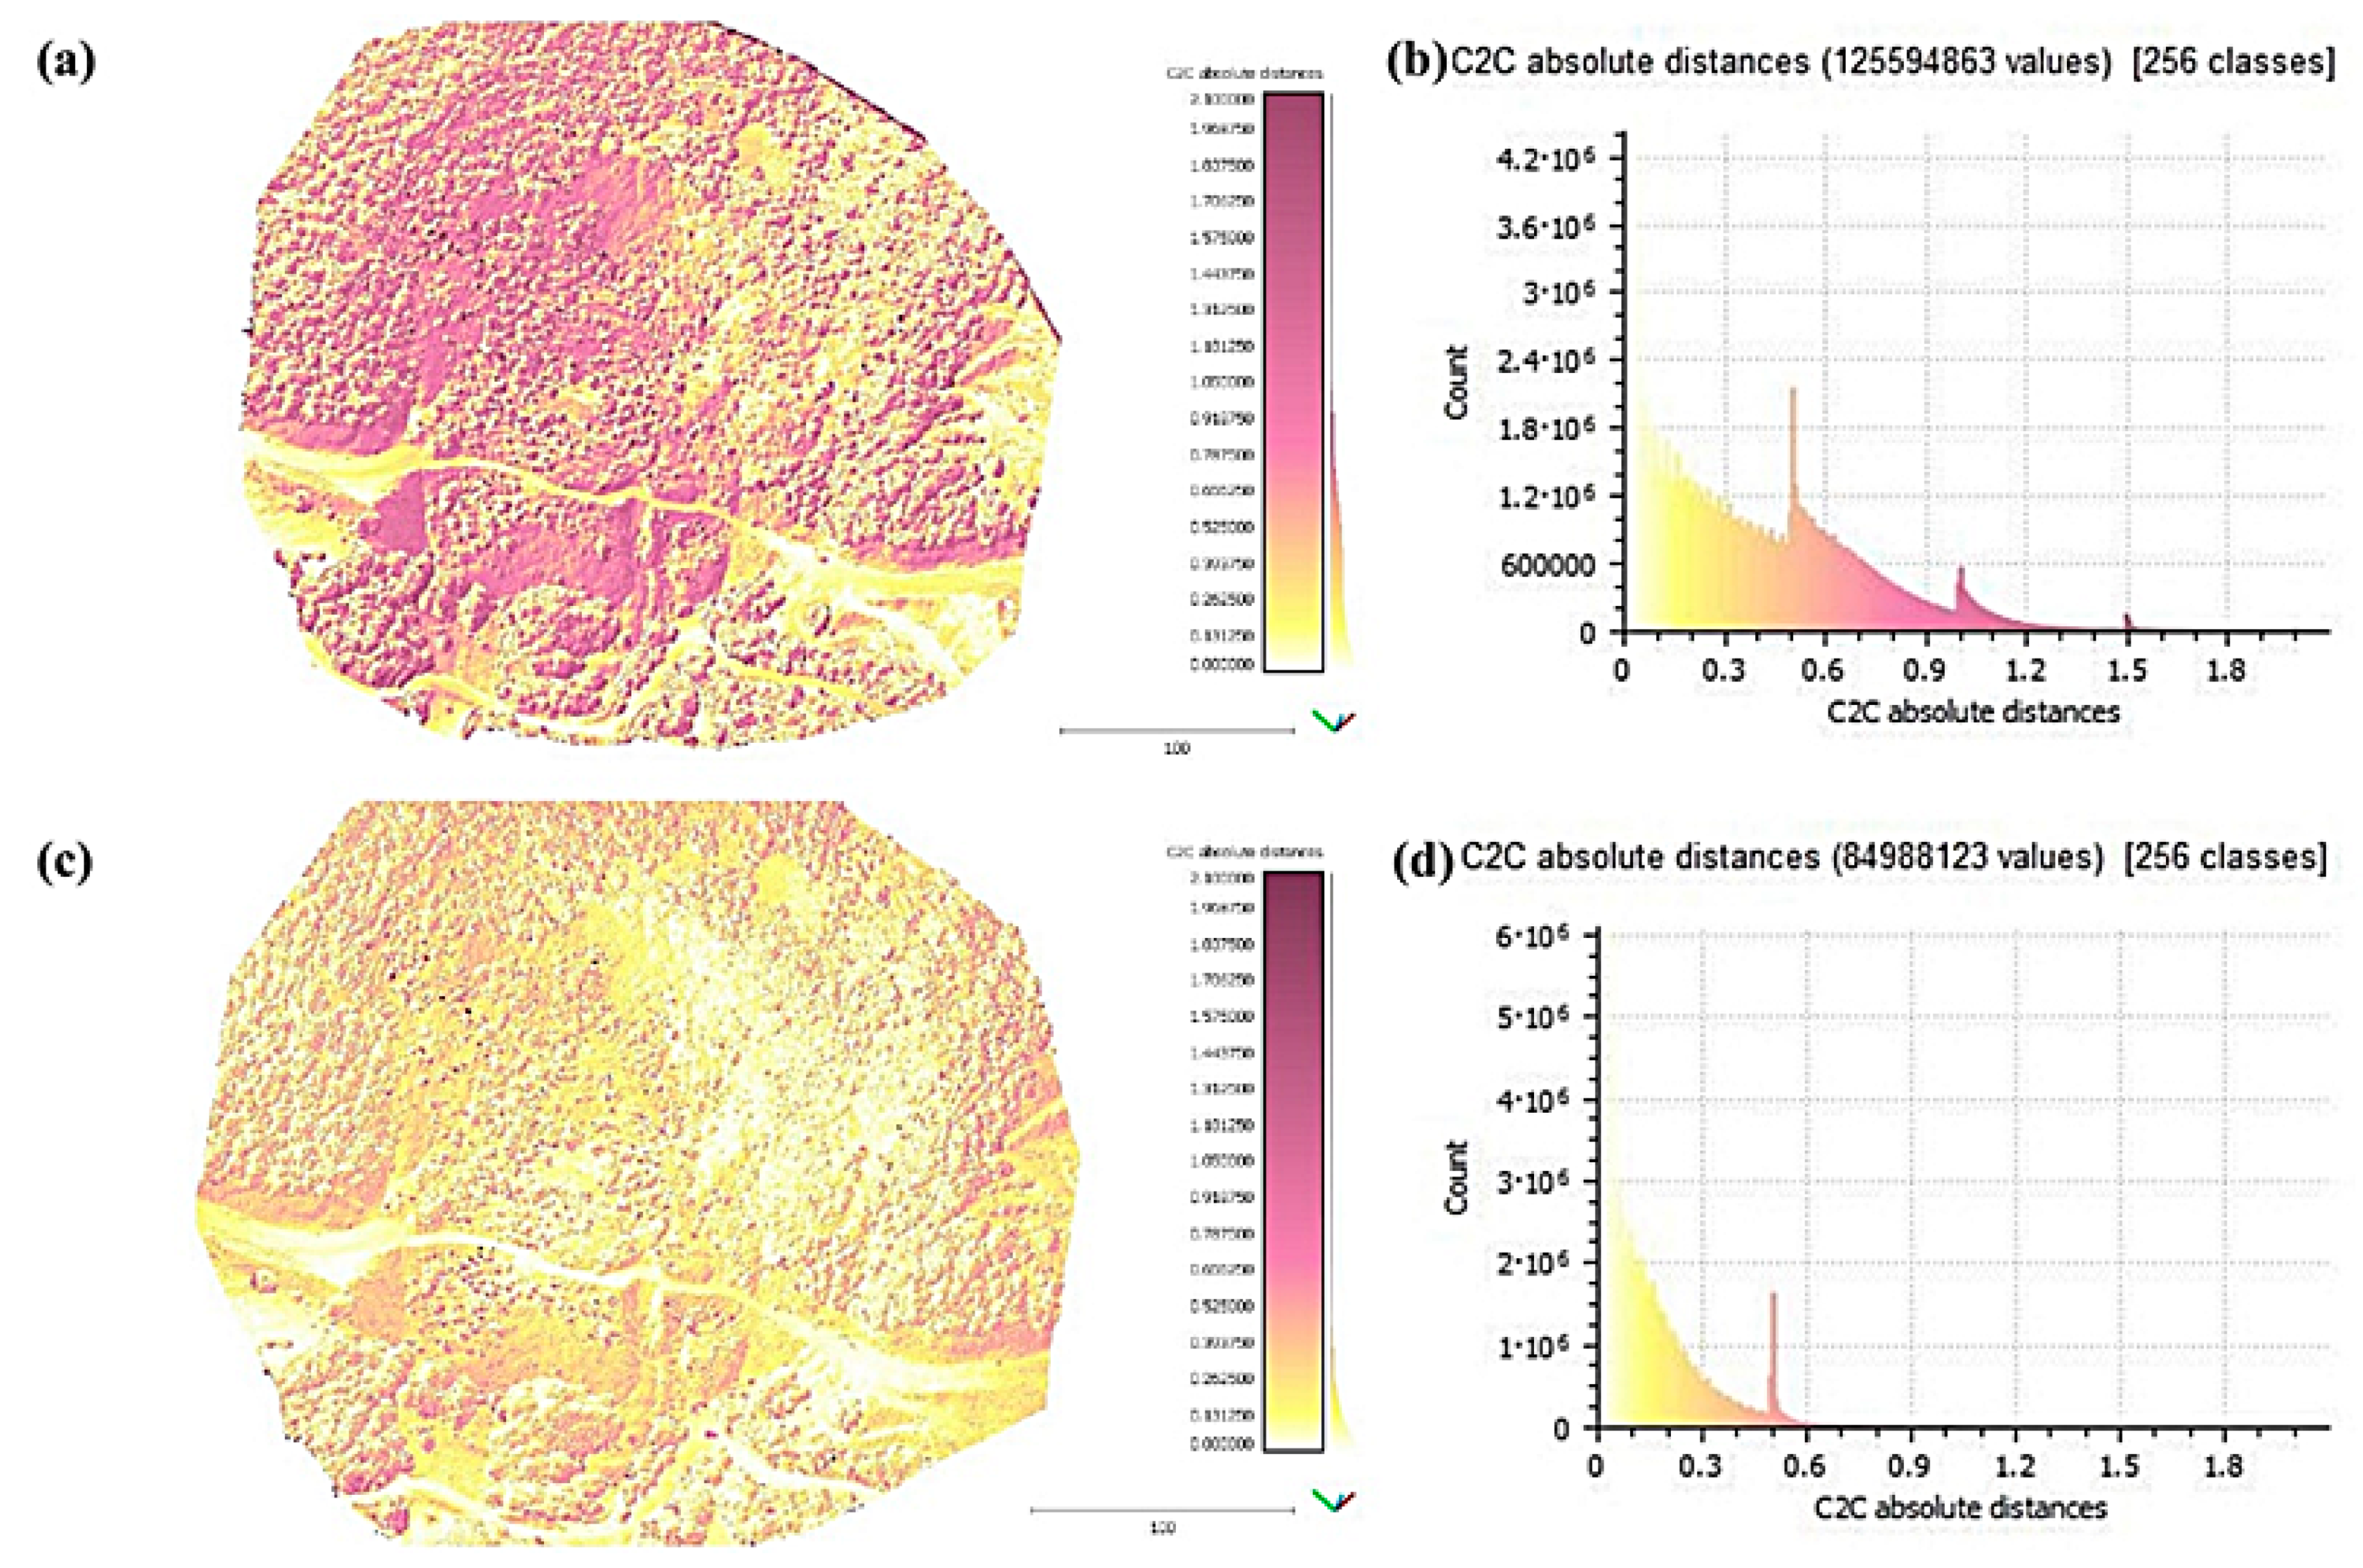
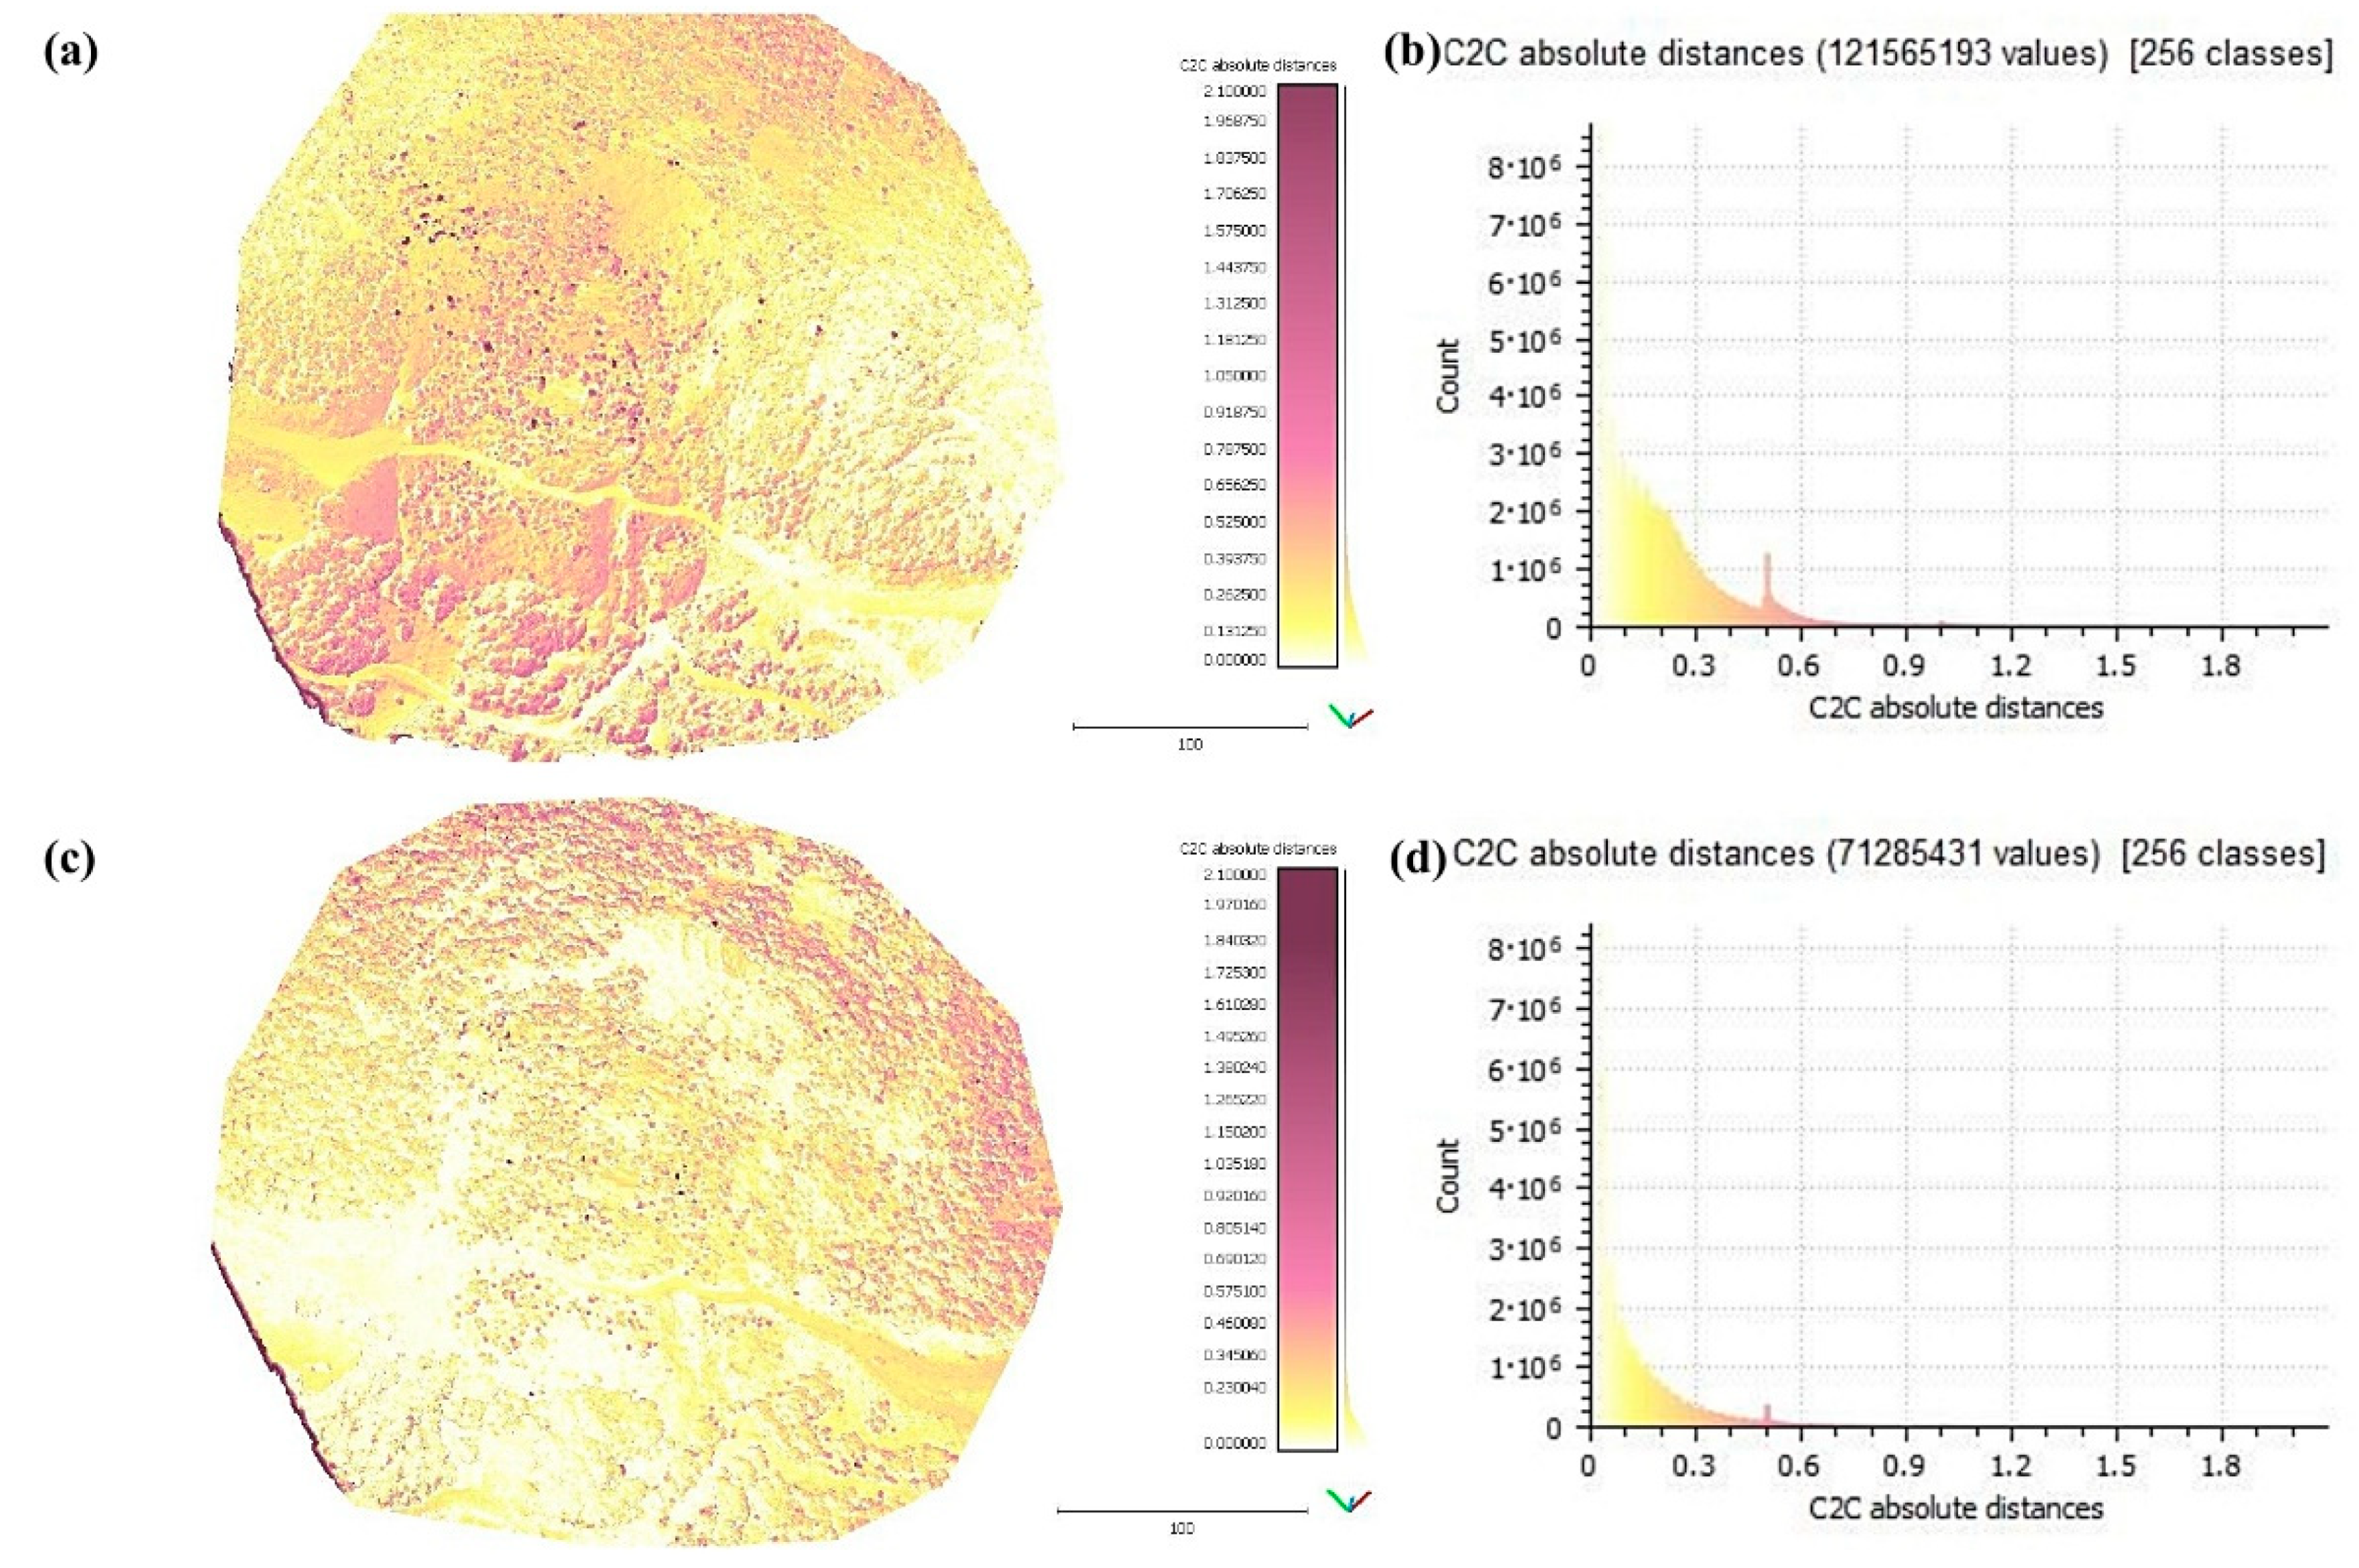
3.3. Point Clouds Accuracy Assessment

The UAV point clouds were integrated into CloudCompare software in order to calculate the distances between the points of subcategories. Thus, each point cloud from nadir or oblique-viewing geometry of each campaign was aligned with the corresponding point cloud resulted from a combination of nadir and oblique imagery. The alignment took place by detecting common points between the clouds along with the iterative closest point algorithm (ICP) [39]. The cloud-to-cloud (C2C) distances were computed between the selected datasets using 2D1/2 triangulation as a method for local modelling. In fact, C2C computation estimates the distance of each point from the respective nearest point of another cloud. Figure 10a and Figure 11a depict the C2C distances between the reference cloud, which was created by a combination of nadir and oblique imagery, and a nadir-viewing point cloud, while Figure 10c and Figure 11c present C2C distances between the refence cloud and an oblique-viewing point cloud. It is worth mentioning that the same color scaling was applied to all figures in order to ensure a direct visual comparison. The smallest surface deviations of Figure 10a are located mainly in the central parts of the landslide and around the road area, while in Figure 10c, the closest C2C distances are more scattered within the study area. The analysis of the two histograms of C2C distance computations revealed that the greatest surface deviations arose from the comparison of the reference cloud with the nadir-viewing point cloud (Figure 10b,c). Similar results were extracted from the comparison of the point clouds acquired on 25 July 2018 (Figure 11). Furthermore, in terms of comparison between the point clouds, surface profiles were created from either nadir-viewing imagery (orange line) or oblique-viewing imagery (green line) and with a respective surface profile extracted by a synergy of nadir and oblique images (blue line) (Figure 12). As observed, the surface profile of oblique is almost identical to the one generated by the combined nadir and oblique point cloud.

4. Discussion

The detailed and accurate mapping of landscapes and their geomorphological characteristics is a key issue in hazard management. Unfortunately, natural disasters are severely affecting Earth and thus, the scientific community has turned its attention in the direction of designing immediate response plans to mitigate the risk and protect the environment and human beings. Several new and innovative remote sensing methodologies have been developed in this direction. The aim of the current work is to examine if the image acquisition geometry of UAV campaigns affects the accuracy of the derived photogrammetric products, i.e., orthophotos, DSMs and photogrammetric point clouds during the performance of a detailed mapping of a landslide area. Four UAV flights were executed using a commercial DJI Phantom 4 and the collected imagery was organized in three subcategories based on the acquisition geometry (nadir imagery, oblique imagery, a combination of nadir and oblique imagery). UAV data processing was carried out through SfM photogrammetry and twelve orthophotos, twelve DSMs and twelve photogrammetric-based point clouds were generated.
The high accuracy of UAV orthophotos and DSMs has already been demonstrated in numerous previous studies, which also analyzed the parameters that could affect it [40,41,42]. The usefulness of oblique photogrammetry acquired from low-cost consumer cameras has been examined in the past for lavas flows and domes [43,44] or for the 3D reconstruction of an old chapel [45]. Diverse tests with different angles of oblique image acquisition have been performed in an area with steep relief using, as reference dataset, accurate data collected with a terrestrial laser scanner (TLS) [46]. A review of camera system selection, configuration and image acquisition in order to ameliorate the digital terrain model (DTM) accuracy was also presented [47]. However, the accuracy of UAV orthophotos, DSMs and point clouds acquired from different geometries does not present the same variety. This study is innovative as it examines the effect of UAV acquisition geometry on the accuracy of three different photogrammetric products, analyzed for the first time using multiple flights and various methodologies.
In further detail, the derived orthophotos were integrated into an ArcGIS environment, where their accuracy assessment was based on a procedure of digitization, calculation and comparison. GNSS measurements executed at the permanent pillars were used as reference measurements to determine the correct positions. Two geodetic lines from the x-y coordinates of the pillars were shaped on two different reliefs in order to check the adaptability of each acquisition geometry on a specific topography. Length and mean center of the reference lines and the digitized lines were calculated. The results demonstrated that orthophotos from the combination of nadir and oblique-viewing geometry could be used effectively for geomorphological mapping. The specific acquisition geometry showed a difference in length of ±0.01% for line 1 and a good performance in measuring the near distances from the reference mean center for the geodetic line 2, while oblique-viewing imagery resulting in the creation of lines with almost similar length to line 2 and small variations in mean centers. In addition, a relation between relief and acquisition geometry was identified. Nadir imagery seemed to provide better results for smooth and flat surfaces, while oblique imagery showed a good performance in steeper and more complex topography. The outcomes are in line with a new perspective for surface reconstruction using photogrammetric procedures, which suggest the collection of oblique and nadir images during a UAV flight in order to improve the accuracy of derived topographic products [48]. This new perspective is contrary to the conventional approaches which used nadir imagery for surface reconstruction. The combination of oblique, nadir and façade images improved the geometric accuracy of UAV data; however, users have to pay close attention to the angle between the viewing direction of the image and the normal vector of the terrain [26]. Oblique imagery can be an effective solution for the reconstruction of buildings, objects or the reconstruction of areas with complex topography [25,49].
The accuracy assessment of DSMs using GCPs or elevations from topographic maps along with the calculation of RMSE have already been checked by several researchers [50,51,52,53]. GNSS measurements performed at the permanent pillars were used as reference data for the calculation of RMSE of each derived DSM. The evaluation of RMSE calculation results proved that a combination of nadir and oblique imagery contributes to a more accurate representation of the landform. Moreover, oblique imagery showed a better adaptation to DSM generation than exclusively nadir-viewing geometry. This is expected and justified by the morphology of the study area. The slope is quite steep with inclinations that are higher than 60 degrees in some places within the landslide body. This is in accordance with another recent study [49], which found that the contribution of the oblique imagery is valuable in areas with complex geomorphology under the limitation that the UAV campaign is in a reasonable altitude.
The photogrammetric point clouds were implemented into CloudCompare software in order to calculate the distances between the points of subcategories. Each point cloud from the nadir or oblique-viewing geometry of each campaign was aligned with the corresponding point cloud resulting from a combination of nadir and oblique imagery and cloud-to-cloud (C2C) distances were computed. The evaluation of C2C distance computation for the analysis of surface changes has already been checked [54]. Oblique-viewing imagery displayed the smallest surface deviations and similar surface profile with the point cloud generated by the combination nadir and oblique images.
The final synthesis of the aforementioned results concluded that the combination of nadir and oblique imagery is the most appropriate for the detailed mapping of complex landforms. In addition, oblique-viewing imagery is quite promising with accurate enough results. This is in full accordance with the results derived from TLS [46]. In that study, it was indicated that the combination of nadir image blocks with oblique images in the UAV–SfM workflow consistently improves both spatial accuracy and precision, while also decreasing data gaps and systematic errors in the final point cloud.

5. Conclusions

The current study examined the effect of UAV image acquisition geometry on the accuracy of the derived products in order to achieve a detailed geomorphological mapping. UAV data were organized in three subcategories, i.e., nadir imagery, oblique imagery and a combination of nadir and oblique imagery. The derived orthophotos, DSMs and point clouds were assessed using multiple methods. The evaluation of orthophotos through a digitization and comparison procedure of the length and the mean center of lines proved that the combination of orthophotos acquired by nadir and oblique-viewing geometry constitute the more effective acquisition for an accurate geomorphological mapping. The same outcome arose from the calculation of RMSE of the derived DSMs. Moreover, it was demonstrated that a purely nadir-viewing geometry is not suitable for geomorphological mapping in very steep areas, while the specific geometry seems to provide better results for smooth and flat surfaces. On the other hand, oblique imagery showed a good performance in a steeper and more complex topography, which is also confirmed by the processing of the derived point clouds. Therefore, we observed a relation between relief and acquisition geometry; however, it is suggested to adjust the viewing angle of the UAV cameras according to the geomorphology and especially to the landform inclination. Furthermore, C2C distance computation could be effectively used as a method for the assessment of UAV point clouds. Even if the main outcome is that the combination of nadir and oblique imagery is the more appropriate image acquisition geometry for an accurate mapping of complex landforms, further research is needed regarding the exploitation of oblique-viewing geometry. In particular, the specific geometry proved to be quite promising and accurate in complex topography. Thus, future research will focus on the evaluation of various viewing angles, while performing oblique acquisition flights.

Author Contributions

Conceptualization, Aggeliki Kyriou and Konstantinos Nikolakopoulos; methodology, Aggeliki Kyriou and Konstantinos Nikolakopoulos; software, Aggeliki Kyriou; validation, Aggeliki Kyriou, Ioannis Koukouvelas, and Konstantinos Nikolakopoulos; formal analysis, Aggeliki Kyriou; investigation, Aggeliki Kyriou, Konstantinos Nikolakopoulos and Ioannis Koukouvelas; data curation, Aggeliki Kyriou, Konstantinos Nikolakopoulos, and Ioannis Koukouvelas, writing—original draft preparation, Aggeliki Kyriou; writing—review and editing, Konstantinos Nikolakopoulos and Ioannis Koukouvelas; project administration, Konstantinos Nikolakopoulos; funding acquisition, Konstantinos Nikolakopoulos and Aggeliki Kyriou. All authors have read and agreed to the published version of the manuscript.

Funding

The research work was supported by the Hellenic Foundation for Research and Innovation (HFRI) under the HFRI PhD Fellowship grant (Fellowship Number: 525).
Ijgi 10 00408 i001

Data Availability Statement

The data presented in this study are available on request from the corresponding author. The data are not publicly available due to privacy.

Conflicts of Interest

The authors declare no conflict of interest.

References

  1. Gobiet, A.; Kotlarski, S.; Beniston, M.; Heinrich, G.; Rajczak, J.; Stoffel, M. 21st century climate change in the European Alps—A review. Sci. Total Environ. 2014, 493, 1138–1151. [Google Scholar] [CrossRef]
  2. Sauerborn, R.; Ebi, K. Climate change and natural disasters—Integrating science and practice to protect health. Glob. Health Action 2012, 5, 19295. [Google Scholar] [CrossRef] [PubMed]
  3. Alcántara-Ayala, I.; Altan, O.; Baker, D.; Briceño, S.; Cutter, S.; Gupta, H.; Holloway, A.; Ismail-Zadeh, A.; Jiménez Díaz, V.; Johnston, D.; et al. Disaster Risks Research and Assessment to Promote Risk Reduction and Management; Ismail-Zadeh, A., Cutter, S., Eds.; ICSU: Paris, France, 2015. [Google Scholar]
  4. Themistocleous, K.; Danezis, C. Monitoring Cultural Heritage Sites Affected by Geo-Hazards Using In-Situ and SAR Data: The Choirokoitia Case Study. In Remote Sensing for Archaeology and Cultural Landscapes—Best Practices and Perspectives across Europe and Middle East; Hadjimitsis, D.G., Themisloceous, K., Cuca, B., Agapiou, A., Lysandrou, V., Lasaponara, R., Masini, N., Schreirer, G., Eds.; Springer Remote Sensing/Photogrammetry: Cham, Switzerland, 2020; ISBN 978-3-030-10978-3. [Google Scholar]
  5. Garnica-Peña, R.J.; Alcántara-Ayala, I. The use of UAVs for landslide disaster risk research and disaster risk management: A literature review. J. Mt. Sci. 2021, 18, 482–498. [Google Scholar] [CrossRef]
  6. Themistocleous, K. Themistocleous, K. The Use of UAVs for Cultural Heritage and Archaeology. In Remote Sensing for Archaeology and Cultural Landscapes—Best Practices and Perspectives across Europe and Middle East; Hadjimitsis, D.G., Themisloceous, K., Cuca, B., Agapiou, A., Lysandrou, V., Lasaponara, R., Masini, N., Schreirer, G., Eds.; Springer Remote Sensing/Photogrammetry: Cham, Switzerland, 2020; ISBN 978-3-030-10978-3. [Google Scholar]
  7. Themistocleous, K.; Hadjimitsis, D.G.; Michaelides, S.; Spizzichino, D.J.; Crosta, G.B.; Fernandez Merodo, J.A.; Bee, E. Best Practices for Monitoring, Mitigation and Preservation of Cultural Heritage Sites Affected By Geo-Hazards. In Proceedings of the EGU2018, Vienna, Austria, 8–13 April 2018; Volume 20. [Google Scholar]
  8. Nikolakopoulos, K.G.; Soura, K.; Koukouvelas, I.K.; Argyropoulos, N.G. UAV vs. classical aerial photogrammetry for archaeological studies. J. Arch. Sci. Rep. 2017, 14, 758–773. [Google Scholar] [CrossRef]
  9. Koeva, M.; Muneza, M.; Gevaert, C.; Gerke, M.; Nex, F. Using UAVs for map creation and updating. A case study in Rwanda. Surv. Rev. 2018, 50, 312–325. [Google Scholar] [CrossRef] [Green Version]
  10. Mancini, F.; Dubbini, M.; Gattelli, M.; Stecchi, F.; Fabbri, S.; Gabbianelli, G. Using Unmanned Aerial Vehicles (UAV) for High-Resolution Reconstruction of Topography: The Structure from Motion Approach on Coastal Environments. Remote Sens. 2013, 5, 6880–6898. [Google Scholar] [CrossRef] [Green Version]
  11. Piras, M.; Taddia, G.; Forno, M.G.; Gattiglio, M.; Aicardi, I.; Dabove, P.; Lo Russo, S.; Lingua, A. Detailed geological mapping in mountain areas using an unmanned aerial vehicle: Application to the Rodoretto Valley, NW Italian Alps. Geomat. Nat. Hazards Risk 2017, 8, 137–149. [Google Scholar] [CrossRef]
  12. Themistocleous, K. The Use of UAVs to Monitor Archeological Sites: The Case Study of Choirokoitia within the PROTHEGO Project. In Proceedings of the Fifth International Conference on Remote Sensing and Geo-information of Environment, Paphos, Cyprus, 20–23 March 2017. [Google Scholar]
  13. Gao, M.; Xu, X.; Klinger, Y.; van der Woerd, J.; Tapponnier, P. High-resolution mapping based on an Unmanned Aerial Vehicle (UAV) to capture paleoseismic offsets along the Altyn-Tagh fault, China. Sci. Rep. 2017, 7, 8281. [Google Scholar] [CrossRef]
  14. Baldi, P.; Coltelli, M.; Fabris, M.; Marsella, M.; Tommasi, P. High precision photogrammetry for monitoring the evolution of the NW flank of Stromboli volcano during and after the 2002–2003 eruption. Bull. Volcanol. 2008, 70, 703–715. [Google Scholar] [CrossRef]
  15. Rau, J.Y.; Jhan, J.P.; Lo, C.F.; Lin, Y.S. Landslide mapping using imagery acquired by a fixed-wing UAV. Int. Arch. Photogramm. 2012, 38, 195–200. [Google Scholar] [CrossRef] [Green Version]
  16. Rossi, G.; Tanteri, L.; Tofani, V.; Vannocci, P.; Moretti, S.; Casagli, N. Multitemporal UAV surveys for landslide mapping and characterization. Landslides 2018, 15, 1045–1052. [Google Scholar] [CrossRef] [Green Version]
  17. Kyriou, A.; Nikolakopoulos, K.; Koukouvelas, I.; Lampropoulou, P. Repeated UAV Campaigns, GNSS Measurements, GIS, and Petrographic Analyses for Landslide Mapping and Monitoring. Minerals 2021, 11, 300. [Google Scholar] [CrossRef]
  18. Themistocleous, K.; Danezis, C. Monitoring cultural heritage sites affected by geohazards. In Earth Resources and Environmental Remote Sensing/GIS Applications IX; International Society for Optics and Photonics: Washington, DC, USA, 2018. [Google Scholar] [CrossRef]
  19. Themistocleous, K.; Danezis, C.; Mendonidis, E.; Lymperopoulou, E. Monitoring ground deformation of cultural heritage sites using UAVs and geodetic techniques: The case study of Choirokoitia, JPI PROTHEGO project. In Earth Resources and Environmental Remote Sensing/GIS Applications VIII, Proceedings of the SPIE Remote Sensing Conference, Warsaw, Poland, 11–14 September 2017; SPIE: Washington, DC, USA, 2017; Volume 10428. [Google Scholar] [CrossRef]
  20. Amrullah, C.; Suwardhi, D.; Meilano, I. Product accuracy effect of oblique and vertical non-metric digital camera utilization in UAV-photogrammetry to determine fault plane. ISPRS Ann. Photogramm. Remote Sens. Spat. Inf. Sci. 2016, 3, 41–48. [Google Scholar] [CrossRef] [Green Version]
  21. Meinen, B.U.; Robinson, D.T. Mapping erosion and deposition in an agricultural landscape: Optimization of UAV image acquisition schemes for SfM-MVS. Remote Sens. Environ. 2020, 239, 111666. [Google Scholar] [CrossRef]
  22. Casella, V.; Franzini, M. Modelling steep surfaces by various configurations of nadir and oblique photogrammetry. ISPRS Ann. Photogramm. Remote Sens. Spat. Inf. Sci. 2016, 3, 175–182. [Google Scholar] [CrossRef] [Green Version]
  23. Rossi, P.; Mancini, F.; Dubbini, M.; Mazzone, F.; Capra, A. Combining nadir and oblique UAV imagery to reconstruct quarry topography: Methodology and feasibility analysis. Eur. J. Remote Sens. 2017, 50, 211–221. [Google Scholar] [CrossRef] [Green Version]
  24. Lingua, A.; Noardo, F.; Spanò, A.; Sanna, S.; Matrone, F. 3D model generation using oblique images acquired by UAV. ISPRS Ann. Photogramm. Remote Sens. Spat. Inf. Sci. 2017, 42, 107–115. [Google Scholar] [CrossRef] [Green Version]
  25. Vacca, G.; Dessì, A.; Sacco, A. The Use of Nadir and Oblique UAV Images for Building Knowledge. ISPRS Int. J. Geo-Inf. 2017, 6, 393. [Google Scholar] [CrossRef] [Green Version]
  26. Tu, Y.-H.; Johansen, K.; Aragon, B.; Stutsel, B.M.; Angel, Y.; Camargo, O.A.L.; Al-Mashharawi, S.K.M.; Jiang, J.; Ziliani, M.G.; McCabe, M.F. Combining Nadir, Oblique, and Façade Imagery Enhances Reconstruction of Rock Formations Using Unmanned Aerial Vehicles. IEEE Trans. Geosci. Remote Sens. 2021, 1–13. [Google Scholar] [CrossRef]
  27. Štroner, M.; Urban, R.; Reindl, T.; Seidl, J.; Brouček, J. Evaluation of the Georeferencing Accuracy of a Photogrammetric Model Using a Quadrocopter with Onboard GNSS RTK. Sensors 2020, 20, 2318. [Google Scholar] [CrossRef] [PubMed] [Green Version]
  28. Štroner, M.; Urban, R.; Seidl, J.; Reindl, T.; Brouček, J. Photogrammetry Using UAV-Mounted GNSS RTK: Georeferencing Strategies without GCPs. Remote Sens. 2021, 13, 1336. [Google Scholar] [CrossRef]
  29. Teppati Losè, L.; Chiabrando, F.; Giulio Tonolo, F. Boosting the Timeliness of UAV Large Scale Mapping. Direct Georeferencing Approaches: Operational Strategies and Best Practices. ISPRS Int. J. Geo-Inf. 2020, 9, 578. [Google Scholar] [CrossRef]
  30. Eltner, A.; Sofia, G. Chapter 1—Structure from motion photogrammetric technique. In Developments in Earth Surface Processes; Tarolli, P., Mudd, S.M., Eds.; Elsevier: Amsterdam, The Netherlands, 2020; Volume 23, pp. 1–24. [Google Scholar]
  31. Westoby, M.; Brasington, J.; Glasser, N.; Hambrey, M.; Reynolds, J. ‘Structure-from-Motion’ photogrammetry: A low-cost, effective tool for geoscience applications. Geomorphology 2012, 179, 300–314. [Google Scholar] [CrossRef] [Green Version]
  32. Micheletti, N.; Chandler, J.; Lane, S.N. Chapter 2—Structure from motion (SFM) photogrammetry. In Geomorphological Techniques; Section 2.2; British Society for Geomorphology: London, UK, 2015. [Google Scholar]
  33. Photoscan Manual. Available online: http://www.agisoft.com/pdf/photoscan-pro_1_1_en.pdf (accessed on 27 February 2021).
  34. Nikolakopoulos, K.; Kyriou, A.; Koukouvelas, I.; Zygouri, V.; Apostolopoulos, D. Combination of Aerial, Satellite, and UAV Photogrammetry for Mapping the Diachronic Coastline Evolution: The Case of Lefkada Island. ISPRS Int. J. Geo-Inf. 2019, 8, 489. [Google Scholar] [CrossRef] [Green Version]
  35. ArcMap (Mean Center). Available online: https://desktop.arcgis.com/en/arcmap/latest/tools/spatial-statistics-toolbox/mean-center.htm (accessed on 2 March 2021).
  36. Mitchell, A. The ESRI Guide to GIS Analysis, 1st ed.; ESRI Press: Redlands, CA, USA, 2005; Volume 2. [Google Scholar]
  37. ArcMap (Near Analysis). Available online: https://desktop.arcgis.com/en/arcmap/10.3/tools/analysis-toolbox/near.htm (accessed on 2 March 2021).
  38. Congalton, R.G.; Green, K. Assessing the Accuracy of Remotely Sensed Data Principles and Practices; CRC Press: Boca Raton, FL, USA, 2009. [Google Scholar]
  39. Chen, Y.; Medioni, G. Object modelling by registration of multiple range images. Image Vis. Comput. 1992, 10, 145–155. [Google Scholar] [CrossRef]
  40. Mesas-Carrascosa, F.J.; Rumbao, I.C.; Berrocal, J.A.B.; Porras, A.G.-F. Positional Quality Assessment of Orthophotos Obtained from Sensors Onboard Multi-Rotor UAV Platforms. Sensors 2014, 14, 22394–22407. [Google Scholar] [CrossRef] [PubMed]
  41. Agüera-Vega, F.; Carvajal-Ramírez, F.; Martínez-Carricondo, P. Accuracy of Digital Surface Models and Orthophotos Derived from Unmanned Aerial Vehicle Photogrammetry. J. Surv. Eng. 2017, 143, 04016025. [Google Scholar] [CrossRef]
  42. Gindraux, S.; Boesch, R.; Farinotti, D. Accuracy Assessment of Digital Surface Models from Unmanned Aerial Vehicles’ Imagery on Glaciers. Remote Sens. 2017, 9, 186. [Google Scholar] [CrossRef] [Green Version]
  43. James, M.R.; Robson, S.; Pinkerton, H.; Ball, M. Oblique photogrammetry with visible and thermal images of active lava flows. Bull. Volcanol. 2006, 69, 105–108. [Google Scholar] [CrossRef]
  44. James, M.R.; Pinkerton, H.; Robson, S. Image-based measurement of flux variation in distal regions of active lava flows. Geochem. Geophys. Geosyst. 2007, 8, Q03006. [Google Scholar] [CrossRef] [Green Version]
  45. Aicardi, I.; Chiabrando, F.; Grasso, N.; Lingua, A.M.; Noardo, F.; Spanò, A. UAV photogrammetry with oblique images: First analysis on data acquisition and processing. In Proceedings of the International Archives of the Photogrammetry, Remote Sensing and Spatial Information Sciences. In Proceedings of the XXIII ISPRS Congress, Prague, Czech Republic, 12–19 July 2016; Volume XLI-B1. [Google Scholar]
  46. Nesbit, P.R.; Hugenholtz, C.H. Enhancing UAV–SfM 3D Model Accuracy in High-Relief Landscapes by Incorporating Oblique Images. Remote Sens. 2019, 11, 239. [Google Scholar] [CrossRef] [Green Version]
  47. Mosbrucker, A.R.; Major, J.J.; Spicer, K.R.; Pitlick, J. Camera system considerations for geomorphic applications of SfM photogrammetry. Earth Surf. Process. Landf. 2017, 42, 969–986. [Google Scholar] [CrossRef] [Green Version]
  48. James, M.R.; Robson, S. Mitigating systematic error in topographic models derived from UAV and ground-based image networks. Earth Surf. Process. Landf. 2014, 39, 1413–1420. [Google Scholar] [CrossRef] [Green Version]
  49. Sammartano, G.; Chiabrando, F.; Spanò, A. Oblique images and direct photogrammetry with a fixed wing platform: First test and results in Hierapolis of Phrygia (TK). Int. Arch. Photogramm. Remote Sens. Spat. Inf. Sci. 2020, 43, 75–82. [Google Scholar] [CrossRef]
  50. Alganci, U.; Besol, B.; Sertel, E. Accuracy Assessment of Different Digital Surface Models. ISPRS Int. J. Geo-Inf. 2018, 7, 114. [Google Scholar] [CrossRef] [Green Version]
  51. Wessel, B.; Huber, M.; Wohlfart, C.; Marschalk, U.; Kosmann, D.; Roth, A. Accuracy assessment of the global TanDEM-X Digital Elevation Model with GPS data. ISPRS J. Photogramm. Remote Sens. 2018, 139, 171–182. [Google Scholar] [CrossRef]
  52. Elkhrachy, I. Vertical accuracy assessment for SRTM and ASTER Digital Elevation Models: A case study of Najran city, Saudi Arabia. Ain Shams Eng. J. 2018, 9, 1807–1817. [Google Scholar] [CrossRef]
  53. Hobi, M.L.; Ginzler, C. Accuracy Assessment of Digital Surface Models Based on WorldView-2 and ADS80 Stereo Remote Sensing Data. Sensors 2012, 12, 6347–6368. [Google Scholar] [CrossRef] [PubMed] [Green Version]
  54. Ahmad Fuad, N.; Yusoff, A.R.; Ismail, Z.; Majid, Z. Comparing the performance of point cloud registration methods for landslide monitoring using mobile laser scanning data. In Proceedings of the International Archives of the Photogrammetry, Remote Sensing and Spatial Information Sciences, International Conference on Geomatics and Geospatial Technology (GGT 2018), Kuala Lumpur, Malaysia, 3–5 September 2018; Volume XLII-4/W9. [Google Scholar] [CrossRef] [Green Version]
Figure 1. Landslide area. (a) Google Earth image covering the study area before the landslide. (b) Orthophoto of the study after the occurrence of the landslide.
Ijgi 10 00408 g001
Figure 2. (ac) GCP patterns, located on permanent pillars.
Ijgi 10 00408 g002
Figure 3. (a) UAV image acquired on 5 November 2017. The red squares define the area where GCPs are located. (bd) GCP patterns as recognized in UAV imagery.
Ijgi 10 00408 g003
Figure 4. (a) Flowchart representing the applied methodology. (b) The derived products of each UAV campaign.
Ijgi 10 00408 g004
Figure 5. UAV acquisition trajectories. (a) Nadir-viewing grid trajectory. (b) Oblique-viewing grid trajectory. (c) Nadir-viewing image. (d) Oblique-viewing image.
Ijgi 10 00408 g005
Figure 6. Orthophotos of the study area. (a) Orthophoto from a combination of nadir and oblique imagery on 5 November 2017. (b) Orthophoto from nadir imagery on 5 November 2017. (c) Orthophoto from oblique imagery on 5 November 2017.
Ijgi 10 00408 g006
Figure 7. The distribution of the permanent pillars and the geodetic lines throughout the study area.
Ijgi 10 00408 g007
Figure 8. Location of mean center of line 1.
Ijgi 10 00408 g008
Figure 9. Location of mean center of line 2.
Ijgi 10 00408 g009
Figure 10. Cloud-to-cloud distances. (a) C2C distances between the point cloud of nadir-oblique imagery and the corresponding one of nadir-viewing geometry, acquired on 9 June 2018. (b) Histogram of C2C distances between the point cloud of nadir-oblique imagery and the corresponding one of nadir-viewing geometry, acquired on 9 June 2018. (c) C2C distances between the point cloud of nadir-oblique imagery and the corresponding one of oblique-viewing geometry, acquired on 9 June 2018. (d) Histogram of C2C distances between the point cloud of nadir-oblique imagery and the corresponding one of oblique-viewing geometry, acquired on 9 June 2018.
Ijgi 10 00408 g010
Figure 11. Cloud-to-cloud distances. (a) C2C distances between the point cloud of nadir-oblique imagery and the corresponding one of nadir-viewing geometry, acquired on 25 July 2018. (b) Histogram of C2C distances between the point cloud of nadir-oblique imagery and the corresponding one of nadir-viewing geometry, acquired on 25 July 2018. (c) C2C distances between the point cloud of nadir-oblique imagery and the corresponding one of oblique-viewing geometry, acquired on 25 July 2018. (d) Histogram of C2C distances between the point cloud of nadir-oblique imagery and the corresponding one of oblique-viewing geometry, acquired on 25 July 2018.
Ijgi 10 00408 g011
Figure 12. Surface profiles. (a) Surface profile of the nadir-viewing point cloud (orange line) in accordance with the respective surface profile of the point cloud from nadir-oblique imagery (blue line). (b) Surface profile of the oblique-viewing point cloud (green line) in accordance with the respective surface profile of the point cloud from nadir-oblique imagery (blue line).
Ijgi 10 00408 g012
Table 1. Dates of UAV campaigns.
CampaignDate
15 November 2017
226 January 2018
39 June 2018
425 July 2018
Table 2. Parameters of UAV flights.
Flight Parameters
UAV altitude (m)110
GSD (cm)4
Along the track overlap %90
Across the track overlap %75
Table 3. Characteristics of subcategories.
CampaignSubcategoriesNumber of Photos
1,2,3,4Nadir imagery189
Oblique imagery174
Nadir + Oblique imagery363
Table 4. Coordinates of GCPs.
a/aPermanent Pillarx-Coordinatey-Coordinatez-Coordinate
1External 1309990.4594225793.033716.803
2External 2310118.3554225605.885720.698
3External 3309982.3504225704.945685.452
4C310070.5774225719.056725.759
52310099.6744225760.662738.102
63310189.3744225638.392759.777
Table 5. Length of the geodetic lines in accordance with the reference length.
CampaignsSubcategoriesLength Line 1 (m)Difference (m)Difference %Length Line 2 (m)Difference (m)Difference %
Reference line from x-y coordinates-226.676--129.881--
1
5 November 2017
Nadir + Oblique imagery227.176−0.500−0.22%129.9010.0200.02%
Nadir imagery227.13−0.454−0.20%129.6840.1970.15%
Oblique imagery226.921−0.245−0.11%129.919−0.038−0.03%
2
9 June 2018
Nadir + Oblique imagery226.734−0.058−0.03%129.7250.1560.12%
Nadir imagery226.933−0.257−0.11%129.550.3310.25%
Oblique imagery226.745−0.069−0.03%129.937−0.056−0.04%
3
25 July 2018
Nadir + Oblique imagery226.4190.2570.11%129.7480.1330.10%
Nadir imagery226.813−0.137−0.06%129.7410.1400.11%
Oblique imagery226.4620.2140.09%130.031−0.150−0.12%
4
26 January 2018
Nadir + Oblique imagery226.761−0.085−0.04%129.851−0.030−0.02%
Nadir imagery226.68−0.0040.00%129.921−0.040−0.03%
Oblique imagery226.5970.0790.03%129.932−0.051−0.04%
Table 6. Near distances of mean centers from the reference mean centers of lines 1 and 2.
CampaignSubcategoriesNear Distance (m)
Mean Center of Line 1
Near Distance (m) Mean Center Line 2
1
5 November 2017
Nadir imagery0.1170.231
Oblique imagery0.0720.108
Nadir + Oblique imagery0.0670.078
2
9 June 2018
Nadir imagery0.0230.095
Oblique imagery0.0150.049
Nadir + Oblique imagery0.0130.112
3
25 July 2018
Nadir imagery0.3450.194
Oblique imagery0.1790.183
Nadir + Oblique imagery0.1520.082
4
26 January 2018
Nadir imagery0.1610.198
Oblique imagery0.0510.081
Nadir + Oblique imagery0.0480.095
Table 7. RMSE between the derived DSMs and the GNSS measurements.
CampaignSubcategoriesRMSE (m)
1
5 November 2017
Nadir imagery0.34
Oblique imagery0.28
Nadir + Oblique imagery0.21
2
9 June 2018
Nadir imagery0.38
Oblique imagery0.26
Nadir + Oblique imagery0.14
3
25 July 2018
Nadir imagery0.32
Oblique imagery0.27
Nadir + Oblique imagery0.17
4
26 January 2018
Nadir imagery0.34
Oblique imagery0.26
Nadir + Oblique imagery0.19
Publisher’s Note: MDPI stays neutral with regard to jurisdictional claims in published maps and institutional affiliations.

