Article

Heterogeneity of Spatial Distribution and Factors Influencing Unattended Locker Points in Guangzhou, China: The Case of Hive Box

1
School of Geography and Planning, Sun Yat-Sen University, No. 135, Xingang Xi Road, Guangzhou 510275, China
2
College of Tourism, Xinjiang University, No. 666, Sheng Li Road, Urumqi 830049, China
*
Author to whom correspondence should be addressed.
ISPRS Int. J. Geo-Inf. 2021, 10(6), 409; https://0-doi-org.brum.beds.ac.uk/10.3390/ijgi10060409
Submission received: 24 March 2021 / Revised: 8 June 2021 / Accepted: 10 June 2021 / Published: 14 June 2021
(This article belongs to the Special Issue Geodata Science and Spatial Analysis in Urban Studies)

Abstract

:
Hive Box is a company that operates a network of express unattended collection and delivery points (UCDPs) in China. Hive Box distribution enhances community-based end-to-end delivery services and low-carbon city logistics. It is argued that UCDPs compared with attended collection and delivery points (ACDPs) should be considered for further investigation. Therefore, the present study employed kernel density estimation, spatial autocorrelation analysis, and geographically weighted regression to investigate the spatial heterogeneity of Hive Box distribution across Guangzhou. Hive Box location data were collected from smartphone apps. The results were as follows: (1) the kernel density declined from the city center toward the outskirts, and showed point-like spatial agglomerations in the city center; (2) the Moran’s I index analysis showed that Hive Box distribution exhibited spatial agglomeration from a global perspective and geographic variations in locality in space; the heterogeneity of urban–rural differences implies the uneven development of Hive Box distribution in Guangzhou; and (3) the factors influencing Hive Box distribution were multilevel, and their effects were complex and varied across regions. These results shed light on the agglomeration and heterogeneity characteristics of the spatial distribution and influencing factors of Hive Boxes. For an enhanced community-based end-to-end delivery service, this study suggested the identification of the geographic variations of Hive Box distribution and the combined effects of multiple factors in intensifying the infrastructure of unattended locker points.

1. Introduction

With the rapid development of e-commerce and city logistics, collection and delivery points (CDPs, often called pickup points) have become a crucial alternative solution for end-to-end delivery services, solving last-mile logistical problems caused by home delivery failures [1]. Two types of CDPs exist: unattended CDPs (UCDPs) and attended CDPs (ACDPs).
A study revealed that CDPs increase delivery efficiency by reducing the number of failed home deliveries, and thus, they have gained popularity in many European countries, such as France, the United Kingdom, and the Netherlands [2]. For example, in France, pickup points were found to account for approximately 20% of parcel deliveries to households [3]. In China, to promote the efficiency of last-mile logistics, many third-party logistics service providers (hereinafter “3PLs”) and the government are involved in the development of end-to-end delivery services. Cainiao Station (which operates ACDPs) and Hive Box (which operates UCDPs) have become increasingly important 3PLs. Currently, Cainiao Station has established more than 40,000 community-based service stations across China, and Hive Box operates more than 150,000 parcel lockers; this covers over 100 cities, and more than 9,000,000 parcels are delivered to such lockers daily [4]. In its 5-year economic development plans, the Chinese government has expressed a great ambition to promote the deployment of end-to-end delivery services in communities, universities, business centers, subway stations, and elsewhere [5,6].
Confronted with complex geographical spaces and the spread of end consumers, those involved in last-mile logistics encounter problems of delivery failure, high end-to-end distribution costs, low delivery service quality, poor delivery timeliness, low convenience of pickup, serious environmental pollution, and the inability to meet the diversified needs of end consumers [7,8]. These problems have become a bottleneck restricting the high-quality development of e-commerce and low-carbon logistics. An alternative method for solving last-mile problems is to shorten the distance between CDPs and end consumers, from the “last mile” to the “last 500 m,” then to the last 100 m, and even to the last 50 m [1]. Thus, the location and distribution of CDPs have aroused research interest worldwide [9,10,11]. UCDPs have more advantages over ACDPs in terms of shortening the distance between CDPs and end consumers, thus achieving the last 100 m in city logistics. This is due to their small size, which enables them to be placed in any unit without the need to consider rent or staffing concerns
Thus far, studies have analyzed the site selection and location, spatial distribution, and accessibility and usability of ACDPs, especially Cainiao Stations and China Post Stations in Chinese cities; however, little is known about the identification and geographic variations of UCDPs [3]. Therefore, the main goals of this study were to identify the spatial distribution characteristics and influencing factors of unattended locker points.
The remainder of this paper is organized as follows. First, a brief review of the recent literature on CDPs was conducted, followed by the methodology, results and discussion of the research. In the final section, conclusions, policy implications, limitations, and directions for future research are discussed.

2. Literature Review

Three core issues related to cost savings in last-mile logistics are (1) last-mile logistics strategies, (2) site location analysis, and (3) route line optimization.
First, strategy selection solves the problem of the distribution of end-to-end delivery service points in urban logistics [12]. In traditional end-to-end delivery markets, the solution was home delivery—bringing each parcel directly to the recipient’s address [13,14]. In recent years, however, a strategy of delivering parcels to recipients through local service points has become popular [15]. These service points may be either staffed facilities or self-service facilities. For example, the Modular Bento Box System (M-BBX) was proposed as a solution for efficient last-mile deliveries [16]. A study revealed that the use of staffed service points instead of home delivery significantly reduced travel costs and the average delivery time [17]. Since 2018, a mobile parcel locker was developed that can change locations during the day, either autonomously or when moved by a driver [18]. Second, site location analyses focus on finding potential locations for parcel lockers, on determining the number of locations, and on selecting the optimal locations for effective installation [19]. To this end, the spatial interactions between pickup points and end consumers [11,20], site characteristics, and the regional location characteristics of parcel lockers are key problems to overcome [10,21]. The spatial pattern [22,23] and site selection [19,24] of parcel lockers have also been analyzed. However, neither the accessibility [2,25], adoption [26,27], and usability [28,29] of parcel lockers from the end consumer’s perspective nor the potential demand for automated delivery stations from the e-commerce delivery perspective have been addressed [30]. Additionally, the impacts of CDPs on the energy efficiency of goods movement, an individual’s activity–travel patterns, e-shopping usage behavior, and city development have been analyzed [31,32,33,34], as have the consequences of CDP uptake for retailers and shopping centers [20]. Third, route line optimization for realizing low-carbon express delivery [35] has been proposed to address problems related to vehicle routing [36,37], urban street networks [38], urban consolidation schemes [39], and vehicle usability [40,41]. The street network within a given urban area in terms of travel distances, travel times, and topography has been indicated to possibly affect last-mile distribution.
In China, scholars have examined Cainiao Stations and China Post Stations in Xi’an, Dongguan, Wuhan, Shenzhen, Nanjing, and Changsha to investigate the spatial distribution pattern, micro-location selection, and influencing factors of CDPs. The methods applied are kernel density estimation, Moran’s I index, standard deviation ellipse, average nearest neighbor analysis, and statistical analysis, etc. [7,42]. These empirical studies have reported the following main findings: (1) The macro-location of CDPs is usually in communities, schools, townships, businesses, enterprises, and office buildings to share costs and customers with supermarkets, department stores, and individual shops [7,42,43,44,45]; (2) the micro-location layout follows the principle of minimum distance and tends to be the last 300 and 100 m in small-scale spaces. The locations of CDPs sites are as close as possible to the entrances and exits of their service targets [7,42,44,45,46]; (3) the spatial distribution of CDPs is unbalanced, with more in some regions and less in other regions. For example, the spatial distribution of CDPs in Shenzhen and Wuhan shaped multi-core agglomerations, which presented more in the central regions yet less in the periphery regions [42,46], whereas the spatial distribution of CDPs in Changsha showed a northwest–southeast orientation, which presented more in the center and less in the surroundings [7]; contrary to that of Shenzhen, Wuhan, and Changsha, the spatial distribution of CDPs in Dongguan presented multi-core agglomerations centered within its town districts [44]. (4) Factors of regional development levels, urban functions, built environment, and personal characteristics show a Pearson relationship with the spatial distribution of CDPs. For example, the regional development level had positive Pearson correlations with CDPs distribution [7,42,43]. With regard to factors of urban functions, industrial and commercial enterprises, residential land use, and the area of municipal districts were positively correlated with the spatial distribution of Cainiao Stations and China Post Stations in Dongguan and Wuhan [44,46]. For factors of the built environment, the preference for using CDPs decreased as urban density decreased, and people in the city center had the most positive perceptions of using lockers and service points, followed by inhabitants of suburbs and the periphery [47]. A significant positive correlation exists between road density and pickup point distribution [7,42,43]. For factors of personal characteristics, population density, and scale are critical in the distribution of CDPs [3,7,42,43]. Research has found that young people, students, and people with full-time jobs had positive views of using CDPs, whereas older adults and unemployed people were somewhat more reluctant to use CDPs; married couples with children were the main users of CDPs [47].
In general, research on end-to-end delivery service points has focused on ACDPs. Discussions of Cainiao Station and China Post Stations have been centered around spatial distribution characteristics, especially spatial distribution patterns, micro-location selection, and influencing factors. Results have indicated that the spatial characteristics of service points are heterogeneous and correlated with factors such as population density, economic development level, land use type, and road accessibility. However, little attention has been paid to the heterogeneity of the strength and scope of such effects, and few studies have examined UCDPs. Furthermore, traditional computer-based point-of-interest (POI) data from Baidu Map (similar to Google map) is insufficient for satisfying the precision requirements of empirical research.
Thus, this study examined Hive Box to discuss the heterogeneous characteristics of spatial distribution patterns and factors influencing locker points, and the smartphone app-based POI data of Guangzhou City were obtained from the official Hive Box app. The guiding research questions were as follows: Why are there more locker points in some areas of urban space and fewer in others? How do the influencing factors vary geographically? This study is expected to provide scientific recognition of the layout optimization for locker points and to promote enhanced community-based end-to-end delivery services and low-carbon city logistics development.

3. Materials and Methods
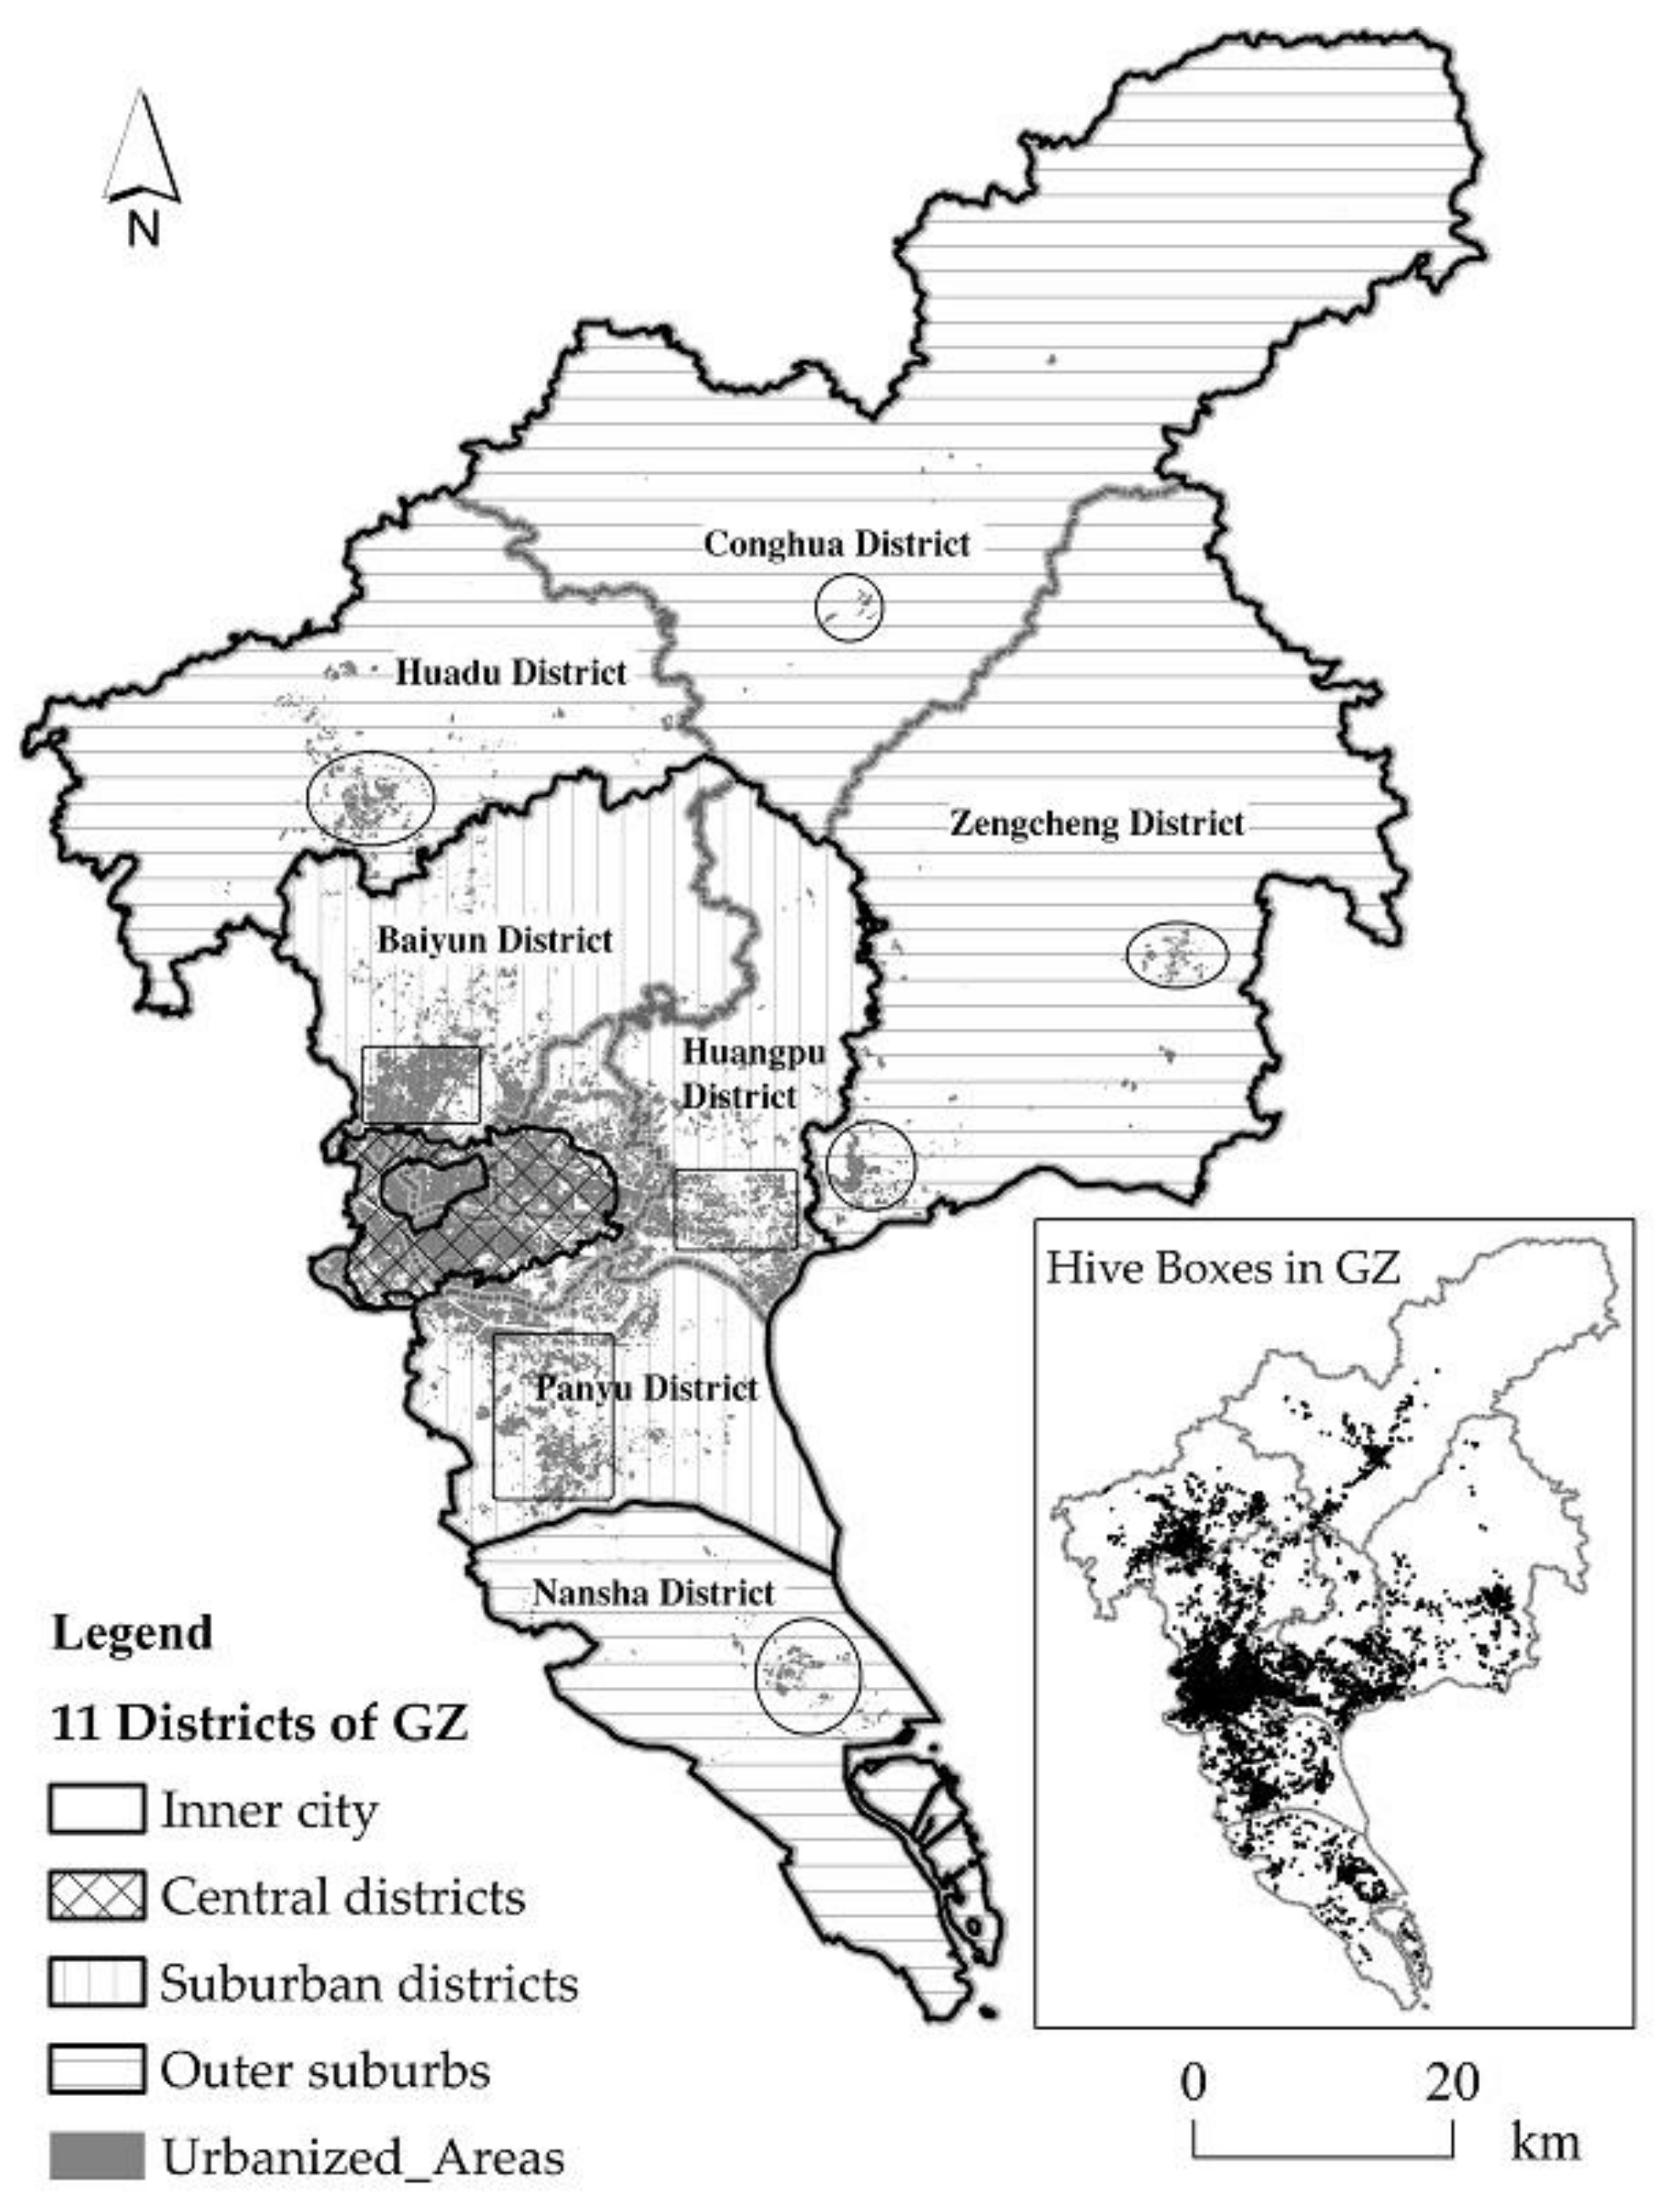
3.1. Study Area

Guangzhou, a super city with a population of more than 10 million in China, is a core city in the Guangdong–Hong Kong–Macao Greater Bay Area. The city has 11 administrative districts, including 4 central districts (i.e., Liwan District, Yuexiu District, Tianhe District, and Haizhu District), 3 suburban districts (i.e., Baiyun District, Huangpu District, and Panyu District; the squares are the centers), and 4 outer suburbs (i.e., Huadu District, Conghua District, Zengcheng District, and Nansha District; the circles are the centers) (Figure 1). These 11 administrative districts consist of 2740 administrative communities, covering approximately 7434.40 km2.
Guangzhou, the capital city of Guangdong Province, is also a metropolis for online shopping and express delivery services. By the end of 2020, the value of online retail sales of physical goods in Guangzhou amounted to more than CNY 0.19 trillion, which accounted for 1.99% of the online retail sales of goods in China. Moreover, both the amount and revenue of the express delivery industry in Guangzhou ranked second, accounting for 9.14% and 7.89%, respectively, of the amount and revenue of this industry nationwide.

3.2. Data Source

The basic data were the geographical locations of Hive Box points and the social characteristics of the 2740 administrative communities.
In previous research, the geospatial data of CDPs were usually obtained from POIs in the Baidu Maps app. Generally, such an incomplete data set with hundreds of POIs cannot satisfy the precision needs of spatial distribution research. Today, with the development of smartphones and apps, more complete and steady measures are employed to obtain huge amounts of location data. In this study, the official Hive Box app developed by Shenzhen Hive Box Technology Co., Ltd. was used to obtain the geospatial data (name, address, longitude, and latitude). The data were obtained through several steps: (1) a batch of control points that completely covered the whole area of Guangzhou were selected, (2) the geographical locations (longitude and latitude) of Hive Box points within a 5 km radius of these control points were searched, and (3) duplicate Hive Box points were deleted. Finally, a total of 11,832 Hive Box points based on the app were obtained and used in this study (Figure 1).
The social characteristics of 2740 administrative communities, including urban development (UD), urban functions (UF), built environment (BE), and personal characteristics (PC), were derived from multiple data sources. Total population (X11), urbanization rate (X12), population aging (X41), number of working people (X42), number of highly educated people (X43), and housing conditions (X44) were derived from the 2010 Population Census of the People’s Republic of China; the POI of living facilities (X21), POI of working facilities (X22), and POI of public facilities (X23) were derived from Baidu Maps through web crawler technology; road density (X31), building density (X32), and building floor (X33) were obtained using OpenStreetMap (OSM) and ArcGIS data on internet (Table 1). Additionally, the results of correlation analysis in the EViews software package showed that there was no collinearity among these 12 variables (Table 2).

3.3. Methodology

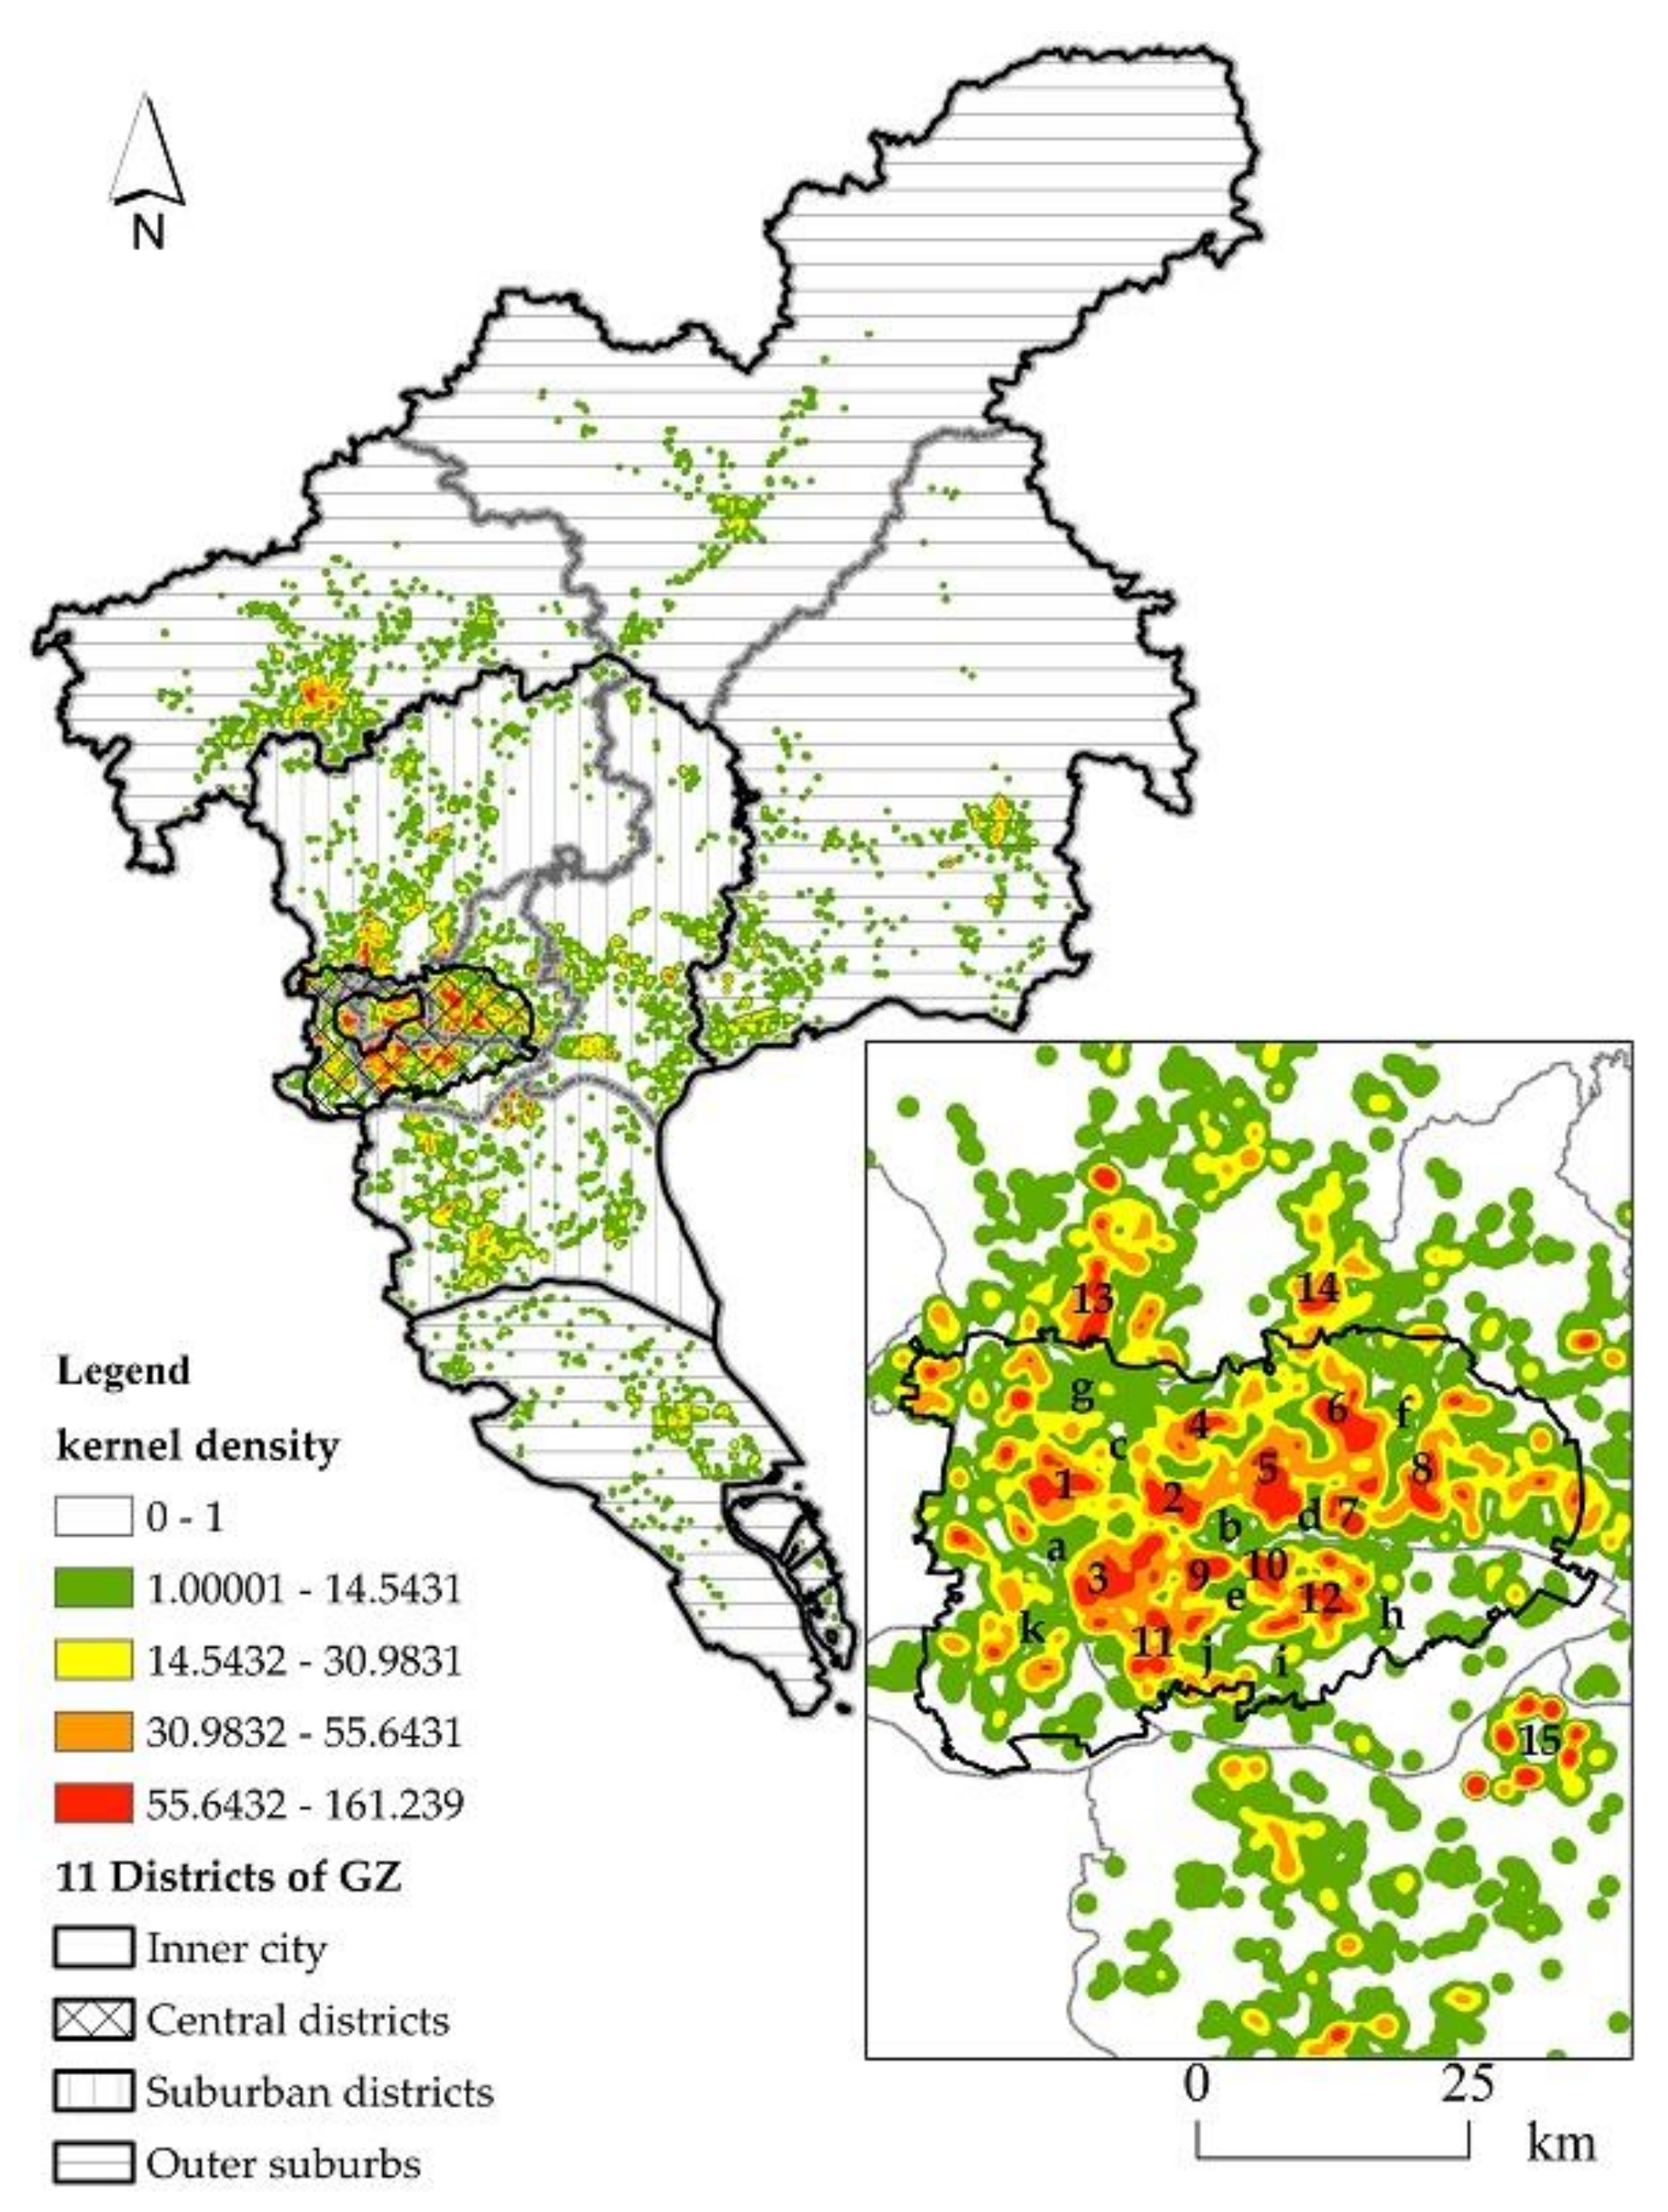
3.3.1. Kernel Density Estimation Method

Kernel density estimation calculates a magnitude-per-unit area from point features using a kernel function to generate a smoothly tapered surface. Density surfaces show where point features are concentrated, which helps detecting hotspots of events happened [48]. In criminal, commercial and traffic activities, it serves as a mean to explore spatial agglomeration characteristics [49,50,51]. In this paper, kernel density is employed to detect the spatial agglomeration characteristics of Hive Box distribution. The higher the kernel density grade, the denser the point distribution, and the lower the scattering, on the contrary. The formula is as follows [52]:
f s = i n k π γ 2 d i s γ ,
where f(s) is the density at position s; r, which equals 500 m, is the search radius of the core density estimate; dis is the distance from i to position s; and k is the weight of dis.

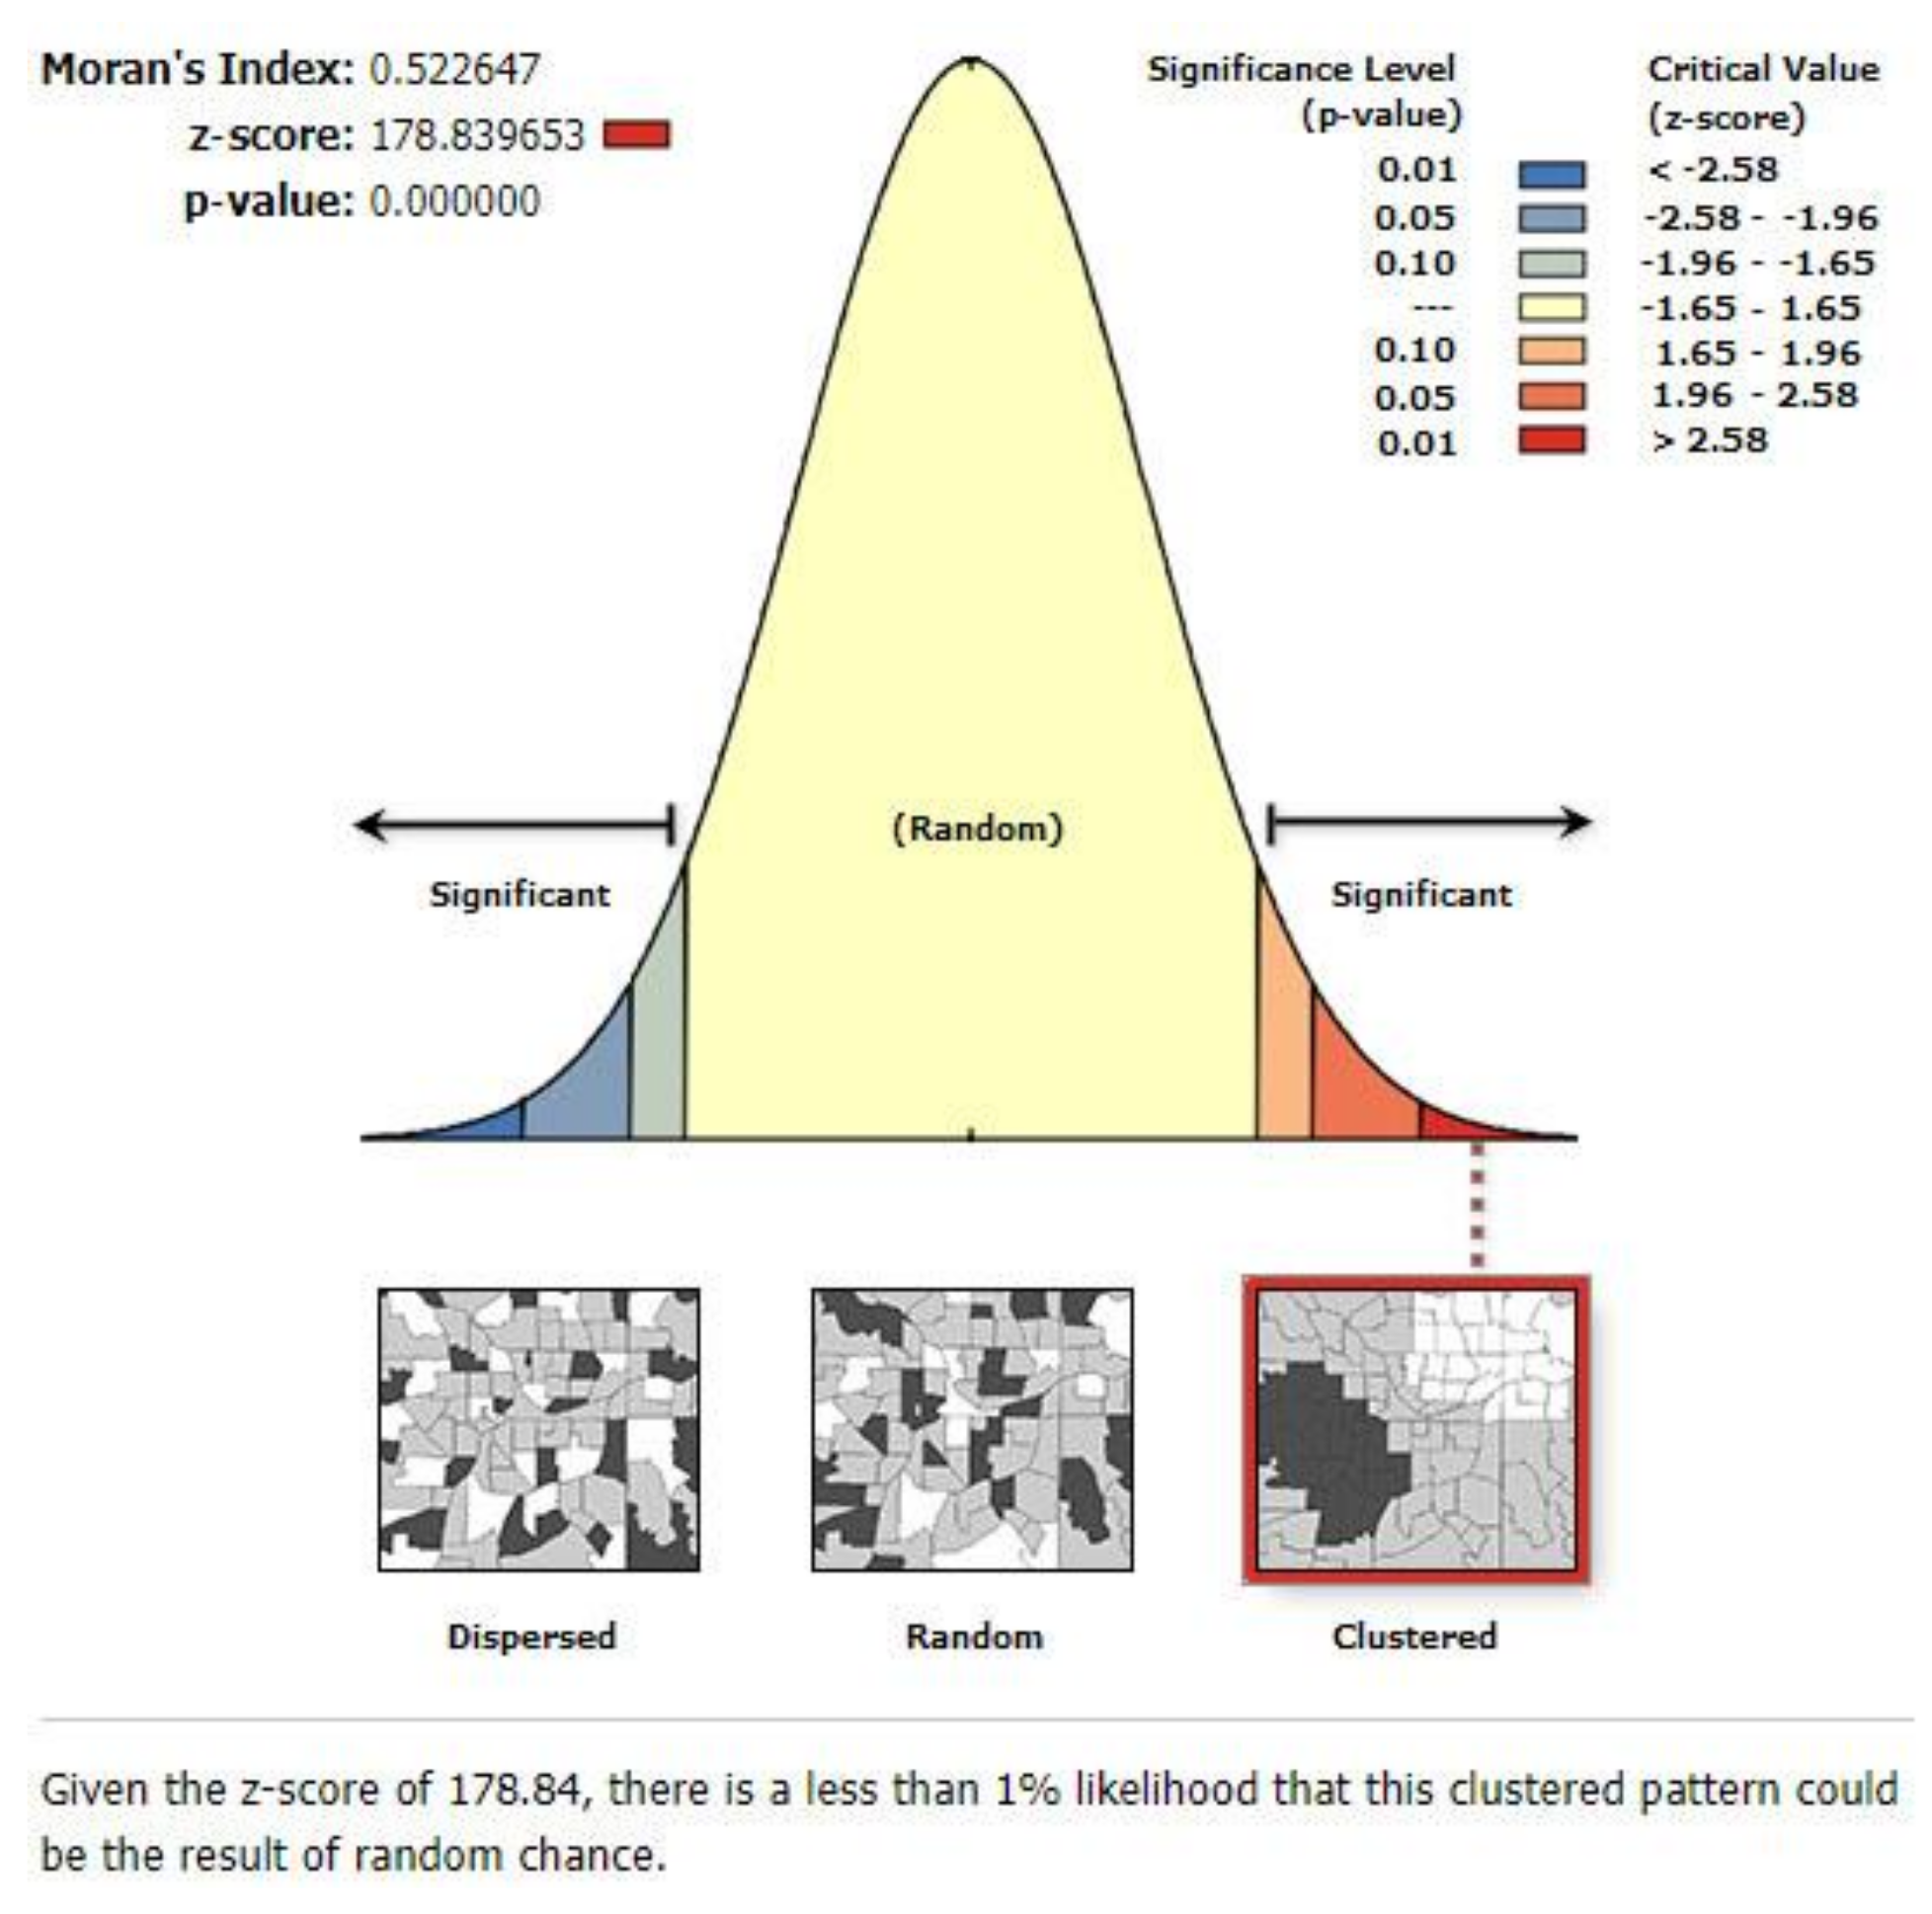
3.3.2. Spatial Autocorrelation Analysis Model

Spatial autocorrelation, which includes global spatial autocorrelation and local spatial autocorrelation, has been widely used to analyze the correlation of the same spatial variable in different spatial positions [53,54,55]. This section provides a brief introduction to Global Moran’s I index and Anselin Local Moran’s I index. In this paper, a square grid of 500 × 500 m was created by the fishnet creating tool in ArcGIS 10.2, and the number of Hive Boxes located in the grids was counted; thus, the global and local spatial autocorrelations of these locations were analyzed.
(1) Global Spatial Autocorrelation: Global spatial autocorrelation measures the extent to which the value of a variable at a certain location relates to the same type of value in neighboring locations [53]. Moran’s I index is the most commonly used technique for detecting spatial patterns, namely, clustered, dispersed, or random, according to the spatial autocorrelation [54,55,56]. To evaluate the spatial distribution patterns of Hive Box in Guangzhou, Moran’s I was used; the formula used is as follows [53]:
I = n i = 1 n j = 1 n W i j x i x ¯ x j x ¯ i = 1 n j = 1 n W i j i = 1 n x i x ¯ 2 ,
where I is the global Moran’s I index. If Moran’s I is significant at the level of 0.05 (0.01), it indicates that there is a significant positive spatial correlation among variables, which indicates that similar eigenvalues in adjacent areas have a cluster trend.
(2) Local Spatial Autocorrelation: Although Moran’s I index is efficient for detecting the global spatial autocorrelation, it does not depict the local spatial cluster and outlier relationships. Local Moran’s I index, also known as cluster and outlier analysis, is a method that analyzes the local spatial autocorrelation by detecting the spatial cluster features of high (hot spots) or low (cold spots) concentrations of spatial data [54,55]. The formula is as follows [57]:
I i = z i z ¯ σ 2 j = 1 , i 1 n w i j z j z ¯
where Ii is the local Moran’s I, which is divided into four types: high–high clusters (HH), high–low outliers (HL), low–low clusters (LL), and low–high outliers (LH). HH (LL) clusters imply that the locations have similarly high or low values compared to their neighbors, that is, high values in a high value neighborhood (HH) or low values in a low value neighborhood (LL); HL (LH) outliers are those values that are obviously different from the values of their surrounding locations, that is, a high value in a low value neighborhood (HL) and a low value in a high value neighborhood (LH).

3.3.3. Geographical Weighted Regression Model (GWR)

The GWR model can fully consider the spatial characteristics of each influencing factor, and it accurately depicts the spatial relationship between independent and dependent variables [58,59,60]. The formula is as follows [61]:
Y i = β 0 μ i , v i + λ n β λ μ i , v i X i λ + ε ,
where Yi denotes the number of Hive Boxes in administrative community i of Guangzhou; β0(ui, vi) is a constant, βλ(ui, vi) represents the regression coefficient, (ui, vi) represents the geographic location of the community i, X represents the parameter value of the λ independent variable of community i, and ε represents the random error. The optimal bandwidth distance was obtained automatically in GWR 4.0 and was subjected to finite correction using the Akaike information criterion (AIC). The smaller the AIC value, the higher the goodness of fit of the model.

4. Results

4.1. Results for Kernel Density Estimation

Figure 2 shows five grades of kernel density estimation, namely, the first grade (0–1), the second grade (1.00001–14.5431), the third grade (14.5432–30.9831), the fourth grade (30.9832–55.6431), and the fifth grade (55.6432–161.239), which could be classified into a larger group (the second to fifth grade) and a smaller one (the first grade).
The results highlighted that kernel density declined from the city center toward the outskirts (Figure 2). In particular, the larger group for the whole city was located in the central districts and core areas of suburban districts. However, the smaller one was distributed across the vast countryside; that is, the density grade of Hive Box distribution in urbanized areas was higher than that in rural areas.
In addition, the results also showed that the kernel density in the areas of Xi Guan, Dongshan, Long Daowei, Xiao Bei, Yang Ji, Lin He, Lie De, Yuan Cun, Su She, Xia Du, Wu Fengxiang, Chi Gang, San Yuanli, Jing Xi, and Xiao Guwei were relatively high, while in the areas of Shamian, Ersha Island, Zhongshan Fifth Road, Zhujiang New Town, Kangle Village, Wushan Nan Road, Zhannan Road, Shiliu Gang Road, Luntou Road, Ruibao Road, and Huawan Road, they were relatively low.

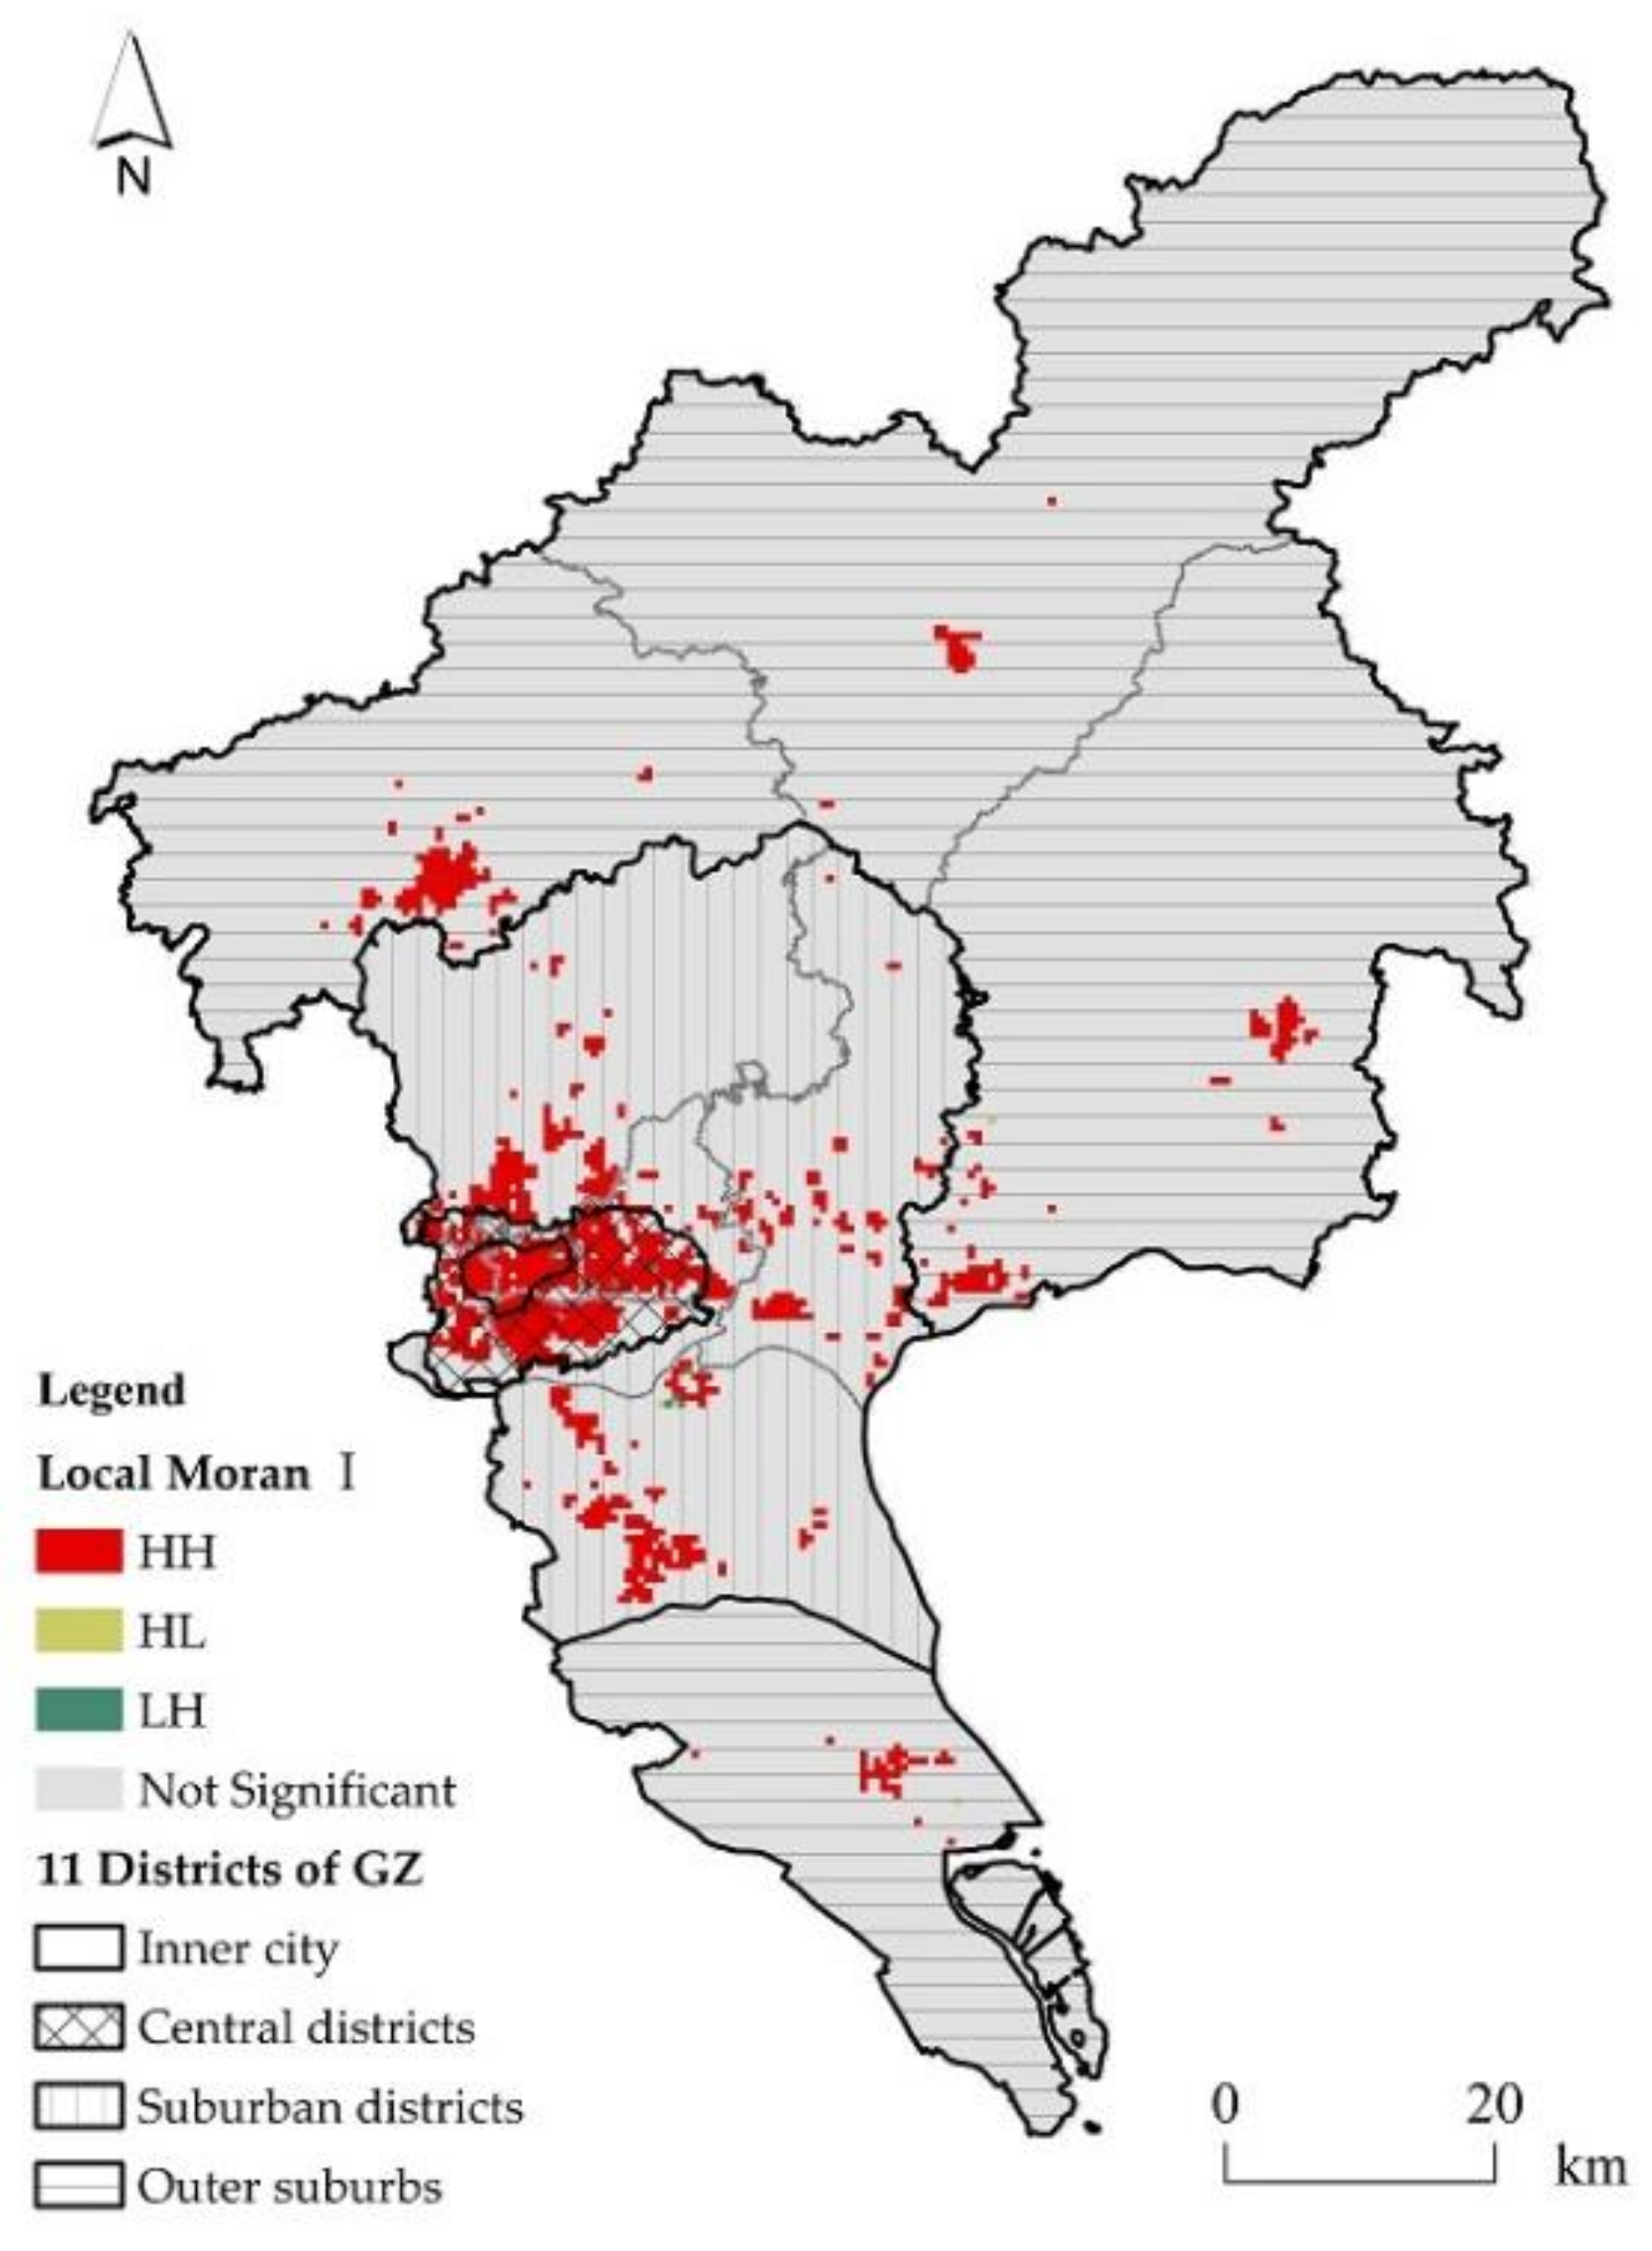
4.2. Results for Global Moran’s I Index and Anselin Local Moran’s I Index

Figure 3 reports the results of Global Moran’s I index. The p-value was less than 0.05, indicating that the Hive Boxes is randomly generated with a probability of only 5%, while the z-score was 178.84, which was larger than 1.96, indicating that the Hive Box distribution showed obvious clustering characteristics. The global Moran’s I index of square grids was 0.52, which was greater than 0, indicating that the spatial distribution pattern of Hive Boxes was positively correlated; that is, high values are clustered in high value neighborhoods, and low values are clustered in low value neighborhoods, showing a significant spatial agglomeration from a global perspective.
Figure 4 presents the results of Local Moran’s I index, which depicts three local spatial agglomeration types, namely, the high–high clusters (HH), high–low outliers (HL), and low–high outliers (LH). On one hand, the dominant high–high clusters occupied the majority of areas in the inner city, central districts, and centers of suburban areas. However, on the other hand, a lack of adequate service of Hive Box in the vast countryside was also detected. Such differences existing in urban–rural space imply the uneven development and spatial distribution of Hive Boxes in Guangzhou.

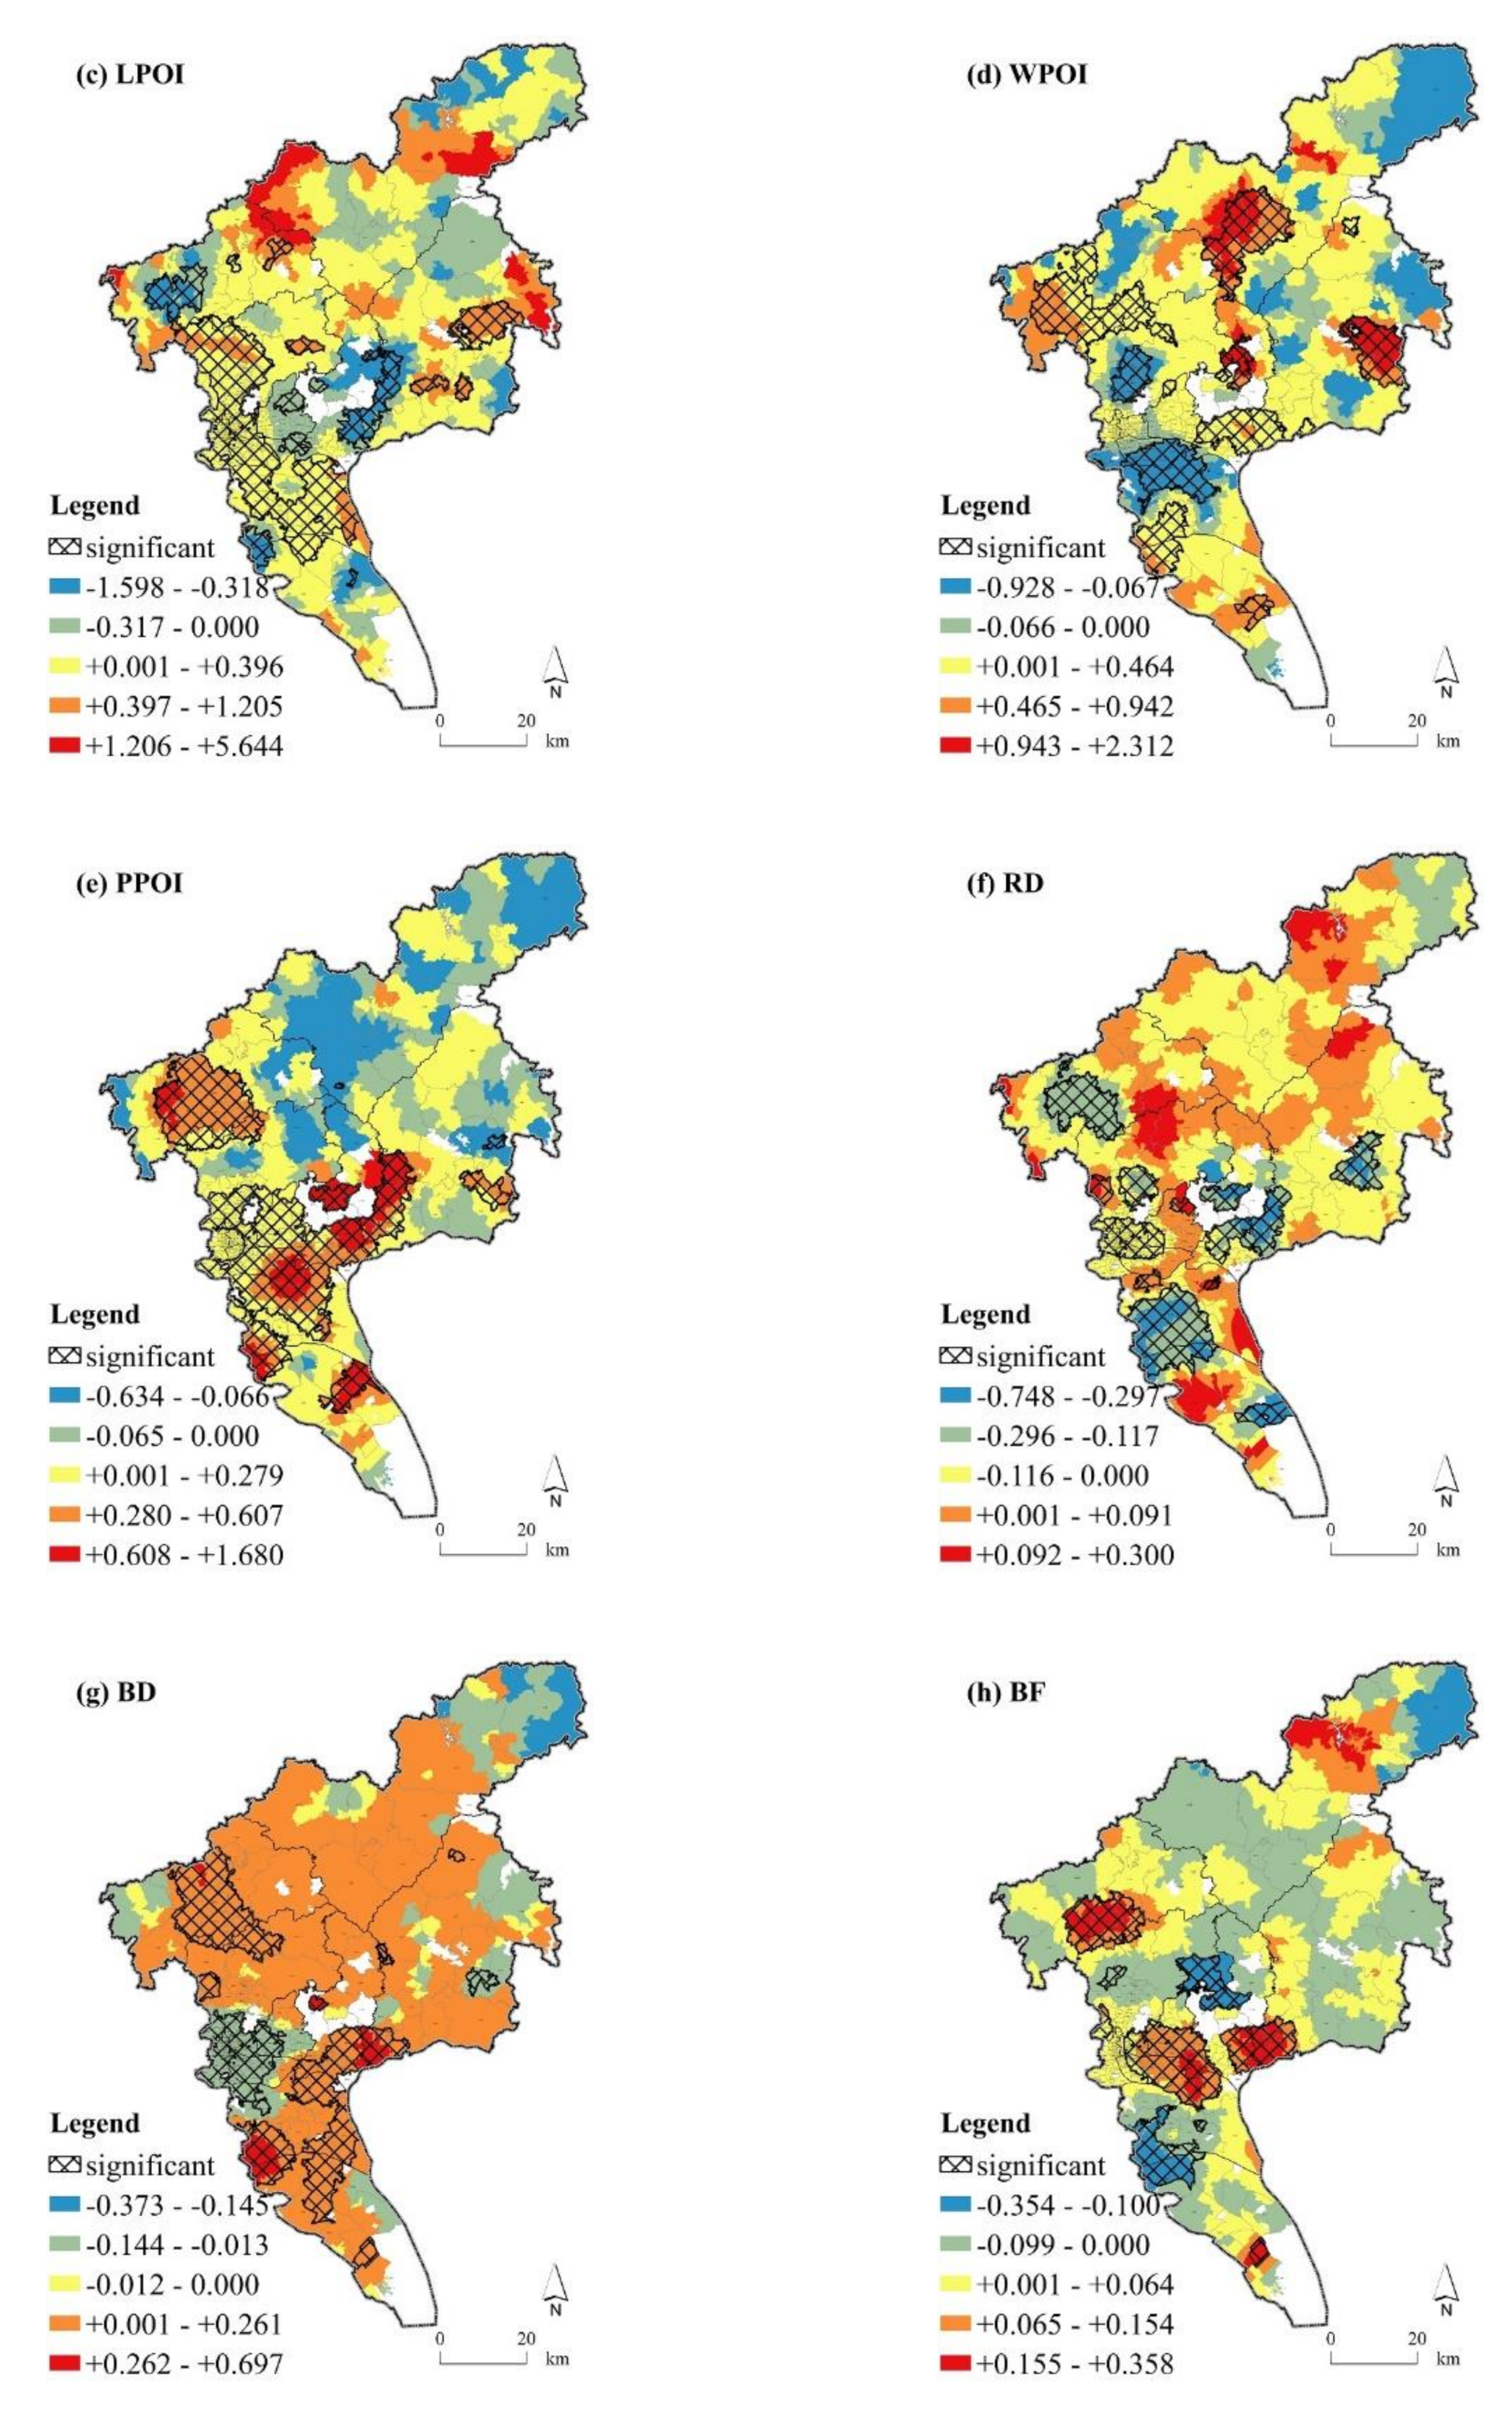
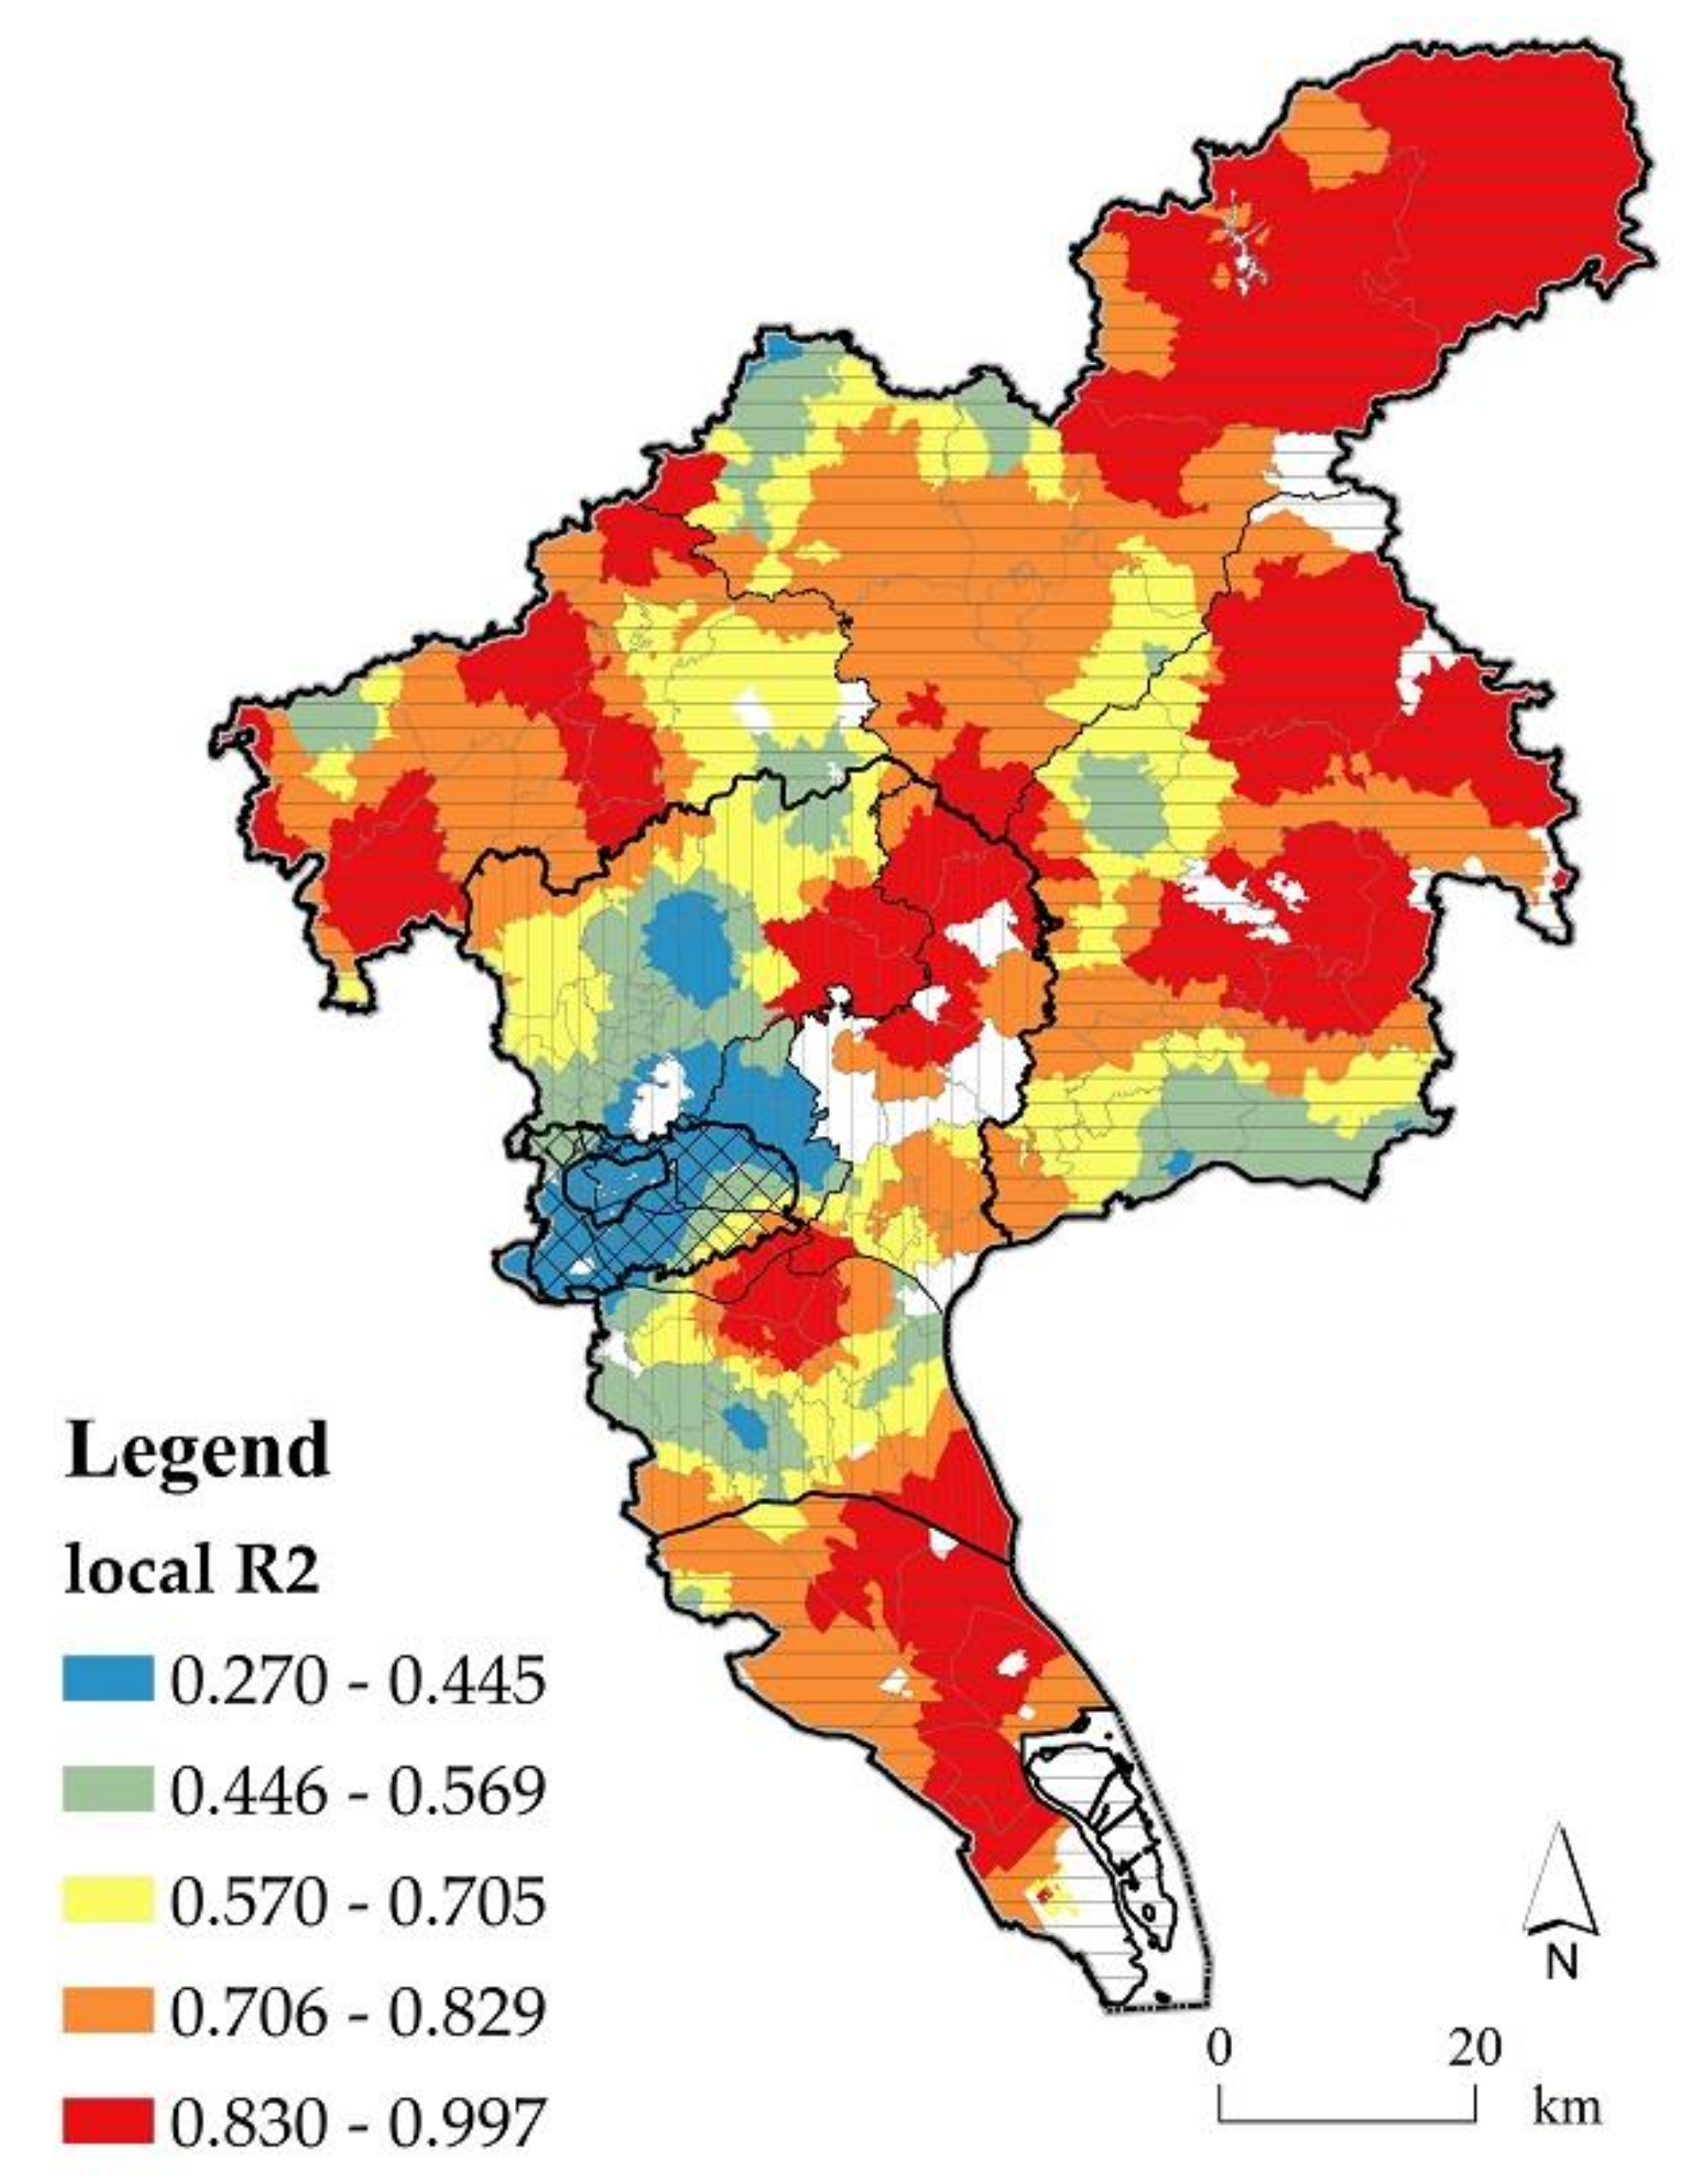
4.3. Results for Influencing Factors of Geographical Weighted Regression Model

4.3.1. Spatial Spillover Effects of Influencing Factors

As the number of Hive Boxes at the Guangzhou community level had spatial autocorrelation effects, the residuals were no longer independent of each other; thus, the influence of the spatial spillover effect could not be ignored.
The GeoDa software package was used to obtain the parameter estimation results of the ordinary least squares (OLS) model, spatial error model (SEM), and spatial lag model (SLM) (Table 3). Higher statistical values of R2 and AIC in the SEM compared with those in the SLM indicated that it was appropriate to use the SEM to explore the key factors affecting the number of Hive Boxes.
According to the SEM results in Table 3, the coefficients of TP (X11), PPOI (X23), and BF (X33) were significant and positive at the 1% threshold level; HC (X44) were significant and positive at the 5% threshold level; and UR (X12) was significant and positive at the 10% threshold level. The coefficients of LPOI (X21), RD (X31), PA (X41), and WP (X42) were significant and negative at the 1% threshold level; BD (X32) was significant and negative at the 5% threshold level; and WPOI (X22) was significant and negative at the 10% threshold level, while the coefficient of HEP (X43) was not significant. Furthermore, a GWR model was employed to explain geographic variations in the degree and scope of the 11 significant factors (X43 was excluded) the space. These factors were inserted into the GWR model according to the criterion of AIC minimization.
The GWR results reveal that the 11 factors explained 99.7% highest of the variance in the number of Hive Boxes (Figure 5). Geographic variations in these factors revealed a difference in the combined statistical influence of these variables on the number of Hive Boxes in Guangzhou, from 0.270 to 0.997. It was found that 58.19% of communities had local R2 values of over 70.5%. The predictive power of the model was low in the center and high in the periphery. The lower R2 values demonstrated a poorer regression fit in the inner city and some parts of the central districts of Guangzhou. A higher R2 indicated a superior regression fit in the outer districts of Guangzhou, such as in the northern, eastern, and southern parts.

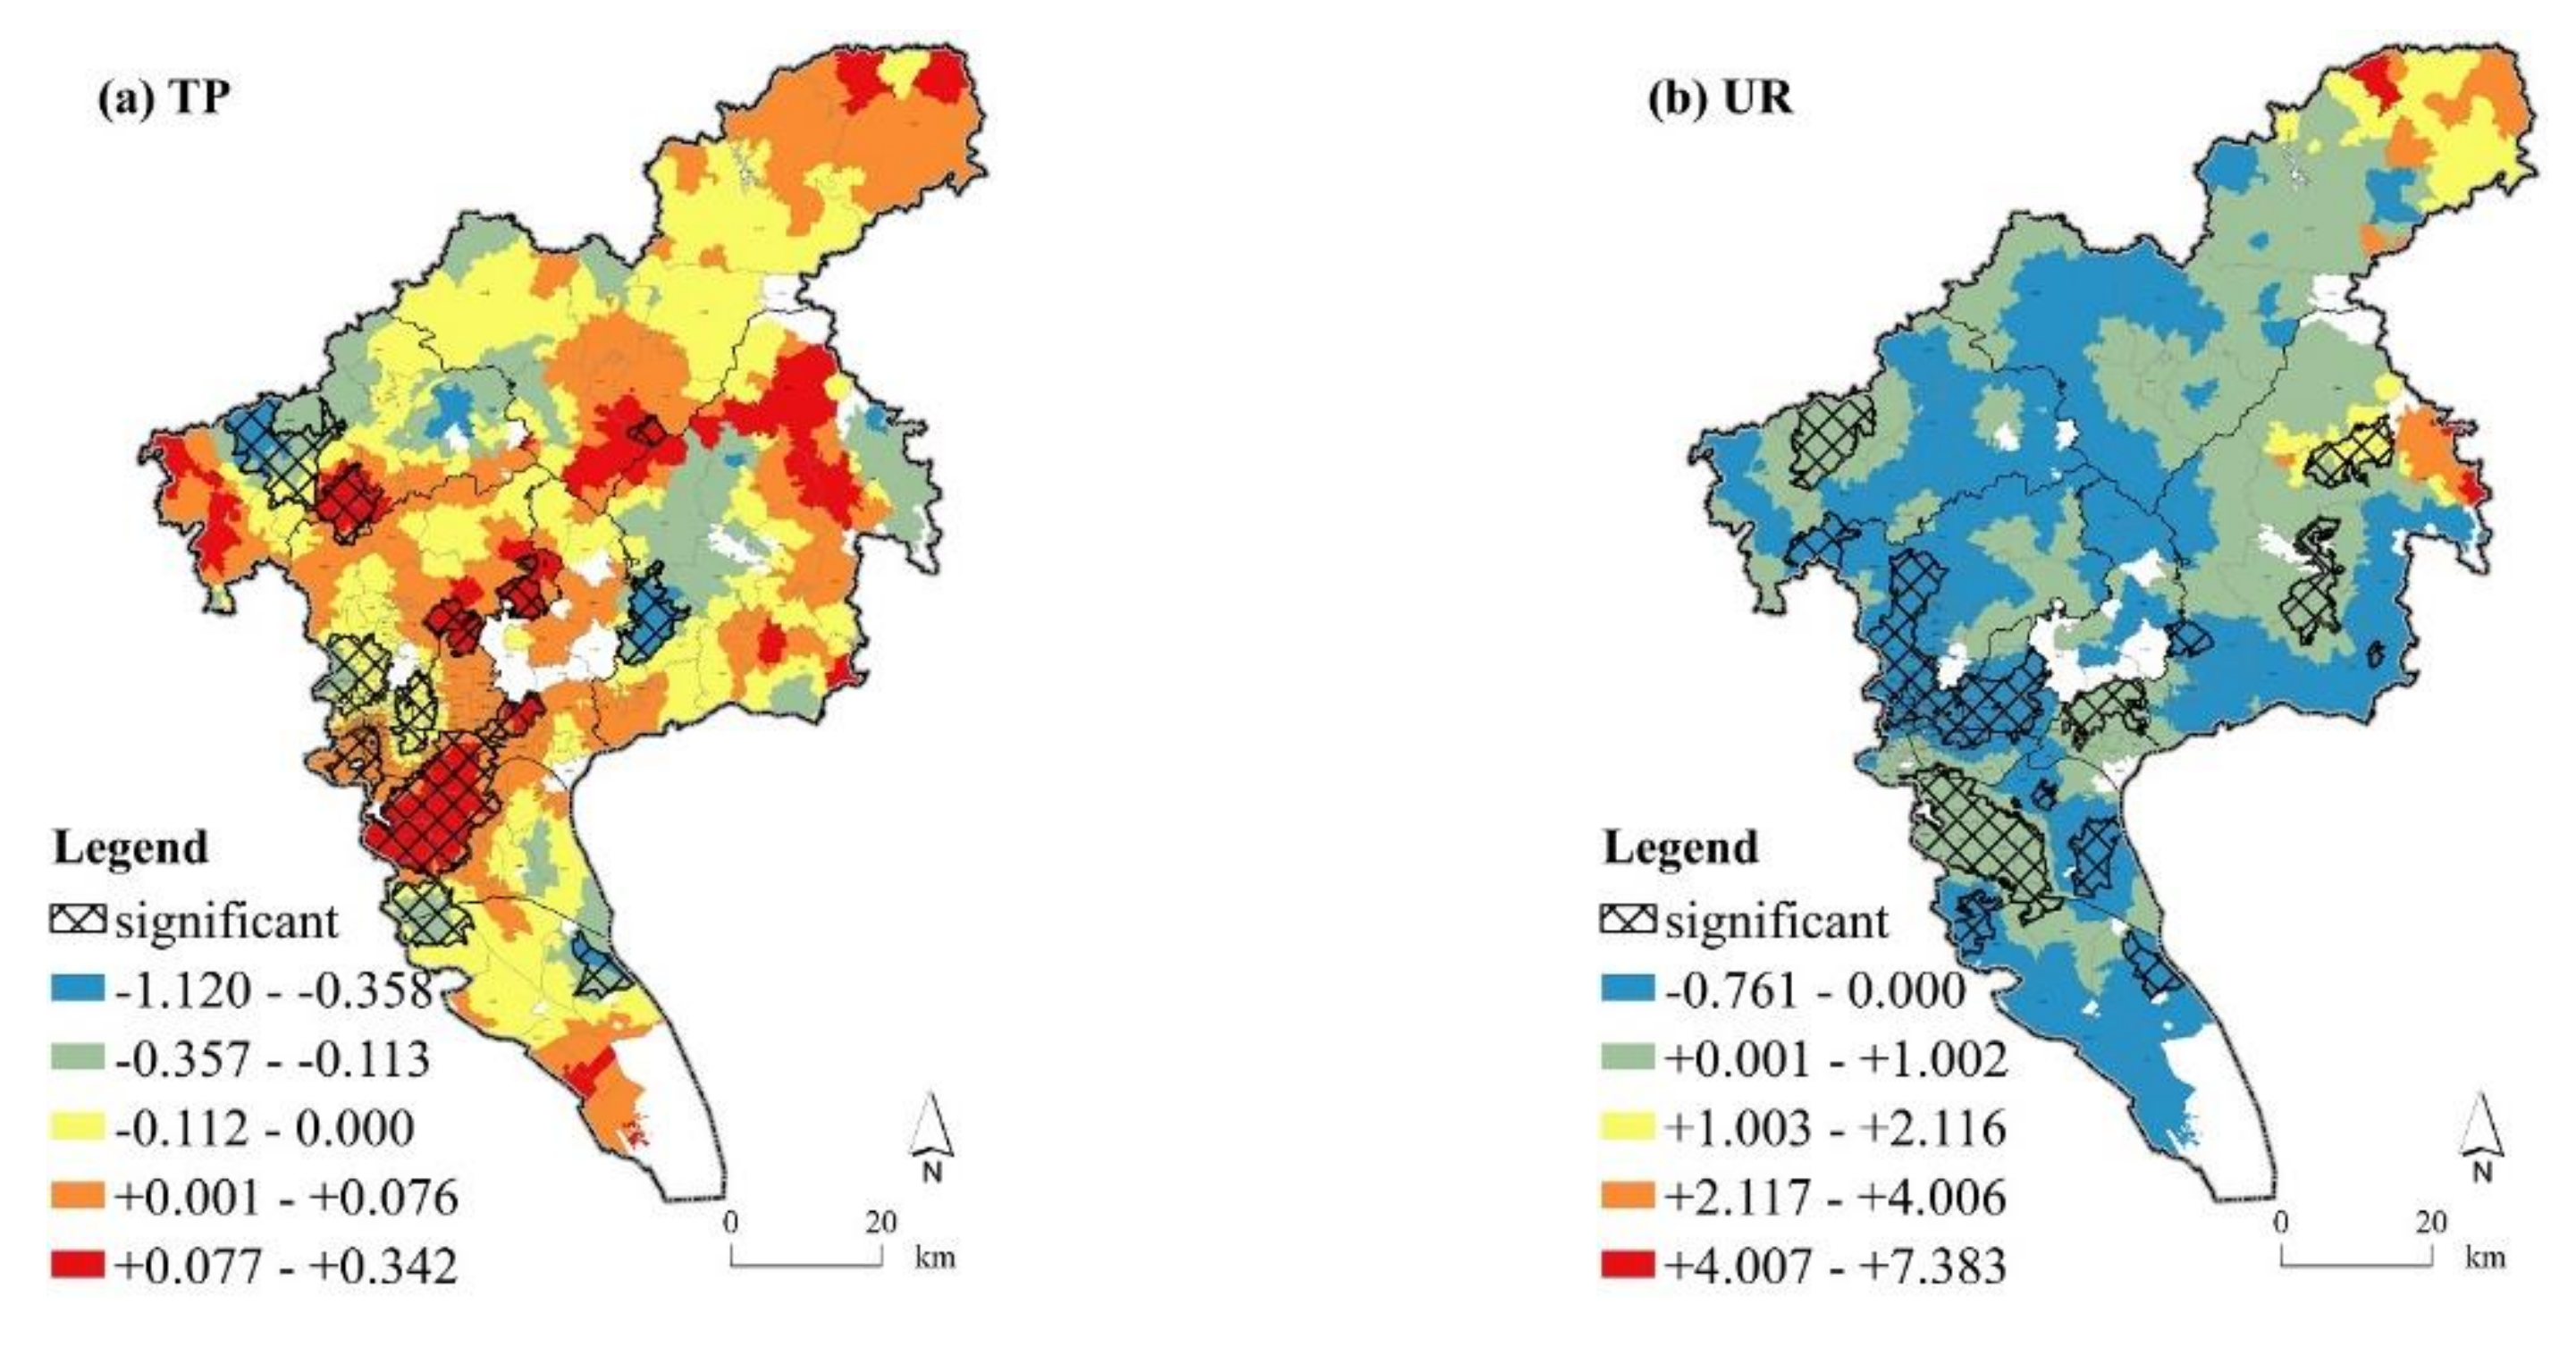
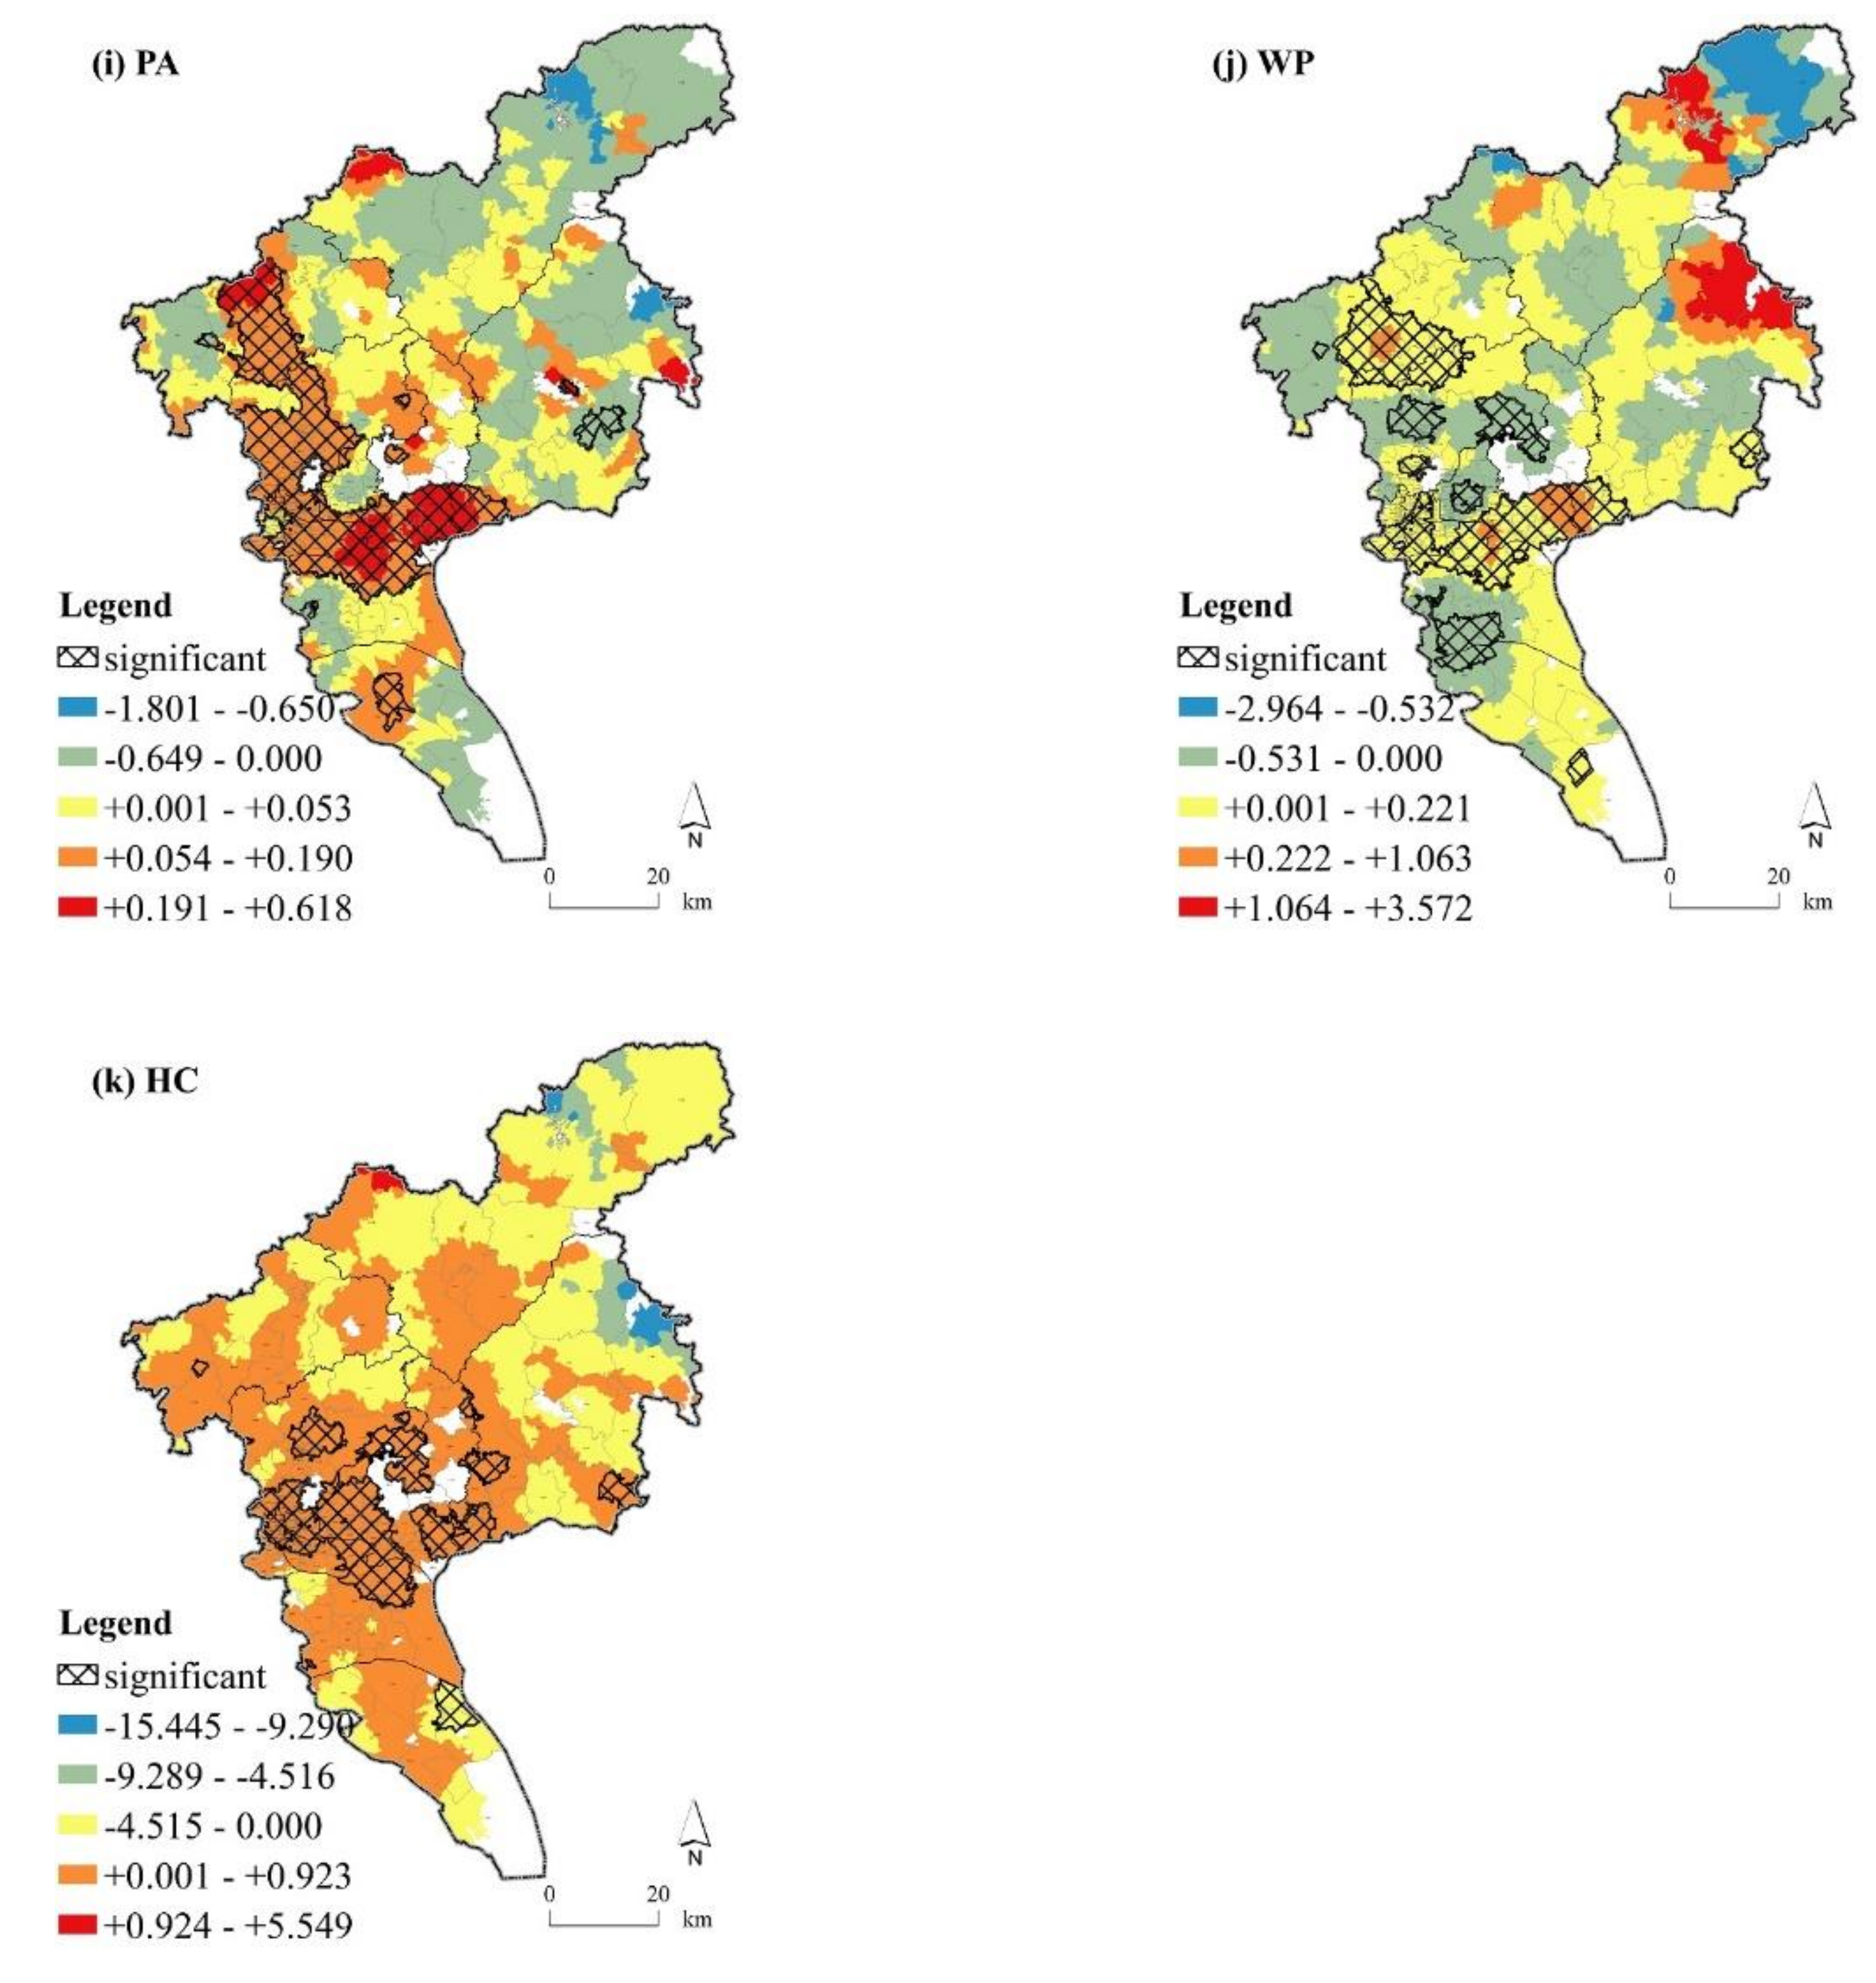
4.3.2. Geographical Variations of Influencing Factors

The spatial distribution of regression coefficient values and the 10% statistically significant level of the t-value were mapped according to the results of GWR modeling (Figure 6). The degree was divided into five classifications based on natural breaks, and the scope of 10% statistically significant level of the t-value was presented with grids. The results were as follows:
The (1) total population (TP) had significant effects (both positive and negative) on 28.23% of the communities in Guangzhou, which significantly increased the number of Hive Boxes in 44.88% of the communities at the edge of Central Guangzhou (such as the Northern Panyu district) that had a larger population, and which had significant negative effects on 55.12% of the communities in the core areas (such as Huangpu district, Panyu district, and Baiyun district) that had a smaller population (Figure 6a). The (2) urbanization rate (UR) had significant effects (both positive and negative) on 33.39% of the communities in Guangzhou, which significantly increased the number of Hive Boxes in 21.78% of the communities at the edge of core regions (such as Panyu district and Huangpu district) that had a lower urbanization rate, and which had significant negative effects on 78.22% of the communities in the core regions (such as Yuexiu district) that had a higher urbanization rate (Figure 6b). The (3) POI of living facilities (LPOI) had significant effects on 49.41% of the communities in Guangzhou, which significantly increased the number of Hive Boxes in 93.04% of the communities located in the inner, central, and suburban regions of the city (such as Yuexiu district, Liwan district, Haizhu district, Panyu district, and Baiyun district), and which had negative effects on 6.96% of the communities in the outer suburban districts (such as Huadu district and Panyu district) (Figure 6c). The (4) POI of working facilities (WPOI) had significant effects (both positive and negative) on 25.29% of the communities in Guangzhou, which significantly increased the number of Hive Boxes in 61.82% of the communities in the suburb and outer areas (such as Huangpu district, Zengcheng district, Huadu district, and Conghua district) that had a lower POI of working facilities, and which had a significant negative effect on 38.18% of the communities in the central districts and outer suburbs (such as Haizhu district, Panyu district, and Baiyun district) that had a higher POI of working facilities (Figure 6d). The (5) POI of public facilities (PPOI) had significant effects on 42.26% of the communities in Guangzhou, which significantly increased the number of Hive Boxes in 99.72% of the communities concentrated in the central, suburban, and outer regions that had a higher POI of public facilities, and which had a significant negative effect on 0.28% of the communities in the outer suburban communities (Figure 6e). The (6) road density (RD) had significant effects on 42.49% of the communities in Guangzhou, which significantly decreased the number of Hive Boxes in 97.42% of the communities in the inner, central, suburban, and outer communities in the city, and which had significant positive effects on 2.58% of the communities (Figure 6f). The (7) building density (BD) had significant effects (both positive and negative) on 50.12% of the communities in Guangzhou, which significantly increased the number of Hive Boxes in 27.30% of the communities in the inner regions (such as Huangpu district, Zengcheng district, Huadu district, and Conghua district) that had higher building density, and which had a significant negative effect on 72.70% of the communities in the suburban and outer regions (such as Huangpu district, Panyu district, Nansha district, and Huadu district) that had lower building density (Figure 6g). The (8) building floor (BF) had significant effects on 31.67% of the communities in Guangzhou, which significantly increased the number of Hive Boxes in 90.12% of the communities in the central areas (such as Yuexiu district, Haizhu district, and Tianhe district) that had higher building floors, and which had a significant negative effect on 9.88% of the communities in suburban districts (such as Huangpu district, Panyu district, and Baiyun district) which had lower building floors (Figure 6h). The (9) population aging (PA) had significant effects on 49.61% of the communities in Guangzhou, which significantly increased the number of Hive Boxes in 98.42% of the communities in most areas of the city, and which had a significant negative effect on 1.58% of the communities in suburban and outer regions of the city (Figure 6i). The (10) number of working people (WP) had significant effects on 33.58% of the communities in Guangzhou, which significantly increased the number of Hive Boxes in 81.02% of the communities in the center of the city (such as Yuexiu district, Liwan district, Haizhu district, Huangpu district, and Huadu district), and which had a significant negative effect on 18.98% of the communities in peripheral areas of the center (such as Tianhe district, Panyu district, and Baiyun district) (Figure 6j). The (11) housing conditions (HC) had significant effects on 39.60% of the communities in Guangzhou, which significantly increased the number of Hive Boxes in 99.21% of the communities in the inner city and central districts (such as Liwan district, Yuexiu district, and Tianhe district) that had dwellings of low square footage, and which had a significant and negative effect on 0.79% of the communities in the city (Figure 6k).

5. Discussion

The results of p-value, z-score, and Global Moran’s I index showed that Hive Box distribution in Guangzhou were not distributed randomly but spatial clustered, and the further analysis of Local Moran’s I index showed that it was the high–high clusters (i.e., high values are clustered in high value neighborhoods) that dominated the spatial agglomeration in the inner city, central districts, and centers of suburban areas. The results depicted high similarity of Hive Box distribution in urban areas.
The results of kernel density also showed that Hive Box distribution in Guangzhou were aggregated in points rather than being evenly distributed in a community-based urban space, which highlighted the uneven development of Hive Boxes in urban areas. Such results may correlate with previous findings, which stated that the spatial distribution of CDPs was unbalanced, and CDPs tended to be located in communities; schools; townships; and businesses, enterprises, and office buildings [7,42,43,44,45].
The regional differences in urban development strategies, urban built environments, individual characteristics of residents, population scales, infrastructures, and social and economic development levels have caused such spatial heterogeneity. Overall, total population, urbanization rate, POI of working facilities, and building density had significant multi-impacts (both positive and negative) on spatial Hive Box distribution; POI of living facilities, POI of public facilities, building floor, population aging, number of working people, and housing conditions had significant positive effects on Hive Box distribution; and road density had significant negative effects on Hive Box distribution.
The positive effects of total population (44.88%) and urbanization rate (21.78%) on Hive Box distribution were mainly observed at the edge areas of Central Guangzhou, and the negative effects of total population (55.12%) and urbanization rate (21.78%) on Hive Box distribution were concentrated in nonspecific Guangzhou. The positive effects of POI working facilities (61.82%) on Hive Box distribution were mainly observed in the suburban and outer areas of Guangzhou, and the negative effects of POI working facilities (38.18%) on Hive Box distribution were mainly observed in the central districts and outer suburbs. The positive effects of building density (27.30%) on Hive Box distribution were found in the inner city of Guangzhou, and the negative effects of building density (72.70%) on Hive Box distribution were found in the suburban and outer districts. The absolutely positive effects of POI of living facilities (93.04%), POI of public facilities (99.72%), and population aging (98.42%) on Hive Box distribution were scattered throughout the whole city; however, the significant positive effects of building floor (90.12%), number of working people (81.02%), and housing conditions (99.21%) on Hive Box distribution were gathered in the center of Guangzhou. Finally, the significant negative effects of road density (97.42%) on Hive Box distribution were scattered throughout the whole city.

6. Conclusions

As an important CDP type in China, Hive Box has increasingly peaked great interest among governments and researchers. Its services represent a crucial alternative solution for solving last-mile logistical problems, especially in current situations.
This paper revealed the spatial characteristics of Hive Box distribution by analyzing the kernel density, Moran’s I index, and GWR methods with the location data of Hive Box. The conclusions indicated that Hive Box distribution exhibited significant spatial agglomeration characteristics and high–high cluster agglomeration type and exhibited spatial heterogeneity rather than homogeneity in urban areas. Multiple factors caused such spatial heterogeneity of Hive Box distribution in Guangzhou, and the effects of influencing factors presented local geographic variations across regions.
The findings enlightened us about the agglomeration and heterogeneity of the spatial distribution and influencing factors when CDPs were applied elsewhere for end-to-end delivery services. It had profound meanings for 3PLs, e-commerce companies, and governments. Nowadays, with the prevalence of e-shopping, customers preferred to select nearby CDPs, which boosted 3PLs and e-commerce companies to engage themselves in the fierce market competition for end-to-end delivery services by establishing different CDPs, while governments committed themselves to providing plans to boost the development of such facilities as well. For local governments, 3PLs and e-commerce companies, it was important to realize where and how geographic variations took place for CDPs. Thus, the findings offered one explication.
To improve the final distribution of unattended locker points (such as Hive Boxes) for an enhanced community-based end-to-end delivery service, low-carbon city logistics, and sustainable e-commerce development in Guangzhou, this study provides the following insights and suggestions:
(1) The infrastructure of unattended locker points should be intensified to improve end-to-end delivery services. The point-like kernel density distribution showed that Hive Boxes exhibited spatial heterogeneity rather than homogeneity in urban areas, which indicated insufficient end-to-end delivery service points in some areas where home delivery failures occur. This reduces consumers’ adoption as well as their usability of self-collection services, end-to-end delivery solutions (the last 100 m), and even unsustainable e-commerce development.
(2) The combined effects of multiple factors should be acknowledged rather than the unidirectional effects of a single factor. The analysis revealed that the Hive Box distribution in Guangzhou was affected by the combined effects of multidimension factors but not by the unidirectional effects of a certain factor. This indicated that, under the combined effects of multiple factors, the original unidirectional effects of a factor varied across regions.
(3) The heterogeneous characteristics of the influencing factors should be identified. The analysis revealed that the effect of the strength, direction, and scope of the factors influencing Hive Box distribution were heterogeneous rather than homogeneous across regions. This result clarified that end-to-end delivery points should be distributed in consideration of regional variations as influencing factors.
One limitation of this study was the difficulty to obtain the most recent data from the 2740 administrative community units of Guangzhou City. Another limitation was the difficulty of allocating equilateral square grids and the corresponding data of the study units for GWR. However, our empirical results were beneficial for understanding the heterogeneous characteristics of the spatial distribution and influencing factors for unattended locker points. Future studies should focus on the characteristics of heterogeneity, accessibility, and usability, and the adoption of locker points (CDPs), according to different types of sub-dwellings.

Author Contributions

Conceptualization, Chunshan Zhou and Song Liu; methodology, Ying Liu; software, Rongrong Zhang and Yongwang Cao; validation, Ying Liu; formal analysis, Rongrong Zhang; investigation, Yongwang Cao; resources, Ming Li; data curation, Song Liu; writing—original draft preparation, Song Liu; writing—review and editing, Chunshan Zhou; visualization, Bahram Zikirya; supervision, Chunshan Zhou; project administration, Chunshan Zhou; funding acquisition, Chunshan Zhou. All authors have read and agreed to the published version of the manuscript.

Funding

This research was funded by the National Social Science Foundation of China, grant number 17BRK010.

Data Availability Statement

Publicly available datasets were analyzed in this study. These data can be found at https://www.fcbox.com/en/pc/index.html#/ (accessed on 11 June 2021).

Conflicts of Interest

The authors declare no conflict of interest.

References

  1. Xiao, Z.; Wang, J.J.; Lenzer, J.; Sun, Y. Understanding the diversity of final delivery solutions for online retailing: A case of Shenzhen, China. Transp. Res. Procedia 2017, 25, 985–998. [Google Scholar] [CrossRef]
  2. Kedia, A.; Kusumastuti, D.; Nicholson, A. Acceptability of collection and delivery points from consumers’ perspective: A qualitative case study of Christchurch city. Case Stud. Transp. Policy 2017, 5, 587–595. [Google Scholar] [CrossRef]
  3. Morganti, E.; Dablanc, L.; Fortin, F. Final deliveries for online shopping: The deployment of pickup point networks in urban and suburban areas. Res. Transp. Bus. Manag. 2014, 11, 23–31. [Google Scholar] [CrossRef] [Green Version]
  4. Intelligent Service Solutions by HIVE BOX. Available online: https://www.fcbox.com/en/pc/index.html#/ (accessed on 11 June 2021).
  5. General Office of the State Council, PRC. 2018. Available online: http://www.gov.cn/zhengce/content/2018-01/23/content_5259695.htm (accessed on 12 May 2021).
  6. State Post Bureau, PRC. 2017. Available online: http://www.spb.gov.cn/zc/ghjbz_1/201702/t20170213_991162.html (accessed on 7 March 2021).
  7. Xue, S.; Li, G.; Yang, L.; Liu, L.; Nie, Q.; Muhammad, S.M. Spatial pattern and influencing factor analysis of attended collection and delivery points in Changsha city, China. Chin. Geogr. Sci. 2019, 29, 1078–1094. [Google Scholar] [CrossRef] [Green Version]
  8. Baidi, M.M.; Manerba, D.; Perboli, G.; Tadei, R. A generalized bin packing problem for parcel delivery in last-mile logistics. Eur. J. Oper. Res. 2019, 274, 990–999. [Google Scholar] [CrossRef]
  9. Florio, A.M.; Feillet, D.; Hartl, R.F. The delivery problem: Optimizing hit rates in e-commerce deliveries. Transp. Res. Part B Methodol. 2018, 117, 455–472. [Google Scholar] [CrossRef]
  10. Andriankaja, D. The Location of Parcel Service Terminals: Links with the Locations of Clients. Procedia Soc. Behav. Sci. 2012, 39, 677–686. [Google Scholar] [CrossRef] [Green Version]
  11. Cardenas, I.D.; Beckers, J. A location analysis of pick-up points networks in antwerp, Belgium. Int. J. Transp. Econ. 2018, 45, 557–569. [Google Scholar] [CrossRef]
  12. Leonardi, J.; Browne, M.; Allen, J.; Bohne, S.; Ruesch, M. Best Practice Factory for Freight Transport in Europe: Demonstrating how ‘Good’ Urban Freight Cases are Improving Business Profit and Public Sectors Benefits. Procedia Soc. Behav. Sci. 2014, 125, 84–98. [Google Scholar] [CrossRef] [Green Version]
  13. Manerba, D.; Mansini, R.; Zanotti, R. Attended home delivery: Reducing last-mile environmental impact by changing customer habits. IFAC PapersOnLine 2018, 51, 55–60. [Google Scholar] [CrossRef]
  14. Ghajargar, M.; Zenezini, G.; Montanaro, T. Home delivery services: Innovations and emerging needs. IFAC PapersOnLine 2016, 49, 1371–1376. [Google Scholar] [CrossRef] [Green Version]
  15. Orenstein, I.; Raviv, T.; Sadan, E. Flexible parcel delivery to automated parcel lockers: Models, solution methods and analysis. EURO J. Transp. Logist. 2019, 8, 683–711. [Google Scholar] [CrossRef]
  16. Dell’Amico, M.; Hadjidimitriou, S. Innovative Logistics Model and Containers Solution for Efficient Last Mile Delivery. Procedia Soc. Behav. Sci. 2012, 48, 1505–1514. [Google Scholar] [CrossRef] [Green Version]
  17. Song, L.; Cherrett, T.; McLeod, F.; Guan, W. Addressing the last mile problem: Transport impacts of collection and delivery points. Transp. Res. Rec. 2009, 2097, 9–18. [Google Scholar] [CrossRef] [Green Version]
  18. Schwerdfeger, S.; Boysen, N. Optimizing the changing locations of mobile parcel lockers in last-mile distribution. Eur. J. Oper. Res. 2020, 285, 1077–1094. [Google Scholar] [CrossRef]
  19. Lee, H.; Chen, M.; Pham, H.T.; Choo, S. Development of a decision making system for installing unmanned parcel lockers: Focusing on residential complexes in Korea. KSCE J. Civ. Eng. 2019, 23, 2713–2722. [Google Scholar] [CrossRef]
  20. Lachapelle, U.; Burke, M.; Brotherton, A.; Leung, A. Parcel locker systems in a car dominant city: Location, characterization and potential impacts on city planning and consumer travel access. J. Transp. Geogr. 2018, 71, 1–14. [Google Scholar] [CrossRef]
  21. Rolko, K.; Friedrich, H. Locations of Logistics Service Providers in Germany—The basis for a new freight transport generation model. Transp. Res. Procedia 2017, 25, 1061–1074. [Google Scholar] [CrossRef]
  22. Heitz, A.; Dablanc, L. Logistics spatial patterns in Paris: Rise of Paris Basin as logistics megaregion. Transp. Res. Rec. 2015, 2477, 76–84. [Google Scholar] [CrossRef]
  23. Heitz, A.; Beziat, A. The Parcel Industry in the Spatial Organization of Logistics Activities in the Paris Region: Inherited Spatial Patterns and Innovations in Urban Logistics Systems. Transp. Res. Procedia 2016, 12, 812–824. [Google Scholar] [CrossRef] [Green Version]
  24. Zheng, Z.; Morimoto, T.; Murayama, Y. Optimal location analysis of delivery parcel-pickup points using AHP and network huff model: A case study of shiweitang sub-district in Guangzhou city, China. ISPRS Int. Geo Inf. 2020, 9, 193. [Google Scholar] [CrossRef] [Green Version]
  25. de Oliveira, L.K.; de Oliveira, R.L.M.; de Sousa, L.T.M.; Caliari, I.D.P.; Nascimento, C.D.O.L. Analysis of accessibility from collection and delivery points: Towards the sustainability of the e-commerce delivery. Urbe. Rev. Bras. Gest. Urbana 2019, 11, 20190048. [Google Scholar] [CrossRef] [Green Version]
  26. Zhou, M.; Zhao, L.; Kong, N.; Campy, K.S.; Xu, G.; Zhu, G.; Cao, X.; Wang, S. Understanding consumers’ behavior to adopt self-service parcel services for last-mile delivery. J. Retail. Consum. Serv. 2020, 52, 101911. [Google Scholar] [CrossRef]
  27. Wang, X.; Yuen, K.F.; Wong, Y.D.; Teo, C.C. An innovation diffusion perspective of e-consumers’ initial adoption of self-collection service via automated parcel station. Int. J. Logist. Manag. 2018, 29, 237–260. [Google Scholar] [CrossRef]
  28. Yuen, K.F.; Wang, X.; Ng, L.T.W.; Wong, Y.D. An investigation of customers’ intention to use self-collection services for last-mile delivery. Transp. Policy 2018, 66, 1–8. [Google Scholar] [CrossRef]
  29. Rai, H.B.; Cetinkaya, A.; Verlinde, S.; Macharis, C. How are consumers using collection points? Evidence from Brussels. Transp. Res. Procedia 2020, 46, 53–60. [Google Scholar] [CrossRef]
  30. de Oliveira, L.K.; Morganti, E.; Dablanc, L.; Oliveira, R. Analysis of the potential demand of automated delivery stations for e-commerce deliveries in Belo Horizonte, Brazil. Res. Transp. Econ. 2017, 65, 34–43. [Google Scholar] [CrossRef] [Green Version]
  31. Liu, C.; Wang, Q.; Susilo, Y.O. Assessing the impacts of collection-delivery points to individual’s activity-travel patterns: A greener last mile alternative? Transp. Res. Part E Logist. Transp. Rev. 2019, 121, 84–99. [Google Scholar] [CrossRef]
  32. Viu-Roig, M.; Alvarez-Palau, E.J. The impact of E-Commerce-related last-mile logistics on cities: A systematic literature review. Sustainability 2020, 12, 6492. [Google Scholar] [CrossRef]
  33. Xiao, Z.; Wang, J.J.; Liu, Q. The impacts of final delivery solutions on e-shopping usage behaviour: The case of Shenzhen, China. Int. J. Retail Distrib. Manag. 2018, 46, 2–20. [Google Scholar] [CrossRef]
  34. Dablanc, L.; Rakotonarivo, D. The impacts of logistics sprawl: How does the location of parcel transport terminals affect the energy efficiency of goods’ movements in Paris and what can we do about it? Procedia Soc. Behav. Sci. 2010, 2, 6087–6096. [Google Scholar] [CrossRef] [Green Version]
  35. Kang, P.; Song, G.; Xu, M.; Miller, T.R.; Wang, H.; Zhang, H.; Liu, G.; Zhou, Y.; Ren, J.; Zhong, R.; et al. Low-carbon pathways for the booming express delivery sector in China. Nat. Commun. 2021, 12, 450. [Google Scholar] [CrossRef] [PubMed]
  36. Alfredo, T.M.F.; Galvão, R.D. A tabu search algorithm for the vehicle routing problem with simultaneous pick-up and delivery service. Comput. Oper. Res. 2006, 33, 595–619. [Google Scholar] [CrossRef]
  37. Mahmoudi, M.; Zhou, X. Finding optimal solutions for vehicle routing problem with pickup and delivery services with time windows: A dynamic programming approach based on state–space–time network representations. Transp. Res. Part B Methodol. 2016, 89, 19–42. [Google Scholar] [CrossRef] [Green Version]
  38. Amaral, J.C.; Cunha, C.B. An exploratory evaluation of urban street networks for last mile distribution. Cities 2020, 107, 102916. [Google Scholar] [CrossRef]
  39. Simoni, M.D.; Bujanovic, P.; Boyles, S.D.; Kutanoglu, E. Urban consolidation solutions for parcel delivery considering location, fleet and route choice. Case Stud. Transp. Policy 2018, 6, 112–124. [Google Scholar] [CrossRef]
  40. Ehrler, V.C.; Schöder, D.; Seidel, S. Challenges and perspectives for the use of electric vehicles for last mile logistics of grocery e-commerce—Findings from case studies in Germany. Res. Transp. Econ. 2019, 100757. [Google Scholar] [CrossRef]
  41. Allen, J.; Piecyk, M.; Piotrowska, M.; McLeod, F.; Cherrett, T.; Ghali, K.; Nguyen, T.; Bektas, T.; Bates, O.; Friday, A.; et al. Understanding the impact of e-commerce on last-mile light goods vehicle activity in urban areas: The case of London. Transport. Res. Part D Transport. Environ. 2018, 61, 325–338. [Google Scholar] [CrossRef] [Green Version]
  42. Liu, L.; Li, G.; Yang, L.; Xue, S. Spatial distribution characteristics and influencing factors of the delivery sites in Shenzhen. J. Geo Inf. Sci. 2019, 21, 1240–1253. (In Chinese) [Google Scholar] [CrossRef]
  43. Mehmood, M.; Li, G.; Xue, S.; Nie, Q.; Ma, X.; Zafar, Z.; Rayit, A. Spatial differentiation and influencing factors of attended collection and delivery points in Nanjing city, China. IJCI 2020, 3, 24–40. [Google Scholar] [CrossRef]
  44. Zhou, J.; Li, G.; Yang, L.; Liu, Q.; Muhammad, S.M. Relationship between spatial distribution of Cainiao station and urban development—A case study of Dongguan city. J. Hum. Settl. West China 2019, 34, 83–91. (In Chinese) [Google Scholar] [CrossRef]
  45. Li, G.; Yang, L.; He, J.; Liu, Q.; Chen, X.; Xue, S. The spatial pattern and organization relation of the pickup points based on POI data in Xi’an: Focus on Cainiao stations. Sci. Geogr. Sin. 2018, 38, 2024–2030. (In Chinese) [Google Scholar] [CrossRef]
  46. Li, G.; Chen, W.; Yang, L.; Liu, Q.; Chen, X. Spatial pattern and agglomeration mode of parcel collection and delivery points in Wuhan City. Prog. Geogr. 2019, 38, 407–416. (In Chinese) [Google Scholar] [CrossRef]
  47. Weltevreden, J.W.J. B2c e-commerce logistics: The rise of collection-and-delivery points in the Netherlands. Int. J. Retail Distrib. Manag. 2008, 36, 638–660. [Google Scholar] [CrossRef]
  48. Wu, C.; Ye, X.Y.; Ren, F.; Du, Q.Y. Check-in behaviour and spatio-temporal vibrancy: An exploratory analysis in Shenzhen, China. Cities 2018, 77, 104–116. [Google Scholar] [CrossRef]
  49. Liu, L.; Zhang, C.X.; Feng, J.X.; Xiao, L.Z.; He, Z.; Zhou, S.L. The spatial-temporal distribution and influencing factors of fraud crime in ZG city, China. Acta Geogr. Sin. 2017, 72, 315–328. (In Chinese) [Google Scholar] [CrossRef]
  50. Chen, W.S.; Liu, L.; Liang, Y.T. Retail center recognition and spatial aggregating feature analysis of retail formats in Guangzhou based on POI data. Geogr. Res. 2016, 35, 703–716. (In Chinese) [Google Scholar] [CrossRef]
  51. Jia, R.; Khadka, A.; Kim, I. Traffic crash analysis with point-of-interest spatial clustering. Accid. Anal. Prev. 2018, 121, 223–230. [Google Scholar] [CrossRef] [PubMed]
  52. Yu, W.; Ai, T. The visualization and analysis of POI features under network space supported by kernel density estimation. Acta Geod. Cartogr. Sin. 2015, 44, 82–90. (In Chinese) [Google Scholar] [CrossRef]
  53. Wang, S.; Liu, H.; Pu, H.; Yang, H. Spatial disparity and hierarchical cluster analysis of final energy consumption in China. Energy 2020, 197, 117195. [Google Scholar] [CrossRef]
  54. Foelske, L.; van Riper, C.J. Assessing spatial preference heterogeneity in a mixed-use landscape. Appl. Geogr. 2020, 125, 102355. [Google Scholar] [CrossRef]
  55. Ye, S.; Song, C.; Shen, S.; Gao, P.; Cheng, C.; Cheng, F.; Wan, C.; Zhu, D. Spatial pattern of arable land-use intensity in China. Land Use Policy 2020, 99, 104845. [Google Scholar] [CrossRef]
  56. Anselin, L. Local indicators of spatial association—LISA. Geogr. Anal. 1995, 27, 93–115. [Google Scholar] [CrossRef]
  57. Zhang, C.; Luo, L.; Xu, W.; Ledwith, V. Use of local Moran’s I and GIS to identify pollution hotspots of Pb in urban soils of Galway, Ireland. Sci. Total Environ. 2008, 398, 212–221. [Google Scholar] [CrossRef]
  58. Yu, H.; Fotheringham, A.S.; Li, Z.; Oshan, T.; Wolf, L.J. On the measurement of bias in geographically weighted regression models. Spat. Stat. 2020, 38, 100453. [Google Scholar] [CrossRef]
  59. Huang, Y.; Wang, X.; Patton, D. Examining spatial relationships between crashes and the built environment: A geographically weighted regression approach. J. Transp. Geogr. 2018, 69, 221–233. [Google Scholar] [CrossRef]
  60. Wang, Y.; Dong, L.; Liu, Y.; Huang, Z.; Liu, Y. Migration patterns in China extracted from mobile positioning data. Habitat Int. 2019, 86, 71–80. [Google Scholar] [CrossRef]
  61. Zhou, C.; Zhang, R.; Ning, X.; Zheng, Z. Spatial-temporal characteristics in grain production and its influencing factors in the Huang-Huai-Hai Plain from 1995 to 2018. Int. J. Environ. Res. Public Health 2020, 17, 9193. [Google Scholar] [CrossRef]
Figure 1. Study area.
Ijgi 10 00409 g001
Figure 2. Map depicting the kernel density of Hive Boxes in Guangzhou. Note: 1—Xi Guan; 2—Dongshan; 3—Long Daowei; 4—Xiao Bei; 5—Yang Ji; 6—Lin He; 7—Lie De; 8—Yuan Cun; 9—Su She; 10—Xia Du; 11—Wu Fengxiang; 12—Chi Gang; 13—San Yuanli; 14—Jing Xi; 15—Xiao Guwei; a—Shamian; b—Ersha Island; c—Zhongshan Fifth Road; d—Zhujiang New Town; e—Kangle Village; f—Wushan Nan Road; g—Zhannan Road; h—Shiliu Gang Road; i—Luntou Road; j—Ruibao Road; k—Huawan Road.
Ijgi 10 00409 g002
Figure 3. Report of Global Moran’s I index for Hive Box distribution in Guangzhou.
Ijgi 10 00409 g003
Figure 4. Results of local Moran’s I index of Hive Box distribution in Guangzhou.
Ijgi 10 00409 g004
Figure 5. Spatial distribution of local R2 in the GWR model.
Ijgi 10 00409 g005
Figure 6. Spatial distribution and regression coefficients for the 11 factors based on the GWR model for Hive Boxes in Guangzhou: (a) Total population, (b) urbanization rate, (c) POI of living facilities, (d) POI of working facilities, (e) POI of public facilities, (f) road density, (g) building density, (h) building floor, (i) population aging, (j) number of working people, and (k) housing conditions.
Ijgi 10 00409 g006aIjgi 10 00409 g006bIjgi 10 00409 g006c
Table 1. Influencing factors, variables, and data sources of the social characteristics of administrative communities in Guangzhou.
FactorsVariablesData Sources
Urban development
(UD, X1)
X11_Total population (TP)2010 Population Census of PRC
X12_Urbanization rate (UR)2010 Population Census of PRC
Urban functions
(UF, X2)
X21_POI of living facilities (LPOI)Baidu’s map
X22_POI of working facilities (WPOI)Baidu’s map
X23_POI of public facilities (PPOI)Baidu’s map
Built environment
(BE, X3)
X31_Road density (RD)OpenStreetMap (OSM) and ArcGIS data
X32_Building density (BD)OpenStreetMap (OSM) and ArcGIS data
X33_Building floor (BF)OpenStreetMap (OSM) and ArcGIS data
Personal characteristics
(PC, X4)
X41_Population ageing (PA)2010 Population Census of PRC
X42_Number of working people (WP)2010 Population Census of PRC
X43_Number of highly educated people (HEP)2010 Population Census of PRC
X44_Housing conditions
(HC, habitable space >120 m2)
2010 Population Census of PRC
Table 2. Correlations of variables in EViews.
X11X12X21X22X23X31X32X33X41X42X43X44
X111.000
X120.1651.000
X210.5390.1221.000
X220.4500.0220.7411.000
X230.5750.2700.7820.6601.000
X310.1290.5600.2040.1330.2541.000
X320.1950.6700.1360.0110.1090.4451.000
X330.2360.6300.2520.1910.3420.4800.4871.000
X41−0.3990.299−0.328−0.353−0.2780.1230.1720.0641.000
X420.5060.1180.3730.3990.3240.1820.2680.217−0.6351.000
X430.2980.5920.0730.0570.3510.2840.3190.4620.0070.2001.000
X44−0.091−0.465−0.0630.024−0.047−0.335−0.537−0.233−0.151−0.091−0.1711.000
Table 3. Results of spatial spillover effects for the OLS model, SEM, and SLM.
VariablesOLSSEMSLM
CoefficientStandard
Deviation
CoefficientStandard
Deviation
CoefficientStandard
Deviation
Constant0.0334 **0.01330.0383 ***0.01380.0301 **0.0130
X11_TP0.0788 ***0.01400.0612 ***0.01370.0658 ***0.0137
X12_UR0.00470.00440.0089 *0.00470.00120.0044
X21_LPOI−0.1040 ***0.0195−0.0914 ***0.0196−0.1036 ***0.0191
X22_WPOI−0.0459 ***0.0156−0.0280 *0.0158−0.0426 ***0.0153
X23_PPOI0.4541 ***0.01830.4396 ***0.01800.4416 ***0.0180
X31_RD−0.0386 ***0.0100−0.0324 ***0.0102−0.0340 ***0.0098
X32_BD−0.0111 **0.0055−0.0146 **0.0060−0.0095 *0.0054
X33_BF0.0902 ***0.00890.0823 ***0.00910.0777 ***0.0088
X41_PA−0.0924 ***0.0254−0.0993 ***0.0267−0.0636 **0.0252
X42_WP−0.0442 ***0.0165−0.0494 ***0.0169−0.0456 ***0.0162
X43_HEP−0.0186 *0.0100−0.01370.0104−0.0214 **0.0098
X44_HC0.0142 ***0.00500.0116 **0.00530.0106 **0.0049
R20.4696 0.4996 0.4894
AIC−8798.26 −8912.57 −8879.70
Notes: *** significant at the 1% level; ** significant at the 5% level; * significant at the 10% level.
Publisher’s Note: MDPI stays neutral with regard to jurisdictional claims in published maps and institutional affiliations.

