
Exploration of Semantic Geo-Object Recognition Based on the Scale Parameter Optimization Method for Remote Sensing Images


Abstract
:1. Introduction
2. Materials and Methods
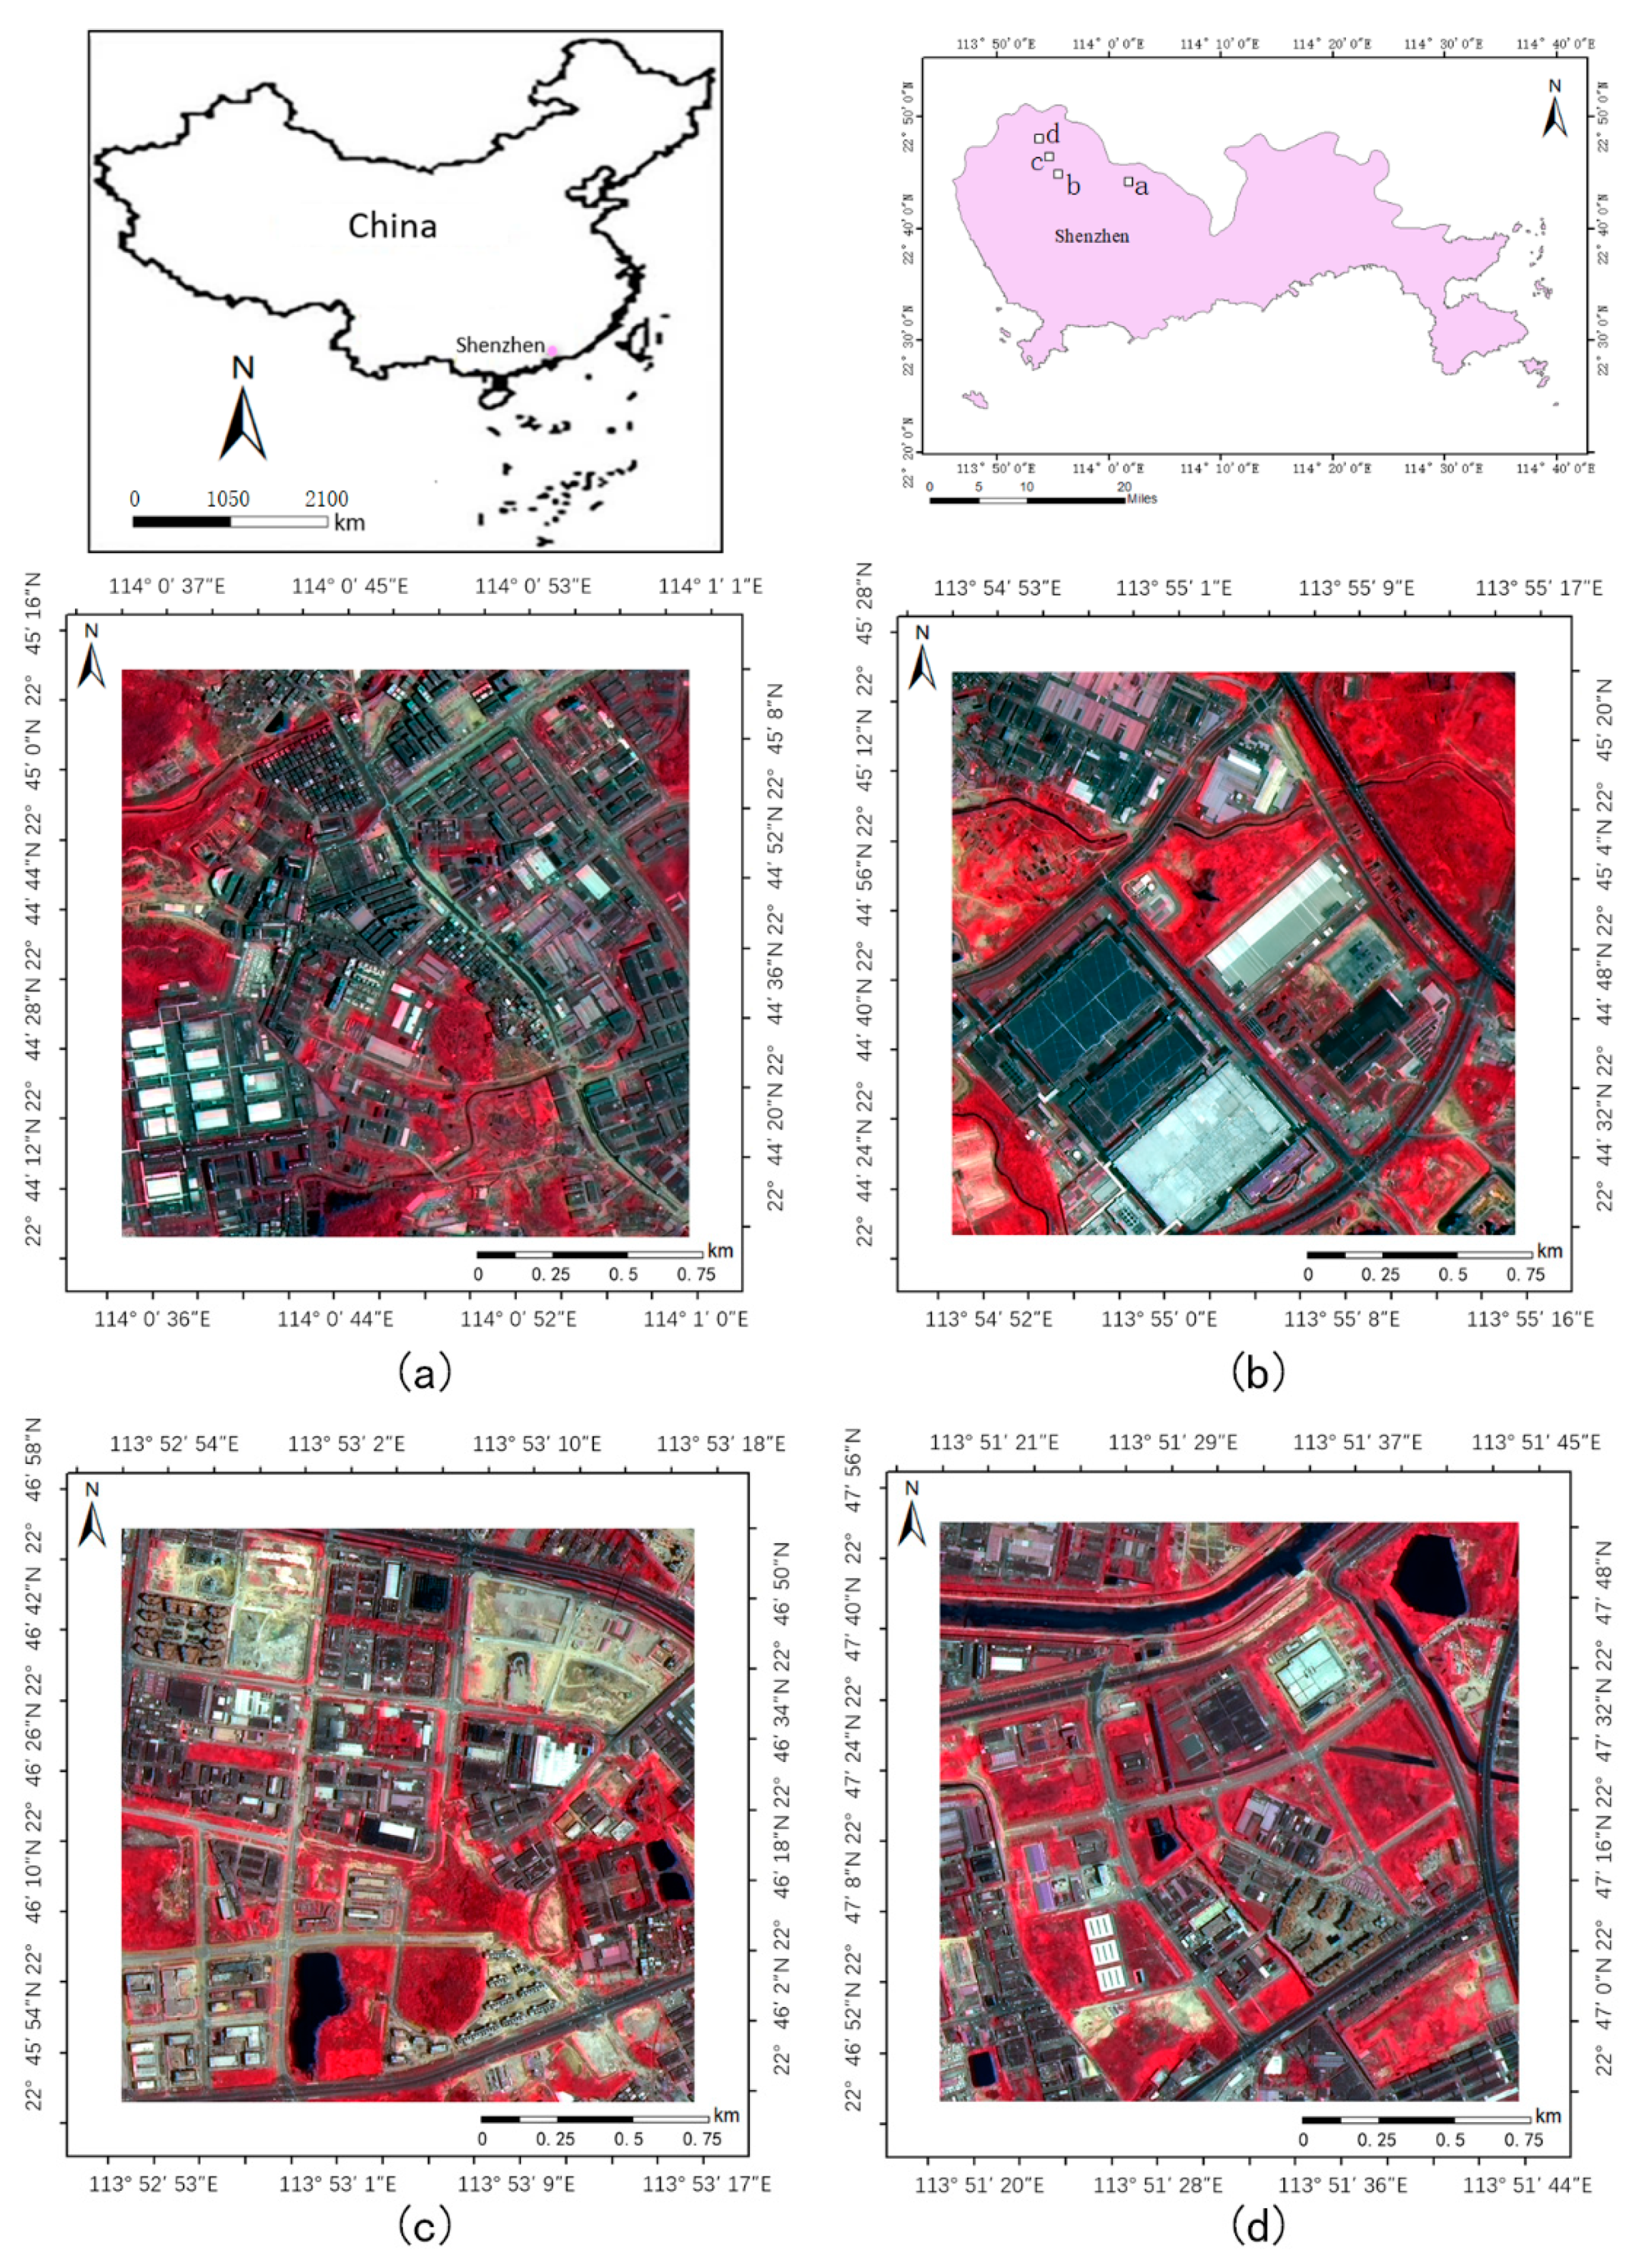
2.1. Study Area
2.2. Methods
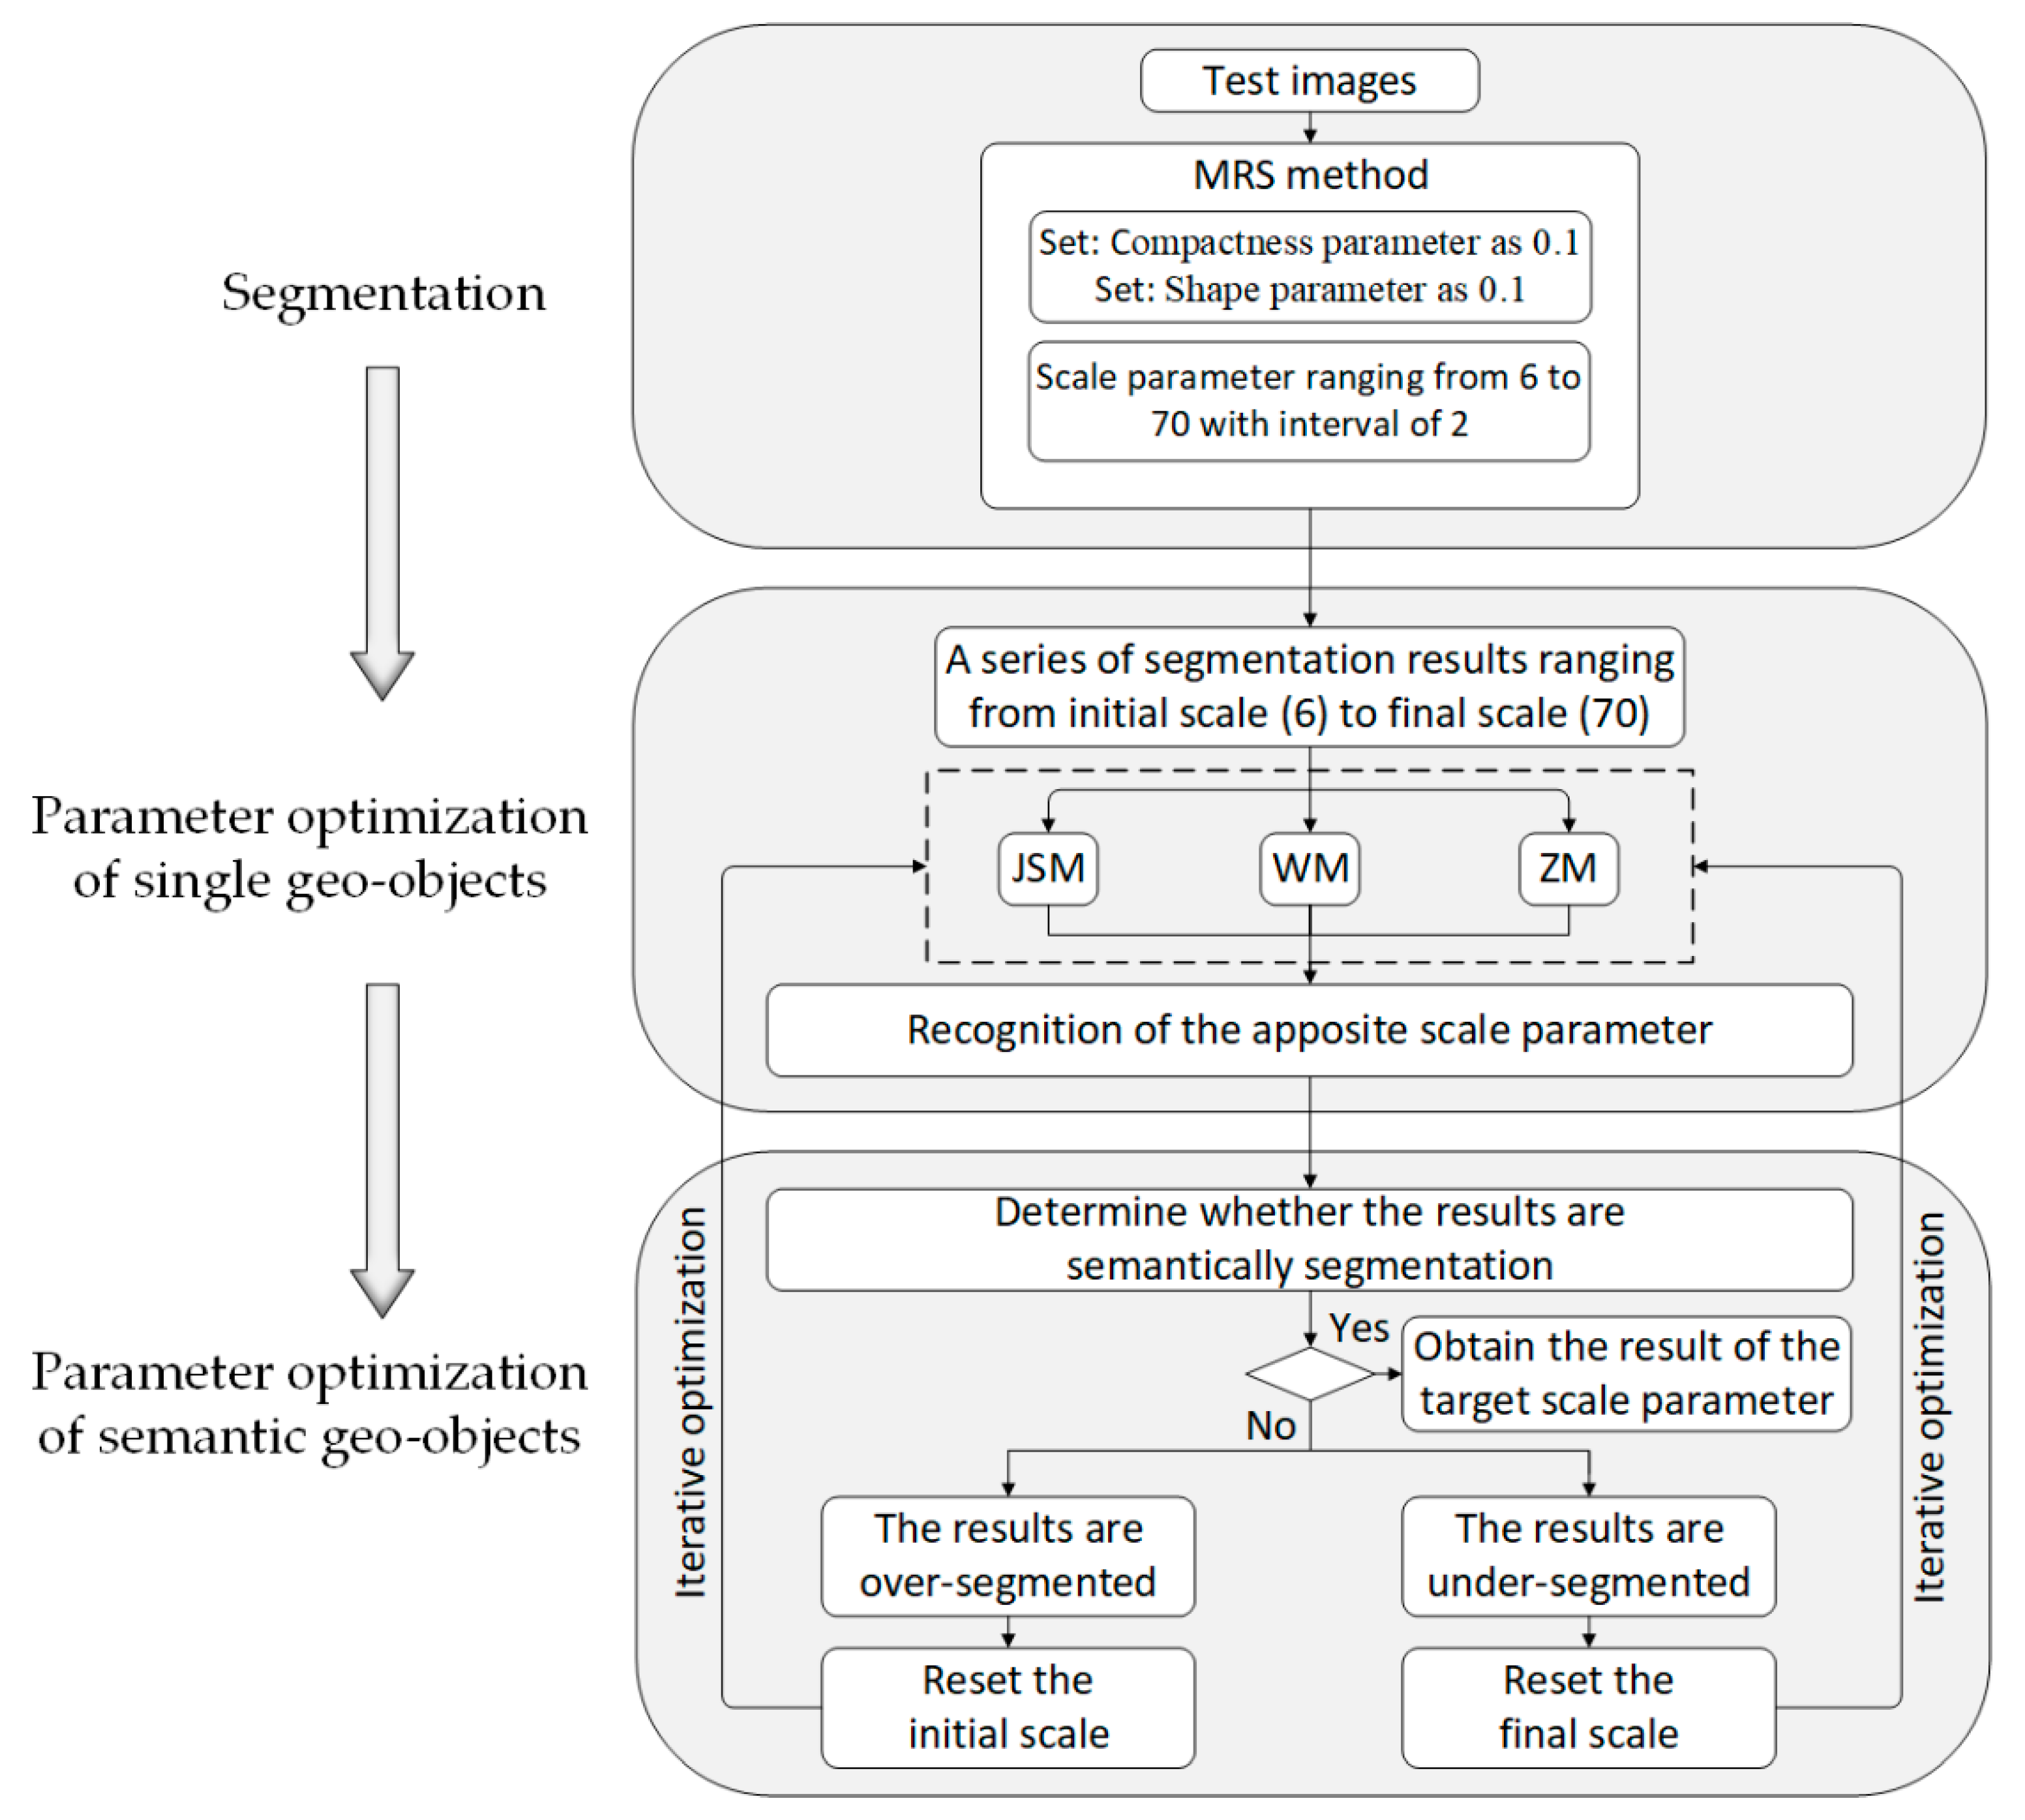
2.2.1. Overview
2.2.2. Semantic Geo-Object PO
3. Results
3.1. Experimental Process
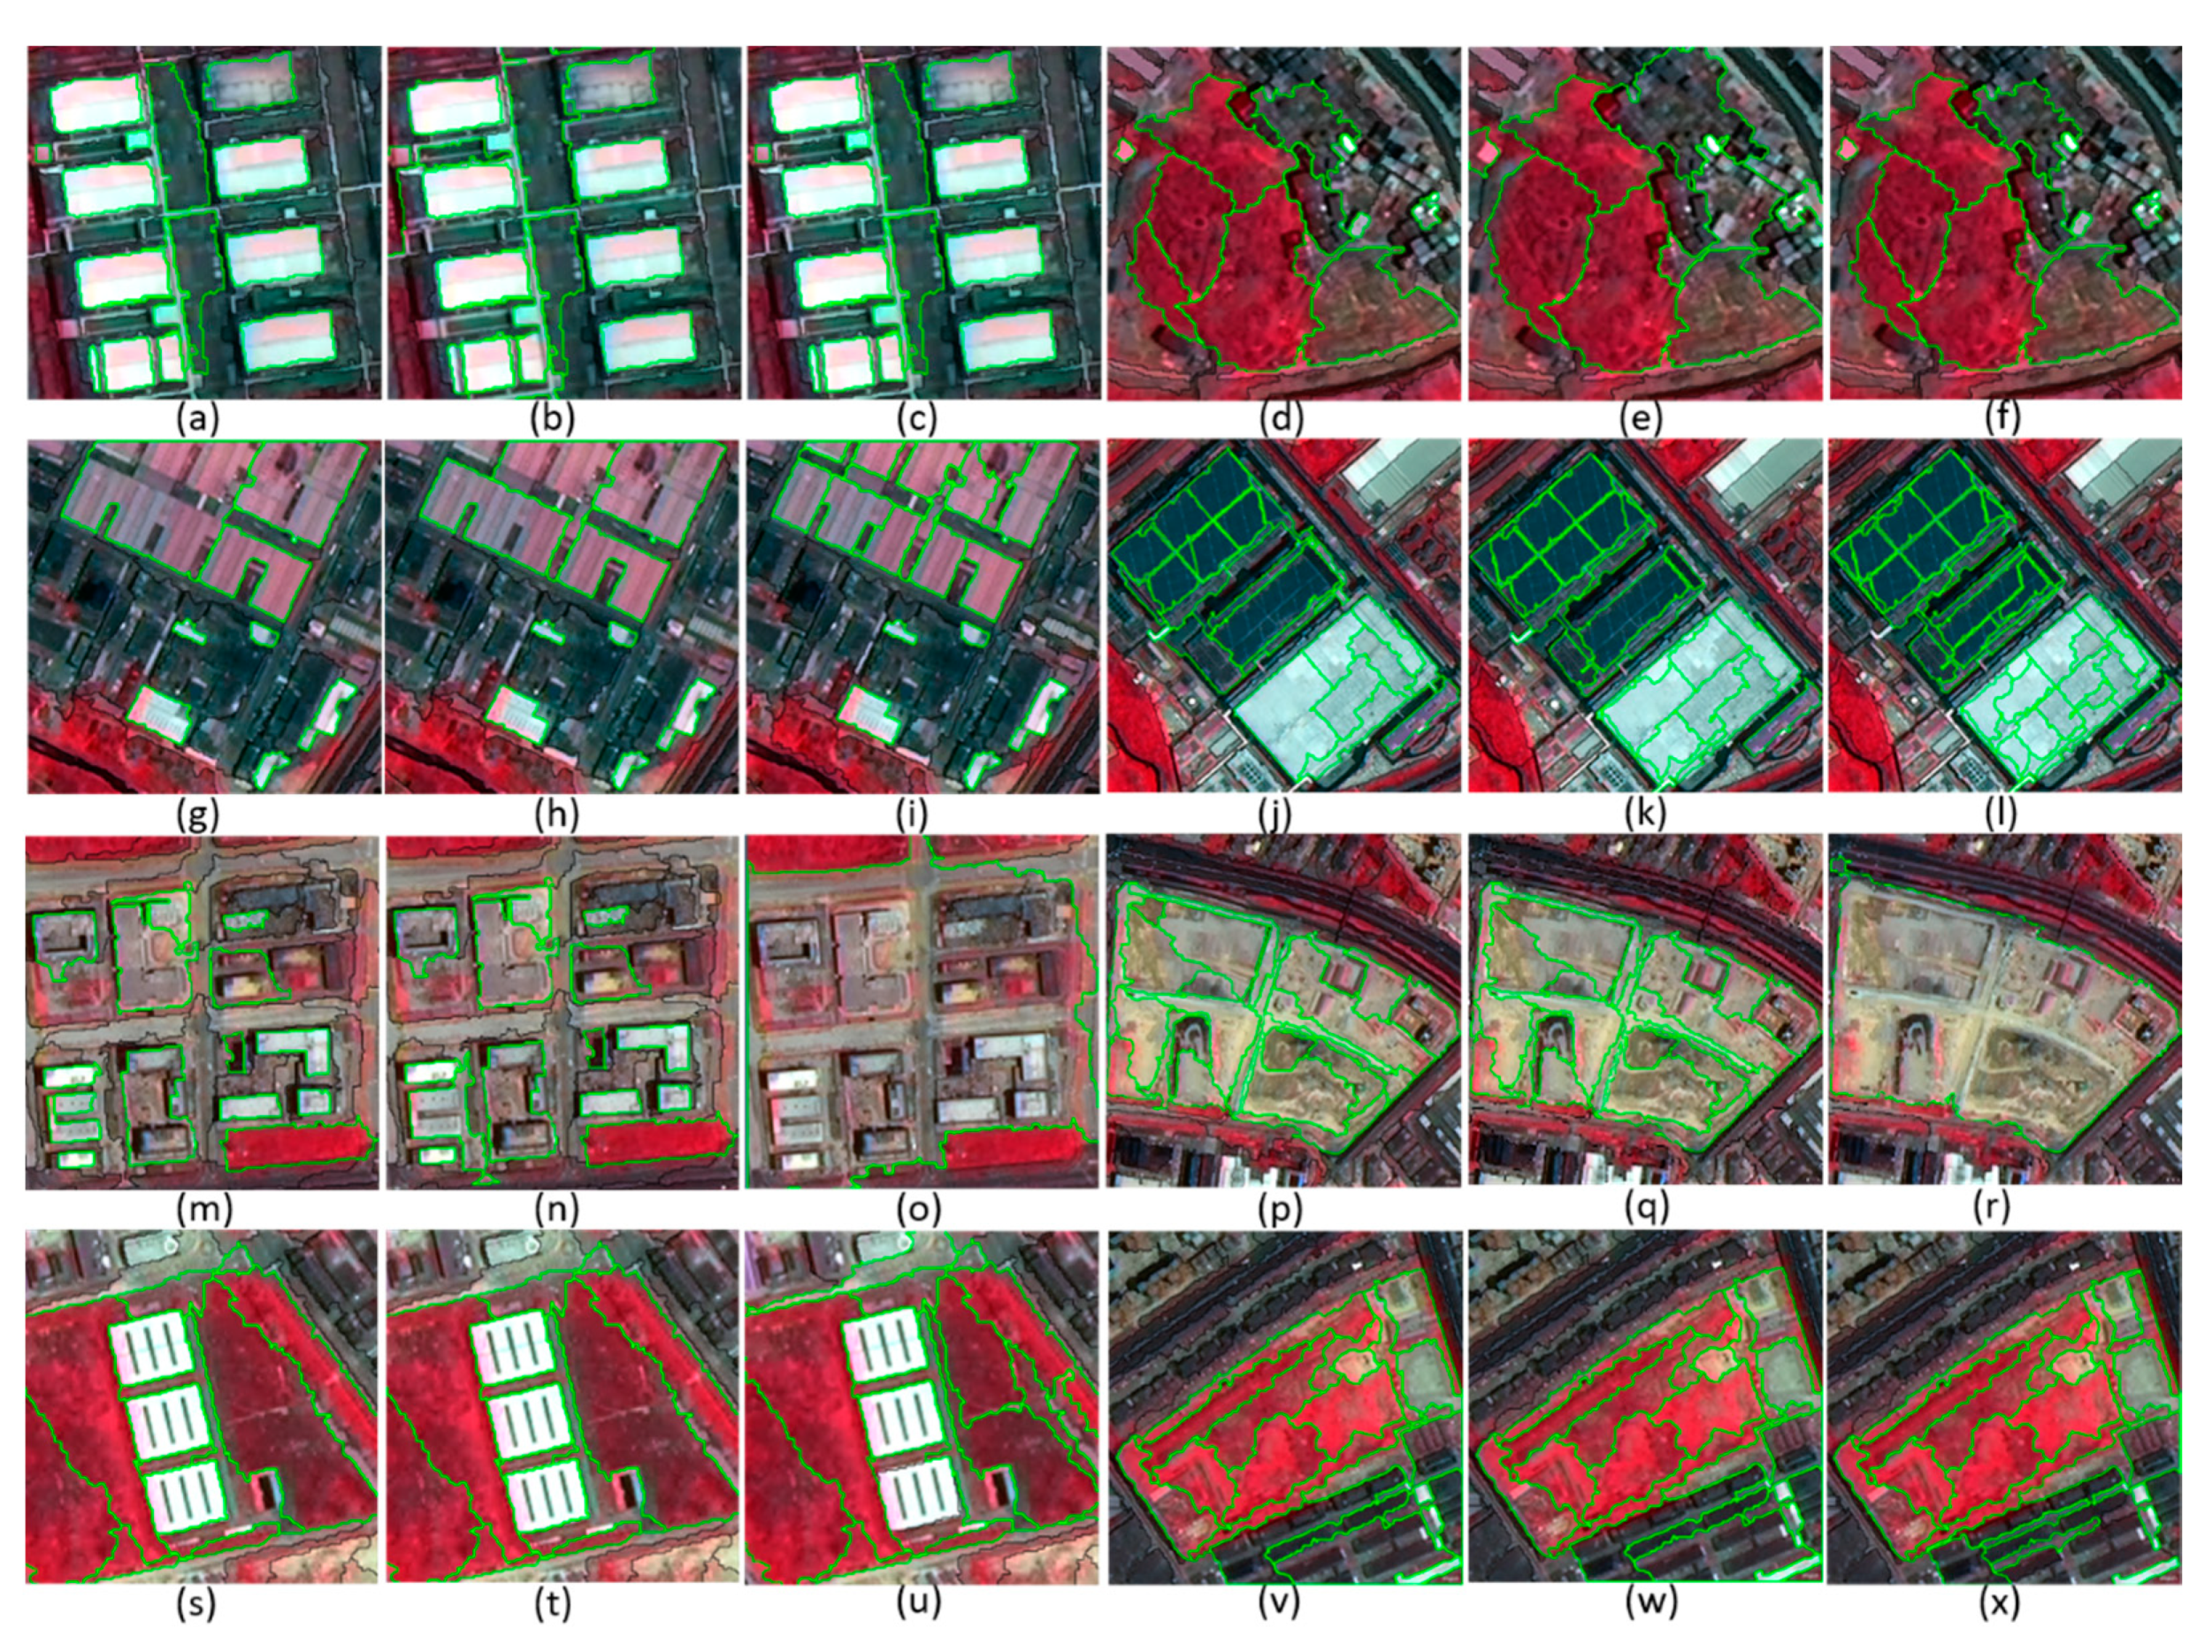
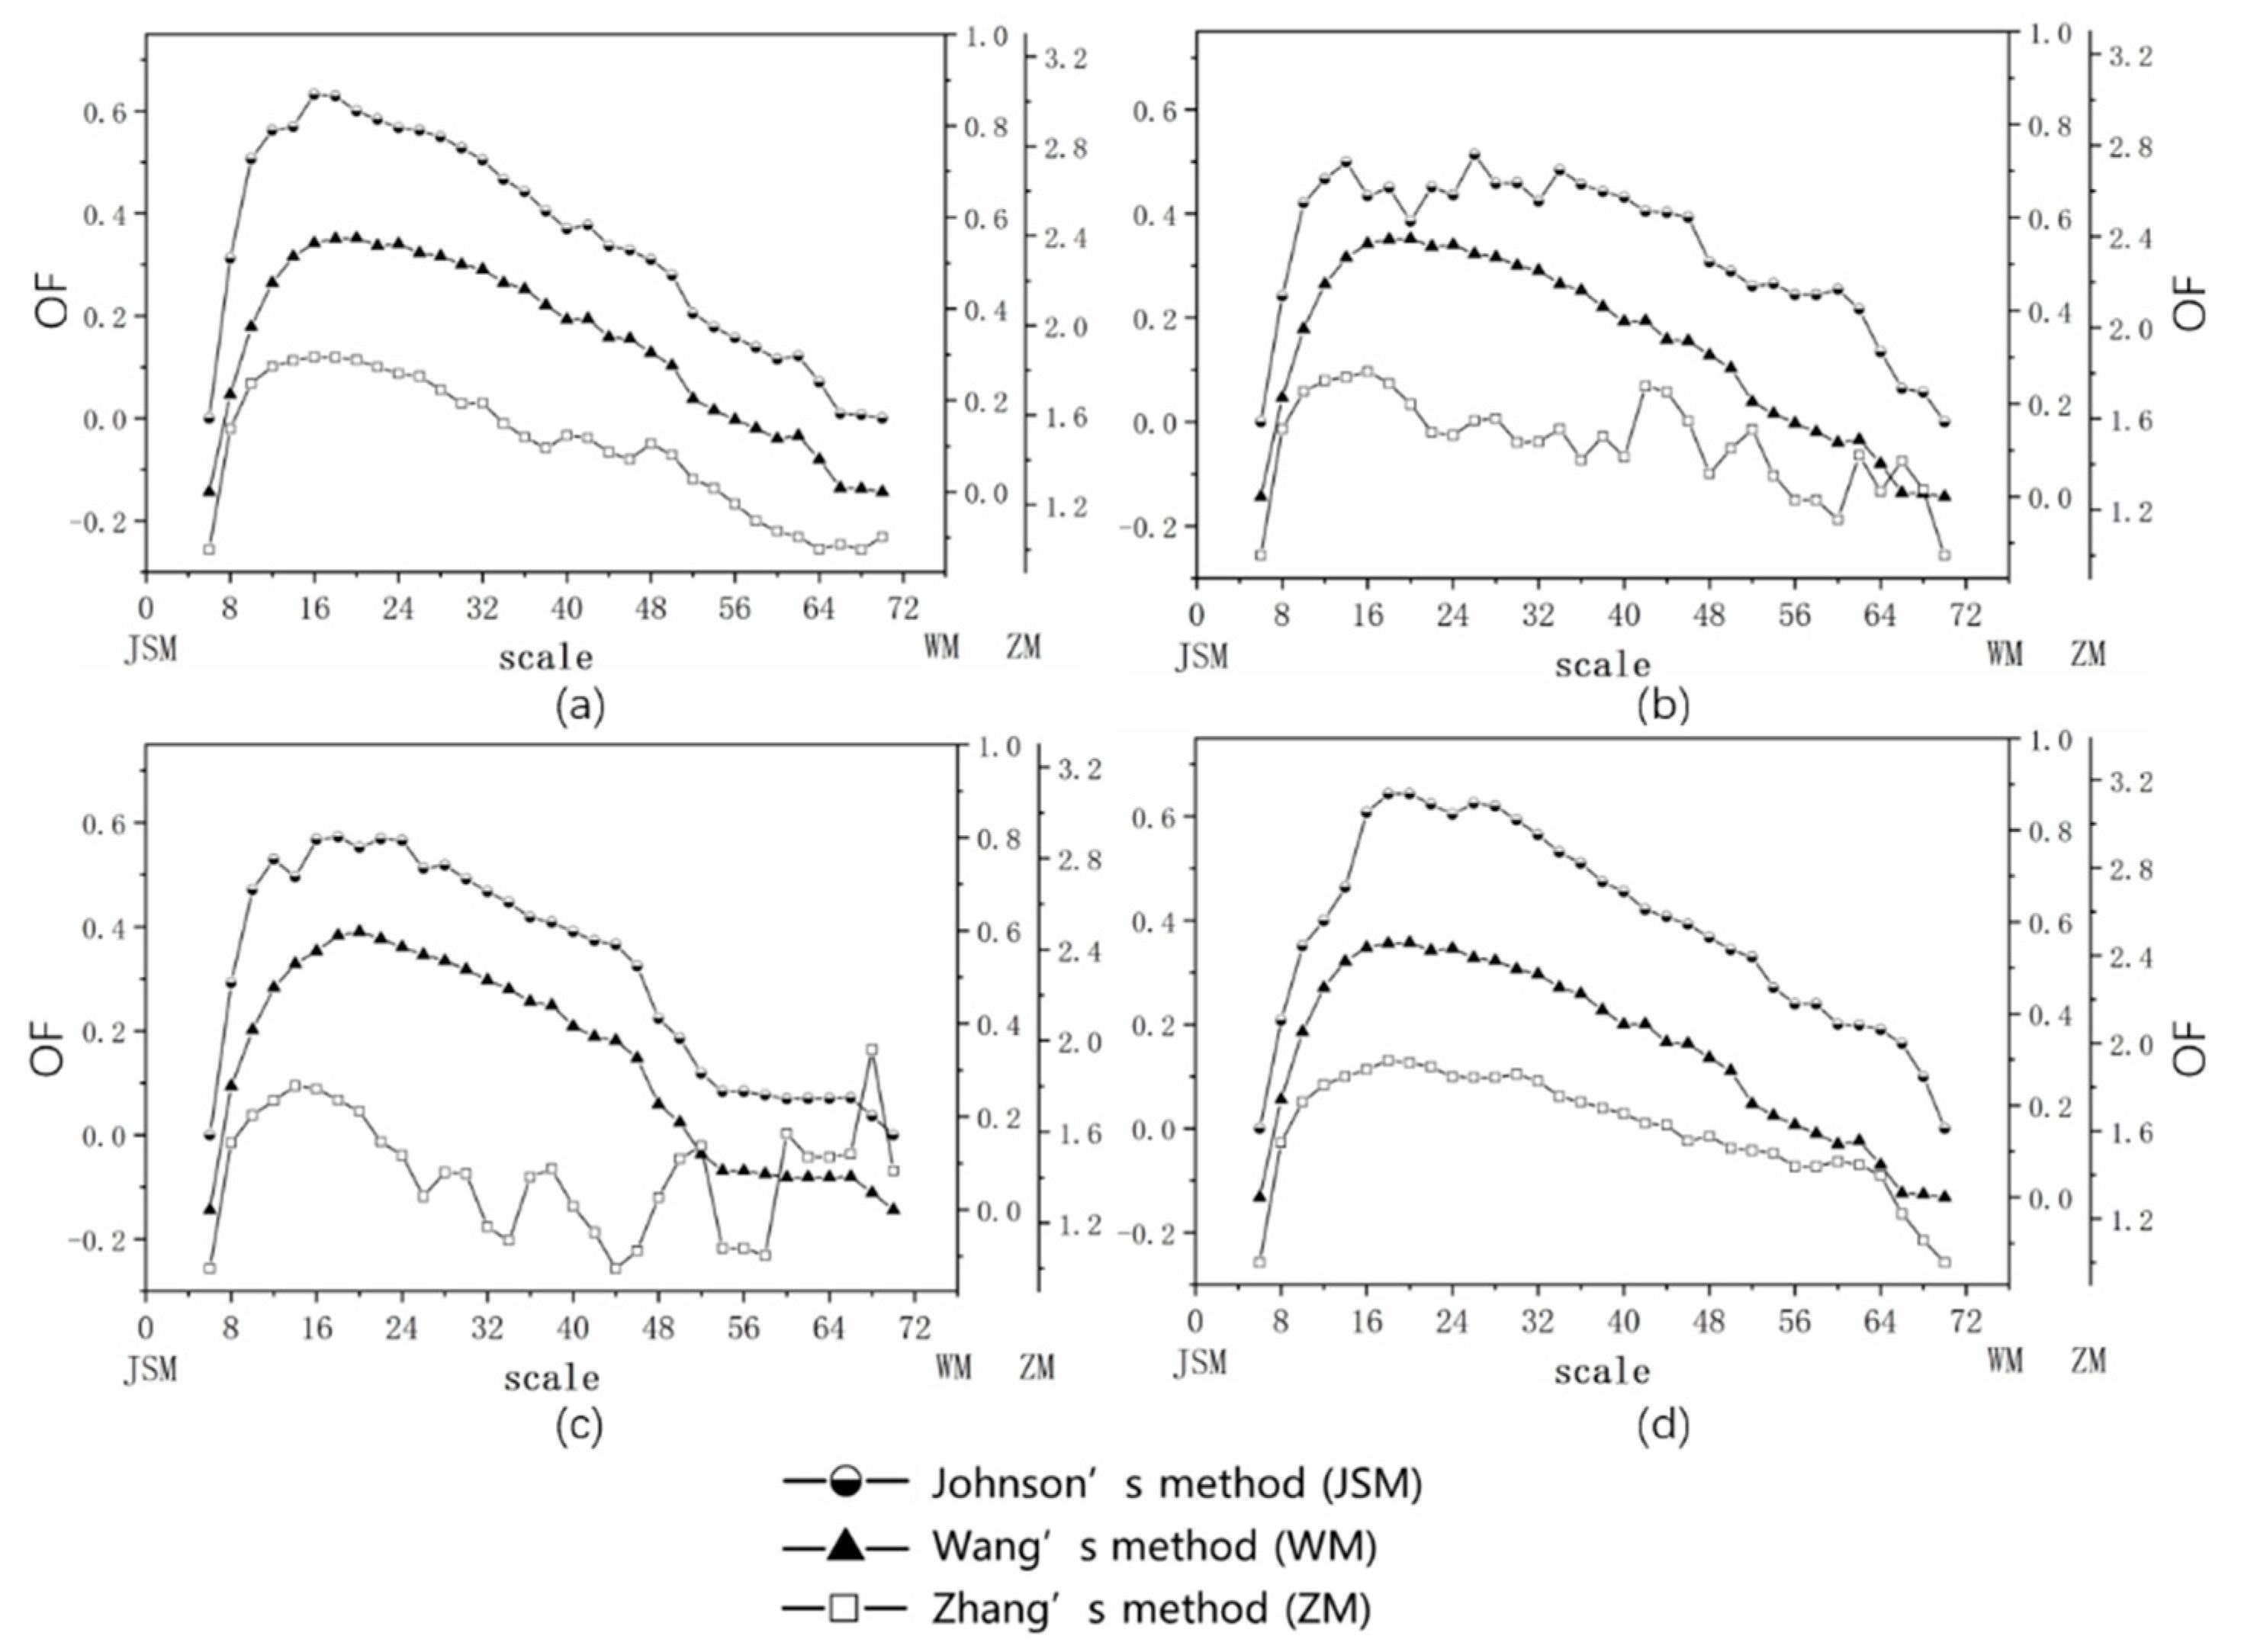
3.2. Results of Scale Parameter Optimization for Single Geo-Objects
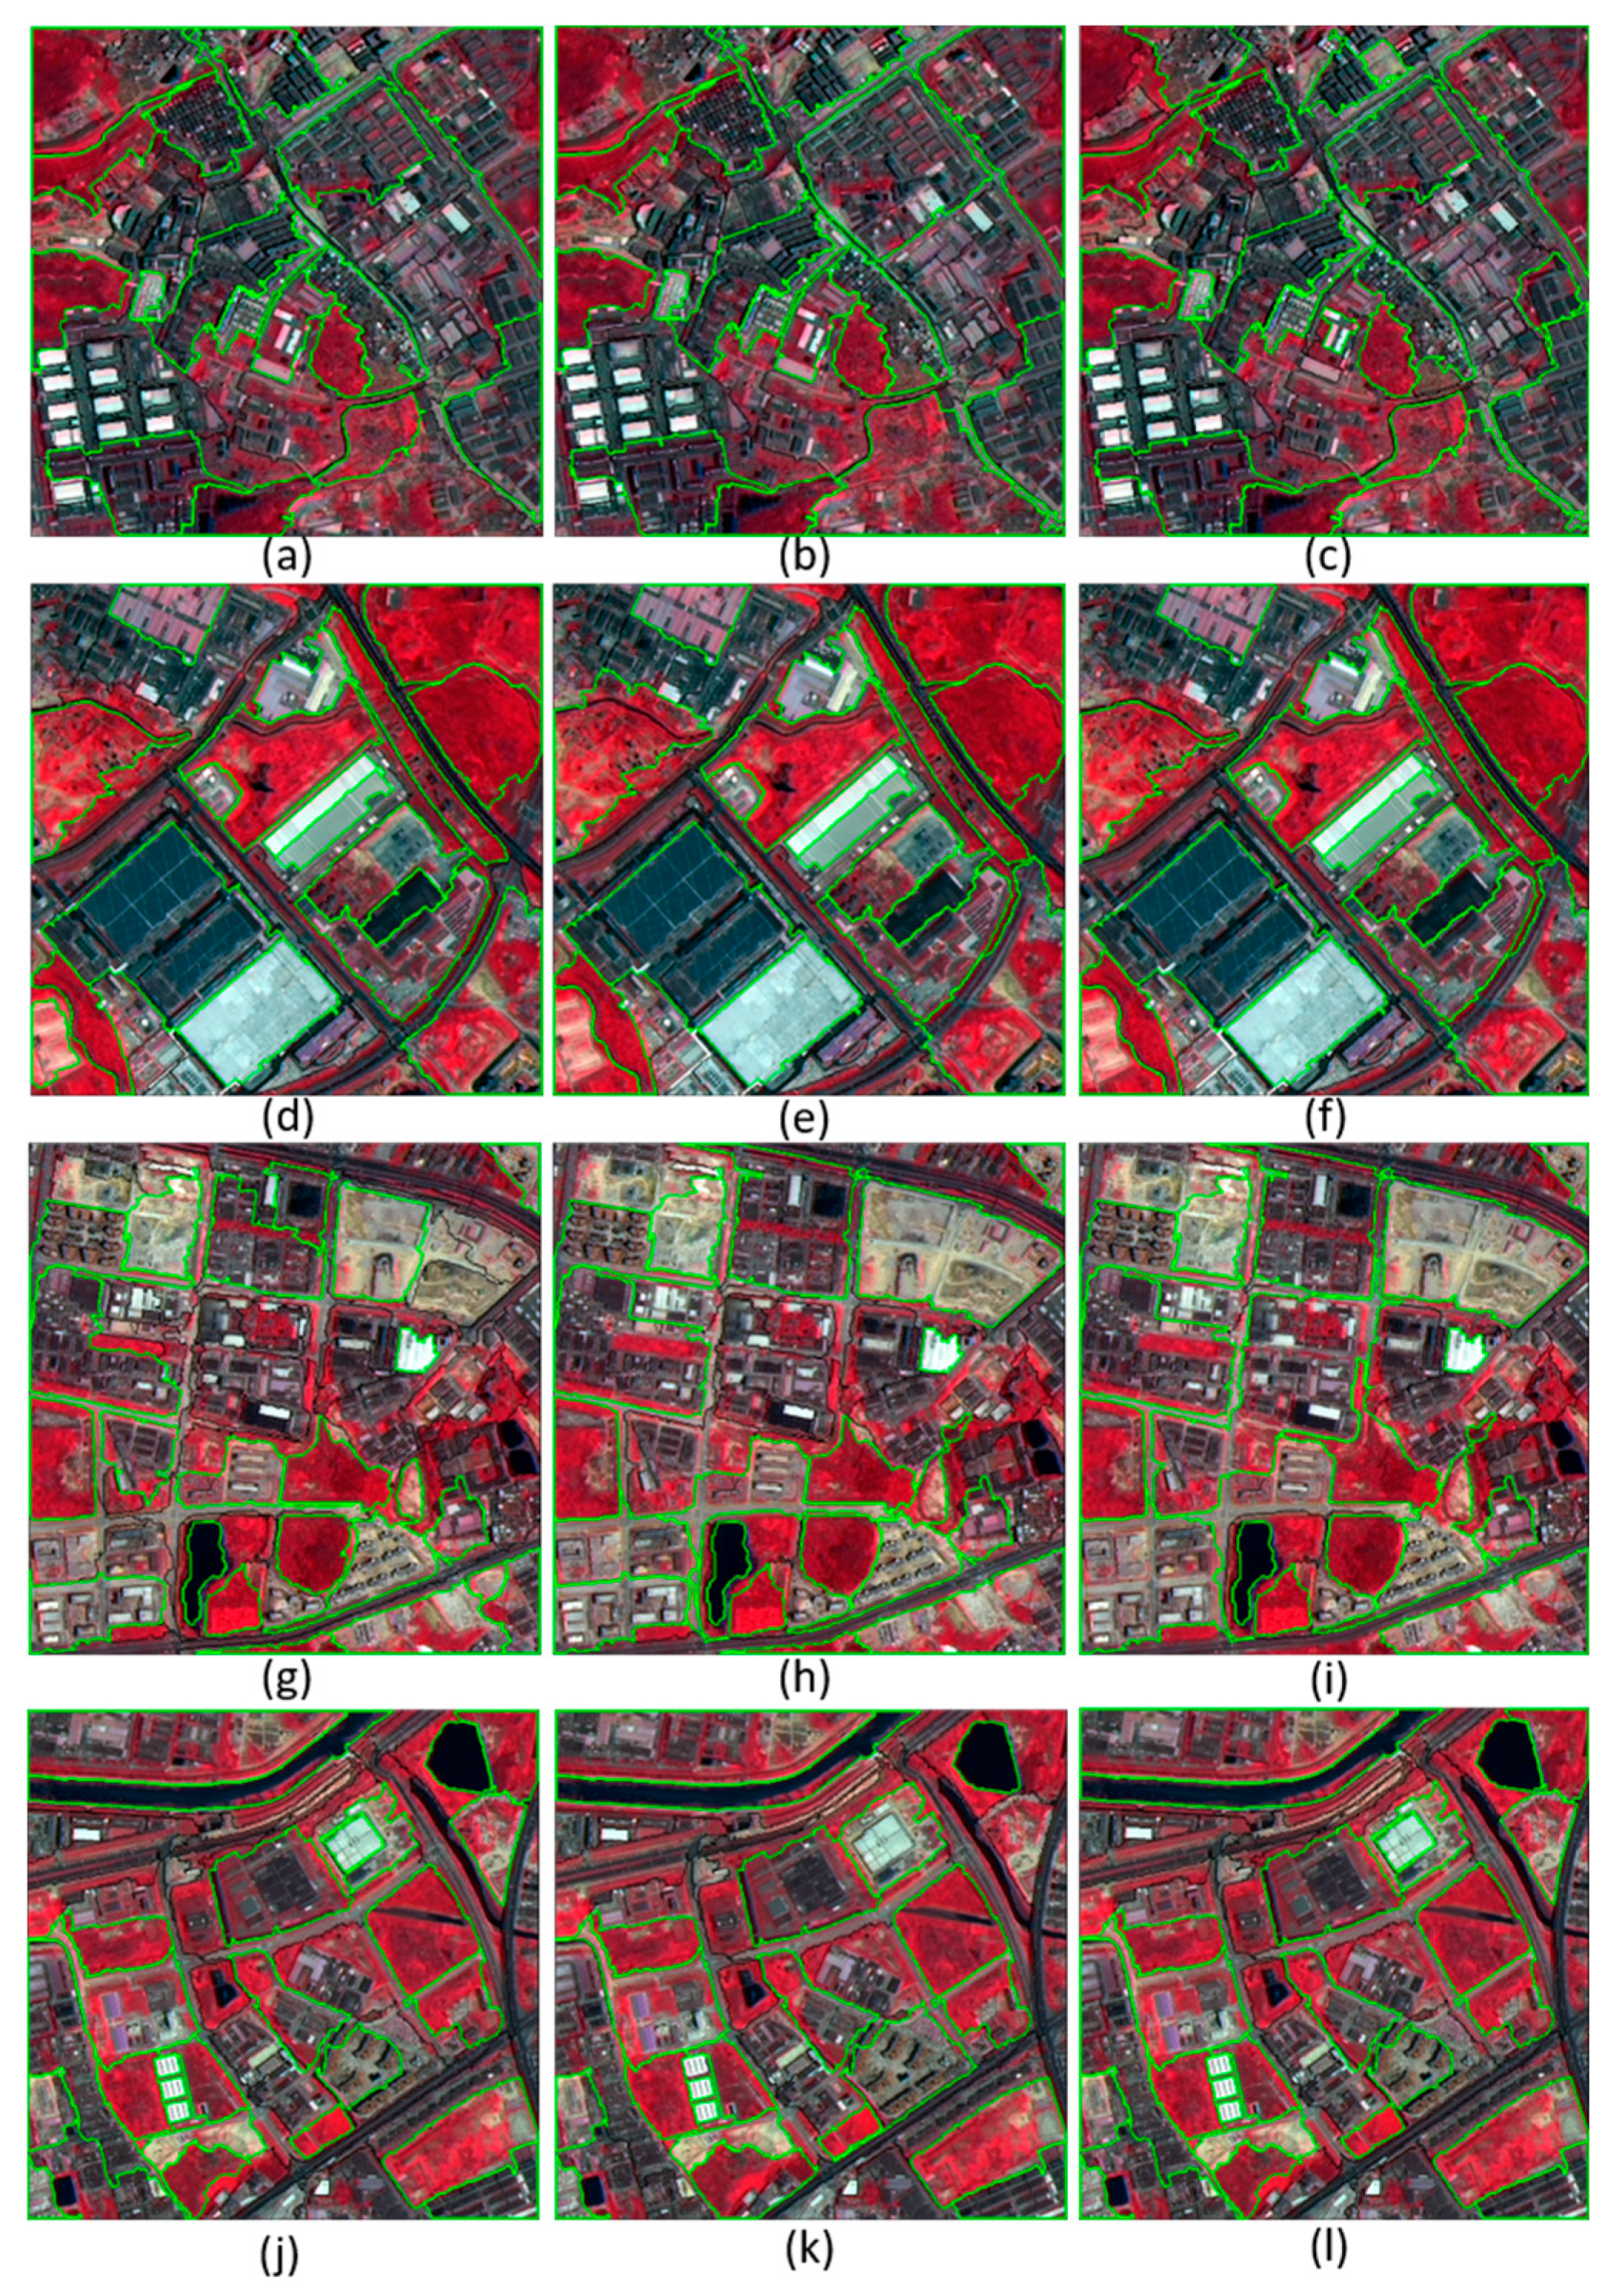
3.3. Results of Scale Parameter Optimization for Semantic Geo-Objects
4. Discussion
5. Conclusions
Author Contributions
Funding
Institutional Review Board Statement
Informed Consent Statement
Data Availability Statement
Acknowledgments
Conflicts of Interest
References
- Johansen, K.; Arroyo, L.A.; Phinn, S.; Witte, C. Comparison of Geo-Object Based and Pixel-Based Change Detection of Riparian Environments using High Spatial Resolution Multi-Spectral Imagery. Photogramm. Eng. Rem. S 2010, 76, 123–136. [Google Scholar] [CrossRef]
- Blaschke, T.; Hay, G.J.; Kelly, M.; Lang, S.; Hofmann, P.; Addink, E.; Feitosa, R.Q.; van der Meer, F.; van der Werff, H.; van Coillie, F.; et al. Geographic Object-Based Image Analysis—Towards a new paradigm. ISPRS J. Photogramm. 2014, 87, 180–191. [Google Scholar] [CrossRef] [Green Version]
- Blaschke, T. Object based image analysis for remote sensing. ISPRS J. Photogramm. 2010, 65, 2–16. [Google Scholar] [CrossRef] [Green Version]
- Liu, J.; Li, P.J.; Wang, X. A new segmentation method for very high resolution imagery using spectral and morphological information. ISPRS J. Photogramm. 2015, 101, 145–162. [Google Scholar] [CrossRef]
- Yang, J.; He, Y.H.; Caspersen, J.; Jones, T. A discrepancy measure for segmentation evaluation from the perspective of object recognition. ISPRS J. Photogramm. 2015, 101, 186–192. [Google Scholar] [CrossRef]
- Cleve, C.; Kelly, M.; Kearns, F.R.; Morltz, M. Classification of the wildland-urban interface: A comparison of pixel- and object-based classifications using high-resolution aerial photography. Comput. Environ. Urban 2008, 32, 317–326. [Google Scholar] [CrossRef]
- Myint, S.W.; Gober, P.; Brazel, A.; Grossman-Clarke, S.; Weng, Q.H. Per-pixel vs. object-based classification of urban land cover extraction using high spatial resolution imagery. Remote Sens. Environ. 2011, 115, 1145–1161. [Google Scholar] [CrossRef]
- Gao, Y.; Mas, J.F.; Maathuis, B.H.P.; Zhang, X.M.; Van Dijk, P.M. Comparison of pixel-based and object-oriented image classification approaches—A case study in a coal fire area, Wuda, Inner Mongolia, China. Int. J. Remote Sens 2006, 27, 4039–4055. [Google Scholar] [CrossRef]
- Benz, U.C.; Hofmann, P.; Willhauck, G.; Lingenfelder, I.; Heynen, M. Multi-resolution, object-oriented fuzzy analysis of remote sensing data for GIS-ready information. ISPRS J. Photogramm. 2004, 58, 239–258. [Google Scholar] [CrossRef]
- Wagner, B.; Dinges, A.; Muller, P.; Haase, G. Parallel Volume Image Segmentation with Watershed Transformation. Lect. Notes Comput. Sci. 2009, 5575, 420–429. [Google Scholar]
- Chen, L.C.; Papandreou, G.; Kokkinos, I.; Murphy, K.; Yuille, A.L. DeepLab: Semantic Image Segmentation with Deep Convolutional Nets, Atrous Convolution, and Fully Connected CRFs. IEEE T Pattern Anal. 2018, 40, 834–848. [Google Scholar] [CrossRef]
- Happ, P.N.; Ferreira, R.S.; Bentes, C.; Costa, G.A.O.P.; Feitosa, R.Q. Multiresolution Segmentation: A Parallel Approach for High Resolution Image Segmentation in Multicore Architectures. In Int Arch Photogramm; Addink, E.A., VanCoillie, F.M.B., Eds.; Copernicus Gesellschaft Mbh: Gottingen, German, 2010; p. 38-4-C7. [Google Scholar]
- Yang, J.; He, Y.H.; Caspersen, J. Region merging using local spectral angle thresholds: A more accurate method for hybrid segmentation of remote sensing images. Remote Sens. Environ. 2017, 190, 137–148. [Google Scholar] [CrossRef]
- Doulamis, A.D.; Doulamis, N.D.; Kollias, S.D. A fuzzy video content representation for video summarization and content-based retrieval. Signal Process. 2000, 80, 1049–1067. [Google Scholar] [CrossRef]
- Vincent, L.; Soille, P. Watersheds in Digital Spaces—An Efficient Algorithm Based on Immersion Simulations. IEEE T Pattern Anal. 1991, 13, 583–598. [Google Scholar] [CrossRef] [Green Version]
- Shi, J.B.; Malik, J. Normalized cuts and image segmentation. IEEE T Pattern Anal. 2000, 22, 888–905. [Google Scholar] [CrossRef] [Green Version]
- Johnson, B.; Xie, Z.X. Unsupervised image segmentation evaluation and refinement using a multi-scale approach. ISPRS J. Photogramm. 2011, 66, 473–483. [Google Scholar] [CrossRef]
- Zhang, X.L.; Xiao, P.F.; Feng, X.Z. An Unsupervised Evaluation Method for Remotely Sensed Imagery Segmentation. IEEE Geosci. Remote Sens. Lett. 2012, 9, 156–160. [Google Scholar] [CrossRef]
- Belgiu, M.; Dragut, L. Comparing supervised and unsupervised multiresolution segmentation approaches for extracting buildings from very high resolution imagery. ISPRS J. Photogramm. 2014, 96, 67–75. [Google Scholar] [CrossRef] [PubMed] [Green Version]
- Bock, S.; Immitzer, M.; Atzberger, C. On the Objectivity of the Objective Function-Problems with Unsupervised Segmentation Evaluation Based on Global Score and a Possible Remedy. Remote Sens. 2017, 9, 769. [Google Scholar] [CrossRef] [Green Version]
- Dragut, L.; Csillik, O.; Eisank, C.; Tiede, D. Automated parameterisation for multi-scale image segmentation on multiple layers. ISPRS J. Photogramm. 2014, 88, 119–127. [Google Scholar] [CrossRef] [PubMed] [Green Version]
- Johnson, B.A.; Bragais, M.; Endo, I.; Magcale-Macandog, D.B.; Macandog, P.B.M. Image Segmentation Parameter Optimization Considering Within- and Between-Segment Heterogeneity at Multiple Scale Levels: Test Case for Mapping Residential Areas Using Landsat Imagery. ISPRS Int. Geo-Inf. 2015, 4, 2292–2305. [Google Scholar] [CrossRef] [Green Version]
- Grybas, H.; Melendy, L.; Congalton, R.G. A comparison of unsupervised segmentation parameter optimization approaches using moderate- and high-resolution imagery. GISci. Remote Sens. 2017, 54, 515–533. [Google Scholar] [CrossRef]
- Dragut, L.; Tiede, D.; Levick, S.R. ESP: A tool to estimate scale parameter for multiresolution image segmentation of remotely sensed data. Int. J. Geogr. Inf. Sci. 2010, 24, 859–871. [Google Scholar] [CrossRef]
- Chabrier, S.; Emile, B.; Rosenberger, C.; Laurent, H. Unsupervised performance evaluation of image segmentation. Eur. J. Appl. Signal Process. 2006. [Google Scholar] [CrossRef] [Green Version]
- Kim, M.; Madden, M.; Warner, T. Estimation of Optimal Image Object Size for the Segmentation of Forest Stands with Multispectral IKONOS Imagery; Springer: Berlin/Heidelberg, Germany, 2008; pp. 291–307. [Google Scholar]
- Wang, Y.; Tian, Z.; Qi, Q.; Wang, J. Double-Variance Measures: A Potential Approach to Parameter Optimization of Remote Sensing Image Segmentation. IEEE J. Sel. Top. Appl. Earth Obs. Remote Sens. 2021, 14, 1. [Google Scholar]
- Espindola, G.M.; Camara, G.; Reis, I.A.; Bins, L.S.; Monteiro, A.M. Parameter selection for region-growing image segmentation algorithms using spatial autocorrelation. Int. J. Remote Sens. 2006, 27, 3035–3040. [Google Scholar] [CrossRef]
- Yang, J.; Li, P.J.; He, Y.H. A multi-band approach to unsupervised scale parameter selection for multi-scale image segmentation. ISPRS J. Photogramm. 2014, 94, 13–24. [Google Scholar] [CrossRef]
- Yang, J.; He, Y.H.; Weng, Q.H. An Automated Method to Parameterize Segmentation Scale by Enhancing Intrasegment Homogeneity and Intersegment Heterogeneity. IEEE Geosci. Remote Sens. Lett. 2015, 12, 1282–1286. [Google Scholar] [CrossRef]
- Kim, M.; Madden, M.; Warner, T.A. Forest Type Mapping using Object-specific Texture Measures from Multispectral Ikonos Imagery: Segmentation Quality and Image Classification Issues. Photogramm. Eng. Remote Sens. 2009, 75, 819–829. [Google Scholar] [CrossRef] [Green Version]
- Faur, D.; Gavat, I.; Datcu, M. Salient Remote Sensing Image Segmentation Based on Rate-Distortion Measure. IEEE Geosci. Remote Sens. Lett. 2009, 6, 855–859. [Google Scholar] [CrossRef]
- Corcoran, P.; Winstanley, A.; Mooney, P. Segmentation performance evaluation for object-based remotely sensed image analysis. Int. J. Remote Sens. 2010, 31, 617–645. [Google Scholar] [CrossRef]
- Wang, Y.J.; Qi, Q.W.; Liu, Y. Unsupervised Segmentation Evaluation Using Area-Weighted Variance and Jeffries-Matusita Distance for Remote Sensing Images. Remote Sens. 2018, 10, 1193. [Google Scholar] [CrossRef] [Green Version]
- Wang, J.; Jiang, L.; Wang, Y.; Qi, Q. An Improved Hybrid Segmentation Method for Remote Sensing Images. ISPRS Int. J. Geo-Inf. 2019, 8, 543. [Google Scholar] [CrossRef] [Green Version]
- Wang, C.-K.; Fareed, N. Mapping Drainage Structures Using Airborne Laser Scanning by Incorporating Road Centerline Information. Remote Sens. 2021, 13, 463. [Google Scholar] [CrossRef]
- Baatz, M.; Schäpe, A. Multiresolution Segmentation—An Optimization Approach for High Quality Multi-Scale Image Segmentation. In Angewandte Geographische Informations-Verarbeitung; Strobl, J., Blaschke, T., Griesebner, G., Eds.; Wichmanm Verlag: Karls ruhe, Germany, 2000; pp. 12–23. [Google Scholar]
- Mikelbank, B.A. Quantitative geography: Perspectives on spatial data analysis. Geogr. Anal. 2001, 33, 370–372. [Google Scholar] [CrossRef]
- Wang, Y.J.; Meng, Q.Y.; Qi, Q.W.; Yang, J.; Liu, Y. Region Merging Considering Within- and Between-Segment Heterogeneity: An Improved Hybrid Remote-Sensing Image Segmentation Method. Remote Sens. 2018, 10, 781. [Google Scholar] [CrossRef] [Green Version]
- Richards, J.A. Remote Sensing Digital Image Analysis: An Introduction; Springer: Berlin/Heidelberg, Germany, 2006; pp. 47–54. [Google Scholar]
- Schmidt, K.S.; Skidmore, A.K. Spectral discrimination of vegetation types in a coastal wetland. Remote Sens. Environ. 2003, 85, 92–108. [Google Scholar] [CrossRef]
- Canovas-Garcia, F.; Alonso-Sarria, F. A local approach to optimize the scale parameter in multiresolution segmentation for multispectral imagery. Geocarto Int. 2015, 30, 937–961. [Google Scholar] [CrossRef] [Green Version]
- Chaudhuri, D.; Kushwaha, N.K.; Samal, A. Semi-Automated Road Detection From High Resolution Satellite Images by Directional Morphological Enhancement and Segmentation Techniques. IEEE J. Stars 2012, 5, 1538–1544. [Google Scholar] [CrossRef]
- Wang, M.; Yuan, S.G.; Pan, J. Building Detection in High Resolution Satellite Urban Image Using Segmentation, Corner Detection Combined with Adaptive Windowed Hough Transform. Int. Geosci. Remote Sens. 2013, 508–511. [Google Scholar] [CrossRef]
- Chen, C.T.; Su, C.Y.; Kao, W.C. An enhanced segmentation on vision-based shadow removal for vehicle detection. In Proceedings of the 2010 International Conference on Green Circuits and Systems (ICGCS), Shanghai, China, 21–23 June 2010; IEEE: Shanghai, China, 2010; pp. 679–682. [Google Scholar]
- Liu, G.; Zhang, Y.S.; Zheng, X.W.; Sun, X.; Fu, K.; Wang, H.Q. A New Method on Inshore Ship Detection in High-Resolution Satellite Images Using Shape and Context Information. IEEE Geosci. Remote Sens. Lett. 2014, 11, 617–621. [Google Scholar] [CrossRef]
- Liu, Y.; Bian, L.; Meng, Y.H.; Wang, H.P.; Zhang, S.F.; Yang, Y.N.; Shao, X.M.; Wang, B. Discrepancy measures for selecting optimal combination of parameter values in object-based image analysis. ISPRS J. Photogramm. 2012, 68, 144–156. [Google Scholar] [CrossRef]
- Cheng, J.H.; Bo, Y.C.; Zhu, Y.X.; Ji, X.L. A novel method for assessing the segmentation quality of high-spatial resolution remote-sensing images. Int. J. Remote Sens. 2014, 35, 3816–3839. [Google Scholar] [CrossRef]
- Costa, H.; Foody, G.M.; Boyd, D.S. Integrating User Needs on Misclassification Error Sensitivity into Image Segmentation Quality Assessment. Photogramm. Eng. Remote Sens. 2015, 81, 451–459. [Google Scholar] [CrossRef]
- Zhang, X.L.; Xiao, P.F.; Feng, X.Z.; Feng, L.; Ye, N. Toward Evaluating Multiscale Segmentations of High Spatial Resolution Remote Sensing Images. IEEE T Geosci. Remote 2015, 53, 3694–3706. [Google Scholar] [CrossRef]
- Su, T.F.; Zhang, S.W. Local and global evaluation for remote sensing image segmentation. ISPRS J. Photogramm. 2017, 130, 256–276. [Google Scholar] [CrossRef]
- Yang, J.; He, Y.H.; Caspersen, J.P.; Jones, T.A. Delineating Individual Tree Crowns in an Uneven-Aged, Mixed Broadleaf Forest Using Multispectral Watershed Segmentation and Multiscale Fitting. IEEE J. Stars 2017, 10, 1390–1401. [Google Scholar] [CrossRef]
- Moller, M.; Birger, J.; Gidudu, A.; Glasser, C. A framework for the geometric accuracy assessment of classified objects. Int. J. Remote Sens. 2013, 34, 8685–8698. [Google Scholar] [CrossRef]
- Tian, J.; Chen, D.M. Optimization in multi-scale segmentation of high-resolution satellite images for artificial feature recognition. Int. J. Remote Sens. 2007, 28, 4625–4644. [Google Scholar] [CrossRef]
- Clinton, N.; Holt, A.; Scarborough, J.; Yan, L.; Gong, P. Accuracy Assessment Measures for Object-based Image Segmentation Goodness. Photogramm. Eng. Remote Sens. 2010, 76, 289–299. [Google Scholar] [CrossRef]
- Persello, C.; Bruzzone, L. A Novel Protocol for Accuracy Assessment in Classification of Very High Resolution Images. IEEE T Geosci. Remote 2010, 48, 1232–1244. [Google Scholar] [CrossRef]


| Parameter | 2-m resolution panchromatic/ 8-m resolution multispectral camera | 16-m resolution multispectral camera | |
| Spectral range (μm) | Panchromatic | 0.45–0.90 | 0.45–0.90 |
| Multispectral | 0.45–0.52 | 0.45–0.52 | |
| 0.52–0.59 | 0.52–0.59 | ||
| 0.63–0.69 | 0.63–0.69 | ||
| 0.77–0.89 | 0.77–0.89 | ||
| Spatial Resolution | Panchromatic | 2 m | 16 m |
| Multispectral | 8 m | ||
| Width | 60 km (combination of two cameras) | 800 km (combination of four cameras) | |
| Revisit Period | 4 d | 2 d | |
| Coverage period | 41 d | 4 d | |
| Input: a series of segmentation results with the MRS from the initial scale (6) to the final scale (70) |
Procedure:
|
| Output: target scale parameters and corresponding segmentation results |
| Test | Method | OF | Scale |
|---|---|---|---|
| P1 | JSM | 0.6324 | 16 |
| WM ZM | 0.5543 1.8595 | 20 16 | |
| P2 | JSM | 0.5138 | 26 |
| WM ZM | 0.5846 1.8071 | 24 16 | |
| P3 | JSM | 0.5727 | 18 |
| WM ZM | 0.5978 1.9607 | 20 68 | |
| P4 | JSM | 0.6432 | 20 |
| WM ZM | 0.5730 1.9212 | 20 18 |
| First Scale Optimization (JSM, WM, ZM) | Second Scale Optimization (JSM, WM, ZM) | Third Scale Optimization (JSM, WM, ZM) | Fourth Scale Optimization (JSM, WM, ZM) | |
|---|---|---|---|---|
| P1 | 16, 20, 16 | 30, 36, 26 | 48, 50, 48 | 52, 58, 70 |
| P2 | 26, 24, 16 | 42, 48, 42 | 60, 64, 66 | —, —, — |
| P3 | 18, 20, 68 | 40, 36, 68 | 44, 46, — | 44, 52, — |
| P4 | 20, 20, 18 | 36, 34, 30 | 48, 54, 48 | —, —, — |
Publisher’s Note: MDPI stays neutral with regard to jurisdictional claims in published maps and institutional affiliations. |
© 2021 by the authors. Licensee MDPI, Basel, Switzerland. This article is an open access article distributed under the terms and conditions of the Creative Commons Attribution (CC BY) license (https://creativecommons.org/licenses/by/4.0/).
Share and Cite
Wang, J.; Jiang, L.; Qi, Q.; Wang, Y. Exploration of Semantic Geo-Object Recognition Based on the Scale Parameter Optimization Method for Remote Sensing Images. ISPRS Int. J. Geo-Inf. 2021, 10, 420. https://0-doi-org.brum.beds.ac.uk/10.3390/ijgi10060420
Wang J, Jiang L, Qi Q, Wang Y. Exploration of Semantic Geo-Object Recognition Based on the Scale Parameter Optimization Method for Remote Sensing Images. ISPRS International Journal of Geo-Information. 2021; 10(6):420. https://0-doi-org.brum.beds.ac.uk/10.3390/ijgi10060420
Chicago/Turabian StyleWang, Jun, Lili Jiang, Qingwen Qi, and Yongji Wang. 2021. "Exploration of Semantic Geo-Object Recognition Based on the Scale Parameter Optimization Method for Remote Sensing Images" ISPRS International Journal of Geo-Information 10, no. 6: 420. https://0-doi-org.brum.beds.ac.uk/10.3390/ijgi10060420