Article

Machine Learning and Geo-Based Multi-Criteria Decision Support Systems in Analysis of Complex Problems

1
Department of Mechanical, Energy and Management Engineering, University of Calabria, 87036 Rende, Italy
2
Department of Civil Engineering, University of Calabria, 87036 Rende, Italy
3
Department of Computer Engineering, Modelling, Electronics and Systems Engineering, University of Calabria, 87036 Rende, Italy
*
Author to whom correspondence should be addressed.
ISPRS Int. J. Geo-Inf. 2021, 10(6), 424; https://0-doi-org.brum.beds.ac.uk/10.3390/ijgi10060424
Submission received: 28 April 2021 / Revised: 14 June 2021 / Accepted: 18 June 2021 / Published: 21 June 2021

Abstract

:
Many complex problems require a multi-criteria decision, such as the COVID-19 pandemic that affected nearly all activities in the world. In this regard, this study aims to develop a multi-criteria decision support system considering the sustainability, feasibility, and success rate of possible approaches. Therefore, two models have been developed: Geo-AHP (applying geo-based data) and BN-Geo-AHP using probabilistic techniques (Bayesian network). The ranking method of Geo-APH is generalized, and the equations are provided in a way that adding new elements and variables would be possible by experts. Then, to improve the ranking, the application of the probabilistic technique of a Bayesian network and the role of machine learning for database and weight of each parameter are explained, and the model of BN-Geo-APH has been developed. In the next step, to show the application of the developed Geo-AHP and BN-Geo-AHP models, we selected the new pandemic of COVID-19 that affected nearly all activities, and we used both models for analysis. For this purpose, we first analyzed the available data about COVID-19 and previous studies about similar virus infections, and then we ranked the main approaches and alternatives in confronting the pandemic of COVID-19. The analysis of approaches with the selected alternatives shows the first ranked approach is massive vaccination and the second ranked is massive swabs or other tests. The third is the use of medical masks and gloves, and the last ranked is the lockdown, mostly due to its major negative impact on the economy and individuals.

1. Introduction

Analysis of complex real-world problems such as multi-criteria decision making and selecting the best choice from numerous alternatives requires different skills and data analysis in different forms [1,2]. The decisions made about the COVID-19 pandemic are among the most complex problems, and resolving the issues require not only experts’ opinions but also dynamic analysis of different databanks. COVID-19 (SARS-CoV-2) was characterized as a pandemic on 11 March 2020, affecting nearly all activities, such as political, global economic, and socio-cultural [3]. Health organizations’ main strategies were lockdowns, mandatory or self-quarantine, social distancing, travel bans, use of facemasks and gloves, swab tests, and vaccination [4]. There is evidence of the spread of COVID-19 by symptomatic and asymptomatic persons [5].
The use of medical facemasks is recommended to prevent the transmission of respiratory diseases [6]. Even homemade facemasks are recommended for protection since they can reduce droplets’ spread [7,8,9]. According to the analysis, medical facemasks can be considered as a complementary means of source control and not a replacement method for core preventive measures, such as lockdown, physical distancing, smart working, etc. Additionally, wearing facemasks may create false security for individuals [10]. Reports show that the production and ordering of facemasks by countries has increased to a million pieces per day [11].
The other method to confront the pandemic is by detecting positive cases. Thus, the use of swab tests is increasing in identifying symptomatic and asymptomatic cases [12]. The testing and detection of mild cases can affect all treatment processes [13]. Group testing is a fast method for large populations and could be efficient in the case of insufficient tests for all individuals [14]. Accurate systematic tests of COVID-19 are beneficial in controlling a pandemic [15], but the wrong tests could be worse than no tests since they would negatively affect the decision making [16,17]. Some non-pharmacological actions to control the pandemic include lockdown, border closure, and social distancing [18,19]. However, these types of actions are affecting nations economically and socially. Economic and sociological studies have shown that the pandemic has changed lifestyles and affected sustainable development [20,21,22,23]. Other study criteria include modeling of the outbreak [24,25,26], the impact of environmental factors, climate and UV [20,27,28,29], the role of mobility on the epidemic [30], characteristic and persistence resistance of SARS-CoV-2 [31,32], the dynamics of virus transmission [33,34], the veterinary perspective of the COVID-19 epidemic [35], the massive test methods [36], and the challenges around massive vaccination [37,38].
In this regard, due to the characteristics of real-life problems, this study aims to develop a geo-based multi-criteria decision support system considering probabilistic techniques for analysis sustainability, feasibility, and success rate (efficiency or probability of success) of approaches. In the case of COVID-19, many published papers have analyzed the pandemic from different viewpoints separately, such as health, vaccine, masks, and economics. However, the best decision depends on multi-variable analysis by involving all alternatives such as the hybrid analytic hierarchy process (AHP). Therefore, the research objective is to show the application of two developed models, Geo-AHP (by applying geo-based data) and BN-Geo-AHP using probabilistic techniques (using Bayesian network), and the role of machine learning in improving the results. This paper discusses an investigation of different approaches used in confronting the COVID-19 pandemic, their impact on sustainability (social, economic, environmental) beside their success rate, feasibility, acceptance rate by the society, and cost of each approach. The proposed hybrid-AHP methods can be applied in complex problems such as multi-criteria decision making, solving the issue of AHP validation, considering geo data, and machine learning in the analysis, and leading to better pairwise comparisons, rankings, and results.

2. Materials and Methods

In this study, we developed a multi-criteria decision support system confronting complex problems by considering the sustainability, feasibility, and success rate of approaches. According to the literature review analysis, the data type for analysis in a decision can be different. Some data are available in geo-based databanks, such as climate factors or population density, and some have a lot of uncertainty, such as healthcare breakpoint. In the case of COVID-19, mobility from one location to another affected the data resulting in the impact on healthcare capacity and correlated decisions, so that the use of a geo-based layer seemed necessary.
Due to the structure of these types of analysis, we developed two models, including Geo-AHP (by applying geo-based data) and BN-Geo-AHP using probabilistic techniques (by using Bayesian network). Since the provided methods in this study could be applied to prioritize the alternatives in a decision, at first, we generalized Geo-APH and provided the equations so that adding new elements and variables would be possible by experts. Then, we developed the application of the probabilistic technique of the Bayesian network in BN-Geo-APH and the role of machine learning for improving the database and the weighting of each parameter.
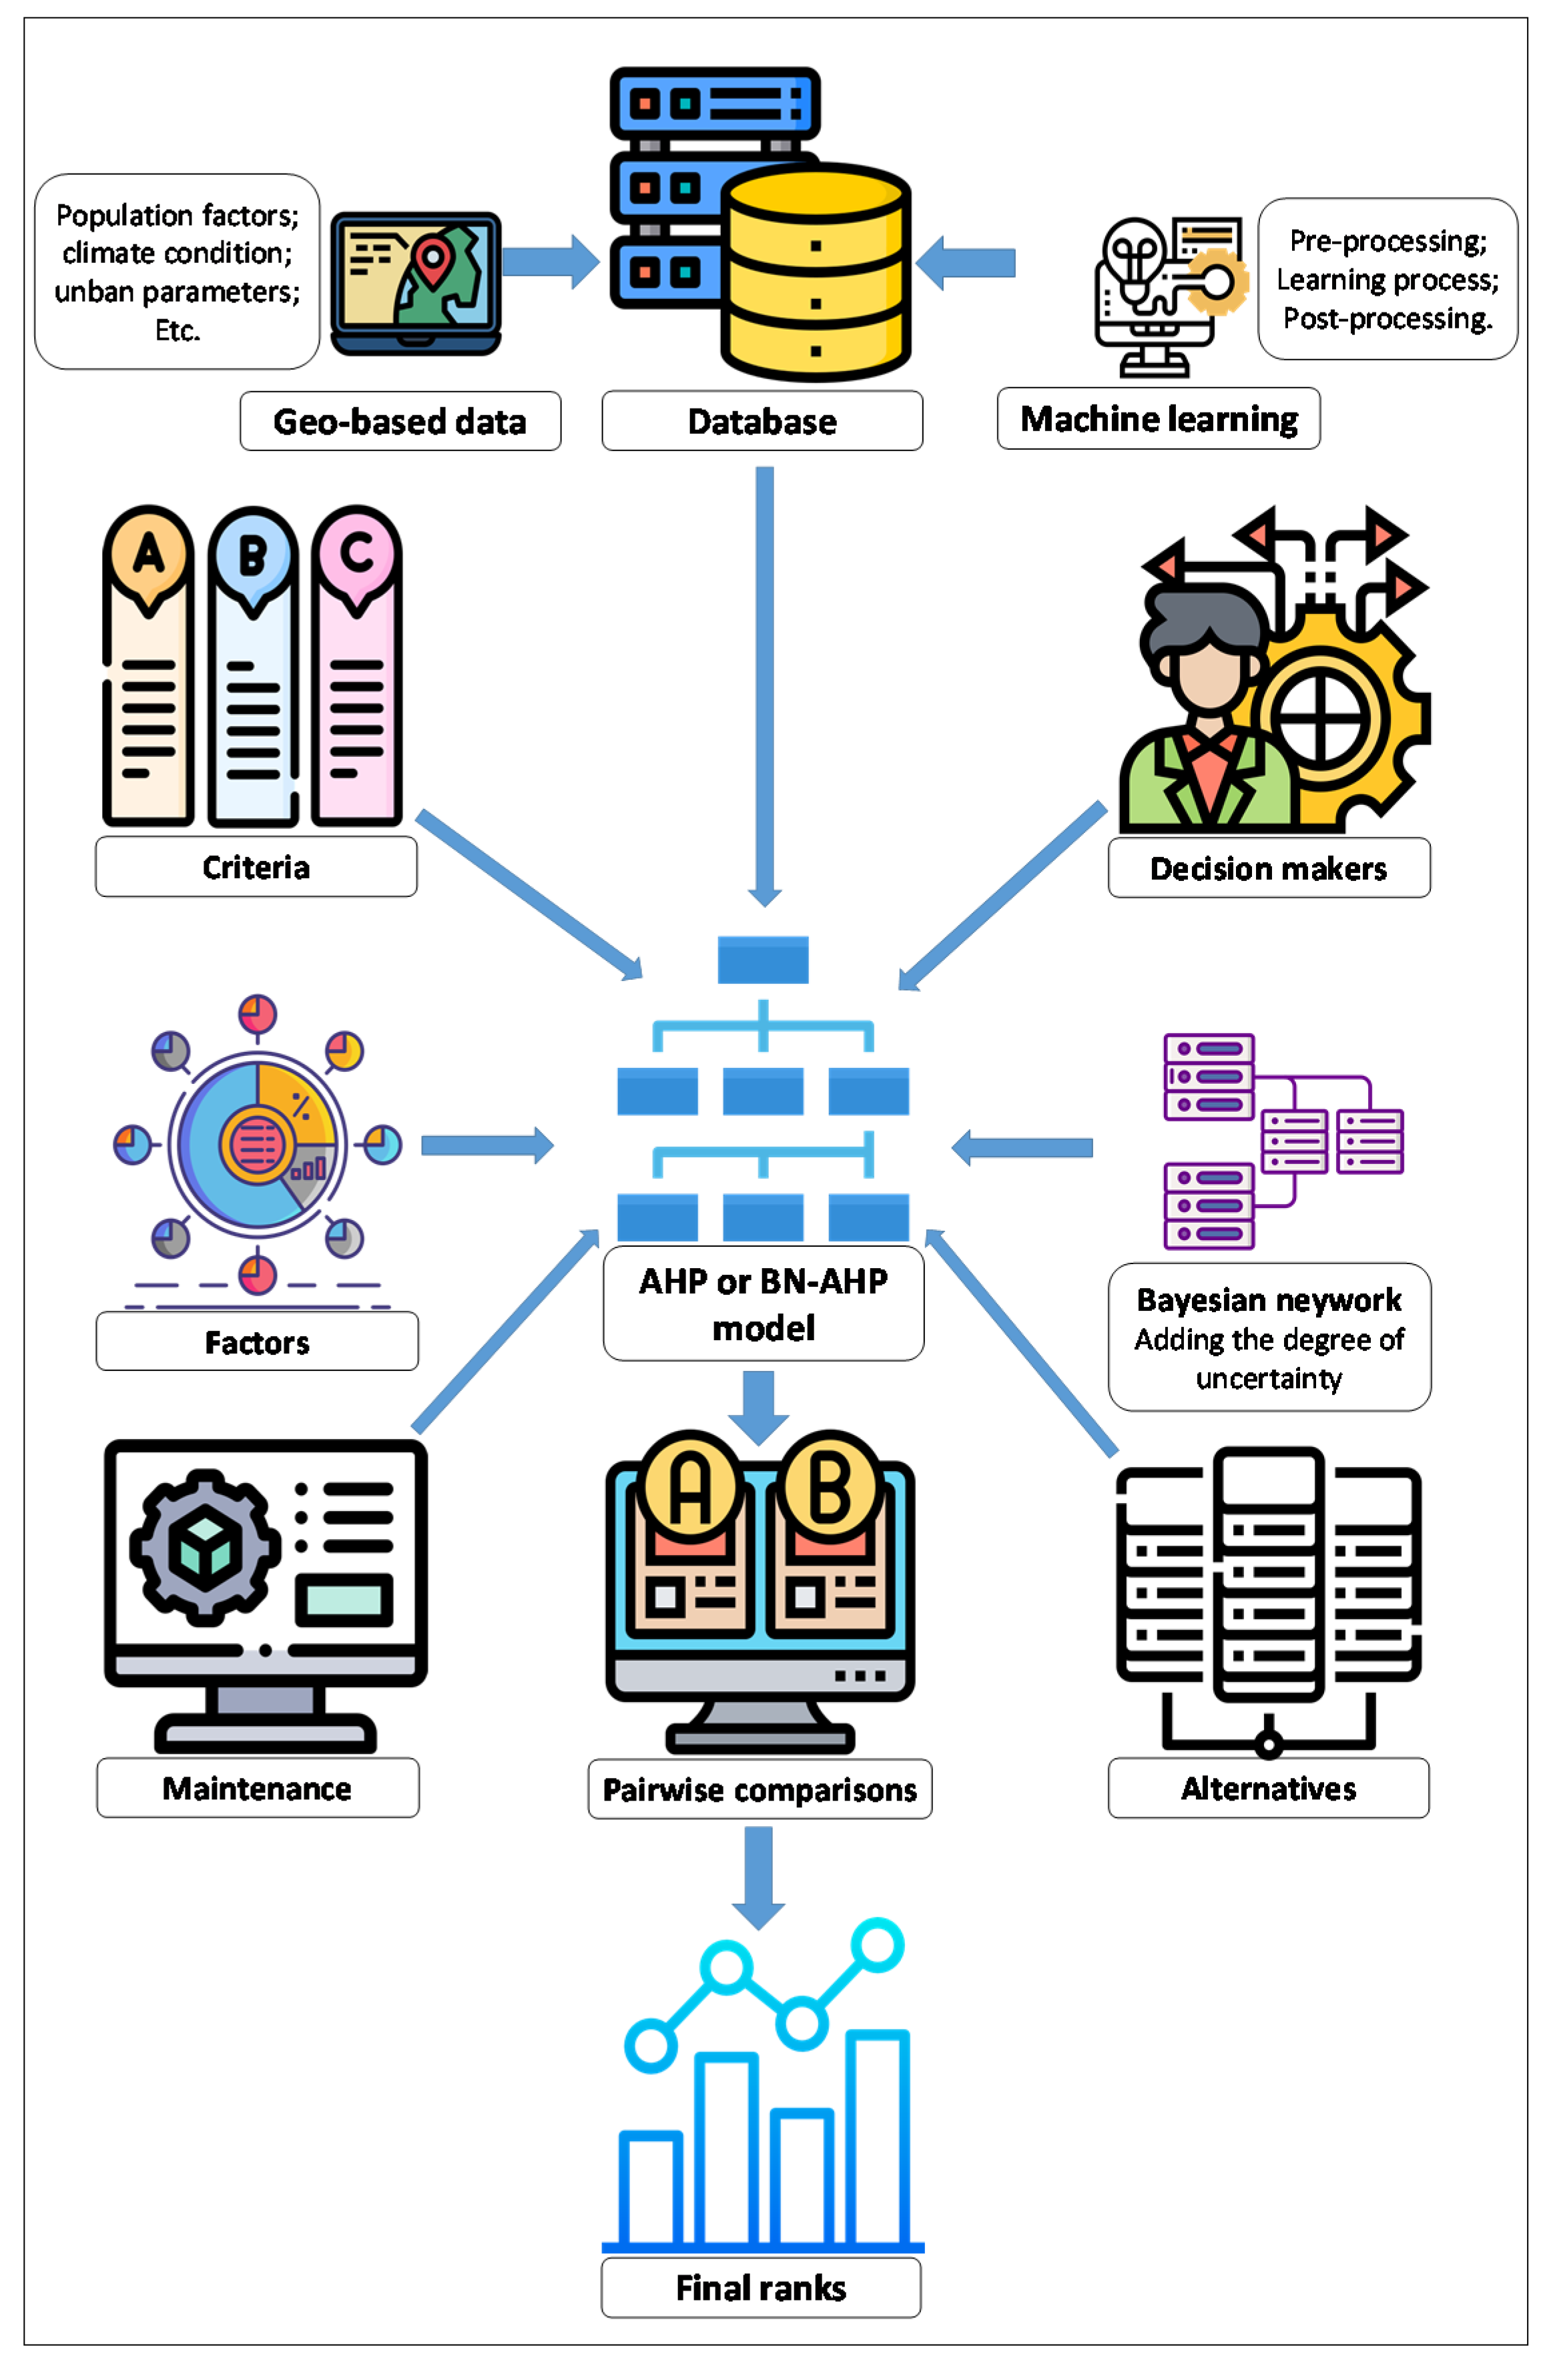
Finally, to show the application of the developed models, the new pandemic of COVID-19 that affected nearly all activities was selected for analysis. Therefore, the main approaches and alternatives in confronting the pandemic of COVID-19 containing geo data and the uncertainties were analyzed and ranked. For this purpose, the available data about COVID-19 and from previous studies about similar virus infections were used. In addition, the main approaches used in different countries to control the pandemic of COVID-19 and their economic and environmental impact were investigated. The analysis flowchart is shown in Figure 1.
According to the flowchart, at the heart of the system is hybrid-AHP (Geo-AHP or BN-Geo-AHP). The quantitative inputs are geo-based data such as population factors, climate conditions, etc., that might need data processing. The pre-processing of the database, the learning process based on the previous patterns, and post-processing can be carried out using machine learning methods. The qualitative inputs are criteria, alternatives, and decision makers. However, there are some uncertainties in the input data, and therefore, the Bayesian network can be applied. According to the step-by-step method in AHP, pairwise comparisons can be made, and the results would show the final rank of each parameter and the impact of alternatives on the final goal.

2.1. Analytic Hierarchy Process (AHP) Ranking Method

Mathematical and ranking methods are widely used in various fields [39,40,41,42] and prioritize decisions in many phenomena [43,44,45,46]. The method of AHP, which considers and evaluates alternatives, can be applied in decision-making problems [47,48]. In this method, different parameters that affect a decision need to be identified first and then can be categorized by their priority by comparing weights and scales. The geographical data is also an important part of some problems and could be added as a layer in the AHP method [49,50,51,52]. The weighting system can use simple numbers, fuzzy numbers, or triangular fuzzy numbers [53,54,55,56]. In the AHP method, the complex issue can be separated into several steps. Due to the complexity of COVID-19, which has various conditions alongside it, causing a more complex decision-making process, the AHP method has been selected for analysis. The main steps of the AHP method include the determination of parameters and layers, determination of the criteria of weights for comparisons, provision of an assessment matrix, calculation of the final scores, and ranking of the parameters [57]. The fundamental scale in AHP ranking is presented in Table 1.

Advantages, Disadvantages, and Weaknesses of AHP

The use of the AHP method changes a multi-criteria decision issue into a more organized structure of simple subjects. The main advantages of the AHP method are its usability, broad application in different fields such as engineering, medicine, and other sciences, and its reasonable system and structure [59]. Ranking by AHP does not require authentic information sets [60]. However, a weakly designed AHP could negatively affect the outcomes [61]. Human emotions may affect the judgments, and the AHP method cannot consider the available but uncertain judgements, resulting in an unrealistic rank and scale of the elements, in some cases [60]. Associated scales and pairwise comparisons in the AHP require sufficient knowledge about the subject. Otherwise, it could be confusing and might create a high level of inconsistency [62]. To improve the application of AHP, solve the issue of validation, and achieve better pairwise comparisons and ranking, one way is through group decisions or using questionnaires [63]. The other method is through a hybrid-AHP by combining the method with other analytical techniques [64], as we used in the current study.

2.2. The Concept of Bayesian Network

Decision making always has some degree of uncertainty due to the data, which could be quantitative, qualitative, or graphical [65,66,67,68]. To decrease and determine the uncertainty level, the scientific analysis can be combined with previous experiences in similar case studies, expert knowledge, and the Bayesian network [69,70]. A Bayesian network (BN) is a probabilistic graphical model (GM) that represents the causal relationship between variables [71].
BNs include three elements as following [72]:
  • A set of “nodes” that represent key variables;
  • A set of “links” representing dependency between the nodes;
  • A set of “probabilities” representing the given state of the nodes.
BNs are a combination of graph theory, probability theory, statistics, and computer science. According to the Bayesian theorem, the uncertainty of event A can be defined with a probability P(A), which means the probability of occurrence or non-occurrence. In fact, P(A) can be computed in the Bayesian theorem using information with uncertainties. The basic Bayesian theorem can be defined with conditional probability representing an event A given event B is as follows [73]
P ( A | B ) = P ( A ,   B ) P ( B )
P(A,B): the probability of occurrence of both events A and B.
P(B): the probability of occurrence event B.
P(A|B): the condition probability (The probability of occurrence A once B has actually occurred).
If P(B|A) demonstrates the probability of occurrence B once A has occurred, then the relationship of the conditional probabilities P(A|B) and P(B|A) can be given
P ( B | A ) = P ( A | B ) × P ( B ) P ( A )
P(A): the probability of occurrence event A.
The Bayesian network is an expansion of the Bayesian theorem over a set of random variables. The equation of a BN for each x i of X i conditioned on π i , is as follows
P B ( X 1 , X 2 , , X n ) = i = 1 n P B ( X i | π i )
X 1 ,   X 2 ,   ,   X n : random variables.
P ( x i | π i ) : the condition probability.
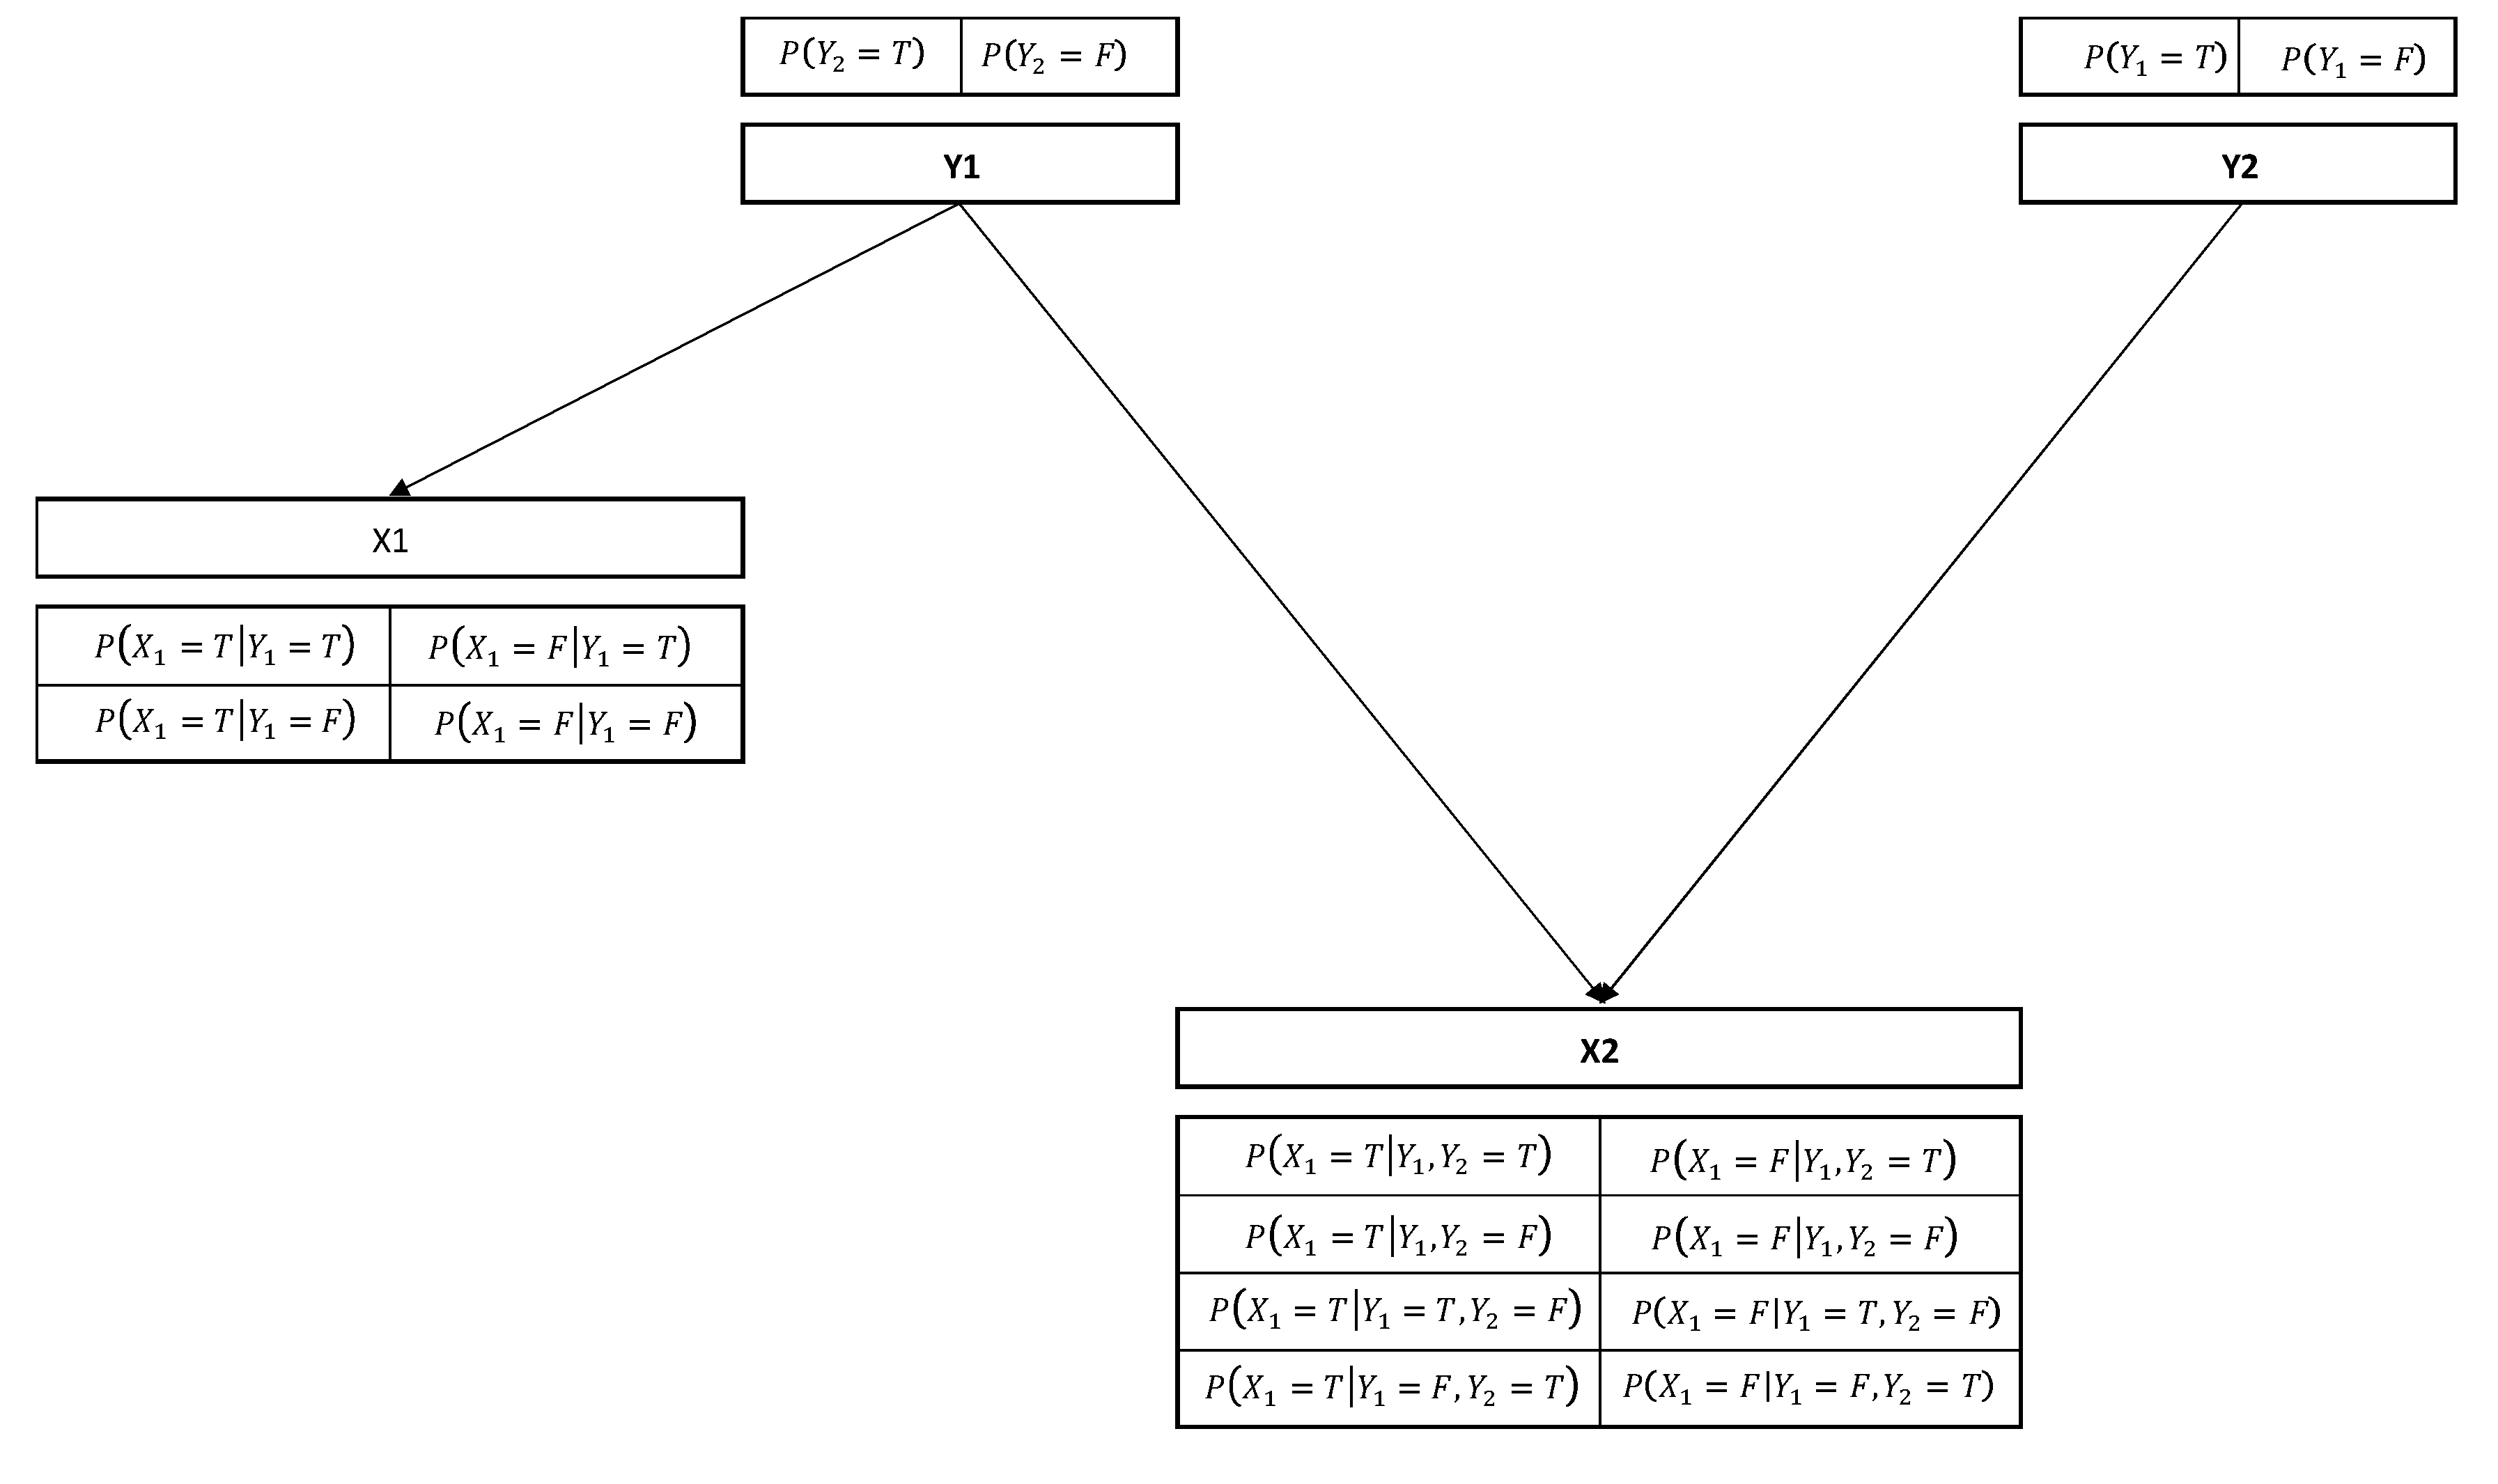
A Bayesian network containing local conditional probability tables (CPTs) are shown in Figure 2. In this Figure, T means true, F means false, and X1 and X2 depend on Y1, Y2. These variables are the nodes in BNs.

2.3. The Role of Machine Learning in Bayesian Networks

Machine learning techniques can be applied to maximize the performance of collected data from multiple networks. The previous patterns in recoded events can be determined by machine learning and could be applied in the future analysis [74]. The conditional probabilities could be based on experimental or field data, outputs of process-based models using machine learning/artificial intelligence, or by an expert’s judgment [75]. In this way, in analysis of probabilistic techniques such as BNs, machine learning methods can be used to characterize the database and predict the behavior [76]. The main roles of machine learning include pre-processing of the database, the learning process based on the previous patterns, and post-processing to generate the rules [77]. In this way, probabilistic techniques used by machine learning methods could help to solve the given training data and prior information (e.g., expert knowledge, casual relationships), and estimate the parameters of the conditional probability tables (CPT).

2.4. The Impact of the COVID-19 Pandemic and the Main Methods Used to Confront It

To be able to define the layers and variables in a multi-criteria decision support system, in this section we analyzed the different effects of the COVID-19 pandemic and the main controlling approaches by different countries.

2.4.1. The Impact of the Pandemic on Economy

The COVID-19 crisis has changed the lives of 7.8 billion people and affected numerous economic activities. Global trade declined due to the pandemic in 2020 by about 9% [78]. People facing food crises doubled, and income decreased by 60% for about 1.6 billion workers [79]. Global GDP declined by 3.9% in 2020, and potential income loss was significant in many countries. Airlines lost approximately USD 370 billion in 2020 worldwide [80,81]. The growth projections for many countries in 2020 were negative such as −5.9 for the U.S., −7.2 France, −9.1 Italy, −6.5 UK [82]. The analysis of different scenarios shows that this pandemic could cost the global economy up to USD 2.7 trillion [83]. According to a World Bank analysis report, global economic growth in 2020 was the lowest since World War II [84]. The European Union (EU) announced a recovery fund of about EUR 1.5 trillion [85], and the U.S. announced a recovery program of USD 700 billion in March 2020, and a loan budget of USD 2.3 trillion to support small businesses [86].
Tourism and related activities are among the highest affected sectors. Due to the pandemic, international tourism decreased by about 60–80% in 2020, which means a loss of about USD 850 billion [87]. The impact of this huge decrease may remain for several years [88]. Finally, between 3.5 and 7% of global GDP depends on the blue economy, from coastal tourism to fisheries and sea transports, which the pandemic could heavily affect and decrease [89].

2.4.2. The Coronavirus Vaccine, Investments, and Vaccine Efficiency

The problem of producing an effective vaccine with the lowest side effects is very important, and is one of the possible methods to control a pandemic. More than 150 countries joined into COVAX Facility for a COVID-19 vaccine. COVAX partners’ goal is to deliver two billion doses of vaccines for high-risk groups by the end of 2021 [90]. Researchers are working on more than 165 vaccines, and, up to 24 July 2020, more than 140 vaccines were at the preclinical stage, about 27 at the stage of human trials, 19 were in phase I, 13 in phase II, 4 in Phase III, and 1 was approved for limited use [91]. After two months, huge progress had been made as, on 30 September 2020, 28 vaccines were in phase I, 14 in phase II, 11 in Phase III, and five were approved for limited use. After about 6 months, in April 2021, 4 vaccines had been abandoned, 49 vaccines were in phase I, 35 in phase II, 27 in Phase III, 5 were approved for limited use and 8 vaccines were approved for full use [91] and more than 1 billion doses of vaccine had been used worldwide [92].
The major projects and investments by different countries and international banks focused on the COVID-19 vaccine are presented in Table 2.
As can be seen in Table 2, a huge investment has been made so far in different countries. However, several issues still remain for the massive vaccination in all countries including production of enough doses, the storage, transportation, and distribution of vaccines worldwide which need greater effort, organization, and trained staff.
The U.S. biomedical advanced research and development authority (BARDA) invested over USD 2.1 billion in May 2020, developing the COVID-19 vaccine both by US-based and international companies [94]. The U.S. investment in the COVID-19 vaccine has increased and reached USD 8 billion in August 2020 [100] and nearly USD 10 billion in March 2021 [119].
By May 2020, the global campaign budget increased to EUR 9.8 billion [120]. Germany, Italy, France, and the Netherlands invested about EUR 750 million (USD 843.2 million) for 300 million doses of the potential vaccine by AstraZeneca (Oxford University). The share of Italy for 75 million doses was EUR 185 million [116]. Germany-based BioNTech and Pfizer aim to provide more than 1.3 billion doses in 2021 [99,108]. The US-based company of Janssen is aiming to produce 1 billion doses of vaccine Ad26.COV2.S in 2021 [98]. Chinese-based Sinovac Biotech started the limited use of the vaccine from early 2021 [121]. Sanofi is planning to deliver up to one billion doses of vaccine in 2021 [100].
The threshold to stop spreading the virus through immunity by a new vaccine is about 60–70%, which means billions of people. The prioritization for delivering the COVID-19 vaccine were different in each country. Some started the vaccination from the high-risk groups such as healthcare workers and older people and some started just based on age. It would be unrealistic to expect a COVID-19 vaccine with 100% effectiveness. However, the analysis shows a vaccine with 50% effectiveness could be a game-changer [122,123]. For the COVID-19 vaccine, there are still uncertainties about the possibility of reinfection and duration of immunity, and the efficiency of vaccines for symptomatic infection hospitalization are different; besides new mutations could affect their efficiency [124].
While the effectiveness of new vaccines is unknown [95], one can refer to studies about the vaccine for another type of Coronavirus, influenza (flu) [125,126,127]:
  • The vaccine effectiveness (VE) can vary and depends on the variety, as the efficiency of flu vaccines for influenzas type A (H1N1) and B are better than type A (H3N2);
  • If the flu vaccine is well matched with most circulating seasonal flu viruses, the total flu risk can be reduced to 40–60%;
  • The monitoring of vaccine effectiveness for the three different influenzas showed, in general, the success rate was between 30 and 60%.
In 2018/2019, about half of adults and 68% of people aged over 65 in the U.S. used the flu vaccine. However, according to the Centers for Disease Control and Prevention (CDC), seasonal flu vaccines’ effectiveness in 2018-2019 was about 29%, whereas, in previous years, it was typically about 50% [128]. Moreover, for influenza, which has a clear transmission season, the vaccine needs to be updated annually, and more development is required [129]. Whereas the flu vaccine’s effectiveness is about 40% to 60% [122], the measles vaccine’s effectiveness is about 95%–98% [130]. Based on the previously infected population, the analysis determined that a vaccine with an efficacy of about 60% could stop the pandemic, but it is likely that social distancing and mask wearing would still have to continue [130]. The required vaccine efficacy for managing the pandemic of 60% is, for the moment, dependent on vaccination coverage being 100%. The required efficacy rises to 70% and 80% when the vaccination coverage drops to 75% and 60%, respectively. The efficacy of at least 80% might be required to stop any other measures being needed [131].
Reinfection and immunity failure are other critical factors, as a new study shows 140 days of immunity from the first infection in patients [132]. Mutations of SARS-CoV-2, which can cause the virus to elude antibodies, are another issue. Researchers have already found several mutations in the virus worldwide, which have not been recognized by neutralizing antibodies [133]. Finally, to achieve a sufficient immunity level, the majority of the population need to be vaccinated. The immunity cannot be achieved if just two-thirds of the population take a vaccine with 70% to 75% efficacy [134].
Therefore, the vaccines’ success rate depends on their effectiveness and the percentage of the vaccinated population that is high enough to break the transmission chains.

2.4.3. Medical Face Masks, Gloves, and the Environmental Issues

Studies show that public face masks could be an effective way to reduce virus spread [135,136]. The widespread use of medical face masks reduce the transmission rate, and even non-medical masks can block some parts of contaminated droplets [137,138]. The assessment of using medical face masks (type N95) in the context of influenza showed that if they were used by about 80% of the population, the outbreak could be eliminated [139]. The first recommendations were using N95 (or FFP2) for health workers in aerosol-generating procedures and surgical masks for non-aerosol generating procedures [140]. However, recently use of two masks has also been recommended by some analysis [141,142]. While estimations showed the required annual masks just for medical workers would be billions, the storage capability in some countries is less than 1% of the requirements [143], showing the high issues for mask producers. Masks production needs an industrial chain from basic industries, chemical, and textile to metallurgy and electronics industries. The cost of medical masks has increased severely since the start of the pandemic. Medical facemasks are produced mainly from polymers such as polyurethane, polyacrylonitrile, polypropylene, and polyester [144], and consist of three layers as follow [145]:
  • The inner layer (soft fibers);
  • The middle layer (the main filtering layer produced from the melt-blown filter);
  • The outer layer (Nonwoven fibers, which are usually colored and water-resistant).
Microplastics, including single-use polymeric materials and plastic packaging materials, are a significant source of environmental pollution threatening aquatic lives and raising concerns on global food safety [146]. The increase in medical masks creates a new environmental challenge, and the materials of different types of medical masks have been reported in oceans [147]. One study showed that using single-use mask could create 66,000 tons of plastic waste in one year [148]. Furthermore, the same issue exists for hand sanitizers and gloves since, after the pandemic, these affect the environment in the same way as face masks.

2.4.4. COVID-19 Tests Characteristics and Advantages

By COVID-19 tests, it is possible to trace and isolate positive cases, thus counting as a way to control the pandemic. The recommendation of the World Health Organization (WHO) is to test every suspected cases, and to consider testing and isolation as the most effective ways to break the transmission chain [149]. The key in control of the SARS-CoV-2 pandemic is restricting the spread of the virus by rapid and massive testing [150,151]. Concerning testing methods, sensitivity and accuracy are key issues that vary significantly from one test to another test or manufacturer. Different types of tests that can be used for COVID-19 are as follow:
  • Serology test: this test can be completed in 20–30 min using a few drops of blood to determine the possible presence of coronavirus antibodies (proteins produced by the immune system to neutralize bacteria/viruses) in the human body. The antibodies take around eight days to develop and to appear in the blood. Therefore, in the early stage of infection, the result can be falsely negative. However, this test is accurate after around the eighth day of infection. This test’s advantages are its low cost and it does not require specially trained staff [149]. The antibodies may remain in the blood for several weeks after recovery, and this can identify previous positive cases that might have immunity in the future. However, the duration and percentage of immunity are not confirmed yet [152].
  • RT-PCR and NAT tests: this direct test aims to determine whether the virus produced antibodies because of infection. In molecular tests such as nucleic acid test (NAT) and reverse transcription-polymerase chain reaction (RT-PCR), the genetic material of COVID-19 can be detected. In both RT-PCR and NAT tests, a nasal or throat swab is used, and positive cases can be identified on the first day of infection. The cost of RT-PCR (about five to six hours to test the samples) is around ten times more than the antibodies test and two times more than NAT (about an hour). The NAT test, which can be ready in one hour, is accurate and does not need trained staff or a special lab. However, doing the RT-PCR test, which is more expensive than NAT, requires highly qualified staff to collect the samples and to do the test, and the result may take around one day [149,152]. However, the results of the test might take longer due to the high number of tests, and a late result could negatively affect the control approaches, such as the isolation of positives cases at the moment of infection.
  • Antigen test: the antigen test can detect the specific proteins on the virus’ surface. The antigen test method is through nasal or throat swab, and the result can be ready in about one hour. This test’s positive result is highly accurate, but the negative result might need confirmation by another methods, such as a molecular test [149,152].
  • Diagnostic test: another type of test is the diagnostic test, such as saliva tests, which can be done by analyzing spit instead of throat swab, and it is more comfortable for people and health workers since no close contact is required [152].
To increase the number of tests for a large population, and in the case of insufficient availability of tests for all individuals separately, the method of group testing or pooled testing (multiple individual tests together) can be applied [14]. If the result of a pooled test becomes negative, it means all individuals in the group are negative, and if the test result shows positive, all individuals in that group need to be tested separately [149]. However, the pooling test might not be a solution of RT-PCR since the effectiveness and the error level is still high and could be used for a pre-analysis.
The number of tests by country depends on several factors such as the financial condition, laboratory capacity, trained staff, and available test options. The manual test systems require special kits, devices, and chemical reagents, and the countries that produce the tests are mainly using them for domestic purposes. Automated test units can solve the need for trained staff, but the cost of the units is high. Global organizations are trying to reduce the price of test machines and the required materials [153]. Swabs for the COVID-19 test are made using a long and thin plastic with a synthetic fiber. However, the total swabs production of different countries is not clear [154,155].
More tests result in higher pandemic control successes, and any delay in doing tests can cause more spread of the virus. Accurate testing requires several processes including test kits, nasal swabs, chemical reagents, lab authorization for doing tests, PCR machines, laboratory technicians, and report system [156].
Since the production number is much less than expected, the use of 3D printers could increase production and decrease the cost [157]. The swab production chain could be established in two weeks and would make a scalable and cost-effective swab [158]. The new developed swab test can provide a molecular test result after less than 30 min, and the cost per person would be around USD 5 [159].

3. Results and Discussion

3.1. Developing Models and Ranking of the Approaches

In this section, first we developed and generalized the ranking Geo-AHP method so it would be possible to add new criteria and alternatives by experts. Then, we showed the application of the developed model for the analysis and ranking of the main approaches and alternatives in confronting the pandemic of COVID-19. Finally, we applied the probabilistic techniques in BN-Geo-APH, demonstrated its application, and compared the results.

3.1.1. Generalized Geo-APH Approach for Comparison of the Decision Ranks

A. Computing the normalized weight for components of criteria:
The pairwise comparison matrix of the components in the layer of criteria is presented in Table 3.
In Table 3, supposing x p ,   q is the pairwise comparison of criteria p and q, then
for   p ,   q = 1 , , n   a n d   p q :     x q ,   p = 1 x p ,   q     for     p = q :     x p ,   q = x q ,   p = 1
The normalized weight can be calculated in 4 steps, Equations (5) to (8):
Step 1: calculation of M q (the sum of the values of the qth column for q = 1 , ,   n in Table 3)
for   q = 1 , ,   n :           M q = p = 1 n x p ,   q
Step 2: calculation of N p ,   q , for q = 1 , ,   n
for   p = 1 , ,   n :                       N p ,   q = x p ,   q M q
Step 3: calculation of the normalized weight for all criteria w p
for   p = 1 , ,   n :           w p = q = 1 n N p ,   q n
Step 4: the weight vector of the component for criteria will be
w = ( w 1 , , w n ) T
The evaluation of the results can be done by computing the consistency ratio (CR) for the pairwise comparison matrix of the component of criteria. The CR of the pairwise comparison matrix can be calculated according to Equations (9) to (13) [160]:
Calculation of v p
for   p = 1 , ,   n     v p = q = 1 n x p ,   q w q
Calculation of λ p
for   p = 1 , ,   n     λ p = v p w p
Calculation of λ m a x
λ m a x = λ 1 + + λ n n
Consistency index (CI)
C I = λ m a x n n 1
Consistency ratio (CR)
C R = C I R I
where RI is the Random Consistency Index and its value is presented in Table 4.
If CR ≤ 0.1, the level of inconsistency is acceptable. Otherwise, the inconsistency is high, and, to achieve better consistency, a re-estimation for the element of x p ,   q might be required.
B. Computing the normalized weight for components of decision makers
The pairwise comparison matrix of the components of decision makers concerning different components of criteria is presented in Table 5.
In Table 5, supposing D p ,   q i is the pairwise comparison of decision maker p, q = 1, …, m, concerning the ith component of criteria (i = 1, …, n), then
for   p q :     D q ,   p i = 1 D p ,   q i   and   for     p = q :     D p ,   q i = D q ,   p i = 1
With an algorithm similar to the mentioned steps 1 to 5 in the past section, the normalized weight of decision makers concerning different components of criteria can be calculated, and the weight vector is as follows
w i = ( w 1 i , , w m i ) T
where w j i = weight of the jth component of the decision makers (j = 1, …, m), under the ith component of criteria (i = 1, …, n).
C. Computing the normalized weight for components of factors (geo-based data)
The pairwise comparison matrix for the components of factors (geo-based data) concerning different components of decision maker is presented in Table 6.
In Table 6, supposing F p ,   q j is the pairwise comparison of factor p, q = 1, …, l, concerning the jth components of decision makers (j = 1, …, m), then
For   p q :     F q ,   p j = 1 F p ,   q j and   for     p = q :     F p ,   q j = F q ,   p j = 1
With an algorithm similar to the mentioned steps 1 to 5 in the past section, the normalized weight of factors concerning different components of decision makers can be calculated, and the weight vector is as follows:
w j = ( w 1 j , , w l j ) T
where w f j = weight of the fth component of the factors (f = 1, …, l), under the jth component of decision makers (j = 1, …, m).
D. Computing the normalized weight of components for alternatives
The pairwise comparison matrix of the components of alternatives concerning different components of factors is presented in Table 7.
In Table 7, supposing A p ,   q f is the pairwise comparison of alternative p, q = 1, …,t, concerning the fth component of factors (f = 1, …, m), then
for   p q : A q ,   p f = 1 A p ,   q f     and   for   p = q : A p ,   q f = A q ,   p f = 1
With an algorithm similar to the mentioned steps 1 to 5, the normalized weight of alternatives concerning different components of factors can be calculated, and the weight vector is as follows
w f = ( w 1 f , , w t f ) T
where w k f = weight of the kth component of the alternatives (k = 1, …, t), under the fth component of factors (f = 1, …, l).
E. Relative importance coefficient (RIC) of alternatives concerning the goal
The total aggregated score for each component of alternatives (k = 1, …, t) concerning the goal can be calculated as follows
( R I C ) k = i = 1 n w i ( j = 1 m w j i ( f = 1 l w f j ( w k f ) ) )
Therefore, the relative importance coefficient (RIC) can determine each alternative’s final rank by considering all the upper layers’ components.

3.1.2. Application of the Developed Geo-AHP in Ranking of Decisions to Control the COVID-19 Pandemic

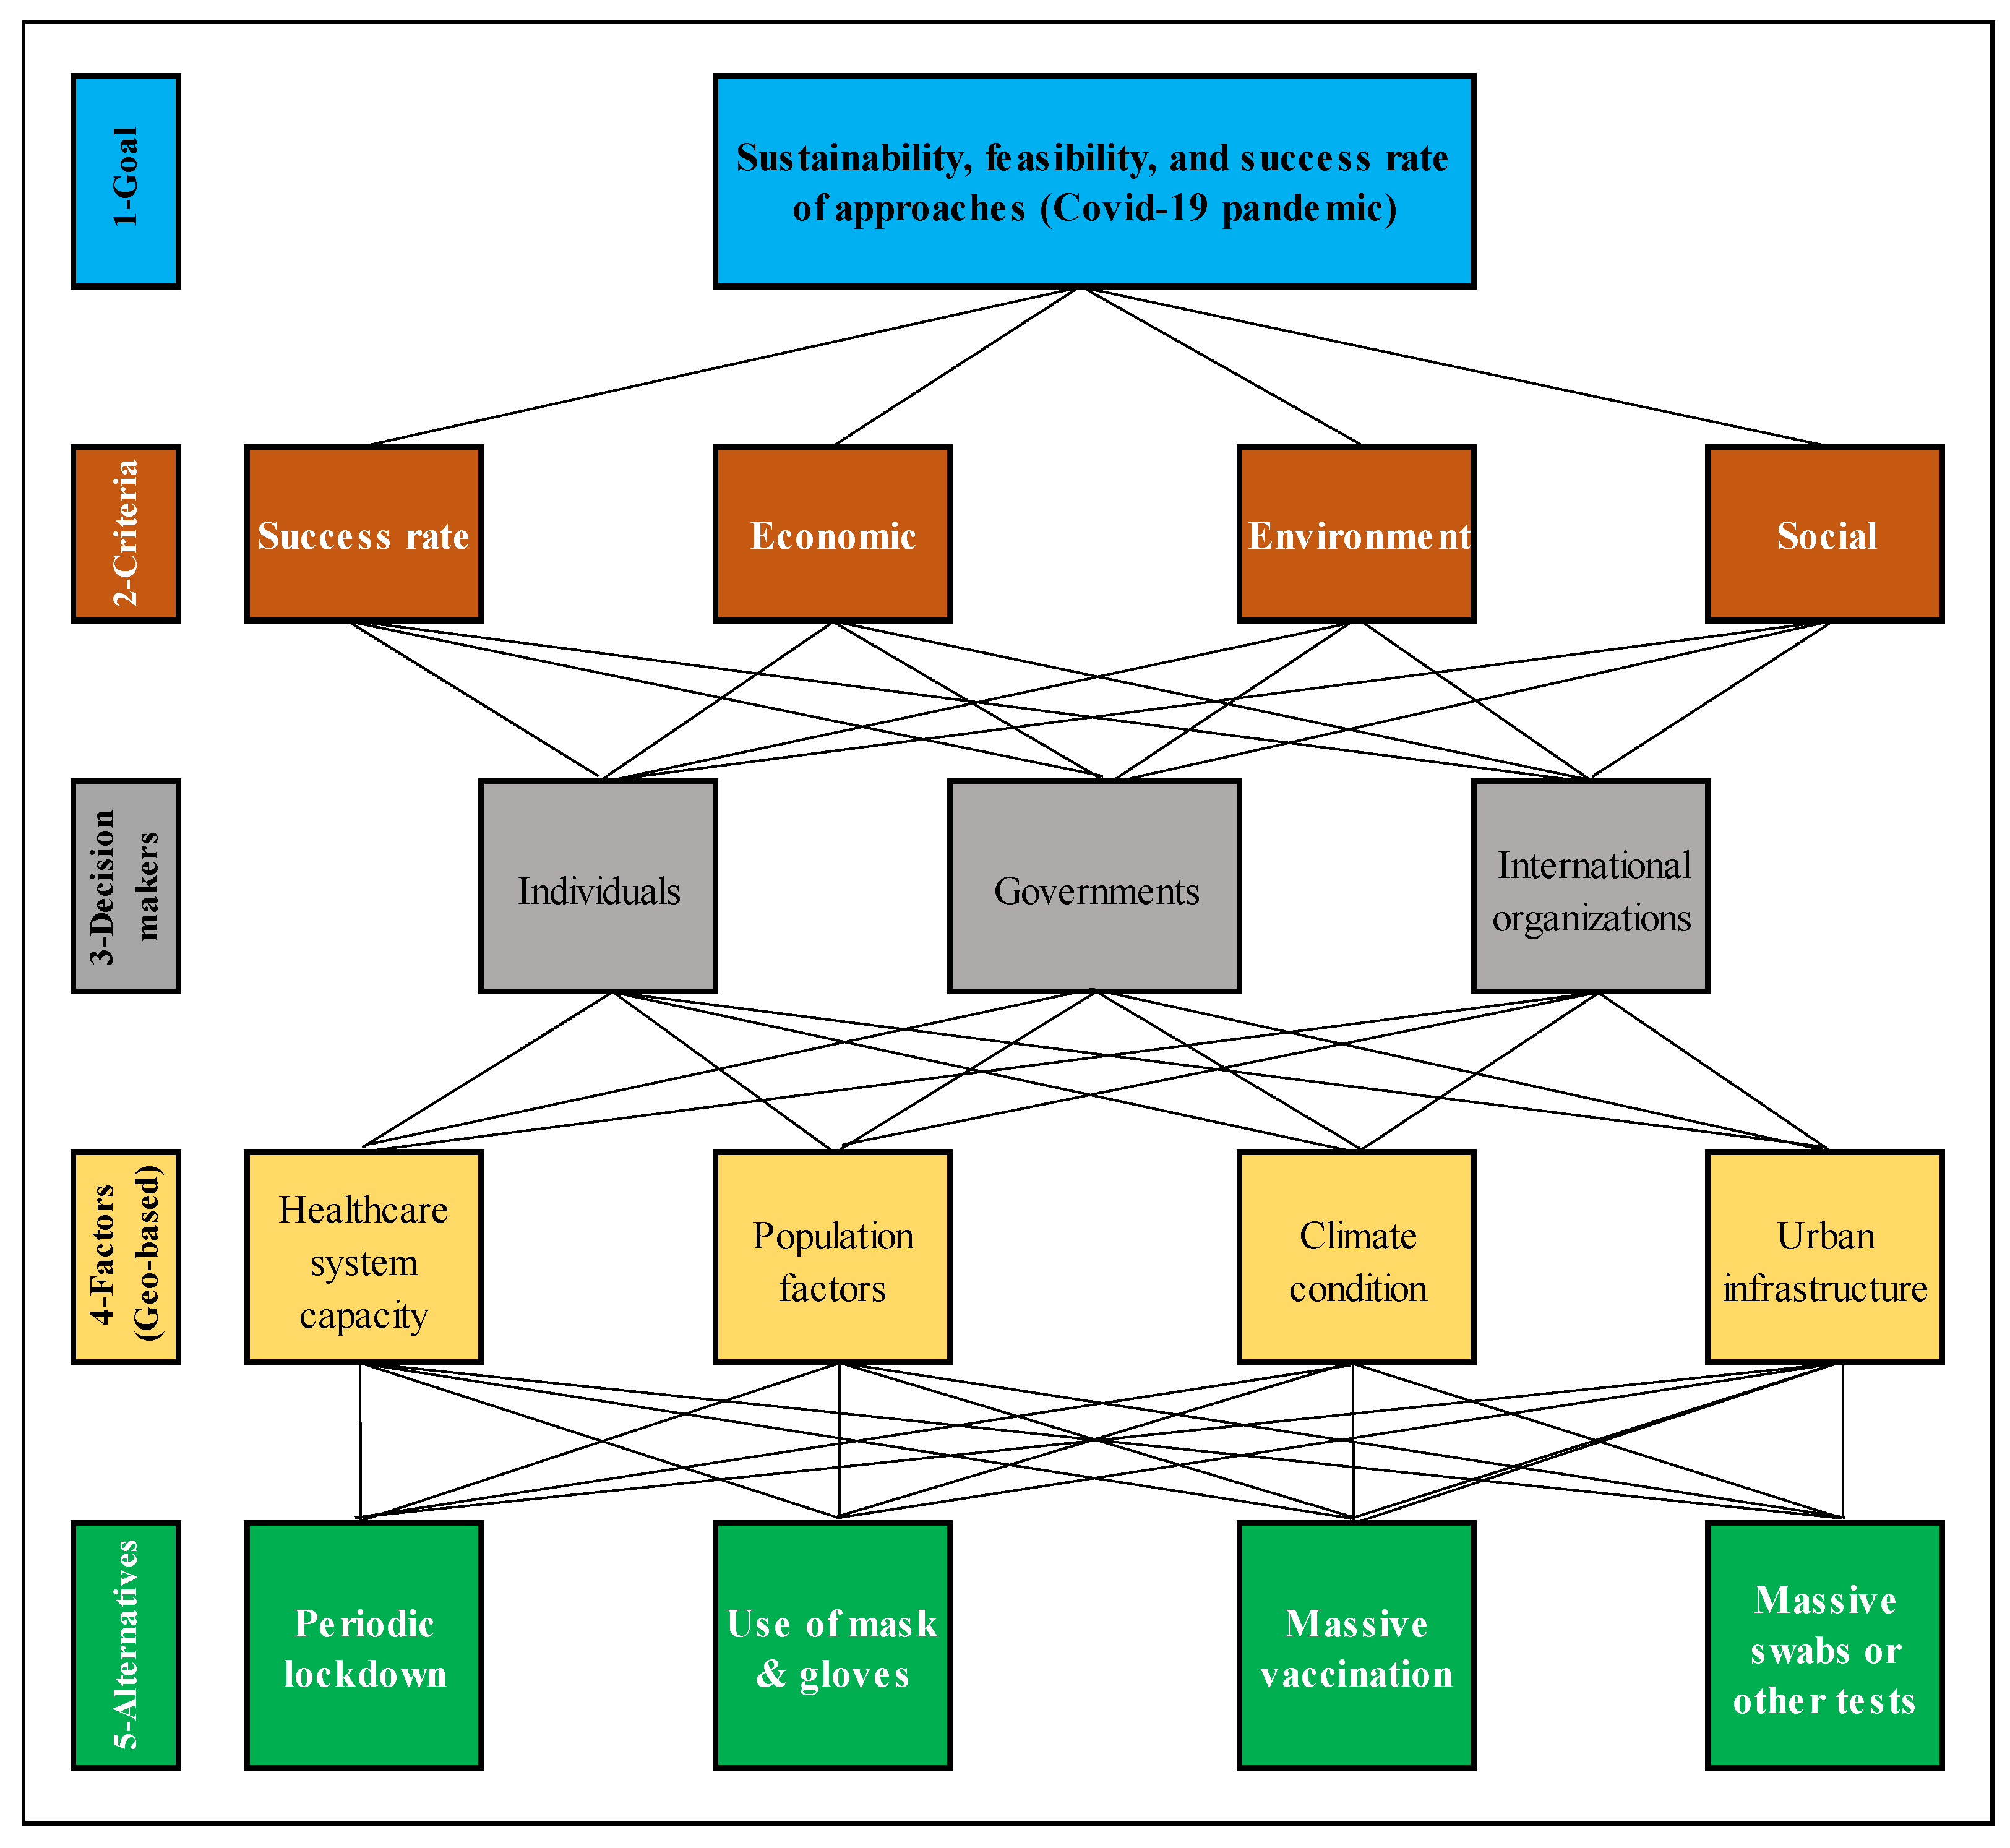
The developed Geo-AHP for ranking of decisions is based on the literature reviews’ findings to control the COVID-19 pandemic and is shown in Figure 3.
The determined layers in our Geo-AHP are:
  • Layer 1 (goal): sustainability, feasibility, and success rate of approaches (in our case means the end of pandemic and sustainable development);
  • Layer 2 (criteria): including success rate, economic, environmental, and social;
  • Layer 3 (decision makers): three decision makers including individuals, governments, and international organizations;
  • Layer 4 (factors): four geo-based factors including healthcare capacity, population factors (density, average age, etc.), climate condition, and urban infrastructure;
  • Layer 5 (alternatives): periodic lockdown, use of mask and gloves, massive vaccination, and massive swabs or other tests.
The parameters in different approaches were analyzed based on previous case studies about similar diseases and the current pandemic (literature review) and compared as pairs (two items) to be scaled under special consideration. The pairwise comparison matrices for the developed Geo-AHP are presented in Table 8, Table 9, Table 10 and Table 11.
The pairwise comparison matrices were completed according to the literature review analysis. First, different criteria were scaled by considering the goal, and then decision makers were scaled by considering the criteria. In the next step, the geo-based factors were weighted according to decision makers and finally, the alternatives weights were determined from the viewpoint of geo-based factors. Therefore, it would be possible to see the impact of alternatives on the final goal. According to the pairwise comparison matrices, the approaches’ final rank was evaluated, and the results are presented in Table 12. The first ranked approach was massive vaccination and the second was massive swabs or other testing. The third rank was the use of facemasks and gloves, and the final rank was periodic lockdown, mostly due to the major negative impacts on the economy and individuals.

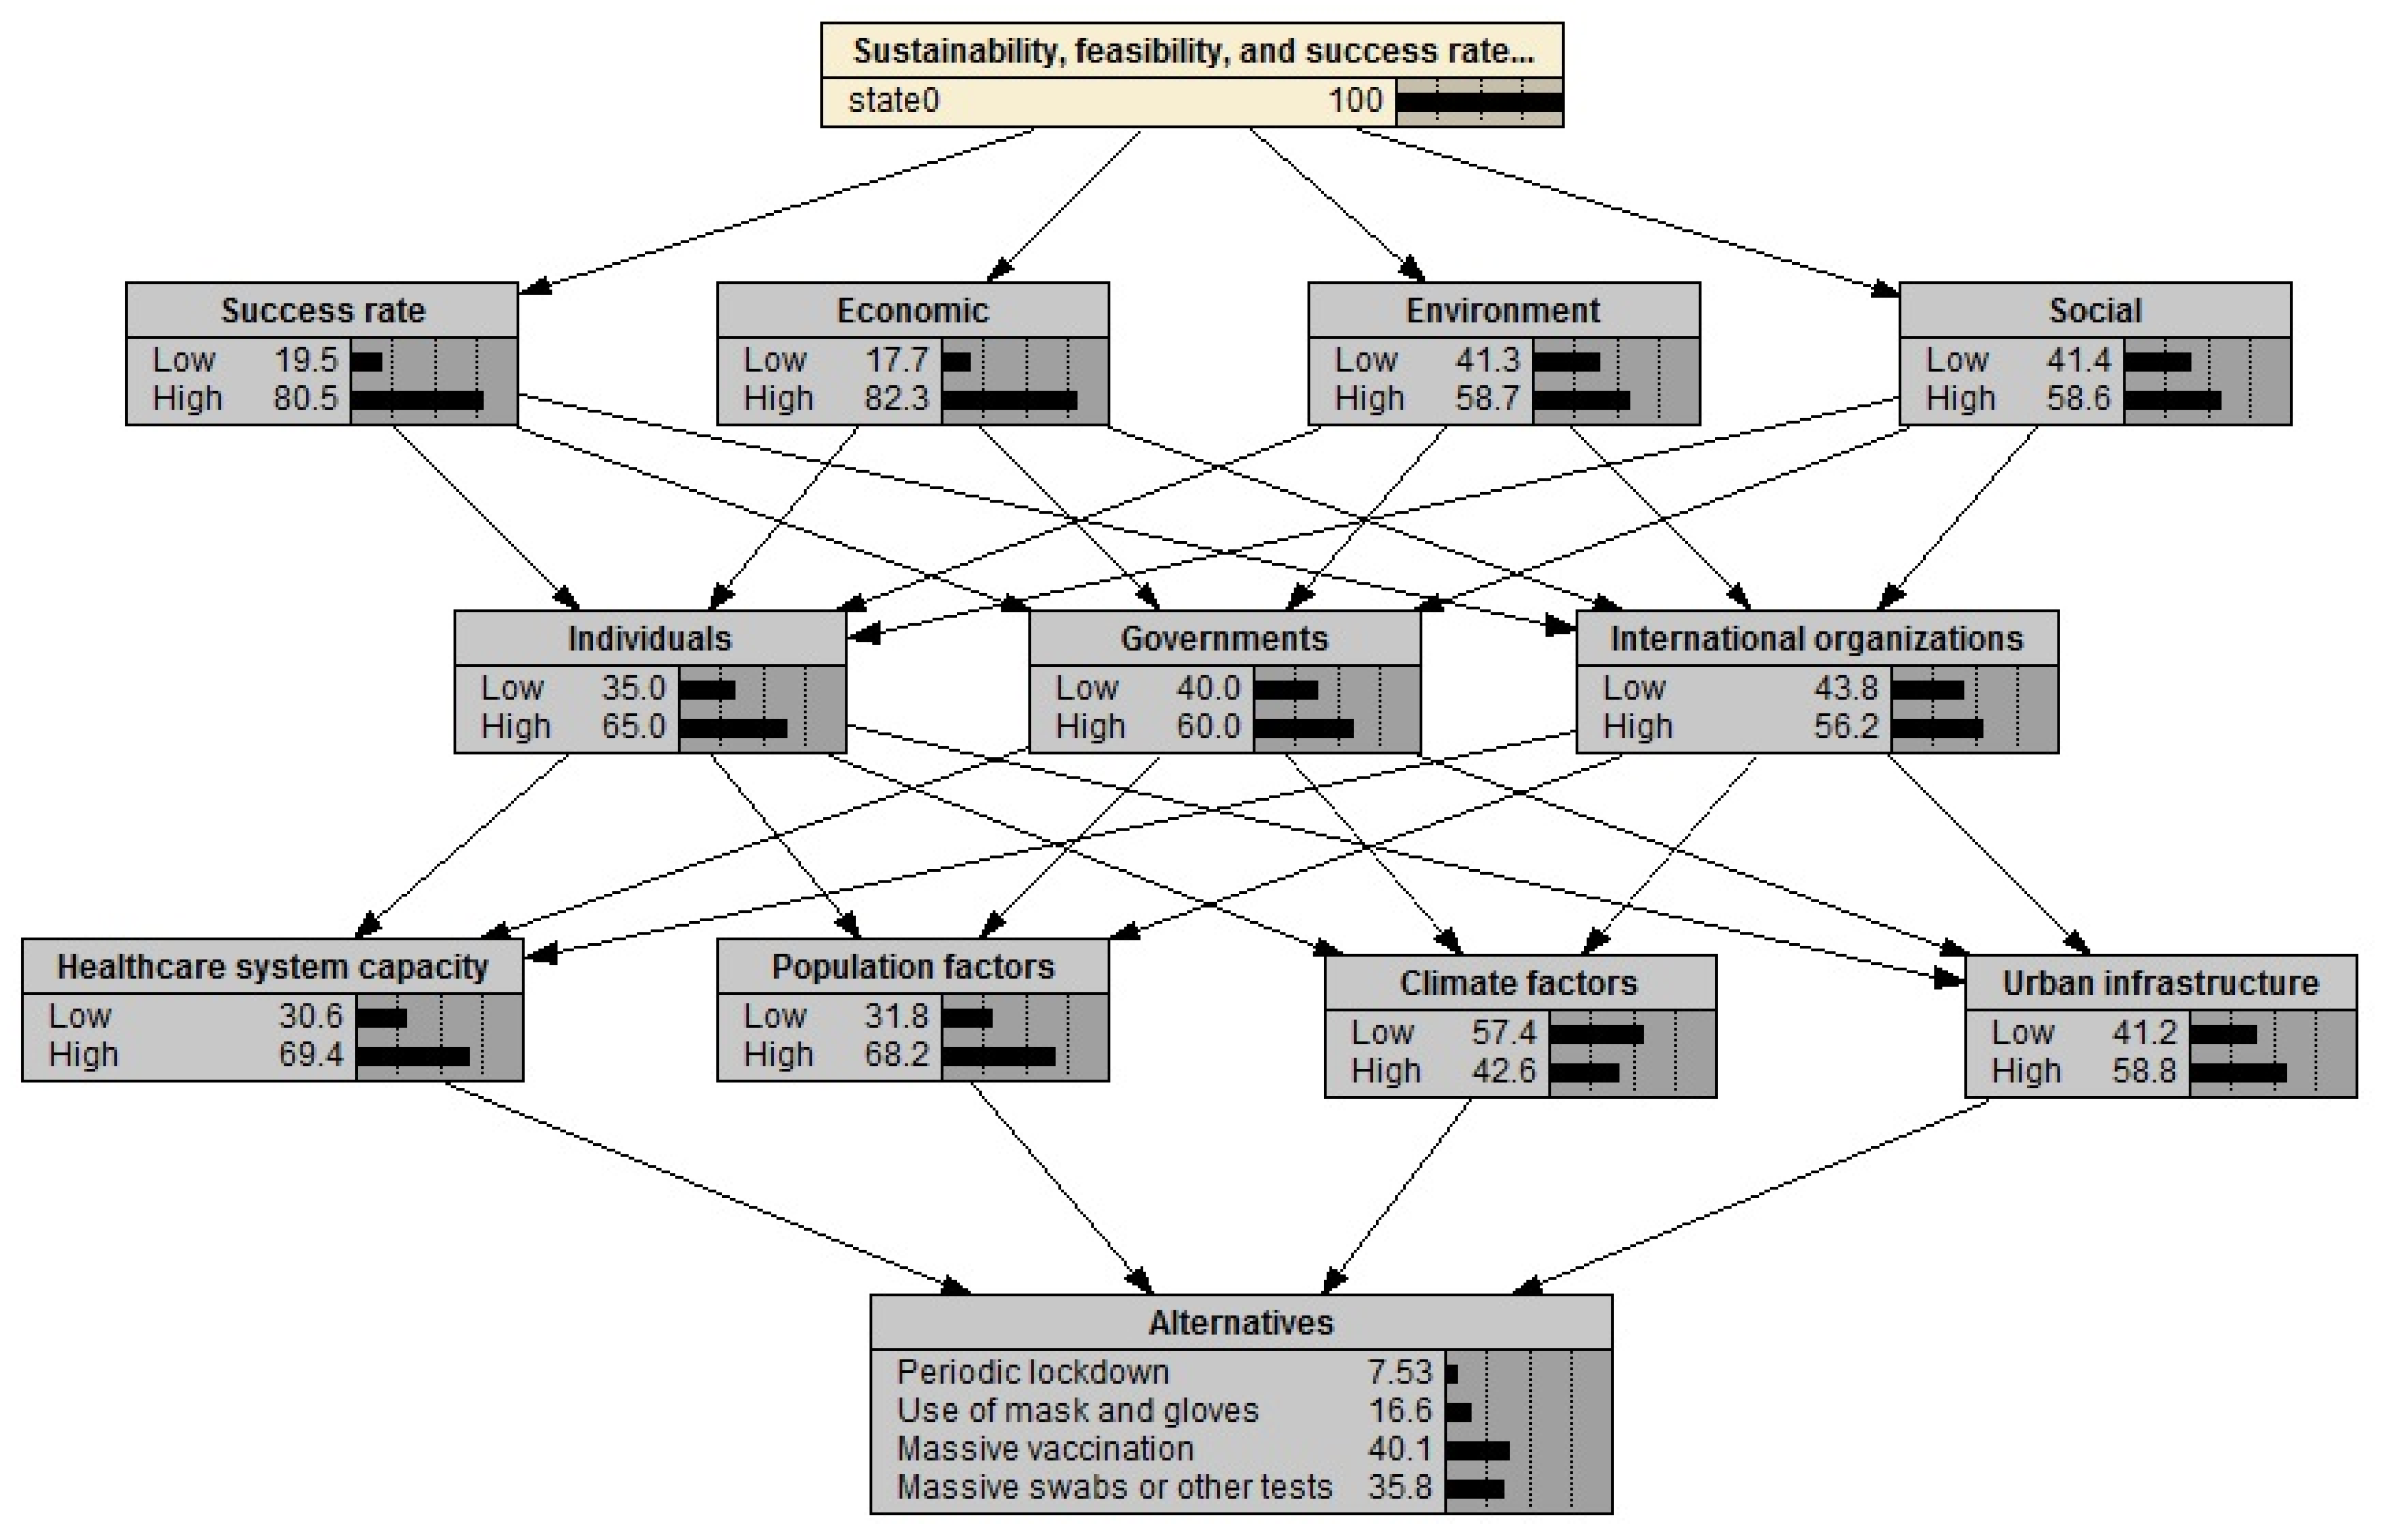
3.1.3. Ranking Using Bayesian Network, BN-Geo-AHP

Bayesian networks can be used to make decisions in uncertain situations. Therefore, we used it to improve the developed Geo-AHP model as there are many uncertainties in the COVID-19 pandemic phenomenon. Three types of nodes, including the utility node (goal), probability nodes (criteria, decision makers, and geo-based factors), and decision node (alternatives) were used in the model. In Table 13. the structure of BN-Geo-AHP and the descriptions and states of the nodes are presented. The probability table of the criteria is presented in Table 14, and the conditional probability tables of decision makers and factors (geo-based data) are presented in Table 15 and Table 16.
The developed BN-Geo-AHP and its calculated probabilities are shown in Figure 4. As shown in Figure 4, the highest probability among the alternatives belonged to the massive vaccination approach (40.1%), and the second to massive swab or other testing (35.8%). Use of mask/gloves with the probability of 16.6% was the third, and the lowest calculated probability belonged to the periodic lockdown (7.5%). The results are similar to the ranks given by Geo-AHP; however, the calculations by the BN method considered the conditional probabilities and could be more relevant.
For use with a large databank, the role of machine learning in the proposed Bayesian networks framework would be for the calculation of the pairwise weights of BN-Geo-AHP according to analysis of the data, and can improve the computation of the relative importance coefficient (RIC) of alternatives concerning the main goal. To implement the application of machine learning in BN-Geo-AHP the steps are as follow:
  • Pre-processing of the database;
  • Classifying the attributes using machine learning algorithms;
  • Obtaining the Bayesian networks model and computing the conditional probabilities tables (CPTs) based on the available database;
  • Modeling of the Geo-AHP according to the result of the BN model;
  • Performing the weights estimation algorithm for Geo-AHP model to convert the probabilistic values of the CPT into the weights for relevance pairwise comparisons;
  • Assigning the obtained weights to calculate the relative importance coefficients (RICs) of alternatives;
  • Final ranking according to the RICs.
Recommendations for future studies
In this study we developed two models and explained the role of machine learning and geo-based data in improving the weight and ranking of approaches for solving complex problems. The use of an analytic network process (ANP) for validation of the AHP is recommended for analysis in future studies. The use of databank and geo-based software like GIS for analysis of the role of machine learning is recommended for future studies.

4. Conclusions

This analysis of the developed geo-based multi-criteria decision support systems considering probabilistic techniques for the sustainability, feasibility, and success rate (efficiency or probability of success) of approaches demonstrated the use of the applications in complex problems. The results showed that the proposed hybrid-AHP methods can be applied for the COVID-19 pandemic issue, considering the geo data layer, different decision makers and several alternatives, and alongside the use of machine learning for analysis of a large databank.
The analysis determined that, while ranking by the AHP method does not involve validation like linear programming, the defined structure and pairwise comparisons procedure is very important. To improve the results, group decisions, using questionnaires or developing a hybrid-AHP combining the method with other analytical techniques, and adding uncertainties such as Bayesian network, can be used.
To examine the developed models, the COVID-19 pandemic was selected. The COVID-19 pandemic affected nearly all activities such as political, global economic, and socio-cultural. The main strategies used so far, such as lockdowns, mandatory or self-quarantine, social distancing, travel bans, using facemasks and gloves, increasing the number of tests, and vaccination, did not fully overcome the pandemic, and it is estimated that the global cost of a new pandemic could be up to USD 2.7 trillion. The analysis of the COVID-19 outbreak in different countries shows that policies such as lockdown can be implemented only as a temporary method to help the health system, since, often after the lockdown, the number of infections kept gradually increasing. The success rate of the mandatory use of medical masks and gloves was different in separate countries and depended on people’s acceptance to wear a facemask frequently and correctly. For control of the virus transmission, the use of a billion facemasks and gloves might be required before the end of the pandemic, but this has already created a new environmental challenge.
The analysis of COVID-19 tests shows that there are several types of tests and combinations of tests, and increasing the test number, besides improving the group or pooled testing, can be useful. The number of tests depends on several factors, such as the financial condition, laboratory capacity, trained staff, and available test options. Massive testing might not be feasible for the great majority of countries but could be possible in the future due to global organizations’ trying to reduce the price of the test (materials and machines).
There are extensive efforts being applied for the development of a vaccine for COVID-19, and massive vaccination through large investments from different countries. Moreover, the need to vaccinate 70% of the population and the vaccine’s effectiveness are other important points to consider. However, previous vaccines’ success rates suggest that the new vaccine would possibly be available for the whole population by the end of 2021, during which time the pandemic might have caused greater damage.
According to the analysis, before massive vaccination, the methods used previously to control the pandemic so far might need to continue in the next months, making it necessary to focus on the fastest ways to decrease the negative impacts. The ranking results with two developed models in this study show that massive vaccination is the first ranked method and the second ranked is massive swab or other testing. The third ranked is the use of medical masks and gloves, and the last ranked is lockdown. Therefore, besides the vaccination programs being developed by countries, expanding testing, the quantitative increase in tests, and the rapidity of the announcement of results for detecting and isolating positive cases and breaking the transmission chains might be the most effective approaches in the forthcoming months.
The results showed that the proposed models are suitable for analysis of the multi-criteria decision making involving quantitative and qualitative inputs with degrees of uncertainty, and the new variables can be added easily in all layers. Finally, the step-by-step analysis in the models can categorize and prioritize different parameters that affect a decision by comparing weights and scales.
In conclusion, the new models of Geo-AHP and BN-Geo-AHP could be useful as multi-criteria decision support system in the analysis of complex structures with uncertainties, such as the COVID-19 pandemic.

Author Contributions

Conceptualization, Behrouz Pirouz and Patrizia Piro; Methodology, Behrouz Pirouz and Behzad Pirouz; Formal analysis, Behzad Pirouz and Behrouz Pirouz; Validation, Behzad Pirouz; investigation, Behrouz Pirouz; Writing—original draft preparation, Behrouz Pirouz; Writing—review and editing, Behrouz Pirouz and Behzad Pirouz; Visualization, Behrouz Pirouz; Supervision, Aldo Pedro Ferrante and Patrizia Piro. All authors have read and agreed to the published version of the manuscript.

Funding

This research received no external funding.

Institutional Review Board Statement

Not applicable.

Informed Consent Statement

Not applicable.

Data Availability Statement

Data sharing not applicable.

Conflicts of Interest

The authors declare no conflict of interest.

References

  1. Shen, K.Y.; Tzeng, G.H. Advances in multiple criteria decision making for sustainability: Modeling and applications. Sustainability 2018, 10, 1600. [Google Scholar] [CrossRef] [Green Version]
  2. Yang, M.; Nazir, S.; Xu, Q.; Ali, S.; Uddin, M.I. Deep Learning Algorithms and Multicriteria Decision-Making Used in Big Data: A Systematic Literature Review. Complexity 2020, 2020. [Google Scholar] [CrossRef]
  3. World Health Organization. WHO Timeline COVID-19. Available online: https://www.who.int/news-room/detail/27-04-2020-who-timeline---covid-19 (accessed on 7 February 2021).
  4. Sigala, M. Tourism and COVID-19: Impacts and implications for advancing and resetting industry and research. J. Bus. Res. 2020, 117, 312–321. [Google Scholar] [CrossRef]
  5. Rothe, C.; Schunk, M.; Sothmann, P.; Bretzel, G.; Froeschl, G.; Wallrauch, C.; Zimmer, T.; Thiel, V.; Janke, C.; Guggemos, W.; et al. Transmission of 2019-NCOV infection from an asymptomatic contact in Germany. N. Engl. J. Med. 2020, 382, 970–971. [Google Scholar] [CrossRef] [Green Version]
  6. Leung, N.H.L.; Chu, D.K.W.; Shiu, E.Y.C.; Chan, K.H.; McDevitt, J.J.; Hau, B.J.P.; Yen, H.L.; Li, Y.; Ip, D.K.M.; Peiris, J.S.M.; et al. Respiratory virus shedding in exhaled breath and efficacy of face masks. Nat. Med. 2020, 26, 676–680. [Google Scholar] [CrossRef] [PubMed] [Green Version]
  7. Alberta Health Services. What Is the Effectiveness of Wearing Medical Masks, Including Home-Made Masks, to Reduce the Spread of COVID-19 in the Community? Available online: https://www.albertahealthservices.ca/assets/info/ppih/if-ppih-covid-19-sag-mask-use-in-community-rapid-review.pdf (accessed on 26 February 2021).
  8. Aydin, O.; Emon, B.; Cheng, S.; Hong, L.; Chamorro, L.P.; Saif, M.T.A. Performance of fabrics for home-made masks against the spread of COVID-19 through droplets: A quantitative mechanistic study. Extrem. Mech. Lett. 2020, 40, 100924. [Google Scholar] [CrossRef]
  9. van der Sande, M.; Teunis, P.; Sabel, R. Professional and home-made face masks reduce exposure to respiratory infections among the general population. PLoS ONE 2008, 3, e2618. [Google Scholar] [CrossRef] [PubMed] [Green Version]
  10. ECDC. Using Face Masks in the Community; European Centre for Disease Prevention and Control, 2020; Available online: https://www.ecdc.europa.eu/en/publications-data/using-face-masks-community-reducing-covid-19-transmission (accessed on 26 February 2021).
  11. Tosepu, R.; Gunawan, J.; Effendy, D.S.; Ahmad, L.O.A.I.; Lestari, H.; Bahar, H.; Asfian, P. Correlation between weather and Covid-19 pandemic in Jakarta, Indonesia. Sci. Total Environ. 2020, 725, 138436. [Google Scholar] [CrossRef] [PubMed]
  12. Coronavirus Testing: How It Is Done, When You Should Get One and How Long Results Take. Available online: https://www.liverpoolecho.co.uk/news/uk-world-news/coronavirus-testing-how-done-you-17912266 (accessed on 25 April 2021).
  13. Corman, V.M.; Landt, O.; Kaiser, M.; Molenkamp, R.; Meijer, A.; Chu, D.K.W.; Bleicker, T.; Brünink, S.; Schneider, J.; Schmidt, M.L.; et al. Detection of 2019 novel coronavirus (2019-nCoV) by real-time RT-PCR. Eurosurveillance 2020, 25, 2000045. [Google Scholar] [CrossRef] [PubMed] [Green Version]
  14. Eberhardt, J.N.; Breuckmann, N.P.; Eberhardt, C.S. Multi-Stage Group Testing Improves Efficiency of Large-Scale COVID-19 Screening. J. Clin. Virol. 2020, 128, 104382. [Google Scholar] [CrossRef]
  15. Ng, G.; Wang, C. The proportion testing positive for SARS-COV-2 among the tested population in the U.S.: Benefits of the positive test ratio under scaled testing scenarios. medRxiv 2020. [Google Scholar] [CrossRef] [Green Version]
  16. Szklarsky, C. False Positive COVID-19 Test Results Rare Despite Recent Scares, Experts Say. Available online: https://www.ctvnews.ca/health/coronavirus/false-positive-covid-19-test-results-rare-despite-recent-scares-experts-say-1.4932859/ (accessed on 10 April 2020).
  17. Gray, N.; Calleja, D.; Wimbush, A.; Miralles-Dolz, E.; Gray, A.; De-Angelis, M.; Derrer-Merk, E.; Uchenna-Oparaji, B.; Stepanov, V.; Clearkin, L.; et al. No test is better than a bad test: Impact of diagnostic uncertainty in mass testing on the spread of Covid-19. medRxiv 2020. [Google Scholar] [CrossRef]
  18. Chinazzi, M.; Davis, J.T.; Ajelli, M.; Gioannini, C.; Litvinova, M.; Merler, S.; Pastore y Piontti, A.; Mu, K.; Rossi, L.; Sun, K.; et al. The effect of travel restrictions on the spread of the 2019 novel coronavirus (COVID-19) outbreak. Science 2020, 368, 395–400. [Google Scholar] [CrossRef] [Green Version]
  19. Shen, M.; Peng, Z.; Guo, Y.; Xiao, Y.; Zhang, L. Lockdown may partially halt the spread of 2019 novel coronavirus in Hubei province, China. MedRxiv 2020. [Google Scholar] [CrossRef] [Green Version]
  20. Pirouz, B.B.; Golmohammadi, A.; Masouleh, H.S.; Violini, G.; Pirouz, B.B. Relationship between Average Daily Temperature and Average Cumulative Daily Rate of Confirmed Cases of COVID-19. medRxiv 2020. [Google Scholar] [CrossRef] [Green Version]
  21. Pirouz, B.; Arcuri, N.; Pirouz, B.; Palermo, S.A.; Turco, M.; Maiolo, M. Development of an assessment method for evaluation of sustainable factories. Sustainability 2020, 12, 1841. [Google Scholar] [CrossRef] [Green Version]
  22. Patel, A.B.; Kumar, S. A sociological study of suicide during COVID-19 in India. Ment. Health Soc. Incl. 2020, 25, 76–87. [Google Scholar] [CrossRef]
  23. Piro, P.; Carbone, M.; Sansalone, J. Delivery and Frequency Distributions of Combined Wastewater Collection System Wet and Dry Weather Loads. Water Environ. Res. 2012, 84, 65–75. [Google Scholar] [CrossRef] [PubMed]
  24. Pirouz, B.; Haghshenas, S.S.; Pirouz, B.; Haghshenas, S.S.; Piro, P. Development of an assessment method for investigating the impact of climate and urban parameters in confirmed cases of COVID-19: A new challenge in sustainable development. Int. J. Environ. Res. Public Health 2020, 17, 2801. [Google Scholar] [CrossRef] [Green Version]
  25. Hu, Z.; Ge, Q.; Jin, L.; Xiong, M. Artificial intelligence forecasting of covid-19 in china. arXiv 2020, arXiv:2002.07112. [Google Scholar]
  26. Pirouz, B.; Nejad, H.J.; Violini, G.; Pirouz, B. The role of artificial intelligence, MLR and statistical analysis in investigations about the correlation of swab tests and stress on health care systems by COVID-19. Information 2020, 11, 454. [Google Scholar] [CrossRef]
  27. Grant, W.B.; Giovannucci, E. The possible roles of solar ultraviolet-B radiation and vitamin D in reducing case-fatality rates from the 1918–1919 influenza pandemic in the United States. Dermatoendocrinology 2009, 1, 215–219. [Google Scholar] [CrossRef]
  28. Haghshenas, S.S.; Pirouz, B.; Haghshenas, S.S.; Pirouz, B.; Piro, P.; Na, K.S.; Cho, S.E.; Geem, Z.W. Prioritizing and analyzing the role of climate and urban parameters in the confirmed cases of COVID-19 based on artificial intelligence applications. Int. J. Environ. Res. Public Health 2020, 17, 3730. [Google Scholar] [CrossRef]
  29. Pirouz, B.; Haghshenas, S.S.; Haghshenas, S.S.; Piro, P. Investigating a serious challenge in the sustainable development process: Analysis of confirmed cases of COVID-19 (new type of Coronavirus) through a binary classification using artificial intelligence and regression analysis. Sustainability 2020, 12, 2427. [Google Scholar] [CrossRef] [Green Version]
  30. Savini, L.; Candeloro, L.; Calistri, P.; Conte, A. A municipality-based approach using commuting census data to characterize the vulnerability to influenza-like epidemic: The COVID-19 application in Italy. Microorganisms 2020, 8, 911. [Google Scholar] [CrossRef] [PubMed]
  31. Lorusso, A.; Calistri, P.; Mercante, M.T.; Monaco, F.; Portanti, O.; Marcacci, M.; Cammà, C.; Rinaldi, A.; Mangone, I.; Di Pasquale, A.; et al. A “One-Health” approach for diagnosis and molecular characterization of SARS-CoV-2 in Italy. One Health 2020, 10, 100135. [Google Scholar] [CrossRef]
  32. Danzetta, M.L.; Amato, L.; Cito, F.; Di Giuseppe, A.; Morelli, D.; Savini, G.; Mercante, M.T.; Lorusso, A.; Portanti, O.; Puglia, I.; et al. Sars-cov-2 rna persistence in naso-pharyngeal swabs. Microorganisms 2020, 8, 1124. [Google Scholar] [CrossRef]
  33. Phan, L.T.; Nguyen, T.V.; Luong, Q.C.; Nguyen, T.V.; Nguyen, H.T.; Le, H.Q.; Nguyen, T.T.; Cao, T.M.; Pham, Q.D. Importation and Human-to-Human Transmission of a Novel Coronavirus in Vietnam. N. Engl. J. Med. 2020, 382, 872–874. [Google Scholar] [CrossRef] [PubMed] [Green Version]
  34. Li, Q.; Guan, X.; Wu, P.; Wang, X.; Zhou, L.; Tong, Y.; Ren, R.; Leung, K.S.M.; Lau, E.H.Y.; Wong, J.Y.; et al. Early transmission dynamics in Wuhan, China, of novel coronavirus-infected pneumonia. N. Engl. J. Med. 2020, 382, 1199–1207. [Google Scholar] [CrossRef]
  35. Lorusso, A.; Calistri, P.; Petrini, A.; Savini, G.; Decaro, N. Novel coronavirus (SARS-CoV-2) epidemic: A veterinary perspective. Vet. Ital. 2020, 56, 5–10. [Google Scholar] [CrossRef]
  36. Ackerman, C.M.; Myhrvold, C.; Thakku, S.G.; Freije, C.A.; Metsky, H.C.; Yang, D.K.; Ye, S.H.; Boehm, C.K.; Kosoko-Thoroddsen, T.S.F.; Kehe, J.; et al. Massively multiplexed nucleic acid detection with Cas13. Nature 2020, 582, 277–282. [Google Scholar] [CrossRef]
  37. Bar-Zeev, N.; Inglesby, T. COVID-19 vaccines: Early success and remaining challenges. Lancet 2020, 396, 868–869. [Google Scholar] [CrossRef]
  38. Krause, P.; Fleming, T.R.; Longini, I.; Henao-Restrepo, A.M.; Peto, R.; Dean, N.E.; Halloran, M.E.; Huang, Y.; Fleming, T.R.; Gilbert, P.B.; et al. COVID-19 vaccine trials should seek worthwhile efficacy. Lancet 2020, 396, 741–743. [Google Scholar] [CrossRef]
  39. Palermo, S.A.; Talarico, V.C.; Turco, M. On the LID systems effectiveness for urban stormwater management: Case study in Southern Italy. IOP Conf. Ser. Earth Environ. Sci. 2020, 410, 012012. [Google Scholar] [CrossRef]
  40. Pirouz, B.; Arcuri, N.; Maiolo, M.; Talarico, V.C.; Piro, P. A new multi-objective dynamic model to close the gaps in sustainable development of industrial sector. IOP Conf. Ser. Earth Environ. Sci. 2020, 410, 012074. [Google Scholar] [CrossRef] [Green Version]
  41. Baglivo, C.; Mazzeo, D.; Panico, S.; Bonuso, S.; Matera, N.; Congedo, P.M.; Oliveti, G. Complete greenhouse dynamic simulation tool to assess the crop thermal well-being and energy needs. Appl. Therm. Eng. 2020, 179, 115698. [Google Scholar] [CrossRef]
  42. Palermo, S.A.; Zischg, J.; Sitzenfrei, R.; Rauch, W.; Piro, P. Parameter Sensitivity of a Microscale Hydrodynamic Model. In Green Energy and Technology; Springer: Cham, Switzerland, 2018; pp. 982–987. [Google Scholar]
  43. Pirouz, B.; Palermo, S.A.; Turco, M.; Piro, P. New Mathematical Optimization Approaches for LID Systems. In Lecture Notes in Computer Science; Springer: Cham, Switzerland, 2020; pp. 583–595. [Google Scholar]
  44. Oberascher, M.; Zischg, J.; Palermo, S.A.; Kinzel, C.; Rauch, W.; Sitzenfrei, R. Smart Rain Barrels: Advanced LID Management Through Measurement and Control. In Green Energy and Technology; Springer: Cham, Switzerland, 2019. [Google Scholar]
  45. Piro, P.; Turco, M.; Palermo, S.A.; Principato, F.; Brunetti, G. A comprehensive approach to stormwater management problems in the next generation drainage networks. In Internet of Things; Springer: Cham, Switzerland, 2019. [Google Scholar]
  46. Pirouz, B.; Palermo, S.A.; Maiolo, M.; Arcuri, N.; Piro, P. Decreasing Water Footprint of Electricity and Heat by Extensive Green Roofs: Case of Southern Italy. Sustainability 2020, 12, 10178. [Google Scholar] [CrossRef]
  47. Saaty, T. Anal. Hierarchy Process; Wiley online Library: Hoboken, NJ, USA, 1980. [Google Scholar]
  48. Saaty, T.; Vargas, L. Models, Methods, Concepts & Applications of the Analytic Hierarchy Process; Springer: New York, NY, USA, 2012; ISBN 9781461435969. [Google Scholar]
  49. Wang, S.; Sheng, Z.; Xi, Y.; Ma, X.; Zhang, H.; Kang, M.; Ren, F.; Du, Q.; Hu, K.; Han, Z. The application of the analytic hierarchy process and a new correlation algorithm to urban construction and supervision using multi-source government data in Tianjin. ISPRS Int. J. Geo Inf. 2018, 7, 50. [Google Scholar] [CrossRef] [Green Version]
  50. Mazzeo, D.; Matera, N.; De Luca, P.; Baglivo, C.; Maria Congedo, P.; Oliveti, G. Worldwide geographical mapping and optimization of stand-alone and grid-connected hybrid renewable system techno-economic performance across Köppen-Geiger climates. Appl. Energy 2020, 276, 115507. [Google Scholar] [CrossRef]
  51. Yu, D.; Kou, G.; Xu, Z.; Shi, S. Analysis of Collaboration Evolution in AHP Research: 1982–2018. Int. J. Inf. Technol. Decis. Mak. 2021, 20, 7–36. [Google Scholar] [CrossRef]
  52. Attique, M.; Cho, H.J.; Jin, R.; Chung, T.S. Top-k spatial preference queries in directed road networks. ISPRS Int. J. Geo Inf. 2016, 5, 170. [Google Scholar] [CrossRef] [Green Version]
  53. Akyar, E.; Akyar, H.; Duzce, S. Al A new method for ranking triangular fuzzy numbers. Int. J. Uncertain. Fuzziness Knowl. Based Syst. 2012, 20, 729–740. [Google Scholar] [CrossRef]
  54. Javiri, F.; Aminullah, A.; Triwiyono, A. Assessment system of condition of typical building infrastructure using fuzzy analitical hierarchy procces (FAHP) method. In MATEC Web of Conferences; EDP Sciences Web of Conferences, France; EDP Sciences: Ulis, France, 2019. [Google Scholar]
  55. Rahiminezhad Galankashi, M.; Mokhatab Rafiei, F.; Ghezelbash, M. Portfolio selection: A fuzzy-ANP approach. Financ. Innov. 2020, 6, 1–34. [Google Scholar] [CrossRef]
  56. Yiu, M.L.; Dai, X.; Mamoulis, N.; Vaitis, M. Top-k spatial preference queries. In Proceedings of the 2007 IEEE 23rd International Conference on Data Engineering, Istanbul, Turkey, 15–20 April 2007. [Google Scholar]
  57. Büyüközkan, G.; Kahraman, C.; Ruan, D. A fuzzy multi-criteria decision approach for software development strategy selection. Int. J. Gen. Syst. 2004, 33, 259–280. [Google Scholar] [CrossRef]
  58. Saaty, T.L. Decision making with the Analytic Hierarchy Process. Sci. Iran. 2002, 9, 215–229. [Google Scholar] [CrossRef] [Green Version]
  59. Oguztimur, S. Why fuzzy analytic hierarchy process approach for transport problems? In Proceedings of the 51st Congress of the European Regional Science Association: “New Challenges for European Regions and Urban Areas in a Globalised World”, Barcelona, Spain, 30 August–3 September 2011.
  60. Karthikeyan, R.; Venkatesan, K.G.S.; Chandrasekar, A. A Comparison of strength and weakness for analytical hierarchy process. Int. J. Pure Appl. Math. 2017, 116, 29–33. [Google Scholar]
  61. Martin, H.; Koylass, J.; Welch, F. An exploration of the consistency limits of the analytical hierarchy process and its impact on contractor selection. Int. J. Constr. Manag. 2018, 18, 14–25. [Google Scholar] [CrossRef]
  62. Asadabadi, M.R.; Chang, E.; Saberi, M. Are MCDM methods useful? A critical review of Analytic Hierarchy Process (AHP) and Analytic Network Process (ANP). Cogent Eng. 2019, 6, 1623153. [Google Scholar] [CrossRef]
  63. Whitaker, R. Validation examples of the Analytic Hierarchy Process and Analytic Network Process. Math. Comput. Model. 2007, 46, 840–859. [Google Scholar] [CrossRef]
  64. Kangas, J. The Analytic Hierachy Process (AHP): Standard Version, Forestry Application and Advances. In Multiple Use of Forests and Other Natural Resources; Springer: Dordrecht, The Netherlands, 1999. [Google Scholar]
  65. Papic-Blagojevic, N.; Gajic, T.; Djokic, N. Using Bayesian network and AHP method as a marketing approach tools in defining tourists’ preferences. Turizam 2012, 16, 8–19. [Google Scholar] [CrossRef] [Green Version]
  66. Atmaca, S.; Karadaş, H.A. Decision making on financial investment in Turkey by using ARDL long-term coefficients and AHP. Financ. Innov. 2020, 6, 1–22. [Google Scholar] [CrossRef]
  67. Xu, L.; Wu, L.; Li, X.; Shen, F. Introduction to the special issue on analytical and decision-making technique innovation in financial market. Financ. Innov. 2020, 6. [Google Scholar] [CrossRef]
  68. Carbone, M.; Turco, M.; Brunetti, G.; Piro, P. A Cumulative Rainfall Function for Subhourly Design Storm in Mediterranean Urban Areas. Adv. Meteorol. 2015. [Google Scholar] [CrossRef] [Green Version]
  69. Marcot, B.G.; Steventon, J.D.; Sutherland, G.D.; McCann, R.K. Guidelines for developing and updating Bayesian belief networks applied to ecological modeling and conservation. Can. J. For. Res. 2006, 36, 3063–3074. [Google Scholar] [CrossRef]
  70. Uusitalo, L. Advantages and challenges of Bayesian networks in environmental modelling. Ecol. Modell. 2007, 203, 312–318. [Google Scholar] [CrossRef]
  71. Ben-Gal, I. Bayesian Networks. In Encyclopedia of Statistics in Quality and Reliability; Wiley & Sons: Hoboken, NJ, USA, 2008. [Google Scholar]
  72. Shenton, W.; Hart, B.T.; Brodie, J. A Bayesian network model linking nutrient management actions in the Tully catchment (northern Queensland) with Great Barrier Reef condition. Mar. Freshw. Res. 2010, 61, 587–595. [Google Scholar] [CrossRef]
  73. Ahmed, A.; Kusumo, R.; Savci, S.; Kayis, B.; Zhou, M.; Khoo, Y.B. Application of analytical hierarchy process and Bayesian belief networks for risk analysis. Complex. Int. 2008, 12, 1–10. [Google Scholar]
  74. Blasch, E.; Cruise, R. Information fusion management: Collection to diffusion. In Proceedings of the IEEE National Aerospace Electronics Conference, NAECON, Dayton, OH, USA, 25–29 July 2016. [Google Scholar]
  75. Borsuk, M.E.; Reichert, P.; Peter, A.; Schager, E.; Burkhardt-Holm, P. Assessing the decline of brown trout (Salmo trutta) in Swiss rivers using a Bayesian probability network. Ecol. Modell. 2006, 192, 224–244. [Google Scholar] [CrossRef]
  76. Lima, E.; Gorski, E.; Loures, E.F.R.; Portela Santos, E.A.; Deschamps, F. Applying machine learning to AHP multicriteria decision making method to assets prioritization in the context of industrial maintenance 4.0. IFAC PapersOnLine 2019, 52, 2152–2157. [Google Scholar] [CrossRef]
  77. Hruschka, E.R.; do Carmo Nicoletti, M. Roles Played by Bayesian Networks in Machine Learning: An Empirical Investigation. In Emerging Paradigms in Machine Learning; Springer: Berlin/Heidelberg, Germany, 2013. [Google Scholar] [CrossRef]
  78. Global Trade Update: February 2021. Available online: https://unctad.org/webflyer/global-trade-update-february-2021 (accessed on 27 April 2021).
  79. UNDP. Putting the UN Framework for Socio-Economic Response to COVID-19 into Action: Insights. 2020. Available online: https://www.undp.org/content/dam/undp/library/covid19/Brief2-COVID-19-final-June2020.pdf (accessed on 27 April 2021).
  80. Maliszewska, M.; Mattoo, A.; Van Der Mensbrugghe, D. The Potential Impact of COVID-19 on GDP and Trade: A Preliminary Assessment. Available online: https://openknowledge.worldbank.org/handle/10986/33605 (accessed on 26 April 2021).
  81. Thomaselli, R. Airline Losses Top $370 Billion for 2020, ICAO Says|TravelPulse. Available online: https://www.travelpulse.com/news/airlines/airline-losses-top-370-billion-for-2020-icao-says.html (accessed on 27 April 2021).
  82. Palumbo, A. International Monetary Fund World Economic Outlook. Contrib. Political Econ. 1996, 15, 105–116. [Google Scholar] [CrossRef]
  83. Orlik, O.; Rush, J.; Cousin, M.; Hong, J. Coronavirus Could Cost the Global Economy $2.7 Trillion. Here’s How. Bloomberg. 2020. Available online: https://www.bloomberg.com/graphics/2020-coronavirus-pandemic-global-economic-risk/ (accessed on 23 April 2021).
  84. World Bank 2020 Global Economic Prospects: June 2020. Available online: https://www.worldbank.org/en/publication/global-economic-prospects (accessed on 25 April 2021).
  85. FAO. COVID-19 Global Economic Recession: Avoiding Hunger Must be at the Centre of the Economic Stimulus. 2020. Available online: http://www.fao.org/policy-support/tools-and-publications/resources-details/en/c/1273314/ (accessed on 23 April 2021).
  86. Federal Reserve. Federal Reserve Takes Additional Actions to Provide Up to $2.3 Trillion in Loans to Support the Economy. Available online: https://www.federalreserve.gov/newsevents/pressreleases/monetary20200409a.htm (accessed on 27 April 2021).
  87. International Tourist Numbers Could Fall 60–80% in 2020, UNWTO Reports|UNWTO. Available online: https://www.unwto.org/news/covid-19-international-tourist-numbers-could-fall-60-80-in-2020 (accessed on 27 April 2021).
  88. World Tourism Organization. UNWTO World Tourism Barometer and Statistical Annex, May 2020. UNWTO World Tour. Barom. 2020, 18, 1–48. [Google Scholar] [CrossRef]
  89. UNCTAD. The Covid-19 Pandemic and the Blue Economy. Available online: https://unctad.org/en/PublicationsLibrary/ditctedinf2020d2_en.pdf (accessed on 22 April 2021).
  90. CEPI; WHO; Gavi. More Than 150 Countries Engaged in COVID-19 Vaccine Global Access Facility. Available online: https://www.gavi.org/news/media-room/more-150-countries-engaged-covid-19-vaccine-global-access-facility (accessed on 23 April 2021).
  91. Zimmer, C.; Corum, J.; Wee, S.-L. Covid-19 Vaccine Tracker: Latest Updates—The New York Times. Available online: https://www.nytimes.com/interactive/2020/science/coronavirus-vaccine-tracker.html (accessed on 27 April 2021).
  92. Coronavirus: Le Vaccinazioni Anti Covid Nel Mondo. Available online: https://lab.gedidigital.it/gedi-visual/2020/coronavirus-le-vaccinazioni-nel-mondo/ (accessed on 27 April 2021).
  93. World Health Organization 172 Countries and Multiple Candidate Vaccines Engaged in COVID-19 Vaccine Global Access Facility. Available online: https://www.who.int/news-room/detail/24-08-2020-172-countries-and-multiple-candidate-vaccines-engaged-in-covid-19-vaccine-global-access-facility (accessed on 23 April 2021).
  94. Merelli, A. The US Just Bought 400 Million Doses of a Coronavirus Vaccine That May Never Exist. Available online: https://qz.com/1858682/the-us-just-bought-400-million-doses-of-a-coronavirus-vaccine-that-may-never-exist/ (accessed on 27 April 2021).
  95. EPR. BARDA to Give Moderna Up to $483 Million for COVID-19 Vaccine Development. Available online: https://www.europeanpharmaceuticalreview.com/news/117327/barda-to-give-moderna-up-to-483-million-for-covid-19-vaccine-development/ (accessed on 27 April 2021).
  96. CNBC. Moderna Gets Further $472 Million U.S. Award for Coronavirus Vaccine Development. Available online: https://www.cnbc.com/2020/07/27/moderna-gets-further-472-million-us-award-for-coronavirus-vaccine-development.html (accessed on 27 April 2021).
  97. Hussey, C. Moderna Announces Supply Agreement with U.S. Government for Initial 100 Million Doses of mRNA Vaccine Against COVID-19 (mRNA-1273). Available online: https://www.businesswire.com/news/home/20200811005852/en/Moderna-Announces-Supply-Agreement-U.S.-Government-Initial (accessed on 27 April 2021).
  98. Yahoo. Finance Johnson & Johnson Announces Agreement with U.S. Government for 100 Million Doses of Investigational COVID-19 Vaccine. Available online: https://finance.yahoo.com/news/johnson-johnson-announces-agreement-u-123000855.html (accessed on 21 April 2021).
  99. Weiland, N.; Grady, D.; Sanger, D. Pfizer Gets $1.95 Billion to Produce Coronavirus Vaccine by Year’s End—The New York Times. Available online: https://www.nytimes.com/2020/07/22/us/politics/pfizer-coronavirus-vaccine.html (accessed on 21 April 2021).
  100. Thomas, K. Sanofi and GlaxoSmithKline Snag Biggest Coronavirus Vaccine Deal Yet. Available online: https://www.nytimes.com/2020/07/31/health/covid-19-vaccine-sanofi-gsk.html (accessed on 2 April 2021).
  101. Sanofi’s Two Vaccine Candidates against COVID-19—Sanofi. Available online: https://www.sanofi.com/en/about-us/our-stories/sanofi-s-response-in-the-fight-against-covid-19 (accessed on 27 April 2021).
  102. Kentucky Bioprocessing: KBP-201—COVID19 Vaccine Tracker. Available online: https://covid19.trackvaccines.org/vaccines/18/ (accessed on 27 April 2021).
  103. The New York Times. U.S. Will Pay $1.6 Billion to Novavax for Coronavirus Vaccine. Available online: https://www.nytimes.com/2020/07/07/health/novavax-coronavirus-vaccine-warp-speed.html?campaign_id=60&emc=edit_na_20200707&instance_id=0&nl=breaking-news&ref=cta®i_id=112367433&segment_id=32801&user_id=b97a48f101a68ef78776a9244eda79c1&fbclid=IwAR2oRyavgw49 (accessed on 25 April 2021).
  104. Higgins-Dunn, N. The U.S. Has already Invested Billions in Potential Coronavirus Vaccines. Here’s Where the Deals Stand. Available online: https://www.cnbc.com/2020/08/14/the-us-has-already-invested-billions-on-potential-coronavirus-vaccines-heres-where-the-deals-stand.html (accessed on 25 April 2021).
  105. GlaxoSmithKline. Sanofi and GSK Sign Agreements with the Government of Canada to Supply Up to 72 Million Doses of Adjuvanted COVID-19 Vaccine. Available online: https://www.gsk.com/en-gb/media/press-releases/sanofi-and-gsk-sign-agreements-with-the-government-of-canada-to-supply-up-to-72-million-doses-of-adjuvanted-covid-19-vaccine/ (accessed on 25 April 2021).
  106. European Investment Bank Germany. Investment Plan for Europe—EIB to Provide BioNTech with Up to €100 Million in Debt Financing for COVID-19 Vaccine Development and Manufacturing. Available online: https://www.eib.org/en/press/all/2020-144-eib-to-provide-biontech-with-up-to-eur-100-million-in-debt-financing-for-covid-19-vaccine-development-and-manufacturing/ (accessed on 25 April 2021).
  107. Didili, Z. EU Pledges €4.9 BLN for Coronavirus Vaccines, Tests. Available online: https://www.neweurope.eu/article/eu-pledges-e4-9-bln-for-coronavirus-vaccines-tests/ (accessed on 25 April 2021).
  108. Pfizer Inc. Pfizer and BioNTech to Potentially Supply the EU with 200 Million Doses of mRNA-based Vaccine Candidate Against SARS-CoV-2 | Pfizer. Available online: https://www.pfizer.com/news/press-release/press-release-detail/pfizer-and-biontech-potentially-supply-eu-200-million-doses (accessed on 21 April 2021).
  109. AstraZeneca. AstraZeneca Concludes Agreement with the European Commission for the Supply of Up to 400 Million Doses of AZD1222 COVID-19 Vaccine. Available online: https://www.astrazeneca.com/content/astraz/media-centre/press-releases/2020/astrazeneca-concludes-agreement-with-the-european-commission-for-the-supply-of-up-to-400-million-doses-of-azd1222-covid-19-vaccine.html (accessed on 25 April 2021).
  110. SANOFI. Sanofi and GSK will Provide Up to 300 Million Doses of COVID-19 Vaccine to the European Union. Available online: https://www.sanofi.com/en/media-room/press-releases/2020/2020-09-18-12-52-46 (accessed on 25 April 2021).
  111. Kramer, A.E. Russia Approves Coronavirus Vaccine Before Completing Tests. Available online: https://www.nytimes.com/2020/08/11/world/europe/russia-coronavirus-vaccine-approval.html (accessed on 20 April 2021).
  112. Randall, T.; Sam, C.; Tartar, A.; Murray, P.; Cannon, C. More Than 2.62 Billion Shots Given: Covid-19 Tracker. Available online: https://www.bloomberg.com/graphics/covid-vaccine-tracker-global-distribution/ (accessed on 27 April 2021).
  113. Miller, J. Germany Flexes Its Muscles on Foreign Investment | Financial Times. Available online: https://www.ft.com/content/54f92ca5-5380-466b-95f8-3e98b40ebc82?shareType=nongift (accessed on 20 April 2021).
  114. COVID-19—CureVac. Available online: https://www.curevac.com/en/covid-19/ (accessed on 27 April 2021).
  115. Phase Two COVID-19 Vaccine Study Gets Underway—Medicus 2021 Issue 1. Available online: https://www.duke-nus.edu.sg/medicus/2021issue1/vaccine-study-gets-underway (accessed on 27 April 2021).
  116. Government of the Netherland. France, Germany, Italy and the Netherlands Working Together to Find a Vaccine for Countries in Europe and Beyond. Available online: https://www.government.nl/latest/news/2020/06/03/france-germany-italy-and-the-netherlands-working-together-to-find-a-vaccine-for-countries-in-europe-and-beyond (accessed on 21 April 2021).
  117. Rose, A. Pfizer and BioNTech to Supply Japan with 120 Million Doses of their BNT162 mRNA-Based Vaccine Candidate. Available online: https://www.pfizer.com/news/press-release/press-release-detail/pfizer-and-biontech-supply-japan-120-million-doses-their (accessed on 27 April 2021).
  118. Bhalla, A.; Nadeem, D. Novavax Aims for 2 Billion COVID-19 Vaccine Doses with Expanded India Dea. Available online: https://www.reuters.com/article/health-coronavirus-novavax-idUSKBN2661PI (accessed on 27 April 2021).
  119. FACT SHEET: Biden Administration Announces Historic $10 Billion Investment to Expand Access to COVID-19 Vaccines and Build Vaccine Confidence in Hardest-Hit and Highest-Risk Communities | The White House. Available online: https://www.whitehouse.gov/briefing-room/statements-releases/2021/03/25/fact-sheet-biden-administration-announces-historic-10-billion-investment-to-expand-access-to-covid-19-vaccines-and-build-vaccine-confidence-in-hardest-hit-and-highest-risk-communities/ (accessed on 27 April 2021).
  120. European Commission Coronavirus: Commission Unveils EU Vaccines Strategy. Available online: https://ec.europa.eu/commission/presscorner/detail/en/ip_20_1103 (accessed on 21 April 2021).
  121. SAM McNEIL. Associated Press Chinese Company Says Coronavirus Vaccine Ready by Early 2021. Available online: https://abcnews.go.com/Health/wireStory/chinese-company-coronavirus-vaccine-ready-early-2021-73217428 (accessed on 23 April 2021).
  122. Stankiewicz, K. Coronavirus Vaccine with 50% or More Efficacy Would be a ‘Game Changer,’ Says Trial Investigator. Available online: https://www.cnbc.com/2020/08/18/coronavirus-vaccine-with-50percent-efficacy-would-be-game-changer.html (accessed on 20 April 2021).
  123. Tirrell, M. Moderna CEO Sees ‘High Probability’ of Success with Covid-19 Vaccine. Available online: https://www.cnbc.com/2020/06/17/moderna-ceo-sees-high-probability-of-success-with-covid-19-vaccine.html (accessed on 25 April 2021).
  124. Kemp, A. AZD1222 US Phase III Primary Analysis Confirms Safety and Efficacy. Available online: https://www.astrazeneca.com/media-centre/press-releases/2021/azd1222-us-phase-iii-primary-analysis-confirms-safety-and-efficacy.html (accessed on 26 April 2021).
  125. Ferdinands, J.M.; Patel, M.M.; Foppa, I.M.; Fry, A.M. Influenza Vaccine Effectiveness. Clin. Infect. Dis. 2019, 69, 190–191. [Google Scholar] [CrossRef] [PubMed] [Green Version]
  126. Kissling, E.; Pozo, F.; Buda, S.; Vilcu, A.M.; Rizzo, C.; Gherasim, A.; Horváth, J.K.; Brytting, M.; Domegan, L.; Meijer, A.; et al. Effectiveness of influenza vaccine against influenza A in Europe in seasons of different A(H1N1)pdm09 and the same A(H3N2) vaccine components (2016–17 and 2017–18). Vaccine X 2019, 3, 100042. [Google Scholar] [CrossRef]
  127. CDC. Vaccine Effectiveness: How Well Do the Flu Vaccines Work?|CDC. Available online: https://www.cdc.gov/flu/vaccines-work/vaccineeffect.htm#why_flu_vax_less_effective_against_H3N2%0Ahttps://www.cdc.gov/flu/vaccines-work/vaccineeffect.htm (accessed on 26 April 2021).
  128. Dutton, G. Past Vaccine Failures May Reduce COVID-19 Vaccination Rates. Available online: https://www.biospace.com/article/past-vaccine-failures-may-reduce-covid-19-vaccination-rates-/ (accessed on 26 April 2021).
  129. Kaslow, D.C. Certainty of success: Three critical parameters in coronavirus vaccine development. npj Vaccines 2020, 5, 1–7. [Google Scholar] [CrossRef] [PubMed]
  130. Lee, B.Y. How Effective Does a COVID-19 Coronavirus Vaccine Need to Be to Stop the Pandemic? A New Study Has Answers. Available online: https://theconversation.com/how-effective-does-a-covid-19-coronavirus-vaccine-need-to-be-to-stop-the-pandemic-a-new-study-has-answers-142468#:~:text=Wefoundthatacoronavirus,vaccineis20%25-60%25 (accessed on 26 April 2021).
  131. Bartsch, S.M.; O’Shea, K.J.; Ferguson, M.C.; Bottazzi, M.E.; Wedlock, P.T.; Strych, U.; McKinnell, J.A.; Siegmund, S.S.; Cox, S.N.; Hotez, P.J.; et al. Vaccine Efficacy Needed for a COVID-19 Coronavirus Vaccine to Prevent or Stop an Epidemic as the Sole Intervention. Am. J. Prev. Med. 2020, 59, 493–503. [Google Scholar] [CrossRef]
  132. Goldman, J.; Wang, K.; Röltgen, K.; Nielsen, S.; Roach, J.; Naccache, S.; Yang, F.; Wirz, O.; Yost, K.; Lee, J.; et al. Reinfection with SARS-CoV-2 and Failure of Humoral Immunity: A case report. Medrxiv 2020. [Google Scholar] [CrossRef]
  133. Weisblum, Y.; Schmidt, F.; Zhang, F.; DaSilva, J.; Poston, D.; Lorenzi, J.C.C.; Muecksch, F.; Rutkowska, M.; Hoffmann, H.-H.; Michailidis, E.; et al. Escape from neutralizing antibodies by SARS-CoV-2 spike protein variants. Elife 2020, 9, e61312. [Google Scholar] [CrossRef] [PubMed]
  134. Cohen, E. Fauci Says Covid-19 Vaccine May Not Get US to Herd Immunity If Too Many People Refuse to Get It. Available online: https://edition.cnn.com/2020/06/28/health/fauci-coronavirus-vaccine-contact-tracing-aspen/index.html (accessed on 23 April 2021).
  135. Tian, L.; Li, X.; Qi, F.; Tang, Q.-Y.; Tang, V.; Liu, J.; Li, Z.; Cheng, X.; Li, X.; Shi, Y.; et al. Calibrated Intervention and Containment of the COVID-19 Pandemic. arXiv 2020, arXiv:2003.07353. [Google Scholar]
  136. W.H.O. Advice on the Use of Masks in the Context of COVID-19. Available online: https://www.who.int/emergencies/diseases/novel-coronavirus-2019/advice-for-public/when-and-how-to-use-masks?gclid=CjwKCAjw7J6EBhBDEiwA5UUM2vjkKXSIXHCJFkucJ1iV5o3tDgXB0Kaejvz0SkpeyLrbjIrhdbxKdhoC_xcQAvD_BwE (accessed on 23 April 2021).
  137. Howard, J.; Huang, A.; Li, Z.; Rimoin, A. Face Masks Against COVID-19: An Evidence Review. Proc. Natl. Acad. Sci. USA 2020. [Google Scholar] [CrossRef]
  138. Chu, D.K.; Akl, E.A.; Duda, S.; Solo, K.; Yaacoub, S.; Schünemann, H.J.; El-harakeh, A.; Bognanni, A.; Lotfi, T.; Loeb, M.; et al. Physical distancing, face masks, and eye protection to prevent person-to-person transmission of SARS-CoV-2 and COVID-19: A systematic review and meta-analysis. Lancet 2020, 395, 1973–1987. [Google Scholar] [CrossRef]
  139. Yan, J.; Guha, S.; Hariharan, P.; Myers, M. Modeling the Effectiveness of Respiratory Protective Devices in Reducing Influenza Outbreak. Risk Anal. 2019, 39, 647–661. [Google Scholar] [CrossRef]
  140. Bartoszko, J.J.; Farooqi, M.A.M.; Alhazzani, W.; Loeb, M. Medical masks vs N95 respirators for preventing COVID-19 in healthcare workers: A systematic review and meta-analysis of randomized trials. Influenza Other Respi. Viruses 2020, 14, 365–373. [Google Scholar] [CrossRef] [Green Version]
  141. Healthline Are 2 Masks Better Than 1 at Preventing COVID-19 Spread? Available online: https://www.healthline.com/health-news/are-2-masks-better-than-1-at-preventing-covid-19-spread-what-to-know (accessed on 23 April 2021).
  142. Healthline Double Masking: How, Why, and When You Should Double Up on Face Masks. Available online: https://www.healthline.com/health/double-masking (accessed on 23 April 2021).
  143. Mahbubani, R. US Medical Workers Will Need 3.5 Billion Face Masks If the Coronavirus Reaches Pandemic Status. Right Now, the Country Only Has 1% of That Number. Available online: https://www.businessinsider.com/usa-1-percent-3-billion-face-masks-needed-coronavirus-pandemic-2020-3?IR=T (accessed on 19 April 2021).
  144. Potluri, P.; Needham, P. Technical Textiles for Protection. In Textiles for Protection; Elsevier: Amsterdam, The Netherlands, 2005; pp. 151–175. [Google Scholar]
  145. Dutton, K.C. Overview and analysis of the meltblown process and parameters. J. Text. Appar. Technol. Manag. 2009, 6, 1–24. [Google Scholar]
  146. Fadare, O.O.; Wan, B.; Guo, L.H.; Zhao, L. Microplastics from consumer plastic food containers: Are we consuming it? Chemosphere 2020, 253, 126787. [Google Scholar] [CrossRef] [PubMed]
  147. Fadare, O.O.; Okoffo, E.D. Covid-19 face masks: A potential source of microplastic fibers in the environment. Sci. Total Environ. 2020, 737, 140279. [Google Scholar] [CrossRef]
  148. Goyena, R.; Fallis, A. The Environmental Dangers of Employing Single-use Face Masks as part of a COVID-19 Exit Strategy. J. Chem. Inf. Model. 2019. [Google Scholar] [CrossRef]
  149. Ahuja, A. Coronavirus Outbreak Explained: Different Types of Tests For COVID-19 And Their Efficacy. Available online: https://swachhindia.ndtv.com/coronavirus-in-india-experts-explain-different-types-of-tests-for-covid-19-and-their-efficacy-44214/ (accessed on 19 April 2021).
  150. OECD. Testing for COVID-19: A Way to Lift Confinement Restrictions. Available online: https://www.oecd.org/coronavirus/policy-responses/testing-for-covid-19-a-way-to-lift-confinement-restrictions-89756248/ (accessed on 19 April 2021).
  151. Yu, L.; Wu, S.; Hao, X.; Dong, X.; Mao, L.; Pelechano, V.; Chen, W.H.; Yin, X. Rapid Detection of COVID-19 Coronavirus Using a Reverse Transcriptional Loop-Mediated Isothermal Amplification (RT-LAMP) Diagnostic Platform. Clin. Chem. 2020, 66, 975–977. [Google Scholar] [CrossRef] [PubMed]
  152. FDA. Coronavirus Testing Basics. Available online: www.fda.gov (accessed on 19 April 2021).
  153. Ravelo, J.L. A Look at COVID-19 Testing and Why Country-Wide Is Impossible Right Now. Available online: https://www.devex.com/news/a-look-at-covid-19-testing-and-why-country-wide-is-impossible-right-now-96842 (accessed on 19 April 2021).
  154. Eichacker, C. This Guilford Company is One of the World’s Top 2 Makers of COVID-19 Testing Swabs. Available online: https://bangordailynews.com/2020/03/21/news/this-guilford-company-is-one-of-the-worlds-top-2-makers-of-covid-19-testing-swabs/ (accessed on 19 April 2021).
  155. Hoey, D. Maine Company Ramping Up Production of Nasal Swabs Used to Test for COVID-19. Available online: https://www.pressherald.com/2020/04/20/maine-company-ramping-up-production-of-nasal-swabs-used-to-test-for-covid-19/ (accessed on 20 April 2021).
  156. Epstein, R.H.; Campbell, S. Why Are Coronavirus Tests so Difficult to Produce? Available online: https://www.bbc.com/future/article/20200422-why-are-coronavirus-tests-so-difficult-to-produce (accessed on 21 April 2021).
  157. Repko, M. As Pressure Grows to Reopen Economy, a Scramble to Make Nasal Swabs for Coronavirus Testing Leads to 3D Printers. Available online: https://www.cnbc.com/2020/04/22/coronavirus-3d-printing-companies-answer-the-call-for-swabs-for-covid-19-tests.html (accessed on 21 April 2021).
  158. Heerlen, N.L. DSM to Help Accelerate Dutch Covid-19 Testing by Making 2.8 Million Nose Swabs. Available online: https://www.dsm.com/corporate/news/news-archive/2020/2020-05-07-dsm-to-help-accelerate-dutch-covid-19-testing-by-making-2-8-million-nose-swabs.html (accessed on 21 April 2021).
  159. Etherington, D. UK Researchers Develop New Low-Cost, Rapid COVID-19 Test That Could even be Used at Home. Available online: https://techcrunch.com/2020/03/25/uk-researchers-develop-new-low-cost-rapid-covid-19-test-that-could-even-be-used-at-home/ (accessed on 20 April 2021).
  160. Alonso, J.A.; Lamata, M.T. Alonso, J.A.; Lamata, M.T. A Statistical Criterion of Consistency in the Analytic Hierarchy Process. In Lecture Notes in Computer Science; Springer: Berlin/Heidelberg, Germany, 2005. [Google Scholar]
Figure 1. The analysis flowchart of Geo-AHP and BN-Geo-AHP by using machine learning.
Ijgi 10 00424 g001
Figure 2. A Bayesian network with four variables and local conditional probability tables.
Ijgi 10 00424 g002
Figure 3. The developed Geo-AHP layers for ranking of approaches: COVID-19 pandemic.
Ijgi 10 00424 g003
Figure 4. The developed BN-Geo-AHP.
Ijgi 10 00424 g004
Table 1. Fundamental scale in the AHP ranking [58].
Intensity of ImportanceDefinition
1Equal importance
3Moderate importance
5Strong importance
7Very strong importance
9Extreme importance
2, 4, 6, 8Inter-values
Table 2. Major projects and investments for a COVID-19 vaccine.
CountriesCompanyMillion ($/€)Name of VaccinePhase
(30 September 2020)
Phase
(30 March 2021)
Reserve doses (Million) Ref.
COVAX program (172 countries)Different companies$600Different candidate vaccines--2000[90]
US$ 1400[93]
USAUS-based Moderna$483 April
$472 July
mRNA-1273IIIApproved and Emergency use-[94,95]
[96]
$1500 August100[97]
US-based Johnson & Johnson‘s Janssen Research & Development$456Ad26.COV2.SIIIEmergency use-[94]
$1000100[98]
UK-based AstraZeneca$1200AZD1222IIIApproved400[94]
German based BioNTech & US-based Pfizer$1950 BNT162b2IIIApproved100[99]
French pharmaceutical company Sanofi$30-IIII-[94]
$2100-100[100,101]
Kentucky BioProcessing--III-[91,102]
Maryland-based Novavax $1600NVX-CoV2373 III100[103,104]
CanadaSanofi and GSK--IIII72[105]
The European Investment Bank (EIB) BioNTech€100BNT162b2IIIApproved-[106]
-€4900 ---250 [107]
European UnionBioNTech-BNT162b2IIIApproved200[108]
AstraZeneca-AZD1222IIIApproved400[109]
Sanofi--II-300[110]
RussiaGamaleya Research Institute- III+ *Early use-[111,112]
GermanyCureVac€300-IIII-[113,114]
SingaporeArcturus and Duke-NUS Medical School--I/IIII-[115]
France, Germany, Italy, and the NetherlandsOxford University/AstraZeneca$843.2-IIIApproved300[116]
JapanGerman-based BioNTech-BNT162b2IIIApproved120[117]
IndiaNovavax-NVX-CoV2373IIIIII2000[118]
ChinaSinopharm--III+ *Approved-[91]
Beijing Institute of Biological Products--III+ *Approved-[91]
Chinese company Sinovac Biotech--III+ *Approved-[91]
* III+ APPROVED FOR LIMITED USE.
Table 3. Pairwise comparison of Criteria concerning the main goal.
iCriteria 1 Criteria n
Criteria 1 x 1 ,   1 x 1 ,   n
Criteria n x n ,   1 x n ,   n
Table 4. Random index for a several matrix dimensions [160].
Number of Component or Matrix Dimensions (n)12345678910
RI000.580.91.121.241.321.411.451.51
Table 5. Pairwise comparison of decision maker components concerning components of criteria.
CriteriaDecision MakersDecision Maker 1 Decision Maker m
Criteria 1Decision maker 1 D 1 ,   1 1 D 1 ,   m 1
Decision maker m D m ,   1 1 D m ,   m 1
Criteria nDecision maker 1 D 1 ,   1 n D 1 ,   m n
Decision maker m D m ,   1 n D m ,   m n
Table 6. Pairwise comparison of factors (geo-based data) concerning components of decision maker.
Decision MakersFactorsFactor 1 Factor l
Decision maker 1Factor 1 F 1 ,   1 1 F 1 ,   l 1
-
-Factor l F l ,   1 1 F l ,   l 1
Decision maker mFactor 1 F 1 ,   1 m F 1 ,   l m
-
-Factor l F l ,   1 m F l ,   l m
Table 7. Pairwise comparison of alternatives concerning different components of Factors.
FactorsAlternativesAlternative 1-Alternative t
Factor 1Alternative 1 A 1 ,   1 1 A 1 ,   t 1
-
-Alternative t A t ,   1 1 A t ,   t 1
Factor mAlternative 1 A 1 ,   1 l A 1 ,   t l
-
-Alternative t A t ,   1 l A t ,   t l
Table 8. Pairwise comparison matrix of criteria.
iSuccess RateEconomicEnvironmentalSocialWeightCR
Success rate15750.610.09
Economic1/51330.20
Environmental1/71/311/30.06
Social1/51/3310.13
Table 9. Pairwise comparison matrix of decision makers.
CriteriaDecision MakersIndividualsGovernmentsInternational OrganizationsWeightCR
Success rateIndividuals1350.630.03
Governments1/3130.26
International organizations1/51/310.11
EconomicIndividuals11/71/30.080.06
Governments7150.72
International organizations31/510.19
EnvironmentalIndividuals1370.640.06
Governments1/3150.28
International organizations1/71/510.07
SocialIndividuals1350.630.03
Governments1/3130.26
International organizations1/51/310.11
Table 10. Pairwise comparison matrix of factors (geo-based data).
Decision MakersFactors
(Geo-Based)
Healthcare SystemPopulation FactorsClimate ConditionsUrban InfrastructureWeightCR
IndividualsHealthcare system17930.580.08
Population factors1/7151/30.12
Climate factors1/91/511/90.04
Urban infrastructure1/33910.27
GovernmentsHealthcare system 13770.600.03
Population factors1/31530.23
Climate factors1/71/511/30.06
Urban infrastructure1/71/3310.09
International organizationsHealthcare system 13930.510.09
Population factors1/31730.28
Climate conditions1/91/711/70.04
Urban infrastructure1/31/3710.17
Table 11. Pairwise comparison matrix of alternatives.
FactorsAlternativesPeriodic LockdownUse of Mask, Gloves, etc.Massive Vaccination Massive TestsWeightCR
Healthcare system capacityPeriodic lockdown131/51/50.010.07
Use of mask & gloves1/311/91/90.04
Massive vaccination59130.54
Massive tests591/310.32
Population factorsPeriodic lockdown11/71/91/70.040.10
Use of mask & gloves711/51/30.15
Massive vaccination95130.55
massive tests731/310.26
Climate factorsPeriodic lockdown19550.630.07
Use of mask & gloves1/911/31/30.06
Massive vaccination1/5311/30.12
Massive tests1/53310.20
Urban management infrastructurePeriodic lockdown11/91/71/50.040.06
Use of mask & gloves91350.56
Massive vaccination71/3130.27
Massive tests51/51/310.13
Table 12. The RIC values for alternatives concerning the goal.
AlternativesRICFinal Rank
Periodic lockdown0.014
Use of facemask & gloves0.173
Massive vaccination0.471
Massive swabs or other tests0.272
Table 13. The structure and descriptions of nodes in the developed BN-Geo-AHP.
Node NameNode Levels in the Bayesian NetworkNode StatesNode Type
Sustainability, feasibility and success rate of approachesGoal-Utility node
Success rateCriteriaLow, HighProbability nodes
Economic
Environmental
Social
IndividualsDecision-makers
Governments
International organizations
Healthcare capacityFactors
Population factors
Climate factors
Urban infrastructure
Periodic lockdownAlternatives-Decision nodes
Use of mask and gloves
Massive vaccination
Massive swabs or other tests
Table 14. Probability table of the Criteria.
Node NameLow (L) Probability ValueHigh (H) Probability Value
Success rateP(Success rate = L)P(Success rate = H)
EconomicP(Economic = L)P(Economic = H)
EnvironmentalP(Environmental = L)P(Environmental = H)
SocialP(Social = L)P(Social = H)
Table 15. Conditional probability table of the decision makers.
SRECENSO P ( I = L | S R ,   E C ,   E n ,   S o ) P ( I = H | S R ,   E C ,   E n ,   S o )
LLLL P ( I = L | S R = L ,   E C = L ,     E n = L ,   S o = L ) P ( I = H | S R = L ,   E C = L ,     E n = L ,   S o = L )
LLLH P ( I = L | S R = L ,   E C = L ,     E n = L ,   S o = H ) P ( I = H | S R = L ,   E C = L ,     E n = L ,   S o = H )
LLHL P ( I = L | S R = L ,   E C = L ,     E n = H ,   S o = L ) P ( I = H | S R = L ,   E C = L ,     E n = H ,   S o = L )
LHLL P ( I = L | S R = L ,   E C = H ,     E n = L ,   S o = L ) P ( I = H | S R = L ,   E C = H ,     E n = L ,   S o = L )
HLLL P ( I = L | S R = H ,   E C = L ,     E n = L ,   S o = L ) P ( I = H | S R = H ,   E C = L ,     E n = L ,   S o = L )
LLHH P ( I = L | S R = L ,   E C = L ,     E n = H ,   S o = H ) P ( I = H | S R = L ,   E C = L ,     E n = H ,   S o = H )
LHLH P ( I = L | S R = L ,   E C = H ,     E n = L ,   S o = H ) P ( I = H | S R = L ,   E C = H ,     E n = L ,   S o = H )
HLLH P ( I = L | S R = H ,   E C = L ,     E n = L ,   S o = H ) P ( I = H | S R = H ,   E C = L ,     E n = L ,   S o = H )
LHHL P ( I = L | S R = L ,   E C = H ,     E n = H ,   S o = L ) P ( I = H | S R = L ,   E C = H ,     E n = H ,   S o = L )
HLHL P ( I = L | S R = H ,   E C = L ,     E n = H ,   S o = L ) P ( I = H | S R = H ,   E C = L ,     E n = H ,   S o = L )
HHLL P ( I = L | S R = H ,   E C = H ,     E n = L ,   S o = L ) P ( I = H | S R = H ,   E C = H ,     E n = L ,   S o = L )
HHHL P ( I = L | S R = H ,   E C = H ,     E n = H ,   S o = L ) P ( I = H | S R = H ,   E C = H ,     E n = H ,   S o = L )
HHLH P ( I = L | S R = H ,   E C = H ,     E n = L ,   S o = H ) P ( I = H | S R = H ,   E C = H ,     E n = L ,   S o = H )
HLHH P ( I = L | S R = H ,   E C = L ,     E n = H ,   S o = H ) P ( I = H | S R = H ,   E C = L ,     E n = H ,   S o = H )
LHHH P ( I = L | S R = L ,   E C = H ,     E n = H ,   S o = H ) P ( I = H | S R = L ,   E C = H ,     E n = H ,   S o = H )
HHHH P ( I = L | S R = H ,   E C = H ,     E n = H ,   S o = H ) P ( I = H | S R = H ,   E C = H ,     E n = H ,   S o = H )
In Table 15. the layer of decision makers: I = individuals, governments, and international organizations, and in its higher layer criteria: success rate (SR), economic (Ec), environmental (En), social (So).
Table 16. Conditional probability table for factors (geo-based data).
INGOIO P ( J = L | I N ,   G O ,   I O ) P ( J = H | I N ,   G O ,   I O )
LLL P ( J = L | I N = L ,   G O = L ,   I O = L ) P ( J = H | I N = L ,   G O = L ,   I O = L )
LLH P ( J = L | I N = L ,   G O = L ,   I O = H ) P ( J = H | I N = L ,   G O = L ,   I O = H )
LHL P ( J = L | I N = L ,   G O = H ,   I O = L ) P ( J = H | I N = L ,   G O = H ,   I O = L )
HLL P ( J = L | I N = H ,   G O = L ,   I O = L ) P ( J = H | I N = H ,   G O = L ,   I O = L )
LHH P ( J = L | I N = L ,   G O = H ,   I O = H ) P ( J = H | I N = L ,   G O = H ,   I O = H )
HLH P ( J = L | I N = H ,   G O = L ,   I O = H ) P ( J = H | I N = H ,   G O = L ,   I O = H )
HHL P ( J = L | I N = H ,   G O = H ,   I O = L ) P ( J = H | I N = H ,   G O = H ,   I O = L )
HHH P ( J = L | I N = H ,   G O = H ,   I O = H ) P ( J = H | I N = H ,   G O = H ,   I O = H )
In Table 16, the layer of factors: J = healthcare capacity, population factors, climate factors, urban infrastructure, and in its higher layer decision makers: individuals (IN), governments (GO) and international organizations (IO).
Publisher’s Note: MDPI stays neutral with regard to jurisdictional claims in published maps and institutional affiliations.

