
Examining the Impact of Different DEM Sources and Geomorphology on Flash Flood Analysis in Hyper-Arid Deserts

 , ,
, ,
Abstract
:1. Introduction
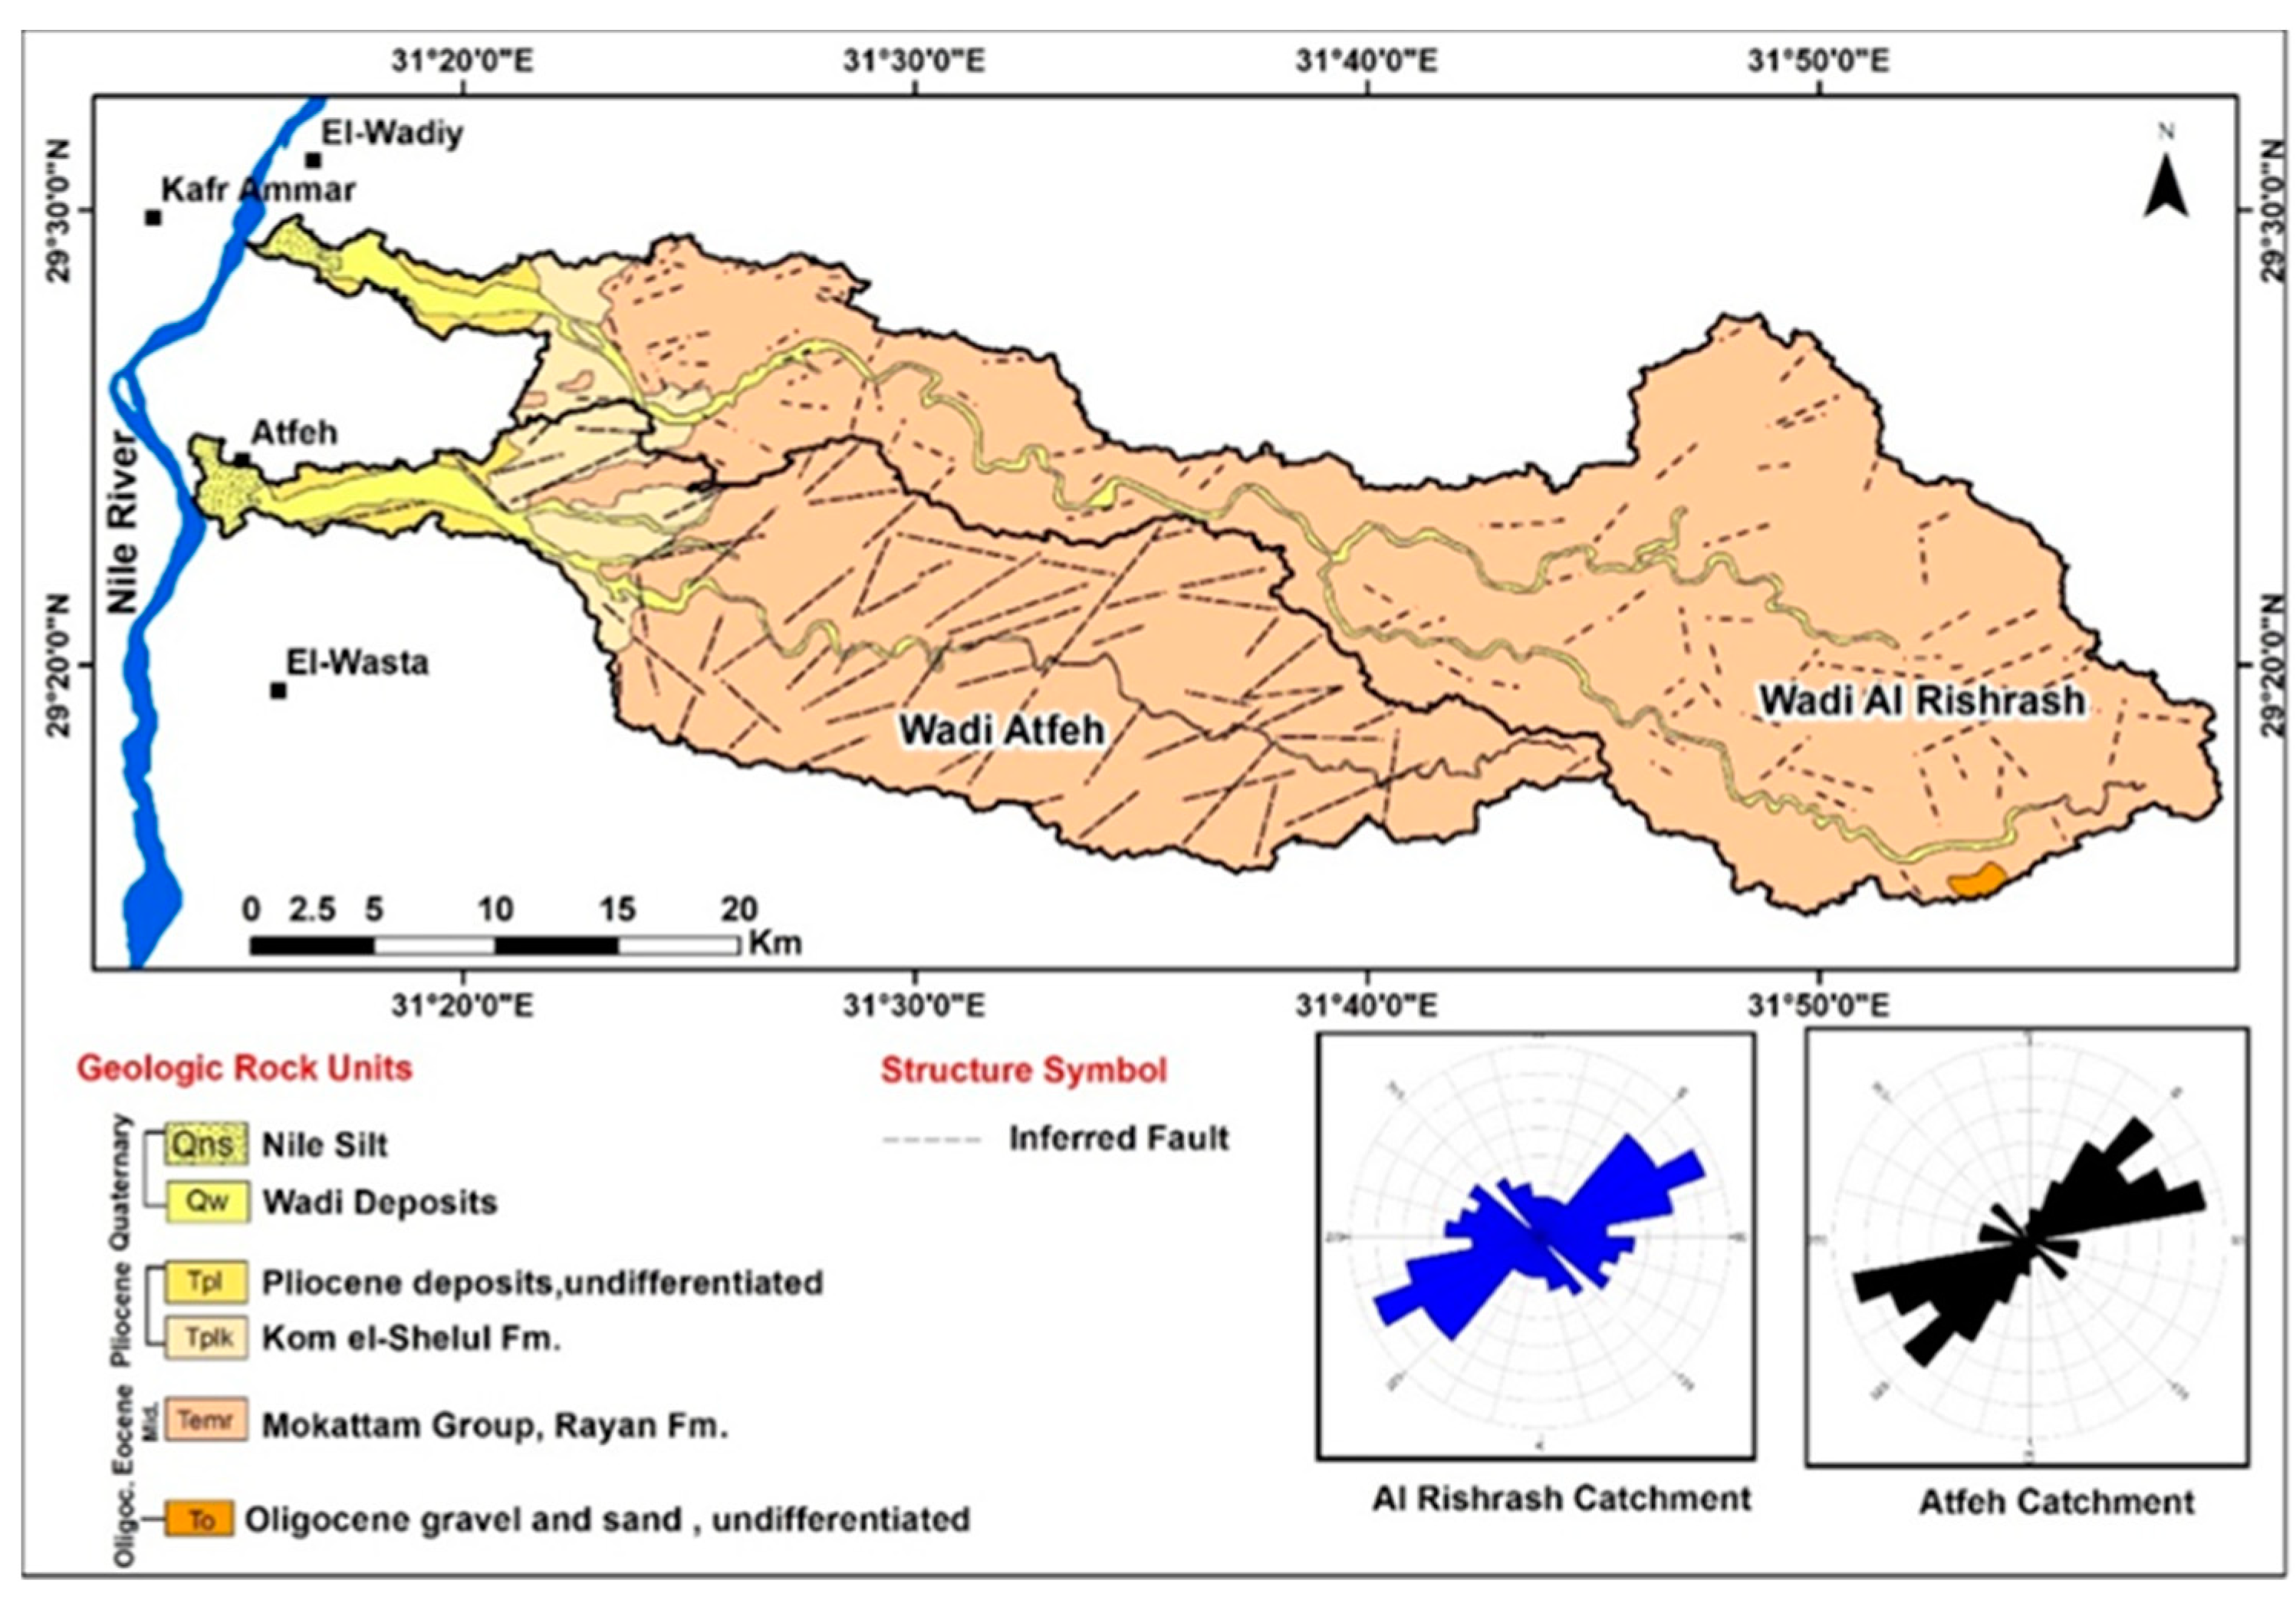
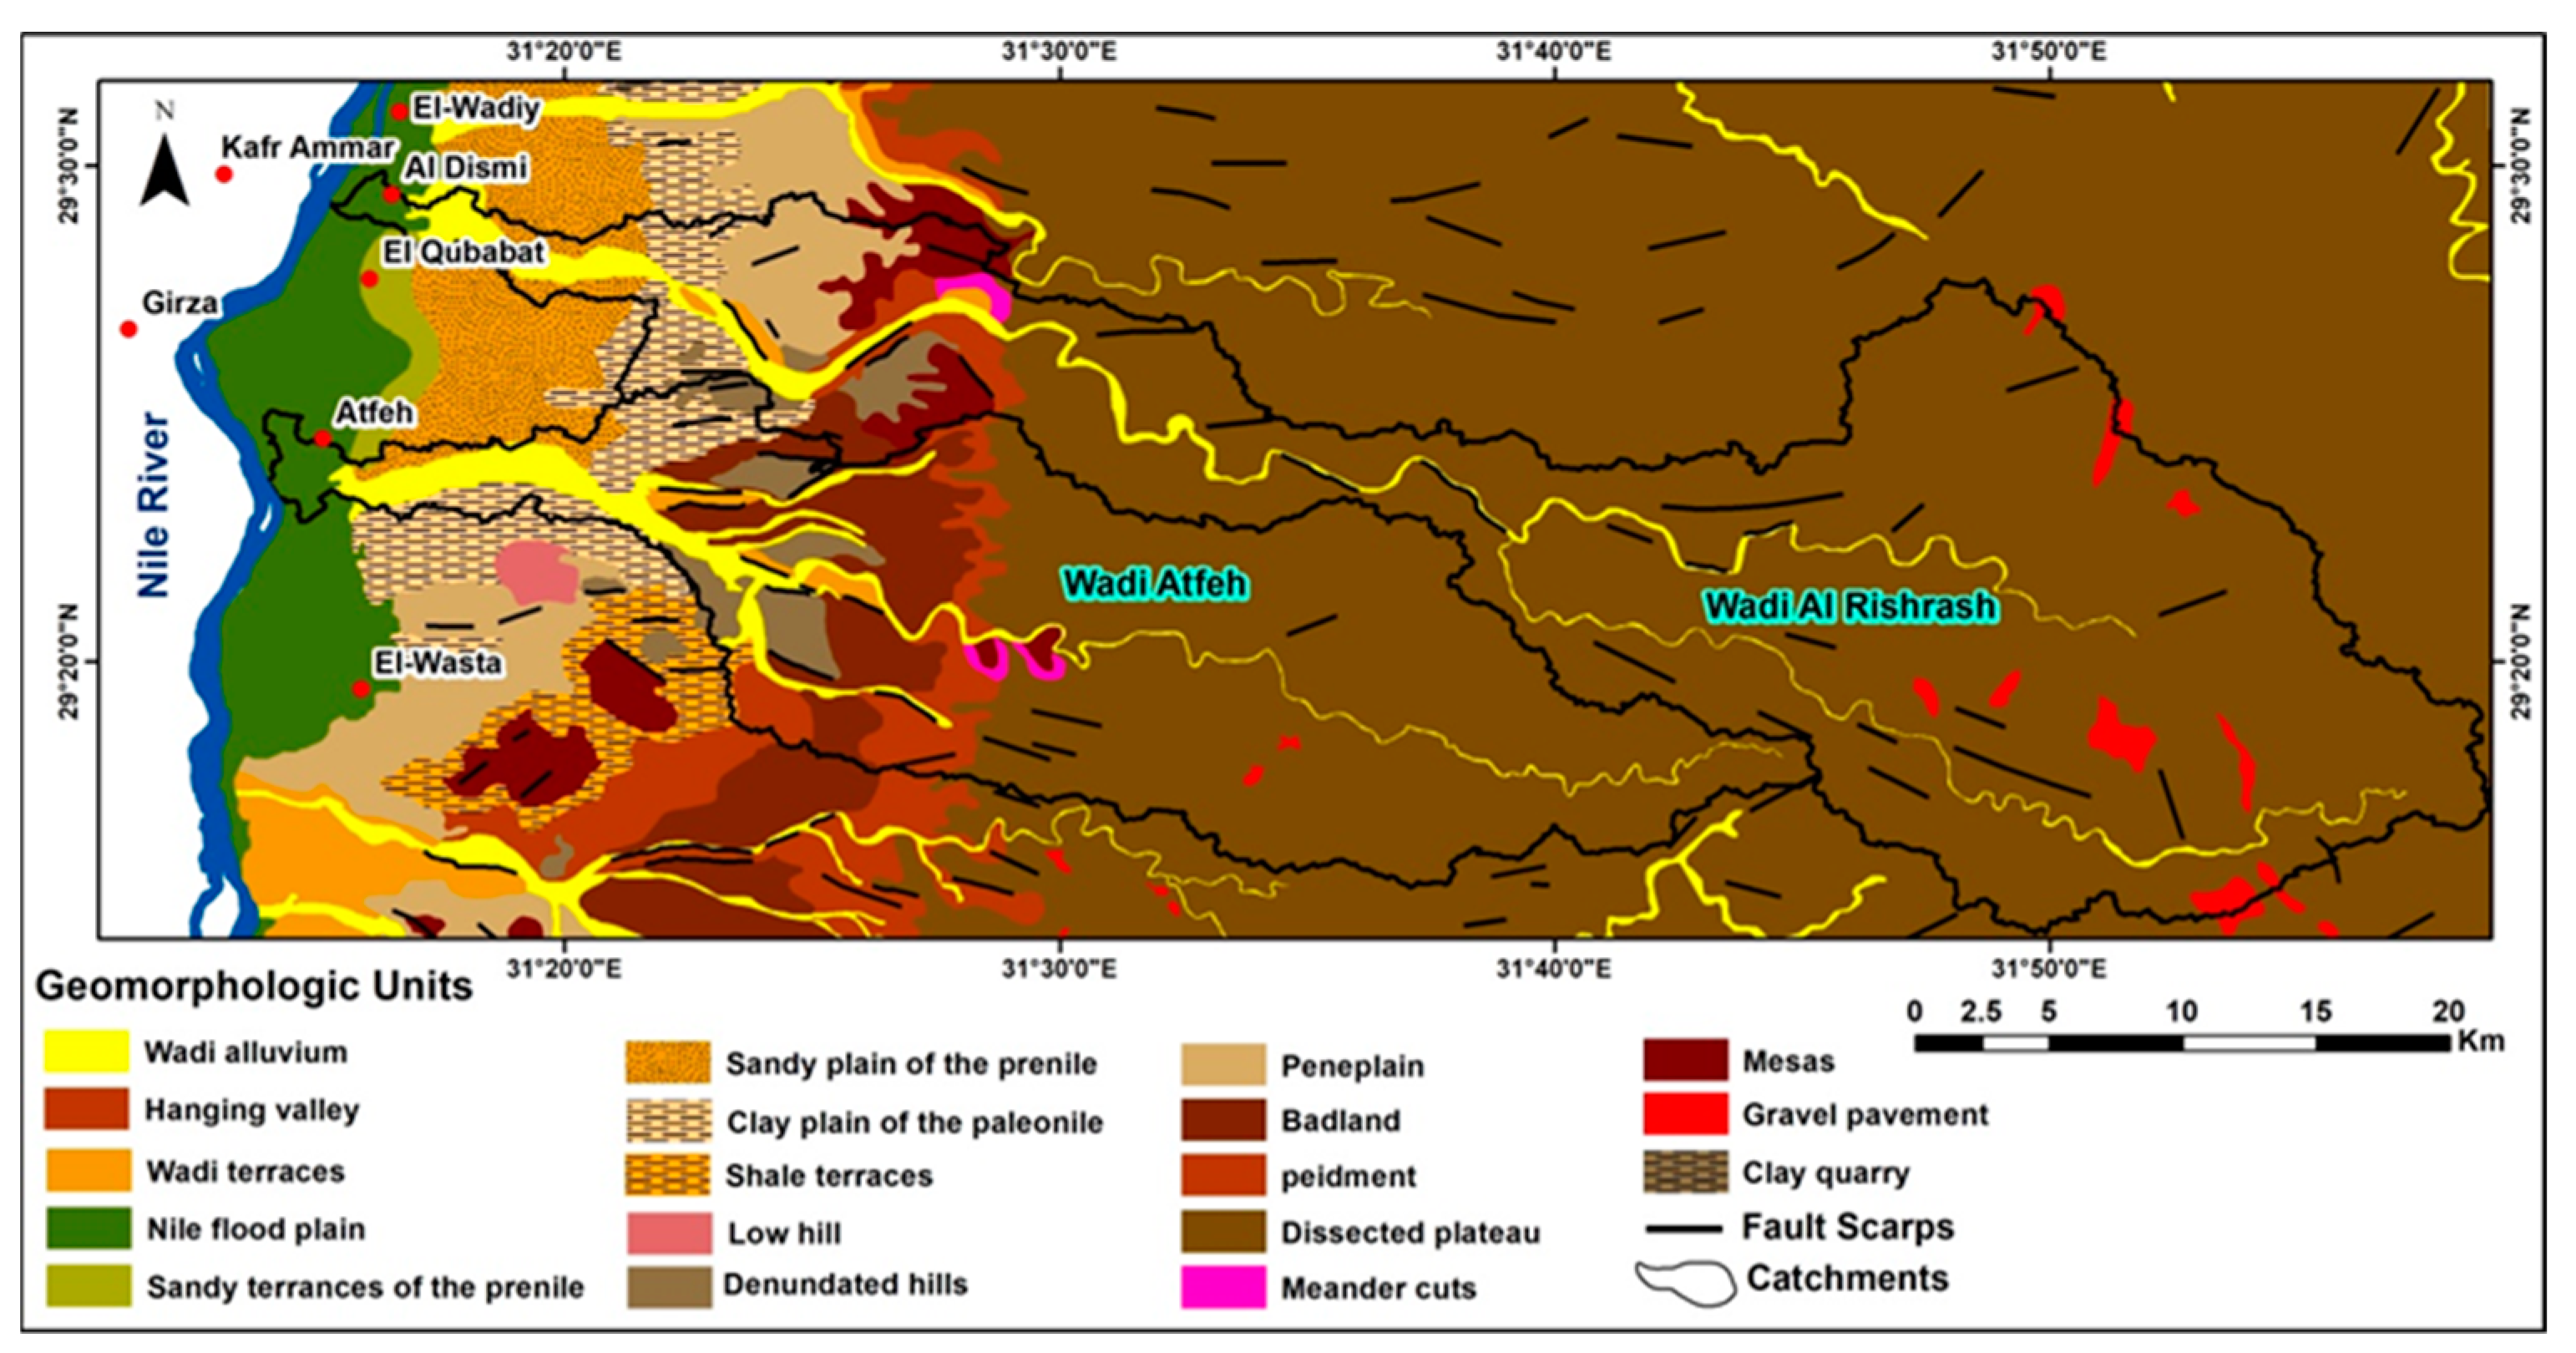
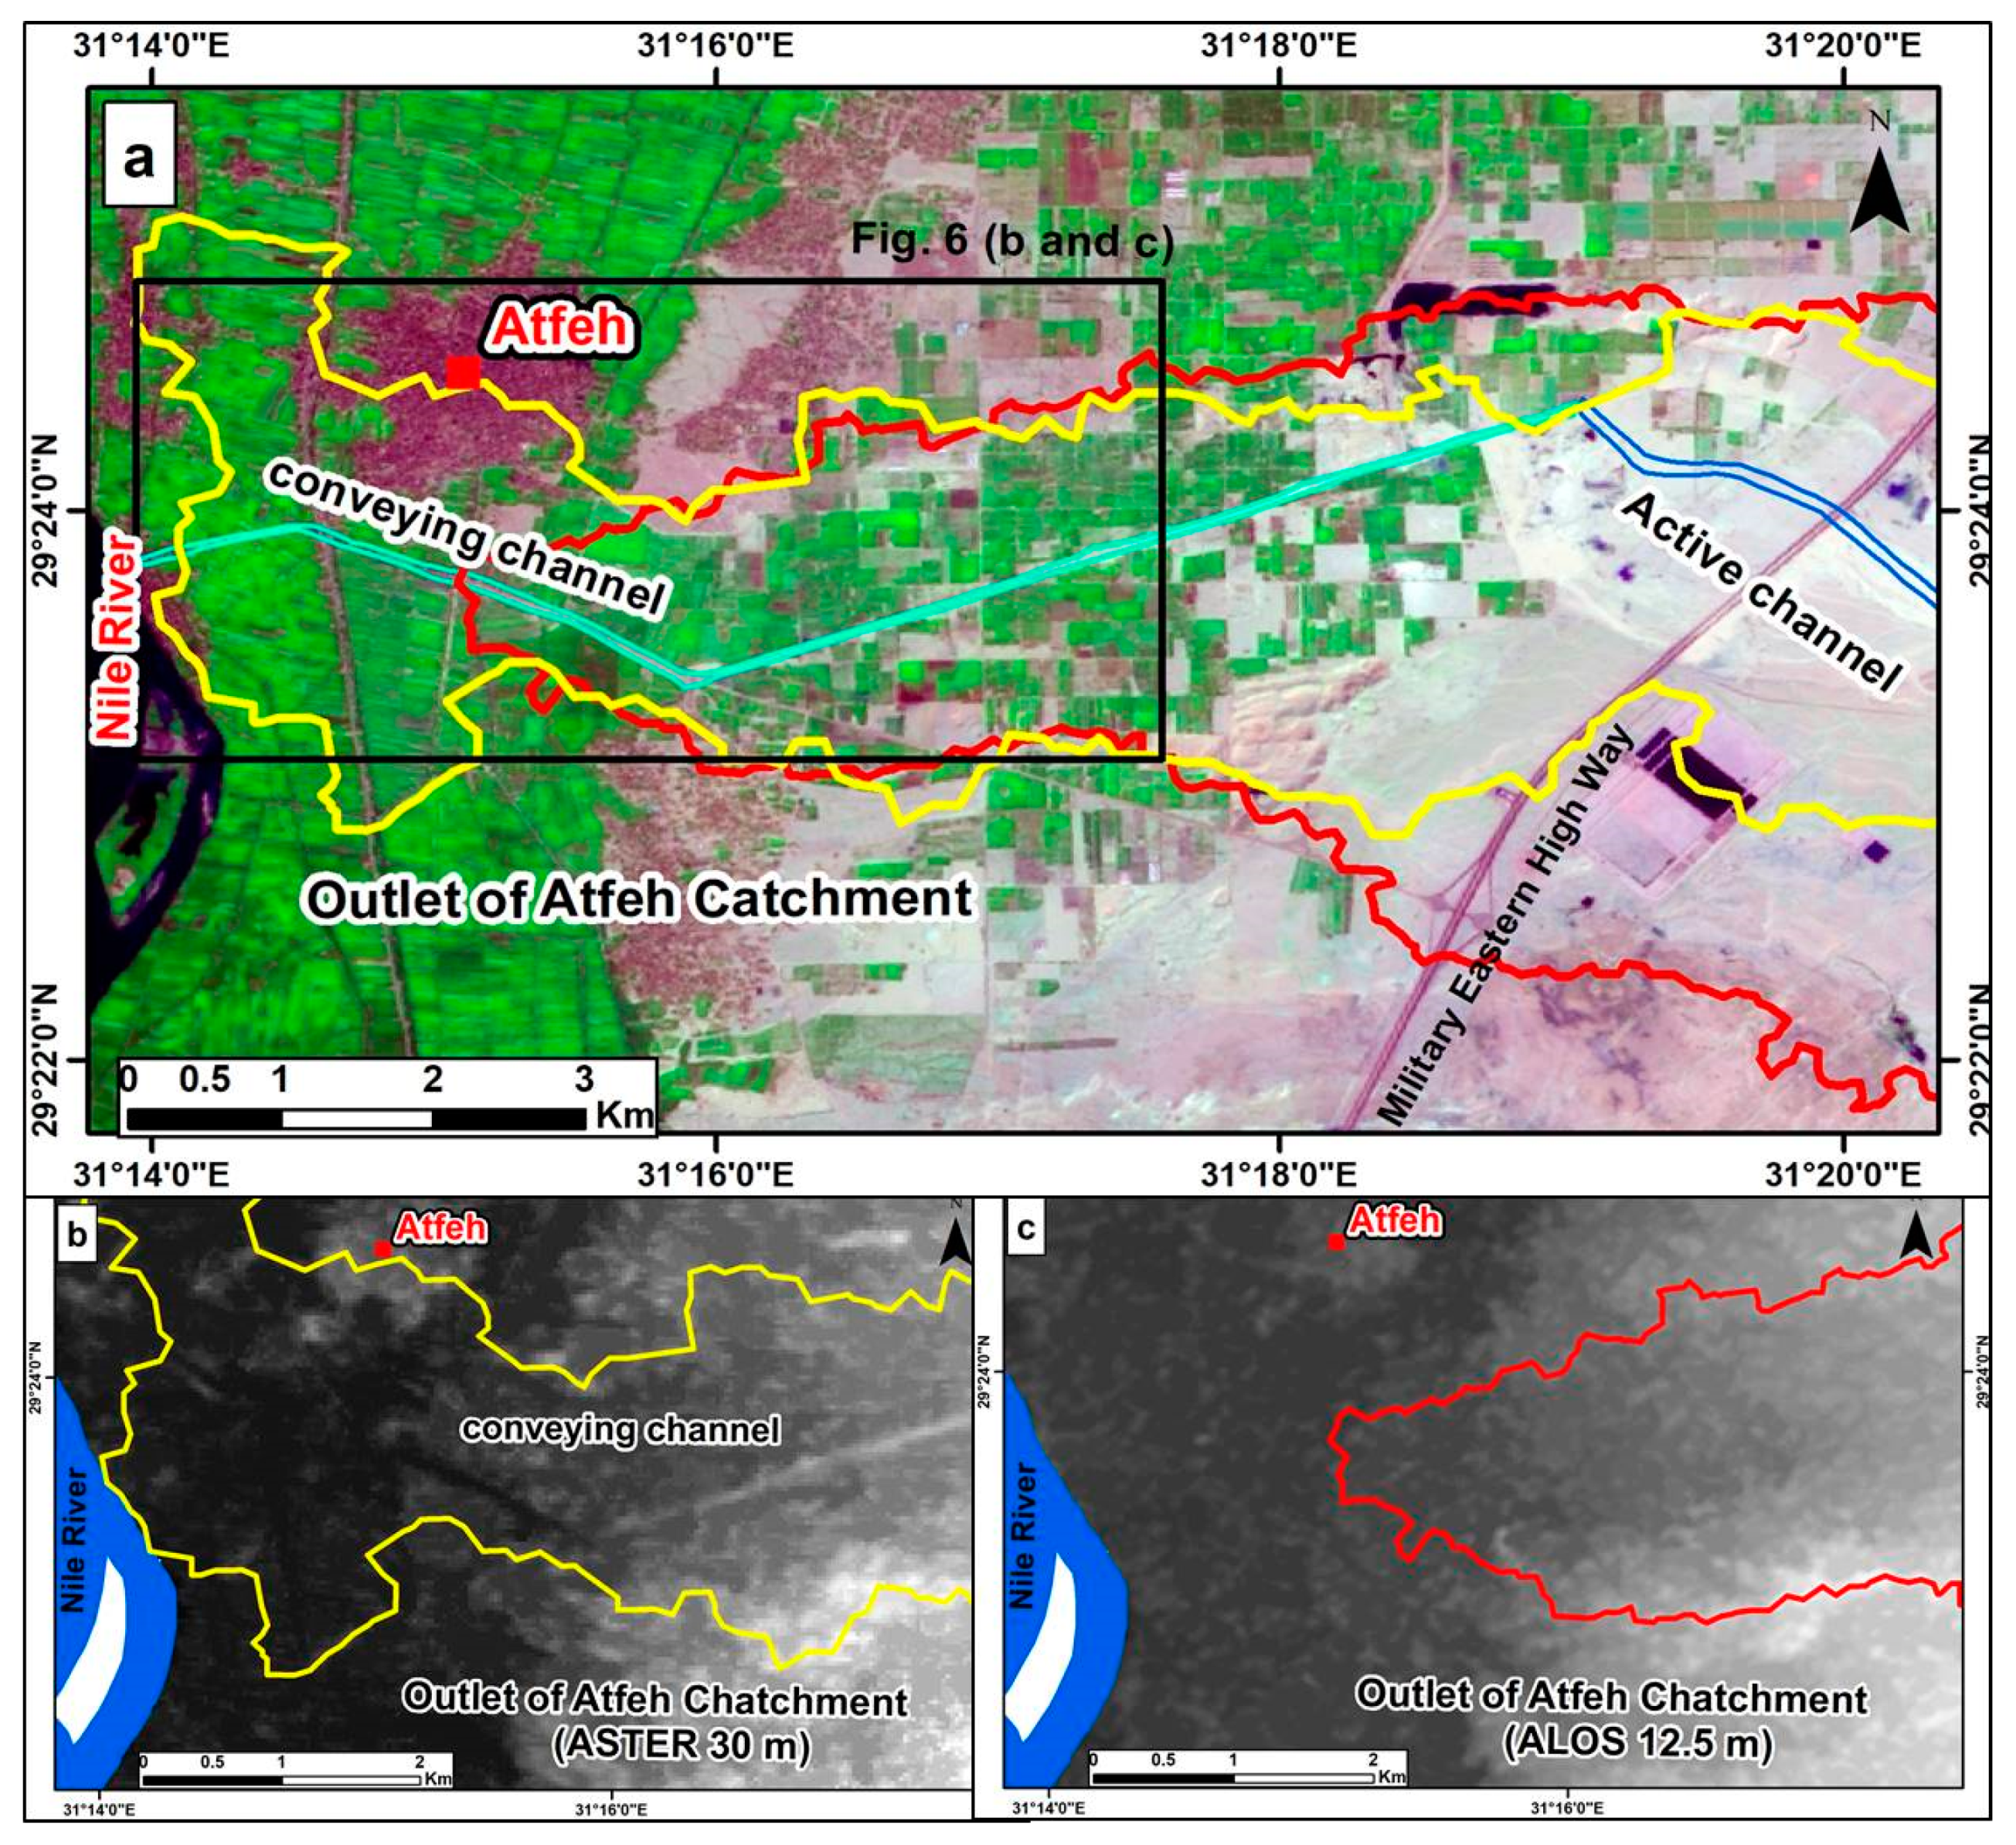
2. Study Area
3. Materials and Methods
3.1. Data Used
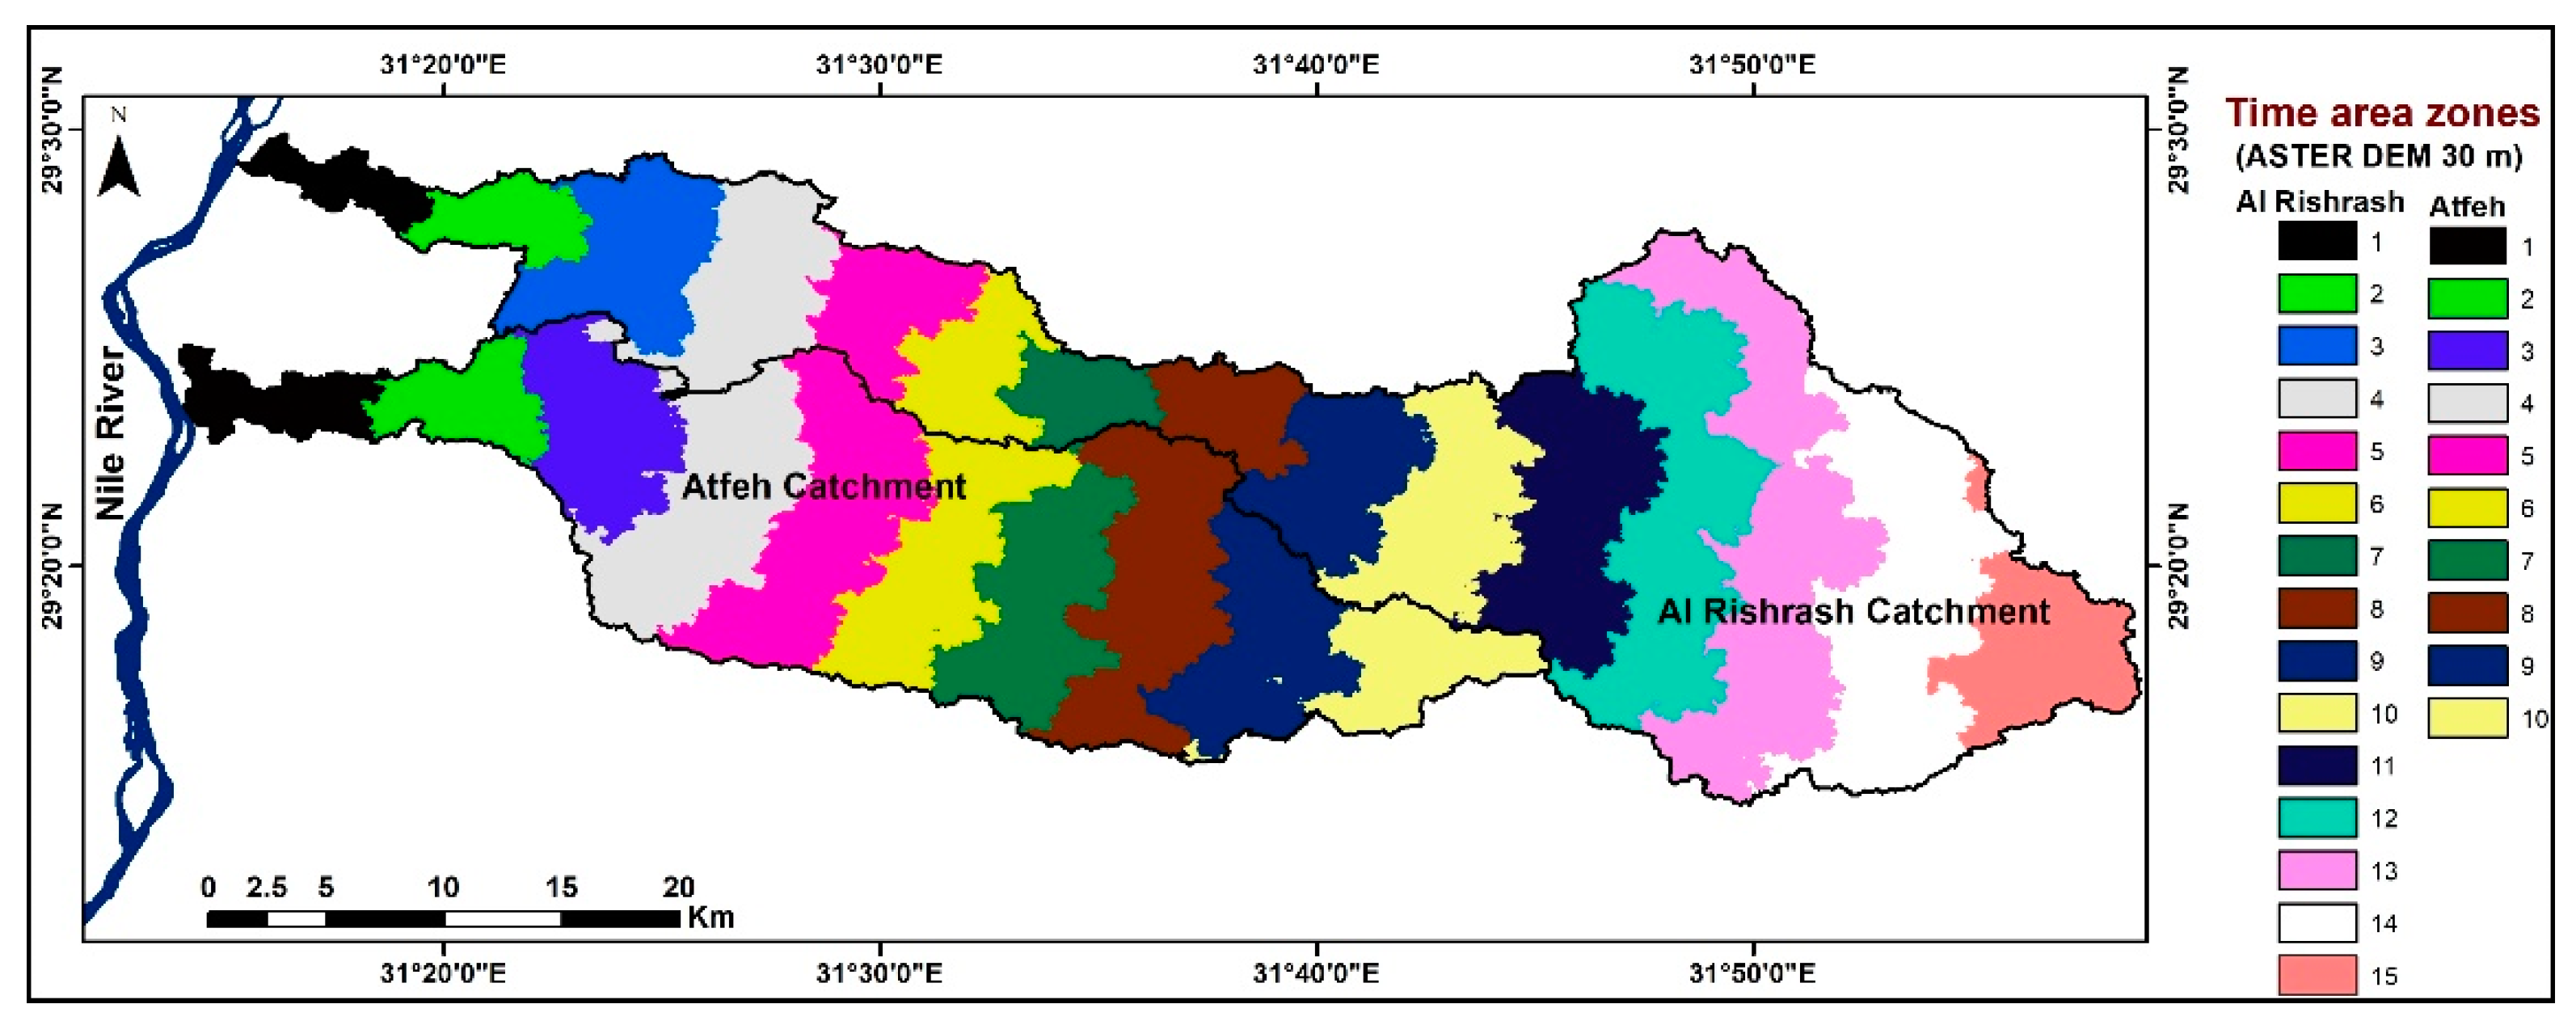
3.2. Estimation of the Hydrographs
4. Results
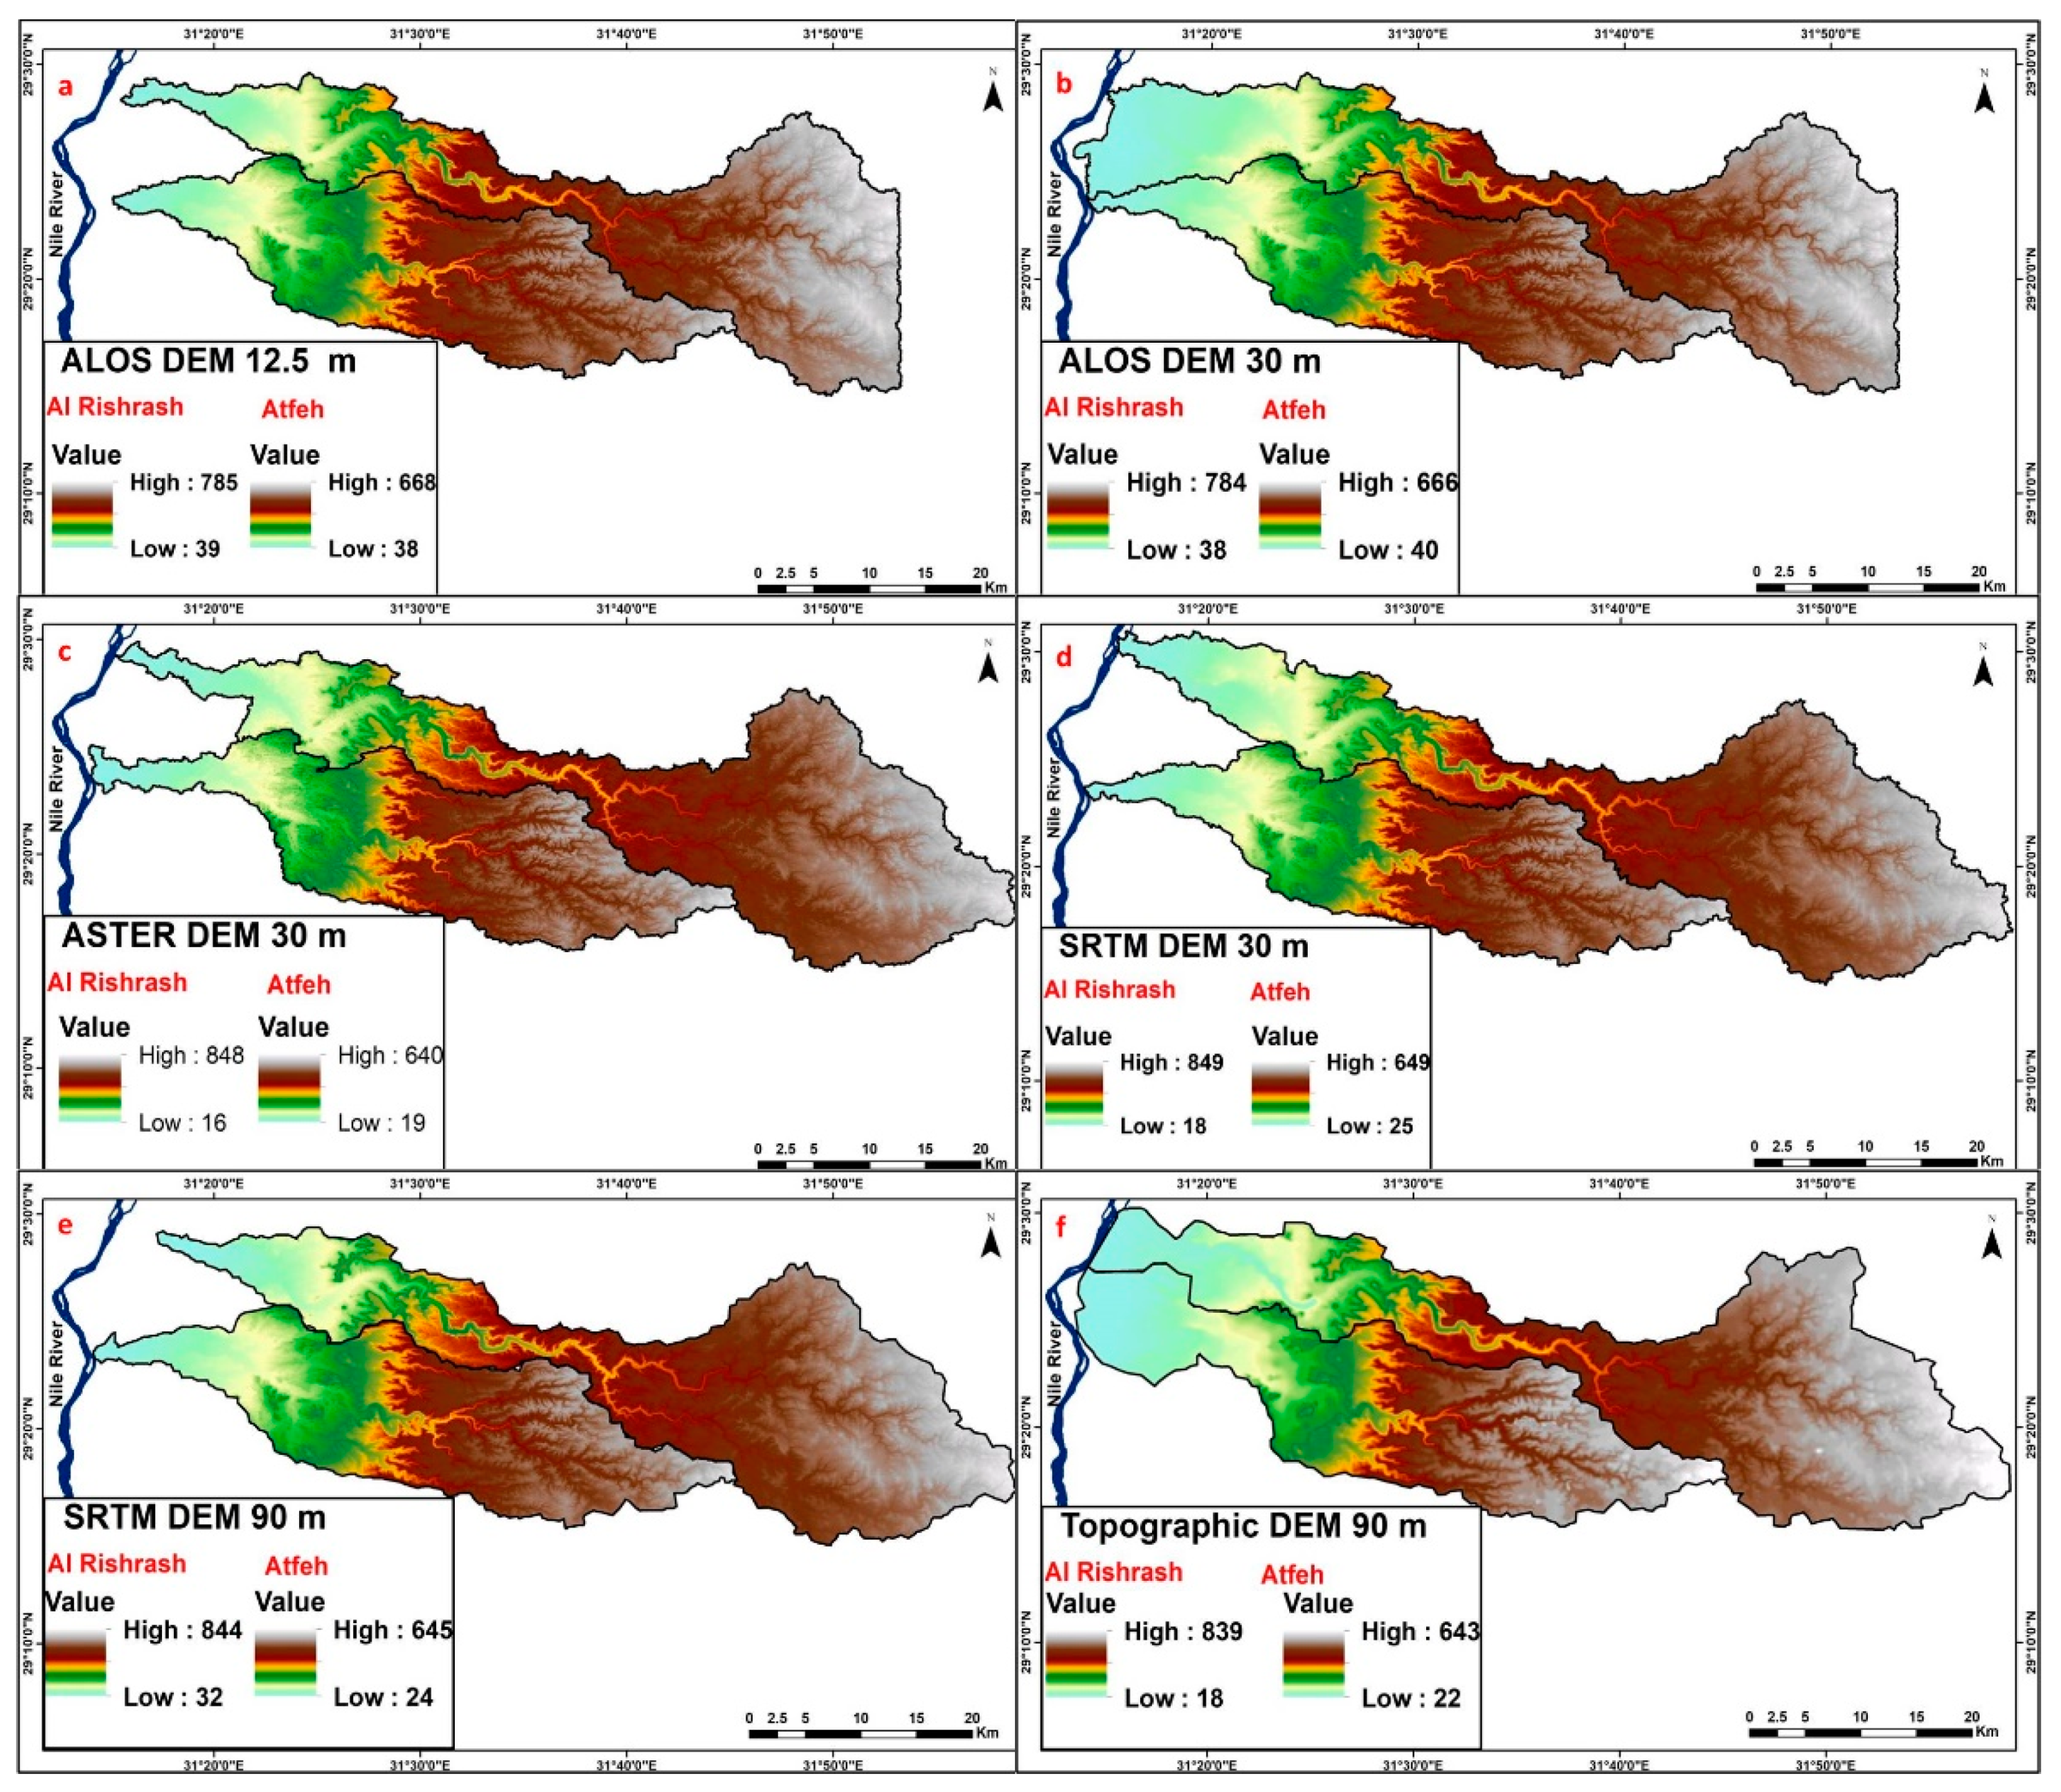
4.1. Topographic Analyses
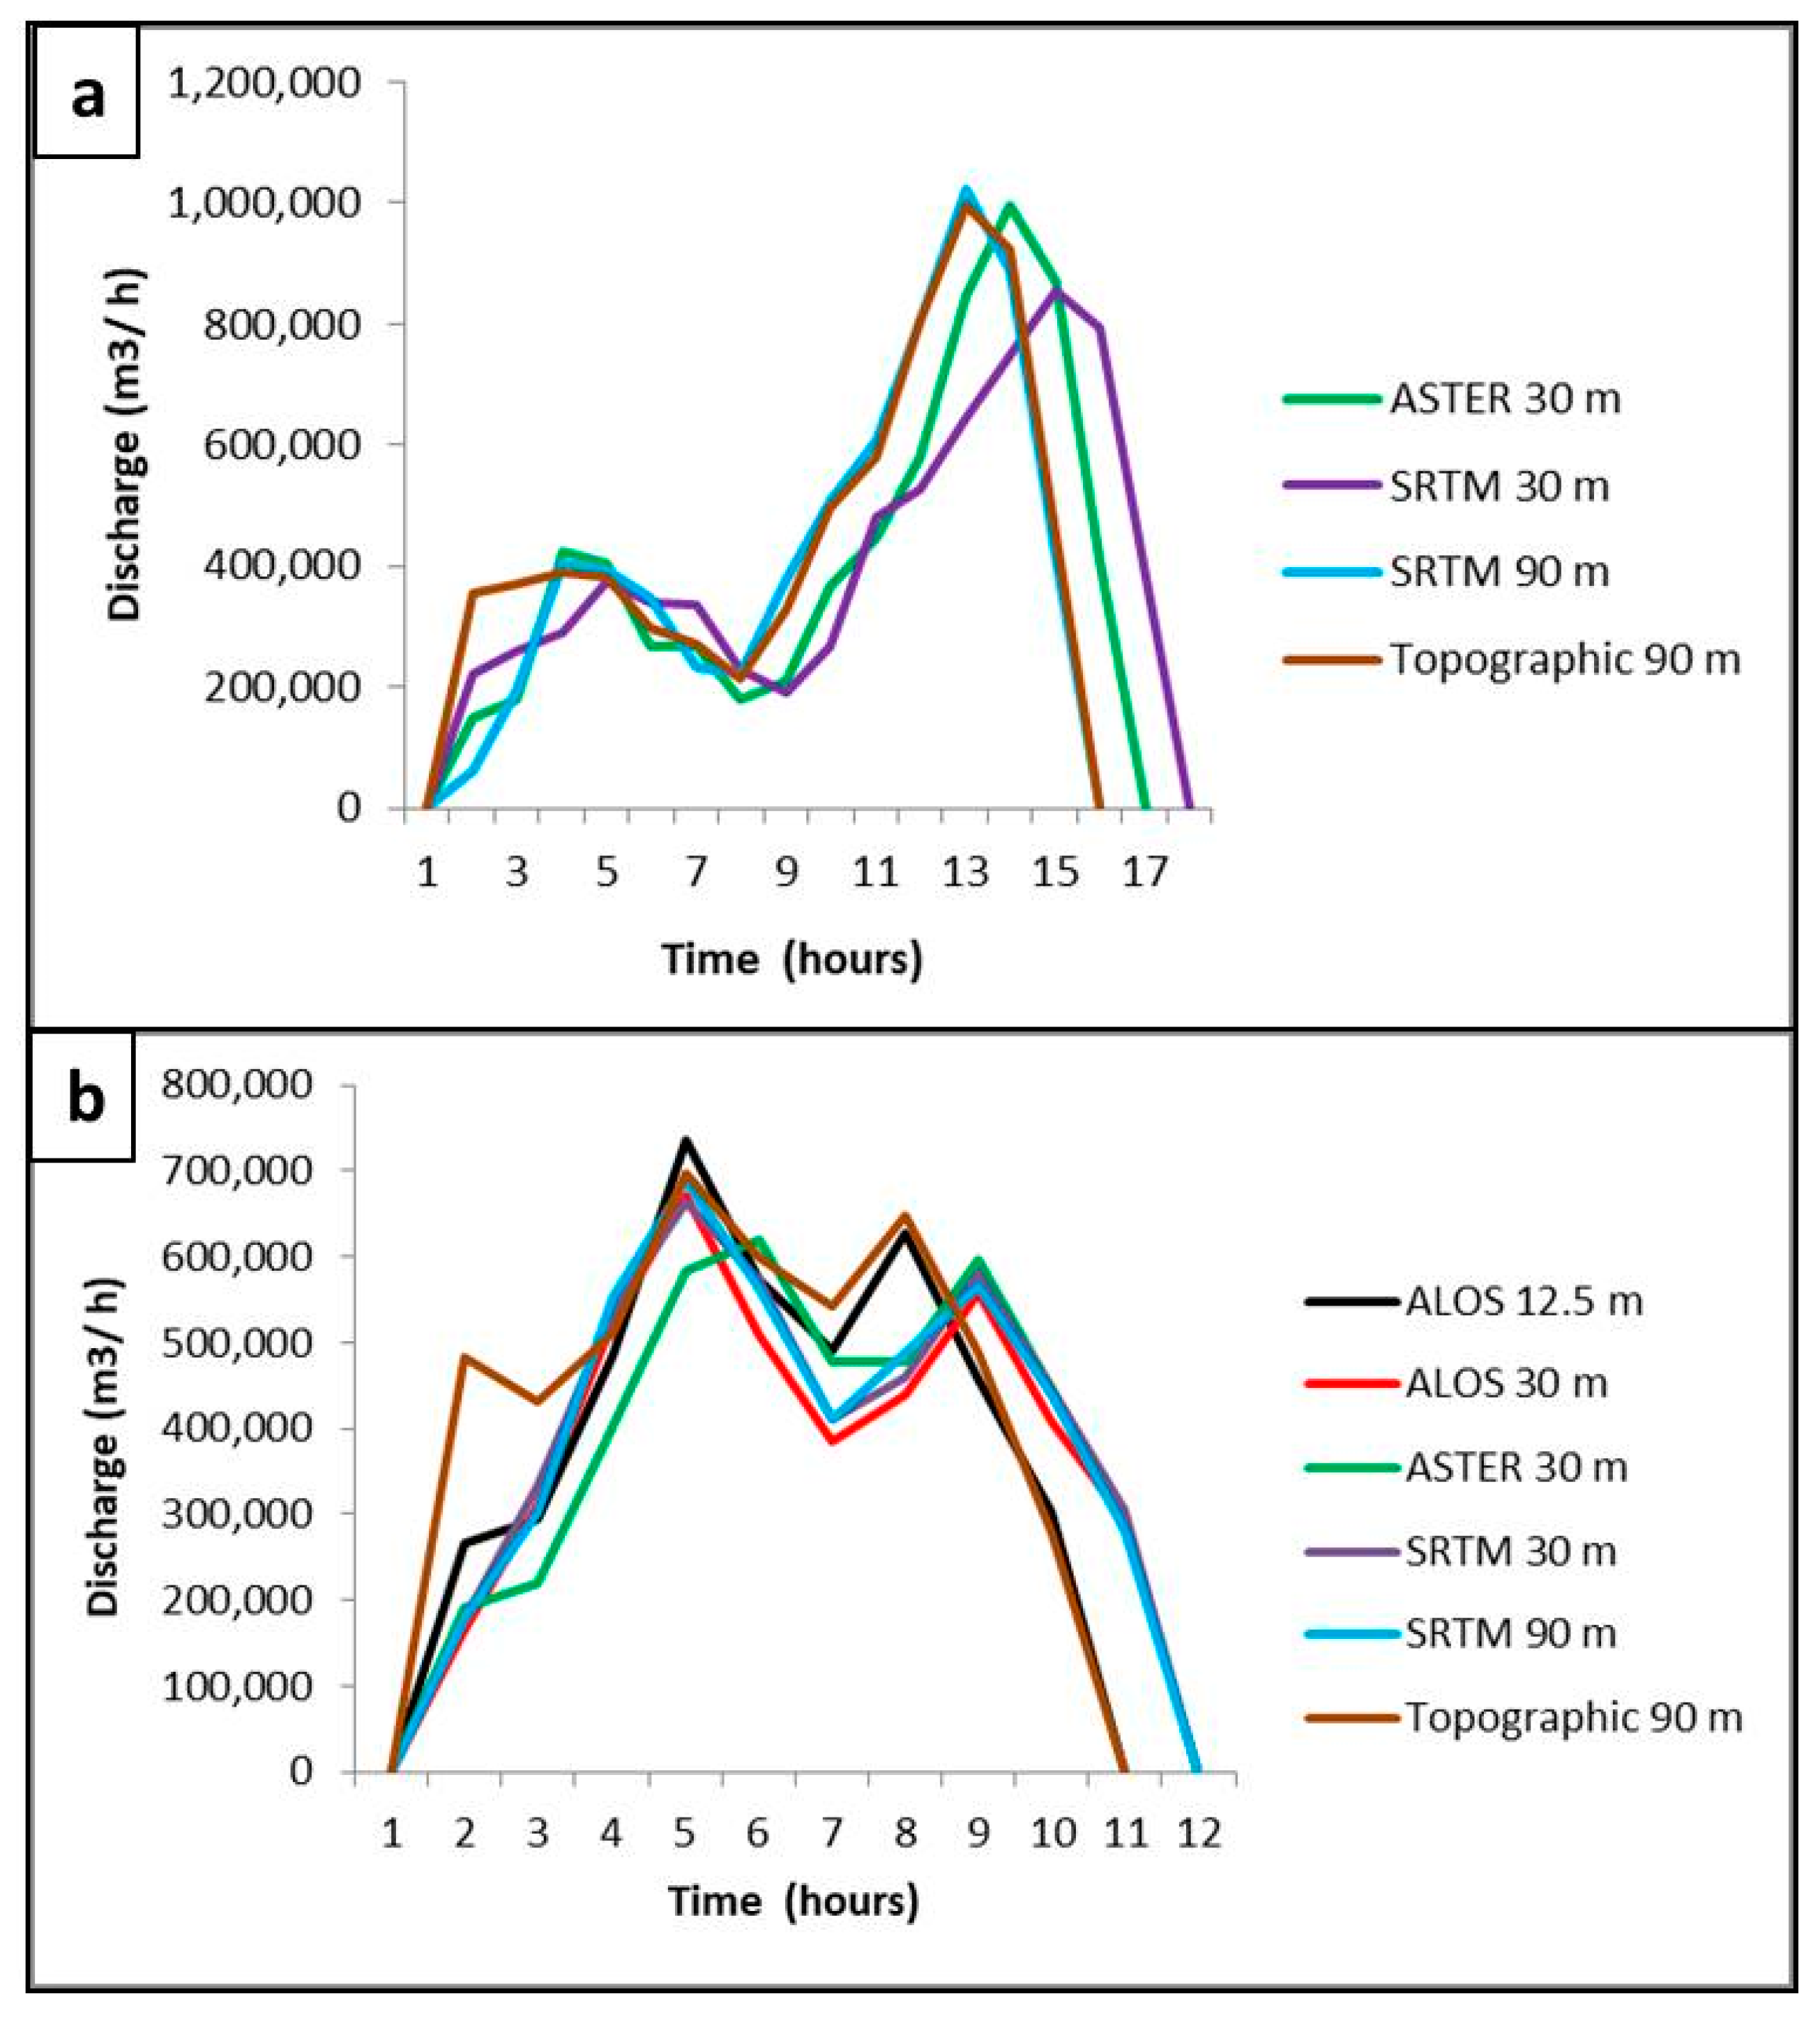
4.2. Hydrological Analyses and Resulting Hydrographs
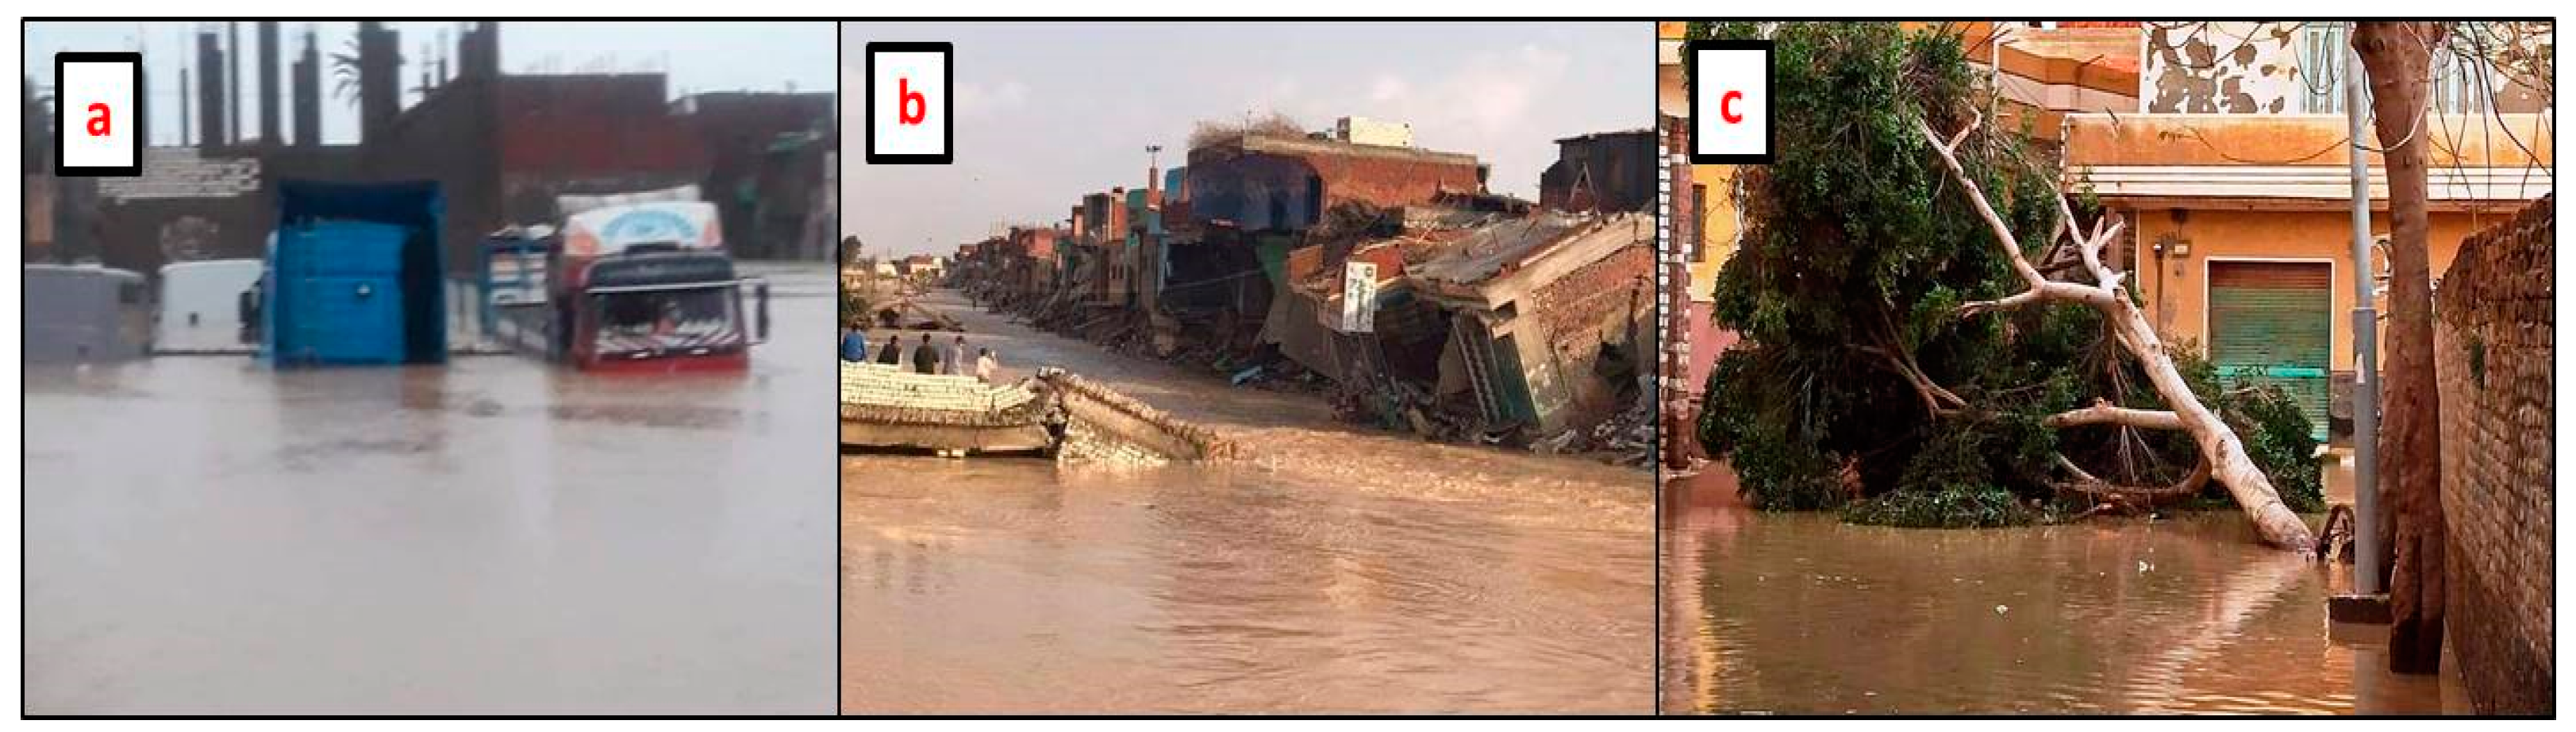
4.3. The Environmental Impacts of the March 2020 Flash Flood Event
5. Discussion
6. Conclusions
Author Contributions
Funding
Institutional Review Board Statement
Informed Consent Statement
Data Availability Statement
Acknowledgments
Conflicts of Interest
References
- López-Vicente, M.; Álvarez, S. Influence of DEM Resolution on Modelling Hydrological Connectivity in a Complex Agricultural Catchment with Woody Crops. Earth Surf. Process. Landf. 2018, 43, 1403–1415. [Google Scholar] [CrossRef]
- Mouratidis, A.; Sarti, F. Flash-Flood Monitoring and Damage Assessment with SAR Data: Issues and Future Challenges for Earth Observation from Space Sustained by Case Studies from the Balkans and Eastern Europe. In Earth Observation of Global Changes (EOGC); Krisp, J., Meng, L., Pail, R., Stilla, U., Eds.; Lecture Notes in Geoinformation and Cartography; Springer: Berlin/Heidelberg, Germany, 2013. [Google Scholar]
- Abbas, M.; Carling, P.; Jansen, J.; Al-Saqara, B. Flash-flood hydrology and aquifer-recharge in Wadi Umm Sidr, Eastern Desert, Egypt. J. Arid Environ. 2020, 178, 104170. [Google Scholar] [CrossRef]
- El-Saadawy, O.; Gaber, A.; Othman, A.; Abotalib, A.Z.; El Bastawesy, M.; Attwa, M. Modeling Flash Floods and Induced Recharge into Alluvial Aquifers using Multi-Temporal Remote Sensing and Electrical Resistivity Imaging. Sustainability 2020, 12, 10204. [Google Scholar] [CrossRef]
- Nikolakopoulos, K.G.; Geniataki, S.; Gianou, S. Suitability of DSM derived from remote sensing data for automatic drainage extraction. In Remote Sensing for Agriculture, Ecosystems, and Hydrology XVI; International Society for Optics and Photonics: Bellingham, DC, USA, 2014; Volume 9239, p. 92390I. [Google Scholar]
- Czubski, K.; Kozak, J.; Kolecka, N. Accuracy of SRTM-X and ASTER Elevation Data and its Influence on Topographical and Hydrological Modeling: Case Study of the Pieniny Mts. in Poland. Intern. J. Geoinf. 2013, 1, 9. [Google Scholar]
- De Carvalho, O.A.; Guimarães, R.F.; Montgomery, D.R.; Gillespie, A.R.; Trancoso Gomes, R.A.; de Souza Martins, É.; Silva, N.C. Karst depression detection using ASTER, ALOS/PRISM and SRTM-derived digital elevation models in the Bambuí Group, Brazil. Remote Sens. 2014, 6, 330–351. [Google Scholar] [CrossRef] [Green Version]
- Khalil, M.M.; Tokunaga, T.; Heggy, E.; Abotalib, A.Z. Groundwater Mixing in Shallow Aquifers Stressed by Land Cover/Land use Changes Under Hyper-Arid Conditions. J. Hydrol. 2021, 598, 126245. [Google Scholar] [CrossRef]
- Yousif, M.; Hussien, H.M.; Abotalib, A.Z. The Respective Roles of Modern and Paleo Recharge to Alluvium Aquifers in Continental Rift Basins: A Case Study from El Qaa Plain, Sinai, Egypt. Sci. Total Environ. 2020, 739, 139927. [Google Scholar] [CrossRef]
- Doctor, D.H.; Young, J.A. An Evaluation of Automated GIS Tools for Delineating Karst Sinkholes and Closed Depressions from 1-Meter Lidar-Derived Digital Elevation Data; 13th Sinkhole Conference, NCKRI Symposium 2. pp. 449–458. Available online: https://www.researchgate.net/publication/250998030_An_Evaluation_of_Automated_GIS_Tools_for_Delineating_Karst_Sinkholes_and_Closed_Depressions_from_1-Meter_LiDAR-Derived_Digital_Elevation_Data (accessed on 23 June 2021).
- Psomiadis, E.; Tomanis, L.; Kavvadias, A.; Soulis, K.X.; Charizopoulos, N.; Michas, S. Potential dam breach analysis and flood wave risk assessment using HEC-RAS and remote sensing data: A multicriteria approach. Water 2021, 13, 364. [Google Scholar] [CrossRef]
- Psomiadis, E.; Soulis, K.X.; Zoka, M.; Dercas, N. Synergistic approach of remote sensing and GIS techniques for flash-flood monitoring and damage assessment in Thessaly Plain Area, Greece. Water 2019, 11, 448. [Google Scholar] [CrossRef] [Green Version]
- Mouratidis, A.; Karadimou, G.; Ampatzidis, D. Extraction and Validation of Geomorphological Features from EU-DEM in the Vicinity of the Mygdonia Basin, Northern Greece. In IOP Conference Series: Earth and Environmental Science; IOP Publishing: Bristol, UK, 2017; Volume 95, p. 032009. [Google Scholar]
- Garcia, G.; Grohmann, C. DEM-based geomorphological mapping and landforms characterization of a tropical karst environment in southeastern Brazil. J. S. Am. Earth Sci. 2019, 93, 14–22. [Google Scholar] [CrossRef] [Green Version]
- González-Moradas, M.; Viveen, W. Evaluation of ASTER GDEM2, SRTMv3.0, ALOS AW3D30 and TanDEM-X DEMs for the Peruvian Andes against highly accurate GNSS ground control points and geomorphological-hydrological metrics. Remote Sens. Environ. 2020, 237, 111509. [Google Scholar] [CrossRef]
- Hirt, C.; Filmer, M.S.; Featherstone, W.E. Comparison and Validation of the Recent Freely Available ASTER-GDEM Ver1, SRTM Ver4. 1 and GEODATA DEM-9S Ver3 Digital Elevation Models over Australia. Aust. J. Earth Sci. 2010, 57, 337–347. [Google Scholar] [CrossRef] [Green Version]
- Satgé, F.; Bonnet, M.; Timouk, F.; Calmant, S.; Pillco, R.; Molina, J.; Lavado-Casimiro, W.; Arsen, A.; Crétaux, J.F.; Garnier, J. Accuracy Assessment of SRTM V4 and ASTER GDEM V2 Over the Altiplano Watershed using ICESat/GLAS Data. Int. J. Remote Sens. 2015, 36, 465–488. [Google Scholar] [CrossRef]
- Elkadiri, R.; Manche, C.; Sultan, M.; Al-Dousari, A.; Uddin, S.; Chouinard, K.; Abotalib, A.Z. Development of a Coupled Spatiotemporal Algal Bloom Model for Coastal Areas: A Remote Sensing and Data Mining-Based Approach. IEEE J. Sel. Top. Appl. Earth Obs. Remote Sens. 2016, 9, 5159–5171. [Google Scholar] [CrossRef]
- Polat, N.; Uysal, M.; Toprak, A.S. An investigation of DEM generation process based on LiDAR data filtering, decimation, and interpolation methods for an urban area. Measurement 2015, 75, 50–56. [Google Scholar] [CrossRef]
- Abotalib, A.Z.; Sultan, M.; Elkadiri, R. Groundwater processes in Saharan Africa: Implications for landscape evolution in arid environments. Earth-Sci. Rev. 2016, 156, 108–136. [Google Scholar] [CrossRef] [Green Version]
- Nikolakopoulos, K.G.; Choussiafis, C.; Karathanassi, V. Assessing the quality of DSM from ALOS optical and radar data for automatic drainage extraction. Earth Sci. Inform. 2015, 8, 293–307. [Google Scholar] [CrossRef]
- Farr, T.G.; Rosen, P.A.; Caro, E.; Crippen, R.; Duren, R.; Hensley, S.; Kobrick, M.; Paller, M.; Rodriguez, E.; Roth, L. The Shuttle Radar Topography Mission Reviews of Geophysics, Vol. 45. RG2004 2007, 10, 1–13. [Google Scholar]
- El Bastawesy, M.; White, K.; Nasr, A. Integration of Remote Sensing and GIS for Modelling Flash Floods in Wadi Hudain Catchment, Egypt. Hydrol. Process. Int. J. 2009, 23, 1359–1368. [Google Scholar] [CrossRef]
- Attwa, M.; El Bastawesy, M.; Ragab, D.; Othman, A.; Assaggaf, H.M.; Abotalib, A.Z. Towards an Integrated and Sustainable Water Resources Management in Structurally-Controlled Watersheds in Desert Environments using Geophysical and Remote Sensing Methods. Sustainability 2021, 13, 4004. [Google Scholar] [CrossRef]
- Li, J.; Wong, D.W. Effects of DEM Sources on Hydrologic Applications. Comput. Environ. Urban Syst. 2010, 34, 251–261. [Google Scholar] [CrossRef]
- Li, X.; Lin, J.; Zhao, W.; Wen, F. Approximate calculation of flash flood maximum inundation extent in small catchment with large elevation difference. J. Hydrol. 2020, 590, 125195. [Google Scholar] [CrossRef]
- Mohamed, S.A. Development of a GIS-based alert system to mitigate flash flood impacts in Asyut governorate. Egypt. Natural Hazards 2021, 107, 1–25. [Google Scholar]
- Nourani, V.; Asl, S.M.; Sorkhkolaee, M.K.; Sharghi, E. Effect of DEM Type and Resolution in Extraction of Hydro-Geomorphologic Parameters. In Recent Advances in Continuum Mechanics, Hydrology and Ecology; WSEAS: Athens, Greece, 2013; Volume 14, pp. 98–103. [Google Scholar]
- Costache, R.; Bao Pham, Q.; Corodescu-Roșca, E.; Cîmpianu, C.; Hong, H.; Thi Thuy Linh, N.; Ming Fai, C.; Najah Ahmed, A.; Vojtek, M.; Muhammed Pandhiani, S.; et al. Using GIS, remote sensing, and machine learning to highlight the correlation between the land-use/land-cover changes and flash-flood potential. Remote Sens. 2020, 12, 1422. [Google Scholar] [CrossRef]
- Ludwig, R.; Schneider, P. Validation of digital elevation models from SRTM X-SAR for applications in hydrologic modeling. ISPRS J. Photogramm. Remote Sens. 2006, 60, 339–358. [Google Scholar] [CrossRef]
- Berry, P.A.M.; Garlick, J.D.; Smith, R.G. Near-global validation of the SRTM DEM using satellite radar altimetry. Remote Sens. Environ. 2007, 106, 17–27. [Google Scholar] [CrossRef]
- Mouratidis, A.; Ampatzidis, D. European digital elevation model validation against extensive global navigation satellite systems data and comparison with SRTM DEM and ASTER GDEM in Central Macedonia (Greece). ISPRS Intern. J. Geo-Inf. 2019, 8, 108. [Google Scholar] [CrossRef] [Green Version]
- Barasa, B.N.; Perera, E.D.P. Analysis of land use change impacts on flash flood occurrences in the Sosiani River basin Kenya. Int. J. River Basin Manag. 2018, 16, 179–188. [Google Scholar] [CrossRef]
- Sakran, S.; Said, S.M. Structural Setting and Kinematics of Nubian Fault System, SE Western Desert, Egypt: An Example of Multi-Reactivated Intraplate Strike-Slip Faults. J. Struct. Geol. 2018, 107, 93–108. [Google Scholar] [CrossRef]
- Bosworth, W.; Stockli, D.F.; Helgeson, D.E. Integrated outcrop, 3D seismic, and geochronologic interpretation of Red Sea dike-related deformation in the Western Desert, Egypt–The role of the 23 Ma Cairo “mini-plume”. J. Afr. Earth Sci. 2015, 109, 107–119. [Google Scholar] [CrossRef]
- Hegazy, D.; Abotalib, A.Z.; El-Bastaweesy, M.; El-Said, M.A.; Melegy, A.; Garamoon, H. Geo-Environmental Impacts of Hydrogeological Setting and Anthropogenic Activities on Water Quality in the Quaternary Aquifer Southeast of the Nile Delta, Egypt. J. Afr. Earth Sci. 2020, 172, 103947. [Google Scholar] [CrossRef]
- Said, R. The Geological Evolution of the River Nile; Springer Science & Business Media: Berlin, Germany, 2012. [Google Scholar]
- Klitszch, E.; List, F.K.; Pohlmann, G. Geological Map of Egypt; 1:500,000; Conoco Coral: Cairo, Egypt, 1987; p. 24. [Google Scholar]
- Maidment, D.R. GIS and Hydrologic Modeling. In Environmental Modeling with GIS; Goodchild, M.F., Parks, B.O., Eds.; Oxford University Press Inc.: New York, NY, USA, 1993; pp. 147–167. [Google Scholar]
- Nicholson, S.E. Desert Hydrology. In Encyclopedia of Hydrology and Lakes. Encyclopedia of Earth Science; Springer: Dordrecht, The Netherlands, 1998; pp. 176–183. [Google Scholar]
- Jenson, S.K.; Domingue, J.O. Extracting Topographic Structure from Digital Elevation Data for Geographic Information System Analysis. Photogramm. Eng. Remote Sens. 1988, 54, 1593–1600. [Google Scholar]
- Ozulu, I.M.; Gökgöz, T. Examining the Stream Threshold Approaches used in Hydrologic Analysis. ISPRS Intern. J. Geo-Inf. 2018, 7, 201. [Google Scholar] [CrossRef] [Green Version]
- Chang, N.B.; Guo, D.H. Urban flash flood monitoring, mapping and forecasting via a tailored sensor network system. In Proceedings of the IEEE International Conference on Networking, Sensing and Control, Lauderdale, FL, USA, 23–25 April 2006; pp. 757–761. [Google Scholar]
- Mohtar, W.H.; Abdullah, J.; Maulud, K.N.; Muhammad, N.S. Urban flash flood index based on historical rainfall events. Sustain. Cities Soc. 2020, 56, 102088. [Google Scholar] [CrossRef]
- McCauley, J.F.; Schaber, G.G.; Breed, C.S.; Grolier, M.J.; Haynes, C.V.; Issawi, B.; Elachi, C.; Blom, R. Subsurface valleys and geoarcheology of the eastern Sahara revealed by shuttle radar. Science 1982, 218, 1004–1020. [Google Scholar] [CrossRef] [PubMed]
- Tribe, A. Automated Recognition of Valley Heads from Digital Elevation Models. Earth Surf. Process. Landforms 1991, 16, 33–49. [Google Scholar] [CrossRef]
- Tarboton, D.G.; Bras, R.L.; Rodriguez-Iturbe, I. On the Extraction of Channel Networks from Digital Elevation Data. Hydrol. Process. 1991, 5, 81–100. [Google Scholar] [CrossRef]
- Niyongabire, E.; Hassan, R.; Elhassan, E.; Mehdi, M. Use of Digital Elevation Model in a GIS for Flood Susceptibility Mapping: Case of Bujumbura City. In Proceedings of the 6th International Conference on Cartography and GIS, Albena, Bulgaria, 13 June 2016; pp. 241–248. [Google Scholar]
- Garbrecht, J.; Martz, L.W.; Starks, P. Automated Watershed Parameterization from Digital Landscapes: Capabilities and Limitations. In Proceedings of the Fourteenth Annual AGU Hydrology Days, Fort Collins, CO, USA, 5–8 April 1994; Morel-Seytoux, H.J., Ed.; Hydrology Days Publications: Atherton, CA, USA, 1994; pp. 123–134. [Google Scholar]
- Wolock, D.M.; Price, C.V. Effects of Digital Elevation Model Map Scale and Data Resolution on a Topography-based Watershed Model. Water Resour. Res. 1994, 30, 3041–3052. [Google Scholar] [CrossRef]


| Location | DEM Source | Area (km2) | Total Flow Discharge (m3) | Peak of Flow Discharge (m3/s) | Total Flow Duration (h) | Time to Peak (h) | Maximum Flow Lengths (km) | Total Stream Lengths (km) |
|---|---|---|---|---|---|---|---|---|
| Al Rishrash Catchment | SRTM 90 m | 617.8 | 6,472,872 | 141.9 | 14 | 13 | 101.5 | 332 |
| SRTM 30 m | 658.2 | 6,935,814 | 118.7 | 16 | 14 | 109.3 | 372 | |
| ASTER 30 m | 624.9 | 6,585,291 | 138.1 | 15 | 13 | 103.9 | 333 | |
| ALOS PRISM 30 m | ||||||||
| ALOS 12.5 m | ||||||||
| Topographic 90 m | 685.0 | 6,847,740 | 138.4 | 14 | 13 | 99.6 | 321 | |
| Atfeh Catchment | SRTM 90 m | 428.2 | 4,471,281 | 95.9 | 10 | 4 | 69.4 | 263 |
| SRTM 30 m | 426.3 | 4,492,359 | 92.3 | 10 | 4 | 70.8 | 291 | |
| ASTER 30 m | 409.0 | 4,309,605 | 86.1 | 10 | 6 | 70.5 | 257 | |
| ALOS PRISM 30 m | 426.2 | 4,262,616 | 93.2 | 10 | 5 | 70.4 | 279 | |
| ALOS 12.5 m | 423.6 | 4,236,148 | 102.2 | 9 | 5 | 70.9 | 276 | |
| Topographic 90 m | 467.9 | 4,678,884 | 96.9 | 9 | 5 | 65.5 | 249 |
Publisher’s Note: MDPI stays neutral with regard to jurisdictional claims in published maps and institutional affiliations. |
© 2021 by the authors. Licensee MDPI, Basel, Switzerland. This article is an open access article distributed under the terms and conditions of the Creative Commons Attribution (CC BY) license (https://creativecommons.org/licenses/by/4.0/).
Share and Cite
El Bastawesy, M.; El Saadawy, O.; Abotalib, A.Z.; Othman, A.; Taha, M.; Gaber, A. Examining the Impact of Different DEM Sources and Geomorphology on Flash Flood Analysis in Hyper-Arid Deserts. ISPRS Int. J. Geo-Inf. 2021, 10, 431. https://0-doi-org.brum.beds.ac.uk/10.3390/ijgi10070431
El Bastawesy M, El Saadawy O, Abotalib AZ, Othman A, Taha M, Gaber A. Examining the Impact of Different DEM Sources and Geomorphology on Flash Flood Analysis in Hyper-Arid Deserts. ISPRS International Journal of Geo-Information. 2021; 10(7):431. https://0-doi-org.brum.beds.ac.uk/10.3390/ijgi10070431
Chicago/Turabian StyleEl Bastawesy, Mohammed, Omnia El Saadawy, Abotalib Z. Abotalib, Abdullah Othman, Maysa Taha, and Ahmed Gaber. 2021. "Examining the Impact of Different DEM Sources and Geomorphology on Flash Flood Analysis in Hyper-Arid Deserts" ISPRS International Journal of Geo-Information 10, no. 7: 431. https://0-doi-org.brum.beds.ac.uk/10.3390/ijgi10070431