
An Approach to Improve the Quality of User-Generated Content of Citizen Science Platforms

Industrial Engineering and Management, School of Engineering Science, LUT University, 53850 Lappeenranta, Finland
*
Author to whom correspondence should be addressed.
ISPRS Int. J. Geo-Inf. 2021, 10(7), 434; https://0-doi-org.brum.beds.ac.uk/10.3390/ijgi10070434
Submission received: 28 April 2021
/
Revised: 13 June 2021
/
Accepted: 22 June 2021
/
Published: 25 June 2021
(This article belongs to the Special Issue Volunteered Geographic Information and Citizen Science)
Abstract
:The quality of the user-generated content of citizen science platforms has been discussed widely among researchers. Content is categorized into data and information: data is content stored in a database of a citizen science platform, while information is context-dependent content generated by users. Understanding data and information quality characteristics and utilizing them during design improves citizen science platforms’ overall quality. This research investigates the integration of data and information quality characteristics into a citizen science platform for collecting information from the general public with no scientific training in the area where content is collected. The primary goal is to provide a framework for selecting and integrating data and information quality characteristics into the design for improving the content quality on platforms. The design and implementation of a citizen science platform that collects walking path conditions are presented, and the resulting implication is evaluated. The results show that the platform’s content quality can be improved by introducing quality characteristics during the design stage of the citizen science platform.
1. Introduction
Citizen science projects have garnered a wide following and usage over the years. In citizen science, non-professional participants contribute to a project by submitting new information or classifying existing data. In the modern digital world, this takes place through an online platform. A notable example of a citizen science project for collecting new information is eBird [1], which has been in operation since 2002, while a notable project for classifying existing data is Galaxy Zoo [2]. To give a more recent example, a project that emerged in 2020 is currently implementing a citizen science classification game within a video game called Borderlands 3; it allows the players of Borderlands 3 to participate in the citizen science project by playing a microbiome mapping game within the actual video game [3].
A wide range of terms have been used to refer to the information provided by citizens, such as volunteered geographic information, participatory sensing, citizen science, and crowdsourcing [4]. This research will focus on using the term “citizen science”.
Citizen science projects have a wide variety of use-cases such as astronomy [5], wildlife research [6], flood monitoring [7], smart cities [8], and many more. There are over a thousand different ongoing projects listed in SciStarter [9]. The major challenge and complaint in citizen science and similar domains is the data quality [6,10,11,12,13,14,15,16,17,18,19,20]. As participants who contribute content have no scientific training, there is a risk that they will produce low-quality data [13]. Some researchers have argued, however, that there is no statistically significant difference in quality between content provided by citizens and experts [17], although this is still a minority opinion. Indeed, in [21], over a hundred different citizen science projects have been investigated, and several issues in data quality management have been identified.
Data quality is essential when data is used for research purposes, to form decisions, or to establish facts [22,23,24]. Data quality is defined as multidimensional (divided into characteristics), and this applies to multiple data quality models with different characteristics and varying definitions [25,26,27]. Most data quality definitions apply to general data quality. However, data quality depends on the scenario [25,26,28,29,30,31], and each domain requires different definitions. Therefore, it can be an extremely limiting factor to demand similar data quality standards from regular citizens as those that are requested of professionals within organizations [10,32]. The International Organization for Standardization (ISO) has established some standards for data quality for different domains [33,34,35].
Another issue that needs to be considered when discussing data quality is information quality. Information and data are two separate terms. Information is more contextual than data, but data can be transformed into information when given a context, category, or analysis [36,37]. Data is a separate object that can be quantified, but information requires external knowledge or perception [28]. For example, a list of temperatures is data, but if the temperatures are tied to dates, they are information about the upcoming temperatures. Likewise, a list of dates and locations by itself is data, but if there is the knowledge that the dates and locations indicate where a band has been touring, it becomes information. This distinction between data and information is crucial for improving data quality in citizen science.
In citizen science, citizens provide information to the platform because the citizens are asked to provide specific information. Information received from citizens is mostly unfiltered, and this is affected by what information a citizen can submit. The provided information is affected by the content collection approach, and when the information is stored as data, it undergoes a data curation process that influences its quality. Information quality is the quality of the information received from citizens, while data quality is the quality of content within the database. Data quality is primarily affected by information quality.
Data quality improvement methodologies can be classified into two strategies, data-driven and process-driven. The data-driven approach aims to improve data quality by replacing low-quality data, correcting errors, or selecting credible sources. Process-driven techniques mainly control or redesign the collection process to remove the causes of low-quality data and introduce methods that produce higher-quality data [38]. Thus, process-driven methods can be considered to improve the quality of information. In citizen science platforms, process-driven methods and correcting errors are feasible strategies to improve quality. Platforms automatically correct minor errors, and more significant errors are fixed by the community or moderators [1,17,39,40]. Selecting volunteers before they provide any content or replacing low-quality data are not recommended methods because holding citizens to professional researchers’ standards leads to issues with data acquisition. With greater data requirements, participants with little expertise in the area can feel discouraged, thus reducing the number of contributions. Additionally, citizens observe their surroundings differently and identify phenomena outside the intended purpose, thus providing valuable data [10]. Selecting credible volunteers is possible after content has been collected and the credibility of volunteers has been adequately evaluated [41].
There are general guidelines and methodologies for incorporating data quality into the platform or design process [42,43,44,45]. However, the existing guidelines mainly indicate a step in a process where data quality should be considered without explaining how to implement methods for improving data quality concretely. Higgins et al. [45] present a generic infrastructure for citizen science platforms and recommend keeping quality elements as part of the data. As a result, there is no clear understanding of an approach to date that can increase citizen science platforms’ content quality.
This research therefore aims to improve the quality of data collected and the quality of the information provided by citizens by integrating quality characteristics into the design of a citizen science platform, as suggested in [21,46]. Incorporating quality characteristics as requirements in creating a platform helps to monitor quality and ensure that the desired quality criteria have been met before any data or information is gathered.
The primary approach to increasing the quality of collected information is using the quality characteristics as prerequisites during the collection process and creating quality controls for the user interface to reduce the amount of low-quality content, as well as integrating quality elements into the data model. The proposed method is evaluated by looking at a platform that collects walking path observations from citizens. The number of participants involved in citizen science projects varies, and the amount of data accumulated may be low, making the quality of data more essential.
This research contributes to the study of improved content quality in citizen science platforms. It aims to improve the content quality by considering data and information quality characteristics during the design and development. This way, the data quality could be enhanced during data collection, and less work is needed for cleaning before analyzing data.
2. Quality of Citizen Science Data and Information
In 1996, Wang and Strong [25] defined 15 essential quality characteristics for the business domain and divided them into four categories. Redman [27], meanwhile, divides data quality into 12 characteristics and four categories. Information quality can be considered to be similar to data quality, but there are significant differences. Data consists of raw facts, while information is derived from data in a given context. Therefore, information quality can only be determined within a given context, while data quality can be context-independent [28,36,37].
ISO has developed a number of data quality standards for different use cases. ISO 19157 [33] is a data quality standard for geographic information that focuses on positional and thematic accuracy, completeness, and temporal correctness. The applicability of ISO 19157 to volunteered geographic information has been investigated in [47]. While many of the standard’s components are suitable, the standard is not perfect because of the difference between authoritative and volunteered geographic information. Volunteered geographic information is heterogenic and lacks data specifications and comparable reference data that are required for the standard. Additional quality indicators, such as reliability, should thus be used to extend the standard. ISO 19157 is not an appropriate standard for citizen science because citizen science platforms collect other information besides just geographical information.
The data quality model ISO 25012 [34] for structured data in computer systems is a more appropriate starting point for citizen science platforms than ISO 19157. The data model divides data quality into 15 characteristics and three categories. Table 1 presents the comparison of three different collections of data quality characteristics and their applicability to information quality based on context-dependency.
The first column in Table 1 determines whether the listed characteristic can be applied to information quality or instead lacks context-dependency. Some characteristics proposed by Wang and Strong can be grouped under one characteristic comparable to ISO or Redman. For example, “interpretability” and “ease of understanding” can be grouped to form “understandability”. Similarly, “believability” and “reputation” can be grouped to form “credibility”. Some of the characteristics are intended for the underlying system and are therefore not applicable for information quality. Few characteristics can be argued to be or not be suitable for information. These depend on the context of the information and where and how it is provided.
Precision, representational consistency, and concise representation rely on the context of information. Concise representation can belong to understandability, but precision and representational consistency are affected by how the information is shown. Representational consistency helps improve understandability, but it may be necessary to have different information representations. Depending on the usage, precision can have a different meaning. (Format) precision means there are a sufficient number of decimals in a given number. Locational precision pertains to how exact the given location information is. For example, geo-coordinates are more precise than a street name, and a city is more precise than a country. Precision in location information is not to be confused with locational accuracy, which pertains to whether the information is close to the proper location or not. Some citizen science platforms require geo-coordinates (high precision), but other platforms settle for knowing the street of the observation or a 5 km radius (low precision).
Based on Table 1, the final list of characteristics for information quality is presented in Table 2. Accuracy is divided into syntactic and semantic accuracy. Syntactic accuracy pertains to whether the information is of the correct type and syntax. If the information is textual, syntactic accuracy can be extended to, for example, language. Semantic accuracy means that information is logical and follows semantic consistency. For example, Finland is part of Europe, and it would be semantically wrong to say Finland is part of Asia. In ISO 19157, accuracy is tied to thematic and positional accuracy, and these definitions of accuracy can be used in some cases. However, syntactic and semantic accuracy can be used for locational information. Syntactic accuracy means that the location is provided in the correct format (street name, postal code, latitude, longitude), and semantic accuracy means that the information is semantically solid. Accuracy does not consider how detailed the positional information is; for that, precision can be used.
3. Case Study: Information and Data Quality in Citizen Science Platforms
Numerous researchers have identified problematic issues with data and information quality in citizen science platforms. The following features are standard amongst most citizen science platforms:
- Inexperienced users or content providers submit information;
- Content can be reviewed by community/moderators;
- Content can be text and multimedia;
- Content is not only freeform text;
- Location and time are part of the information;
- Information can be precise or general.
Data and information quality should be evaluated based on individual characteristics. The quality of the information received from citizens is vital as it affects the quality of data. Therefore, each platform’s user interface needs to be examined from the content provider’s perspective to evaluate the information provided by citizens. Unfortunately, it is difficult to accurately assess information quality directly from the user interface.
Four platforms have been selected to evaluate the quality of data and information in citizen science based on the following criteria:
- Platforms collect different observations;
- Platforms are still collecting observations;
- Platforms provide access to data;
- Platforms have a large quantity of data.
iNaturalist [39] is a global network of websites that operates in multiple countries. Each country uses the iNaturalist platform template to collect environmental observations from citizens and connect with existing platforms within the operating country. For example, Laji.fi is integrated with iNaturalist in Finland. A dataset related to the great tit (Parus major) bird is downloaded, and it consists of 39,910 entities.
Atlas of Living Australia (ALA) [48] is an Australian environment and wildlife data collection platform. Data is collected in two ways, either from other organizations, such as environmental research facilities, or from citizens. Citizens can submit data directly using the ALA website or through the citizen science platform iNaturalist Australia, which has been integrated with ALA. The lace monitor (Varanus varius) lizard dataset is downloaded, and it consists of 14,138 entities.
Globe at Night [49] is an international citizen science project that gathers night sky brightness information from citizens. The project has been ongoing since 2006, and its main base of operations is in the United States. Data from 2020 is downloaded, and the dataset consists of 29,507 entities.
Budburst [50] is a citizen science project managed by the Chicago Botanic Garden. The project focuses on observing plants and pollinators within the United States. The whole available dataset is downloaded from the website, and it consists of 96,815 entities.
Each of the datasets has location information, but they have different levels of precision. For example, some have exact latitude and longitude coordinates, while others provide a location at only the city or country level.
3.1. Information Quality Evaluation through the User Interface
The quality of information submitted by the citizen is examined through the user interface within the platforms.
Globe at Night offers a generic report interface. Users can set the exact observation time and location or provide the location at the country level. Users are presented with options for the information to be sent, such as different sky conditions and darkness, and exact details are optional. The most challenging aspects of the Globe at Night interface are that there is no option to record who submitted the information and there are only a handful of correctness checks. For example, the location can be set to Africa, and then users can select the United States as the country. Issues like this risk reducing the accuracy and completeness of the information.
ALA uses the iNaturalist user interface for single observations, so ALA and iNaturalist evaluation is combined. The user interface in iNaturalist imposes some restrictions but also offers some options for the users. First of all, the species must be selected from a predetermined list and cannot be arbitrary. Similarly, the time of observation is precisely formatted and checked. Users are given the option to mask or generalize the precise location information. However, the masked location shows correctly in the downloaded data, undermining the utility of the given choice. Location information is provided through a map as coordinates, and the user can use a selection tool to cover a wider area. The location is automatically matched to a specific city and country based on the coordinates, but the user can overwrite this. iNaturalist has a list of quality criteria that are automatically checked for each observation. This list includes items such as the following: has location, picture or sound included; has the correct place; has the correct date; has been identified by the community, and so on. Information pertaining to over half of the items requires the community to form a consensus before it can be verified.
Budburst offers a predetermined list of species that the user selects from. Users can add new species to the list that are somehow moderated. The location information in Budburst can be at the state level as well as in the form of a precise location. Users have limited freeform input when submitting information, and each input field has syntax checks, increasing the syntactic accuracy drastically. Each field is also mandatory, aside from optional comments, making the completeness high. Many of the information fields can be approximated, so the user does not have to be an expert or be constantly checking what time it is. The biggest downside in Budburst is that users are always anonymized. None of the observations can be tied to a specific user, so it is impossible to determine whether several observations come from one or several different users.
Each of the user interfaces of the platforms has its own positive and negative traits. Overall, iNaturalist has the best user interface regarding information quality. It uses automatic checks related to the information, which increases the accuracy and value of the content. The most significant benefit for iNaturalist is that it provides user information about each observation, which helps to assess the credibility of every user who submits information. Considering the extensiveness of input fields in reports, Budburst has the most user-friendly and accessible user interface when submitting and viewing information.
3.2. Data Quality Evaluation
Data quality is evaluated using a dataset from each platform. The evaluation is conducted using the characteristics presented in Table 2. The data quality is evaluated by subjecting each dataset to specific queries related to each quality characteristic using the data analytics platform RapidMiner (https://rapidminer.com/, accessed on 27 April 2021). RapidMiner is a commercial data science platform meant for data mining, analytics, and machine learning.
Table 3 presents the general queries formulation method for RapidMiner usage for each of the characteristics. Value as a quality characteristic is inherently subjective, and so everyone has their own opinion on the value of data. For the sake of simplicity, value in this research is evaluated with the help of other characteristics, but this is by no means the only way to assess the value.
The following list presents specific adjustments for the general data mining queries:
- Syntactic accuracy:
- ⚬
- ALA: Based on the verbatim date attribute and expected syntax of yyyy/MM/dd hh:mm
- ⚬
- Globe at Night: No issues in syntactic accuracy.
- ⚬
- BudBurst: Based on the country attribute. The expected syntax is the acronym of a country (US), which means, for example, United States is incorrect.
- ⚬
- iNaturalist: Based on the timezone attribute. The majority of the values are the country locations, and the minority of values are UTC or Eastern Time.
- Semantic accuracy:
- ⚬
- ALA: Sex attribute is inspected to determine whether values are male, female, or unknown.
- ⚬
- Globe at Night: No semantic issues.
- ⚬
- BudBurst: No semantic issues.
- ⚬
- iNaturalist: Timezone is compared to the collection location.
- Credibility:
- ⚬
- ALA: NA
- ⚬
- Globe at Night: NA
- ⚬
- BudBurst: NA
- ⚬
- iNaturalist: NA
- Objectivity:
- ⚬
- ALA: The location similarity is tied to the city/county level.
- ⚬
- Globe at Night: NA
- ⚬
- BudBurst: NA
- ⚬
- iNaturalist: Dataset includes an agreement attribute that reflects how many other users agree on the observation.
- Volume:
- ⚬
- Globe at Night: NA
- ⚬
- BudBurst: NA
- Privacy:
- ⚬
- Globe at Night: No personal information in data.
- ⚬
- BudBurst: No personal information in data.
- Traceability
- ⚬
- Globe at Night: Missing user identification, so traceability is reduced in the calculations.
- ⚬
- BudBurst: Missing user identification, so traceability is reduced in the calculations.
- Understandability:
- ⚬
- ALA: Understandability is measured through the locality attribute and mining incomprehensible texts or locations that do not make sense.
- ⚬
- Globe at Night: Sky comment attribute is mined for non-English texts and incomprehensible values.
- ⚬
- BudBurst: Location_title attribute is used to measure understandability by mining incomprehensible texts or locations that do not make sense.
- ⚬
- iNaturalist: Place_guess attribute is mined for invalid words to measure understandability.
Table 4 presents the RapidMiner query results as values between 0 and 1, reflecting the percentage of results. Values indicate the percentage of correct data entities for each characteristic (conform to the given query). For example, if a dataset consists of 40,000 entities and 5000 entities are missing a location, the traceability would be 0.96 (3 × 40,000 —5000 divided by 3 × 40,000). Not applicable (NA) results are deemed as zero when evaluating value because, if something is not applicable, it does not exist.
Budburst and Globe at Night do not provide any user information in the dataset, so there is no way to tie any observation to a specific provider. This means that there is no information on how many users provide information and how many come from the same provider. This undermines multiple characteristics, most notably objectivity, credibility, and traceability. On the other hand, the lack of any identifying information increases privacy.
Out of all the datasets, Budburst has the lowest completeness. Many attributes are left empty in the dataset. This reflects the nature of the user interface, which allows users to provide much optional information, such as different pollinators. A better method of storing this information would be to have some default values for each attribute rather than leaving them empty.
While ALA and iNaturalist use the same interface to collect singular observations, ALA also contains datasets to add to their collection via their interface. This difference is reflected in the data extracted from each platform. ALA has more attributes in the dataset than iNaturalist, and each has different names for the same attributes. These differences demonstrate the comparative accuracy and currentness of the data from each dataset. Some data in the ALA dataset is sourced from the 20th century, while all data in iNaturlist has been provided after 2010.
Globe at Night has the fewest attributes in the dataset. This means that there is only a minimal amount of extra information within the data, making its completeness the best out of the tested datasets. On the other hand, the comment attributes include text in multiple languages, which reduces the understandability considerably. Some of the comments are also short acronyms that, without any context, are difficult to understand.
4. Integration of Quality Characteristics into the Citizen Science Platform: WalkingPaths
The idea of increasing data and information quality in citizen science platforms by integrating quality characteristics into the model is presented in [21,46]. Ref. [46] provides general guidelines for increasing data quality by not allowing insufficient quality data into the system and [21] provides the initial design for integrating data quality characteristics into the design of a citizen science platform via specific checks or attaching the quality characteristic into the data model. To test and evaluate this idea, a citizen science web platform called WalkingPaths is developed. The platform is developed using ReactJS for the frontend and NodeJS for the backend with an NoSQL database, MongoDB. Mongoose middleware is used to enforce syntax restrictions on data. The platform integrates the information quality characteristics listed in Table 2 into the platform’s design.
The platform collects walking path information from citizens in Finland. Citizens are asked to fill out a simple form consisting of the path’s location and condition, and they are given an option to send an image in addition to the observation. The data is collected from March 2020 to September 2020, and the final dataset consists of 108 observations.
4.1. Platform Design
The quality of information from the content provider depends on the user interface. When integrating quality characteristics into the design, this fact is crucial to consider. Having proper checks and limitations in the user interface will increase the quality of the information received from content providers, increasing the overall data quality within the system. For example, location can be considered complete if a valid address or geolocation is given. The rules for limiting content within the user interface can be received from the database. The data model can require specific data types, and the user interface can limit the possibilities based on these restrictions. If illegal data types are given, the information is not stored, and citizens are asked to modify it.
Data and information quality characteristics can be divided into four categories based on their implementation:
Before collection: Characteristics that should be implemented before collecting information from content providers. These should be integrated into the data model and backend.
- Syntactic accuracy: Within the data model, the syntax of each data is defined. Depending on the chosen database, the syntax is automatically enforced or manually enforced via the backend (NoSQL). In this research, the syntax is evaluated using the middleware Mongoose.
- Semantic accuracy: Semantic accuracy rules come from an expected value. When requiring a date, it is expected to receive a valid date. Semantic rules for content come from the database and can be enforced and checked in the backend or user interface.
During collection: Characteristics that should be implemented during the collection of content. These should be integrated into the user interface.
- Syntactic accuracy: Syntactic accuracy during collection can be enforced by making type checks in the user interface and not allowing incorrect or illegal types to be submitted.
- Semantic accuracy: Semantic accuracy can be increased during the collection by giving the content provider a selection field rather than freeform text fields. Another method is to check if the given information in the field matches specific content, such as asking a country and checking whether a given country exists in the list of countries.
- Privacy: Privacy relates to personal information, and it is up to the developers to decide whether or not to collect personal information. The easiest method of increasing privacy is not collecting personal information, especially in a citizen science platform where location is often necessary. Whenever private information is being collected, clear statements should be made on what is collected and how it is used. In addition, the user needs to be offered the opportunity to consent to their personal information being used and be given the option to delete personal information if it has been collected [51,52].
- Completeness: During collection, completeness can be ensured by not allowing content providers to submit incomplete content. There can be a variable degree of completeness.
- Traceability: Traceability requires information regarding when content is submitted and where it comes from. This information is most easily collected from the user interface when a content provider is submitting content. For example, the date and time can be stored, and the location and content provider’s name can be requested if necessary.
- Relevance: Each platform, especially in citizen science projects, has some specific use case for collecting data. For example, content providers can be restricted to providing only information relevant to the topic during the content collection.
- Credibility: Credibility is related to a content provider’s credibility rather than content credibility. Content provider’s credibility can be determined in various ways, but the most common method is reputation models. If the content provider has previously submitted high-quality content, then their credibility score will be higher.
- Currentness: When content is submitted and when the observation has been made can be directly taken from the user interface.
After collection: Characteristics that should be implemented after the collection of content should be integrated into the backend.
- Completeness: Completeness of given content can be checked after submission, and the provided data can be marked complete/incomplete. If it is possible to edit the content later, this value can then be updated.
- Objectivity: The objectivity of content can be based on various aspects. One aspect is the content provider and what content is submitted. If the content has an image attached, it is easier to determine objectivity. If a reputable content provider submits the content, it is most likely to be objective. Different objectivity values can be directly attached to the data. Objectivity can also be determined using a voting system in the platform.
- Volume: After content is submitted, similar content can be checked and calculated based on the similarity score. For example, content related to the same location area can be grouped to form general information found on its content.
- Value: The value of content can be determined and calculated on various conditions, and this value score can be attached to the data.
- Usability: The usability of data can be determined and calculated on various conditions, and this usability score can be attached to the data.
Presenting information: Characteristics that should be implemented when presenting the information. These should be integrated into the user interface.
- Privacy: If personal information has been collected, the extent to which this information is shared with others should be evaluated. It is unnecessary to show personal information in most cases, and thus it should be omitted from the user interface. The option to hide personal information could be added for citizens on the platform.
- Volume: Having multiple similar observations or reports in a platform must be indicated in some form. There is a significant difference between one person making a claim and ten people making the same claim. The volume of content can be presented in different ways, depending on how the content is presented in general.
- Understandability: Information should be presented understandably. For example, a list of observations and reports can be a challenging format for understanding the bigger picture, and it is therefore better to use an alternative method for presenting the information. For example, in most citizen science platforms, there is a map that shows different locations. Another approach is to show statistical analysis of specific pieces of data. Regardless of the methodology, each is implemented in the user interface.
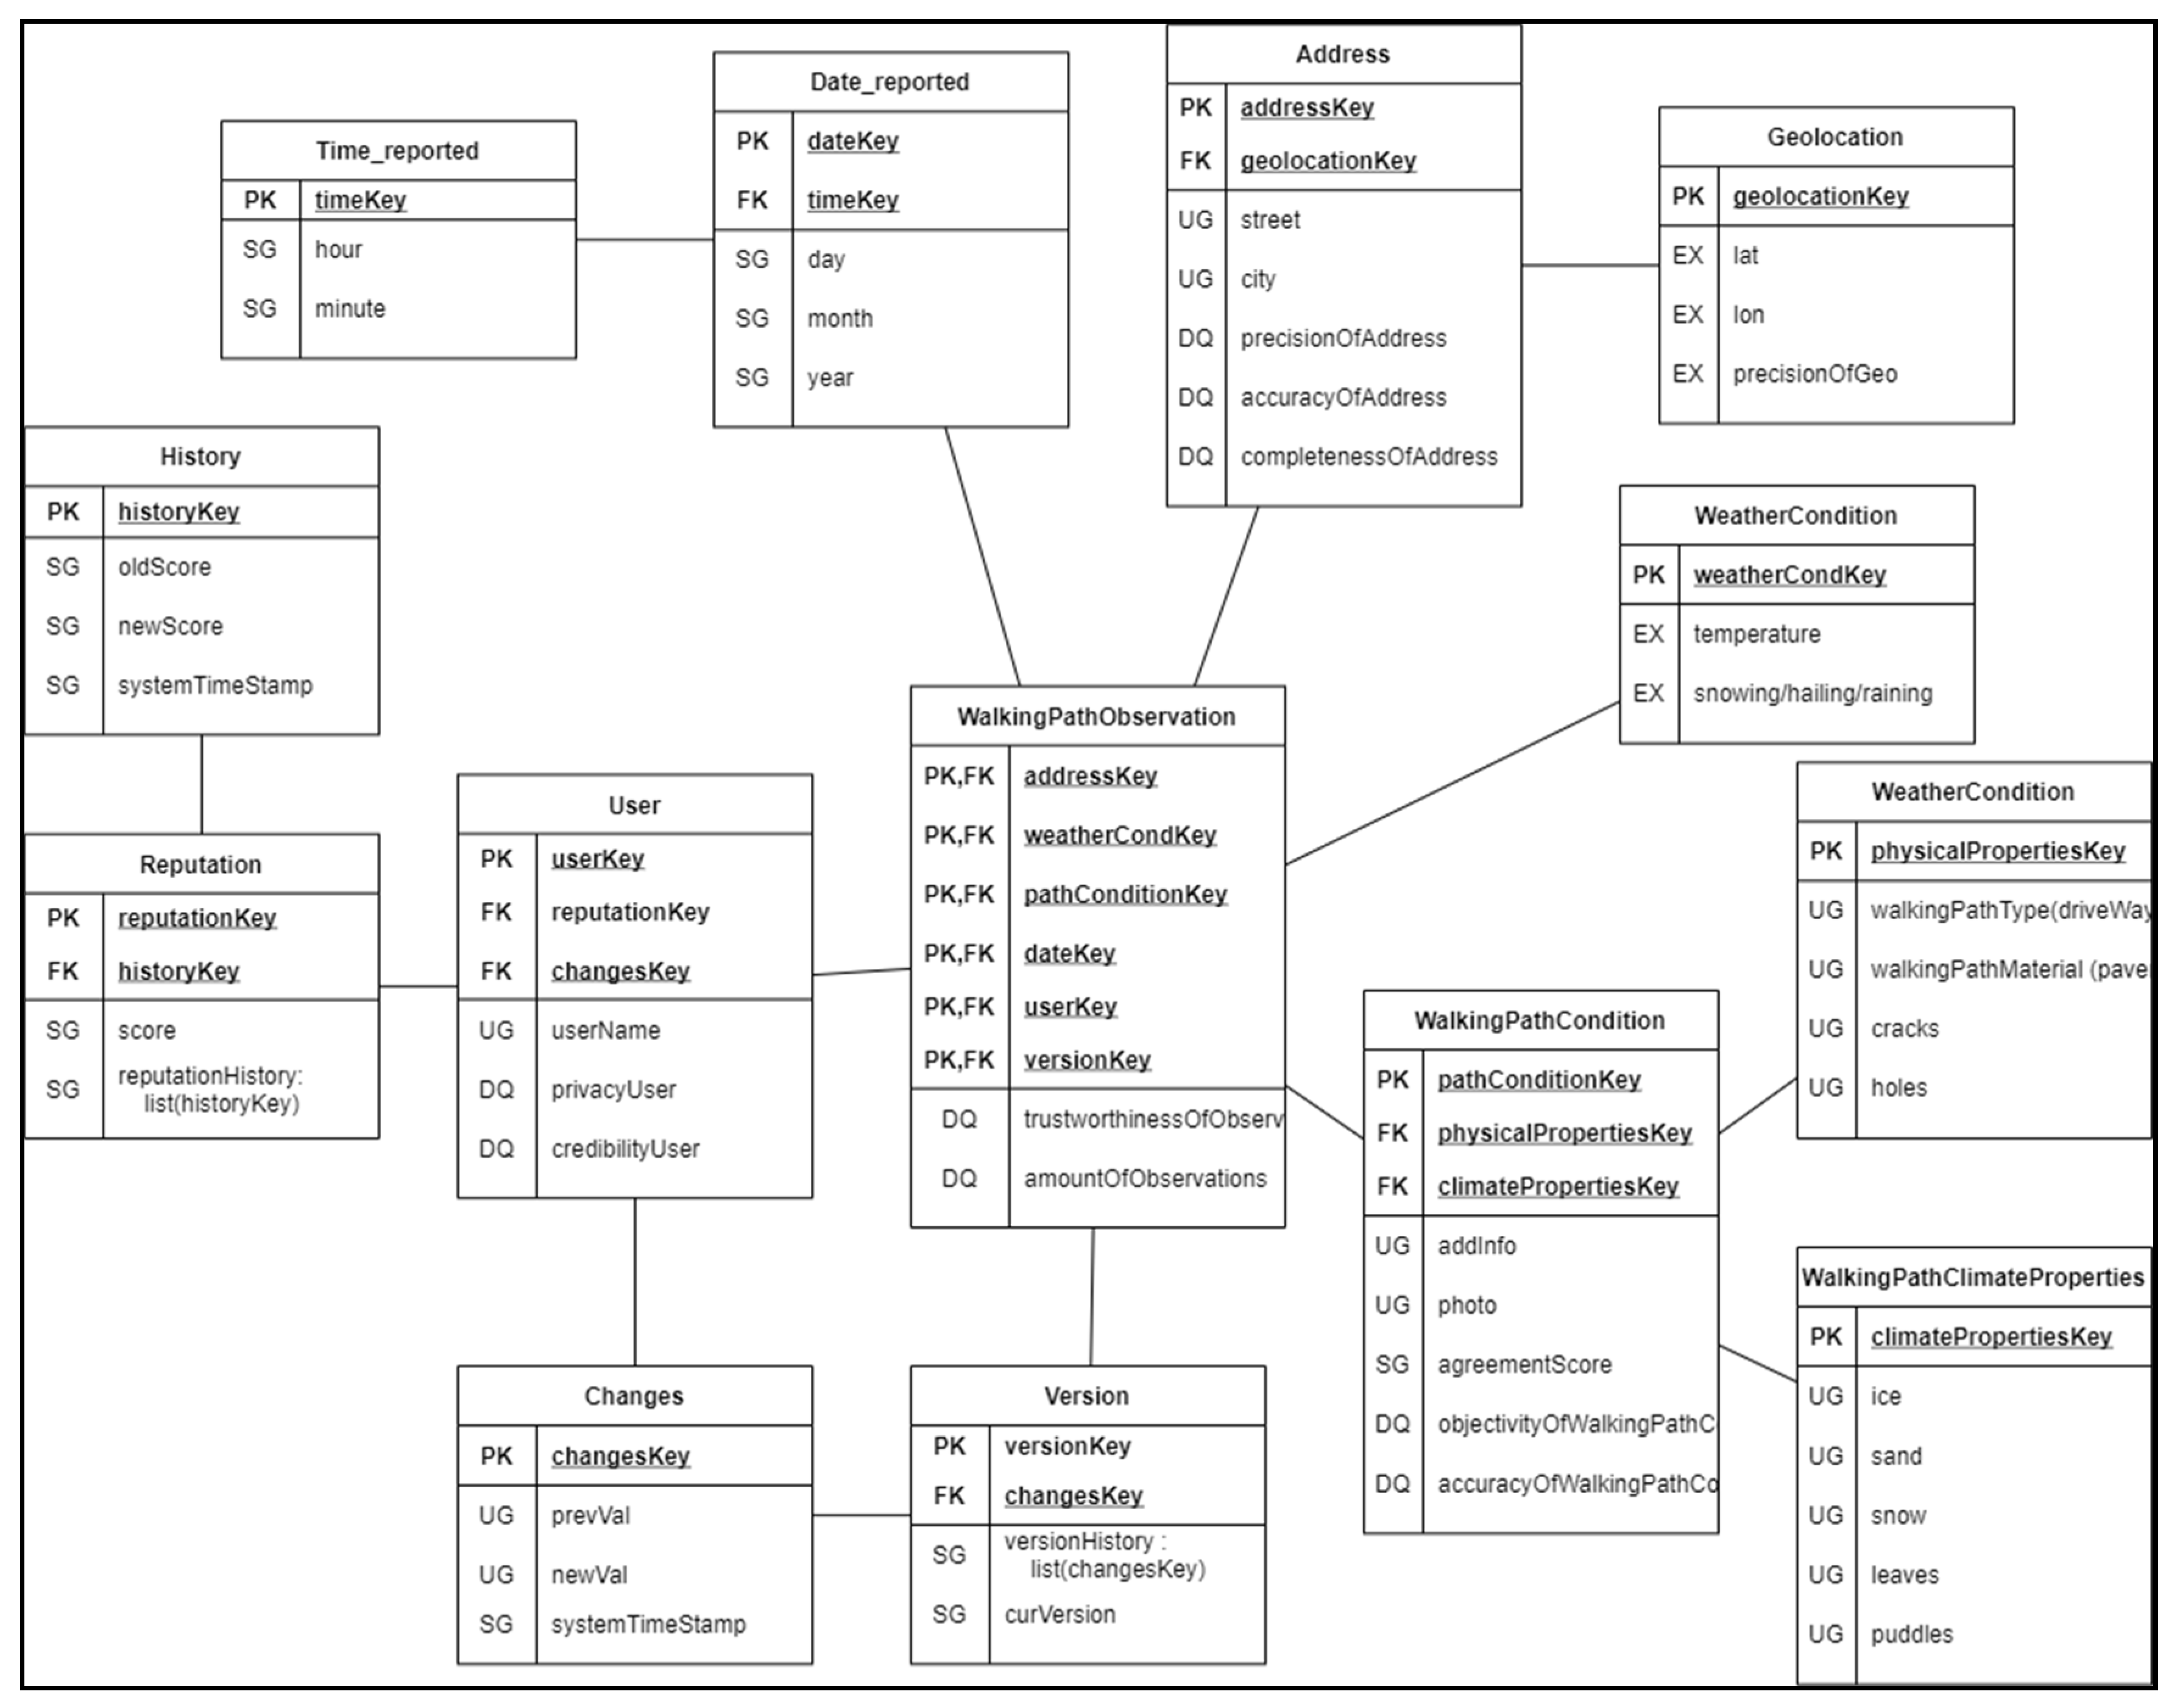
Figure 1 shows the database schema developed using the snowflake data model [53] of the platform WalkingPaths. In the center is the fact table WalkingPathObservation, and it is connected to several dimension tables. Each dimension table holds a primary key and a foreign key to any sub-tables. The fact table contains foreign keys from all linked dimension tables and has them as a combined primary key. Thus, a snowflake schema can be easily transformed into a relational data model.
The attributes in the database schema have different initials tied to them:
- PK and FK: Indicates the primary and foreign keys.
- SG: The platform generates the attribute.
- UG: The attribute is user-generated, i.e., given by the user.
- EX: The attribute is obtained from external sources.
- DQ: The attribute stores information related to data quality.
Several data quality characteristics are integrated into the model as separate attributes. These include accuracy (syntactic and semantic), completeness, volume, credibility, privacy, objectivity, and traceability. These characteristics are used for storing relevant quality evaluations and presenting them to others. For this platform, the precision of geolocation is considered necessary. The information regarding how many meters the location may be off of the given coordinates is stored in the database. The quality of data can be described, quantified, and guaranteed more easily using the data quality attributes when sharing the data with others.
Geolocation is separated from the address because the coordinates are not mandatory, and the location is extracted from the device directly while the user manually provides the address. Changes stores all modifications made by a user to any existing observation within the platform. For example, if a user modifies an observation by adding a photograph or modifying the additional information, the prevVal stores the previous content, and newVal stores the modified content. Storing the modifications made to any information helps restore “correct” values if observations have been incorrectly changed. Historical data can be used as reference data to improve the quality of new data in some scenarios. For example, if there has never been ice in July, it is unlikely to happen in the present, which means that if someone claims there is ice, the observation can be marked for further inspection and validation.
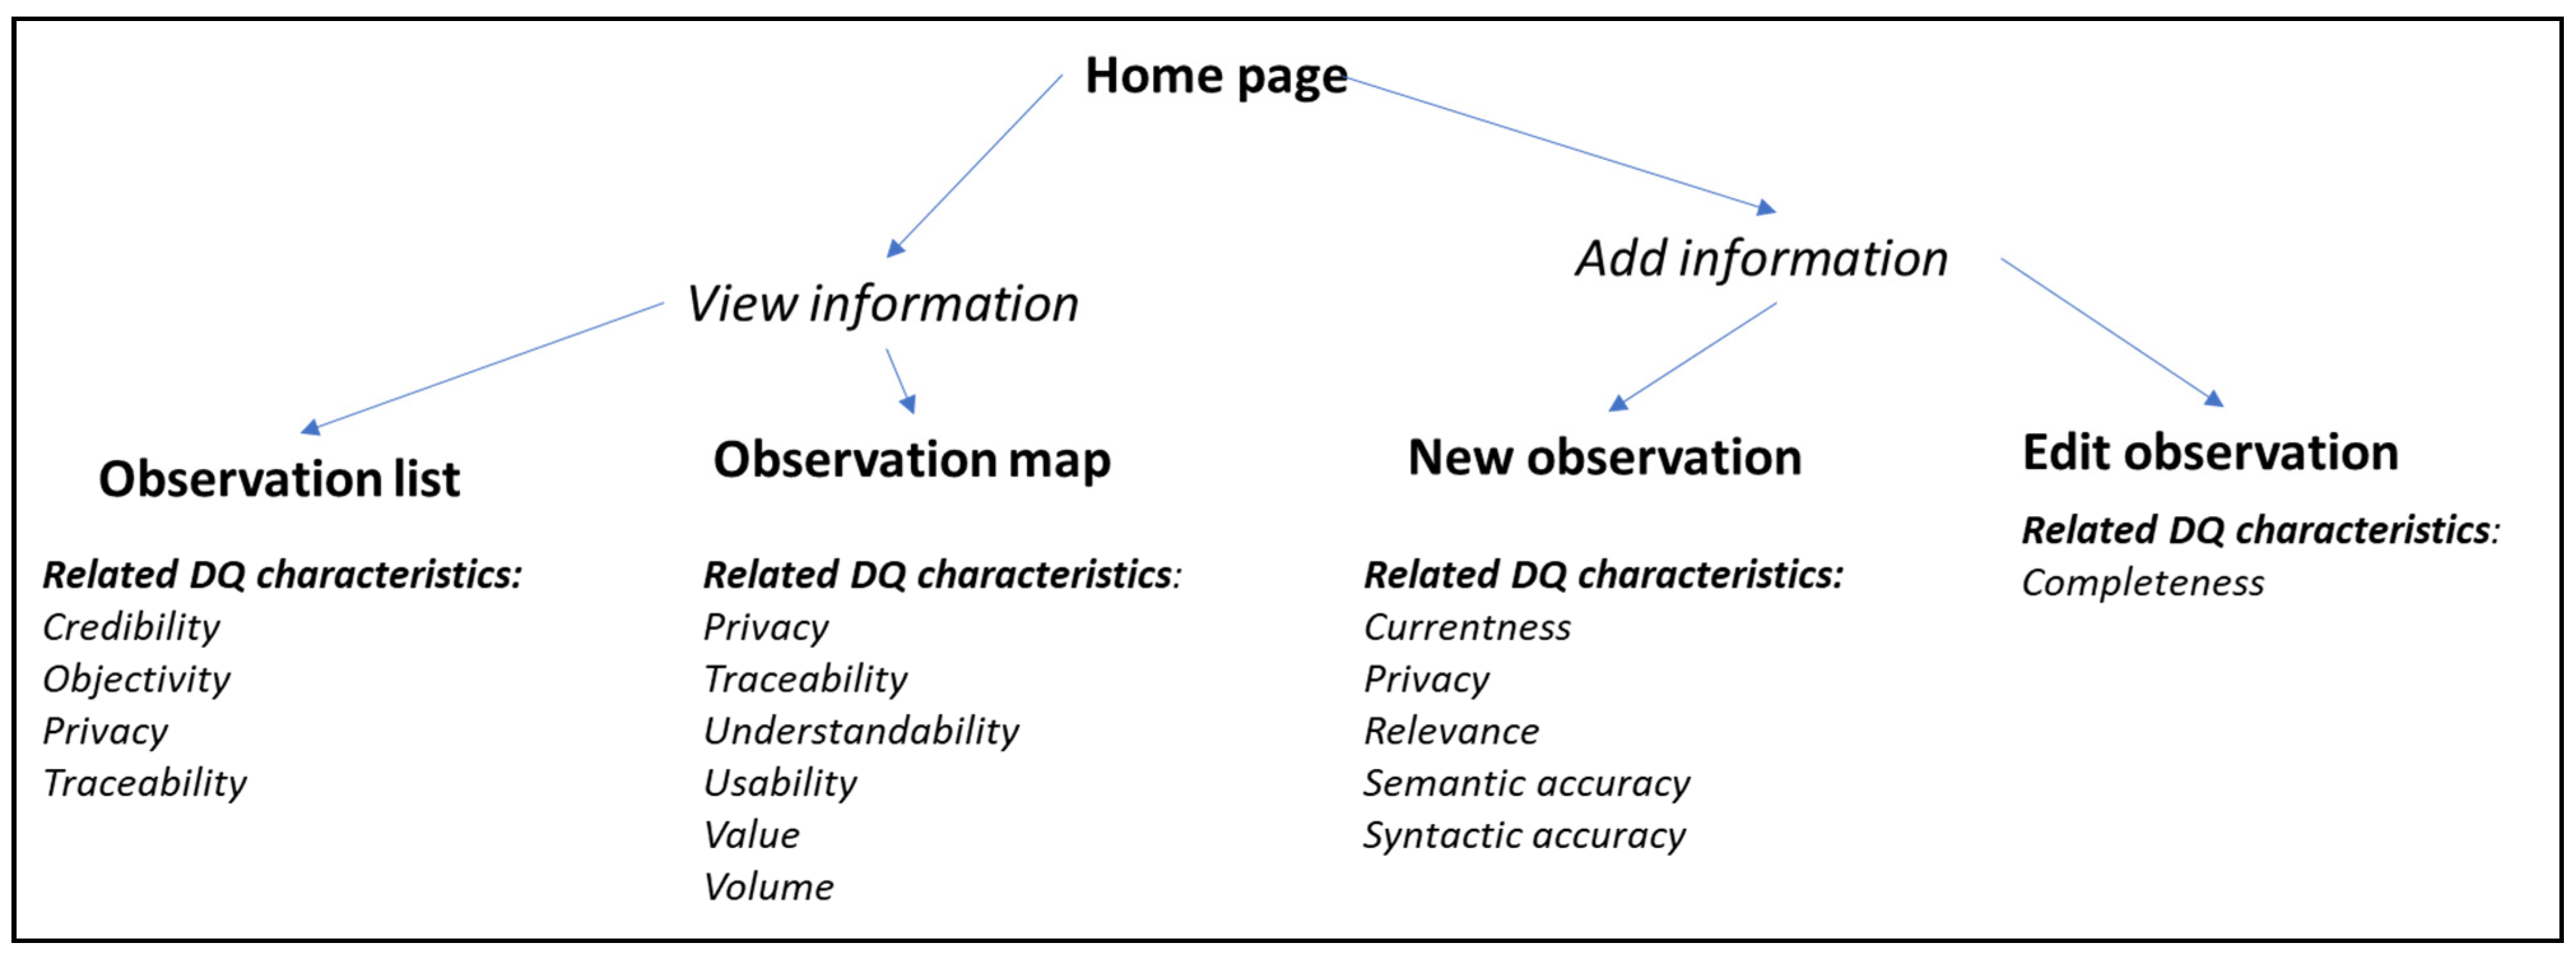
Figure 2 shows which characteristics relate to each view in the user interface. The characteristics affect how information is collected or shown in the user interface. Different characteristics are required for different views. For example, accuracy is essential in the New observation-view because data is being collected, but accuracy is unnecessary in the Observations list-view as the data has already been collected and requires no further refinement of accuracy.
The following characteristics are integrated into the user interface: completeness, privacy, understandability, credibility, objectivity, traceability, accuracy (syntactic and semantic), volume, value, usability, and relevance.
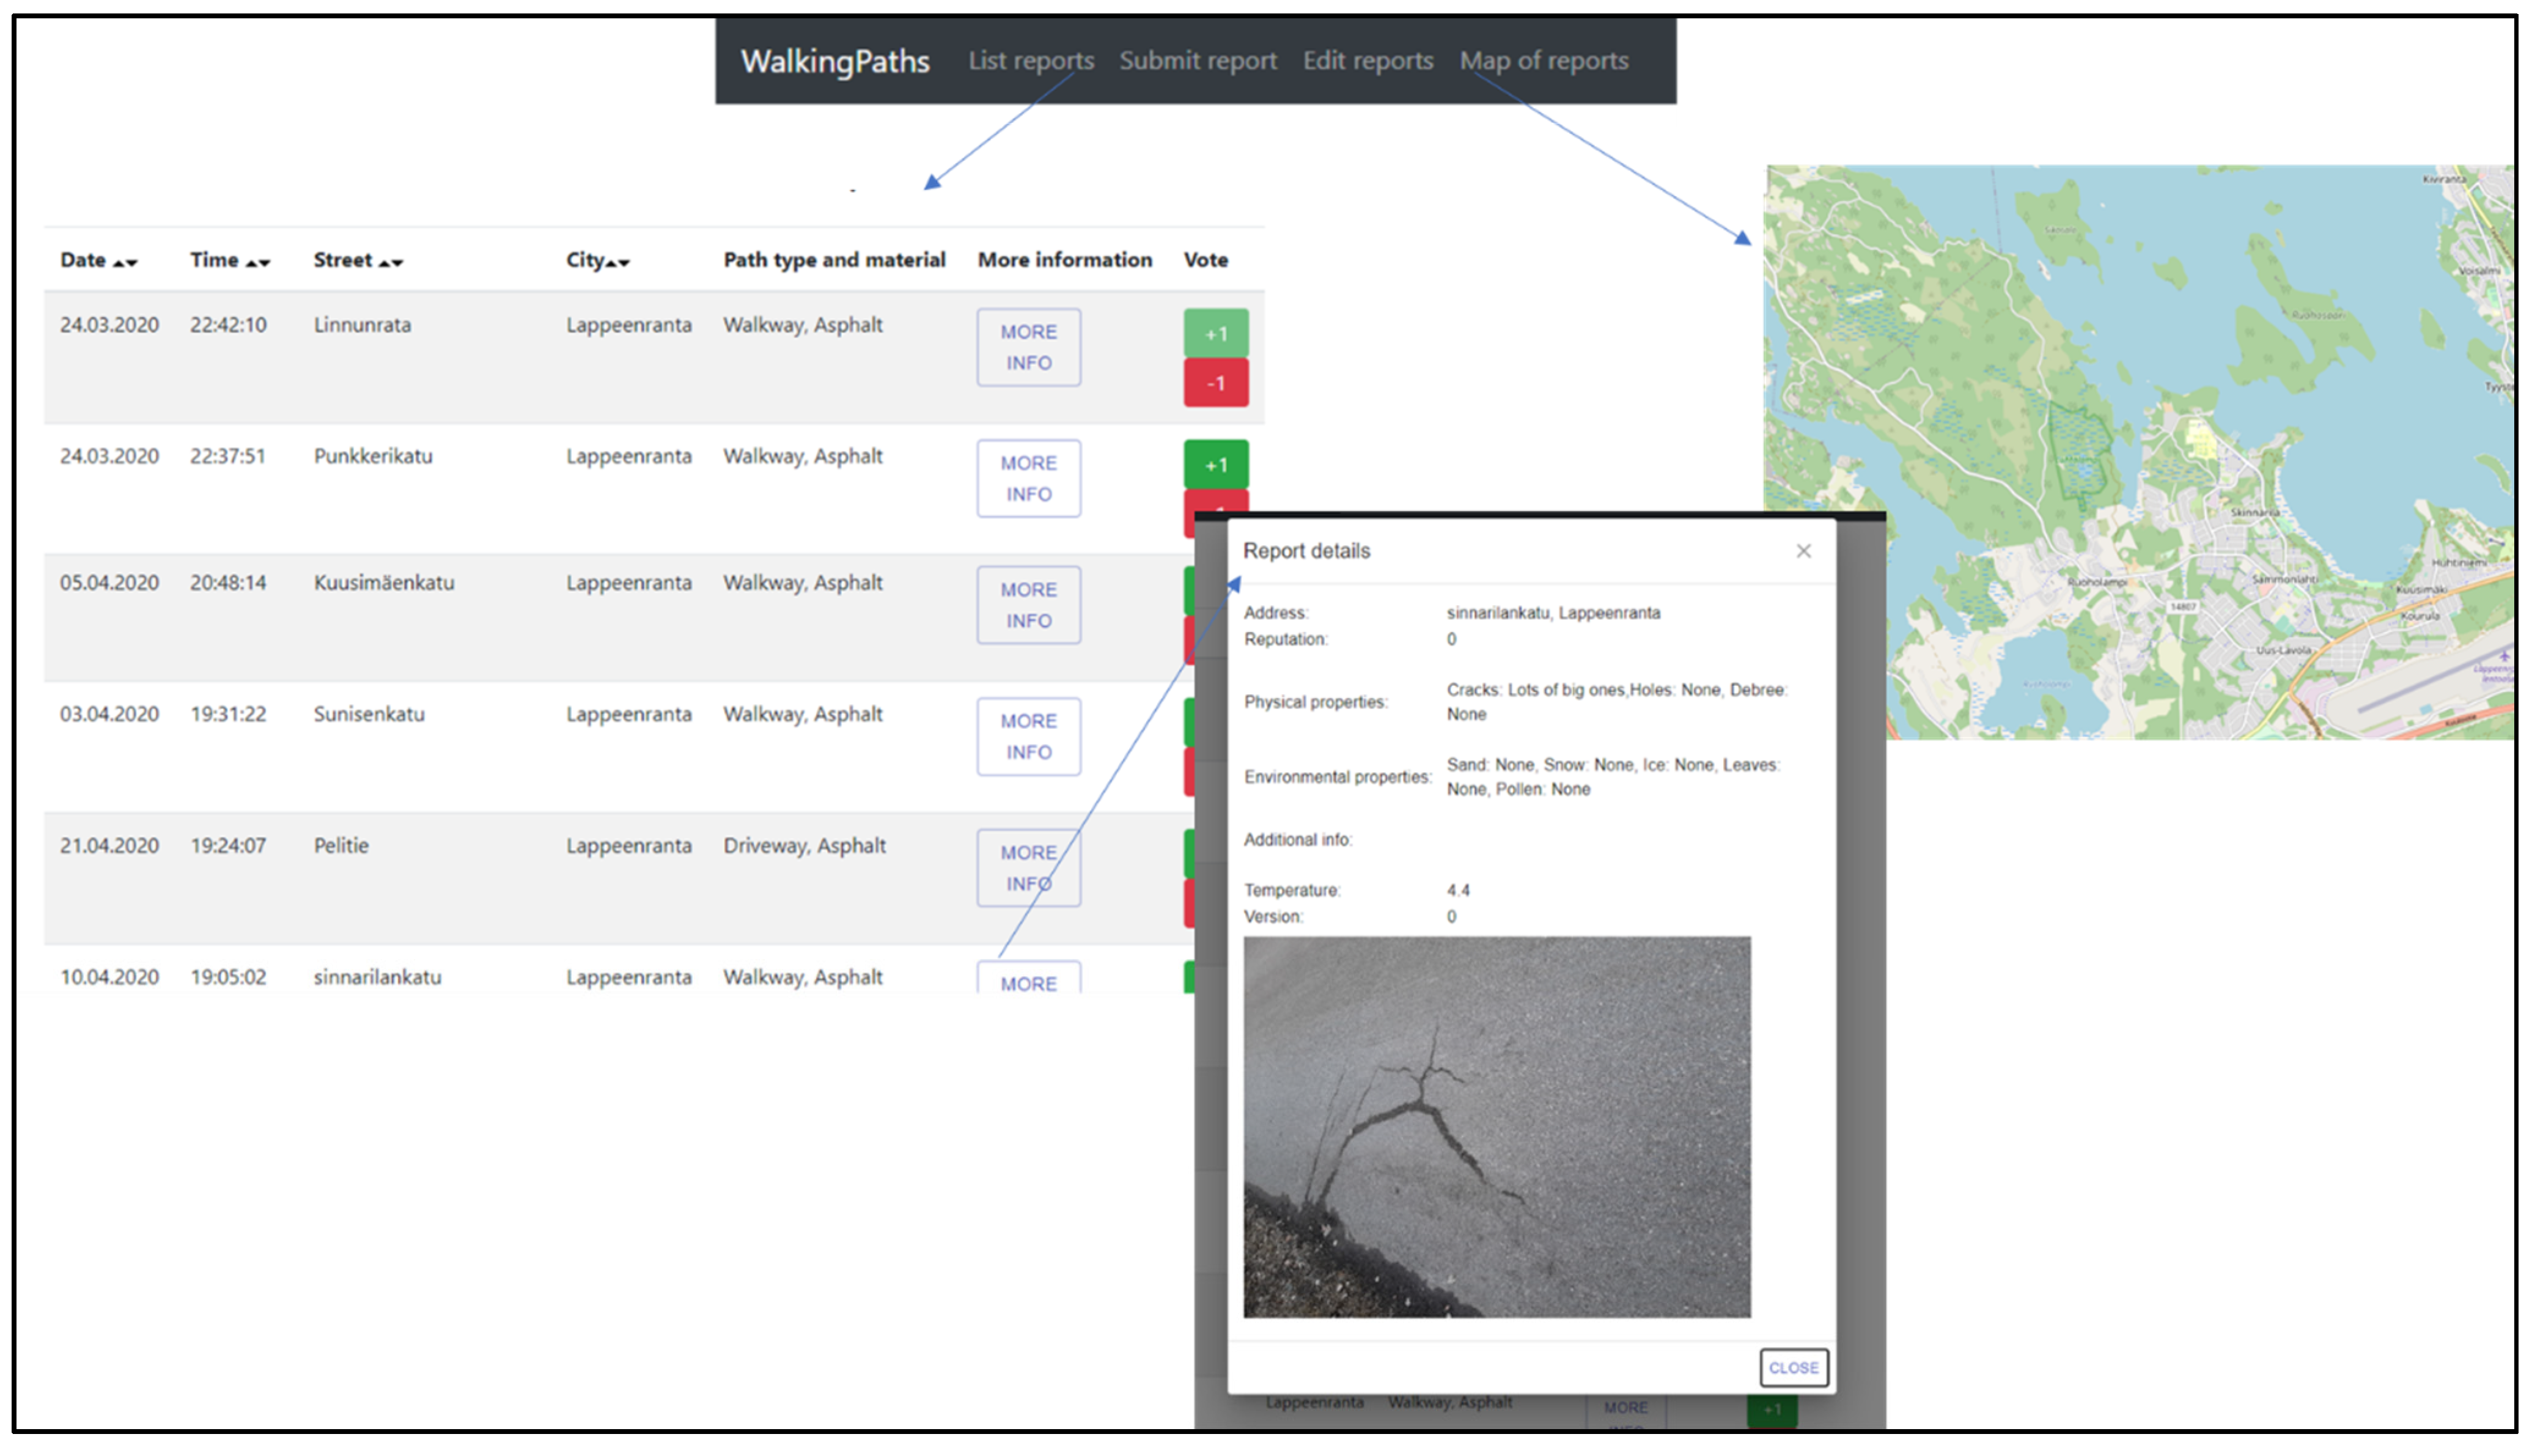
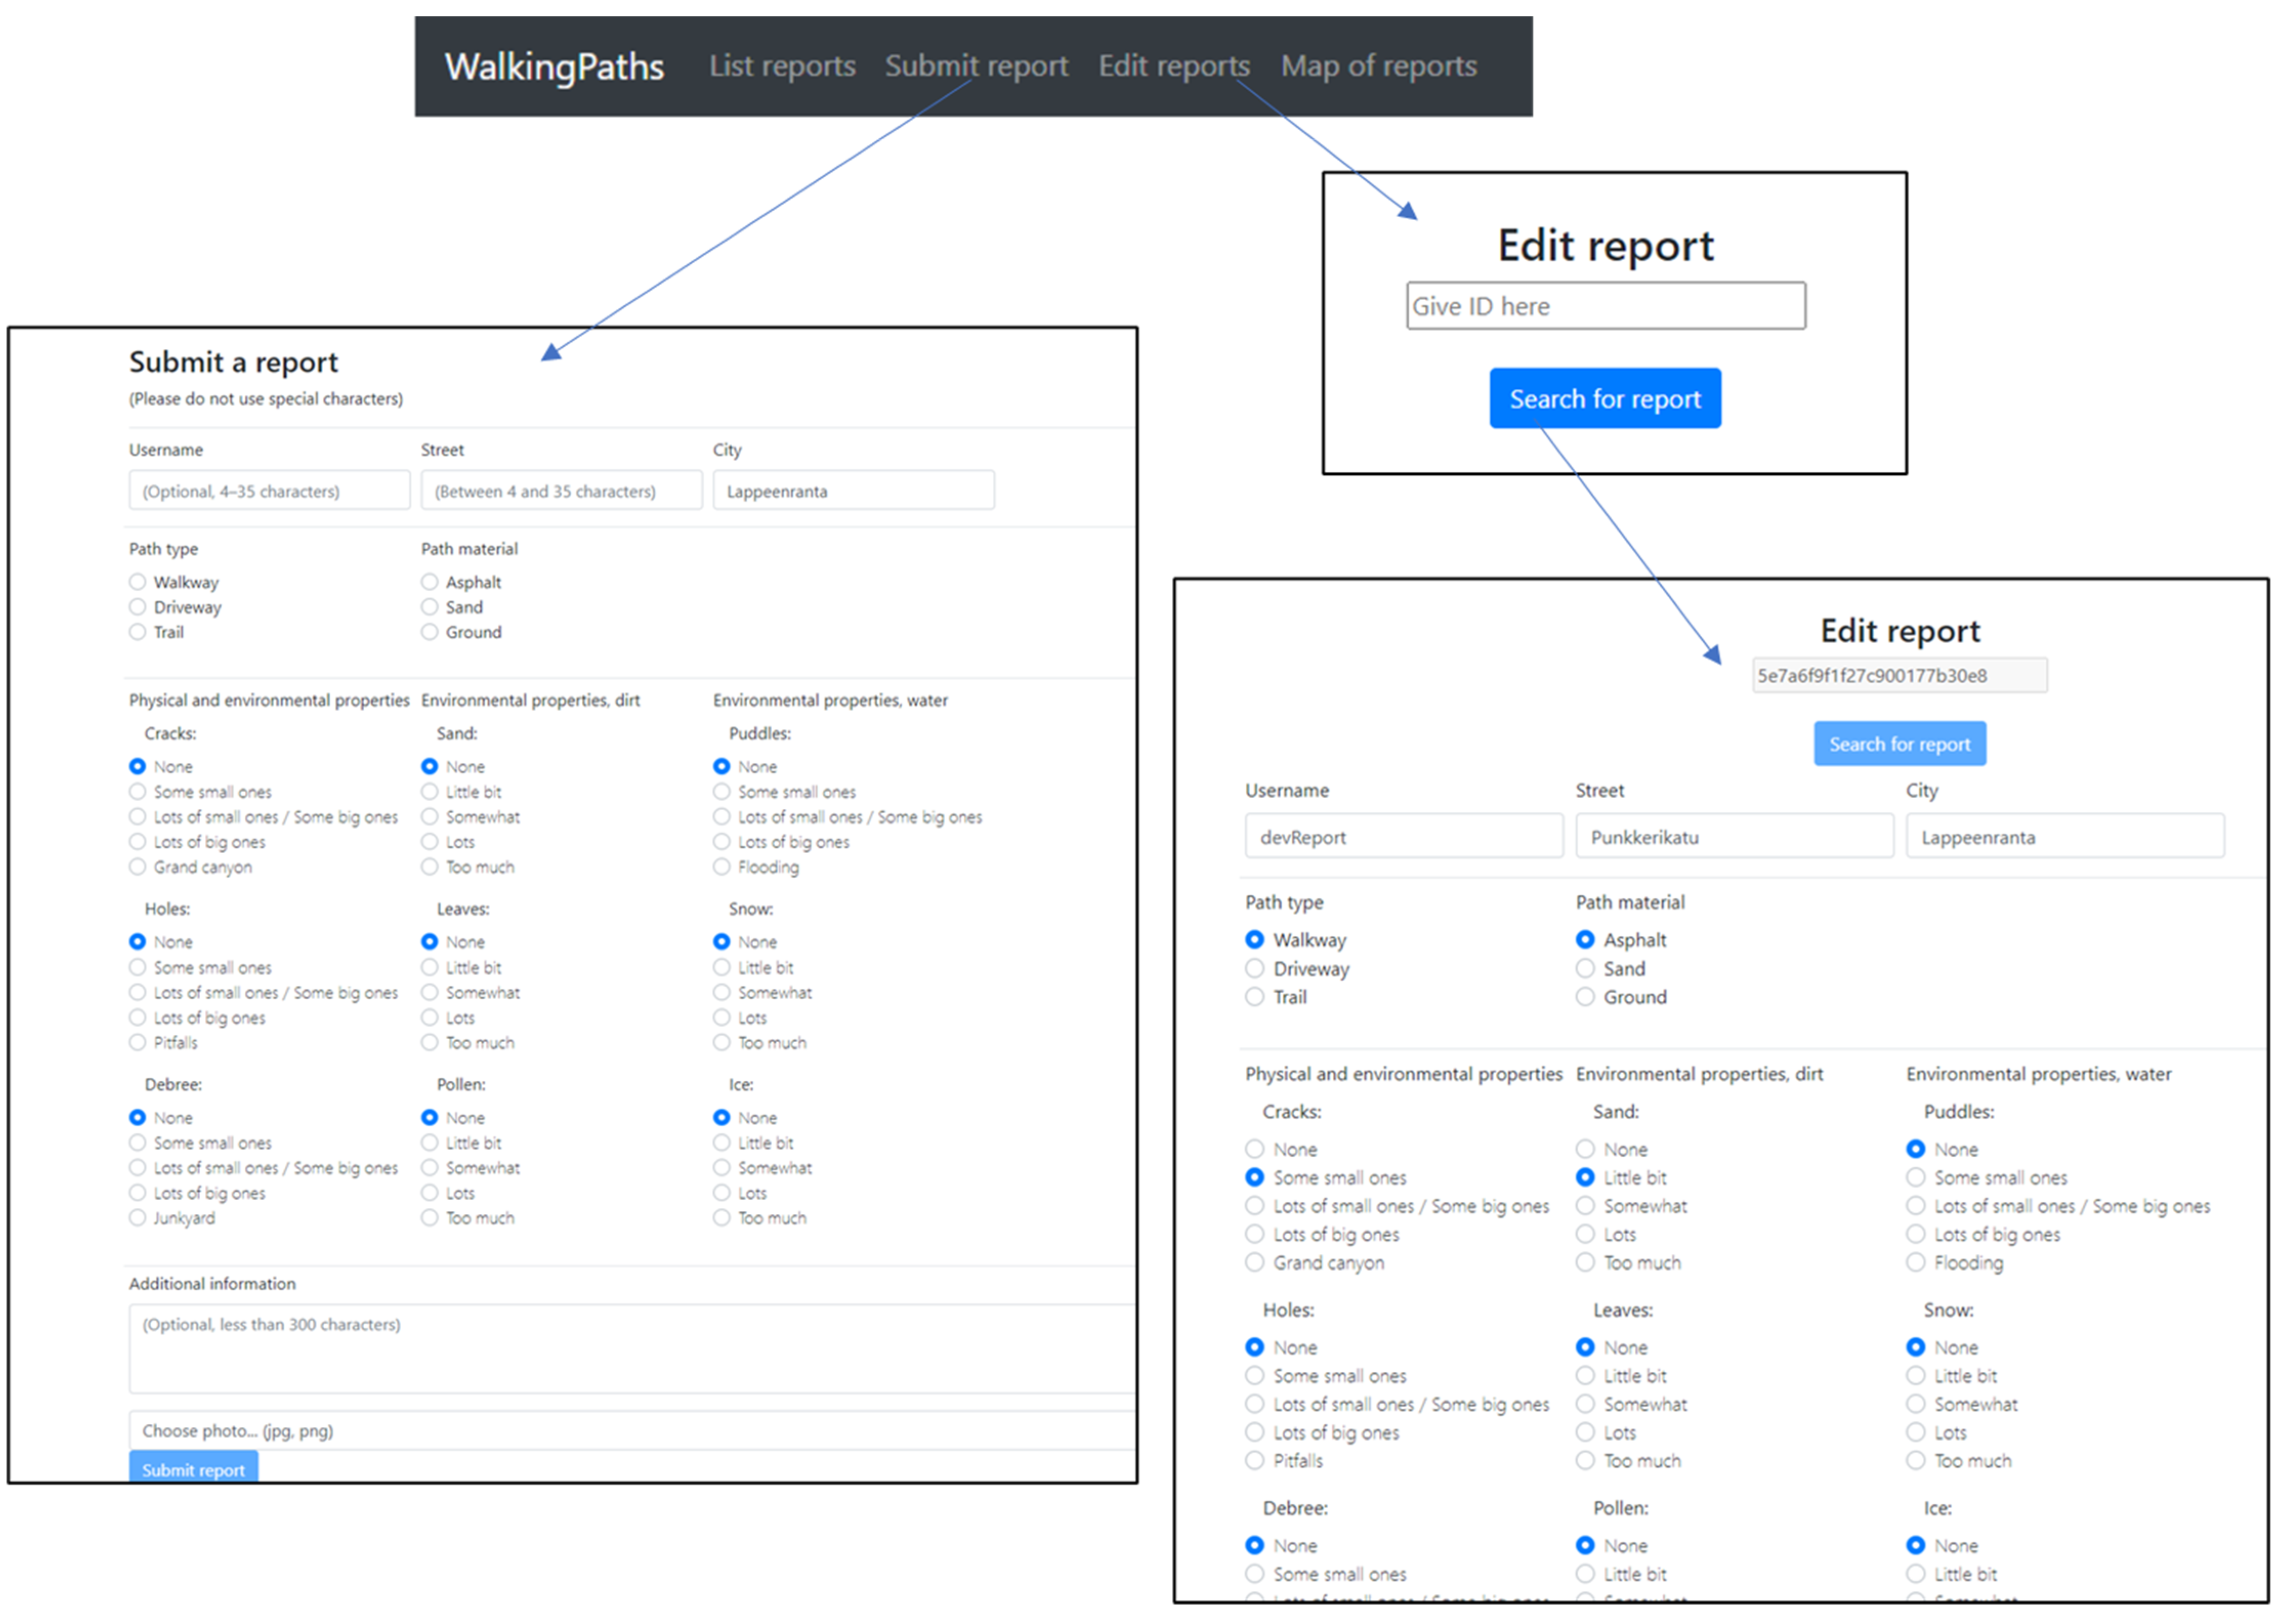
Figure 3 and Figure 4 show the transition using the navigation bar to each view presented in Figure 2. The observation list only notes minimal detail for each report, such as location and time. Everything else regarding the report can be viewed by opening the More information pop-up window. Each report can be up- or down-voted by anyone. As the platform does not require registration, some other forms of restrictions have been implemented in the voting mechanism to reduce misuse. Edit observation view is similar to New observation except for the fact that, when editing an existing observation, the user must provide an ID to retrieve the current information.
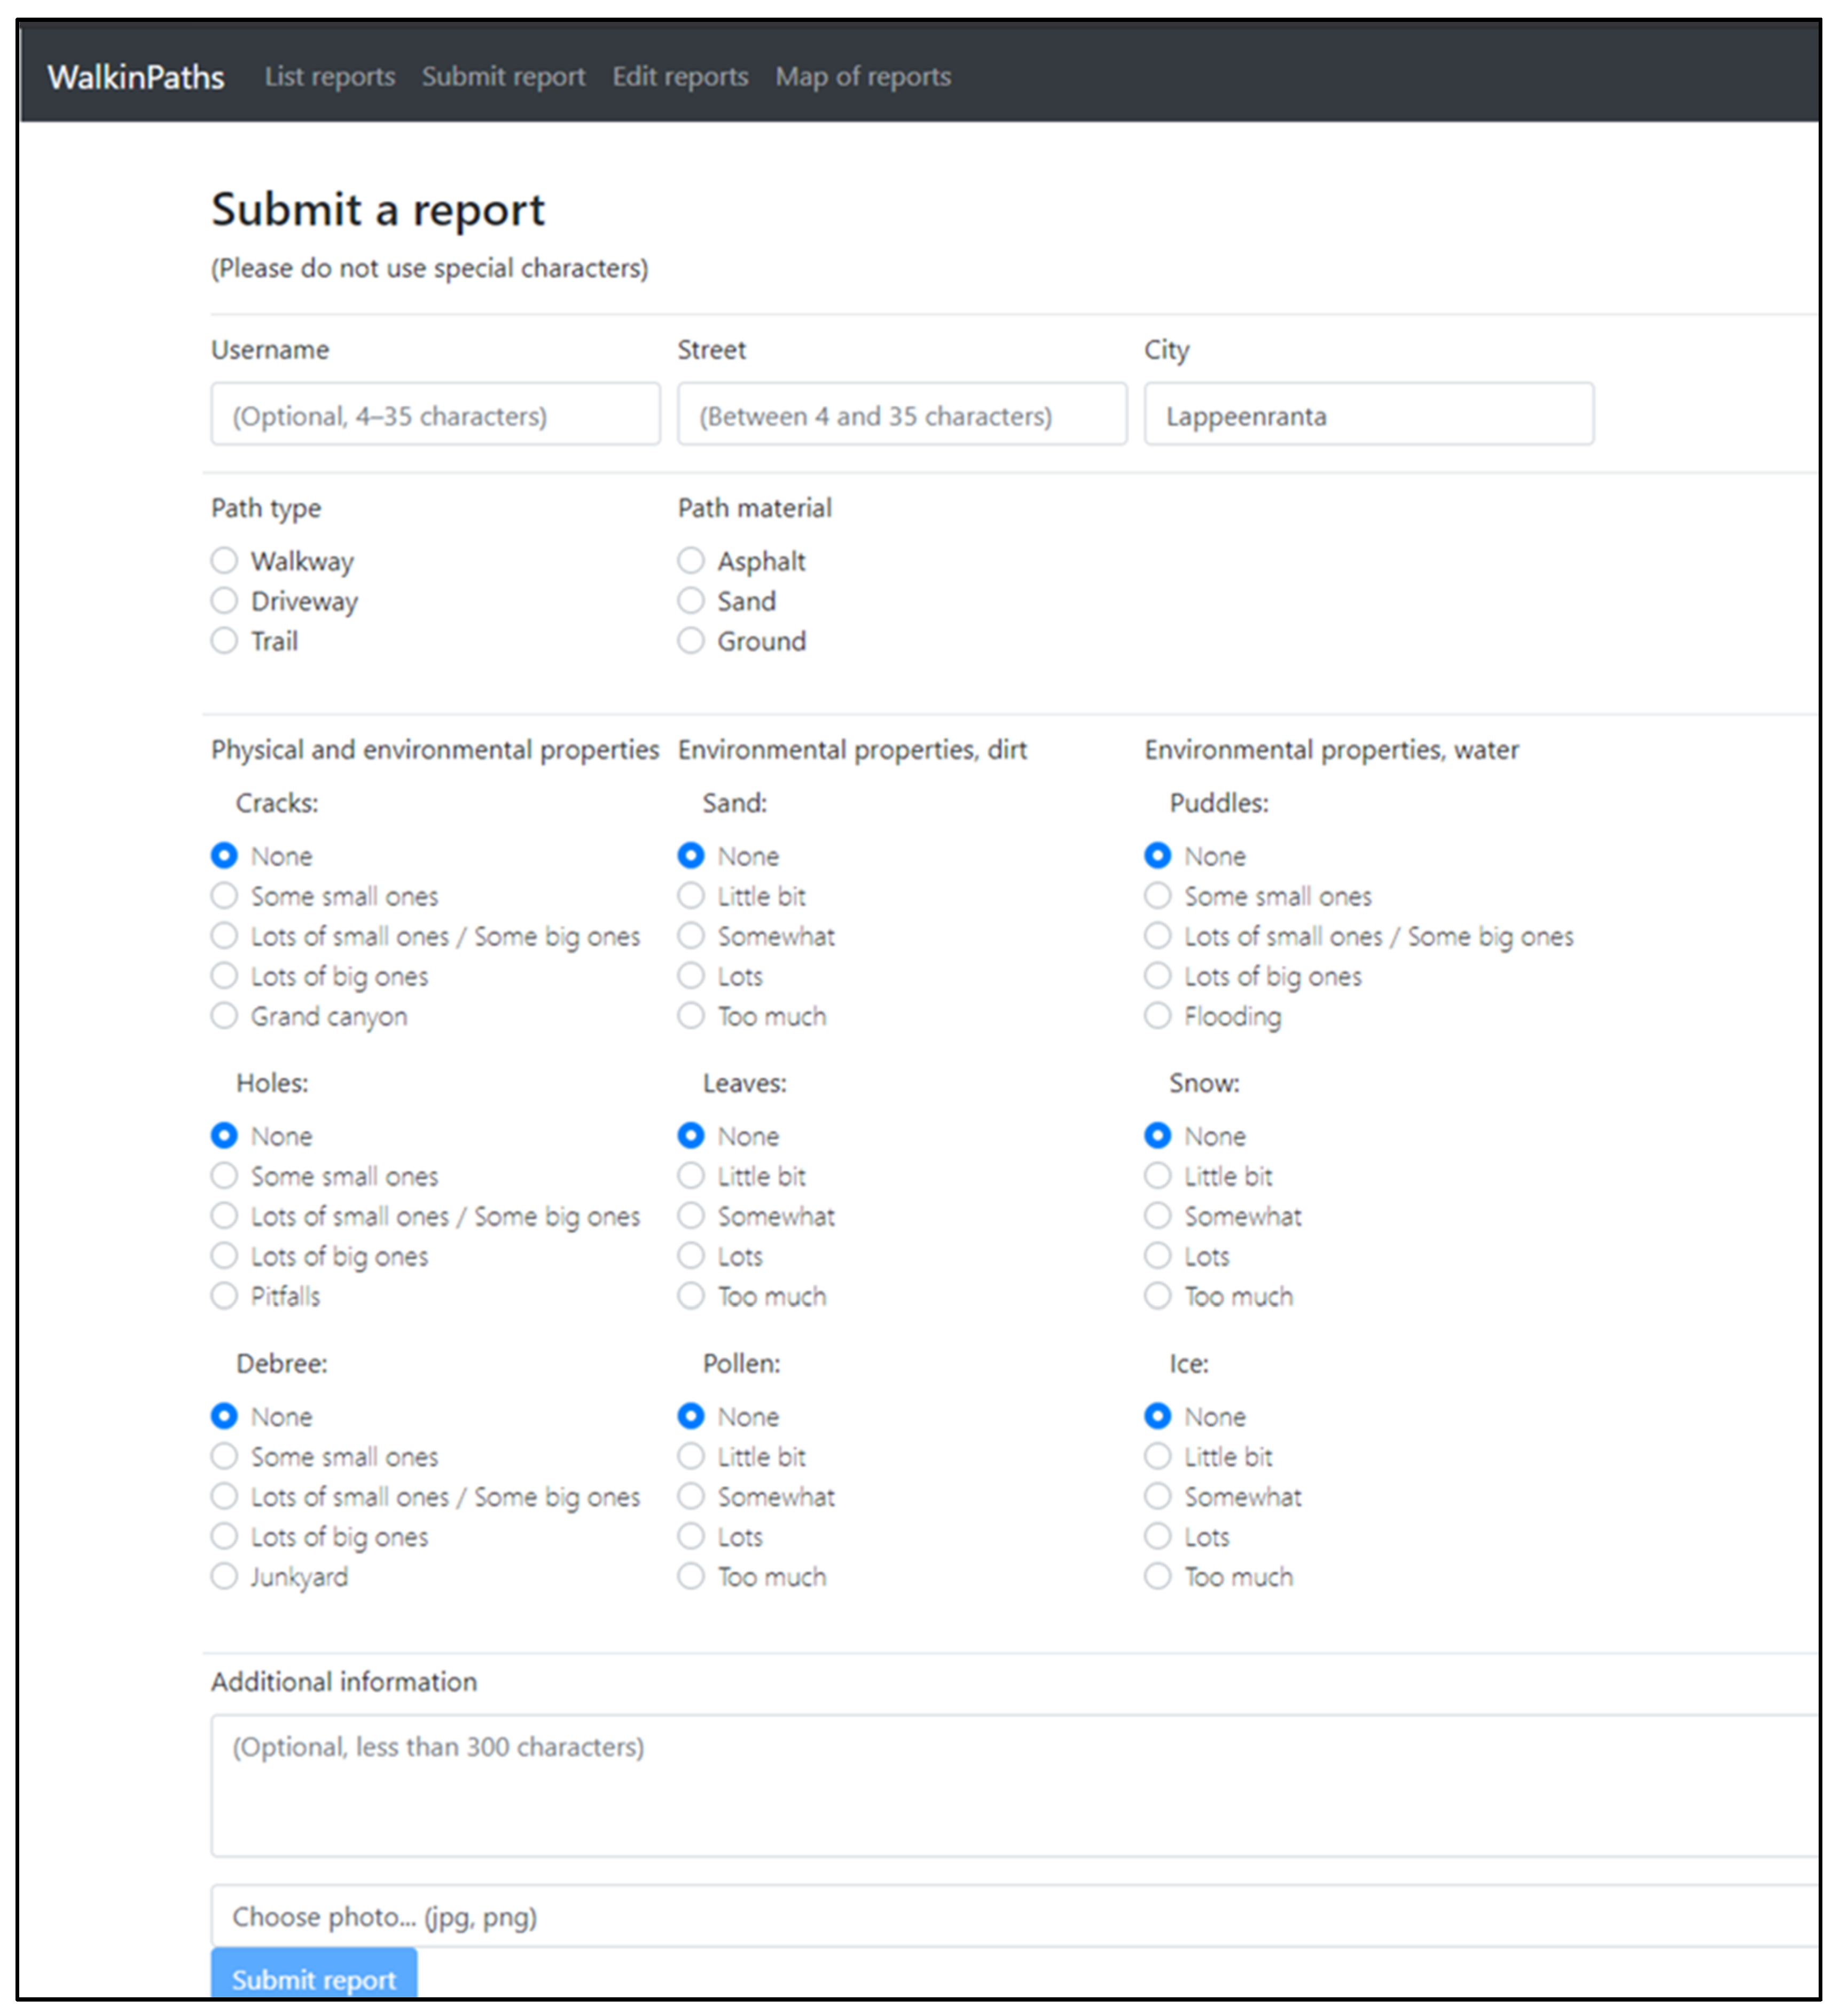
Figure 5 presents a higher-resolution view of report submission, as shown in Figure 4. Only four fields are freeform text, and two of them are mandatory. Username and Additional information are optional fields that can be left empty. Many of the choice boxes in the report window have predetermined values to ensure each report’s completeness. Only two choice boxes do not have a value, but the report cannot be submitted before some value is given to both of them.
The usage of choice boxes is an excellent method for increasing the report’s syntactic and semantic accuracy. They also enable the content provider to know what to look for before submitting anything. Any additional information can be written in the text box. The user is not required to give an exact location; the city and street names (optional building numbers) are sufficient. There are a few reasons why a precise location is not required:
- The location precision of a smartphone is inconsistent. The precision varies between smartphone models and, with buildings or trees around the area, the precision decreases. This imprecision may result in placing the actual location on a different street to that which is suggested by the coordinates [54,55,56,57].
- Use of the location requires permission from the user, and not all are willing to give consent.
- Precise location raises privacy concerns [58].
Marking the disclosure of a precise location as optional information may hinder the exact precision of results, but it increases users’ privacy. The downside of this is that, if the user does not remember or know the street name, it can affect their willingness to contribute observations.
4.2. Evaluation and Analysis
WalkingPaths is subjected to the same RapidMiner queries as other citizen science platforms. Table 5 presents the analysis results for WalkingPaths combined with the previous results from Table 4.
WalkingPaths scored better results than other citizen science platforms in most categories and is the only platform with results pertaining to credibility. Credibility in WalkingPaths is based on a user’s reputation, and this reputation is tied to their previous observations and agreement scores. However, the volume in WalkingPaths is the lowest, although this is expected as the project is new. The most significant difference in scores is missing dates and times in other platforms for completeness, currentness, and traceability.
In WalkingPaths, semantic accuracy is affected by misspelled street and city names. This could be quickly resolved by adding a comprehensive list of available cities and suggestions for street names when the content provider starts typing. However, if a similar platform is extended outside of one country, the list of cities and street names would inflate drastically. While it can be argued that ALA, iNaturalist, and Budburst perform worse than WalkingPaths or Globe at Night because they collect different kinds of observations, the same techniques used in the development of WalkingPath can be utilized in any type of observation. The difference in the types of observations is negligible as platforms’ underlying principle stays the same.
5. Discussion
Improving data quality based on the data model is not a new idea [6,32,46,59]. This research aims to improve data and information quality by integrating quality characteristics into the citizen science platform’s design, mainly focusing on the data model and user interface. Improving the data model is presented as an excellent option to enhance data quality, while processes that add or modify the data should be examined and improved [46]. Data quality characteristics can be considered constraints for the data model and the platform’s user interface during the design stage.
Integrating quality characteristics into the design of a platform can increase the quality of data and information. Integration into a new platform is easier compared to integrating similar characteristics into an existing platform. If quality characteristics are integrated into the data model of an existing platform, the whole platform needs to be shut down in the worst-case scenario while making these changes. All current data needs to be either discarded or modified to comply with the new data model. Characteristics integrated into the user interface are easier to integrate as they do not require significant changes or modifications to the data model.
The quality of a platform design has a significant impact on the engagement of users. Many different variables affect how engaging a platform is. For example, placing a burden on users by requiring too much detail and information can demotivate citizens from submitting information, and the amount of information users send should be kept to a minimum [32]. Placing too many restrictions on what type of information users can submit may negatively influence their willingness to engage with the platform and continue to contribute. On the other hand, having too much freedom may equally demotivate users as they are unsure what information should be given, and the quality of information is drastically reduced [60,61]. Thus, there are tradeoffs with engagement and platform constraints that should be appropriately balanced. The adverse effects of limitations can be alleviated by masking the rules as guidelines rather than automatically implementing the rules to outright reject information.
Some researchers have investigated how citizen science platforms’ data quality can be increased by training citizens [62], using reputation models [63], and using attribute filtering methods for data input [59]. These are excellent choices for increasing the quality of data and information, but they require more from citizens than making changes to the platform would.
There are some limitations to WalkingPath data collection worth mentioning. First of all, the amount of data used for evaluation is small compared to citizen science platforms that have been online for a longer time. Another limitation is that the data is limited to one country. Finally, it would be beneficial to investigate how the integration of quality characteristics into an existing platform affects the quality of data and information and whether the benefits outweigh the costs.
6. Conclusions
This research presents an approach to improve citizen science platforms’ data and information quality by integrating quality characteristics into the platform design. Results show that incorporating quality characteristics into the design increases the overall quality of data compared to existing citizen science platforms. Furthermore, most characteristics can be integrated without significant changes to the design. Some of the characteristics are integrated into the data model, and others are integrated into the user interface. Several are integrated into both by attaching a score to the data entity in the data model.
This research’s integration criterion and method are helpful instruments for citizen science platform designers to improve data and information quality. This framework can be used in any platform and even be applied to an existing platform if necessary. The framework presents four categories for classifying the chosen characteristics to aid in deciding whether they should be integrated into the user interface or the data model.
The most important step is identifying which characteristics are essential in each platform, and this has to be done by considering the context in which the information will be used. This research selects frequently used characteristics for data and information quality that can be utilized in most citizen science platforms. However, the list is not exhaustive, and there may exist some relevant characteristics for specific cases.
Data and information quality are easier to define when quality is split into data and information characteristics. Researchers often base their definition and selection of data quality characteristics on previous research of classical quality models [25,26,27,34]. These research works assess classical data quality and are required to be adjusted case-by-case because data quality depends on the scenario [10,29]. Context is vital for information [28,37]. Data quality characteristics that are context-dependent can be transformed into information quality characteristics. This paper investigates data quality characteristics from earlier works and filters out those that do not apply to information to identify data and information quality characteristics related to citizen science platforms.
Some people trust data from citizen science platforms less than other sources because citizens are considered to be non-professionals who provide inaccurate data [6,22,64,65]. However, this is not necessarily true, and even if it is, there are methods to increase the quality of data on the platform [17,32,59,66].
In the future, a method will be developed so that the characteristics can be implemented into an existing platform to investigate how schema evolution can be accommodated to improve the quality of data in existing citizen science platforms and how quality is improved before and after the integration of quality characteristics.
Supplementary Materials
The following are available online at https://0-www-mdpi-com.brum.beds.ac.uk/article/10.3390/ijgi10070434/s1.
Author Contributions
Conceptualization, Jiri Musto and Ajantha Dahanayake; Methodology, Jiri Musto and Ajantha Dahanayake; Supervision, Ajantha Dahanayake; Writing—original draft, Jiri Musto; Writing—review & editing, Jiri Musto and Ajantha Dahanayake. All authors have read and agreed to the published version of the manuscript.
Funding
This research received no external funding.
Institutional Review Board Statement
Not applicable.
Informed Consent Statement
Not applicable.
Data Availability Statement
The data presented in this study is available in (Supplementary Material).
Conflicts of Interest
The authors declare no conflict of interest.
References
- Cornell Lab of Ornithology. eBird. 2021. Available online: https://ebird.org/home (accessed on 9 March 2021).
- Lintott, C.; Schawinski, K.; Bamford, S.; Slosar, A.; Land, K.; Thomas, D.; Edmondson, E.; Masters, K.; Nichol, R.C.; Raddick, M.J.; et al. Galaxy Zoo 1: Data release of morphological classifications for nearly 900 000 galaxies. Mon. Not. R. Astron. Soc. 2011, 410, 166–178. [Google Scholar] [CrossRef] [Green Version]
- Waldispühl, J.; Szantner, A.; Knight, R.; Caisse, S.; Pitchford, R. Leveling up citizen science. Nat. Biotechnol. 2020, 38, 1124–1126. [Google Scholar] [CrossRef] [PubMed]
- See, L.; Mooney, P.; Foody, G.; Bastin, L.; Comber, A.; Estima, J.; Fritz, S.; Kerle, N.; Jiang, B.; Laakso, M.; et al. Crowdsourcing, Citizen Science or Volunteered Geographic Information? The Current State of Crowdsourced Geographic Information. ISPRS Int. J. Geo-Inf. 2016, 5, 55. [Google Scholar] [CrossRef]
- Simpson, R.; Page, K.R.; De Roure, D. Zooniverse: Observing the world’s largest citizen science platform. In WWW 2014 Companion, Proceedings of the 23rd International Conference on World Wide Web, Seoul, Korea, 7–11 April 2014; Association for Computing Machinery, Inc: New York, NY, USA, 2014; pp. 1049–1054. [Google Scholar]
- Lukyanenko, R.; Parsons, J.; Wiersma, Y. The IQ of the Crowd: Understanding and Improving Information Quality in Structured User-Generated Content. Inf. Syst. Res. 2014, 25, 669–689. [Google Scholar] [CrossRef]
- Arthur, R.; Boulton, C.A.; Shotton, H.; Williams, H.T.P. Social sensing of floods in the UK. PLoS ONE 2018, 13, e0189327. [Google Scholar] [CrossRef] [PubMed]
- Liu, X.; Heller, A.; Nielsen, P.S. CITIESData: A smart city data management framework. Knowl. Inf. Syst. 2017, 53, 699–722. [Google Scholar] [CrossRef] [Green Version]
- SciStarter. SciStarter. 2021. Available online: https://scistarter.com/ (accessed on 9 January 2021).
- Lukyanenko, R.; Parsons, J.; Wiersma, Y.F. Emerging problems of data quality in citizen science. Conserv. Biol. 2016, 30, 447–449. [Google Scholar] [CrossRef] [Green Version]
- Nasiri, A.; Abbaspour, R.A.; Chehreghan, A.; Arsanjani, J.J. Improving the Quality of Citizen Contributed Geodata through Their Historical Contributions: The Case of the Road Network in OpenStreetMap. ISPRS Int. J. Geo-Inf. 2018, 7, 253. [Google Scholar] [CrossRef] [Green Version]
- Leibovici, D.G.; Rosser, J.F.; Hodges, C.; Evans, B.; Jackson, M.J.; Higgins, C.I. On Data Quality Assurance and Conflation Entanglement in Crowdsourcing for Environmental Studies. ISPRS Int. J. Geo-Information 2017, 6, 78. [Google Scholar] [CrossRef] [Green Version]
- Sheppard, S.A.; Wiggins, A.; Terveen, L. Capturing quality. In Proceedings of the 17th ACM Conference on Computer Supported Cooperative Work & Social Computing—CSCW ‘14, Baltimore, MD, USA, 15–19 February 2014; Association for Computing Machinery (ACM): New York, NY, USA, 2014; pp. 1234–1245. [Google Scholar]
- Elbroch, M.; Mwampamba, T.H.; Santos, M.J.; Zylberberg, M.; Liebenberg, L.; Minye, J.; Mosser, C.; Reddy, E. The Value, Limitations, and Challenges of Employing Local Experts in Conservation Research. Conserv. Biol. 2011, 25, 1195–1202. [Google Scholar] [CrossRef]
- Haklay, M.; Basiouka, S.; Antoniou, V.; Ather, A. How Many Volunteers Does It Take to Map an Area Well? The Validity of Linus’ Law to Volunteered Geographic Information. Cartogr. J. 2010, 47, 315–322. [Google Scholar] [CrossRef] [Green Version]
- Mitchell, N.; Triska, M.; Liberatore, A.; Ashcroft, L.; Weatherill, R.; Longnecker, N. Benefits and challenges of incorporating citizen science into university education. PLoS ONE 2017, 12, e0186285. [Google Scholar] [CrossRef]
- Bordogna, G.; Carrara, P.; Criscuolo, L.; Pepe, M.; Rampini, A. On predicting and improving the quality of Volunteer Geographic Information projects. Int. J. Digit. Earth 2016, 9, 134–155. [Google Scholar] [CrossRef]
- Medeiros, G.; Holanda, M. Solutions for Data Quality in GIS and VGI: A Systematic Literature Review. Adv. Intell. Syst. Comput. 2019, 930, 645–654. [Google Scholar] [CrossRef]
- Torre, M.; Nakayama, S.; Tolbert, T.J.; Porfiri, M. Producing knowledge by admitting ignorance: Enhancing data quality through an “I don’t know” option in citizen science. PLoS ONE 2019, 14, e0211907. [Google Scholar] [CrossRef]
- Dorn, H.; Törnros, T.; Zipf, A. Quality Evaluation of VGI Using Authoritative Data—A Comparison with Land Use Data in Southern Germany. ISPRS Int. J. Geo-Inf. 2015, 4, 1657–1671. [Google Scholar] [CrossRef]
- Musto, J.; Dahanayake, A. Improving Data Quality, Privacy and Provenance in Citizen Science Applications. Front. Artif. Intell. Appl. 2020, 321, 141–160. [Google Scholar] [CrossRef]
- Bayraktarov, E.; Ehmke, G.; O’Connor, J.; Burns, E.L.; Nguyen, H.A.; McRae, L.; Possingham, H.P.; Lindenmayer, D.B. Do Big Unstructured Biodiversity Data Mean More Knowledge? Front. Ecol. Evol. 2019, 6, 239. [Google Scholar] [CrossRef] [Green Version]
- Sadiq, S.; Indulska, M. Open data: Quality over quantity. Int. J. Inf. Manag. 2017, 37, 150–154. [Google Scholar] [CrossRef]
- Lewandowski, E.; Specht, H. Influence of volunteer and project characteristics on data quality of biological surveys. Conserv. Biol. 2015, 29, 713–723. [Google Scholar] [CrossRef] [PubMed]
- Wang, R.Y.; Strong, D.M. Beyond Accuracy: What Data Quality Means to Data Consumers. J. Manag. Inf. Syst. 1996, 12, 5–33. [Google Scholar] [CrossRef]
- Batini, C.; Scannapieco, M. Data Quality: Concepts, Methodologies and Techniques; Springer: Berlin, Germany, 2006; ISBN 9783540331735. [Google Scholar]
- Redman, T.C. Data Quality for the Information Age; Artech House: Norwood, MA, USA, 1996; ISBN 9780890068830. [Google Scholar]
- Bovee, M.; Srivastava, R.P.; Mak, B. A conceptual framework and belief-function approach to assessing overall information quality. Int. J. Intell. Syst. 2003, 18, 51–74. [Google Scholar] [CrossRef] [Green Version]
- Haug, A.; Arlbjørn, J.S.; Pedersen, A. A classification model of ERP system data quality. Ind. Manag. Data Syst. 2009, 109, 1053–1068. [Google Scholar] [CrossRef]
- Han, J.; Jiang, D.; Ding, Z. Assessing Data Quality Within Available Context. In Data Quality and High-Dimensional Data Analysis Proceedings of the DASFAA 2008 Workshops, New Delhi, India, 19–22 March 2008; World Scientific: Singapore, 2009; pp. 42–59. [Google Scholar]
- Batini, C.; Blaschke, T.; Lang, S.; Albrecht, F.; Abdulmutalib, H.M.; Barsi, Á.; Szabó, G.; Kugler, Z. Data Quality in Remote Sensing. ISPRS Int. Arch. Photogramm. Remote Sens. Spatial Inf. Sci. 2009, 42, 447–453. [Google Scholar] [CrossRef] [Green Version]
- Lukyanenko, R.; Parsons, J.; Wiersma, Y.F.; Maddah, M. Expecting the Unexpected: Effects of Data Collection Design Choices on the Quality of Crowdsourced User-Generated Content. MIS Q. 2019, 43, 623–648. [Google Scholar] [CrossRef] [Green Version]
- International Organization for Standardization (ISO). ISO 19157:2013 Geographic Information—Data Quality; ISO: Geneva, Switzerland, 2013. [Google Scholar]
- International Organization for Standardization (ISO). ISO/IEC 25012:2008 Software Engineering—Software Product Quality Requirements and Evaluation (SQuaRE)—Data Quality Model; ISO: Geneva, Switzerland, 2008. [Google Scholar]
- International Organization for Standardization (ISO). ISO/TS 8000:2011 Data Quality; ISO: Geneva, Switzerland, 2011. [Google Scholar]
- Watts, S.; Shankaranarayanan, G.; Even, A. Data quality assessment in context: A cognitive perspective. Decis. Support Syst. 2009, 48, 202–211. [Google Scholar] [CrossRef]
- Davenport, T.H.; Prusak, L. Working Knowledge: How Organizations Manage What They Know; Harvard Business School Press: Boston, MA, USA, 1998. [Google Scholar]
- Batini, C.; Cappiello, C.; Francalanci, C.; Maurino, A. Methodologies for data quality assessment and improvement. ACM Comput. Surv. 2009, 41, 1–52. [Google Scholar] [CrossRef] [Green Version]
- iNaturalist. A Community for Naturalists. 2021. Available online: https://www.inaturalist.org/ (accessed on 29 March 2021).
- Kelling, S.; Lagoze, C.; Wong, W.-K.; Yu, J.; Damoulas, T.; Gerbracht, J.; Fink, D.; Gomes, C. E Bird: A human/computer learning network to improve biodiversity conservation and research. AI Mag. 2013, 34, 10–20. [Google Scholar]
- Rajaram, G.; Manjula, K. Exploiting the Potential of VGI Metadata to Develop A Data-Driven Framework for Predicting User’s Proficiency in OpenStreetMap Context. ISPRS Int. J. Geo-Inf. 2019, 8, 492. [Google Scholar] [CrossRef] [Green Version]
- Shanks, G.; Darke, P. Understanding Data Quality in a Data Warehouse. J. Res. Pract. Inf. Technol. 1998, 30, 122–128. [Google Scholar]
- Cai, L.; Zhu, Y. The Challenges of Data Quality and Data Quality Assessment in the Big Data Era. Data Sci. J. 2015, 14, 2. [Google Scholar] [CrossRef]
- Immonen, A.; Pääkkönen, P.; Ovaska, E. Evaluating the Quality of Social Media Data in Big Data Architecture. IEEE Access 2015, 3, 2028–2043. [Google Scholar] [CrossRef]
- Higgins, C.I.; Williams, J.; Leibovici, D.G.; Simonis, I.; Davis, M.J.; Muldoon, C.; Van Genuchten, P.; O’hare, G.; Wiemann, S. Citizen OBservatory WEB (COBWEB): A Generic Infrastructure Platform to Facilitate the Collection of Citizen Science data for Environmental Monitoring. Int. J. Spat. Data Infrastruct. Res. 2016, 11, 20–48. [Google Scholar] [CrossRef]
- Fox, T.L.; Guynes, C.S.; Prybutok, V.R.; Windsor, J. Maintaining Quality in Information Systems. J. Comput. Inf. Syst. 1999, 40, 76–80. [Google Scholar] [CrossRef]
- Fonte, C.C.; Antoniou, V.; Bastin, L.; Estima, J.; Arsanjani, J.J.; Bayas, J.-C.L.; See, L.; Vatseva, R. Assessing VGI Data Quality. In Mapping and the Citizen Sensor; Ubiquity Press: London, UK, 2017; pp. 137–163. ISBN 978-1-911529-16-3. [Google Scholar]
- Atlas of Living Australia. Open access to Australia’s Biodiversity Data. 2021. Available online: http://www.ala.org.au/ (accessed on 17 March 2021).
- Globe at Night. International Citizen-Science Campaign to Raise Public Awareness of the Impact of Light Pollution. 2021. Available online: https://www.globeatnight.org/ (accessed on 27 April 2021).
- Budburst. An Online Database of Plant Observations, a Citizen-Science Project of the Chicago Botanic Garden. Glencoe, Illinois. 2021. Available online: https://budburst.org/ (accessed on 27 April 2021).
- Intersoft Consulting. General Data Protection Regulation (GDPR)—Official Legal Text. 2018. Available online: https://gdpr-info.eu/ (accessed on 7 June 2021).
- California Legislative Information. Bill Text-SB-1121 California Consumer Privacy Act of 2018. 2018. Available online: https://leginfo.legislature.ca.gov/faces/billTextClient.xhtml?bill_id=201720180SB1121 (accessed on 7 June 2021).
- Teorey, T.; Lightstone, S.; Nadeau, T.; Jagadish, H.V. Business Intelligence. In Database Modeling and Design; Elsevier: Amsterdam, The Netherlands, 2011; pp. 189–231. [Google Scholar]
- GPS.gov. GPS Accuracy. 2020. Available online: https://www.gps.gov/systems/gps/performance/accuracy/ (accessed on 19 April 2021).
- Merry, K.; Bettinger, P. Smartphone GPS accuracy study in an urban environment. PLoS ONE 2019, 14, e0219890. [Google Scholar] [CrossRef] [Green Version]
- Schaefer, M.; Woodyer, T. Assessing absolute and relative accuracy of recreation-grade and mobile phone GNSS devices: A method for informing device choice. Area 2015, 47, 185–196. [Google Scholar] [CrossRef]
- Tomaštík, J.; Saloň, Š.; Piroh, R. Horizontal accuracy and applicability of smartphone GNSS positioning in forests. Forestry 2016, 90, 187–198. [Google Scholar] [CrossRef] [Green Version]
- De Montjoye, Y.-A.; Hidalgo, C.A.; Verleysen, M.; Blondel, V.D. Unique in the Crowd: The privacy bounds of human mobility. Sci. Rep. 2013, 3, 1376. [Google Scholar] [CrossRef] [PubMed] [Green Version]
- Lukyanenko, R.; Parsons, J.; Wiersma, Y. Citizen Science 2.0: Data Management Principles to Harness the Power of the Crowd. In DESRIST 2011: Service-Oriented Perspectives in Design Science Research; Springer: Berlin/Heidelberg, Germany, 2011; Volume 6629, pp. 465–473. ISBN 9783642206320. [Google Scholar]
- Wehn, U.; Almomani, A. Incentives and barriers for participation in community-based environmental monitoring and information systems: A critical analysis and integration of the literature. Environ. Sci. Policy 2019, 101, 341–357. [Google Scholar] [CrossRef]
- Hobbs, S.J.; White, P.C.L. Motivations and barriers in relation to community participation in biodiversity recording. J. Nat. Conserv. 2012, 20, 364–373. [Google Scholar] [CrossRef]
- Fonte, C.C.; Bastin, L.; Foody, G.; Kellenberger, T.; Kerle, N.; Mooney, P.; Olteanu-Raimond, A.-M.; See, L. Vgi Quality Control. ISPRS Ann. Photogramm. Remote Sens. Spatial Inf. Sci. 2015, 2, 317–324. [Google Scholar] [CrossRef] [Green Version]
- Pang, L.; Li, G.; Yao, X.; Lai, Y. An Incentive Mechanism Based on a Bayesian Game for Spatial Crowdsourcing. IEEE Access 2019, 7, 14340–14352. [Google Scholar] [CrossRef]
- Blatt, A.J. The Benefits and Risks of Volunteered Geographic Information. J. Map Geogr. Libr. 2015, 11, 99–104. [Google Scholar] [CrossRef]
- See, L.; Comber, A.; Salk, C.; Fritz, S.; van der Velde, M.; Perger, C.; Schill, C.; McCallum, I.; Kraxner, F.; Obersteiner, M. Comparing the Quality of Crowdsourced Data Contributed by Expert and Non-Experts. PLoS ONE 2013, 8, e69958. [Google Scholar] [CrossRef] [PubMed] [Green Version]
- Guo, J.; Liu, F. Automatic Data Quality Control of Observations in Wireless Sensor Network. IEEE Geosci. Remote. Sens. Lett. 2014, 12, 716–720. [Google Scholar] [CrossRef]
Figure 1.
A database schema using the snowflake model for WalkingPaths.

Figure 2.
Quality characteristics in WalkingPaths views.

Figure 3.
WalkingPaths observation list and map.

Figure 4.
The New observation and Edit observation views of WalkingPaths.

Figure 5.
A detailed version of the new observation view.


Table 1.
Data quality characteristic comparison.
| Applicable for Information Quality | Wang and Strong [25] | ISO 25012 [34] | Redman [27] |
|---|---|---|---|
| Yes | believability | credibility | |
| Yes | accuracy | accuracy (syntactic and semantic) | accuracy |
| Yes | objectivity | ||
| Yes | reputation | ||
| Yes | relevancy | appropriateness | |
| Yes | value-added | ||
| Yes | timeliness | currentness | currency |
| Yes | completeness | completeness | completeness |
| Yes | an appropriate amount of data | ||
| Yes | interpretability | interpretability | |
| Yes | ease of understanding | understandability | |
| Yes/No | representational consistency | representation consistency | |
| Yes/No | concise representation | ||
| No | accessibility | accessibility | |
| Yes | access security | confidentiality | |
| No | efficiency | efficient use of memory | |
| No | compliance | ||
| Yes/No | precision | format precision | |
| Yes | traceability | ||
| No | availability | ||
| No | portability | portability | |
| No | recoverability | ||
| No | consistency | consistency | |
| No | ability to represent null values | ||
| No | format flexibility |
Table 2.
Chosen characteristics and their definitions.
| Final List | Definition |
|---|---|
| credibility | The source of information is credible. It does not consider the credibility of the information. |
| accuracy (syntactic and semantic) | Information is syntactically and semantically correct, i.e., of correct type and logical. |
| objectivity | Information is objective and not affected by the source’s opinions or biases. |
| relevancy | Information is relevant for the topic. |
| value | Information is valuable, provides new insights, benefits. |
| currentness | Information is as recent as possible. |
| completeness | Information is complete and not missing important details. |
| volume | Multiple sources provide similar information. |
| understandability | Information is easy to understand. |
| privacy (access security) | Information source’s privacy is protected i.e., personal information of a citizen is protected. |
| traceability | Information origin can be traced to a user, time and location. |
Table 3.
RapidMiner queries for each characteristic.
| # | Characteristic | (Data Mining) Technique |
|---|---|---|
| 1 | Syntactic accuracy | Compare values to the expected input and format. Based on the most changing attribute. |
| 2 | Semantic accuracy | Compare values if they are semantically correct based on what is expected. |
| 3 | Completeness | Compare missing values to the total amount of values |
| 4 | Credibility | User reputation if available. |
| 5 | Objectivity | Count how many entities from different sources/content providers have the same information and how many are only from singular content providers/sources. |
| 6 | Volume | Count how many entities from different content providers have relatable information based on selected attributes. Unlike objectivity, the information does not have to be the same, but there must be some similarities, such as location. |
| 7 | Currentness | Given date is later than 31 December 2010. |
| 8 | Privacy | Filter out content providers whose possible real names are given and compare them to the total amount (text mining). |
| 9 | Relevancy | Data comparison to given relevance factor such as the topic. By default, everything is relevant. |
| 10 | Usability | If the content is missing essential attributes (location or time), it is deemed unusable. |
| 11 | Value | Calculation based on other characteristics, (Syntactic + Semantic + Credibility + Relevancy + Usability + Understandability)/6. |
| 12 | Traceability | Count how many entities have a valid time, location, and content provider/source compared to all entities. |
| 13 | Understandability | Text mining of invalid words in specific attributes. |
Table 4.
RapidMiner query results.
| Characteristic | ALA | iNaturalist | Globe at Night | Budburst |
|---|---|---|---|---|
| Syntactic accuracy | 0.71 | 0.89 | 1.00 | 0.99 |
| Semantic accuracy | 0.80 | 0.90 | 1.00 | 1.00 |
| Completeness | 0.71 | 0.73 | 0.87 | 0.33 |
| Credibility | NA | NA | NA | NA |
| Objectivity | 0.29 | 0.56 | NA | NA |
| Volume | 0.70 | 0.73 | NA | NA |
| Currentness | 0.44 | 0.99 | 1.00 | 0.80 |
| Privacy | 0.80 | 0.98 | 1.00 | 1.00 |
| Relevancy | 1.00 | 1.00 | 1.00 | 1.00 |
| Usability | 0.96 | 0.83 | 1.00 | 0.87 |
| Value | 0.74 | 0.72 | 0.78 | 0.79 |
| Traceability | 0.91 | 0.90 | 0.86 | 0.70 |
| Understandability | 0.97 | 0.69 | 0.65 | 0.86 |
Table 5.
WalkingPaths compared to other citizen science platforms.
| Characteristic | WalkingPaths 108 Observations | ALA 14,138 Observations | iNaturalist 39,910 Observations | Globe at Night 29,507 Observations | BudBurst 96,815 Observations |
|---|---|---|---|---|---|
| Syntactic accuracy | 1.00 | 0.71 | 0.89 | 1.00 | 0.99 |
| Semantic accuracy | 0.96 | 0.80 | 0.90 | 1.00 | 1.00 |
| Completeness | 1.00 | 0.71 | 0.73 | 0.87 | 0.33 |
| Credibility | 0.74 | NA | NA | NA | NA |
| Objectivity | 0.54 | 0.29 | 0.56 | NA | NA |
| Volume | 0.36 | 0.70 | 0.73 | NA | NA |
| Currentness | 1.00 | 0.44 | 0.99 | 1.00 | 0.80 |
| Privacy | 1.00 | 0.80 | 0.98 | 1.00 | 1.00 |
| Relevancy | 1.00 | 1.00 | 1.00 | 1.00 | 1.00 |
| Usability | 1.00 | 0.96 | 0.83 | 1.00 | 0.87 |
| Value | 0.95 | 0.74 | 0.72 | 0.78 | 0.79 |
| Traceability | 1.00 | 0.91 | 0.90 | 0.86 | 0.70 |
| Understandability | 1.00 | 0.97 | 0.69 | 0.65 | 0.86 |
Publisher’s Note: MDPI stays neutral with regard to jurisdictional claims in published maps and institutional affiliations. |
© 2021 by the authors. Licensee MDPI, Basel, Switzerland. This article is an open access article distributed under the terms and conditions of the Creative Commons Attribution (CC BY) license (https://creativecommons.org/licenses/by/4.0/).
Share and Cite
MDPI and ACS Style
Musto, J.; Dahanayake, A. An Approach to Improve the Quality of User-Generated Content of Citizen Science Platforms. ISPRS Int. J. Geo-Inf. 2021, 10, 434. https://0-doi-org.brum.beds.ac.uk/10.3390/ijgi10070434
AMA Style
Musto J, Dahanayake A. An Approach to Improve the Quality of User-Generated Content of Citizen Science Platforms. ISPRS International Journal of Geo-Information. 2021; 10(7):434. https://0-doi-org.brum.beds.ac.uk/10.3390/ijgi10070434
Chicago/Turabian StyleMusto, Jiri, and Ajantha Dahanayake. 2021. "An Approach to Improve the Quality of User-Generated Content of Citizen Science Platforms" ISPRS International Journal of Geo-Information 10, no. 7: 434. https://0-doi-org.brum.beds.ac.uk/10.3390/ijgi10070434
Note that from the first issue of 2016, this journal uses article numbers instead of page numbers. See further details here.