Article

Assessing Earthquake Impacts and Monitoring Resilience of Historic Areas: Methods for GIS Tools

1
Laboratory for the Analysis and Protection of Critical Infrastructures, Casaccia Research Centre, ENEA, National Agency for New Technologies Energy and Sustainable Economic Development, Via Anguillarese, 301, 00123 Rome, Italy
2
Department of Computer Science and Engineering, Bologna University, Mura Anteo Zamboni, 7, 40126 Bologna, Italy
3
Cultural Heritage Lab., INGV, National Institute of Geophysics and Volcanology, Remote Sensing Unit–ONT, Via P. Bucci-Cube 30/C-7th Floor, 87036 Rende, Italy
4
IAIS, Fraunhofer Institute for Intelligent Analysis and Information Systems, Schloss Birlinghoven, 53757 Sankt Augustin, Germany
*
Author to whom correspondence should be addressed.
ISPRS Int. J. Geo-Inf. 2021, 10(7), 461; https://0-doi-org.brum.beds.ac.uk/10.3390/ijgi10070461
Submission received: 13 April 2021 / Revised: 11 June 2021 / Accepted: 24 June 2021 / Published: 6 July 2021
(This article belongs to the Special Issue Geomatics and Geo-Information in Earthquake Studies)

Abstract

:
Historic areas (HAs) are highly vulnerable to natural hazards, including earthquakes, that can cause severe damage, if not total destruction. This paper proposes methods that can be implemented through a geographical information system to assess earthquake-induced physical damages and the resulting impacts on the functions of HAs and to monitor their resilience. For the assessment of damages, making reference to the universally recognised procedure of convoluting hazard, exposure, and vulnerability, this paper proposes (a) a framework for assessing hazard maps of both real and end-user defined earthquakes; (b) a classification of the exposed elements of the built environment; and (c) an index-based seismic vulnerability assessment method for heritage buildings. Moving towards the continuous monitoring of resilience, an index-based assessment method is proposed to quantify how the functions of HAs recover over time. The implementation of the proposed methods in an ad hoc customized WebGIS Decision Support System, referred to as ARCH DSS, is demonstrated in this paper with reference to the historic area of Camerino-San Severino (Italy). Our conclusions show how ARCH DSS can inform and contribute to increasing awareness of the vulnerabilities of HAs and of the severity of the potential impacts, thus supporting effective decision making on mitigation strategies, post-disaster response, and build back better.

1. Introduction

Historic towns, old urban quarters, villages, and hamlets as well as historic landscapes, referred to hereafter as historic areas (HAs), play a primary role in community life and well-being; they are part of the social fabric, the places we live in, and represent our cultural link with the past, which must be preserved and transmitted to future generations. HAs hold unique and diverse, tangible and intangible cultural heritage that awakens curiosity, stimulates creativity, and shapes the identity and thinking of local communities and visitors [1]. HAs also play a significant role in promoting economic development and the strengthening of social capital as well as cultural diversity [2]. Acknowledging that, the 2030 Agenda for Sustainable Development recommends to strengthening efforts to protect and safeguard the world’s cultural and natural heritage, [3] and the Sendai Framework for Disaster Risk Reduction 2015–2030 states the imperative need to incorporate cultural heritage in disaster resilience [4].
Recent earthquakes in Italy, Turkey, and Greece (e.g., Umbria-Marche 1997, Izmit and Duzce 1999, the central Italy sequence of 2016–2017, and Kos 2017, just to mention few of them) caused the loss of invaluable HAs, pointing to the increasing need for mitigation actions specifically targeted at preserving cultural heritage and cultural landscapes from natural disasters [5]. Targeted measures are not sufficient unless they are coordinated into common disaster risk reduction actions and policies that are capable of harmonizing the contributions of scientists working in different disciplines, policymakers, and a wide spectrum of groups, e.g., professional groups, public bodies, NGOs, and community groups. The need for a holistic and participatory approach also applies to the post-disaster recovery and reconstruction of HAs, as the lack of interdisciplinary approaches might lead to severe consequences; as an example, post-disaster recovery and reconstruction after the Calabria (1783), Irpinia (1980), and Belice (1986) earthquakes in Italy ignored the history, memory, and identity of these places and resulted in the definitive abandonment of several villages [5].
Geographical information systems (GIS) can be used to inform and support the complex and interdisciplinary decision-making processes required for the resilience enhancement of HAs by providing an environment where knowledge and information can be shared and accessed easily, thus enabling interactions among different groups and facilitating interdisciplinary approaches.
This paper presents methods that can be implemented in GIS-based environments to assess earthquake-induced impacts on HAs and to monitor and compare the resilience achieved through mitigation strategies in the pre-disaster phase (i.e., in business-as-usual conditions) or through response and reconstruction strategies in post-disaster circumstances. Furthermore, this paper showcases the implementation of the proposed methods in a WebGIS decision support system (DSS), “Critical Infrastructure Protection Forecasting—Earthquake Simulator” (CIPCast-ES), which was originally conceived for the protection of distributed critical infrastructures and has been newly customized for HAs. The use of a WebGIS decision support system for the analysis of HAs, referred to hereafter as ARCH DSS, has been defined within the framework of the Horizon 2020 funded research project known as “Advancing Resilience of Historic Areas Against Climate-related and Other Hazards” (ARCH) (https://savingculturalheritage.eu/, accessed on 12 May 2021). Some of the functions of ARCH DSS are demonstrated in this paper through examining the historic area of the town of Camerino-S.Severino (Italy). This town, among other HAs in central Italy, was struck by a severe seismic sequence during 2016–2017, the impacts of which continue to severely affect the well-being and economies of the local communities.
Towards the definition of the ARCH DSS software architecture and of the assessment methods therein implemented, reference has been made to internationally recognized GIS-based platforms for seismic risk assessment, e.g., the Global Earthquake Model (GEM) (https://www.globalquakemodel.org/gem, accessed on 12 May 2021); the HAZUS-MH platform used by the US Federal Emergency Management Agency (FEMA) [6]; the CAPRA Probabilistic Risk Assessment Platform (https://ecapra.org/, accessed on 12 May 2021), among several others [7,8,9,10,11,12,13,14,15,16]. However, none of the existing tools and platforms, to the authors’ knowledge, specifically target the HAs that are and should be regarded as complex social–ecological systems where institutional, social, cultural, physical, economic, environmental, and intangible dimensions exist and strongly interact. The research presented in this paper aims to contribute to the bridging of this gap in line with the recommendations of the Agenda 2030 [3] and of the Sendai Framework [4].
As far as the resilience monitoring of HAs is concerned, the authors have originally proposed an approach that, although being computationally simple, aims to be very effective in informing decision makers of the delays and bottlenecks that impede the functional recovery of services, organizations, and activities that are essential for the functioning and thriving of HAs, thus impeding their resilient recovery. The definition of the resilience monitoring approach proposed in this paper has been built on internationally recognized literature including the Hyogo Framework for Action 2005–2015 [17], the Resilience-based Earthquake Design (REDi) rating system [18], and the PEOPLES framework, which assesses the resilience of communities by accounting for seven dimensions, namely: population, environment, organized government services, physical infrastructures, lifestyle, economics, and social capital [19].
This paper is structured as follows: Section 2 presents the proposed materials and methods for earthquake impact assessment and resilience monitoring as implemented in the ARCH DSS. As previously mentioned, the same methods can be considered for implementation in other GIS-based tools in addition to ARCH DSS. After a brief introduction of essential terms and concepts and the necessary steps to conduct the analysis, details of the proposed methods are provided as follows: Section 2.1 presents the methods proposed for the assessment of earthquake-induced physical damage on the built environment of HAs as a function of hazards (Section 2.1.1), exposure (Section 2.1.2), and the seismic vulnerability of the exposed asset (Section 2.1.3); Section 2.2 presents methods to estimate the functional, social, and economic impacts on HAs induced by the physical damage caused by an earthquake; Section 2.3 presents methods to monitor the recovery of the essential functionalities of HAs, i.e., methods to monitor Has’ post-disaster resilience. Section 3 presents the obtained results and in particular, Section 3.1 describes how the software architecture of ARCH DSS has been customized to allow for the damage, impact assessment and resilience monitoring of HAs. Section 3.2 describes the implementation of ARCH DSS in the historic area of Camerino-S.Severino to showcase some of its functionalities and the potential of the tool. Potential future research is discussed in the concluding section, Section 4.

2. Materials and Methods

HAs are considered both in the ARCH project and in this paper as complex and interconnected systems. HAs are defined as a social–ecological systems that include institutional, social, cultural, physical, economic, environmental, and intangible dimensions (Figure 1). This concept is perfectly in line with and expands the historic urban landscape (HUL) concept and approach defined by UNESCO in 2011 [1], which shifts the emphasis from the sole conservation of monumental architecture to the holistic conservation and development of HAs. The HUL concept aims to preserve the quality of the human environment by enhancing the productive and sustainable use of urban spaces, promoting social and functional diversity, and increasing the economic development of HAs. To the UNESCO HUL concept and approach, ARCH adds the awareness that climate change and other natural hazards can severely affect the holistic conservation and development of HAs and therefore, it is imperative to provide methods and tools for the assessment of their potential impacts to inform and promote resilience strategies, the effectiveness of which should be monitored (Figure 1).
The resilience of HAs is defined by the ARCH project as “the sustained ability of a historic area as a social-ecological system to cope with hazardous events by responding and adapting in ways that maintain the historic area’s functions and heritage significance, including: Identity, Integrity, Authenticity”. To support this view on resilience, the ARCH DSS was conceived as an integrated evaluation tool that allows for the monitoring of the resilience of HAs, and the informing and enhancing of awareness of the possible damages and impacts that may be induced by hazardous events, including earthquakes.
Towards that, methods have been implemented in ARCH DSS to:
  • (Section 2.1) Assess earthquake-induced physical damages to the built environment of HAs;
  • (Section 2.2) Assess the resulting impacts on an HA functions;
  • (Section 2.3) Monitor the recovery of an HA essential functions over time and assess and compare the resilience achieved.

2.1. Assessing Earthquake-Induced Physical Damage on the Built Environment of Historic Areas

The estimation of seismic-induced physical damages to the built environment is the first step towards the assessment of the induced impacts on HAs and for the resilience monitoring. Earthquake-induced damages can be estimated by convoluting the assessment of the hazards that might potentially affect a location, the exposed elements in the affected location, and the vulnerabilities of the exposed elements to each specific hazard.
This concept can be summarized in the following equation, Equation (1):
Damage ≈ Hazard * Exposure * Vulnerability
To assess the earthquake induced physical damage to the built environment of HAs, we propose the use of the so-called macroseismic-mechanical cross-calibrated method [20,21] that allows the assessment of damages for different sets of buildings, from groups of buildings (statistically aggregated in a geographical unit) to single buildings.
Several methods for the seismic vulnerability and risk assessment of both residential and monumental buildings, including methods specific to HAs where buildings are usually organized in an aggregated context, exist e.g., [22,23,24,25,26,27,28], just to provide some examples. The aforementioned methods are different both in their nature (e.g., observed-based; expert-based; mechanical-based; or a combination of the previous ones) and in the level of data and details needed to characterise and assess the vulnerability and risk of the specific building/set of buildings under analysis.
Reference has been made in this work to [20,21] being a method that can be implemented, starting from a simple typological classification of the exposed asset under analysis obtained with very basic data and being a method whose reliability can be improved when more data on the building and/or evidence on the seismic performance of similar typologies become available. In fact, the proposed method can be defined as a mixed observed-based/expert-based approach; the values proposed for the vulnerability indexes V and Q have been derived from observed damage data when available or from expert judgement otherwise. Provided the availability of data on observed damage, it is possible to calibrate and tune the proposed V and Q indexes as deemed appropriate.
Equation (2), proposed by [20,21], has been therefore implemented in the ARCH DSS for the assessment of earthquake-induced physical damage in the built environment:
μ D = 2.5 [ 1 + t a n h ( I E M S 98 + α V β Q ) ]
where μD is the expected mean degree of damage for single buildings or set of aggregated buildings; the seismic hazard is represented using the macroseismic intensity IEMS-98, according to the European Macroseismic Scale EMS-98 [29]; the seismic vulnerability of single or sets of aggregated buildings and structures is assessed in terms of the vulnerability V and ductility Q indexes; α and β are coefficients. Values of the coefficients α and β can be assumed as α = 6.25, β = 13.1; these values resulted by deriving Equation (2) from the damage probability matrices implicitly defined by EMS-98 [29] using a combined probabilistic and fuzzy-logic approach [20,21]. Some authors, i.e., [30,31], suggest to use β = 12.7 in lieu of β = 13.1 after repeating the derivation of Equation (2) under modified assumptions than the ones at the base of the original derivation of the macroseismic vulnerability curves [20,21]. A critical discussion on the resulting differences (that are indeed minor) while using β = 12.7 in lieu of β = 13.1 in Equation (2) is out of the scope of this paper and can be the subject of future research.
The level of damage to each building or group of buildings can be allocated on the basis of the resulting μD according to the EMS-98 physical damage scale [29], which considers five damage levels, i.e., D1, D2, D3, D4, D5, plus the absence of damage, D0, enabling the qualitative description of the earthquake-induced physical damage to the structural and non-structural components of buildings (Table 1 and Figure 2).
In the following sub-sections, methods for the assessment damage as a function of hazards, exposure, and vulnerability as for Equation (1) are presented, and are specifically expressed in terms of the variables needed in Equation (2), namely: hazard assessment in terms of IEMS-98 (Section 2.1.1); identification and characterization of the exposed elements within HAs (Section 2.1.2); and seismic vulnerability assessment of the exposed elements (Section 2.1.3) in terms of the V and Q indexes.

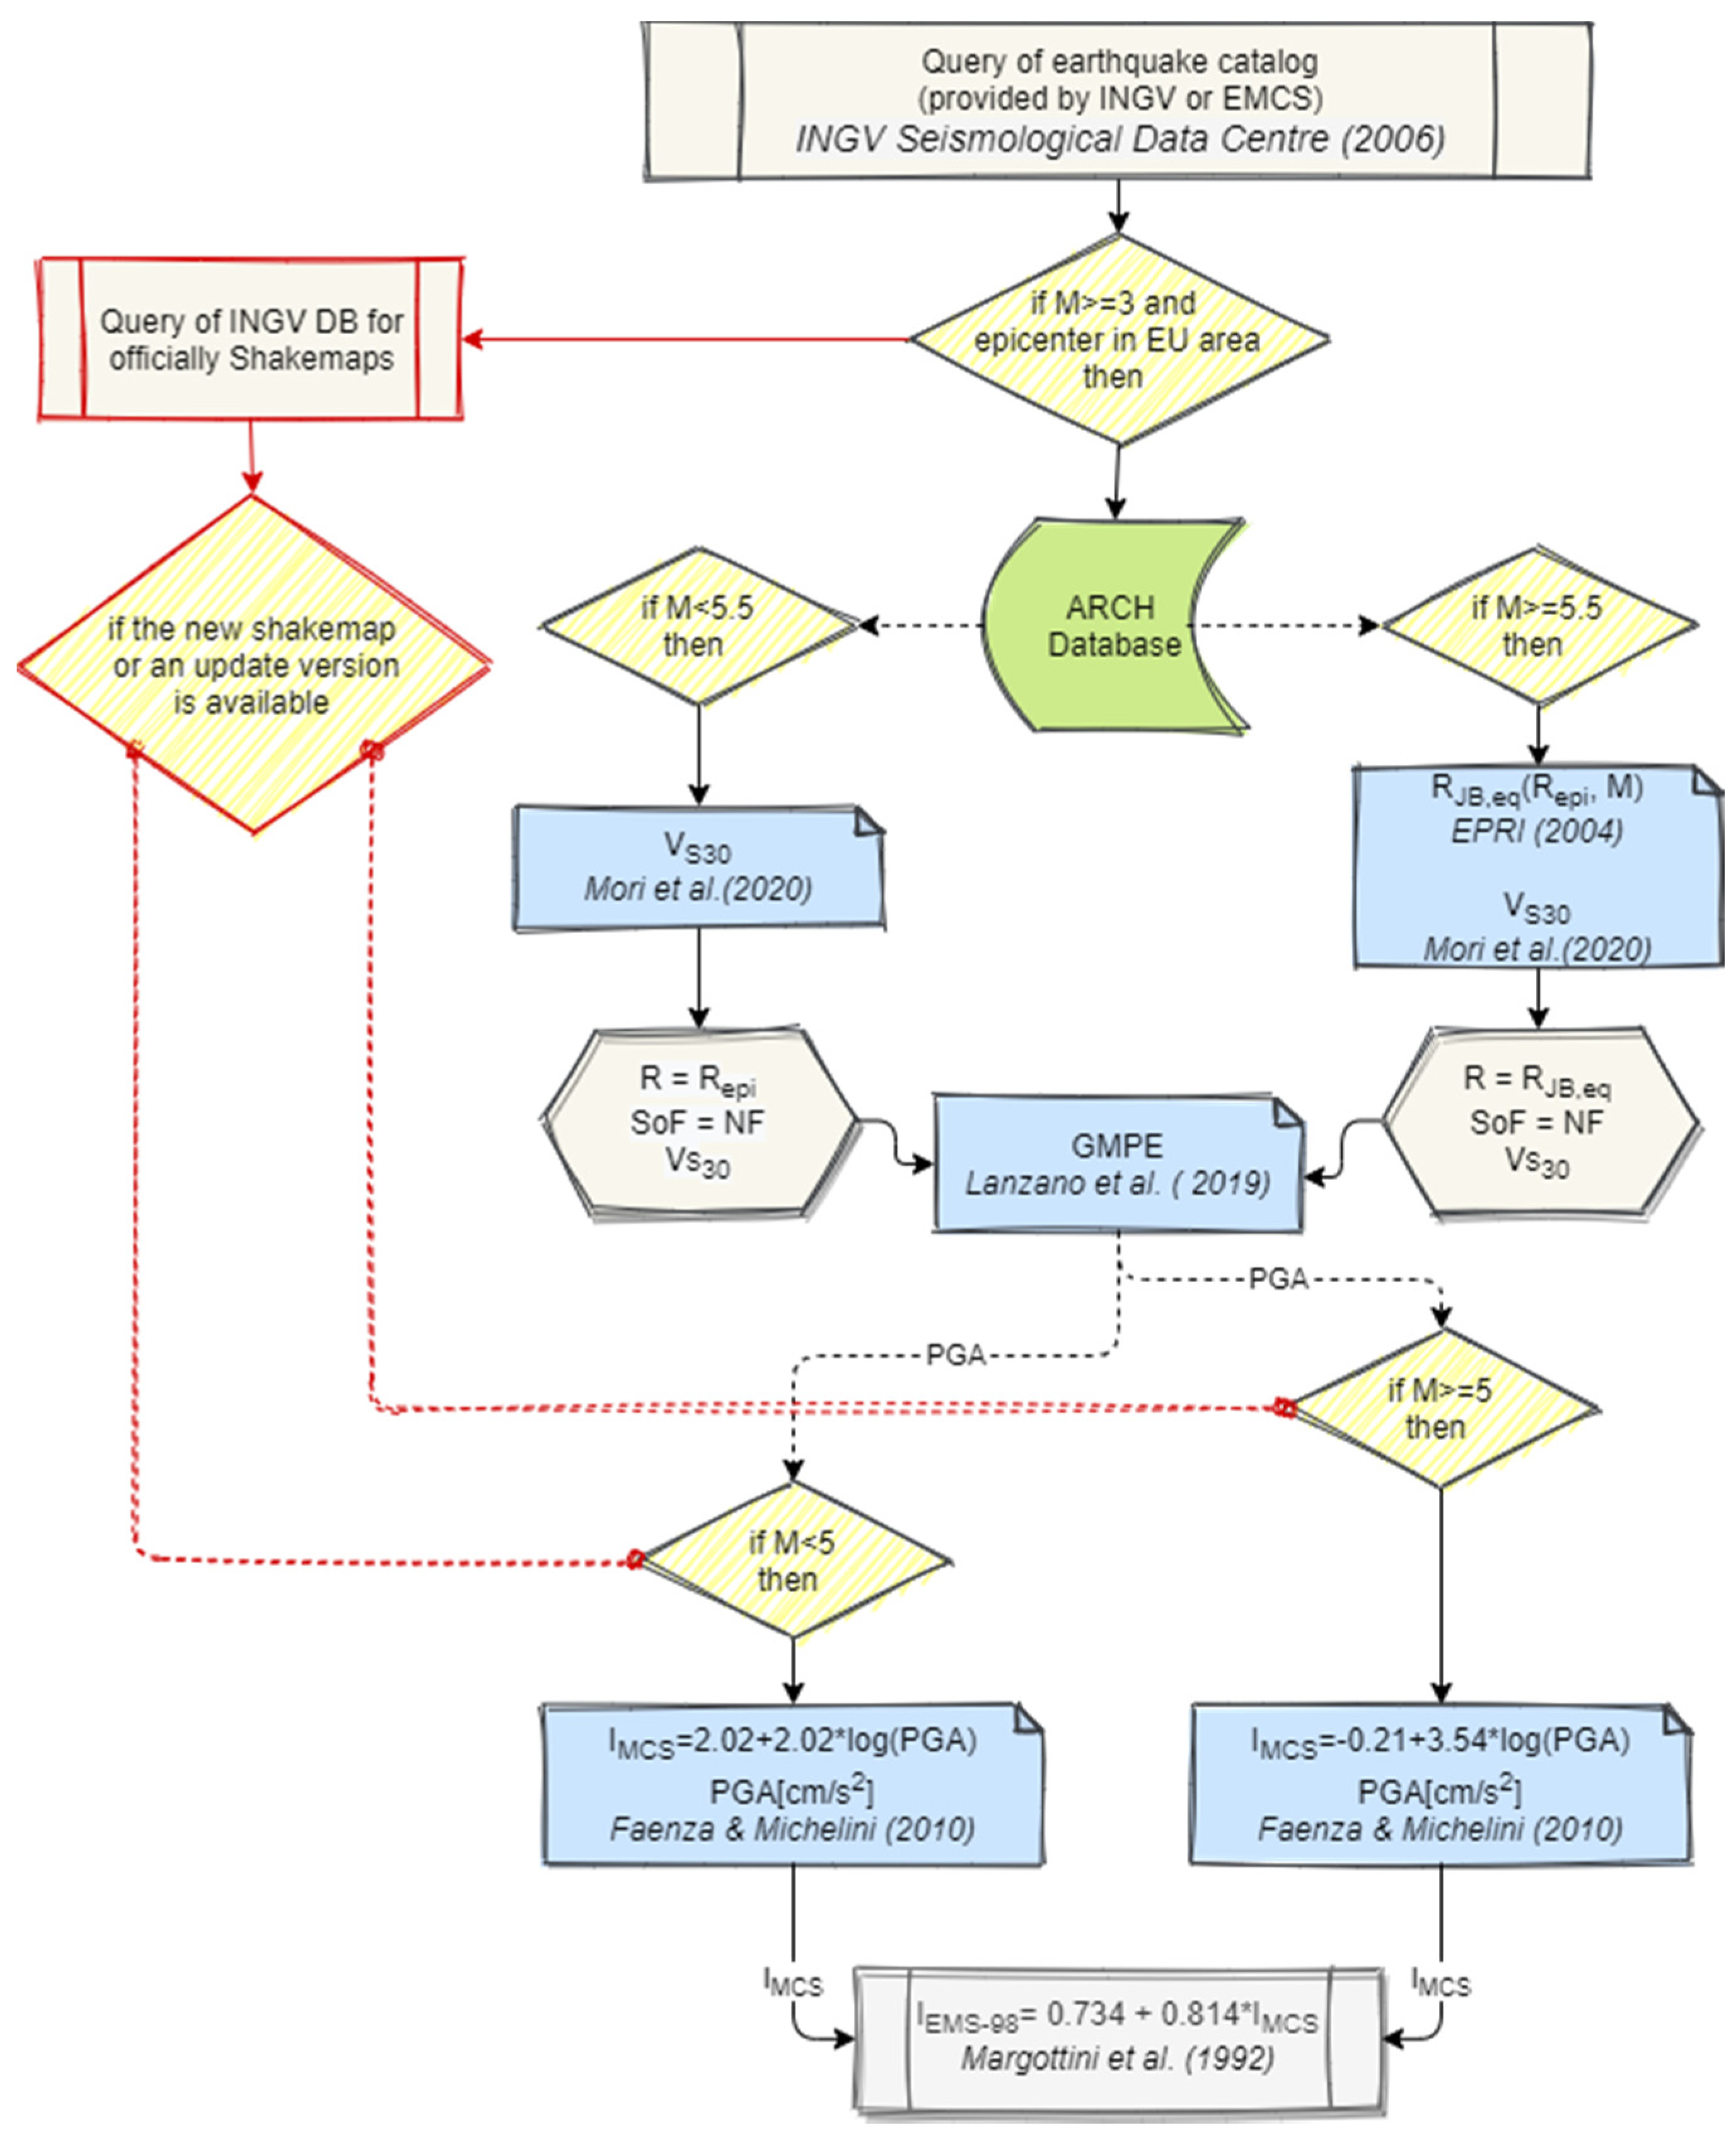
2.1.1. Assessing and Representing Seismic Hazard

The hazard component of the ARCH DSS aims to provide an estimation of the expected ground motion, using either a deterministic or a probabilistic approach (or a combination of the two). Ground motion is the movement of the earth’s surface produced by the waves that are generated by earthquakes (due to sudden slip or rupture on a fault) or explosions (due to sudden pressure at the explosive source) travelling through the earth and along its surface, and can be also amplified by particular soil or morphology conditions of the territory (Figure 3).
Deterministic approaches allow for the estimation of the expected ground motion and its related consequences for any selected seismic event under analysis. On the other hand, probabilistic approaches allow for the estimation of the probability of occurrence of a certain ground motion and the relative consequences in a certain time frame due to all of the possible seismogenic sources that might generate an earthquake in the HA. The selection of either the probabilistic approach, or the deterministic approach, or both of them depends on the goal of the individual study [6,7,8,9,10,11,12,13,14,15,16]. In the ARCH project reference is made to a deterministic approach since the goal is to assess damage and impact scenarios that can support an aware and informed decision making process. A deterministic model able to represent the geographical and physical extent of the ground motion produced by an earthquake has been therefore fine-tuned; Figure 4 represents the workflow used in the ARCH DSS to generate deterministic ground motion maps for both real and user-defined events. The workflow can be summarized in three basic steps:
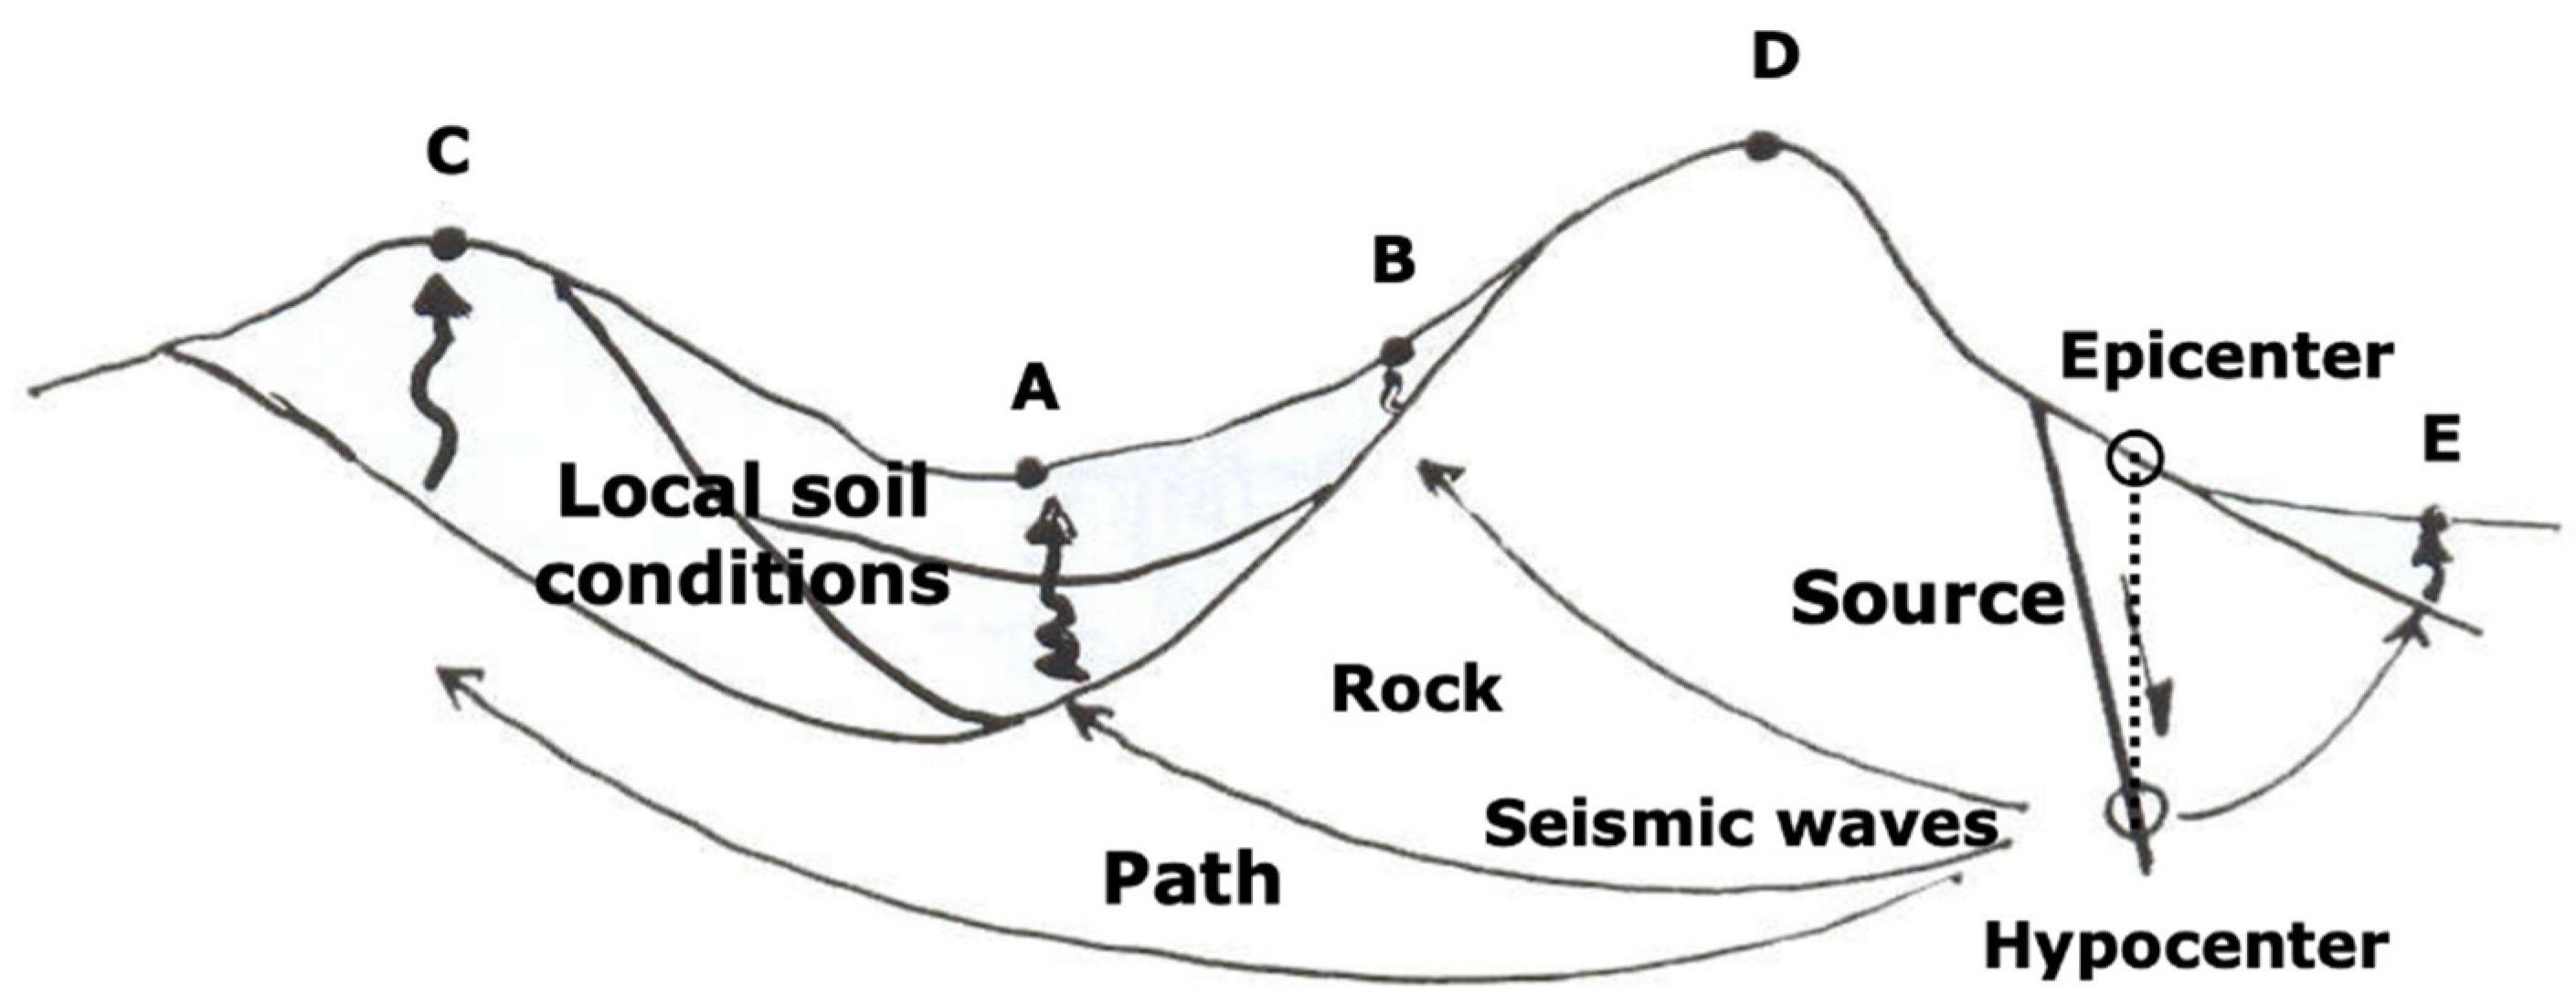
  • Characterization of the specific earthquake event under analysis: i.e., hypocenter location and characteristics of the seismogenic source (i.e., location and characteristics of faults or fault systems) that has generated the earthquake (for a historic event) or that might generate the earthquake (for user-defined scenarios): the magnitude of the energy that has been released (for a real event) or that can potentially be released (for user-defined events);
  • Characterization of specific local site conditions that might lead to amplification, i.e., to an increase in the size of the ground motion;
  • Selection and implementation of a Ground Motion Prediction Equation (GMPE), i.e., attenuation relations, describing how the earthquake ground motion decreases as the distance between the earthquake source and the site under analysis increases while accounting for possible amplification due to the ground propagation properties (point 2, above).
As for Step (1), i.e., the characterization of the specific earthquake event under analysis, in case of the occurrence of a real event, data are automatically collected and collated by the ARCH DSS. A web-service, developed through ObsPy toolbox [32,33], receives the measured characteristics of the earthquakes in near real-time; characteristics of seismic events with a magnitude greater than 3 and an epicenter located within (or close to) European countries are then stored in the ARCH DSS geodatabase. To this end, the system continuously polls the earthquake catalogues managed by the European Mediterranean Seismological Centre (EMSC) [34] and by the National Institute of Geophysics and Volcanology (INGV) [35] to obtain information according to the International Federation of Digital Seismograph Networks (FDSN) standard protocols [36].
For user-defined seismic event scenarios, the ARCH DSS provides end-users with several geo-datasets (Figure 4) to support them in appropriately selecting the characteristics of the simulated earthquake (e.g., the maximum historical event from a pertinent seismogenic source or the maximum earthquake compatible with the known tectonic framework, etc.). These datasets, relating to both Italian and European territories, include representations of historic earthquakes [37,38,39], known seismogenic sources [40,41], and probabilistic seismic hazard maps used as a reference in seismic design codes [42,43,44].
As far as the characterization of the specific geological and geomorphological conditions of the territory under analysis is concerned (Step 2), geodatabases reporting the results of seismic microzoning studies [45] that provide spatial information about local effects related to geological and geotechnical conditions on ground motion (e.g., [46,47]) and hydrogeological hazards (landslides and floods) [48] are embedded in the ARCH DSS geodatabase. In particular, two different VS30 maps (i.e. maps representing the average shear-wave velocity in the uppermost 30 m) are included: worldwide topographic slopes [49,50] that are also reported as a regional detail in the world map published by the US Geological Survey (USGS) [51] and the seismic soil classification of Italy obtained by terrain geomorphological classification integrated with a large amount of data obtained using a seismic microzoning dataset [52].
Step (3) requires the selection of a GMPE used in seismic hazard analysis to evaluate the expected level of ground shaking at any given site for the earthquake event defined in Step (1). The ground shaking can be described in terms of the level of acceleration, velocity, and displacement of the earth’s surface induced by the earthquake waves. Conventionally used shaking intensity measures (IMs) include, among others, peak ground acceleration (PGA); peak ground velocity (PGV); peak ground displacement (PGD); pseudo-spectral accelerations (PSAs); pseudo-spectral velocities (PSVs); and pseudo-spectral displacements (PSDs). The values of these IMs are generally provided as median values by GMPEs, with their associated uncertainty being due to both inherent randomness, referred to as aleatory variability, and epistemic uncertainty from of a lack of knowledge.
Figure 4. Workflow of ARCH DSS hazard assessment module: assessment of deterministic ground shaking maps in peak ground acceleration (PGA) using GMPE by [53] and PGA to IMCS and IEMS98 conversion [54].
Ijgi 10 00461 g004
The calculation of ground shaking maps in terms of different IMs, via GMPEs, depend on different characteristics and parameters (Figure 4 and Equation (3)) including moment magnitude, (Mw); style of faulting (SoF), i.e., main focal mechanism—normal fault, thrust, or strike-slip; distance from the site under analysis to the seismic source R that can be represented by point-source distance metrics such as hypocentral distance and epicentral distance or the rupture distance, i.e., the closest distance to an extended rupture of plane fault (RRup), or Joyner–Boore distance (RJB), i.e., the closest distance to the surface projection of an extended fault [55]; a simplified term representative of the site effects on the amplification of the ground motion (A), e.g., the average shear-wave velocity in the uppermost 30 m (VS30), among others.
IMs = f(Mw, SoF, R, A)
In the current version of the ARCH DSS, the most recent GMPEs for the Italian territory have been implemented, namely [53,56] among others.
Once ground motion maps are assessed in terms of the shaking intensity measure, IMS such as PSAs and PGAs, conversion equations are implemented in the ARCH DSS to obtain Macroseismic Intensity (I) maps. In particular, the relationship proposed by [54] allows us to obtain the Macroseismic Intensity estimation with regard to Mercalli Cancani Siberg Macroseismic Intensity scale IMCS [57]. A further correlation [58] is applied to convert IMCS to intensities measured according to the European Macroseismic Scale IEMS-98 [29], which is the official Macroseismic Intensity scale adopted in Europe and is the hazard input required in Equation (2).

2.1.2. Classifying the Exposure in the Built Environment

The exposure assessment deals with the characterizations (e.g., identification of type/category), quantifications (e.g., number of surface occupied, number of users, etc.), and geolocation of the items exposed to a certain hazard. Critical elements of the built environment of HAs exposed to the seismic hazard include, among others, cultural heritage buildings, their content and the intangible values of culture that they represent.
The concept of cultural heritage (CH) has varied considerably over time, with the current definition including both tangible and intangible dimensions. The ARCH project adopts the classification proposed by UNESCO [59] that was later revised by the ICOMOS Climate Change and Cultural Heritage Working Group in 2019 [60], where CH elements are classified according to six main categories: (1) moveable heritage, (2) archaeological sites, (3) buildings and structures, (4) cultural landscapes, (5) associated and traditional communities, and (6) intangible heritage.
Building on the above proposed categories [59,60], as well as on further ones sourced from key references [61,62], the ARCH classification proposed for CH items is provided in Table 2, where for each category, different types and examples are presented. For the CH type “Architecture (historic and monumental buildings” under the category “Buildings and structures”, further examples are provided in Table 3 by both sourcing and combining examples from [61,62,63].

2.1.3. Assessing the Seismic Vulnerability of Cultural Heritage Buildings

The ARCH DSS assesses the seismic vulnerability of CH items within an HA according to the so-called Macroseismic-Mechanical cross-calibrated Method [20,21], which allows for the seismic vulnerability assessment of different sets of buildings, from group of buildings, statistically aggregated in a geographical unit, to single buildings. According to [20,21], the seismic vulnerability of single buildings or group of buildings is measured in terms of both a vulnerability index V and a ductility index Q. As far as single buildings are concerned, the vulnerability index V is attributed by considering how different building types (e.g., masonry buildings, reinforced concrete building, or timber) might have a different seismic performance and how further constructive or geometric peculiarities of the buildings (such as the state of maintenance, plane, and vertical regularity the presence of specific constructive, such features like tie-roads) might modify it. The ductility index Q accounts for the rate of damage progression with the increase of the ground shaking intensity. The background methodology and the operational steps for its implementation on residential and ordinary buildings can be found in [20,21].
The focus of this paper is on how to implement the approach for the CH category “Buildings and Structures” (Table 2). Examples of types of CH buildings and structures of the specific European architecture are listed in Table 3; buildings and structures recognized in each type can be considered to have a similar seismic vulnerability. Based on this assumption, values for the V and Q indexes can be attributed to each CH type identified in Table 3; these values have been deduced from observed damage data when available and applying an expert judgement procedure otherwise [59,60,61,62]. In particular, some of the V and Q indexes reported in Table 3 were already reported in [59,60,61,62] and already used for the evaluation of the seismic risk on UNESCO CH in Europe [63]. The V and Q indexes reported in italics in Table 3 (i.e., for columns, temples, triliths, canopies, chapels, stadiums, synagogues, storage tanks) are introduced in the present work.
It is worth highlighting that a vulnerability assessment based on a typological classification has to be regarded only as a starting point, as it does not take into account the distinctiveness of a single building and does not allow for the singling out of the most vulnerable building/structures within a type. To refine the vulnerability assessment, a quick survey is recommended aiming to collect, via a proper survey form, further relevant parameters, such as the state of maintenance, the quality of the constructive material (e.g., for stone, brick, mortar from both a chemical and mechanical point of view), the structural regularity (in plan and in elevation), the size and slenderness of relevant structural elements, the interaction with adjacent structures, the presence of retrofitting interventions, and/or of vernacular aseismic devices.
This concept is summarized in Equation (4), where the vulnerability index V is defined as the sum of the typological vulnerability index V0 attributed according to the building type (Table 3) plus the sum of the vulnerability index modifiers Vk attributed to each constructive, geometric, or conservation peculiarity of building (Table 4).
V = V 0 + Σ V k
To evaluate the vulnerability of buildings in an aggregate context, it is first necessary to clearly identify each single structural unit within the larger, aggregated context with the help of a GIS map representing the building aggregate plan and with the help of a front view of the building aggregate. For the vulnerability assessment, all Vk representing the peculiarities of the single building (upper part of Table 4) as well as those representing the aggregated context in which the building is inserted (lower part of Table 4) need to be calculated.
For some architecture types, such as churches and palaces, more complex indicator-based approaches can be implemented by filling out specific survey forms [65,66,67,68].
For the ARCH category Moveable Heritage (MH) (Table 2), the vulnerability assessment should consider whether the MH is anchored to a wall or a support (Adopted in ARCH from the STORM project, http://www.storm-project.eu/, accessed on 12 May 2021); in absence of a proper anchoring system, the MH item is very vulnerable to falls and breaks if subjected to seismic action. In the presence of an effective anchoring system, the same vulnerability of the building and therefore the same damage level can be attributed to the MH items. In the absence of an effective anchoring system, a higher vulnerability can be assumed and therefore, an increase in one damage-level can be assumed (e.g., if damage level D3 has been estimated for a building subjected to a certain earthquake, a damage level D4 can be assumed for the non-anchored MH items therein contained). If the information on the presence and effectiveness of such anchoring devices is not available, it is reasonable to assume the worst-case scenario, i.e., absence of the anchoring system. As far as the ARCH categories “Cultural Landscape” and “Archaeological resources” are concerned (Table 2), the vulnerability can be assessed as a function of the potentiality for seismic-induced geotechnical hazards (e.g., liquefaction, faulting, rock fall, and landslides). This topic will be the subject of a future report.

2.2. Assessing Resulting Impacts on Functions of Historic Areas

Once physical damages to the built environment of HAs are assessed, the potential impacts on the social and economic dimensions of the HAs can be assessed starting from the assessment of the “downtime” of the essential services/activities, i.e., the time during which services and activities that are considered essential for the functioning and thriving of HAs are out of action or unavailable for use. Further to the services that are usually considered essential for the functioning of urban areas (such as critical infrastructures, health systems, schools among others), the functionality of the services and activities that contribute to social cohesion and identity building as identified in Table 5 along with the local productive and commercial activities and craftsmanship activities considered essential for HAs.
Downtime can be roughly associated with the physical damage level Dk as proposed in Table 6, adapted from the U.S. Resiliency Council (USRC) Building Rating System. Table 6 also reports the correlation between the loss of building usability and downtime with the impact on the intangible heritage associated with the building itself.
Instead of the rough correspondence between Dk and downtime proposed in Table 6, downtime functions can be defined for monitoring the functional recovery of a building in a more precise way, depending on its particular function and occupancy, based on either available data, expert opinion, or both. In residential buildings, functional recovery is related to regaining occupant comfort and livable conditions—the lights are on, water flows, and heating and air conditioning are operating; [18] proposes very detailed downtime functions for residential buildings. For non-residential buildings, the functional recovery implies the resumption of the building’s specific functions (e.g., emergency services and typical services in hospitals, business activity in offices and retail, social-cohesion and identity building activities in HA buildings).
Based on the functional impact on the building and time required for its functional recovery, it is possible to estimate socio-economic impacts in terms of key performance indicators (KPIs). To this end, effective KPIs for monitoring socio-economic consequences due to the loss of functionality of HA buildings have been extracted from the 2030 Agenda goals, targets, and indicators (https://unstats.un.org/sdgs/indicators/indicators-list/, accessed on 12 May 2021) and from the Culture|2030 Indicators (https://whc.unesco.org/en/culture2030indicators/, accessed on 12 May 2021).
KPI for monitoring the impacts of the loss of functionality of HA buildings on social-cohesion and identity building activities have been included in the ARCH DSS, being adapted as proposed in Agenda|Culture 2030:
  • KPISCA, the ratio of citizens within the total local population engaged in social-cohesion activities (SCA);
  • KPIIBA, the ratio of citizens within the total local population engaged in identity building activities (IBA).
KPISCA and KPIIBA have to be estimated for each one of the items listed in Table 6 either in an aggregated or disaggregated way and have to be estimated during business-as-usual times (referred hereafter with the subscript t0), KPIt0, as a baseline reference measure to allow for impact assessment and recovery/resilience monitoring in post-disaster circumstances (as explained in Section 2.3).
KPI for monitoring the impacts on the local economy have been included in the ARCH DSS, being adapted as proposed in Agenda|Culture 2030:
  • KPICGDP, monitoring the Contribution of Cultural Gross Domestic Product (CGDP) from cultural activities or from the culture sector in general, Equation (5);
  • KPICEP, monitoring the Cultural Employment (CEP), i.e., the ratio of citizens engaged in cultural and creative employment occupations within the total employed population in a given site, Equation (6).
K P I CGDP = 1 n G V A C A   i s i c   G D P
where GVACA isic is the gross value added from cultural activities identified based on the International Standard Industrial Classification of Economic Activities (ISIC), and GDP is the gross domestic product in a given country or in the HA.
K P I C E P = 1 n C E C A   i s c o   E P
where CECA isco is the total number of the persons employed in cultural occupations identified based on the International Standard Classification of Occupations (ISCO) (https://www.ilo.org/public/english/bureau/stat/isco/ accessed on 5 July 2021) and EP is the total number of the employed population.

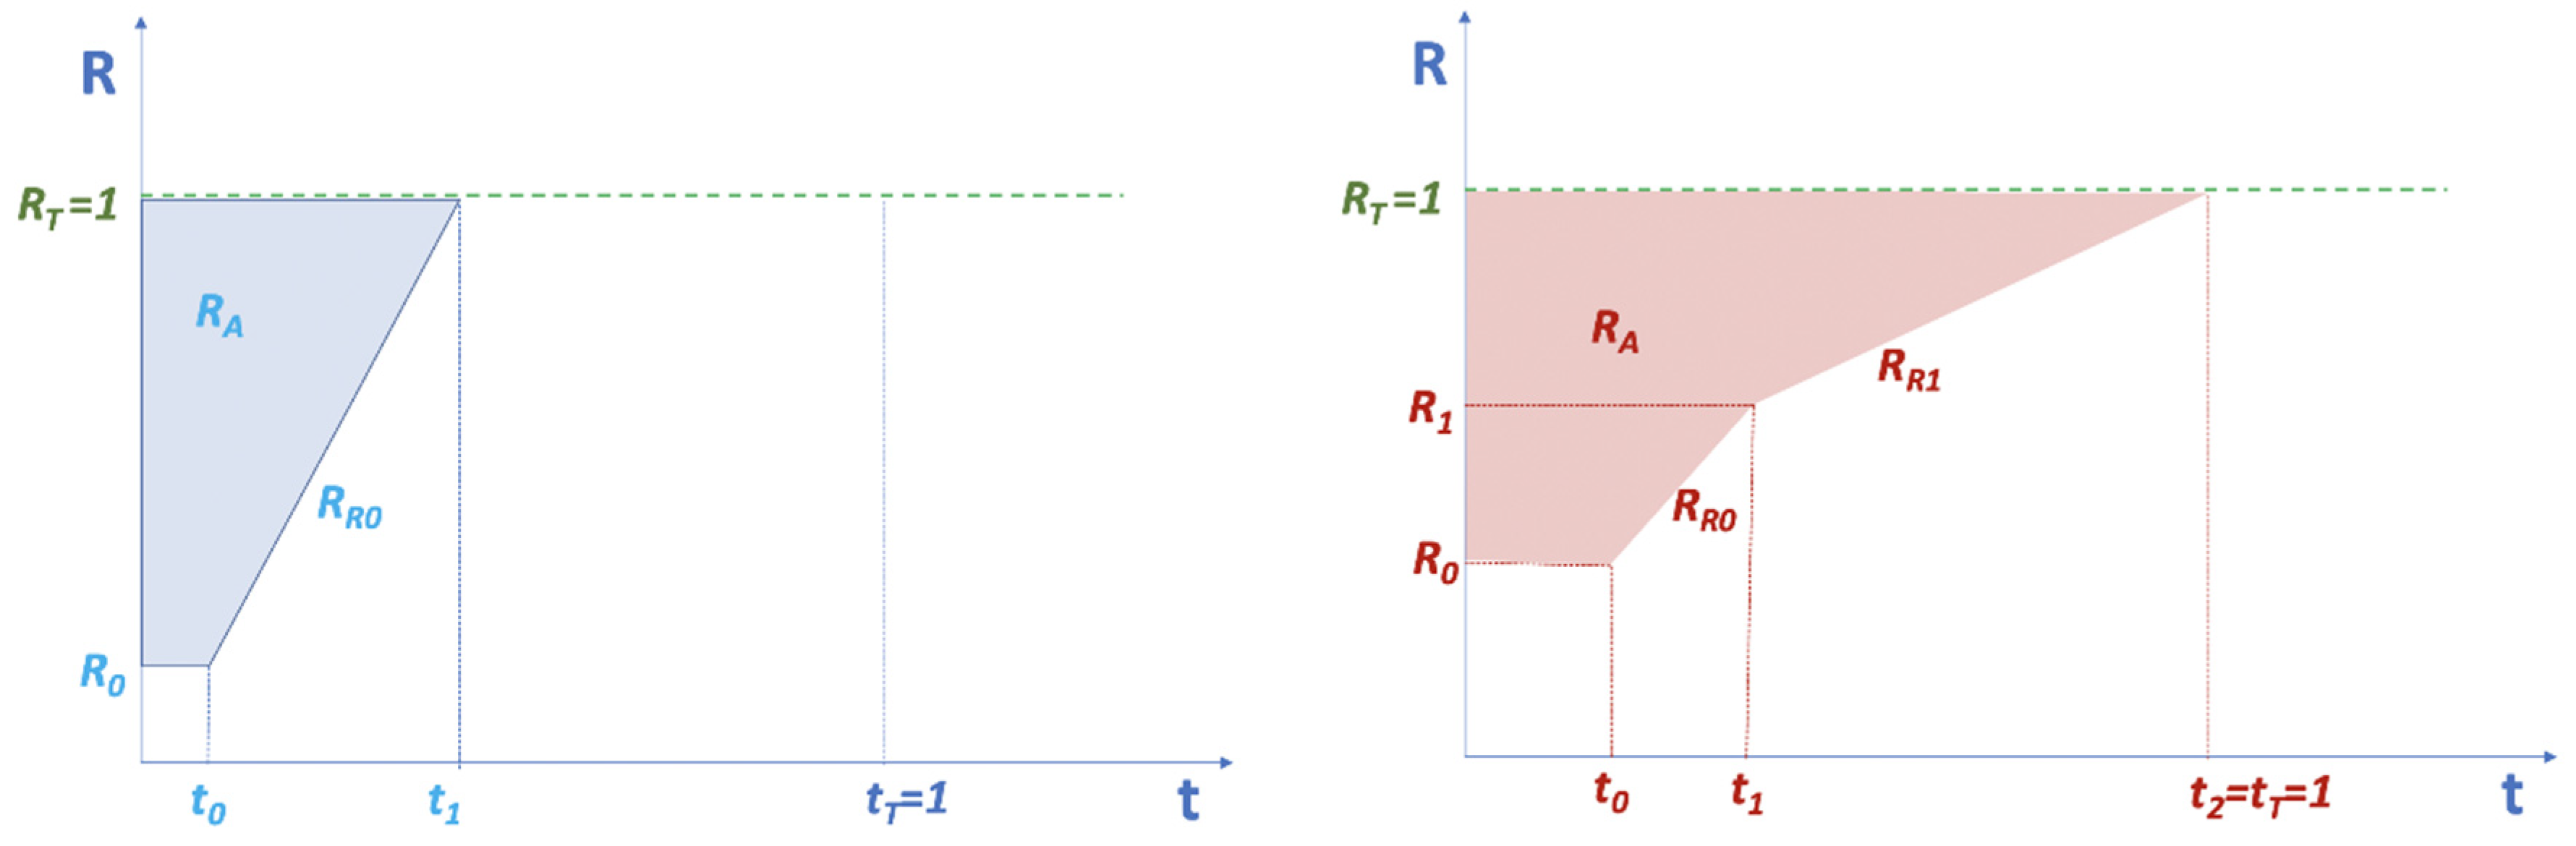
2.3. Monitoring Resilience of Historic Areas

Once relevant KPIs are identified and assessed, it is possible to monitor the resilience of the HA system for each specific KPI. In the international literature [19,64,69,70], resilience is essentially measured as the total functionality lost over time, and the functionality is defined as a piecewise function that captures the reduction in system performance from 0% (total loss of system functionality) to 100% (no reduction in system functionality). The work of [71] introduces the idea of using function-based metrics to measure resilience. Valuable frameworks and approaches for assessing and monitoring the seismic resilience of cities and local communities are available in the literature, e.g., [72,73,74,75,76,77,78,79], among others. Building on the international literature, the present work originally proposes different resilience metrics, Equation (7), to be assessed either as individual metrics or as a combined metric, aiming to quantifying the effectiveness of recovery, response, and built-back-better interventions in HAs after an earthquake event.
R = f ( R O ,   R R i , R A )
where:
  • RO is the resilience origin, i.e., the starting point after the crises event, providing a measure of the extent of the KPI loss to be recovered, Equation (8);
  • RRi is the resilience rate, providing a measure of the effectiveness of each i stepwise intervention, Equation (9);
  • RA is the resilience area, providing the overall quantification of the effectiveness of the interventions to the recovery of the KPI over time, Equation (11).
From the aforementioned resilience metrics, a combined R metric can be assessed, either as a mean value of RO, RRi, and RA, as the minimum or maximum value among them, or by combining them as deemed more appropriate (e.g., normalized sum, weighted normalized sum, etc.).
The RO, resilience origin, Equation (8), is assessed as a function of the value assumed by the monitored KPI after the earthquake (or other crises events), in comparison to the baseline value, KPIt0, assessed pre-event during business-as-usual time. The target KPIT can be either assumed equal to the baseline KPIT = KPIt0 or higher than that if the crisis event is regarded as an opportunity to build back better, i.e., KPIT > KPIt0.
R O = 1 K P I T K P I t 0 K P I T
The RRi the resilience rate, Equation (9), is the slope of the recovery of the KPI over time and measures the effectiveness of each i stepwise intervention
R R i = R i + 1 R i t i + 1 R i
where Ri, Equation (10), is measured as a function of the value of the KPIti measured at time ti when a variation of policies, available resources, etc., is causing a change in the rate of the KPI recovery (which can be either positive, i.e., increasing the resilience rate, or negative, i.e., decreasing the resilience rate).
R i = 1 K P I T K P I t i K P I T
Finally, the resilience area, Equation (11), is assessed as the overall area of the polygon identified by the recovery path over time.
R A = i = 0 T [ ( ( 1 R i ) + ( 1 R i + 1 ) ) · ( t i + 1 t i ) 2 ]  
To perform the resilience assessment according to the proposed resilience metrics, it is necessary to fix an observation time range, referred to as target time tT (e.g., a few months, one year, a decade, or any other amount of time) and assume it as a unit value tT = 1. The time from the seismic event t0 = 0 to the target time tT = 1 will therefore be measured as a proper fraction (e.g., if the monitoring time is a decade tT = 1 = 10y, a check made after one year will be at time t1 = 0.1 = 1y).
In this way, a 10-level resilience scale, from 0 to 1 (Table 7) can be used to judge the resilience efficiency class achieved with different interventions during the monitoring time; here, the idea is to use the same class system usually adopted to judge energy efficiency, i.e., from A4 (i.e., A+++), greatest efficiency, to G, lowest efficiency.
Figure 5 showcases how the proposed resilience metrics RO, RI, and RA can be easily assessed by plotting them on a time–resilience, t-R, plot, where the resilience target RT and time target tT are assumed as a unitary value. We can imagine that the plots are referring to a KPI related to the usability of a building damaged after an earthquake. On the left side, after a stall time, repair work starts and the usability is brought back to normal before the target time; on the right side, although the loss in usability is less than the previous example, the stall time is longer and the rate of recovery proceeds at a lower rate compared to example (a) and is further delayed, starting from time t1.
It is worth underlying that if the KPI could not be fully recovered during the time range selected for the observation (i.e., from t = 0 to tT), the value of the last observed Ri result will be less than the targeted resilience, i.e., Ri < RT.

3. Results

3.1. ARCH DSS Software Architecture

The ARCH DSS was developed by customizing the CIPCast DSS, a GIS-based DSS developed as part of the EU-funded FP7 project CIPRNet (Critical Infrastructures Preparedness and Resilience Research Network, [80,81]) for real-time and operational (24/7) monitoring and risk analysis of built and natural assets, with special focus on the analysis of interdependent critical infrastructures such as electric power, water, telecommunication, road networks, and strategic buildings [82,83,84,85]. CIPCast DSS built as a combination of free/open-source software environments, detailed presentation and explanation of which is provided in [80,81].
The CIPCast DSS is based on a multi-tier architecture including distinct layers organized according to a hierarchical order: the presentation layer, service layer, middleware layer, and persistence layer. In the CIPCast DSS, the Web-GIS application represents a fundamental tool for decision-making and monitoring processes as a specific interface of the CIPCast DSS. The basic geospatial information, the considered assets, and the processed maps and scenarios can be visualized and queried via the Internet, through a common browser. Geographical and spatial elements can be selected both graphically and spatially, using topologically defined spatial relationships (such as contiguity, adjacency, intersection, etc.) or using specific descriptive attributes (qualitative/quantitative).
CIPCast-ES (Earthquake Simulator) is an extension of the CIPCast DSS that is specifically aimed at simulating seismic hazard maps and assessing earthquake-induced physical damage and impacts. In this case, the Web-GIS application operates as the geographic interface of the CIPCast-ES simulator for (a) the geographic visualization, (b) the parameter input and selection of the simulation approach (e.g., GMPE), (c) the execution of an earthquake simulation, (d) the visualization of the damage scenario on the assets of interest, and (e) the interactive consultation of the results.
To build the ARCH DSS, the existing functionalities of the CIPCast DSS and CIPCast-ES have been exploited and extended to allow for the implementation of approaches that have been specifically identified for the vulnerability, physical damage, and impact assessment and resilience monitoring of HA.
The presentation layer (or dashboard) of the ARCH DSS (top layer in Figure 6) includes different graphical user interfaces (GUI) viewers and a set of GUI widgets:
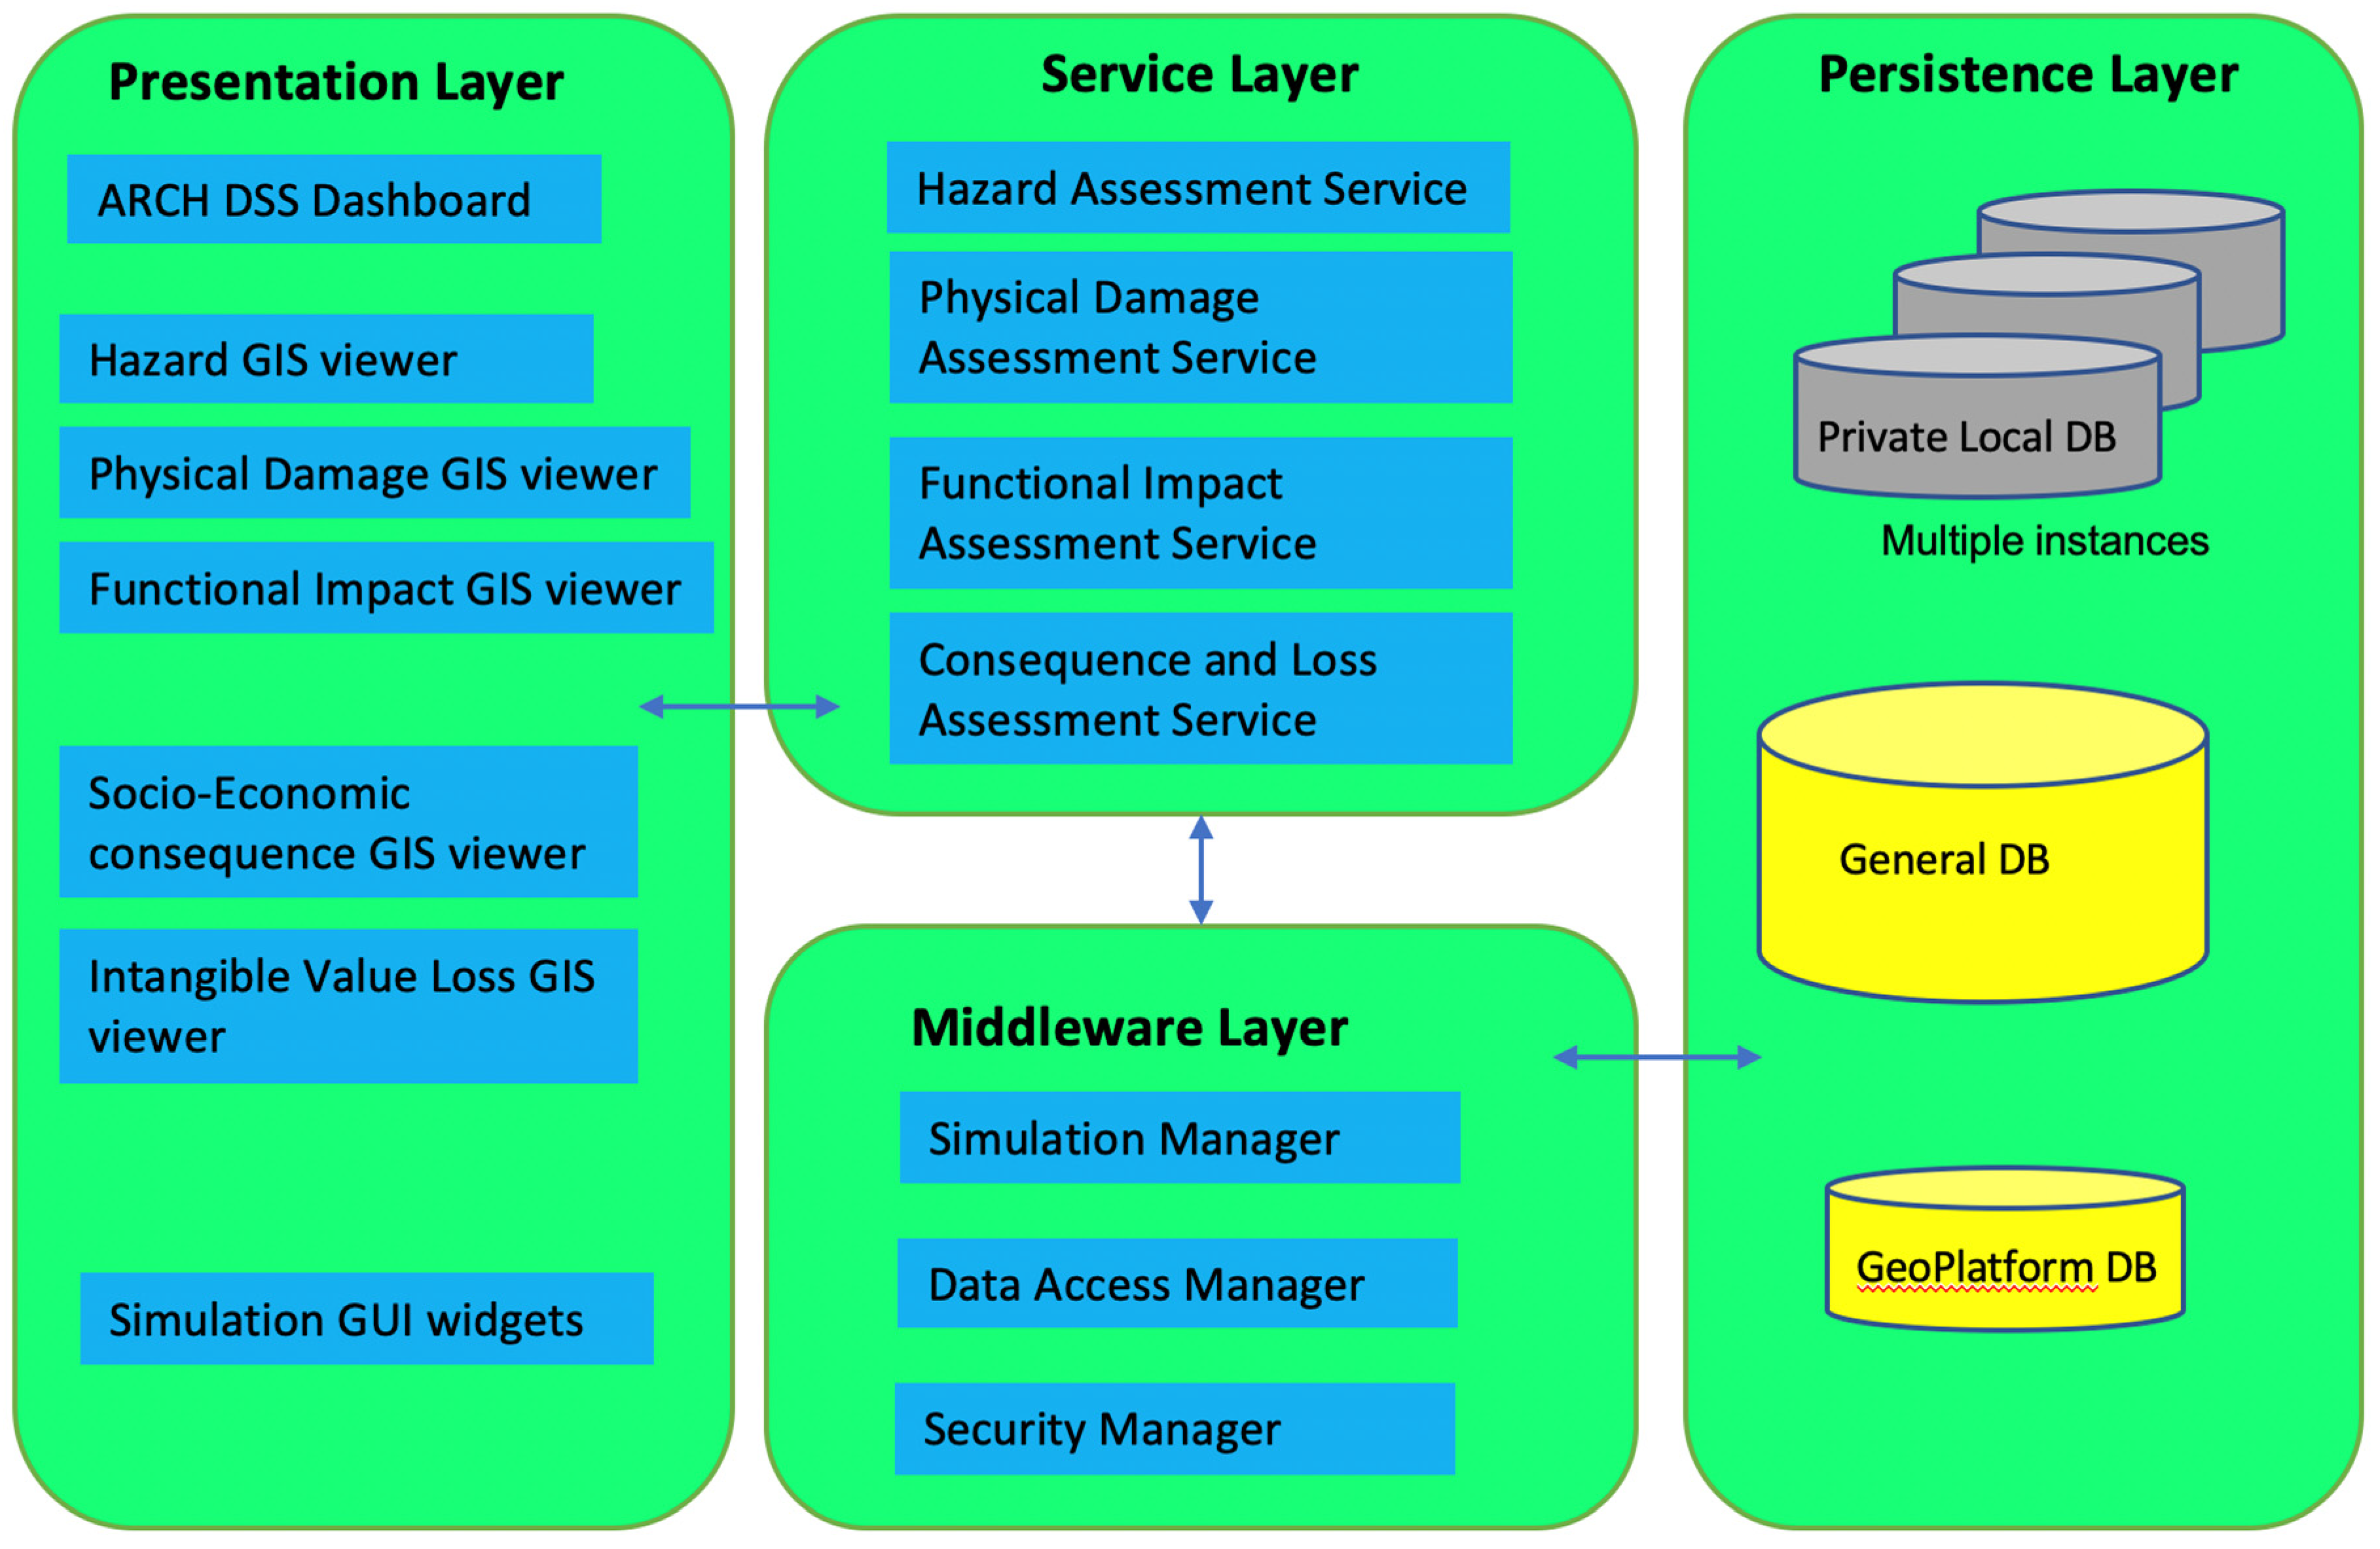
  • GUI viewers provide dedicated GIS viewers with different layers including seismic vulnerability, physical damage, functional impact, social and economic consequences, and intangible value losses;
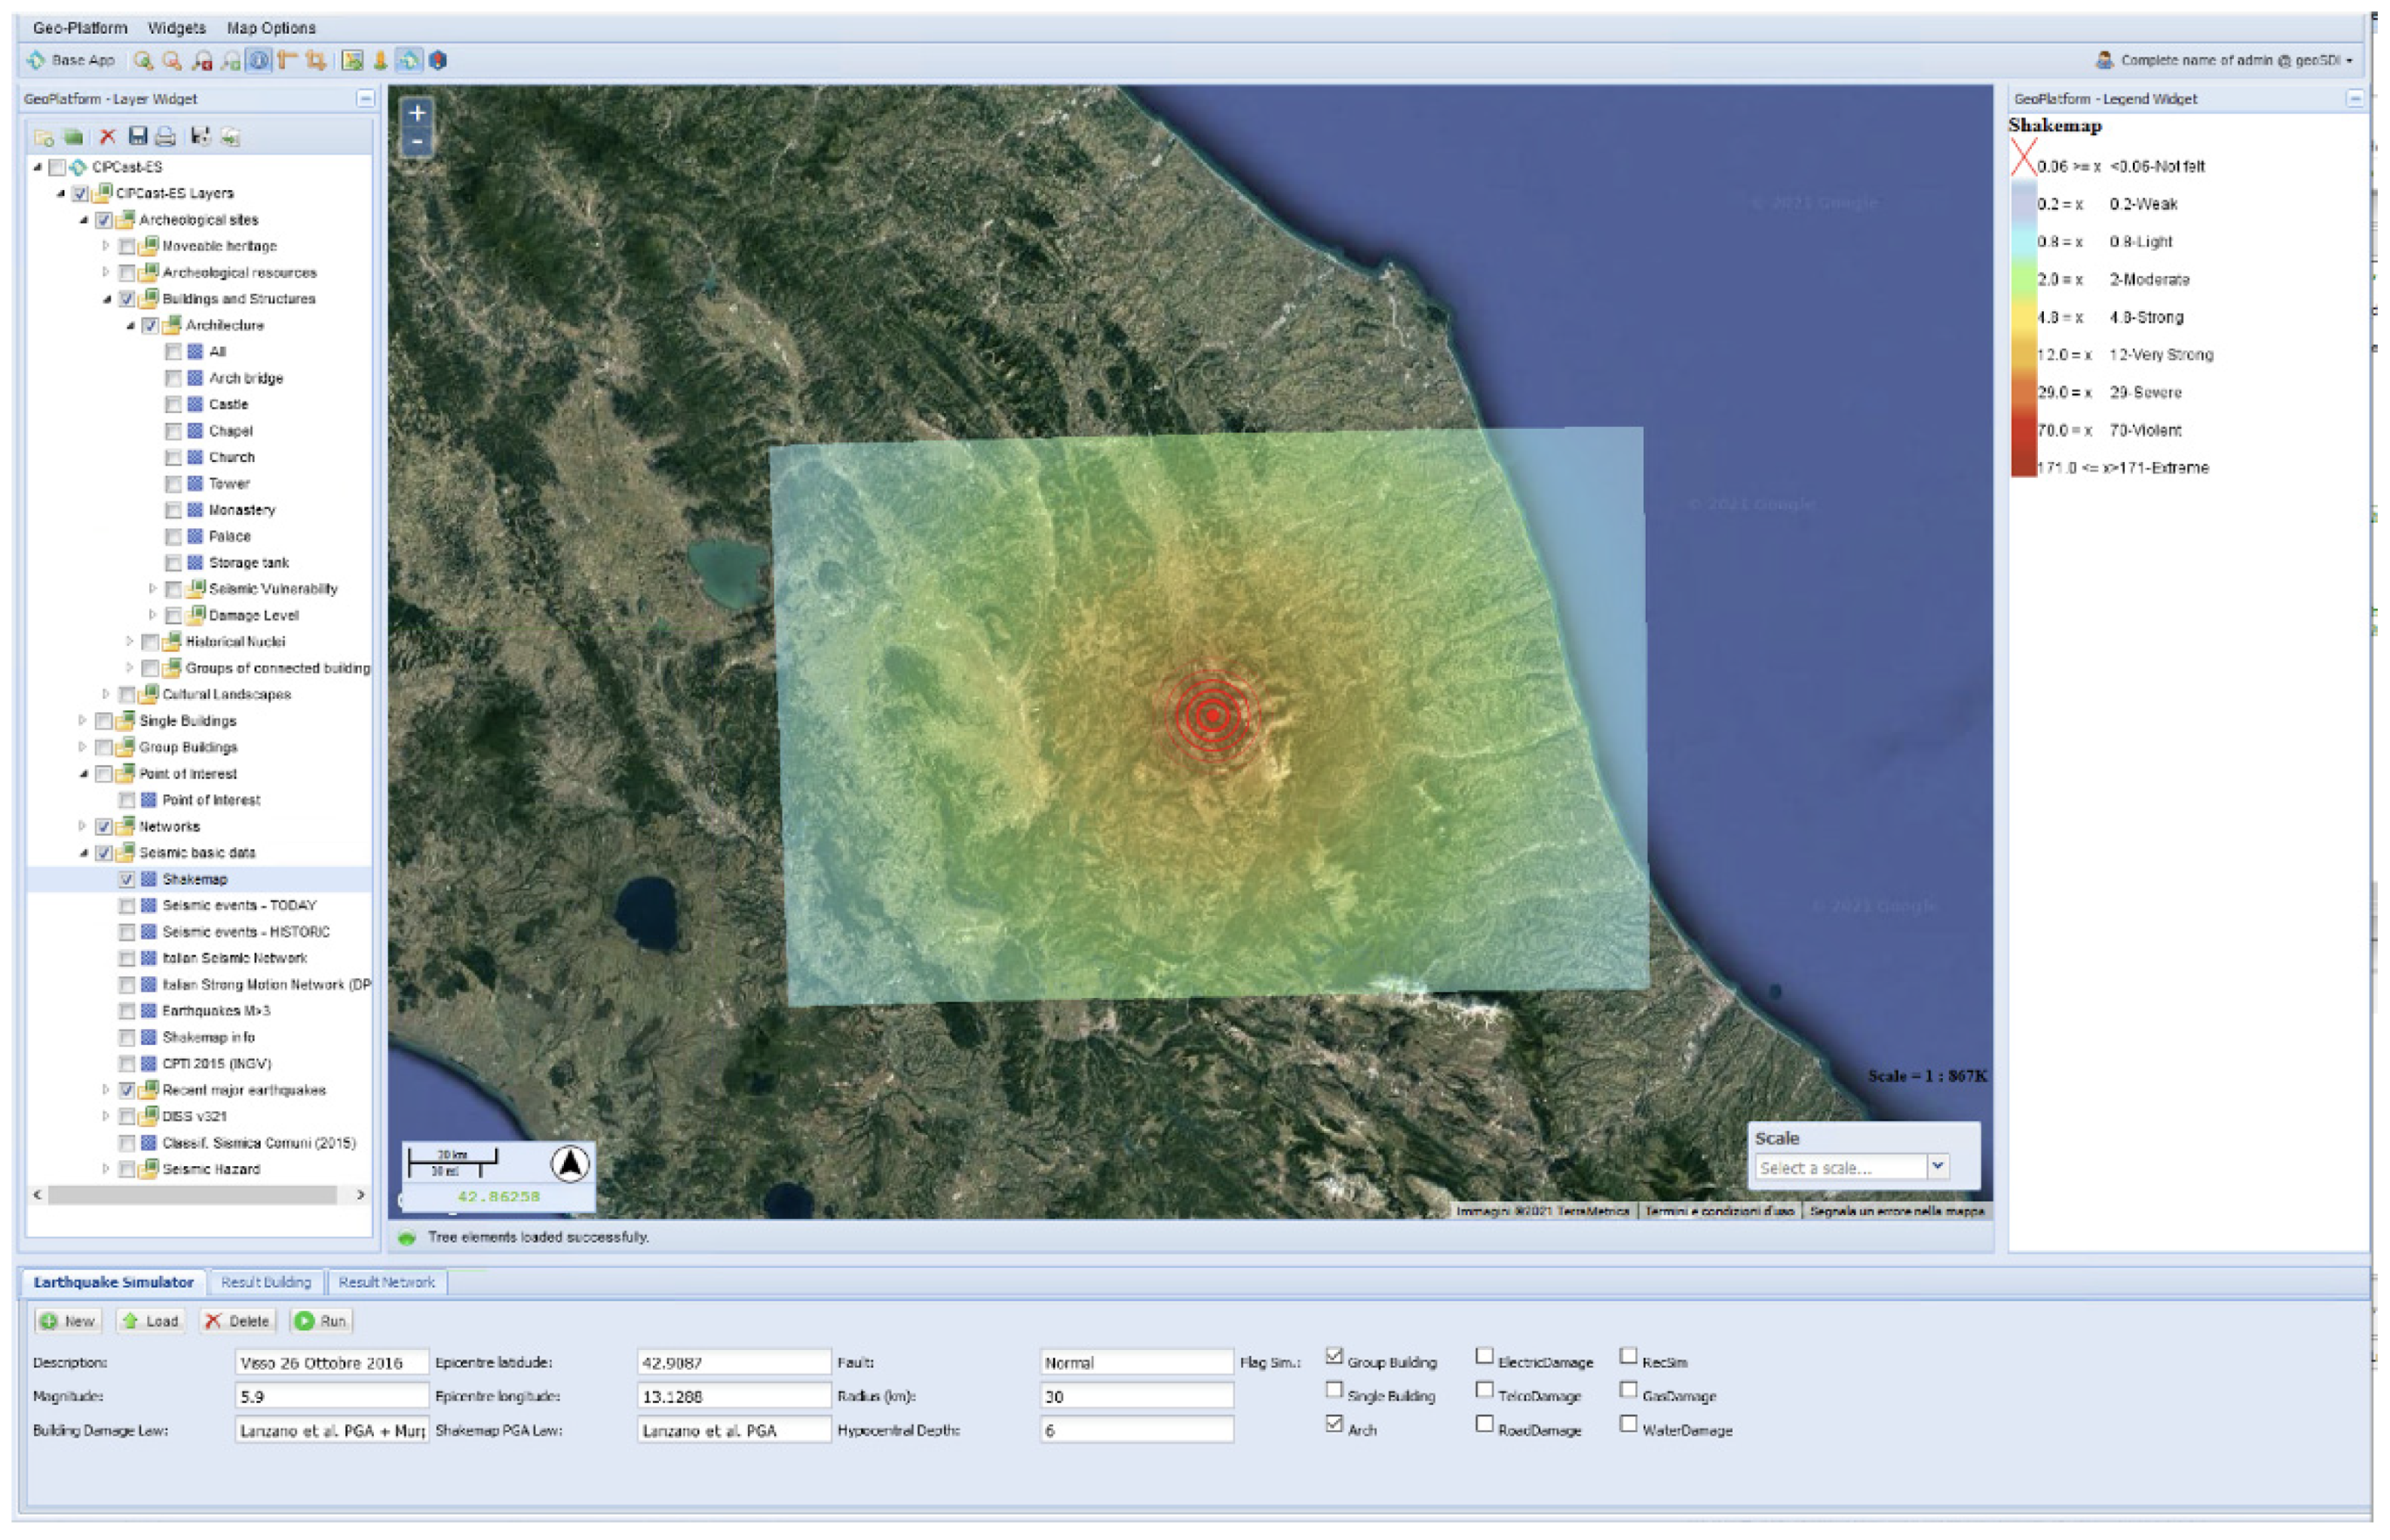
  • GUI widgets allow the user to define the characteristic of the simulation to be run, e.g., simulations of real events versus user-defined events; deterministic versus probabilistic simulations and definitions of the specific characteristics of the event to be simulated (e.g., for deterministic events, coordinates of the epicenter, hypocentral depth, magnitude; for probabilistic events, the selected return period); selection of the scale of analysis, e.g., territorial versus local; selection of the minimum unit of analysis, i.e., single building versus census, borough or municipal area; selection of the specific exposed asset under analysis; selection of the phase to be simulated, such as pre-event emergency management and post-event recovery and reconstruction.
The service layer of the ARCH DSS (second layer in Figure 6) contains several components, namely:
  • Simulated hazard assessment service: this service allows the assessment of hazards either in a deterministic way (end-user defined event and/or replication of occurred events) to be used for impact scenario or in a stochastic way, to be used as risk scenario;
  • Real time hazard assessment service: this service allows the assessment of hazard maps in real time for an on-going event, provided the availability of the required information to characterize the event (e.g., for generating ground-motion maps after an earthquake, it is necessary to know the coordinates of the earthquake epicenter or hypocenter and the event magnitude; for generating a pluvial flooding map, mm/h, digital elevation model, and characteristics of the drainage system);
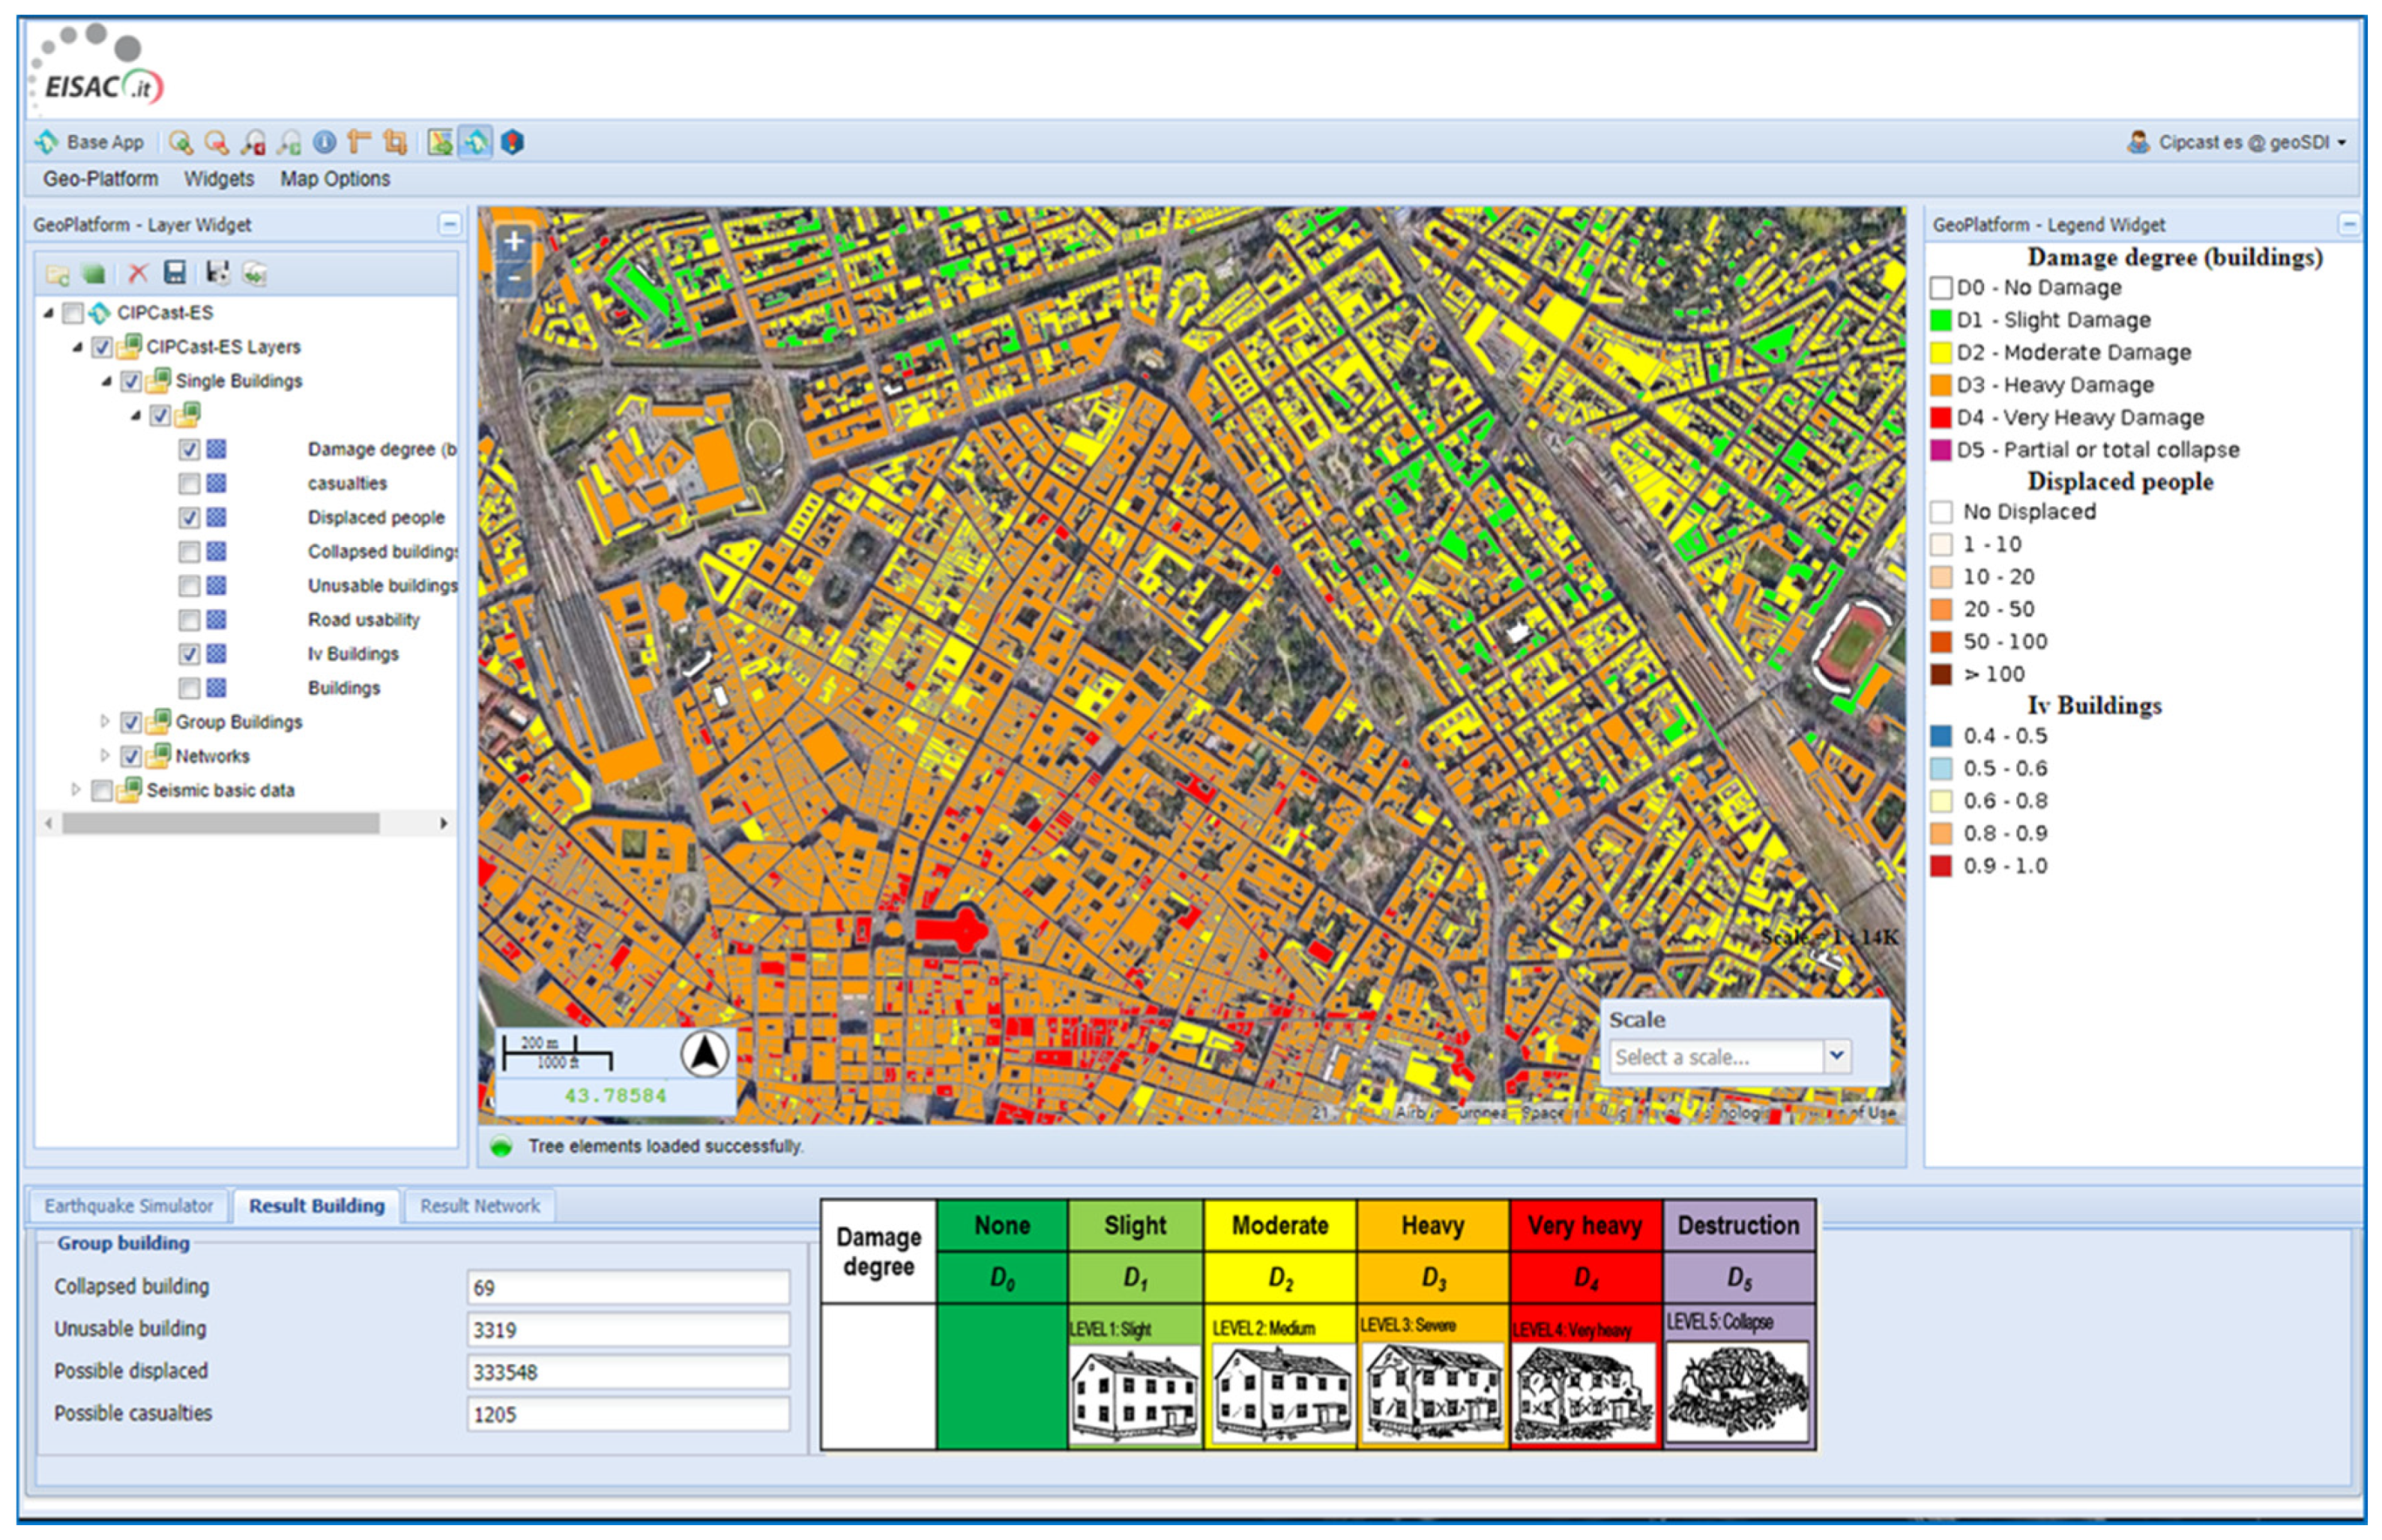
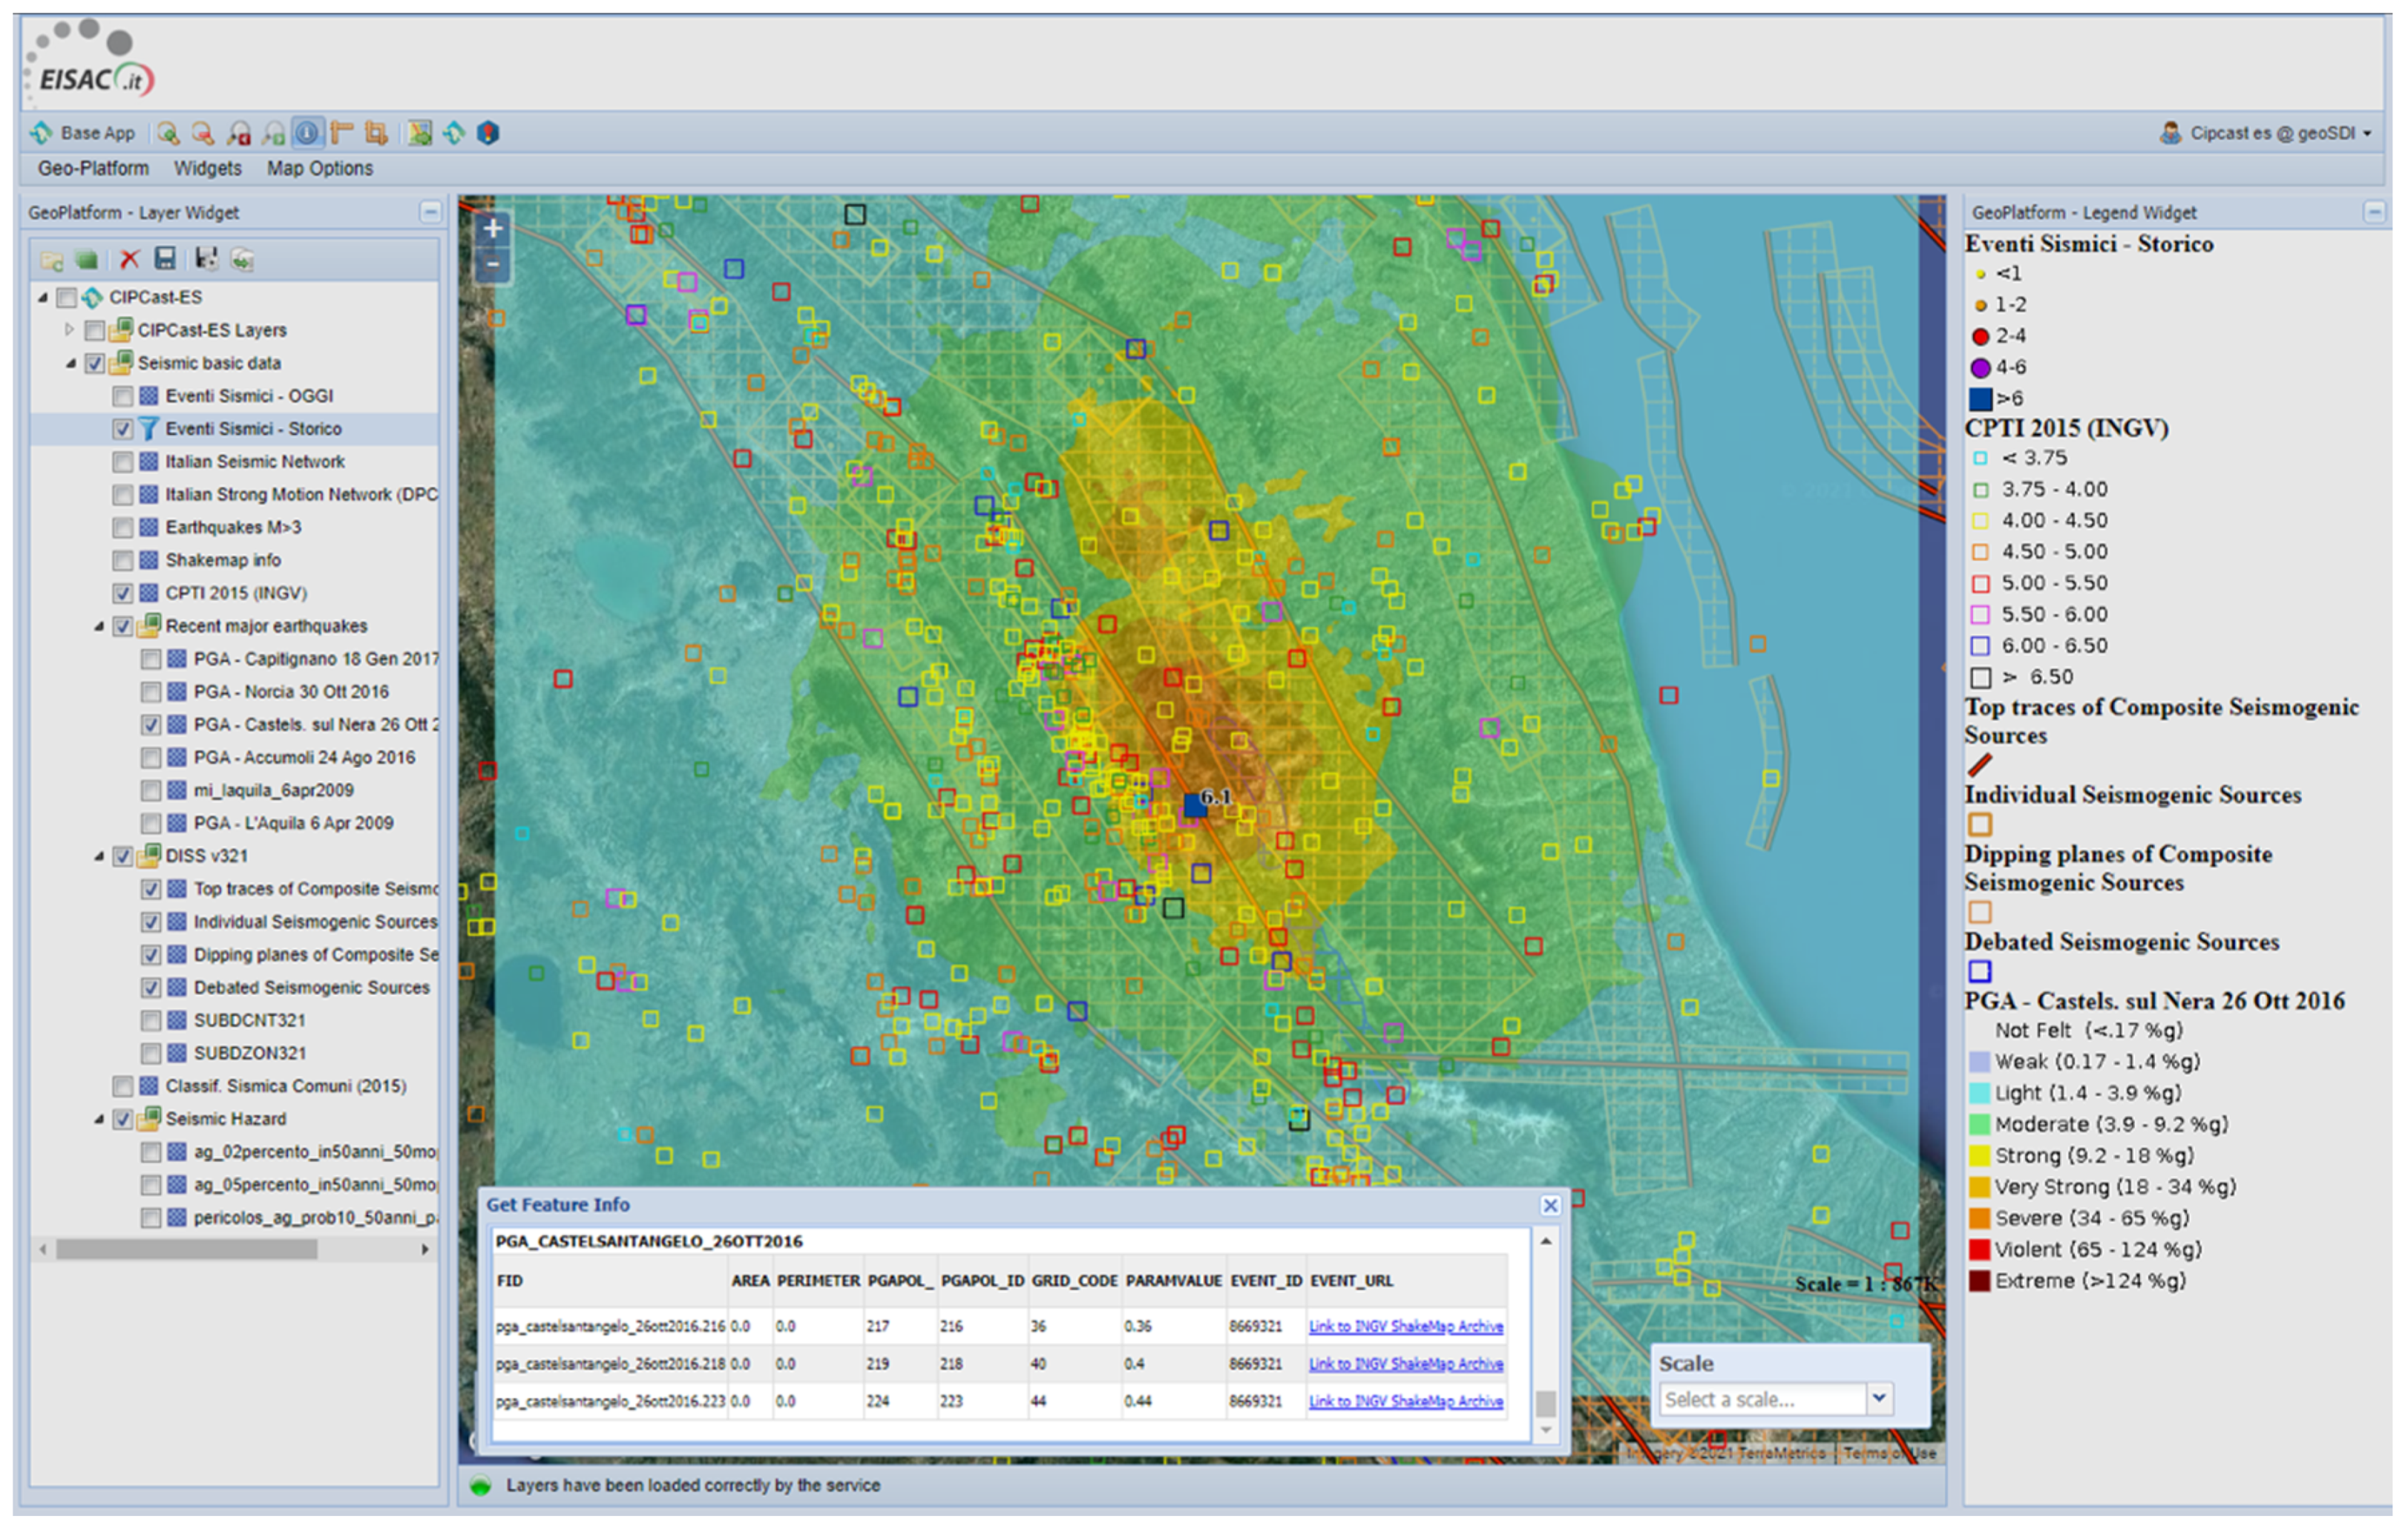
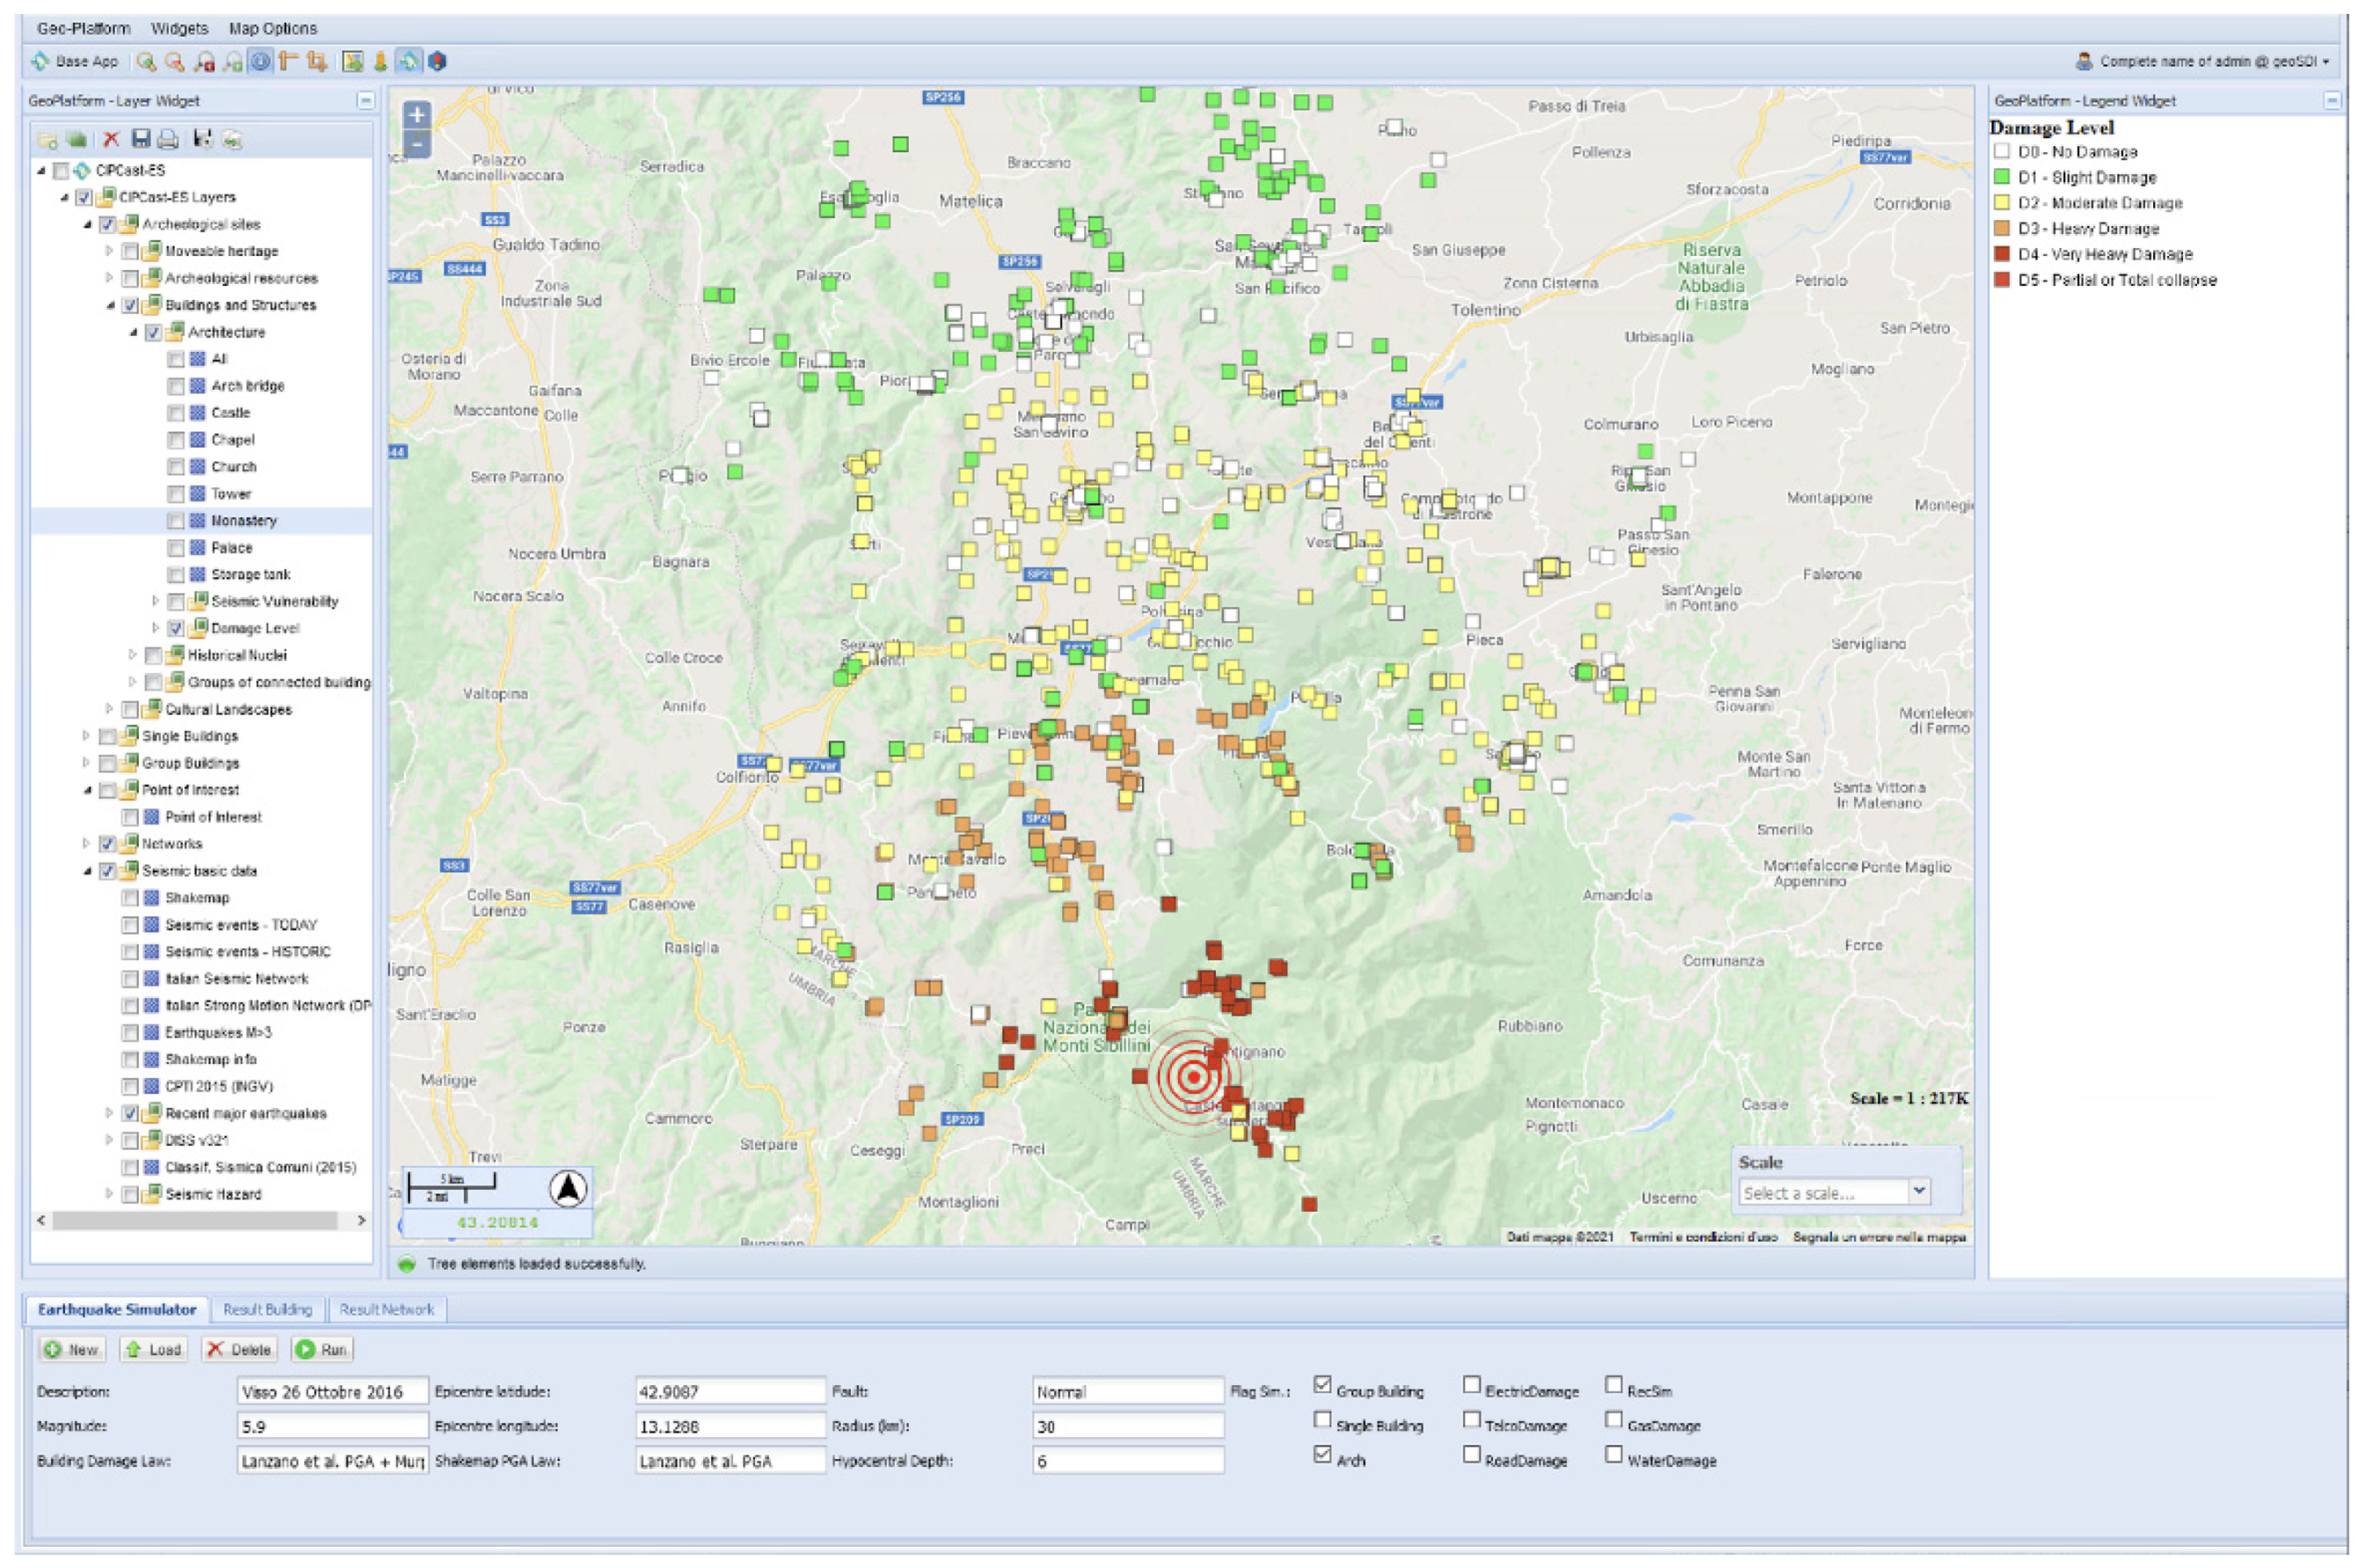
  • Physical damage scenario assessment Manager: this service allows the prediction of (physical) damage scenarios for historic areas based on the hazard outputs from the hazard assessment services and the vulnerability of exposed objects (example see Figure 2 and Figure 9);
  • Impact and consequence prediction manager: this service estimates physical functional (including cascading effects) impacts on historical areas and related systems (e.g., ecosystems, social systems, and intangible value systems connected to historic areas) considering the natural, social, and built environments they are embedded in as well as (inter)dependencies with critical infrastructures.
The middleware layer of the ARCH DSS contains the following components:
  • Data access manager: this component implements the procedures necessary to gather data coming from external sources on a 24/7 basis, such as meteorological data needed to feed models and simulations;
  • GeoPlatform interaction service: this service is responsible for login and logout functions and the uploading of user data;
  • Security and user account manager: this service is responsible for managing user accounts and controlling access to the data.
The persistence layer of the ARCH DSS contains the following components:
  • Public GeoPlatform DB: this database stores GIS layers (such as territorial, socio-economical, and technological infrastructure data) compliant with INfrastructure for SPatial InfoRmation in Europe (INSPIRE) and Open Geospatial Consortium (OGC) standards;
  • Private local DB: this database contains information specific to each historic area. For each of those, a separate DSS instance will be created. “Local” here refers to the historic area;
  • General DB: this database contains data common for all instances.

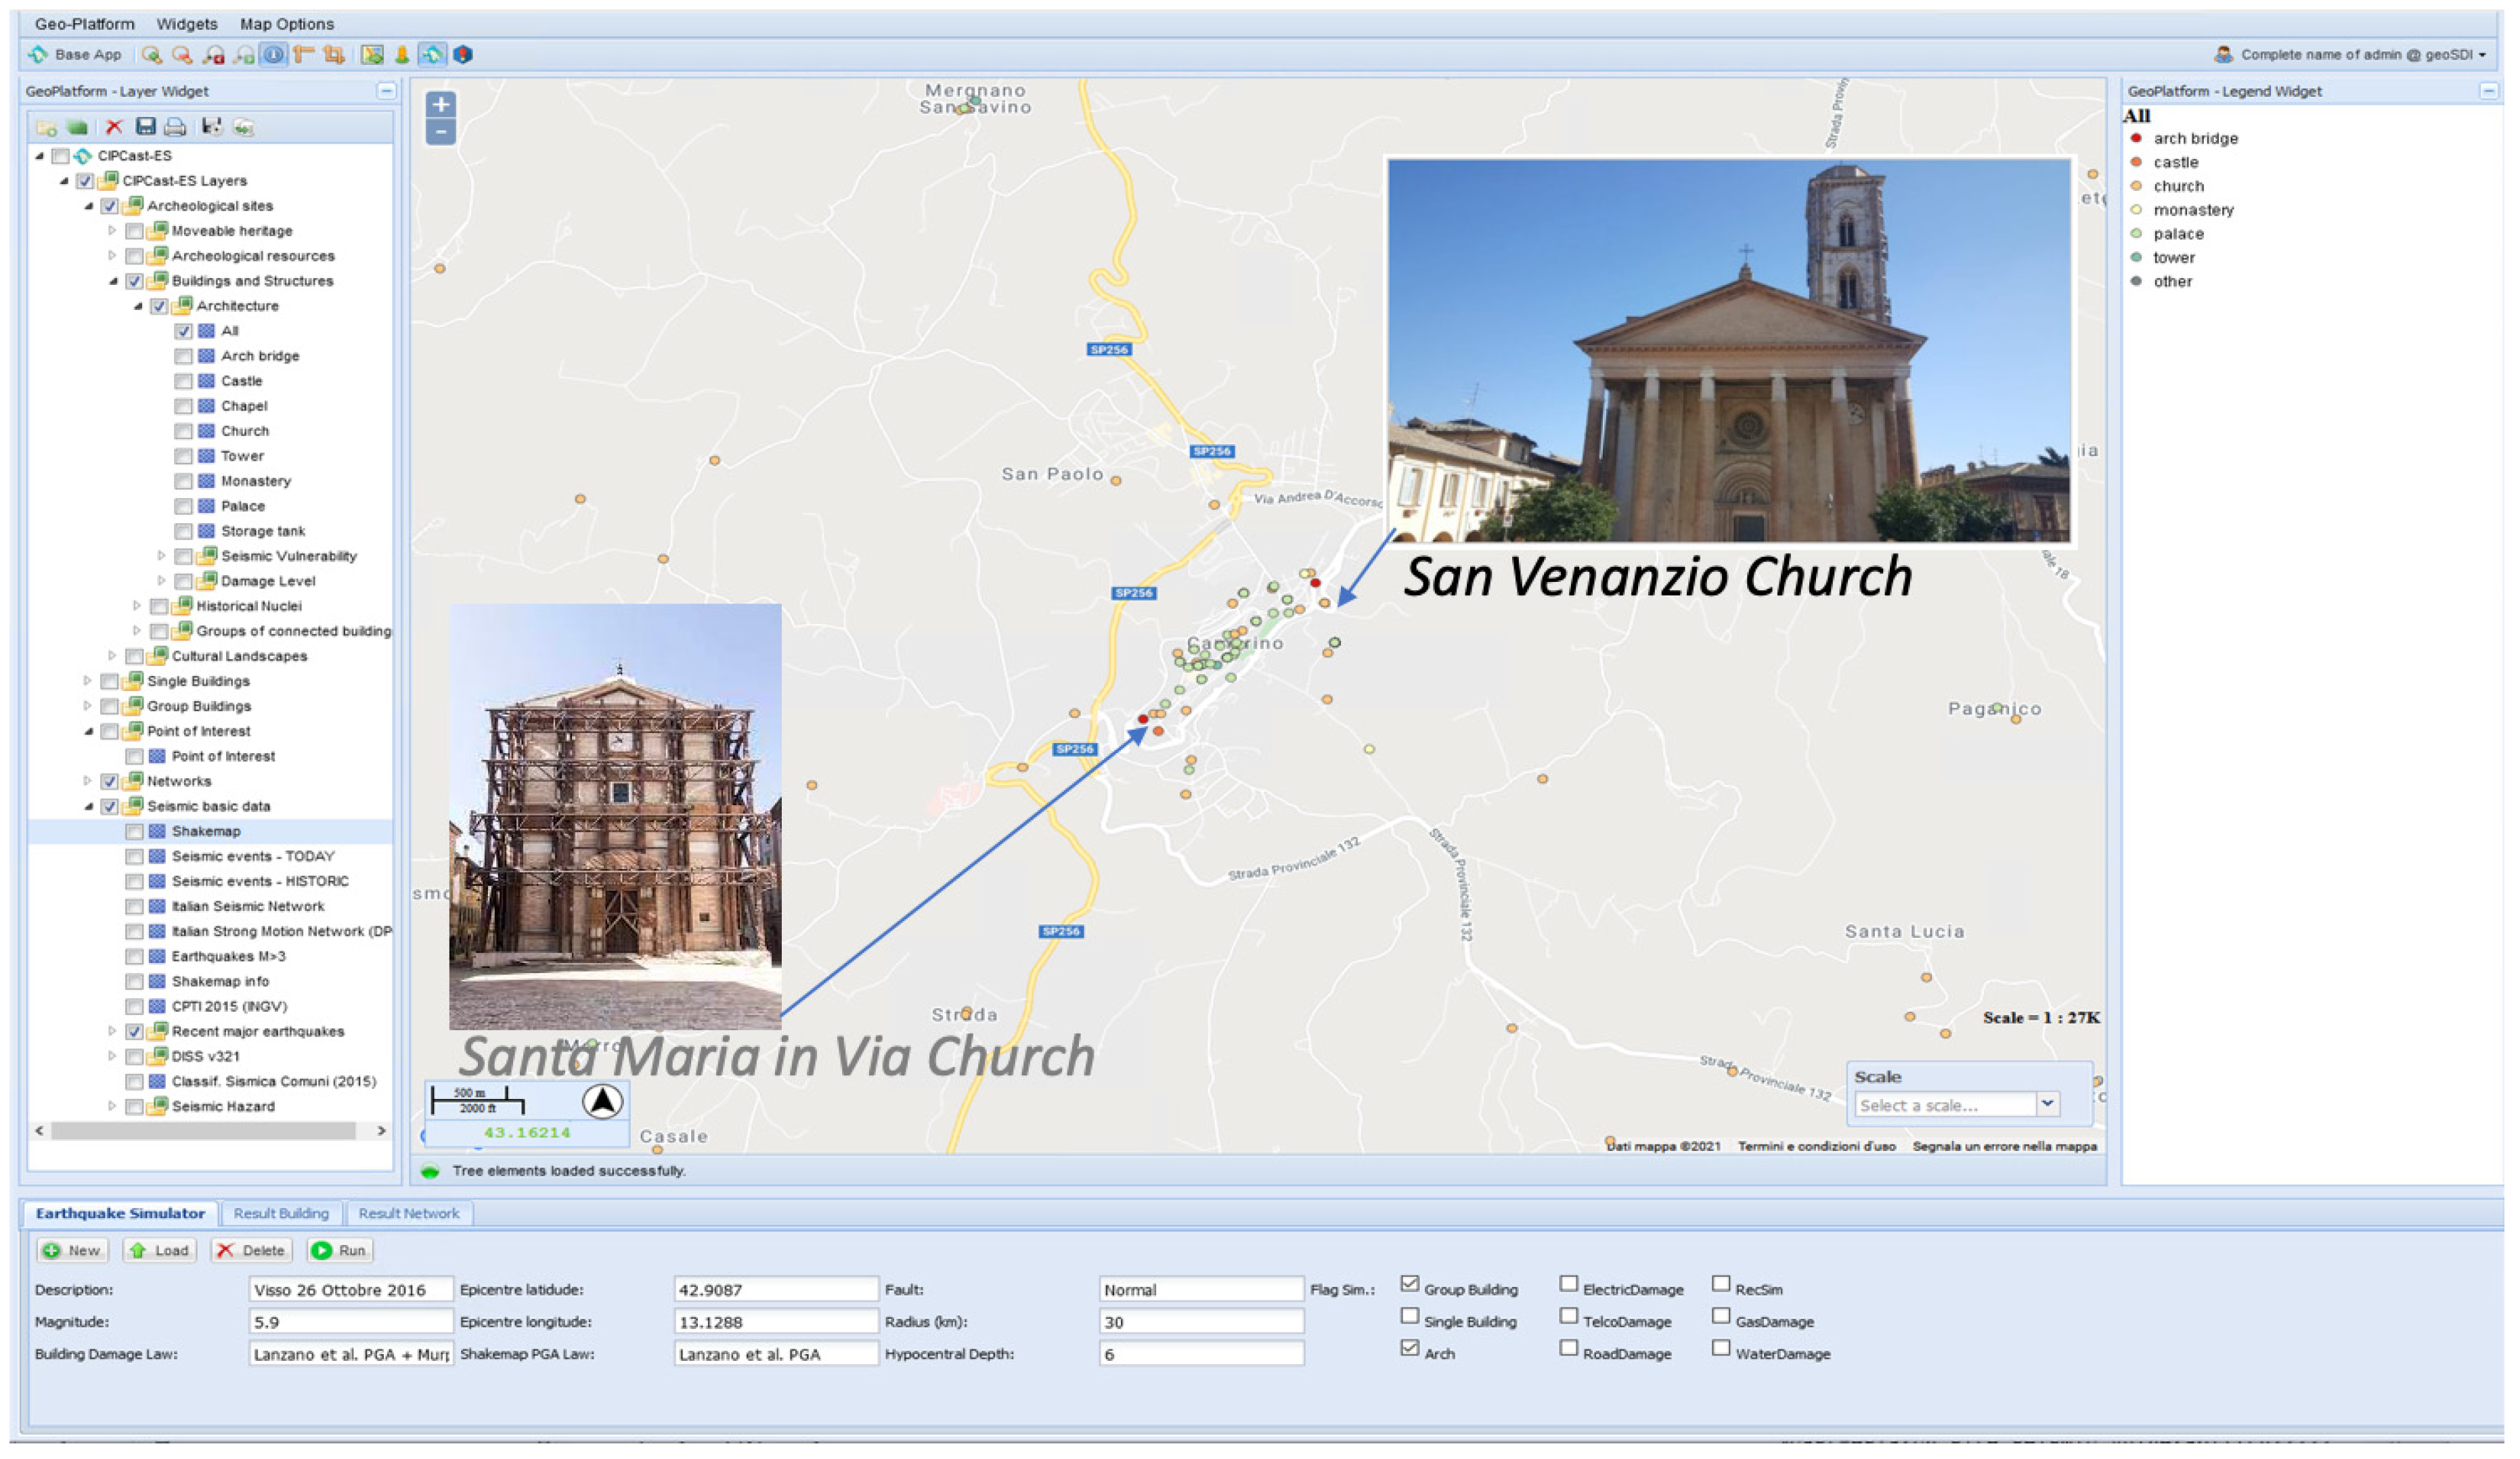
3.2. Implementation of ARCH DSS in Camerino-S.Severino HA

The central area of Italy is highly seismically active (Figure 7). In 2016, this area experienced one of the most disruptive seismic sequences in recent time. The sequence started on 24 August 2016, when an earthquake with a moment magnitude Mw = 6.0, referred to as the “Amatrice earthquake” and a hypocentral depth of 8 km followed by an Mw = 5.4 aftershock caused 299 deaths and significant destruction of numerous towns and villages in central Italy. On 26 October, two earthquakes (Mw = 5.4 and Mw = 5.9) occurred in an adjacent area along the Umbria and Marche region boundaries. The stronger 26 October event, i.e., Mw = 5.9, is referred to as the “Visso earthquake”. A further main shock of Mw = 6.5 occurred on October the 30th in the Umbria region, referred to as the “Norcia earthquake”. The “Visso earthquake” has been chosen as a case study for the seismic simulation and its impact on the cultural heritage in the HA of Camerino-San Severino. The choice is motivated by the widespread damage caused to the cultural heritage buildings and cultural sites in the analyzed area. In fact, the Visso earthquake induced the collapse of the tower of Santa Maria in Via church (already severely damaged by the previous earthquake events of the sequence), which is one of the focus points selected in the ARCH project for the Camerino case study.
According to the methods introduced in Section 2.1.1, the ARCH DSS has been used for the first time to assess the ground shaking map generated by the Visso earthquake (Figure 8) by specifying the event characteristics (i.e., position of the epicentre, hypocenter depth, magnitude) in the input widget; by selecting the GMPE; and by accounting for the possible soil amplification. As reported in Section 2.1.1, simulated ground shake maps can be substituted and/or integrated with the ground shake maps resulting from national [86] or urban [87] accelerometric seismic networks as soon as they are made available by INGV.
Concerning the characterization of the exposure, the ARCH geodatabase contains data from the Sistema Informatico Territoriale Carta del Rischio SIT-CR for the area of interest. SIT-CR is the example of a shared and accessible CH database, a best practice that should be adopted internationally. SIT-CR was conceived and realized by Istituto Superiore per la Conservazione e il Restauro (ISCR, previously Istituto Centrale per il Restauro) under the Italian Ministry for Cultural and Environmental Heritage (MIBAC) as the main reference tool for the safeguarding of Italian Cultural Heritage. SIT-CR is a data repository for heritage buildings and cultural sites, capable of processing data and statistics for each one of the 8100 Italian municipalities. SIT-CR is available to MIBAC, local and regional bodies for developing safeguards, conservation, and maintenance interventions as well as restoration and urban planning measures for cultural heritage. The SIT-CR also proved to be a very useful tool for supporting post-disaster emergency management and reconstruction. After recent catastrophic earthquake events in Italy (e.g., Abruzzo 2009, Emilia 2012, the central Italy seismic sequence 2016–2017), SIT-CR was used to identify the list of heritage buildings and cultural sites that were located in the area affected by the ground shaking and as a basis for collecting further information on the affected cultural heritage. The joint use of SIT-CR and GIS DSS such the ARCH DSS can provide great opportunities for supporting the planning and prioritizing of emergency and reconstruction interventions as showcased both later in this paper and in past papers for a different WebGIS DSS [73].
The CH buildings and structures included in the SIT-CR for Camerino-San Severino HA have been classified according to the ARCH classification for CH (Table 2). Both typological vulnerability V and ductility Q indexes (Table 3) were attributed to them. By implementing the method proposed in Section 2.1 of the paper, ARCH DSS allowed us to assess the physical damage scenario (Figure 9) as a function of the seismic vulnerability implemented for the different building types and as a function of the ground shake map simulated by the ARCH DSS for the Visso earthquake (Figure 8).
Table 8 reports the results of the simulation in terms of the estimated number of buildings and structures damaged at different damage levels, Dk(k = 0–5) of the EMS-98 damage scale (Table 1).
The resulting damages are definitely in line with the damages and impacts that were observed to affect CH buildings following the central Italy seismic sequence 2016–2017 [88]. A detailed validation of the results against the observed evidence is out of the scope of this work and will be the subject of a further publication. However, it is worth mentioning that what was obtained from the scenario run with ARCH DSS is coherent with the observed damages and impacts (in terms of residual usability) suffered by masonry churches after the 2016–2017 Central Italy seismic sequence as reported in [89] in terms of percentages of churches affected at different levels of different ranges of PGA. Once the damage assessment was performed, the ARCH DSS can be used to assess the impacts (e.g., in terms of residual usability and functionality of the buildings, possible impacts on artwork contained in the building, or estimation of the number of artwork in danger of being evacuated from damaged buildings) and to monitor the resilience of the repair and recovery phases for the buildings, for the HA as a whole and its the local communities, their economy, and well-being. Figure 10 shows an example of the monitoring for the KPI of usability for two iconic churches in Camerino, i.e., San Venanzio and Santa Maria in Via. They were both unusable after the 26 October 2016 earthquake because of the earthquake-induced damage to their structural and non-structural elements. Santa Maria in Via Church is still unusable to date, while San Venanzio is back to being fully operational, and it was reopened on 15 December 2019 to the public for religious ceremonies and celebrations (thanks to the commitment of the local community and to the financial support received from a private donation from the Arvedi Buschini Foundation). Assuming the observation time range of the resilience assessment from the earthquake event on 26 October 2016 to date and the implementation of the approach proposed in Section 2.3, the resilience class of the two iconic churches, i.e San Venanzio and Santa Maria in Via, can be judged as A+ and G, respectively, according to the resilience scale introduced in Table 7, as far the KPI for usability is concerned.

4. Discussion and Conclusions

The paper presents methods for assessing earthquake-induced physical damages and the resulting impacts on the functions of HAs as well as methods for monitoring the resilience of HAs. The paper showcases the implementation of the proposed methods within a WebGIS tool named ARCH DSS. The proposed methods can also be implemented within other GIS-based platforms and tools. However, the embedment and use of the proposed methods within an integrated platform such as ARCH DSS is recommended in order to consider and analyze the interdependencies and cascading effects that might be critical and cannot be disregarded in complex systems such as HAs where the built-environment, social, economic, and bio-ecologic dimensions co-exist and interact with the intangible dimension of values, perceptions, social-cohesion, and sense of belonging that makes historical areas unique.
In particular, this paper focuses on methods for the assessment of earthquake-induced physical damages on the built-environment of HAs and methods for the estimation of the impacts on vital functions of HAs, both tangible and intangible, resulting from such physical damages. The paper furthermore proposes methods for estimating how the loss/reduction of HA functions might lead to economic consequences (e.g., loss/reduction of revenue from economic activities peculiar and vital for the local economy of the HAs) and consequences on the social-cohesion and the sense of belonging/identity of local communities. However, HAs are complex social–ecological systems, and further to the proposed methods for assessing how earthquakes might affect the physical properties of HAs and consequently the social and economic ones, further work is needed to embed valuable approaches to support building resilience in GIS systems, especially with regard to the additional properties of HAs, such as the institutional, social, cultural, physical, economic, environmental, and intangible properties.
The implementation of the proposed methods on the HA of Camerino-San Severino was undertaken with the aim of demonstrating the potential of the ARCH DSS or similar GIS systems to inform and support decision-making processes towards the preservation and thriving of HAs in the different phases of the disaster risk reduction cycle:
  • Before the occurrence of an earthquake event, to plan for mitigation actions aiming to reduce possible future impacts;
  • In the aftermath of a seismic event, to inform and support the emergency management phase by providing first responders the estimation of the location and extent of damages and impacts for a timely, effective, and efficient allocation of resources;
  • After an event, to support resilience building and build back better policies and strategies.
Further work is planned to enhance the current potentialities of the ARCH DSS tool both from the perspective of the sophistication and reliability of the methods proposed and embedded in ARCH DSS and from the perspective of increasing the interactivity and usefulness of the tool for the users.
As far as the method improvement is concerned, the hazard module will be connected and empowered with the capabilities of the hazard module of the OpenQuake engine (https://docs.openquake.org/oq-engine/1.2/calculators/hazard.html, accessed on 26 January 2021). Work for the inclusion of additional vulnerability, damage, impact, and consequence assessment functions is also planned [22,23,24,25,26,27,28,90]; similarly, the addition of further frameworks for classifying the exposure [91], indicators, and performance metrics for measuring impacts [92] is envisioned.
As for increasing the potentialities, interactivity, and usefulness of the ARCH DSS tool for users, the direction of near-future research targets all of the following. First, ARCH DSS will be extended to support participatory decision-making processes including multi-criteria analysis. In this way, during business-as-usual times, ARCH DSS is envisioned to become a tool for promoting the co-design and co-production processes for the identification of community-based mitigation and resilience strategies. The aim is to enable different stakeholders to use the ARCH DSS for a two-step approach: (1) performing what-if analyses based on user-defined scenarios to find data and evidence regarding “what would happen if an earthquake, stronger than the one already occurred centuries ago in this historic area, would strike again? Would the cultural patrimony survive? Would the local community be affected? And, if so, to what extent? What can we do to mitigate the risk for impacts? How can we choose among different strategies for preserving the quality of the social dimension, and the prosperity of the local economies?”; and (2) facilitating discussion and reconciliation between the different and often conflicting needs of the stakeholders during the definition of management plans for historic areas and cultural heritage, which include risk mitigation and contingency plans.
Second, to support the build back better and resilience enhancement process, ARCH DSS will be equipped with the capabilities to handle dynamic data (i.e., data that varies over time) so that it can became a platform where KPIs related to socio-economic and intangible impacts can be dynamically monitored to check the effectiveness of response and recovery strategies. Furthermore, ARCH DSS will be integrated with a database of resilience building measures to support the formulation and comparison of resilience building strategies [88,89,90,91,92,93,94]. Additionally, the functionalities of the ARCH DSS will be integrated in a resilience assessment framework based on the UNDRR Disaster Resilience Scorecards for cities [95] and buildings [96] that include further—non-physical—resilience aspects (e.g., community resilience) to support the formulation of comprehensive resilience action plans for historic areas in agreement with the urban adaptation cycle [97].
Finally, future research will look at defining and at integrating approaches such as agent-based modelling and systems dynamics methods within ARCH DSS thus enabling a more advanced and more realistic representation and assessment of the complex interactions between human decisions, tangible, and intangible dimensions of historic areas and the representation and simulation of multi-hazard scenarios and of their cascading effects. Future research will also look at the possibility to connect ARCH DSS to an urban digital twin model to support the resilience of historic areas and local communities in a smart and holistic perspective. A prototype of an urban digital twin has been proposed to support urban planning decision making processes [98]; the same idea can certainly be explored in the context of decision support systems for mitigating risks from natural hazards and for building resilience.

Author Contributions

Conceptualization, Sonia Giovinazzi, Ludovica Giordano, Antonio Costanzo, Vittorio Rosato and Daniel Lückerath; software, Antonio Di Pietro, Luigi La Porta; validation, Corinna Marchili, Antonio Di Pietro, Ludovica Giordano, Antonio Costanzo and Maurizio Pollino; formal analysis, Sonia Giovinazzi, Corinna Marchili, Antonio Di Pietro, Ludovica Giordano, Antonio Costanzo and Maurizio Pollino; resources, Ludovica Giordano, Antonio Costanzo; cata curation, Corinna Marchili, Antonio Di Pietro, Ludovica Giordano, Antonio Costanzo, Luigi La Porta and Maurizio Pollino; writing—Review and Editing, Sonia Giovinazzi, Ludovica Giordano, Antonio Costanzo, Maurizio Pollino, Daniel Lückerath, Katharina Milde and Oliver Ullrich; visualization, Sonia Giovinazzi, Antonio Costanzo and Maurizio Pollino; supervision, Sonia Giovinazzi; project administration, Daniel Lückerath; cunding acquisition, Sonia Giovinazzi, Vittorio Rosato, Daniel Lückerath and Oliver Ullrich. All authors have read and agreed to the published version of the manuscript.

Funding

The main features of the ARCH DSS come from the exploitation of a DSS realized within the EU FP7 project “CIPRNet”, which has allowed the design and the realization of the core structure of the CIPCast DSS. Subsequently, the basic CIPCast DSS has been improved by using funds provided by the Italian Ministry for University and Research through PON project RAFAEL (“System for Risk Analysis and Forecast for Critical Infrastructures in the AppenninEs dorsaL Regions”, grant agreement no. ARS01_00305). Previous activities made in PON Project RoMA (Resilience enhancement of Metropolitan Areas, project nr. SCN_00064) have provided the basic technologies on which the ARCH DSS has been built upon. These funding agencies are greatly acknowledged. The research activities and the results that are the subject of the present work have been funded by the European project “ARCH—Advancing Resilience of historic areas against Climate-related and other Hazards” funded by the European Union’s Horizon 2020 research and innovation programme under grant agreement no. 820999. The sole responsibility for the content of this publication lies with the authors. It does not necessarily represent the opinion of the European Union. Neither the EASME nor the European Commission are responsible for any use that may be made of the information contained therein.

Acknowledgments

CH data for the Camerino-San Severino area were provided by the Superior Institute for Conservation and Restoration (ISCR) of the Italian Ministry for Cultural and Environmental Heritage (MIBAC) and are those included in the Vincoli in rete—Carta del rischio project http://vincoliinrete.beniculturali.it/VincoliInRete/vir/utente/login, on 26 January 2021. Authors warmly acknowledge interesting discussions and useful suggestions provided by several colleagues involved in the ARCH project, in particular, the University of Camerino team lead by Andrea Dell’Asta and the Municipality of Camerino team. Authors thank the anonymous reviewers whose constructive and professional comments helped in improving the clarify of the manuscript.

Conflicts of Interest

The authors declare no conflict of interest.

References

  1. United Nations Educational, Scientific and Cultural Organization (UNESCO). Recommendation on the Historic Urban Landscape, Including a Glossary of Definitions. Available online: https://whc.unesco.org/uploads/news/documents/news-1026-1.pdf (accessed on 26 January 2021).
  2. Organisations for Security and Coperation in Europe (OSCE). Guidebook on Standard for Drafting Cultural Heritage Management Plan 2020. Available online: https://www.osce.org/files/f/documents/2/d/461188.pdf (accessed on 26 January 2021).
  3. UN General Assembly. Transforming Our World: The 2030 Agenda for Sustainable Development. 21 October 2015. A/RES/70/1. Available online: https://www.refworld.org/docid/57b6e3e44.html (accessed on 26 January 2021).
  4. United Nations International Strategy for Disaster Reduction (UNISDR). Sendai Framework for Disaster Risk Reduction 2015–2030. 2015. Available online: https://www.undrr.org/publication/sendai-framework-disaster-risk-reduction-2015-2030 (accessed on 28 December 2020).
  5. Pecchioli, L.; Panzera, F.; Poggi, V. Cultural heritage and earthquakes: Bridging the gap between geophysics, archaeoseismology and engineering. J. Seismol. 2020, 24, 725–728. [Google Scholar] [CrossRef]
  6. Federal Emergency Management Agency (FEMA). HAZUS99 Technical Manual; Service Release 2; FEMA: Washington, DC, USA, 2001. [Google Scholar]
  7. Ravankhah, M.; De Wit, R.; Argyriou, A.V.; Chliaoutakis, A.; Revez, M.J.; Birkmann, J.; Žuvela-Aloise, M.; Sarris, A.; Tzigounaki, A.; Giapitsoglou, K. Integrated Assessment of Natural Hazards, Including Climate Change’s Influences, for Cultural Heritage Sites: The Case of the Historic Centre of Rethymno in Greece. Int. J. Disaster Risk Sci. 2019, 10, 343–361. [Google Scholar] [CrossRef] [Green Version]
  8. Newman, J.P.; Maier, H.R.; Riddell, G.A.; Zecchin, A.; Daniell, J.E.; Schaefer, A.M.; van Delden, H.; Khazai, B.; O’Flaherty, M.J.; Newland, C.P. Review of literature on decision support systems for natural hazard risk reduction: Current status and future research directions. Environ. Model. Softw. 2017, 96, 378–409. [Google Scholar] [CrossRef]
  9. Matassoni, L.; Fiaschi, A.; Giovinazzi, S.; Pollino, M.; La Porta, L.; Rosato, V. A geospatial decision support tool for seismic risk management: Florence (Italy) case study. In Computational Science and Its Applications—ICCSA 2017; Lecture Notes in Computer Science, Part II, LNCS 10405; Springer International Publishing: Cham, Switzerland, 2017; pp. 278–293. [Google Scholar]
  10. Bocchini, G.M.; Pomonis, A.; So, E.; King, A.B.; Giovinazzi, S. The GEM Earthquake Consequences Database and New Zealand’s Contributions. 2014 NZSEE Conference. Available online: https://www.researchgate.net/publication/283934626_The_GEM_earthquake_consequences_database_and_New_Zealand’s_contributions (accessed on 17 February 2021).
  11. Vecere, A.; Monteiro, R.; Ammann, W.J.; Giovinazzi, S.; Santos, R.H.M. Predictive models for post disaster shelter needs assessment. Int. J. Disaster Risk Reduct. 2017, 21, 44–62. [Google Scholar] [CrossRef]
  12. Balbi, A.; Galasco, S.; Giovinazzi, S.; Lagormarsino, S.; Parodi, S. “Scenario Sismico”: A Tool For Real Time Damage Scenarios. In Proceedings of the First European Conference on Earthquake Engineering and Seismology, Geneva, Switzerland, 3–8 September 2006; p. 912. [Google Scholar]
  13. Pollino, M.; Fattoruso, G.; La Porta, L.; Della Rocca, A.B.; James, V. Collaborative Open Source Geospatial Tools and Maps Supporting the Response Planning to Disastrous Earthquake Events. Future Internet 2012, 4, 451–468. [Google Scholar] [CrossRef]
  14. Steiniger, S.; Hunter, A.J.S. Free and Open Source GIS Software for Building a Spatial Data Infrastructure. In Geospatial Free and Open Source Software in the 21st Century; Bocher, E., Neteler, M., Eds.; Springer: Berlin/Heidelberg, Germany, 2011; pp. 247–261. [Google Scholar]
  15. Coletti, A.; De Nicola, A.; Di Pietro, A.; La Porta, L.; Pollino, M.; Rosato, V.; Vicoli, G.; Villani, M.L. A comprehensive system for semantic spatiotemporal assessment of risk in urban areas. J. Conting. Crisis Manag. 2020, 28, 178–193. [Google Scholar] [CrossRef]
  16. Pollino, M.; Cappucci, S.; Giordano, L.; Iantosca, D.; De Cecco, L.; Bersan, D.; Rosato, V.; Borfecchia, F. Assessing Earthquake-Induced Urban Rubble by Means of Multiplatform Remotely Sensed Data. ISPRS Int. J. Geo-Inf. 2020, 9, 262. [Google Scholar] [CrossRef] [Green Version]
  17. International Strategy for Disaster Reduction (ISDR). Hyogo framework for action 2005–2015: Building the resilience of nations and communities to disasters. In Proceedings of the World Conference on Disaster Reduction, Kobe, Japan, 18–22 January 2005. [Google Scholar]
  18. Almufti, I.; Willford, M. Resilience-Based Earthquake Design (REDi) Rating System; Version 1.0; Arup: London, UK, 2013. [Google Scholar]
  19. Renschler, C.S.; Frazier, A.E.; Arendt, L.A.; Cimellaro, G.P.; Reinhorn, A.M.; Bruneau, M. A Framework for Defining and Measuring Resilience at the Community Scale: The PEOPLES Resilience Framework; MCEER: Buffalo, NY, USA, 2010. [Google Scholar]
  20. Giovinazzi, S. The Vulnerability Assessment and the Damage Scenario in Seismic Risk Analysis. Ph.D. Thesis, University of Florence (I) and TU-Braunschweig (D), Florence, Italy, 2005. [Google Scholar]
  21. Lagomarsino, S.; Giovinazzi, S. Macroseismic and mechanical models for the vulnerability and damage assessment of current buildings. Bull. Earthq. Eng. 2006, 4, 415–443. [Google Scholar] [CrossRef]
  22. D’Ayala, D.; Speranza, E. Definition of Collapse Mechanisms and Seismic Vulnerability of Historic Masonry Buildings. Earthq. Spectra 2003, 19, 479–509. [Google Scholar] [CrossRef]
  23. Del Gaudio, C.; De Martino, G.; Di Ludovico, M.; Manfredi, G.; Prota, A.; Ricci, P.; Verderame, G.M. Empirical fragility curves for masonry buildings after the 2009 L’Aquila, Italy, earthquake. Bull. Earthq. Eng. 2019, 17, 6301–6330. [Google Scholar] [CrossRef]
  24. Rossetto, T.; D’Ayala, D.; Ioannou, I.; Meslem, A. Evaluation of existing fragility curves. In SYNER-G: Typology Definition and Fragility Functions for Physical Elements at Seismic Risk, Buildings, Lifelines, Transportation Networks and Critical Facilities 2014; Pitilakis, K., Crowley, H., Kaynia, A.M., Eds.; Springer Science + Business Media: Dordrecht, The Netherlands, 2014. [Google Scholar]
  25. Rosti, A.; Rota, M.; Penna, A. Empirical fragility curves for Italian URM buildings. Bull. Earthq. Eng. 2021, 19, 3057–3076. [Google Scholar] [CrossRef]
  26. Eads, L.; Miranda, E.; Krawinkler, H.; Lignos, D.G. An efficient method for estimating the collapse risk of structures in seismic regions. Earthq. Eng. Struct. Dyn. 2013, 42, 25–41. [Google Scholar] [CrossRef]
  27. Dolce, M.; Prota, A.; Borzi, B.; da Porto, F.; Lagomarsino, S.; Magenes, G.; Moroni, C.; Penna, A.; Polese, M.; Speranza, E.; et al. Seismic risk assessment of residential buildings in Italy. Bull. Earthq. Eng. 2021, 19, 2999–3032. [Google Scholar] [CrossRef]
  28. Ceroni, F.; Caterino, N.; Vuoto, A. Simplified Seismic Vulnerability Assessment Methods: A Comparative Analysis with Reference to Regional School Building Stock in Italy. Appl. Sci. 2020, 10, 6771. [Google Scholar] [CrossRef]
  29. Grünthal, G. European Macroseismic Scale 1998. In Chaiers du Centre Europèen de Gèodynamique et de Seismologie; Grünthal, G., Musson, R.M.W., Schwarz, J., Stucchi, M., Eds.; Conseil de l’Europe: Luxemburg, 1998; Volume 15, 100p, ISBN 2-87977-008-4. [Google Scholar]
  30. Romis, F.; Caprili, S.; Salvatore, W.; Ferreira, T.M.; Lourenço, P.B. An Improved Seismic Vulnerability Assessment Approach for Historical Urban Centres: The Case Study of Campi Alto di Norcia, Italy. Appl. Sci. 2021, 11, 849. [Google Scholar] [CrossRef]
  31. Bernardini, A.; Lagomarsino, S. The seismic vulnerability of architectural heritage. In Proceedings of the Institution of Civil Engineers Structures & Buildings; Volume 161, pp. 171–181. Available online: https://www.researchgate.net/publication/245408732_The_seismic_vulnerability_of_architectural_heritage (accessed on 26 January 2021). [CrossRef]
  32. Beyreuther, M.; Barsch, R.; Krischer, L.; Megies, T.; Behr, Y.; Wassermann, J. ObsPy: A Python Toolbox for Seismology. Seismol. Res. Lett. 2010, 81, 530–533. [Google Scholar] [CrossRef] [Green Version]
  33. Megies, T.; Beyreuther, M.; Barsch, R.; Krischer, L.; Wassermann, J. ObsPy—What can it do for data centers and observatories? Ann. Geophys. 2011, 54, 47–58. [Google Scholar] [CrossRef]
  34. EMSC Seismic Portal. Available online: https://www.emsc-csem.org/Project/#seismic (accessed on 30 November 2020).
  35. INGV Seismological Data Centre. Rete Sismica Nazionale (RSN). Istituto Nazionale di Geofisica e Vulcanologia (INGV), Italy. 1 January 2006. Available online: http://cnt.rm.ingv.it/instruments/network/IV (accessed on 6 May 2021).
  36. FDSN Services. Available online: http://fdsn.org/services/ (accessed on 30 November 2020).
  37. Guidoboni, E.; Ferrari, G.; Tarabusi, G.; Sgattoni, G.; Comastri, A.; Mariotti, D.; Ciuccarelli, C.; Bianchi, M.G.; Valensise, G. CFTI5Med, the new release of the catalogue of strong earthquakes in Italy and in the Mediterranean area. Sci. Data 2019, 6, 80. [Google Scholar] [CrossRef]
  38. Stucchi, M.; Rovida, A.; Capera, A.A.G.; Alexandre, P.; Camelbeeck, T.; Demircioglu, M.B.; Gasperini, P.; Kouskouna, V.; Musson, R.M.W.; Radulian, M.; et al. The SHARE European Earthquake Catalogue (SHEEC) 1000–1899. J. Seismol. 2013, 17, 523–544. [Google Scholar] [CrossRef] [Green Version]
  39. Grünthal, G.; Wahlström, R.; Stromeyer, D. The SHARE European Earthquake Catalogue (SHEEC) for the time period 1900–2006 and its comparison to the European-Mediterranean Earthquake Catalogue (EMEC). J. Seismol. 2013, 17, 1339–1344. [Google Scholar] [CrossRef] [Green Version]
  40. DISS Working Group. Database of Individual Seismogenic Sources (DISS), Version 3.2.1: A Compilation of Potential Sources for Earthquakes Larger than M 5.5 in Italy and Surrounding Areas. Istituto Nazionale di Geofisica e Vulcanologia. 2018. Available online: http://diss.rm.ingv.it/diss/ (accessed on 26 January 2021). [CrossRef]
  41. Basili, R.; Kastelic, V.; Demircioglu, M.B.; Moreno, D.G.; Nemser, E.S.; Petricca, P.; Sboras, S.P.; Besana-Ostman, G.M.; Cabral, J.; Camelbeeck, T.; et al. The European Database of Seismogenic Faults (EDSF) Compiled in the Framework of the Project SHARE. Available online: http://diss.rm.ingv.it/share-edsf/ (accessed on 6 May 2021). [CrossRef]
  42. Italian Seismic Map. Available online: http://esse1-gis.mi.ingv.it/s1_en.php (accessed on 30 November 2020).
  43. Giardini, D.; Wössner, J.; Danciu, L. Mapping Europe’s Seismic Hazard. Eos 2014, 95, 261–262. [Google Scholar] [CrossRef] [Green Version]
  44. Toro, G.; Abrahamson, N.; Schneider, J. Letter to the editor. Seismol. Res. Lett. 1997, 68, 481–482. [Google Scholar] [CrossRef]
  45. Open Data Ricostruzione Sisma. 2016. Available online: https://sisma2016data.it/microzonazione/ (accessed on 30 November 2020).
  46. Lanzo, G.; Silvestri, F.; Costanzo, A.; D’Onofrio, A.; Martelli, L.; Pagliaroli, A.; Sica, S.; Simonelli, A. Site response studies and seismic microzoning in the Middle Aterno valley (L’aquila, Central Italy). Bull. Earthq. Eng. 2011, 9, 1417–1442. [Google Scholar] [CrossRef]
  47. Costanzo, A.; Caserta, A. Seismic response across the Tronto Valley (at Acquasanta Terme, AP, Marche) based on the geophysical monitoring of the 2016 Central Italy seismic sequence. Bull. Int. Assoc. Eng. Geol. 2019, 78, 5599–5616. [Google Scholar] [CrossRef]
  48. ISPRA Hydro-Geological Hazards. Available online: https://idrogeo.isprambiente.it/app/page/open-data (accessed on 30 November 2020).
  49. Wald, D.; Allen, T.I. Topographic Slope as a Proxy for Seismic Site Conditions and Amplification. Bull. Seismol. Soc. Am. 2007, 97, 1379–1395. [Google Scholar] [CrossRef] [Green Version]
  50. Michelini, A.; Faenza, L.; Lauciani, V.; Malagnini, L. Shakemap Implementation in Italy. Seismol. Res. Lett. 2008, 79, 688–697. [Google Scholar] [CrossRef] [Green Version]
  51. Worden, C.B.; Wald, D.J.; Sanborn, J.; Thompson, E.M. Development of an open-source hybrid global Vs30 model. In Proceedings of the Seismological Society of America Annual Meeting, Pasadena, CA, USA, 21–23 April 2015. [Google Scholar]
  52. Mori, F.; Mendicelli, A.; Moscatelli, M.; Romagnoli, G.; Peronace, E.; Naso, G. A new Vs30 map for Italy based on the seismic microzonation dataset. Eng. Geol. 2020, 275, 105745. [Google Scholar] [CrossRef]
  53. Lanzano, G.; Luzi, L.; Pacor, F.; Felicetta, C.; Puglia, R.; Sgobba, S.; D’Amico, M. A Revised Ground-Motion Prediction Model for Shallow Crustal Earthquakes in Italy. Bull. Seismol. Soc. Am. 2019, 109, 525–540. [Google Scholar] [CrossRef]
  54. Faenza, L.; Michelini, A. Regression analysis of MCS intensity and ground motion parameters in Italy and its application in ShakeMap. Geophys. J. Int. 2010, 180, 1138–1152. [Google Scholar] [CrossRef] [Green Version]
  55. Joyner, W.; Boore, D.M.; Porcella, R. Peak horizontal acceleration and velocity from strong motion records including records from the 1979 Imperial Valley, California, earthquake. Open File Rep. 1981, 71, 2011–2038. [Google Scholar] [CrossRef]
  56. Bindi, D.; Pacor, F.; Luzi, L.; Puglia, R.; Massa, M.; Ameri, G.; Paolucci, R. Ground motion prediction equations derived from the Italian strong motion database. Bull. Earthq. Eng. 2011, 9, 1899–1920. [Google Scholar] [CrossRef] [Green Version]
  57. Sieberg, A. Geologie der Erdbeben. Handbuch Geophysik 1930, 2, 552–555. [Google Scholar]
  58. Margottini, C.; Molin, D.; Serva, L. Intensity versus ground motion: A new approach using Italian data. Eng. Geol. 1992, 33, 45–58. [Google Scholar] [CrossRef]
  59. UNESCO. Convention for the Safeguarding of the Intangible Cultural Heritage. 2003. Available online: https://ich.unesco.org/en/convention#art2 (accessed on 6 May 2021).
  60. ICOMOS Climate Change and Cultural Heritage Working Group. The Future of Our Pasts: Engaging Cultural Heritage in Climate Action. 2019. Available online: https://www.icomos.org/en/77-articles-en-francais/59522-icomos-releases-future-of-our-pasts-report-to-increase-engagement-of-cultural-heritage-in-climate-action (accessed on 26 January 2021).
  61. Chiabrando, F.; Colucci, E.; Lingua, A.; Matrone, F.; Noardo, F.; Spanò, A. A European Interoperable Database (EID) to increase resilience of cultural heritage. Int. Arch. Photogramm. Remote Sens. Spat. Inf. Sci. 2018, XLII-3/W4, 151–158. [Google Scholar] [CrossRef] [Green Version]
  62. European Commission Joint Research Centre. D2.8.iii.2 INSPIRE Data Specification on Buildings—Technical Guidelines. European Commission Joint Research Centre 2013. Available online: https://inspire.ec.europa.eu/id/document/tg/bu (accessed on 26 January 2021).
  63. Despotaki, V.; Silva, V.; Lagomarsino, S.; Pavlova, I.; Torres, J. Evaluation of Seismic Risk on UNESCO Cultural Heritage sites in Europe. Int. J. Arch. Herit. 2018, 12, 1231–1244. [Google Scholar] [CrossRef]
  64. Giuffrè, A. Seismic damage in historic town centres and attenuation criteria. Ann. Geophys. 1995, 38. [Google Scholar] [CrossRef]
  65. Lagomarsino, S.; Podestà, S. Seismic vulnerability of ancient churches. Part 1: Damage assessment and emergency planning. Earthq. Spectra 2004, 20, 377–394. [Google Scholar] [CrossRef]
  66. Lagomarsino, S.; Podestà, S. Seismic vulnerability of ancient churches. Part 2: Statistical analysis of surveyed data and methods for risk analysis. Earthq. Spectra 2004, 20, 395–412. [Google Scholar] [CrossRef]
  67. D’Ayala, D.F.; Paganoni, S. Assessment and analysis of damage in L’Aquila historic city centre after 6th April 2009. Bull. Earthq. Eng. 2011, 9, 81–104. [Google Scholar] [CrossRef]
  68. Lagomarsino, S.; Cattari, S.; Ottonelli, D.; Giovinazzi, S. Earthquake damage assessment of masonry churches: Proposal for rapid and detailed forms and derivation of empirical vulnerability curves. Bull. Earthq. Eng. 2019, 17, 3327–3364. [Google Scholar] [CrossRef]
  69. Bruneau, M.; Chang, S.E.; Eguchi, R.T.; Lee, G.C.; O’Rourke, T.D.; Reinhorn, A.M.; Shinozuka, M.; Tierney, K.; Wallace, W.A.; von Winterfeldt, D. A Framework to Quantitatively Assess and Enhance the Seismic Resilience of Communities. Earthq. Spectra 2003, 19, 733–752. [Google Scholar] [CrossRef] [Green Version]
  70. Cimellaro, G.P.; Reinhorn, A.M.; Bruneau, M. Seismic resilience of a hospital system. Struct. Infrastruct. Eng. 2010, 6, 127–144. [Google Scholar] [CrossRef]
  71. Jacques, C.C.; McIntosh, J.; Giovinazzi, S.; Kirsch, T.D.; Wilson, T.; Mitrani-Reiser, J. Resilience of the Canterbury Hospital System to the 2011 Christchurch Earthquake. Earthq. Spectra 2014, 30, 533–554. [Google Scholar] [CrossRef]
  72. Shang, Q.; Guo, X.; Li, Q.; Xu, Z.; Xie, L.; Liu, C.; Li, J.; Wang, T. A benchmark city for seismic resilience assessment. Earthq. Eng. Eng. Vib. 2020, 19, 811–826. [Google Scholar] [CrossRef]
  73. Burton, H.V.; Deierlein, G.; Lallemant, D.; Singh, Y. Measuring the Impact of Enhanced Building Performance on the Seismic Resilience of a Residential Community. Earthq. Spectra 2017, 33, 1347–1367. [Google Scholar] [CrossRef]
  74. Chang, S.E.; Shinozuka, M. Measuring Improvements in the Disaster Resilience of Communities. Earthq. Spectra 2004, 20, 739–755. [Google Scholar] [CrossRef]
  75. Ellingwood, B.R.; Cutler, H.; Gardoni, P.; Peacock, W.G.; van de Lindt, J.W.; Wang, N.Y. The Centerville Virtual Community: A Fully Integrated Decision Model of Interacting Physical and Social Infrastructure Systems. Sustain. Resil. Infrastruct. 2016, 1, 95–107. [Google Scholar] [CrossRef]
  76. Miles, S.B.; Chang, S.E. Modeling Community Recovery from Earthquakes. Earthq. Spectra 2006, 22, 439–458. [Google Scholar] [CrossRef]
  77. Xiong, C.; Huang, J.; Lu, X. Framework for city-scale building seismic resilience simulation and repair scheduling with labor constraints driven by time–history analysis. Comput. Civ. Infrastruct. Eng. 2020, 35, 322–341. [Google Scholar] [CrossRef]
  78. Yodo, N.; Wang, P. Engineering Resilience Quantification and System Design Implications: A Literature Survey. J. Mech. Des. 2016, 138, 111408. [Google Scholar] [CrossRef] [Green Version]
  79. Vona, M. Proactive Actions Based on a Resilient Approach to Urban Seismic Risk Mitigation. Open Constr. Build. Technol. J. 2020, 14, 321–335. [Google Scholar] [CrossRef]
  80. Di Pietro, A.; Lavalle, L.; La Porta, L.; Pollino, M.; Tofani, A.; Rosato, V. Design of DSS for Supporting Preparedness to and Management of Anomalous Situations in Complex Scenarios. In Managing the Complexity of Critical Infrastructures, A Modelling and Simulation Approach; Setola, R., Rosato, V., Kyriakides, E., Rome, E., Eds.; Springer: Cham, Switzerland, 2016; pp. 195–232. [Google Scholar]
  81. Rome, E.; Doll, T.; Rilling, S.; Sojeva, B.; Voÿ, N.; Xie, J. The Use of What-If Analysis to Improve the Management of Crisis Situations Chapter 10. In Managing the Complexity of Critical Infrastructures, A Modelling and Simulation Approach; Setola, R., Rosato, V., Kyriakides, E., Rome, E., Eds.; Springer: Cham, Switzerland, 2016. [Google Scholar]
  82. Giovinazzi, S.; Pollino, M.; Ciarallo, F.; Rosato, V.; La Porta, L.; Di Pietro, A.; Clemente, P.; Buffarini, G. A Decision Support System for the Emergency Management of Highways in the Event of Earthquakes. In Proceedings of the ANIDIS XVIII, Ascoli Piceno, Italy, 15–19 September 2019. [Google Scholar]
  83. Giovinazzi, S.; Pollino, M.; Kongar, I.; Rossetto, T.; Caiaffa, E.; Di Pietro, A.; La Porta, L.; Rosato, V.; Tofani, A. Towards a Decision Support Tool for Assessing, Managing and Mitigating Seismic Risk of Electric Power Networks. In Computational Science and Its Applications—ICCSA 2017; Lecture Notes in Computer Science, Part III, LNCS 10406; Springer International Publishing: Cham, Switzerland, 2017; pp. 399–414. [Google Scholar]
  84. D’Agostino, G.; Di Pietro, A.; Giovinazzi, S.; La Porta, L.; Pollino, M.; Rosato, V.; Tofani, A. Earthquake Simulation on Urban Areas: Improving Contingency Plans by Damage Assessment. In Critical Information Infrastructures Security. CRITIS 2018; Luiijf, E., ZÃåutautaiteÃá, I., HaÃàmmerli, B., Eds.; Lecture Notes in Computer Science; Springer: Cham, Switzerland, 2019; Volume 11260, pp. 72–83. [Google Scholar]
  85. Giovinazzi, S.; Di Pietro, A.; Mei, M.; Pollino, M.; Rosato, V. Protection of Critical Infrastructure in the Event of Earthquakes: CIPCast-ES. In Proceedings of the XVII ANIDIS Conference, Pistoia, Italy, 17–21 September 2017; pp. 62–70. [Google Scholar]
  86. Dolce, M.; Nicoletti, M.; De Sortis, A.; Marchesini, S.; Spina, D.; Talanas, F. Osservatorio sismico delle strutture: The Italian structural seismic monitoring network. Bull. Earthq. Eng. 2015, 15, 621–641. [Google Scholar] [CrossRef] [Green Version]
  87. D’Alessandro, A.; Costanzo, A.; Ladina, C.; Buongiorno, F.; Cattaneo, M.; Falcone, S.; La Piana, C.; Marzorati, S.; Scudero, S.; Vitale, G.; et al. Urban Seismic Networks, Structural Health and Cultural Heritage Monitoring: The National Earthquakes Observatory (INGV, Italy) Experience. Front. Built Environ. 2019, 5. [Google Scholar] [CrossRef] [Green Version]
  88. Giovinazzi, S.; Abeling, S.; Galvez, F.; Vallis, S.; Goded, T.; Horspool, N.; Calandra, E.; Ingham, J. Fostering the Resilience of Heritage Buildings in New Zealand: Potentialities of Decision Support Systems. In Proceedings of the 16th European Conference on Earthquake Engineering, Thessaloniki, Greece, 18–21 June 2018. [Google Scholar]
  89. Mazzoni, S.; Castori, G.; Galasso, C.; Calvi, P.; Dreyer, R.; Fischer, E.; Fulco, A.; Sorrentino, L.; Wilson, J.; Penna, A.; et al. 2016–2017 Central Italy Earthquake Sequence: Seismic Retrofit Policy and Effectiveness. Earthq. Spectra 2018, 34, 1671–1691. [Google Scholar] [CrossRef]
  90. Cescatti, E.; Salzano, P.; Casapulla, C.; Ceroni, F.; Da Porto, F.; Prota, A. Damages to masonry churches after 2016–2017 Central Italy seismic sequence and definition of fragility curves. Bull. Earthq. Eng. 2020, 18, 297–329. [Google Scholar] [CrossRef]
  91. Crowley, H.; Despotaki, V.; Rodrigues, D.; Silva, V.; Toma-Danila, D.; Riga, E.; Karatzetzou, A.; Fotopoulou, S.; Zugic, Z.; Sousa, L.; et al. Exposure model for European seismic risk assessment. Earthq. Spectra 2020, 36, 252–273. [Google Scholar] [CrossRef]
  92. JRC. European Commission Guidance for Recording and Sharing Disaster Damage and Loss Data. Towards the Development of Operational Indicators to Translate the Sendai Framework into Action. EU Expert Working Group on Disaster Damage and Loss Data. 2015. Available online: https://publications.jrc.ec.europa.eu/repository/handle/JRC95505 (accessed on 26 January 2021).
  93. Rebollo, V.; Latinos, V.; Balenciaga, I.; Roca, R. ARCH D7.2 Mapping and Characterisation of Good Practices in Cultural Heritage Resilience. ARCH H2020 Project GA No. 820999. Available online: https://savingculturalheritage.eu/resources/deliverables (accessed on 15 September 2020).
  94. Lückerath, D.; Streberova, E.; Bogen, M.; Rome, E.; Ullrich, O.; Pauditsova, E. Climate Change Impact and Vulnerability Analysis in the City of Bratislava: Application and Lessons Learned. In Critical Information Infrastructures Security. CRITIS 2019; Nadjm-Tehrani, S., Ed.; Lecture Notes in Computer Science; Springer: Cham, Switzerland, 2019; Volume 11, pp. 83–94. [Google Scholar]
  95. United Nations Office for Disaster Risk Reduction: Disaster Resilience Scorecard for Cities. 2017. Available online: https://www.undrr.org/publication/disaster-resilience-scorecard-cities (accessed on 6 May 2021).
  96. UNDRR; ARISE. Disaster Resilience Scorecard for Industrial and Commercial Buildings. For Use by Building Owners, Operators and Managers. Available online: https://www.preventionweb.net/publications/view/69845 (accessed on 14 September 2020).
  97. European Climate Adaptation Platform Climate—ADAPT. Partnership between the European Commission and European Environment Agency. Available online: https://climate-adapt.eea.europa.eu/knowledge/tools/urban-ast (accessed on 15 September 2020).
  98. Dembski, F.; Wössner, U.; Letzgus, M.; Ruddat, M.; Yamu, C. Urban Digital Twins for Smart Cities and Citizens: The Case Study of Herrenberg, Germany. Sustainability 2020, 12, 2307. [Google Scholar] [CrossRef] [Green Version]
Figure 1. ARCH DSS integrated evaluation tool to support the assessment of earthquake-induced damage and impacts on HAs’ functions for monitoring resilience.
Ijgi 10 00461 g001
Figure 2. Assessment and representation of earthquake-induced physical damage in ARCH DSS.
Ijgi 10 00461 g002
Figure 3. Example of factors that influence the intensity and extent of ground motion generated by an earthquake: (1) position of the hypocenter (or of the epicenter, i.e., hypocenter projection on the surface); (2) distance between earthquake source and site of interest (e.g., points A, B, C, D in the picture); (3) local site conditions (soil type profile and morphology).
Ijgi 10 00461 g003
Figure 5. Examples of time–resilience, t-R, plots showcasing the use of the proposed resilience metrics RO, RRi, and RA.
Ijgi 10 00461 g005
Figure 6. ARCH WebGIS DSS software architecture conceived as a multi-tier architecture including 4 layers: presentation, service, middleware, and persistence.
Ijgi 10 00461 g006
Figure 7. ARCH DSS screenshot representing data from geodatabases of: seismogenic sources; MW > 3 earthquake events; INGV ground shaking map of the 26th October 2016 “Castel Sant’Angelo sul Nera” Mw = 5.4 earthquake.
Ijgi 10 00461 g007
Figure 8. Ground-shaking map for the Visso Earthquake (PGA in [%g]) simulated using the ARCH DSS (26 October 2016, Mw = 5.9, Lat 42,91 N, Long 13,13 E).
Ijgi 10 00461 g008
Figure 9. Assessed damages for the CH of Camerino HA after Visso Earthquake (26 October 2016, Mw = 5.9).
Ijgi 10 00461 g009
Figure 10. ARCH DSS exposure GUI showcasing the different types of CH in Camerino HA and pictures of the two iconic churches, i.e., San Venanzio and Santa Maria in Via.
Ijgi 10 00461 g010
Table 1. Attribution of damage levels Dk (k = 0–5) based on μD ranges resulting from Equation (2).
DkDamage LevelsμD Ranges
D0No damage0 ≤ μD < 0.5
D1Slight damage, cracking of non-structural elements0.5 ≤ μD < 1
D2Moderate damage, major damage to non-structural elements minor damage to load bearing ones1 ≤ μD < 2
D3Heavy damage, significant damage to load bearing elements2 ≤ μD < 3
D4Very heavy damage, partial structural collapse3 ≤ μD < 4
D5Destruction, serious destruction of structural and non-structural elements or total collapse4 ≤ μD ≤ 5
Table 2. ARCH Classification for CH included in HAs: Categories; Types and Examples.
CH CategoriesCH TypesCH Examples
Moveable heritageWorks of monumental sculpture and painting Paintings, sculptures, furniture, wall paints
Archaeological resourcesArchaeological finds Pottery, artefacts, inscriptions
Archaeological materials Bones, textiles, ceramic
Archaeological sites Tombs, caves
Archaeological monuments Sacred places, temples, burial sites
Stratigraphic elementsStratigraphic tests and finds
Buildings and structuresArchitecture (historic and monumental buildings)Castles, theatres, churches, cathedrals *
Groups of separate or connected buildings Streets, warehouse complexes, harbours
Historical nuclei Historic centres of towns and cities
Cultural landscapesParks/gardensParks, cemeteries, botanical gardens
Combined works of nature and humankindAgricultural landscapes, mining landscapes
Associated and traditional communitiesTraditional groups, communities and individualsIndigenous peoples
Intangible heritageOral traditions and expressionsProverbs, poems, tales
Performing arts Theatre, music, dances
Social practices, rituals, festive eventsFestivals, religious rituals, ceremonies
Traditional craftsmanship (knowledge and skills)Crafts, traditional agricultural techniques, masonry
Knowledge and practices concerning nature and universe Traditional ecological wisdom, traditional healing systems
* Further examples area provided in Table 3.
Table 3. Typological vulnerability V and ductility Q indexes for ARCH building and structures.
Building and StructuresV0QBuilding and StructuresV0Q
Arch bridges0.462.3Towers0.782.0
Castles0.542.0Triliths0.583.0
Churches0.893.0Triumphal arches0.582.6
Columns0.743.0Canopy0.462.0
Monasteries0.742.3Chapel0.623.0
Mosques0.812.6Lighthouse0.743.0
Obelisks0.743.0Stadium0.542.0
Palaces0.622.3Synagogue0.812.6
Temples0.622.3Storage Tanks0.743.0
Table 4. Values of vulnerability index modifiers Vk to be applied at both single and aggregated buildings and Vk peculiar for aggregated building only.
Vulnerability Factor Vk
Both isolated and aggregated/connected buildings
State of MaintenanceVery bad
+0.08
Bad
+0.04
Medium
0
Good
−0.04
Quality of Materials Bad
+0.04
Medium
0
Good
−0.04
Planimetric
Configuration
Irregular
+0.04
Regular
0
Symmetrical
−0.04
Elevation Configuration Irregular
+0.02
Regular
−0.02
Interventions on
structural system
Disruptive 1
+0.08
Effective retrofitting
−0.08
Anti-seismic vernacular devices Effective devices 2
−0.08
Site morphologyRidge
+0.08
Slope
+0.04
Flat
0
For aggregated/connected buildings only
Position of the building in the aggregateHeader
+0.06
Corner
+0.04
Isolated
0
Included
−0.04
Height difference with adjacent buildingsHigher on both sides
+0.04
Higher on one side
+0.02
Lower on both sides
−0.02
Lower on one
side
−0.04
Discontinuity between adjacent buildingTypological discontinuity
+0.03
Staggered floors
+0.02
Anti-seismic vernacular in aggregated context Effective devices 3
−0.04
1 Examples of disruptive interventions on buildings might include superimposed floor, partial or total demolition of internal/external bearing walls, structural discontinuity caused by enlargement or creation of a new opening, addition of building annexes, and merging of a portion of adjacent buildings. 2 Example of effective anti-seismic vernacular devices might include tie-roads, effective connections between perpendicular walls and between walls and horizontal floor, buttresses as well as connecting elements (headers) in multi-leaf masonry walls [64]. 3 Example of effective anti-seismic vernacular devices in an aggregated context might include counter thrust arches.
Table 5. Activities and services identified as essential to maintain the functionality of HAs and the well-being and economies of local communities (adapted from Agenda|Culture 2030).
Social-Cohesion ActivitiesIdentity-Building Activities
movie/cinema/film festival national or local festival participation
theatre representation or dance show celebrations of cultural/historic events
live musical performance community rites/events/ceremonies
historical/cultural park or a heritage site amateur cultural practices, community practices *
museum, an art gallery or a crafts exposition membership of cultural associations
* of youth culture, popular culture, ethnic culture, etc.
Table 6. Possible correlation between earthquake-induced physical Damage level, residual building usability and downtime, and long-term impact on intangible heritage attribute.
DkImpact on Building UsabilityDowntime Impact to Intangible Heritage Attributes 1
D5No longer usableN/AHighly significant/total Loss
D4Non usable long termWithin years to decadesVery Significant Loss
D3Non usable long termWithin month to a yearSignificant Loss
D2Temporally non usable for inspections and proppingWithin weeks to monthsPartial/Moderate loss in heritage value
D1Temporally non usable for inspectionsWithin days to weeksMinor loss in heritage value
D0Usable Immediate to daysNo loss in heritage values
1 Adopted in ARCH from the STORM project (http://www.storm-project.eu/, accessed on 12 May 2021).
Table 7. 10 level resilience scale from 0 to 1 proposed to attribute a resilience class as a function of the values resulting from the resilience metrics R, RO, and RA.
Resilience ClassA4A3A2A1BCDEFG
R, RO, Ri, RA0–0.10.1–0.20.2–0.30.3–0.40.4–0.50.5–0.60.6–0.70.7–0.80.8–0.90.9–1
Table 8. Number of buildings and structures damaged at different damage levels Dk(k = 0–5) of the EMS-98 damage scale resulting from the ARCH DSS simulation of the Visso earthquake.
D0D1D2D3D4D5Total
churches115206369128790897
palaces5736355200693
towers7051252150172
chapel12000000120
arch bridges674000071
castles571100059
monasteries186330030
Publisher’s Note: MDPI stays neutral with regard to jurisdictional claims in published maps and institutional affiliations.

