Article

Effects of Climate and Land Use/Land Cover Changes on Water Yield Services in the Dongjiang Lake Basin

1
Key Laboratory of Forestry Remote Sensing Based Big Data & Ecological Security for Hunan Province, Central South University of Forestry and Technology, Changsha 410004, China
2
Hunan City University Design and Research Institute Co., LTD, Changsha 410028, China
3
Hunan Urban and Rural Ecological Planning and Restoration Engineering Research Center, Changsha 410028, China
4
Laboratory of Key Technologies of Digital Urban-Rural Spatial Planning of Hunan Province, College of Architecture & Urban Planning, Hunan City University, Yiyang 413000, China
5
School of Business, Hunan Agricultural University, Changsha 410128, China
6
Key Laboratory of Agro-Ecological Processes in Subtropical Region, Institute of Subtropical Agriculture, Chinese Academy of Sciences, Changsha 410125, China
7
Dongting Lake Station for Wetland Ecosystem Research, Institute of Subtropical Agriculture, Chinese Academy of Sciences, Changsha 410125, China
*
Author to whom correspondence should be addressed.
ISPRS Int. J. Geo-Inf. 2021, 10(7), 466; https://0-doi-org.brum.beds.ac.uk/10.3390/ijgi10070466
Submission received: 7 May 2021 / Revised: 22 June 2021 / Accepted: 4 July 2021 / Published: 7 July 2021

Abstract

:
Spatial and quantitative assessments of water yield services in watershed ecosystems are necessary for water resource management and improved water ecological protection. In this study, we used the InVEST model to estimate regional water yield in the Dongjiang Lake Basin in China. Moreover, we designed six scenarios to explore the impacts of climate and land use/land cover (LULC) changes on regional water yield and quantitatively determined the dominant mechanisms of water yield services. The results are expected to provide an important theoretical reference for future spatial planning and improvements of ecological service functions at the water source site. We found that (1) under the time series analysis, the water yield changes of the Dongjiang Lake Basin showed an initial decrease followed by an increase. Spatially, water yield also decreased from the lake area to the surrounding region. (2) Climate change exerted a more significant impact on water yield changes, contributing more than 98.26% to the water yield variability in the basin. In contrast, LULC had a much smaller influence, contributing only 1.74 %. (3) The spatial distribution pattern of water yield services in the watershed was more vulnerable to LULC changes. In particular, the expansion of built-up land is expected to increase the depth of regional water yield and alter its distribution, but it also increases the risk of waterlogging. Therefore, future development in the basin must consider the protection of ecological spaces and maintain the stability of the regional water yield function.

1. Introduction

Ecosystem services are the basis for human survival and development and are closely related to human well-being [1]. The implementation of the Millennium Ecosystem Services Assessment developed and improved the research on ecosystem services. These studies identified a two-thirds decline in ecosystem services over the past 50 years, which likely had a significant negative impact on human well-being [2]. As an important ecosystem service function, water yield services play a critical role in the sustainable development of regional economies and ecosystems; however, the anthropogenic demand for water resources has increased rapidly in response to rapid economic development and urbanization. In addition to the uneven distribution of water resources, imbalances between water resource supply and demand are becoming increasingly prominent [3]. Moreover, climate anomalies caused by global climate change and water pollution have enhanced water shortage problems to varying degrees in certain regions [4,5]. It is, therefore, necessary to study the factors influencing ecosystem water yield services, as water shortages directly affect human survival and development [6,7].
There is currently no accepted definition of ecosystem water yield services in academia, and many studies show conceptual confusion with regards to water yield, water supply, and water conservation. Generally, water yield is defined as the rainfall amount minus actual evapotranspiration [8,9]. Water supply is the quantification of water supply services, which can be divided into a broad and narrow sense: in the broad sense, the water supply is considered the water yield [10,11], and in the narrow sense, the water supply is the availability of effective water sources to meet specific demands (i.e., by subtracting water yield from water consumption for a specific demand) [12]. Water conservation is the quantification of the water conservation function; it is related to the forest ecosystem through the interception of precipitation by the canopy, water absorption by the litter layer, and precipitation retained in the soil layer to redistribute rainfall, regulate runoff, and improve water quality [13]. Some studies have directly used water yield to characterize water conservation, while others have used related parameters to modify water yield and obtain a measure of water conservation [14,15]. Water supply and conservation are integrated concepts, and water yield is the basis for both. This study mainly uses water supply services in the broad sense—i.e., water yield, which is also referred to as water yield depth.
The water yield is mainly affected by the combined effects of climate and land use/land cover (LULC) changes [8,16]. Climate change alters precipitation and evapotranspiration (solar radiation, temperature, and precipitation) in watersheds [17], which alters the regional water cycle, infiltration processes, water holding model, and thus water yield [18]. Recent research has investigated this process. For example, Zhan et al. (2011) estimated the number of water resources upstream of the Miyun Reservoir and found that land-use change was the main driver of water yield changes in the region [19]; Pessacg et al. (2015) assessed the water yield in various precipitation data and found that precipitation changes are likely to cause significant location and magnitude differences in water yield [20]; Gao et al. (2017) assessed the influence of land-use change on water-related ecosystem services and found that ongoing expansion of built-land is likely to increase water yield. These researchers have conducted in-depth analyses of climate and LULC changes on regional water yield [21]. However, most studies have only focused on the influence of a single factor, and few have quantitatively assessed the degree of influence of two different factors on regional water yield. Notably, the InVEST (Integrated Valuation of Ecosystem Services and Tradeoffs) model, a tool with open-source and strong spatial ability, has been used widely in ecosystem service evaluation and provides important technical support for the research into water yield service. Compared to the other models, the InVEST model has more sample and convenient calculation with fewer data requirements and can effectively reveal the response law of ecosystem service and provide a scientific basis for ecological management and ecological protection planning [22,23]. However, most of the studies related to the InVEST model were conducted for administrative divisions or on river scales, and research on the water yield services at the water head site is relatively rare.
The Dongjiang Lake Basin is an important water resource site in Hunan Province in China. The basin is a key watershed and a site for ecological compensation pilot projects for water resources in China. Dongjiang Lake is the largest reservoir in Hunan Province, supplying rare, high-quality water to its inhabitants. As the second water source for the Changsha-Zhuzhou-Xiangtan Urban Agglomeration in China, the Dongjiang Lake Basin has benefited 13 million people in 13 counties (cities), including Changsha, Zhuzhou, Xiangtan, Hengyang, and Chenzhou. Thus, the stability of the water supply service function in this watershed is essential for regional, social, and economic development. Existing studies only focus on the monitoring of changes in water quality and water storage in the reservoir region and exploring the ecological compensation mechanisms based on them [24,25,26,27,28,29] but lack in-depth investigation of the driving mechanism of the watershed water yield changes.
This study attempted to use the water yield module of the InVEST model to estimate the water yield service of the Dongjiang Lake Basin. Moreover, six scenarios were designed to quantitatively explore the impact of climate and LULC changes on the water yield of the watershed. The results are expected to provide an important theoretical reference for the ecological management and protection of water source sites, as well as the planning and utilization of water resources.

2. Materials and Methods

2.1. Study Area

The Dongjiang Lake Basin (113°13′26″E–114°3′00″E, 25°20′51″N–26°10′30″N) mainly refers to the catchment area of rivers flowing into Dongjiang Lake. The region is located in the southern part of Chenzhou city, Hunan, China, and covers 4851.04 km2 (Figure 1). The terrain is high in the east and low in the west, with elevations ranging from 180 to 1691 m above sea level. The basin has a typical subtropical monsoon humid climate, with warm and humid summers and cold and dry winters. The average annual precipitation is 1645 mm, and the annual mean temperature ranges from 13.7 to 18.7 °C. The Dongjiang Lake Reservoir was constructed in the 1970s. When the normal impounded level was 285 m, the water surface area was 160 km2, the water storage was 8.12 billion m3, and the effective storage capacity was 5.67 billion m3. The reservoir is also a downstream source of industrial, agricultural, and domestic water. Since 2000, Dongjiang Lake has replenished the water of the Xiangjiang River almost every year. In particular, the water supply reached 2.25 × 10⁹ m3, 846 × 109 m3, 900 × 109 m3, and 12.9 × 10⁹ m3 during the arid years of 2003, 2008, 2009, and 2017, respectively. Moreover, the heavy metal concentration in the Zhuzhou, Xiangtan, and Hengyang sections of the Xiangjiang River often exceeds the standard values; these sections are also diluted by Dongjiang Lake sluicing to avoid water shortages in the downstream city. Therefore, the stability of the water supply service in the Dongjiang Lake Basin is critical for maintaining the normal ecological function of the entire Xiangjiang River Basin.

2.2. Data Source

The data used in this study include LULC data, meteorological data, soil data, digital elevation data, etc., as shown in Table 1.

2.3. Methods

2.3.1. Estimation Model for Water Yield

In fact, the InVEST model has been applied maturely in water ecosystem services [22,30,31], and this study used the water yield module of InVEST3.9.0 to simulate the water yield and its spatial distribution pattern in the Dongjiang Lake Basin. The model was based on Budyko’s assumptions: the watershed water storage variables on the multi-year average scale are neglected, simplifying the confluence process, and there is no distinction between surface runoff, soil runoff, and base flow. The specific principles can be found in the InVEST2.3.0 practical manual [18], and the related equations are shown as follows.
Y x j = ( 1 A E T x j P x ) × P x
A E T x j P x = 1 + ω x R x j 1 + ω x R x j + 1 R x j
R x j = k × E T o P x
ω x = Z A W C x P x
A W C x = M I N ( M a x   s o i l   D e p t h x , R o o t   D e p t h x ) × P A W C x
In Equations (1)–(5): Yxj is the average annual water yield on pixel x for land cover type j; Px is the average annual precipitation on pixel x; AETxj is the average annual actual evapotranspiration on pixel x for land cover type j; ωx is a dimensionless non-physical parameter that revises the ratio of plant available water to expected precipitation on pixel x; Rxj is the Budyko aridity index on pixel x for land cover type j; k (or ETk) is a crop factor based on the ratio between evapotranspiration ET and reference evapotranspiration ETo for crops in various developmental phases; Z is the Zhang coefficient (seasonality factor), which should be adjusted based on the simulation results of water yield and the annual runoff observations in model validation; AWCx is the volumetric plant available water content on pixel x; Max Soil Depthx is the maximum soil depth on pixel x; Root Depthx is the root depth on pixel x; and PAWCx is the plant available water capacity on pixel x.

2.3.2. CA-Markov Model

The CA–Markov model is the coupling of the cellular automaton (CA) and Markov models. The Markov model reflects the transformation of LULC by obtaining the initial probability and transfer probability based on the Markov chain. As a result, it can be used to predict trends in the number of future land types [32]. CA is a type of statistical dynamic model based on conversion rules to simulate complex spatial–temporal evolutions and has a strong complex spatial prediction ability, which can be applied in both raster and vector data [32,33,34]. This combination has been extensively utilized in relevant research and can improve the accuracy or strengthen the simulation of spatial changes in LULC patterns [35,36]. Therefore, we selected the CA–Markov model to simulate and predict the LULC patterns in 2030, and the process was mainly completed by the CA–Markov module of IDRISI Selva 17.0. In this process, this study combined LULC data from 2000 and 2010 with DEM and road data to build the transition suitability image collection (i.e., DEM, slope, and distance from National Road, Provincial Road, County Road) and conducted 10 iterations to simulate the LULC pattern in 2020 with the 5 × 5 cellular filter (1km cellular size). Finally, the validation accuracy of the simulated data was conducted with the obtained data in 2020. The kappa coefficient was 0.859, indicating that the model was suitable for the Dongjiang Lake Basin.
Meanwhile, based on the LULC of 2020, considering the two main development demands of the Dongjiang Lake basin in the future—tourism development and water source protection [37,38], we used the CA–Markov model to simulate the LULC pattern in 2030 through the two scenarios. (1) Natural development scenarios. The Dongjiang Lake basin continued to develop based on the past tourism conditions (e.g., the terrain and traffic factors), so we made no restrictions on the conversion between LULC, only simulating the LULC pattern in 2030 with the suitability image collection. (2) Ecological protection development scenario. As a key regional water source, the woodland, grassland, and water bodies in the basin need to be protected seriously. Thus, when simulating the ecological protection scenario, we restricted the conversion of woodland, grassland, water into farmland and built-up land, respectively, based on the original suitability image collection. Finally, we explored the impacts of LULC changes on the distribution of water yield through the two future scenarios.

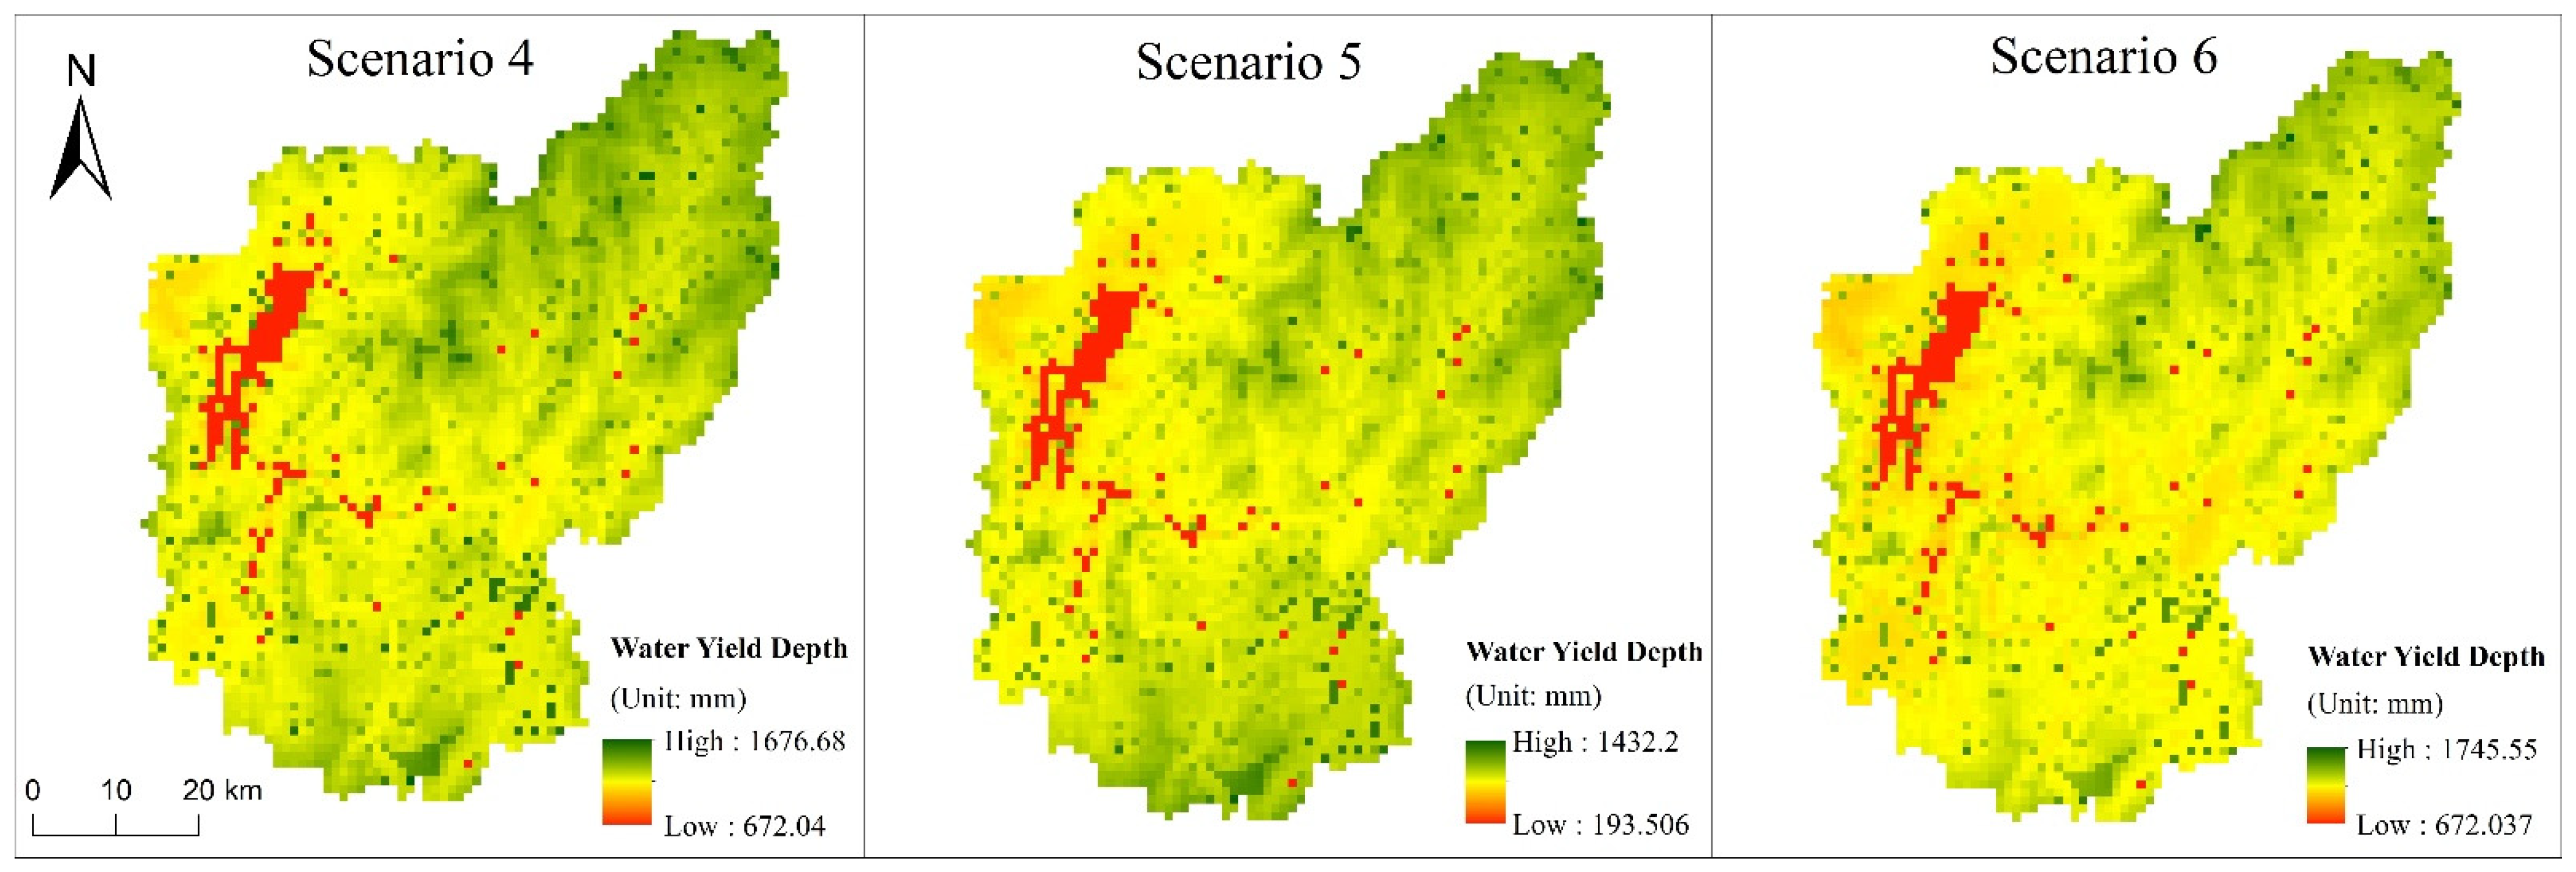
2.3.3. Scenario Settings

This study designed six scenarios to quantitatively study and characterize the impacts of climate and LULC changes on water yield, as shown in Table 2. Moreover, as the Dongjiang Lake Basin is located in a mountainous region and the LULC changes were smaller in a short time interval, we conducted a comparative study at 10-year intervals to reflect differences in the temporal changes of climate and LULC. For the real scenario, the climate data corresponded to the LULC data in Dongjiang Lake in 2000, 2010, and 2020, respectively. For the climate change scenarios, the LULC was set to no change to determine the impacts of climate change on ecosystem water yield services. For the LULC change scenarios, climate elements remained unchanged to determine the impacts of LULC changes on ecosystem water yield services. Finally, to conduct a comparative analysis, the study period was divided into three periods: 2000–2010, 2010–2020, and 2000–2020.
According to the water yield changes under the different scenarios, the contribution of climate and LULC changes to ecosystem water yield services can be quantified by the following formulas:
R C = C C + L × 100
R L = L C + L × 100
In Equations (6) and (7): RC refers to the contribution of climate change to ecosystem water yield services; RL refers to the contribution of LULC changes to ecosystem water yield services; C is the changes in water yield in a climate change scenario; L is the changes in water yield in the LULC change scenario.

2.4. Data Processing

The input variables for the InVEST water yield module included LULC, precipitation, reference evapotranspiration, plant-available water fraction, depth-to-root restricting layer, and the biophysical parameter table. The data were processed as follows: DEM and LULC data were resampled to 1 km by ArcGIS10.4 (Nearest Neighbor Assignment Method) over five periods (2000, 2005, 2010, 2015, 2020). Precipitation data for 2000, 2005, and 2010 were obtained by averaging from 1 km raster precipitation data for 1999–2001, 2004–2006, and 2009–2011, respectively, to correspond with the LULC data time and avoid the low representation of single-year data while considering the impact of extreme climate change in certain years. The precipitation data for 2015 and 2020 derived from the national meteorological station data for 2014–2016 and 2018–2020, respectively, were processed into 1 km raster data after ANUSPLIN spatial interpolation (The software was mainly based on thin-plate smoothing splines for multivariable spatial interpolation, widely used in meteorological data spatial interpolation [8,9].) and averaging (arithmetic mean value). The plant-available water fraction was calculated using the empirical formula proposed by Zhou et al. (2005) [39] and was then processed into 1 km raster data using ArcGIS10.4. Using the corrected FAO-56 Penman–Monteith formula on the daily meteorological data [40] and the multi-year average and ANUSPLIN spatial interpolation, reference crop evapotranspiration was processed into 1 km raster data. The depth of the root-restricting layer was approximately replaced by soil reference depth. The biophysical parameter table reflected the attributes of the LULC type, including LULC coding, maximum root depth, and evapotranspiration coefficient. Maximum root depth refers to the maximum root depth of a vegetation-covered land-use type derived from the InVEST model description document [18]. The evapotranspiration coefficient of each LULC type was based on the Food and Agriculture Organization (FAO) evapotranspiration coefficient reference value (Table 3).

2.5. The Determination of the Seasonal Factor (Z)

Having determined other parameters, we calibrated the model by adjusting the seasonal factor (Z) within the range of 1 to 30. According to the principle of water balance, the difference between precipitation and actual evapotranspiration is equal to the sum of soil water storage and surface runoff, while the measurement of soil water content is complicated and of low precision; therefore, the variation of soil water storage on the annual average scale could be negligible. Moreover, referring to related research results and the Dongjiang reservoir inflow data [25,26,27,28,29], the actual surface runoff depth (1297.74mm)at a multi-year average scale could be calculated from the results of Xu et al. (2016 and 2017). Based on this, we conducted many calculations to make the scatter diagram between the mean of water yield depth over five periods and the seasonal factor (Z) (Figure 2). Finally, through the linear equation of the scatter, combined with the actual surface runoff on the multi-year average scale obtained above, the Z value was finally determined as 1.58.

3. Results and Analysis

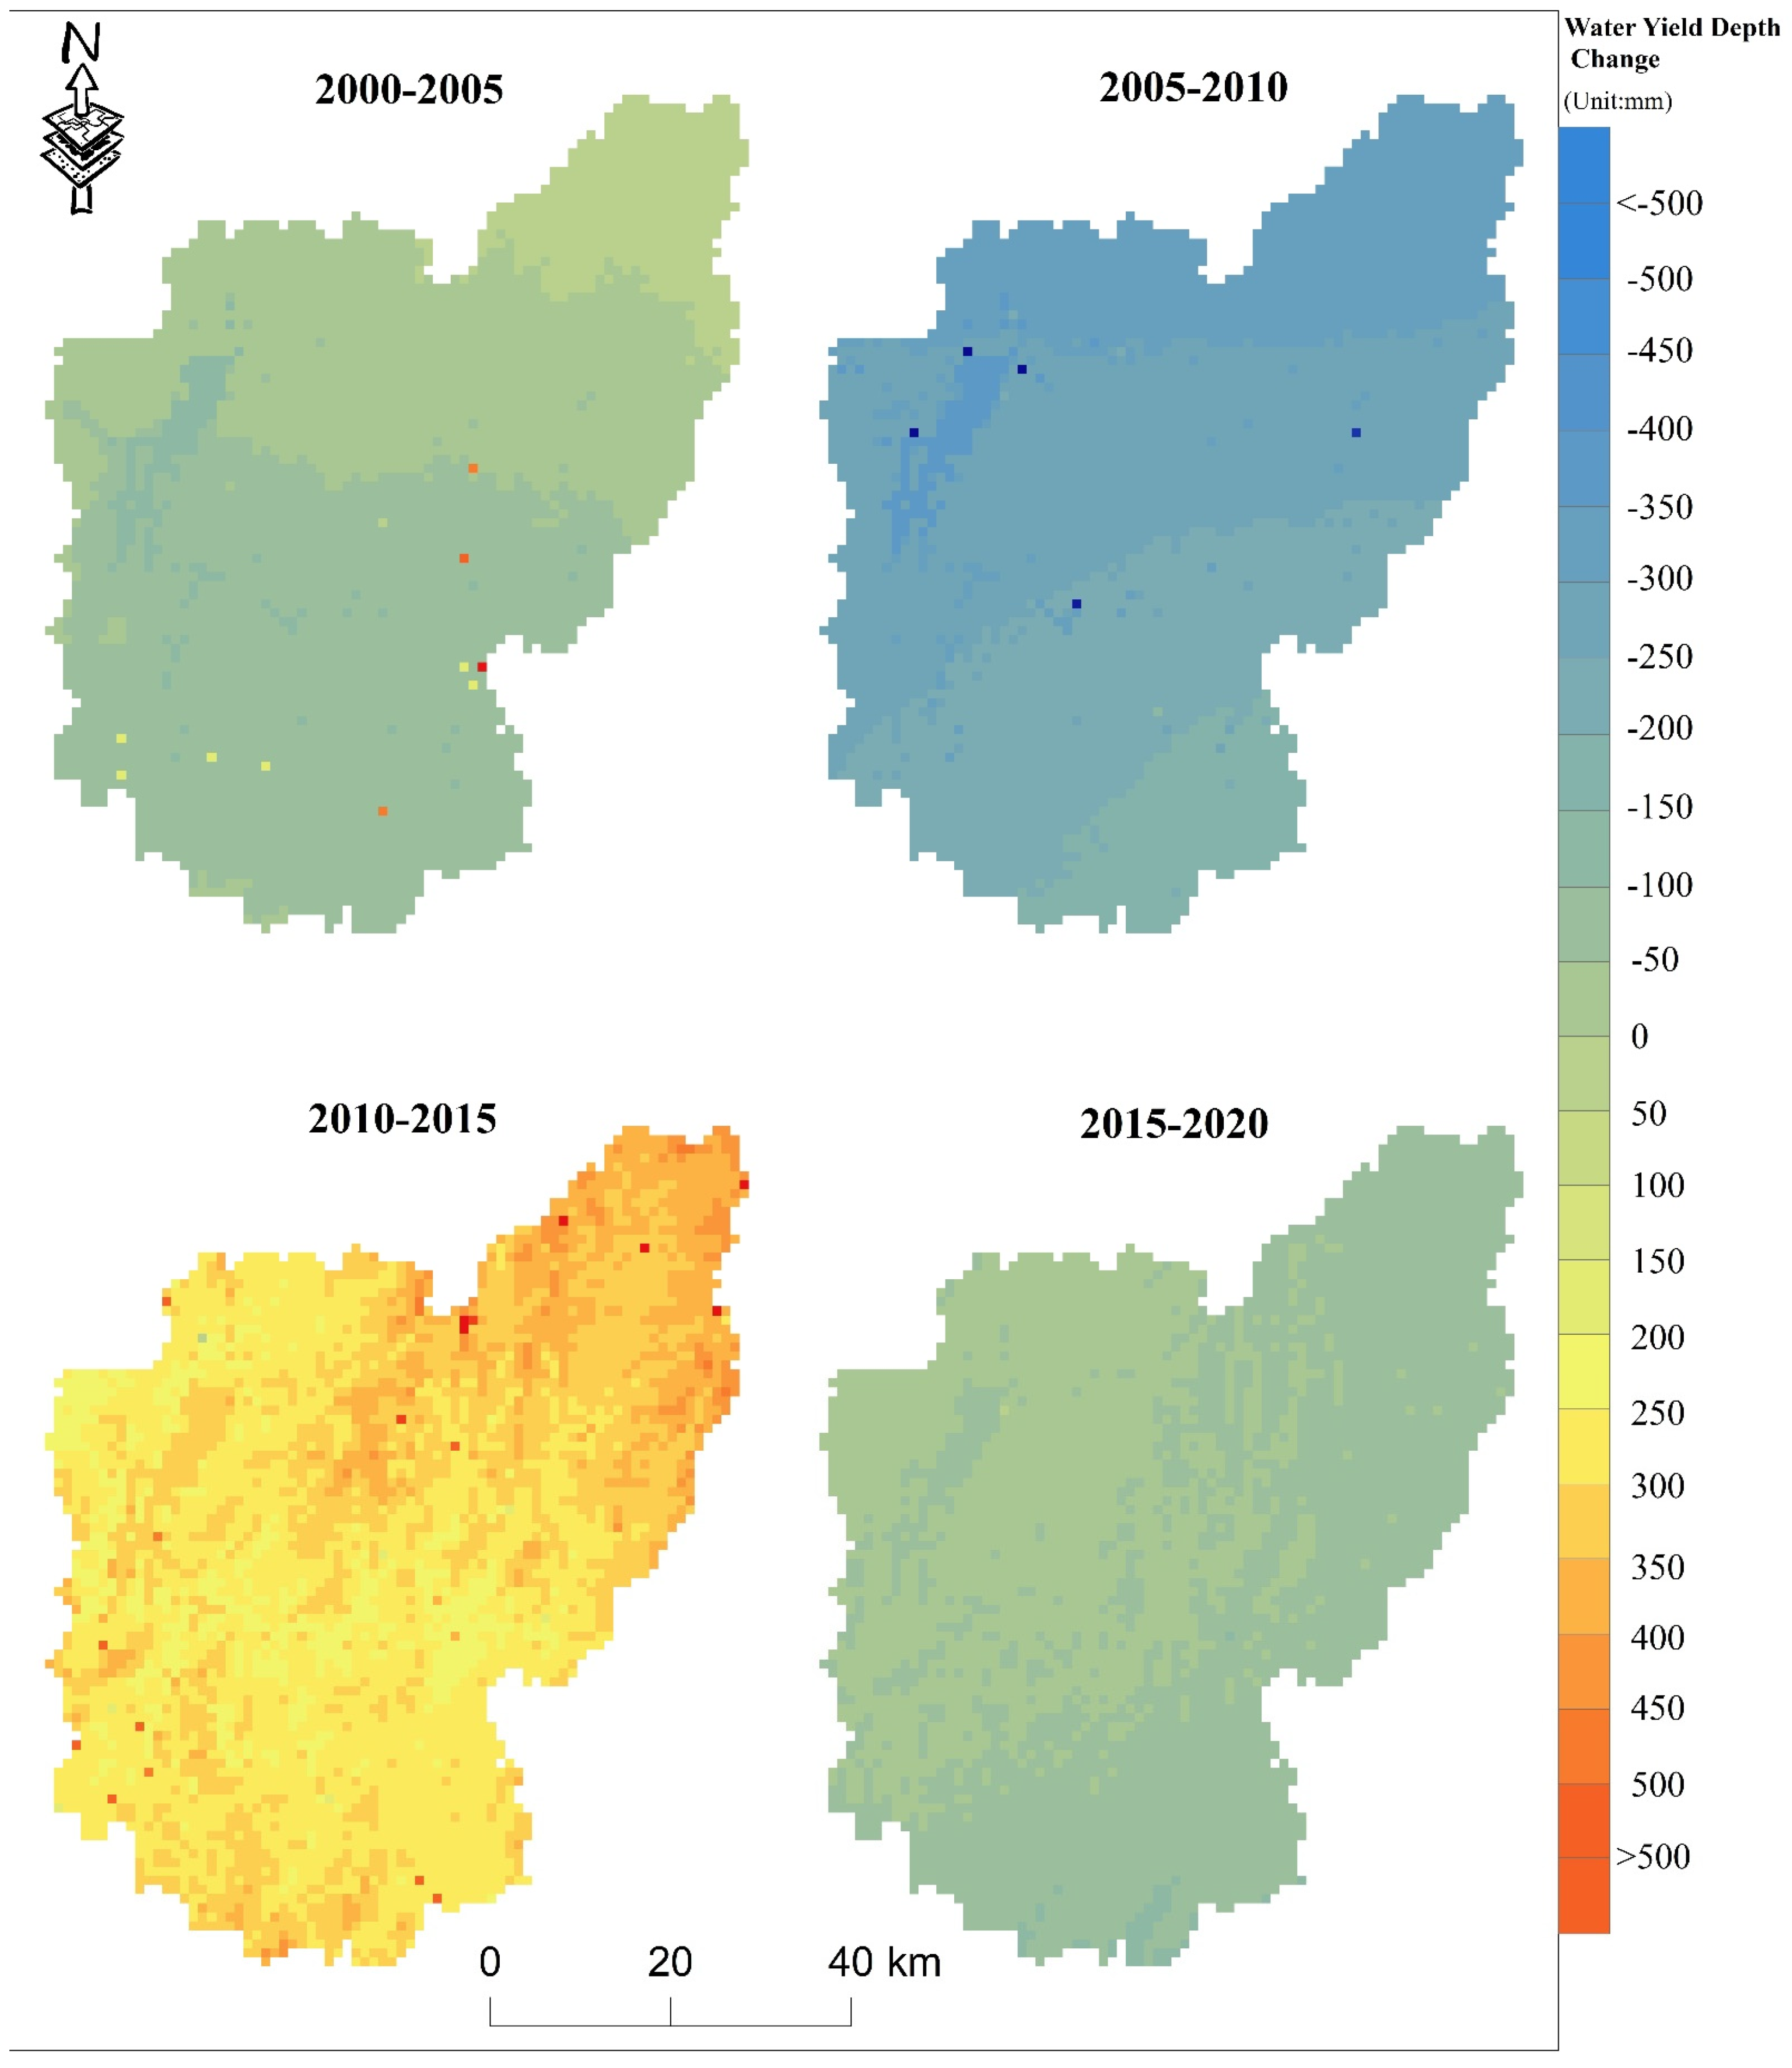
3.1. Temporal and Spatial Variation of Water Yield in the Dongjiang Lake Basin

For the temporal changes, the trend in water yield in the Dongjiang Lake Basin during 2000–2020 showed an initial decrease followed by an increase (as shown in Figure 3). The average water yield depth was between 1000 and 1400 mm, and the total water yield was between 4.65 × 10⁹ and 6.5 × 10⁹ m3; the highest water yield occurred in 2000 (6.48 × 10⁹ m3), and the lowest in 2010 (5.02 × 10⁹ m3). In terms of water balance, precipitation and evaporation are the key factors determining water yield in ecosystems. Moreover, precipitation is an important variable of climate change, and actual evapotranspiration is affected by both climate (radiation, temperature, humidity, and wind speed) and underlying surface cover. As shown in Figure 3, the change in average precipitation throughout the time series was consistent with that of water yield, showing an initial decrease followed by an increase: the highest precipitation occurred in 2000 (1733.42 mm), and the lowest in 2010 (1418.84 mm). Moreover, both potential evaporation and actual evaporation showed considerable high fluctuation, but their multi-year differences were not significant and were maintained close to 900 mm and 340 mm, respectively.
The spatial pattern of annual water yield in the Dongjiang Lake Basin was consistent (as shown in Figure 4), increasing from the lake area to the surrounding region. The lowest value occurred in the lake area, with an annual water yield of between 190 and 700 mm. The highest value occurred in the northeast area, with an annual water supply of between 1400 and 1900 mm. In this study, the InVEST model mainly used the difference between precipitation and actual evaporation to calculate water yield, and the spatial distribution of precipitation interpolation showed increasing precipitation from the lake area to the surrounding region. The lake area was, therefore, a low-value precipitation zone. Due to the storage capacity of Dongjiang Lake, the initial water content of the underlying surface of the water body was saturated, and the rain infiltration capacity was therefore limited. Moreover, the evapotranspiration of the lake area can be divided into water evaporation and vegetation evapotranspiration (non-water). The evaporation of the lake water body was difficult to measure directly, and most of it was converted by the observation value of the onshore evaporator. Usually, the evaporation of water bodies is higher than that of the onshore evaporation pool and exceeds vegetation evapotranspiration [41], resulting in the low-value water yield zone in the lake area. The high-value zone in the northeast area was likely related to the precipitation and evapotranspiration of different vegetation cover types.
To further analyze the spatial variation differences, the distribution changes of water yield were derived from the raster calculator tool of ArcGIS10.4, as shown in Figure 5. We observed a clear reduction trend in 2000–2010, and the degree of reduction was higher in the north and lower in the south. The reduction degree was highest during 2005–2010, especially in the lake area, which was evidently related to the precipitation decrease during this period (average annual precipitation reduced by 16.14%, and average annual evapotranspiration decreased by only 1.87%). In contrast, the overall watershed water yield increased significantly during the period 2010–2020, especially during 2010–2015, and the degree of increase was higher in the northeast and lower in the mid-west, ranging from 0 to 700 mm (the average unit increase degree was 300.81 mm). During this period, the average annual precipitation increased significantly by 22.03%, while the average annual actual evapotranspiration showed a much smaller increase of only 3.43%. As a result, the watershed water yield showed an overall increase. We observed a slight reduction in water yield during the period 2015–2020, mainly due to the reduction in precipitation (average unit annual precipitation reduced by 3.07%) and the significant increase in evapotranspiration (the average annual actual evapotranspiration increased by 1.6 times) in the Dongjiang Lake Basin. This caused a reduction in water yield, with a reduction range of between 0 and 200 mm (average of 53.54 mm). Thus, relative to precipitation, actual surface evaporation had little effect on the watershed water yield.

3.2. Scenario Analysis

Scenario analysis is commonly used in ecological environments and regional development planning to quantitatively explore the internal mechanisms of regional change by comparing the results of different setting conditions [42]. As shown in Table 4, the water yield depth of each land cover type in the Dongjiang Lake Basin occurred in the order of urban and built-up land > grassland > thickets > woodland > cultivated land. Although urban and built-up land showed the highest water yield, this water source is difficult to access because precipitation falls on impervious surfaces and directly flows into the urban drainage pipeline. In addition to precipitation and evapotranspiration, grassland, thickets, woodland, and cultivated land are also affected by the combined factors of surface runoff, soil water content, litter water holding capacity, and canopy interception, resulting in different water yield services between the various land cover types. Bare land had the highest water yield depth, but a small areal coverage and the water yield capacity was vulnerable to other surrounding land cover types. The precipitation of the lake area was lower, and evaporation was higher than that of vegetation [41]. Moreover, the change in water yield depth and precipitation for each LULC type was notably consistent, showing an initial decrease followed by an increase. However, the different ranges of change between the different land cover types were notably affected by the combination of climate and LULC changes.

3.2.1. Effects of Climate Change on Water Yield

Climate change mainly affects water yield through precipitation and potential evapotranspiration. As shown in Figure 6, the average water yield depth in scenarios 1 (1081.13 mm) and 2 (1327.66 mm) decreased by 313.85 mm and 67.32 mm, respectively, compared with that of the actual situation (1394.98 mm). The total water yield amounts were also 5.02 × 10⁹ m3 and 6.17 × 10⁹ m3, respectively; this suggests that climate change caused the water yield of the watershed to first decrease and then increase. Moreover, the water yield depth under scenario 3 dropped by 67.13 mm to 1327.85 mm, and the total water yield amount was relatively consistent with that of scenario 2. Further comparisons of water yield changes under each LULC type for the three scenarios (as shown in Table 4) demonstrate that the water yield of urban and built-up land, forest land, thickets, grassland, and cultivated land decreased by an average of 21.36% in 2000–2010, and the average annual precipitation decreased by 18.15%. The water yields of all land cover types also increased by 21.15% in 2010–2020, and the corresponding average annual precipitation increased by 18.29%. Thus, the watershed water yield was significantly affected by climate change, especially precipitation, which had a positive correlation with water yield.

3.2.2. Effects of LULC Changes on Water Yield

Unlike climate change, human activity significantly affects LULC changes by altering the underlying surface of the atmosphere, which in turn affects watershed water yield. The results demonstrate (Figure 7) that the average water yield depth for scenarios 4 (1395.21 mm) and 5 (1395.92 mm) decreased by 0.23 mm and 0.94 mm, respectively, compared with that of the actual scenario in 2000. The average water yield depth of scenario 6 was 1081.94 mm, an increase of 0.65 mm compared with that of the actual scenario in 2010. Moreover, compared with the variation in water yield depth for each LULC type, the annual average change in water yield depth during 2000–2010 was only 0.08% (i.e., unchanged). The water yield depth of the mixed forest also increased by 1.21% during 2010–2020, which may be due to the implementation of the Dongjiang Lake ecological protection policy during this period. The water yield depth of the other land cover types showed little change. The exception was bare land due to its small areal coverage and dependence on the surrounding land; its water yield capacity was vulnerable, so its range of change was relatively large (2.72%). Overall, under the condition of unchanging climate, LULC changes would have a relatively small impact in the Dongjiang Lake Basin, with only slight increases in water yield.

3.2.3. Contribution Quantification

According to the above analysis, the contribution of climate change to water yield in the Dongjiang Lake Basin was 98.26% during 2000–2020, while LULC changes only contributed 1.74%. During 2000–2010, the contribution of climate change and LULC to water yield were 99.92% and 0.08%, respectively. During 2010–2020, the contribution of climate change and LULC to water yield were 99.04% and 0.96%, respectively. For all three time periods, the contribution rates of climate change to water yield in the Dongjiang Lake Basin were all above 98%, while the contribution rates of LULC changes were significantly lower at less than 2%. Therefore, climate change had a more significant impact than LULC changes on water yield services in the Dongjiang Lake Basin.

4. Discussion

In general, the changes in water yield in the Dongjiang Lake Basin resulted from the combined influence of climate and LULC changes, with climate having a more significant impact. These findings were also consistent with the results of Lang et al. (2017), which showed that the effect of rainfall changes on the Sancha River Basin water yield was about 97.44%, while the effect of land-use changes was only 2.56% [3]. Moreover, Pessacg et al. (2015) found that precipitation variations caused marked differences in regional water yield [20]; Bai et al. (2019) quantified the impacts of land use and climate change on water-related ecosystem services in Kentucky, USA, and found that climate change had a greater impact than land use on water retention at the state scale [43]; Sangam et al.(2016) conducted the related research with the representative concentration pathways (RCPs) in the Bago River Basin, Myanmar, and the results showed that the impact of climate change on streamflow was higher than the land use change in the near year [44]. Although there were some differences in scale, geography, etc., the impact of climate change on water yield is more significant overall compared with land use changes. Meanwhile, according to the water balance principle, precipitation and actual evapotranspiration are two critical factors determining water yield. Precipitation is an important variable in climate elements, and actual evapotranspiration is synthetically affected by climatic conditions and LULC. Climate elements are mainly controlled by natural conditions, and human factors have little effect on precipitation. However, human activities significantly affected LULC changes, but LULC changes had little effect on water yield. This may be owing to the complexity of the change process [45], whereby the transition between different LULC types may cause both an increase and a decrease in water yield. Relative to climate change, LULC changes were more likely to influence the spatial distribution of watershed water yield, thus affecting the total regional water yield.

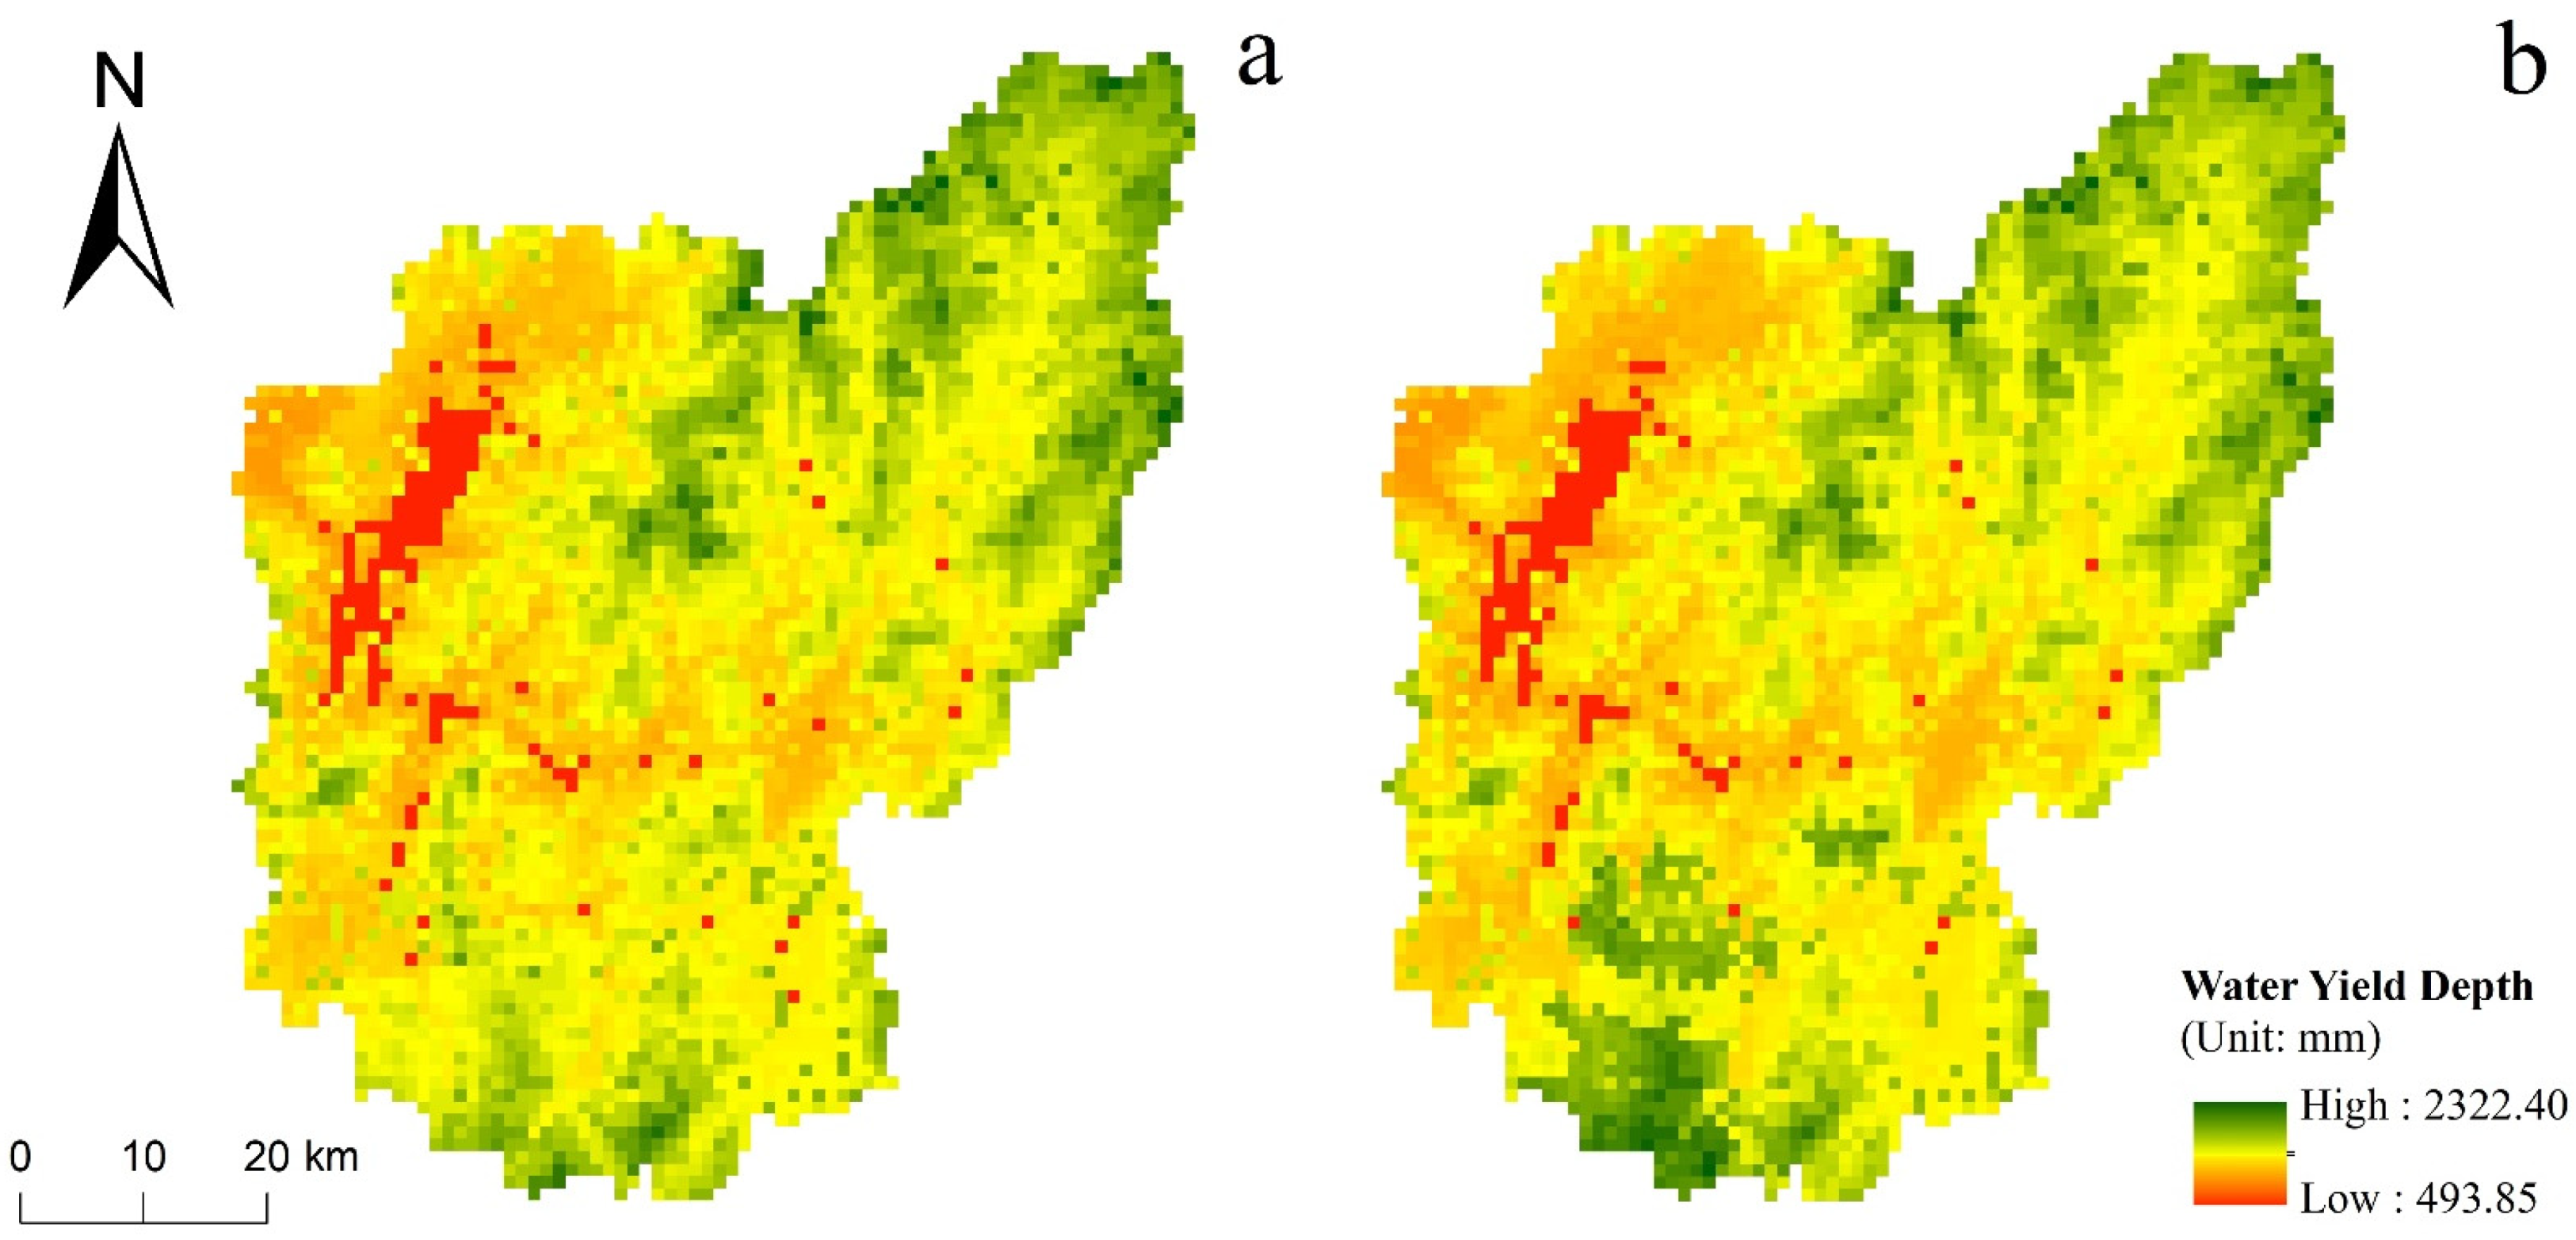
4.1. Future Water Yield Projections Based on CA-Markov Models

To understand the future water yield trends and further explore the effects of LULC changes on water yield in Dongjiang Lake, we used the CA-Markov model to simulate the LULC pattern in the Dongjiang Lake Basin for 2030. Based on the year 2020, assuming that precipitation and evapotranspiration in 2030 remained consistent with the annual average meteorological data for 2010–2020, the water yield in 2030 was simulated under two scenarios: (1) the LULC natural development scenario (as shown in Figure 8b), and (2) the LULC ecological protection scenario (as shown in Figure 8a). Comparing 8a with 8b, we found that the maximum water yield was higher under the natural development scenario than under the ecological protection scenario. Moreover, in the southern watershed, the water yield under the natural development state was notably higher than that of the ecological protection state, likely due to the expansion of urban and built-up land under natural development. According to Table 5, the area of urban and built-up land under the natural development scenario more than tripled that of the ecological protection scenario; cultivated land also increased by 7%, and woodlands and thickets declined to varying degrees. Moreover, the water yield depth of each land cover type remained unchanged, but the total water yield amount increased by 1.16%. As could be shown by the above results, urban and built-up land had a larger unit water yield, and its area continually expanded. In contrast, the water yields of woodland and grassland were relatively small, and their area had shrunk. By changing the distribution of regional water yield, the changes in LULC types notably altered the total water yield amount. The expansion of built-up land often increases the area of impervious surface, which alters the water balance, reduces precipitation infiltration, increases runoff, and raises the regional water yield. In contrast, woodlands and grasslands intercept more surface runoff, increase soil infiltration, delay the precipitation confluence time, and reduce the flood-peak discharge and vegetation evapotranspiration. As a result, the water yields of forest and grassland were relatively low. However, built-up land continued to expand over longer periods, and the impervious surface continued to increase, which may produce a flood-peak discharge and increase the risk of waterlogging in the town area. Therefore, to reduce the risk of flooding and related hazards in the future, it is necessary to minimize urban encroachment on forests and grasslands (especially in rain-rich hills), increase the area of urban greening, safeguard ecological spaces, and increase precipitation interception and water storage functions in the Dongjiang Lake Basin to improve water resource utilization.

4.2. Research Limitations

We conducted a comparative study on water yield in the Dongjiang Lake Basin under different land-use and climate scenarios to improve our understanding of water yield services in the basin. However, due to inevitable errors in the InVEST model, such as calculating water yield without considering soil water content, some parameters, such as evapotranspiration coefficient, maximum root depth, and seasonal factors, were obtained according to the empirical data of the existing results, which lowered the accuracy of water yield estimations in some regions. Similarly, the accuracy of CA–Markov model also needs to be improved and investigated in depth. Moreover, the uniform resolution of all the data in the study was 1 km, which limits the spatial accuracy of water yield. Therefore, future research should further optimize the parameters by localizing them through field investigations and sampling tests to simulate and verify water yield more accurately. In general, the application of the InVEST model in this study was good and effectively depicted the overall change law of water yield in the Dongjiang Lake Basin, providing important technical support for water resource management and ecological protection. Moreover, the results of this study indirectly reflected that the estimation of water yield was more sensitive to the precipitation data, so the rainfall data needs to be selected or used carefully when conducting the water yield estimation with InVEST model.

5. Conclusions

The Dongjiang Lake Basin is an important source of the Xiangjiang River and the second water source for the Changsha–Zhuzhou–Xiangtan region in China. The basin is therefore highly important for the coordinated development of the regional social economy and ecological environment. This study tried to use the InVEST model to estimate the water yield in the Dongjiang Lake Basin quantitatively. We also conducted a scenario analysis to compare the effects of climate and LULC changes on water yield and explore the internal mechanisms of water yield service formation in the Dongjiang Lake Basin. The results are expected to provide an important theoretical basis for the scientific planning and management of land space resources, as well as the maintenance of water supply function stability in the Dongjiang Lake Basin.
(1) According to the time series results, the water yield in Dongjiang Lake Basin was characterized by an initial decrease followed by an increase. Spatially, water yield also decreased from the lake area to the surrounding region. The water yield depth of the Dongjiang Lake Basin dropped by 22.49% during 2000–2010 and increased by 22.87% in 2010–2020. The average water yield depth ranged from 1000 to 1400 mm, with the minimum value was observed in 2010.
(2) Climate change exerted a more significant impact on water yield variability in the watershed ecosystem, while the impact of LULC changes was relatively small. During 2000–2020, the contribution rate of climate change to water yield in the Dongjiang Lake Basin reached 98.26%, and LULC changes only contributed 1.74%.
(3) Compared with climate change, LULC had a stronger effect on the spatial distribution of watershed water yield. In particular, the expansion of urban and built-up land, despite its higher water yield, was also prone to waterlogging, if not limited. Therefore, future watershed development must further optimize the land-use structure and maintain and enhance its ecological service functions by protecting the ecological space, including the surrounding woodland and grassland.

Author Contributions

Wenbo Mo devised the idea, performed the analysis, and wrote the paper; Yunlin Zhao, Nan Yang, and Zhenggang Xu provided technical support and supervision; Weiping Zhao and Feng Li helped in data collection. All authors have read and agreed to the published version of the manuscript.

Funding

This research was sponsored by the Hunan Provincial Key Research and Development Plan (2019SK2336), Hunan Provincial Hi-tech Industry Science and Technology Innovation Leading Plan (2020SK2019), National Sustainable Development Agenda Innovation Demonstration Zone Construction projects (2019SFQ21), Hunan Provincial Water Science and Technology Project (XSKJ2019081-31), the Joint Fund for Regional Innovation and Development of NSFC (U19A2051), and Scientific Innovation Fund for Post-graduates of Central South University of Forestry and Technology (CX202101015).

Data Availability Statement

The data presented in this study are available from the corresponding author (Y.N.) on reasonable request.

Acknowledgments

The authors would like to thank the Hunan Provincial Hydrology and Water Resources Survey Center for the support of this hydrology data.

Conflicts of Interest

The authors declare no conflict of interest.

References

  1. Costanza, R.; D’Arge, R.; Groot, R.D.; Farber, S.; Grasso, M.; Hannon, B.; Limburg, K.; Naeem, S.; O’Neill, R.; Paruelo, J. The value of the world’s ecosystem services and natural capital. Ecol. Econ. 1997, 25, 3–15. [Google Scholar] [CrossRef]
  2. Reid, W.V.; Mooney, H.A.; Cropper, A.; Capistrano, D.; Carpenter, S.R.; Chopra, K.; Dasgupta, P.; Dietz, T.; Duraiappah, A.K.; Hassan, R.; et al. Ecosystems and human well-being-synthesis: A report of the millennium ecosystem assessment. Phys. Technol. 2005, 34, 534. [Google Scholar]
  3. Lang, Y.; Song, W.; Zhang, Y. Responses of the water-yield ecosystem service to climate and land-use change in Sancha River Basin, China. Phys. Chem. Earth Parts A/B/C 2017, 101, 102–111. [Google Scholar] [CrossRef]
  4. Shomar, B.; Dare, A. Ten key research issues for integrated and sustainable wastewater reuse in the Middle East. Environ. Sci. Pollut. Res. 2015, 22, 5699–5710. [Google Scholar] [CrossRef] [PubMed]
  5. Deng, X.Z.; Zhao, C.H. Identification of water scarcity and providing solutions for adapting to climate changes in the Heihe River Basin of China. Adv. Meterol. 2015, 2015, 1–13. [Google Scholar] [CrossRef]
  6. Hess, L.; Meir, P.; Bingham, I. Comparative assessment of the sensitivity of oilseed rape and wheat to limited water supply. Ann. Appl. Biol. 2015, 167, 102–115. [Google Scholar] [CrossRef]
  7. Smith, L.E.D.; Siciliano, G. A comprehensive review of constraints to improved management of fertilizers in China and mitigation of diffuse water pollution from agriculture. Agric. Ecosyst. Environ. 2015, 209, 15–25. [Google Scholar] [CrossRef] [Green Version]
  8. Xu, J.; Xiao, Y.; Li, N.; Wang, H. Spatial and temporal patterns of supply and demand balance of water supply services in the Dongjiang Lake Basin and its beneficiary areas. J. Resour. Ecol. 2015, 6, 386–396. [Google Scholar]
  9. Yang, J.; Xie, B.P.; Zhang, D.G.; Tao, W.Q. Climate and land use change impacts on water yield ecosystem service in the Yellow River Basin, China. Environ. Earth Sci. 2021, 80, 1–12. [Google Scholar] [CrossRef]
  10. Leh, M.D.K.; Matlock, M.D.; Cummings, E.C.; Nalley, L.L. Quantifying and mapping multiple ecosystem services change in West Africa. Agric. Ecosyst. Environ. 2013, 165, 6–18. [Google Scholar] [CrossRef]
  11. Francesconi, W.; Srinivasan, R.; Perez-Minana, E.; Willcockd, S.P.; Quintero, M. Using the soil and water assessment tool (SWAT) to model ecosystem services: A systematic review. J. Hydrol. 2016, 525, 625–636. [Google Scholar] [CrossRef]
  12. Xiao, Y.; Xiao, Q.; Ouyang, Z.; Qin, M. Assessing changes in water flow regulation in Chongqing region, China. Environ. Monit. Assess. 2015, 187, 1–13. [Google Scholar] [CrossRef] [PubMed]
  13. Niels, T.; Volker, B.; Altynm, A.; Kobbing, J.F.; Nurtazin, S.; Hirschelmann, S.; Piechottka, T.; Salmurzauli, R.; Baibagysov, A. Assessment of ecosystem services of the wetlands in the Ili River Delta, Kazakhstan. Environ. Earth Sci. 2017, 76, 1–12. [Google Scholar]
  14. Pei, X.; Guo, Y.M.; Fu, B. Regional Impacts of climate and land cover on ecosystem water retention services in the Upper Yangtze River Basin. Sustainability 2019, 11, 5300. [Google Scholar]
  15. Li, M.Y.; Liang, D.; Xia, J.; Song, J.X.; Cheng, D.D.; Wu, J.T.; Cao, Y.L.; Sun, H.T. Evaluation of water conservation function of Danjiang River Basin in Qinling Mountains, China-based on InVEST model. J. Environ. Manag. 2021, 286, 112212. [Google Scholar] [CrossRef]
  16. Sun, S.L.; Ge, S.; Caldwell, P.; McNulty, S.; Cohen, E.; Xiao, J.F.; Zhang, Y. Drought impacts on ecosystem functions of the U. S. National Forests and Grasslands: Part II Assessment results and management implications. For. Ecol. Manag. 2015, 353, 269–279. [Google Scholar] [CrossRef] [Green Version]
  17. Legesse, D.; Vallet-Coulomb, C.; Gasse, F. Hydrological response of a catchment to climate and land-use changes in Tropical Africa: Case study South Central Ethiopia. J. Hydrol. 2003, 275, 67–85. [Google Scholar] [CrossRef]
  18. Sharp, R.; Tallis, H.T.; Ricketts, T.; Guerry, A.D.; Wood, S.A.; Chaplin-Kramer, R.; Nelson, E.; Ennaanay, D.; Wolny, S.; Olwero, N.; et al. InVEST 3.2.0 User‘s Guide. The Natural Capital Project, Stanford University, University of Minnesota, The Nature Conservancy, and World Wildlife Fund. 2015. Available online: https://naturalcapitalproject.stanford.edu/software/invest (accessed on 15 March 2021).
  19. Zhan, C.S.; Xu, Z.X.; Ye, A.Z.; Su, H.B. LUCC and its impact on run-off yield in the Bai River catchment-upstream of the Miyun Reservoir basin. J. Plant. Ecol. 2011, 4, 61–66. [Google Scholar] [CrossRef] [Green Version]
  20. Pessacg, N.; Flaherty, S.; Brandizi, L.; Solman, S.; Miguel, P. Getting water right: A case study in water yield modeling based on precipitation data. Sci. Total Environ. 2015, 537, 225–234. [Google Scholar] [CrossRef] [PubMed]
  21. Gao, J.; Li, F.; Gao, H.; Zhou, C.B.; Zhang, X.L. The impact of land-use change on water-related ecosystem services: A study of the Guishui River Basin, Beijing, China. J. Clean. Prod. 2017, 163, S148–S155. [Google Scholar] [CrossRef]
  22. Yang, D.; Liu, W.; Tang, L.Y.; Chen, L.; Li, X.Z.; Xu, X.L. Estimation of water provision service for monsoon catchments of South China: Applicability of the InVEST model. Landsc. Urban Plan. 2019, 182, 133–143. [Google Scholar] [CrossRef]
  23. He, C.; Zhang, D.; Huang, Q.; Zhao, Y. Assessing the potential impacts of urban expansion on regional carbon storage by linking the LUSD-urban and InVEST models. Environ. Model. Softw. 2016, 75, 44–58. [Google Scholar] [CrossRef]
  24. Cao, F.; Qin, P.; Lu, S.; Qi, H.; Wu, F.C.; Sun, H.W.; Wang, L.; Li, L.L. Measurement of volatile organic compounds and associated risk assessments through ingestion and dermal routes in Dongjiang Lake, China. Ecotoxicol. Environ. Saf. 2018, 165, 645–653. [Google Scholar] [CrossRef] [PubMed]
  25. Liao, C.H.; Guo, H.F.; Zhang, Y.F.; Ma, J.H. The changes analysis of areal precipitation and inflow in Dongjiang Reservoir. Water Conser. Sci. Technol. Econ. 2017, 32, 32–38. (In Chinese) [Google Scholar]
  26. Liu, H.; Tong, L.X. Analysis on the function of reservoir operation in realizing the comprehensive benefit of Dongjiang Project. Hunan Electr. Power 2011, 31, 80–85. (In Chinese) [Google Scholar]
  27. Xu, J.; Xiao, Y.; Xie, G.; Jiang, Y. Ecosystem service flow insights into horizontal ecological compensation standards for water resource: A case study in Dongjiang Lake Basin, China. Chin. Geogr. Sci. 2019, 29, 214–230. [Google Scholar] [CrossRef] [Green Version]
  28. Xu, J.; Xiao, Y.; Xie, G.; Wang, S.; Zhu, W.B. Spatiotemporal dataset of water supply service in the Dongjiang Lake Basin (1995–2010). Digit. J. Glob. Chang. Res. Data Publ. Rep. 2017. [Google Scholar] [CrossRef]
  29. Xu, J.; Xiao, Y.; Xie, G.; Wang, S.; Zhu, W.B. Spatiotemporal dataset of water supply service in the Dongjiang Lake Basin. Acta Ecol. Sin. 2016, 36, 4892–4906. (In Chinese) [Google Scholar]
  30. Benra, F.; Frutos, A.D.; Gaglio, M.; Alvarez-Garreton, C.; Felipe-Lucia, M.; Bonn, A. Mapping water ecosystem services: Evaluating InVEST model predictions in data scarce regions. Environ. Model. Softw. 2021, 138, 104982. [Google Scholar] [CrossRef]
  31. Marques, S.M.; Campos, F.S.; David, J.; Cabral, P. Modelling sediment retention services and soil erosion changes in Portugal: A spatio-temporal approach. ISPRS Int. J. Geo-Inf. 2021, 10, 262. [Google Scholar] [CrossRef]
  32. Kamusoko, C.; Aniya, M.; Adi, B.; Manjoro, M. Rural sustainability under threat in Zimbabwe—Simulation of future land use/cover changes in the Bindura district based on the Markov-cellular automata model. Appl. Geogr. 2009, 29, 435–447. [Google Scholar] [CrossRef]
  33. Pinto, N.; Antunes, A.P.; Roca, J. Applicability and calibration of an irregular cellular automata model for land use change. Comput. Environ. Urban 2017, 65, 93–102. [Google Scholar] [CrossRef] [Green Version]
  34. Lu, Y.; Cao, M.; Zhang, L. A vector-based cellular automata model for simulating urban land use change. Chin. Geogr. Sci. 2015, 25, 74–84. [Google Scholar] [CrossRef]
  35. Zadbagher, E.; Becek, K.; Berberoglu, S. Modeling land use/land cover change using remote sensing and geographic information systems: Case study of the Seyhan Basin, Turkey. Environ. Monit. Assess. 2018, 190, 494. [Google Scholar] [CrossRef]
  36. Gashaw, T.; Tulu, T.; Argaw, M.; Worqlul, A.W. Modeling the hydrological impacts of land use/land cover changes in the Andassa watershed, Blue Nile Basin, Ethiopia. Sci. Total Environ. 2017, 619, 1394–1408. [Google Scholar] [CrossRef]
  37. Chen, Y.L. Research on ecological compensation mechanism of Dongjiang Lake Basin under the guidance of the “Green is Gold” concept. Nat. Resour. Econ. China 2018, 31, 35–38. (In Chinese) [Google Scholar]
  38. Xie, Y.H.; Liao, Q.L. Study on the action strategy of ecotourism in Dongjiang Lake Wetland Park in Hunan Province. Arch. Cul. 2019, 117–118. [Google Scholar]
  39. Zhou, W.Z.; Liu, G.; Pan, J.; Feng, X. Distribution of available soil water capacity in China. J. Geogr. Sci. 2005, 15, 3–12. [Google Scholar] [CrossRef]
  40. Allen, R.G.; Pereira, L.S.; Raes, D.; Martin, S. Crop Evapotranspiration-Guidelines for Computing Crop Water Requirements-FAO Irrigation and Drainage Paper 56; FAO: Rome, Italy, 1998; Volume 300, pp. 1–15. [Google Scholar]
  41. Zhao, X.S.; Liu, Y.B.; Wu, G.P. The evapotranspiration characteristics and environmental factors of Poyang Lake area based on remote sensing. J. Lake Sci. 2013, 25, 428–436. (In Chinese) [Google Scholar]
  42. Bormann, H.; Breuer, L.; Graff, T.; Huisman, J. Analysing the effects of soil properties changes associated with land use changes on the simulated water balance: A comparison of three hydrological catchment models for scenario analysis. Ecol. Model. 2007, 209, 29–40. [Google Scholar] [CrossRef]
  43. Bai, Y.; Ochuodho, T.O.; Yang, J. Impact of land use and climate change on water-related ecosystem services in Kentucky, USA. Ecol. Indic. 2019, 102, 51–64. [Google Scholar] [CrossRef]
  44. Shrestha, S.; Htut, A.Y. Land use and climate change impacts on the hydrology of the Bago River Basin, Myanmar. Environ. Model. Assess. 2016, 21, 819–833. [Google Scholar] [CrossRef]
  45. Nie, W.; Yuan, Y.; Kepner, W.; Maliha, S.; Michael, J.; Caroline, E. Assessing impacts of land use and land cover changes on hydrology for the upper San Pedro watershed. J. Hydrol. 2011, 407, 105–114. [Google Scholar] [CrossRef]
Figure 1. Location and boundary of the Dongjiang Lake Basin.
Ijgi 10 00466 g001
Figure 2. Scatter diagram of the seasonal factor Z and the mean of water yield depth over five periods.
Ijgi 10 00466 g002
Figure 3. Changes in mean annual precipitation, evapotranspiration, and water yield in the Dongjiang Lake Basin in 2000~2020.
Ijgi 10 00466 g003
Figure 4. Spatial distribution of water yield in the Dongjiang River Basin.
Ijgi 10 00466 g004
Figure 5. Spatial distribution of water production changes in the Dongjiang Lake Basin.
Ijgi 10 00466 g005
Figure 6. Water yield pattern of Dongjiang Lake Basin with LULC unchanged.
Ijgi 10 00466 g006
Figure 7. Water yield pattern of Dongjiang Lake Basin with climate unchanged.
Ijgi 10 00466 g007
Figure 8. Distribution of water yield under different LULC data of the Dongjiang Lake Basin in 2030. (a) The LULC natural development scenario; (b) The LULC natural development scenario.
Ijgi 10 00466 g008
Table 1. Data types and sources.
Data TypesContextResolutionSource
Land use/land coverThe year of 2000, 2005, 2010, 2015, and 2020.30 mThe Resources and Environmental Sciences Data Center (RESDC), Chinese Academy of Sciences (http://www.resdc.cn, accessed on 4 July 2021).
MeteorologyDaily meteorological data of 16 national meteorological stations in the watershed and surrounding areas in 1998-2020 (including temperature, wind speed, sunshine duration, etc.). China Meteorological Data net (http://data.cma.cn, accessed on 4 July 2021)
Precipitation data from 1998 to 2015.1 kmThe Resources and Environmental Sciences Data Center (RESDC), Chinese Academy of Sciences (http://www.resdc.cn, accessed on 4 July 2021).
SoilSoil reference depth, soil type, soil texture, etc.1 kmFood and Agriculture Organization of the United Nations (FAO), International Institute for Applied Systems Analysis. China soil map based harmonized world soil database (HWSD) (v1.1) (2009)
Digital Elevation Model (DEM)ASTER GDEM v230mGeospatial Data Cloud site, Computer Network Information Center, Chinese Academy of Sciences. (http://www.gscloud.cn, accessed on 4 July 2021)
RoadNational Highway, provincial road, county road. Open-source data site
of Openstreet
hydrologyDongjiang reservoir inflow data in the years 2015 and 2020. Hunan Hydrographic and Water Resources Survey Center
Table 2. The scenario settings of climate and LULC changes.
FactorReal ScenarioClimate Change ScenarioLULC Change Scenarios
200020102020Scenario1Scenario2Scenario3Scenario4Scenario5Scenario6
Climate 200020102020201020202020200020002010
LULC200020102020200020002010201020202020
Table 3. Maximum root depth and evapotranspiration coefficient of different land use/cover types in the Dongjiang Lake Basin.
CodeLand Cover TypesMaximum Root Depth (mm)Evapotranspiration Coefficient
1Evergreen needle leaf forest70001
2Evergreen broad leaf forest67001
4Deciduous broad leaf forest31001
5Mixed forests48001
6Brushwood50000.6
7Grassland24000.75
8Wetland1001.2
9Farmland20001
10Urban and built-up10.1
12Bare land10.2
13Water bodies11
Table 4. Water yield depth of each LULC type in Dongjiang Lake Basin under different scenarios (mm).
Type CodeRealClimate Change ScenariosLand Use/Land Cover Change Scenarios
200020102020Scenario 1Scenario 2Scenario 3Scenario 4Scenario 5Scenario 6
11418.551109.771367.021110.021367.581367.341418.381418.131109.48
21415.591105.681343.311105.821344.661344.461415.501414.851105.07
41404.881095.661352.211095.661347.481347.481404.881408.381100.10
51419.751106.291365.681108.111360.401350.441414.651427.681119.67
61502.521187.041441.121186.771441.921441.971502.681502.081186.36
71522.701212.851490.641215.761494.531490.641519.541519.541212.85
91380.271075.361298.881074.921297.991298.381380.541380.821075.74
101607.391289.881539.501288.411517.711520.031608.041619.481300.72
121530.151201.091392.601201.091411.601411.601530.151510.131168.39
13711.44249.36510.01252.69513.26510.01709.71709.71249.36
Table 5. Total amount of water yield under different development scenarios in 2030.
Type CodeEcological Protection ScenarioNatural Development Scenario
Average Water Yield Depth (mm)Area
(km2)
Total Water Production (m3)Average Water Yield Depth (mm)Area
(km2)
Total Water Production (m3)
11616.9022773,681,676,985.111624.7319833,221,841,378.05
21559.51610951,302,450.441560.51599934,744,240.84
41616.682845,266,937.741620.562845,375,804.57
51643.2162101,878,998.541631.6662101,162,730.59
61689.04366618,187,216.431695.72342579,936,806.64
71779.412442,705,866.331779.412442,705,866.33
91498.019561,432,095,454.711479.5510161,503,224,748.90
101770.7386152,282,682.981878.07365685,495,765.26
121581.941828,474,838.261581.941828,474,838.26
13570.8514884,486,170.04564.8813877,953,979.86
Dongjiang Lake Basin7,138,357,600.59 7,220,916,159.30
Publisher’s Note: MDPI stays neutral with regard to jurisdictional claims in published maps and institutional affiliations.

