
Subjectively Measured Streetscape Perceptions to Inform Urban Design Strategies for Shanghai


1
Department of City and Regional Planning, Cornell University, Ithaca, NY 14850, USA
2
Center for Spatial Information Science, The University of Tokyo, Tokyo 113-8654, Japan
3
School of Architecture, University of Virginia, Charlottesville, VA 22904, USA
4
Graduate School of Design, Harvard University, Cambridge, MA 02138, USA
*
Author to whom correspondence should be addressed.
ISPRS Int. J. Geo-Inf. 2021, 10(8), 493; https://0-doi-org.brum.beds.ac.uk/10.3390/ijgi10080493
Submission received: 23 May 2021
/
Revised: 17 July 2021
/
Accepted: 19 July 2021
/
Published: 21 July 2021
Abstract
:Recently, many new studies applying computer vision (CV) to street view imagery (SVI) datasets to objectively extract the view indices of various streetscape features such as trees to proxy urban scene qualities have emerged. However, human perception (e.g., imageability) have a subtle relationship to visual elements that cannot be fully captured using view indices. Conversely, subjective measures using survey and interview data explain human behaviors more. However, the effectiveness of integrating subjective measures with SVI datasets has been less discussed. To address this, we integrated crowdsourcing, CV, and machine learning (ML) to subjectively measure four important perceptions suggested by classical urban design theory. We first collected ratings from experts on sample SVIs regarding these four qualities, which became the training labels. CV segmentation was applied to SVI samples extracting streetscape view indices as the explanatory variables. We then trained ML models and achieved high accuracy in predicting scores. We found a strong correlation between the predicted complexity score and the density of urban amenities and services points of interest (POI), which validates the effectiveness of subjective measures. In addition, to test the generalizability of the proposed framework as well as to inform urban renewal strategies, we compared the measured qualities in Pudong to other five urban cores that are renowned worldwide. Rather than predicting perceptual scores directly from generic image features using a convolution neural network, our approach follows what urban design theory has suggested and confirmed as various streetscape features affecting multi-dimensional human perceptions. Therefore, the results provide more interpretable and actionable implications for policymakers and city planners.
1. Introduction
Streets are important public spaces for residents to thrive [1]. Urban design qualities such as enclosure, human scale, transparency, complexity, and imageability directly affect a person’s appreciation of a street space [2]. Conventional investigations on the quality of street design have largely relied on objective metrics, ranging from the height-to-width ratio [3] to pedestrians counts [2], which require extensive spatial data and human labor for observations [4,5]. Recently, with prevalence of street view imagery (SVI) data in environmental auditing [4], computer vision (CV) has been widely applied to extract streetscape features, making the understanding of large-scale urban scenes possible [6]. However, these emerging studies are still limited to objective measures. Only the view index of individual features such as trees and buildings are analyzed, while the overall perceptions of viewers are ignored. Human perceptions have subtle relationships that cannot be fully represented by individual view indices nor a simple combination of them [2,7].
Conversely, the “subjective measure”, which refers to evaluative scores collected from survey questions, can capture more subtle relationships [7]. It is more user centered [8] although the definitions of perceptual qualities are inconsistent across studies [2]. There is no standard procedure to handle the involved error margin to ensure the comparability and reliability from different raters [4]. Despite these drawbacks in costly labor and a lack of comparability for cross-studies, subjective measures can also be effectively integrated with objectively measured indicators. Several studies have correlated subjective scores from raters with the objective visual elements that appeared in video clips or SVIs to successfully operationalize seemly subjective but indeed objective measures of urban perception [2,8,9]. However, these studies have limitations. Although the study from Ewing and Handy [2] was well designed and based on urban design theory, their approach had low-throughput. It took raters an hour to rate a single video clip [2]. While Naik et al. [8] provided an artificial intelligence (AI) based method, it was not rooted in urban design theory: the perceived safety was made based on generic image features such as color histograms or stacked HSV color channels that had been extracted from SVIs,. In other words, their prediction of perception is a black box providing limited actionable urban design policy implications.
Therefore, the effectiveness of subjective measures in capturing more subtle human perceptions on various urban scenes using SVI data have not been adequately addressed. To bridge the gap between AI based urban analytics and classical urban design theory, we took Shanghai as an example and applied CV and Machine Learning (ML) to subjectively measure four perceptual qualities, namely the enclosure, human scale, complexity, and imageability. These perception qualities have been identified as important in affecting pedestrian behaviors, residence move choices, and home buyer willingness to pay [10]. Our work enriches subjectively measured urban perception studies. It is also the first cross-study for global cities. Urban renewal implications are derived for policymakers based on this global comparison. Furthermore, we contribute to future studies by proposing a framework that integrates AI applications with classical urban measurement frameworks.
2. Literature Review
2.1. Objective and Subjective Measures
Street environment significantly affects people’s appreciation of a place as well as the physical activities of the residents who live there, the choice to move, and the willingness to pay [11]. Street qualities have mostly been measured using objective quantities such as building height, street width, and number of trees [3]. However, physical features alone cannot represent people’s overall perceptions, which have more subtle relationships [2].
Conversely, subjective measures often derive from interviews and surveys. They explain people’s behavior more completely, as behavior is mediated by a “cognitive map” of the environment [12]. Conventional approaches have relied on interviews or telephone surveys to collect people’s overall perceptions, and these data collection methods have problems [2]. First, the consistency and reliability of the operation can be questioned due to individual differences. Secondly, measurements based on surveys is time-consuming and expensive. This low-throughput method limits the application of subjective measurement to larger geographic contexts [8]. Third, the results are difficult to interpret, providing less instructive implications for policymakers [7].
Nevertheless, the subjective and objective measures could be integrated. Ewing and Handy [2] reviewed 51 subjective perceptual qualities from a pile of urban design literature. They statistically correlated subjective scores rated by experts while watching street view video clips to the objectively quantified elements like people and trees from field survey. They successfully operationalized the objective measurement of five seemingly subjective perceptions.
2.2. Computer Vision and Machine Learning in Street Measures
Recently, new studies that are taking advantage of open-source big data and AI algorithms have emerged. First, SVI data covers a handful of cities and has rapidly spread to new cities since 2007, and this data can be used to measure street-level human eye views that are inaccessible from bird view [13]. A few recent studies have measured the built environment using SVIs. For example, Rundle et al. [14] used Google SVI to manually audit the neighborhood environment. Later, with the advance of AI such as CV and ML, automatically extracting features from images became possible. Yin and Wang [4] applied ML to measure visual enclosure from SVI. Their results showed that the ML algorithms performed well in their ability to recognize and calculate sky areas with 90% precision, allowing the measurement to be done reproducibly. They found that the visual enclosure variables are significantly negatively associated with the number of pedestrians and the walk score [4]. Other research has measured pedestrians, trees, sky, buildings, façade etc. with SVIs and using CV models effectively and accurately [10,13,15]. However, as discussed previously, these objective view indices cannot represent overall feelings that viewers have toward street scenes [16]. For perceptual qualities that were not familiar to the average person, such as imageability, a subjective framework exhibits better performance [16].
Besides open-source SVI data, integrating crowdsourcing with AI has become viable to uncover large-scale public perceptions [8]. Online data collection allows a greater number of participants to evaluate perceived qualities from images, largely increasing the accessibility of urban perception data [8,9]. Naik et al. [8] collected information on perceived safety of an urban area online by asking participants to rank pairwise street photos. These preferences were converted to ranked safety scores and became the training data to train ML models to predict the perceived safety score for 21 cities worldwide. The method was also applied to investigate the correlation between urban appearance and neighborhood income as well as housing prices [17].
Despite the effectiveness of subjective measures in incorporating more subtle human perceptions, most studies using SVI data are limited to objectively extracted visual elements. Little has been done to construct global maps depicting the subjectively measured perceptions for the many perceptual qualities identified by classical urban design studies, such as imageability and complexity [2].
Therefore, our work aims to enrich the subjective measures of urban perceptions. It contributes to analytical frameworks by extending the classical urban design framework with AI and big data (Figure 1). While Ewing and Handy [2] relied on human labor to manually count physical features from video clips, we applied CV to extract the pixel ratios or counts of each important feature. While Naik et al. [8] only mapped the perceived safety score, we measured four important qualities identified by the literature in urban design and validated the scores with objective points of interest (POI) data, which refers to a specific physical location that someone may find interesting, such as restaurants, retail stores, and grocery stores. Furthermore, it is the first cross-study considering several global cities with the application of CV and ML, which sheds light on urban renewal implications for global studies.
3. Data and Methods
3.1. Study Area and Data Preparation
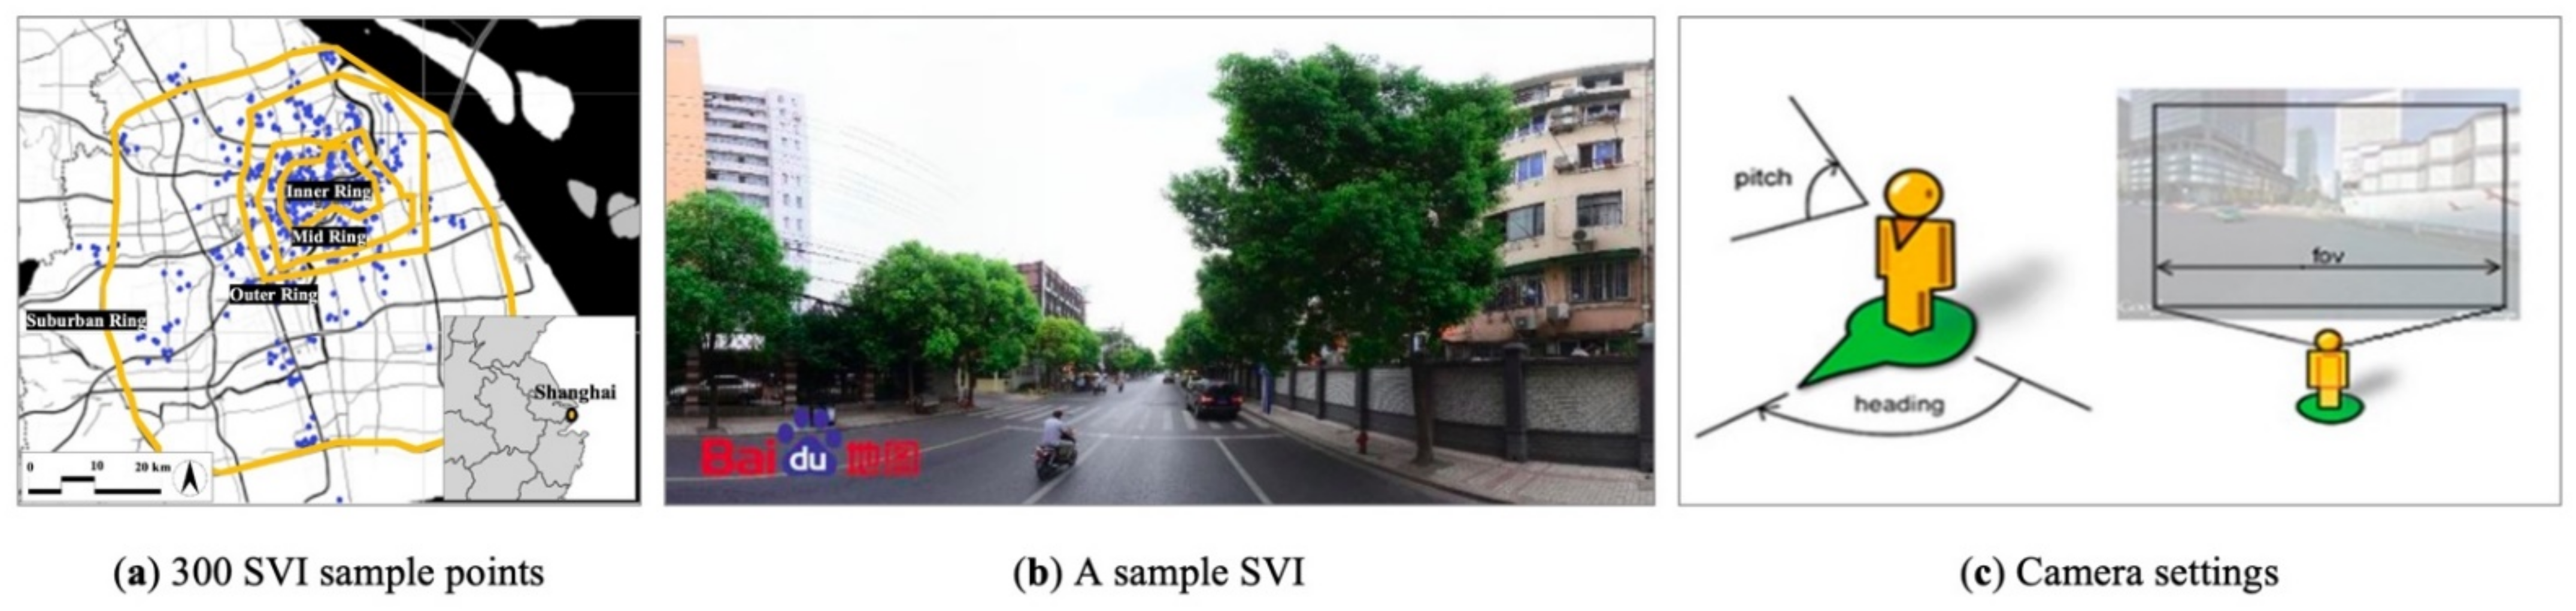
Pudong District in Shanghai is the financial center of China (Figure 2a). Since the housing reform in 1998, Pudong has become one of the most expensive and vibrant housing markets in China [15]. An empirical analysis for the street quality for the city-wide area of Pudong would provide essential implications for urban renewal. The data include (1) SVIs collected from Baidu Street View API (https://api.map.baidu.com/lbsapi/ (accessed on 2 October 2019)), (2) POI data from DaZhongDianPing (https://www.dianping.com/ (accessed on 8 October 2019)) and AutoNavi Map (https://lbs.amap.com/ (accessed on 5 October 2019)), and (3) a shapefile of road networks from Open Street Map (https://www.openstreetmap.org/ (accessed on 30 September 2019)).
3.2. Selection and Calculation of the Four Subjective Qualities
Motivated by classical measurement protocols for urban design quality [2,18], we chose “(visual) enclosure”, “human scale”, “complexity”, and “imageability” to present the perceived streetscape qualities. These four qualities have been operationalized by Ewing and Handy [2] and achieved widely agreed upon definitions created by urban designers and planners [2]. Specifically, enclosure refers to the extent that streets are visually defined by features such as trees, walls, and buildings [4]. Human scale measures the size of physical elements, their texture, and their articulation that match the scale and proportions of a person and correspond to the walking speed. Physical elements including pavement texture, facade details, street furniture, trees, and plants are considered important [2]. Complexity denotes the visual richness of a place, depending on the variety of and number of elements such as human activity, signage, street furniture, greenery, and buildings [2]. Imageability captures the quality of a place that makes it distinct, recognizable, and memorable [2].
3.2.1. Downloading Baidu SVIs
SVIs were downloaded from the Baidu Street View Static API with consistent camera settings. The “heading” was set using the street angle; the image size was 800 × 400 pixels. The FOV (the horizontal field of view) was 120 degrees. The “pitch”, which specifies the up or down angle of the camera was 0 degrees. To ensure our training images would cover most urban area types, 300 images were randomly sampled across the Shanghai region (Figure 2a).
3.2.2. Collecting Public Perceptions as Training Labels
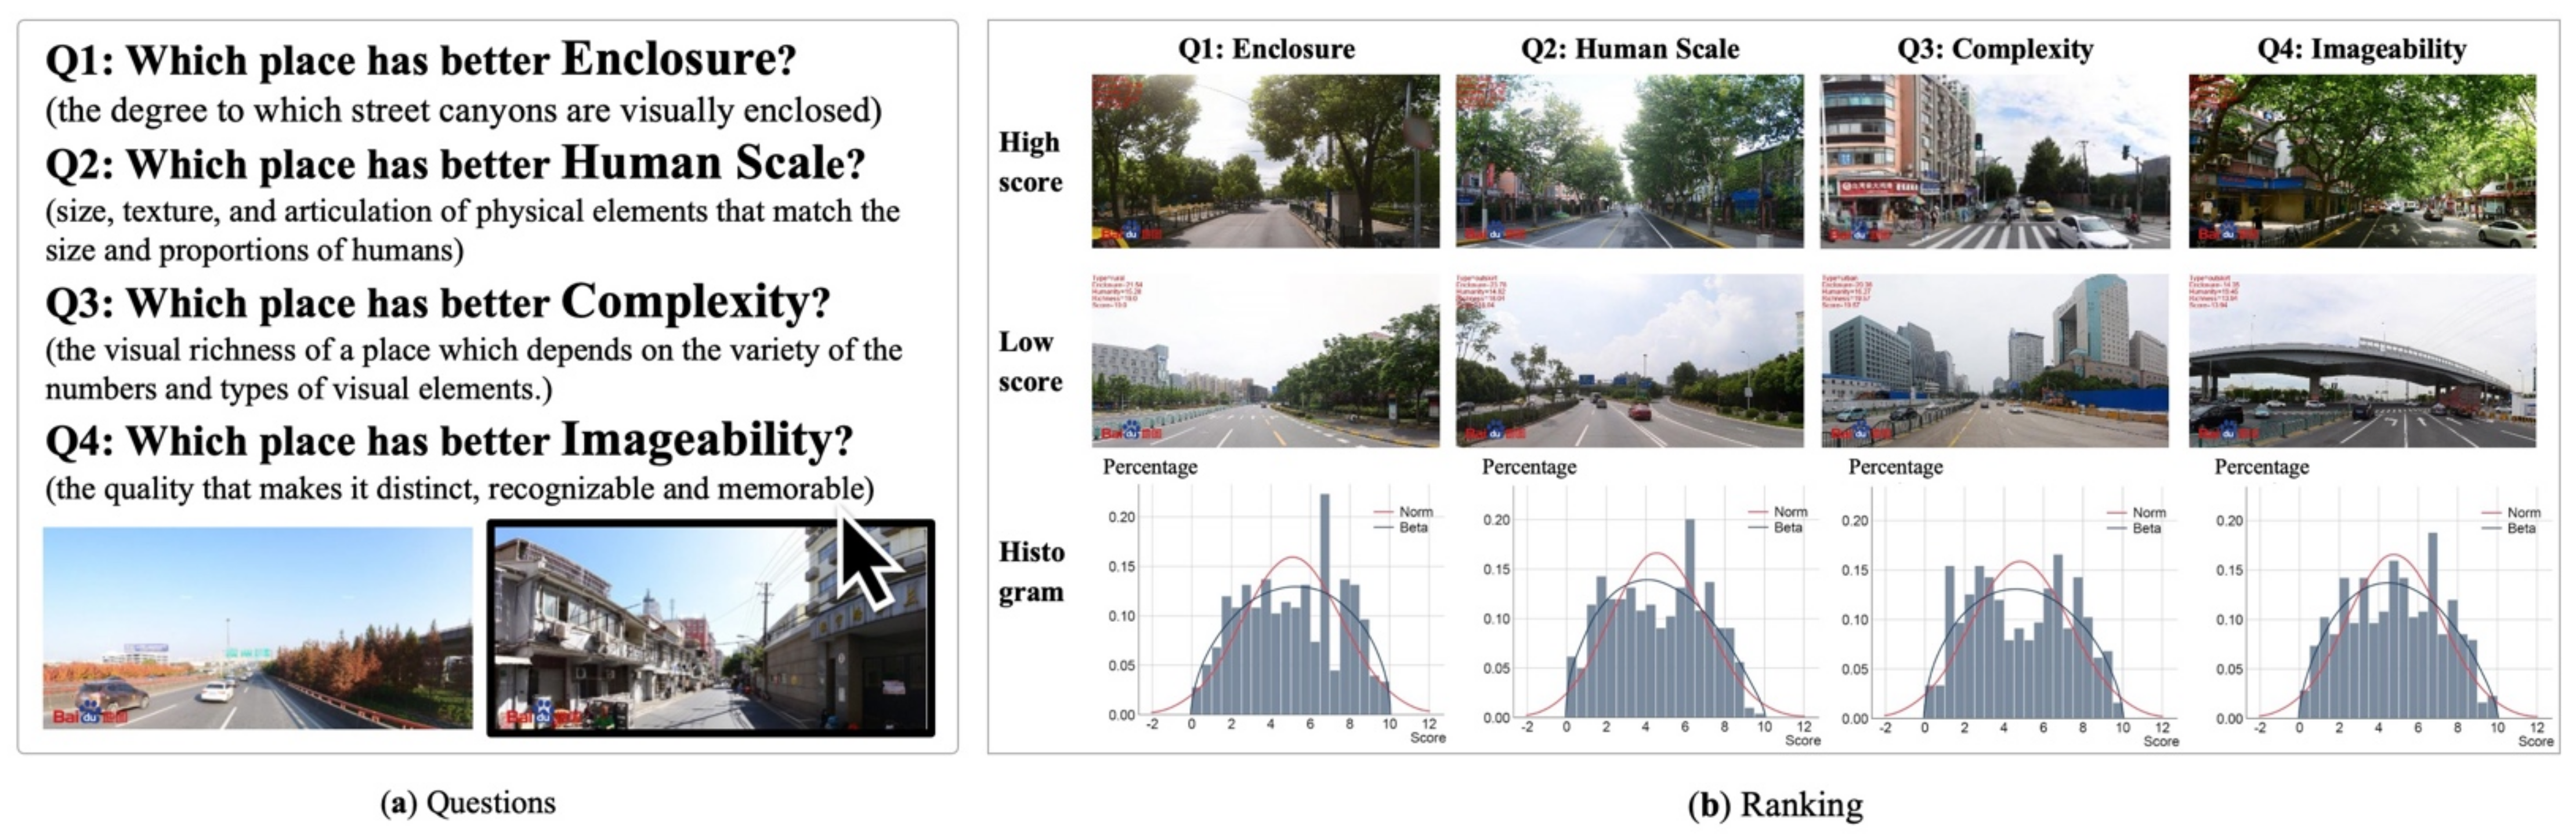
To collect people’s preferences on street scenes as the training labels, we developed an online questionnaire platform (http://140.143.239.153:3000/index.html#/ (accessed on 24 June 2020)) where people could select the image that they preferred in pairwise comparisons regarding the four perceptual qualities (Figure 3a). Human perception is comprehensive and subtle; therefore, viewers perceive the quality of a street scene through the overall sensory information obtained by viewing the whole picture [2,8]. Taking “enclosure” as example, we first gave a qualitative definition on this quality. Participants were then asked, “Which place has better enclosure?”. To ensure the SVIs shown in the survey captured a variety of streetscapes ranging from city center, suburban, to countryside, the 300 SVIs used in the survey were randomly sampled from across the Shanghai area.
These preferences were then translated to ranked scores with the TrueSkill Algorithm [19], which has also been applied to rank perceived safety scores that were collected through a crowdsourcing survey in which participants were asked to rank pairwise images by Naik et al. [8]. During a one-week period, we collected 3120 valid entries from 23 volunteers who were mostly architecture students in Shanghai. On average, an image was compared to 10 other images, which is sufficient for the TrueSkill algorithm (https://github.com/sublee/trueskill (accessed on 30 June 2020)) converge the results [8]. The ranked scores were normalized onto a 0–10 scale. People seemed to favor streetscapes with less sky exposure, more trees, and more pedestrians (Figure 3b). These 300 labelled images become our training data.
3.2.3. Physical Feature Classification
A few physical features from street scenes have been statistically identified to relate to how humans perceive street design quality [2,5,10]. Among these studies, the pixel ratios of individual elements such as trees, buildings, cars, and people were often extracted from SVIs as view indices to proxy street quality [10]. Formally, a view index is the percentage of pixels of a feature to the total pixels of an image [20], which can capture the importance of a visual element from eye-level view. For example, the green view index measures the share of tree pixels. Therefore, we use the general formula, Formula (1), to measure various view indices for all of physical features shown in the SVIs.
where, is the view index, is the total pixels of the image, and is the pixels of the physical feature obj.
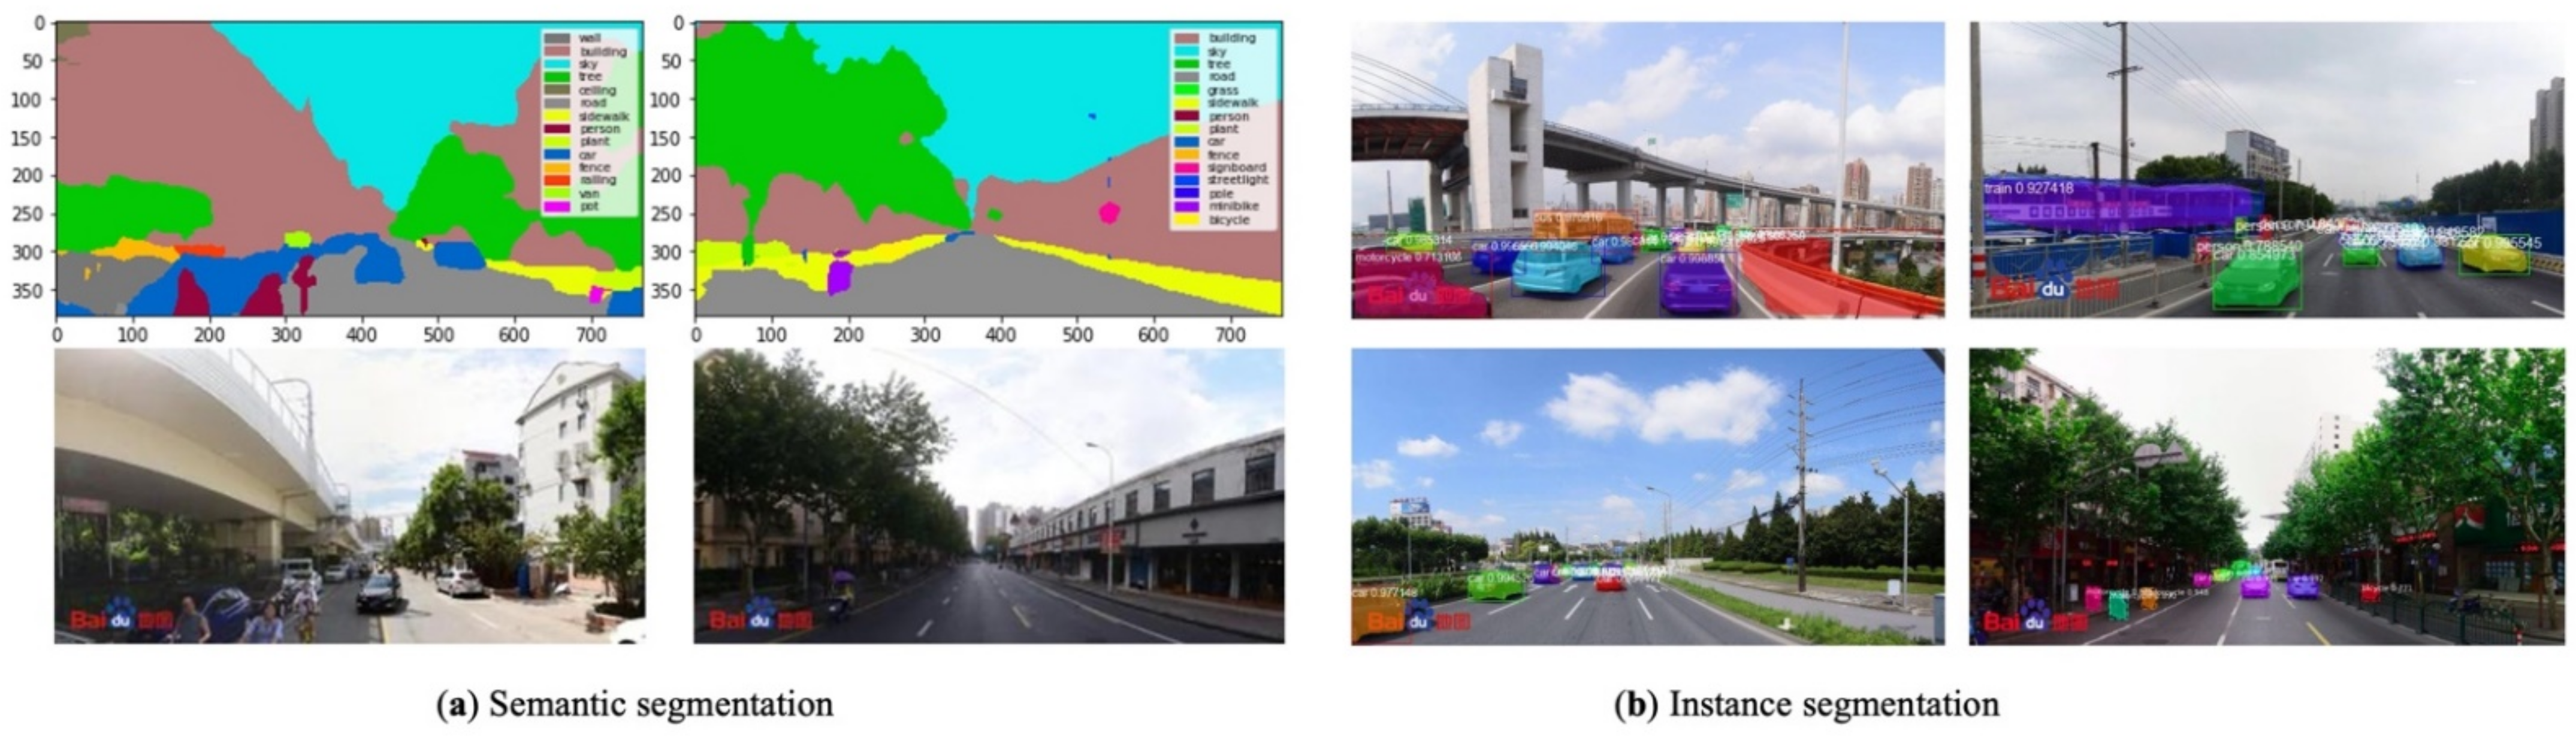
The pyramid scene parsing network (PSPNet) is a pixel-level object recognition and classification algorithm that produces reliable results in semantic segmentation, achieving more than 93.4% pixel-level accuracy [21]. It has been applied by several prior studies [20,22] to extract streetscape features such as trees, sky, and building views from SVIs to inform the urban environment [22] and housing prices [20]. We used PSPNet to extract the pixel ratios of individual features as view indices from SVIs. More than 30 streetscape elements were detected (Figure 4a). Furthermore, for the quantity of cars, people, signs, and street furniture, the pixel ratio makes less sense. Therefore, we applied MASK R-CNN [23] to count the absolute amounts (Figure 4b).
3.2.4. Streetscape Feature Selection
Notably, from the perspective of both the feature engineering of statistics [24] and urban perception theory [2,5], not all streetscape features classified from SVIs will have a significant effect on human perceptions. For example, based on the literature, the sky, tree, plants, sidewalk, road, building, person, and bike view indices were significant in affecting perceptions [2,5]. Therefore, the selection of streetscape features as explanatory variables to predict perception scores were based on literature and feature engineering. We used the widely applied Gini importance (GI) [25], also known as the mean decrease in impurity, to rank the feature importance. Specifically, each feature’s GI was calculated based on the impurity reduction of splits, as the sum over the number of splits across all of the trees that include the feature, proportionally to the number of samples it splits during the random forest process using the Python Scikit-learn package [26]. Only features identified either as significant and important in affecting human perception or receiving high GI scores would be kept.
3.2.5. Predicting Subjective Scores
The target output variables of this study are the four perceived scores, the data type for which is continuous. The input of the ML model was 30 streetscape features obtained from Section 3.2.3. Thus, regression algorithms are required. Meanwhile, the algorithm must be able to identify the feature importance for the street view features to inform urban design. Therefore, neural network algorithms were not considered because they are a complete black-box that cannot provide guidance on the importance of each streetscape feature identified by urban design theory [5,18].
Based on the above two conditions, we chose eight ML algorithms (Table 2), which included linear regression, K-nearest neighbors (KNN), support vector machine (SVM), random forest (RF), decision tree (DT), voting selection (VS), gradient boosting (GB), and adaptive boost (ADAB), to predict the four perceptions. Those algorithms are classical and mature in supervised learning. In urban related studies, they have been extensively used as baseline in the prediction of a numerical target feature based on other features of an instance and have shown effectiveness and robustness [5,8,27,28,29]. Using different algorithms to assess the prediction performance can better reflect real dataset applications.
The implementation processes related to machine learning algorithms and modeling are based on the Scikit-learn Python library [26]. Optimization and improvement at the algorithm level are not in our research scope. Therefore, this paper does not introduce the theoretical and mathematical derivation processes of these algorithms.
The mean absolute error (MAE) was set as the loss function to evaluate the performance of the ML algorithms. It shows advantages in assessing the average model performance [30]. Assuming that is the number of errors, is the predicted perceived scores, and x is the true value. The MAE is calculated as follows:
The lower MAE value implies the higher accuracy of a prediction model. We then applied the best performance models to all of the downloaded 14,274 Baidu SVIs and derived the four subjective scores for the Pudong Area.
3.3. Correlation Test and Cross-Reference Validation
The relationships within different human perceptions are subtle and could be correlated. Zhang et al. [5] indicated the high correlation between certain pairs of subjective perceptions measured from SVIs, such as “beautiful–wealthy” and “depressing–safe”. We applied Pearson correlation analysis to investigate the multicollinearity of the four perception scores. We also cross-referenced the subjective scores to the objectively quantified indicators with the external data, such as POI density, floor area ratio (FAR), etc. The goal was to test the effectiveness of the subjective measures in capturing more interpretable and objective urban metrics that have been proved to affect human perceptions of urban scenes.
3.4. Global Comparison with Other Cities
A high-quality environment stimulates urban innovation [31,32,33]. In recent years, the government has devoted considerable resources to improve the environmental quality of the Pudong area aimed at promoting innovative industrial and activities, especially in the Zhangjiang High-Tech area of Pudong [34]. To validate the generalizability of our framework and to inform what kind of perceivable environment facilitates urban innovation, we conducted a comparative analysis of the perceived scores between the Pudong Zhangjiang High-Tech area and five other global renowned innovative districts. Cambridge Kendall Square, Downtown San Francisco, Manhattan Wall Street, Seattle South Lake Union, and the London Knowledge Quarter were selected as the benchmarks. Perched next to the Massachusetts Institute of Technology, Cambridge Kendall Square is an internationally recognized innovation district that is propelled by innovative firms [35]. Neighboring Silicon Valley, Downton San Francisco has one of the best innovation ecosystem where a large number of start-ups, business incubators, and leading-edge companies gather [36]. Located in New York, Manhattan Wall Street is the second leading high-tech hub in the United States [37]. Seattle South Lake Union is the hotbed of innovative companies including Amazon and Microsoft [38]. The London Knowledge Quarter (in the UK) has one of the leading clusters of innovation and research organizations in the world [39]. These five cities were listed in the World Top 20 Science and Technology clusters by the World Intellectual Property Organization (WIPO) [40]. These five districts have been widely studied as the leading global practices of innovational clusters [31,41,42].
The scores of the Zhangjiang High-Tech Park in the Pudong area were compared to those of the five benchmarks. Implications for urban design and renewal for Pudong and Zhangjiang were discussed based on the results of the comparison.
4. Findings & Discussion
4.1. Descriptive Statistics of the Classfication and Significant Streetscape Features
Using a PSPNet pre-trained algorithm, more than 30 visual elements that appeared in sample SVIs were quantified based on the general formula, Formula (1), with large differences in their quantities and standard deviation. First, among these features, more ubiquitous elements (e.g., buildings, sky, trees, curbs, roads, and street walls) were revealed to significantly affect human perceptions [2,5,10]. For example, sky, tree, and building views extracted from the SVIs have been tested to significantly affect perceived enclosure [4] as well as housing prices [15,20,43]. Second, less ubiquitous elements like people, proportion windows, signboards, and street furniture, such as outdoor dining and streetlights, have also been revealed to be important in affecting human behaviors and perceptions. For example, the presence of people, street squares, courtyards, parks, outdoor dining, landscape features, and identifiable building facades have been proved to affect the perception of “imageability” [2], while the proportion street walls, buildings, and the sky affected the perceived “enclosure” [2,18]. Therefore, we kept the 25 most vast visual elements, the mean view indices of which were greater than zero at 4 digits. Meanwhile, for individual features like people, using the absolute count makes more sense than using the pixel ratio. Therefore, we also replaced the view indices of the five features with their absolute counts, namely the people, cars, bicycles, motorbikes, and benches, which have been indicated to be important human activities indicators, along with street furniture objects [2,18]. In the end, these 30 features were the final explanatory variables fitting into ML models to the predict perceived scores. Table 1 provides a descriptive summary of either their view indices or absolute counts.
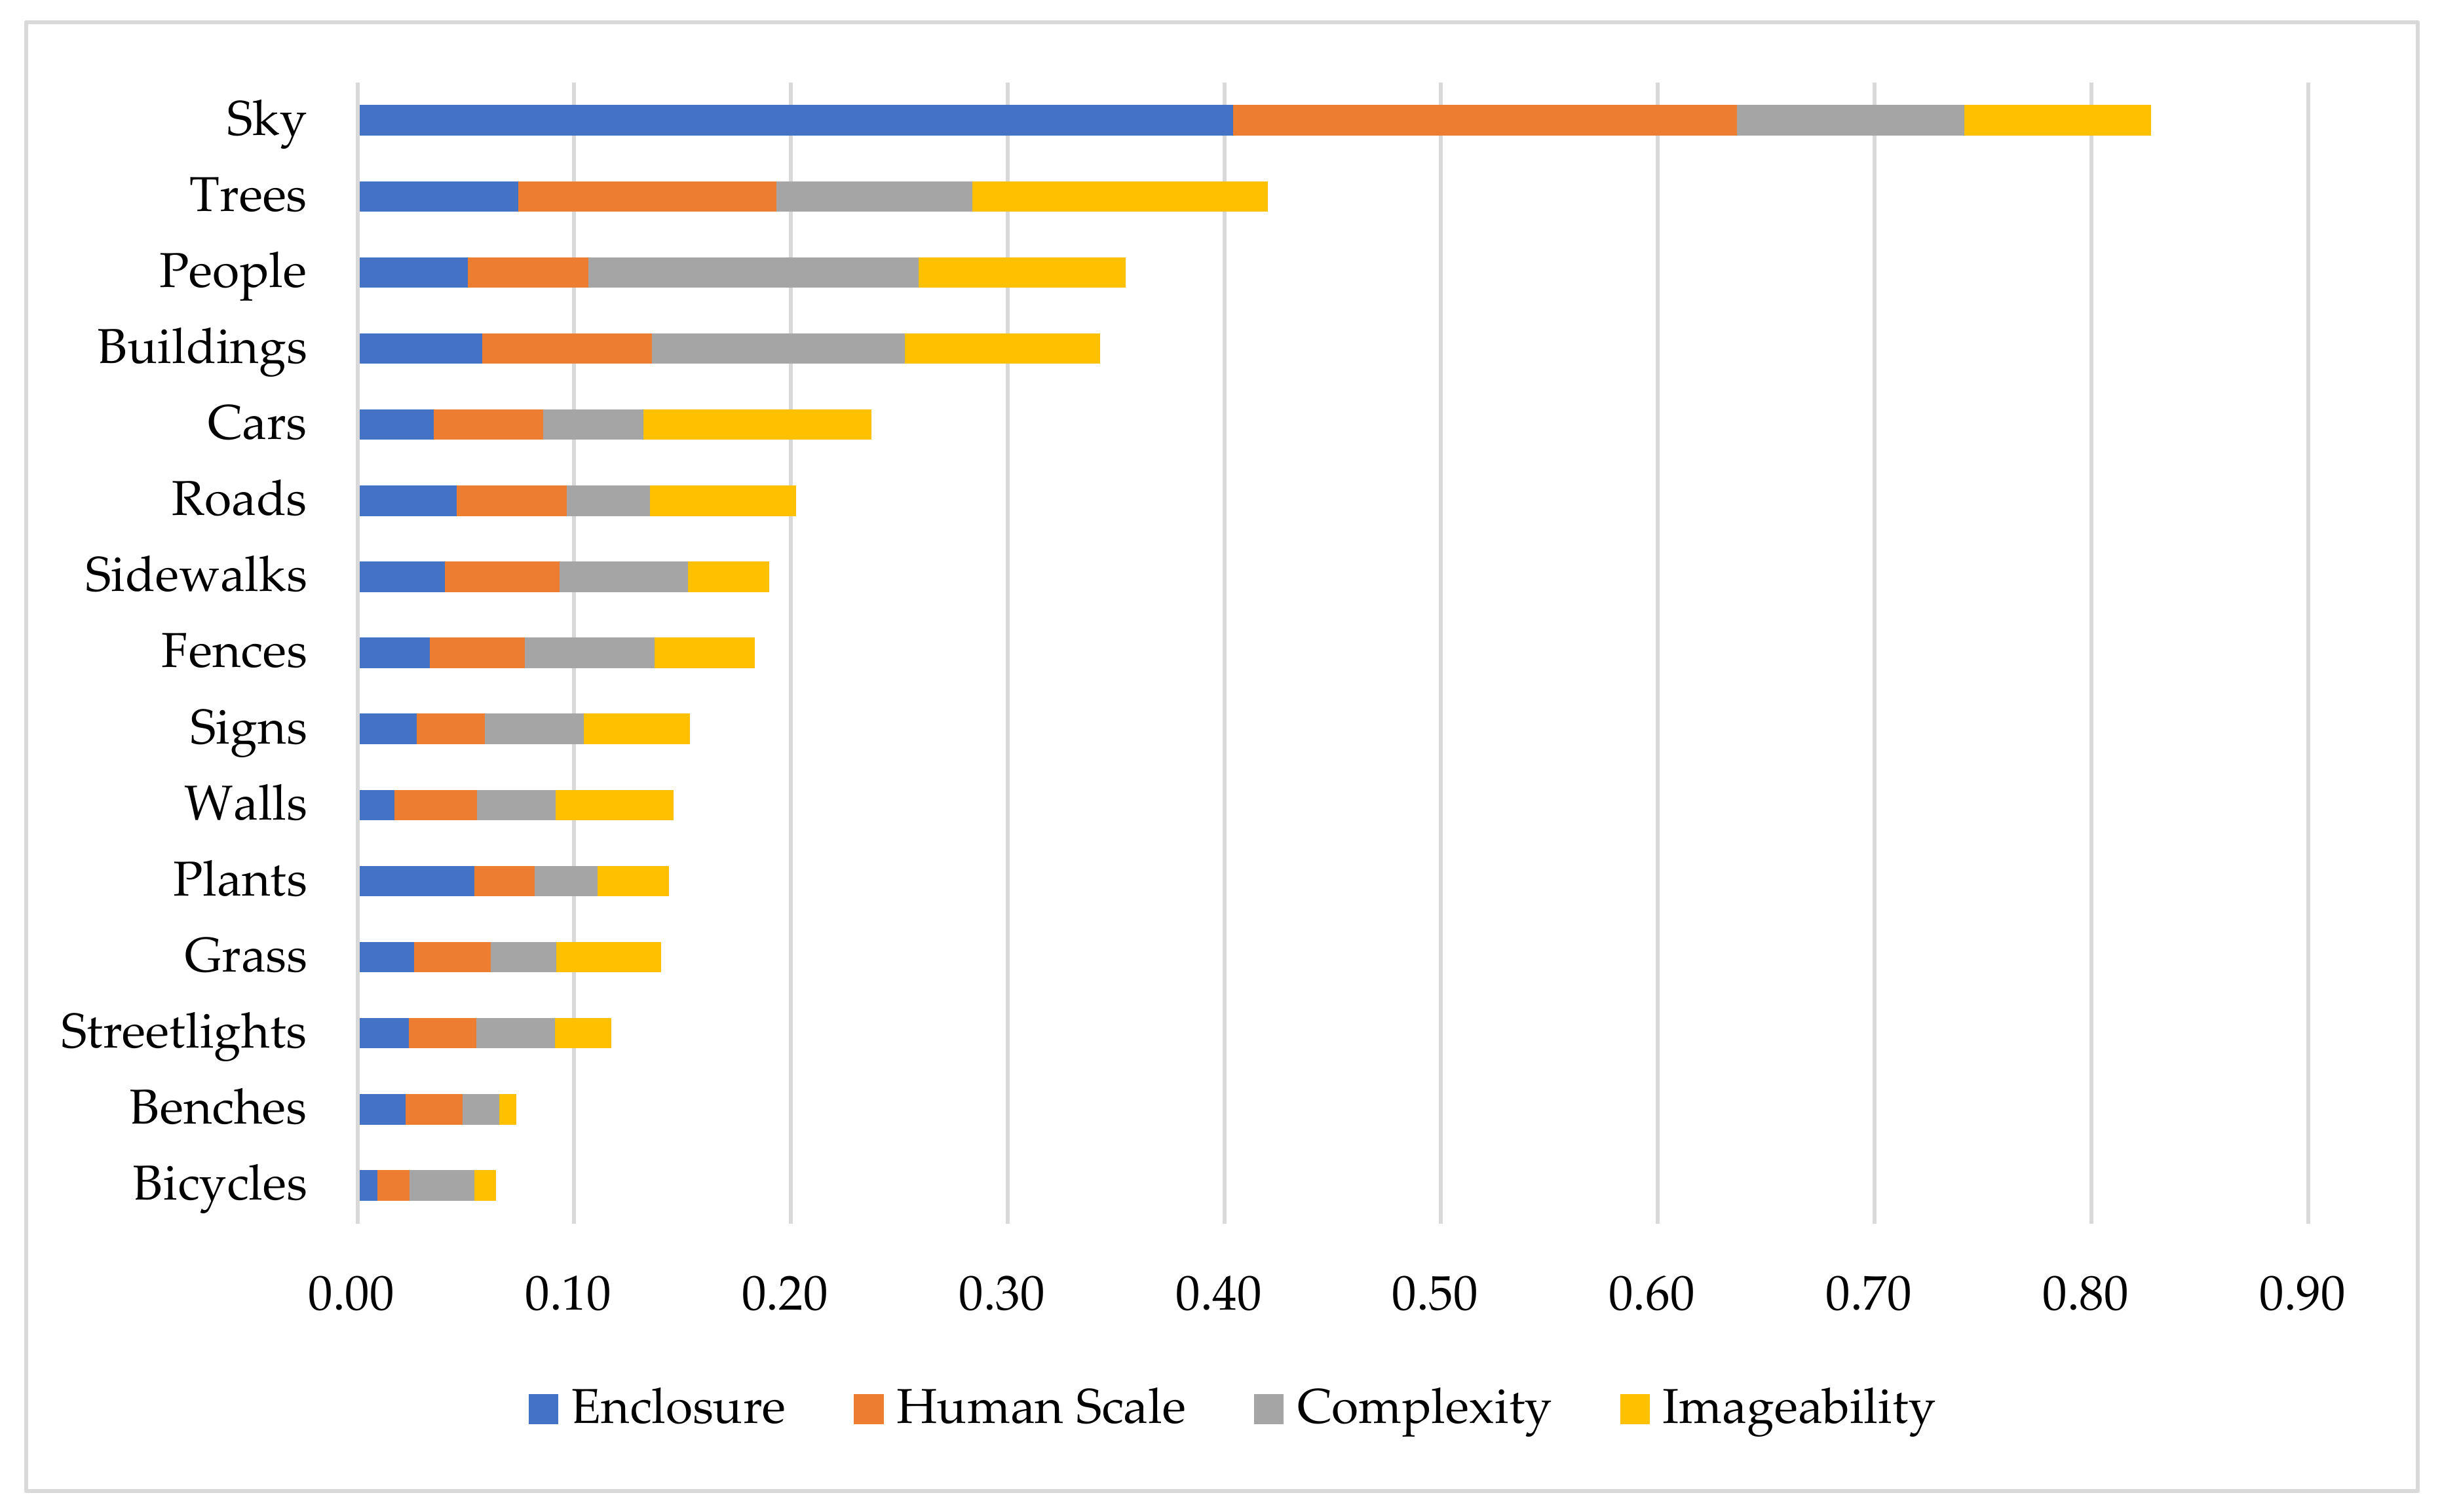
Ranked by their GI scores [25], the top 15 five most important visual elements that contribute to pedestrians’ perception of street design qualities are reported in Figure 5. The values of sky, trees, people, buildings, and cars ranked highest based on the sum of their GI scores in predicting four qualities, which is consistent with prior studies [2,5,44,45]. However, street furniture that have been proven to be important by prior urban design studies [2], such as streetlights and benches, are not highly ranked. Another interesting finding is that with a same feature, its importance scores in predicting different perceptions have a large amount of variance. For example, sky is much more important in predicting enclosure than aesthetics, trees are almost equally important in predicting all four perceptions, while the presence of people is more important to predict complexity.
4.2. ML Prediction Performances
Different ML models’ prediction accuracies in terms of R2 and MAE varied across four perceptual scores. SVM outperformed the other ML models in predicting complexity and imageability scores (Table 2). SVM uses kernel tricks to solve complex solutions. It contains a convex optimization function that can perform well when there are limited training data and many features [46]. Gradient boosting (GB) outperformed other ML models in the human scale score, while RF performed the best in predicting the enclosure score compared to other models. RF can handle overfitting efficiently and shows advantages in processing data with outliers [47]. As shown in Table 2, the enclosure score has a greater standard deviation (std.), which means that the value of the enclosure has higher dispersion and contains more outliers. This could explain why RF performed better in the enclosure score. Moreover, the MAE of the RF model for predicting imageability was 1.19, being much smaller than that of the remaining three perceptual scores, which could be the result of the online rater variations during image ranking [5].
The training resulted in best models with MAE being between 1.19 to 1.62 and with R2 from 0.47 to 0.51. Compared to the R2 scores achieved by Naik et al. (0.38 to 0.57) [8] and that of Ewing and Handy (e.g., 0.36 for imageability, 0.43 for enclosure, 0.36 for human scale, and 0.38 for complexity) [2], our results are therefore acceptable, considering the small training sample. Meanwhile, an error of 1.19 to 1.62 will not alter the interpretation of predicted quality with a 0–10 scoring system. For example, in the worst case, a true score of 7.5 could be predicted to a value between 6.31 to 9.12, which would be interpreted as good to very good quality. Therefore, for all of the downloaded 14,274 Baidu SVIs, the best models were selected to predict perceptual scores accordingly. Specifically, as Table 2 reported, SVM was selected to predict “complexity” and “imageability”, GB was selected to predict “human scale” while RF was selected to predict “enclosure”.
4.3. Correlations between Four Perceptions
The pairwise coefficients between imageability and the other three scores have a moderate (between ±0.30 and ±0.50) degree of correlation, while the correlations between enclosure, human scale, and complexity are high (between ±0.50 and ±1) (Table 3). The positive association between the pair of “enclosure–human scale” is particularly strong. Intuitively, this is reasonable because these two perceptions, by definition, overlap in many ways. Both of their operationalized measures have been proved to relate to streetscapes that construct a vertical and horizontal street scene, such as sky, buildings, trees, and street furniture. Our finding is consistent with the literature, for example “enclosure” and “complexity” were positively correlated in affecting walkability [2]. In addition, the strong correlations also indicate that future studies could investigate the divergence and coherence between these subjective measures, especially to define and differentiate their definitions more explicitly. Otherwise, the use of subjective measures could be restricted by its ambiguity, and the results could raise confusion in interpretation when making policy implications.
4.4. Validation of Complexity Score
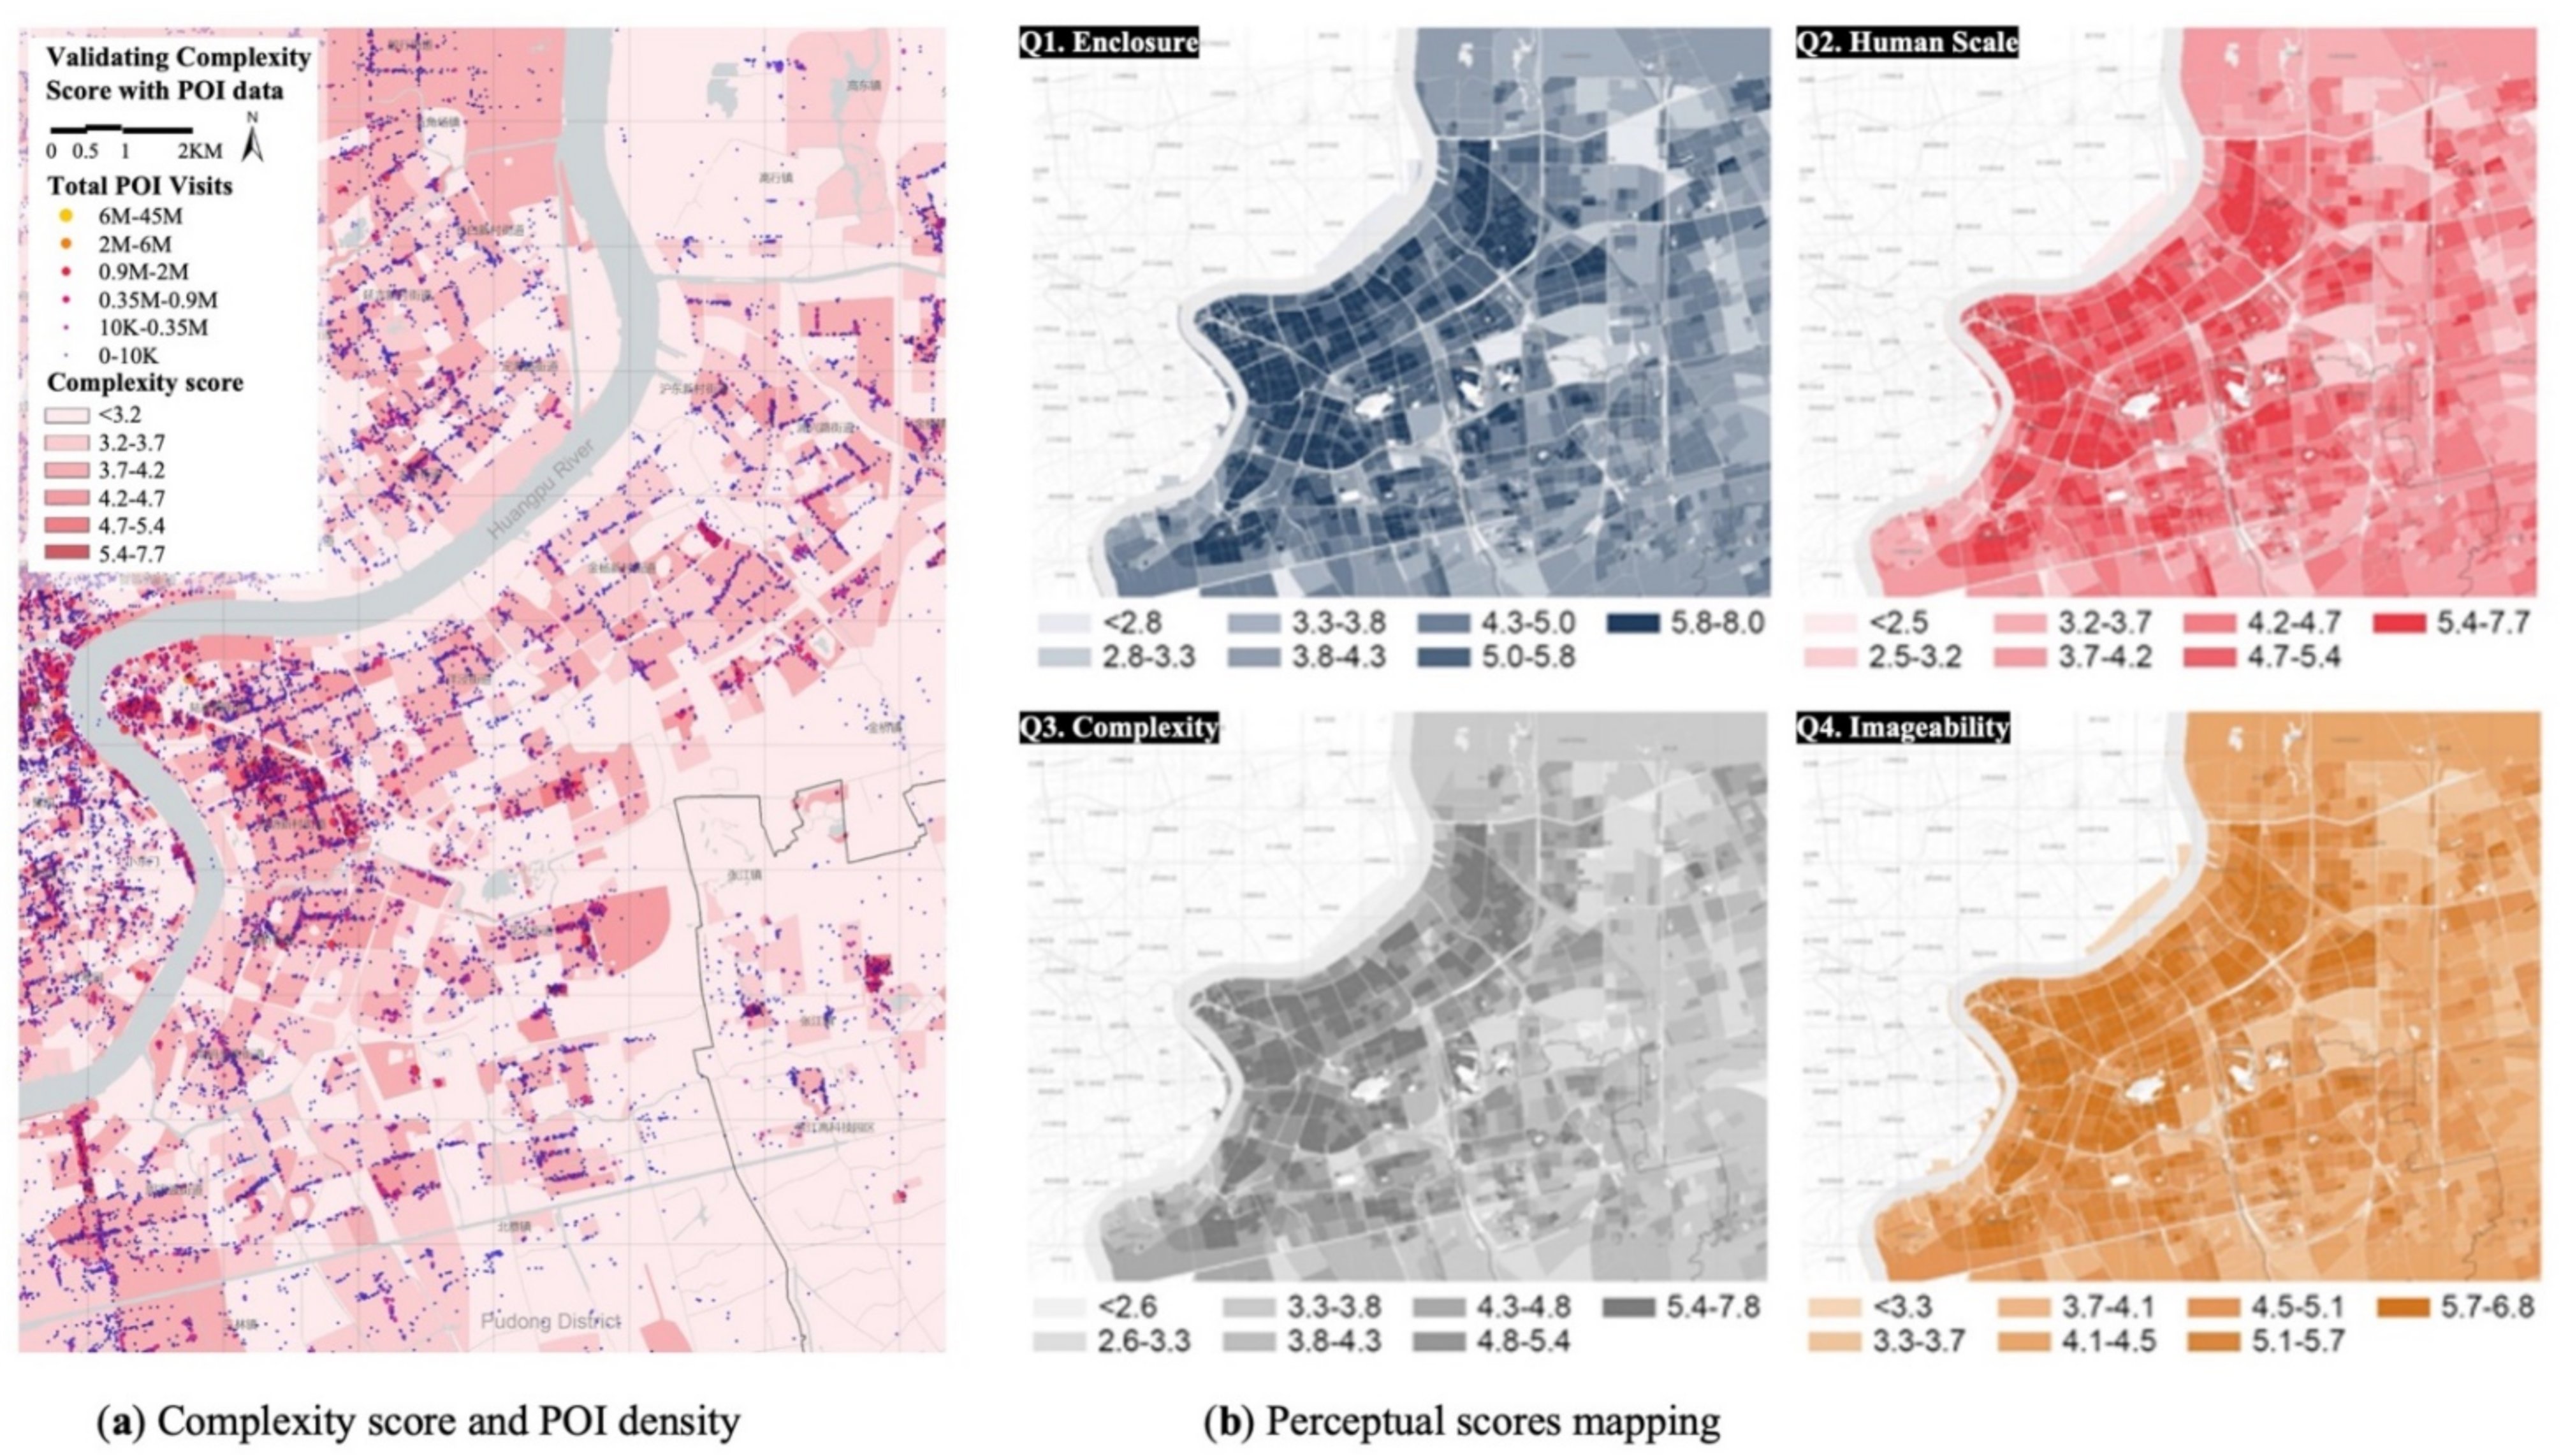
The results show that the degree of “imageability” is significantly and positively correlated with “enclosure” and “complexity” (Table 3). Furthermore, we crossed referenced the complexity score to the POI density (using food and beverage, entertainment, and recreation). A higher complexity score was correlated with more POIs, indicating the predicted complexity score effectively captures the impacts of urban amenities and services (Figure 7a).
4.5. Uneven Spatial Distribution of Perceptual Qualities
Figure 6b provides the first comprehensive cognitive maps for Pudong District. The distributions of the four perceptual qualities are heterogeneous, with the downtown area (i.e., Lujiazui area) being perceived as having the highest concentrations of these qualities. The results indicate that more efforts could be invested into the periphery residential areas and new industrial parks. For example, Zhangjiang High-Tech Park, where street qualities are perceived as low but with a large residential population and employment. Urban renewal resources such as greenifying the streets and policy and regulation changes such as changing zoning codes from mono to multi and mixed land use could effectively improve the street quality as it is perceived by residences.
4.6. Comparison with Other Cities
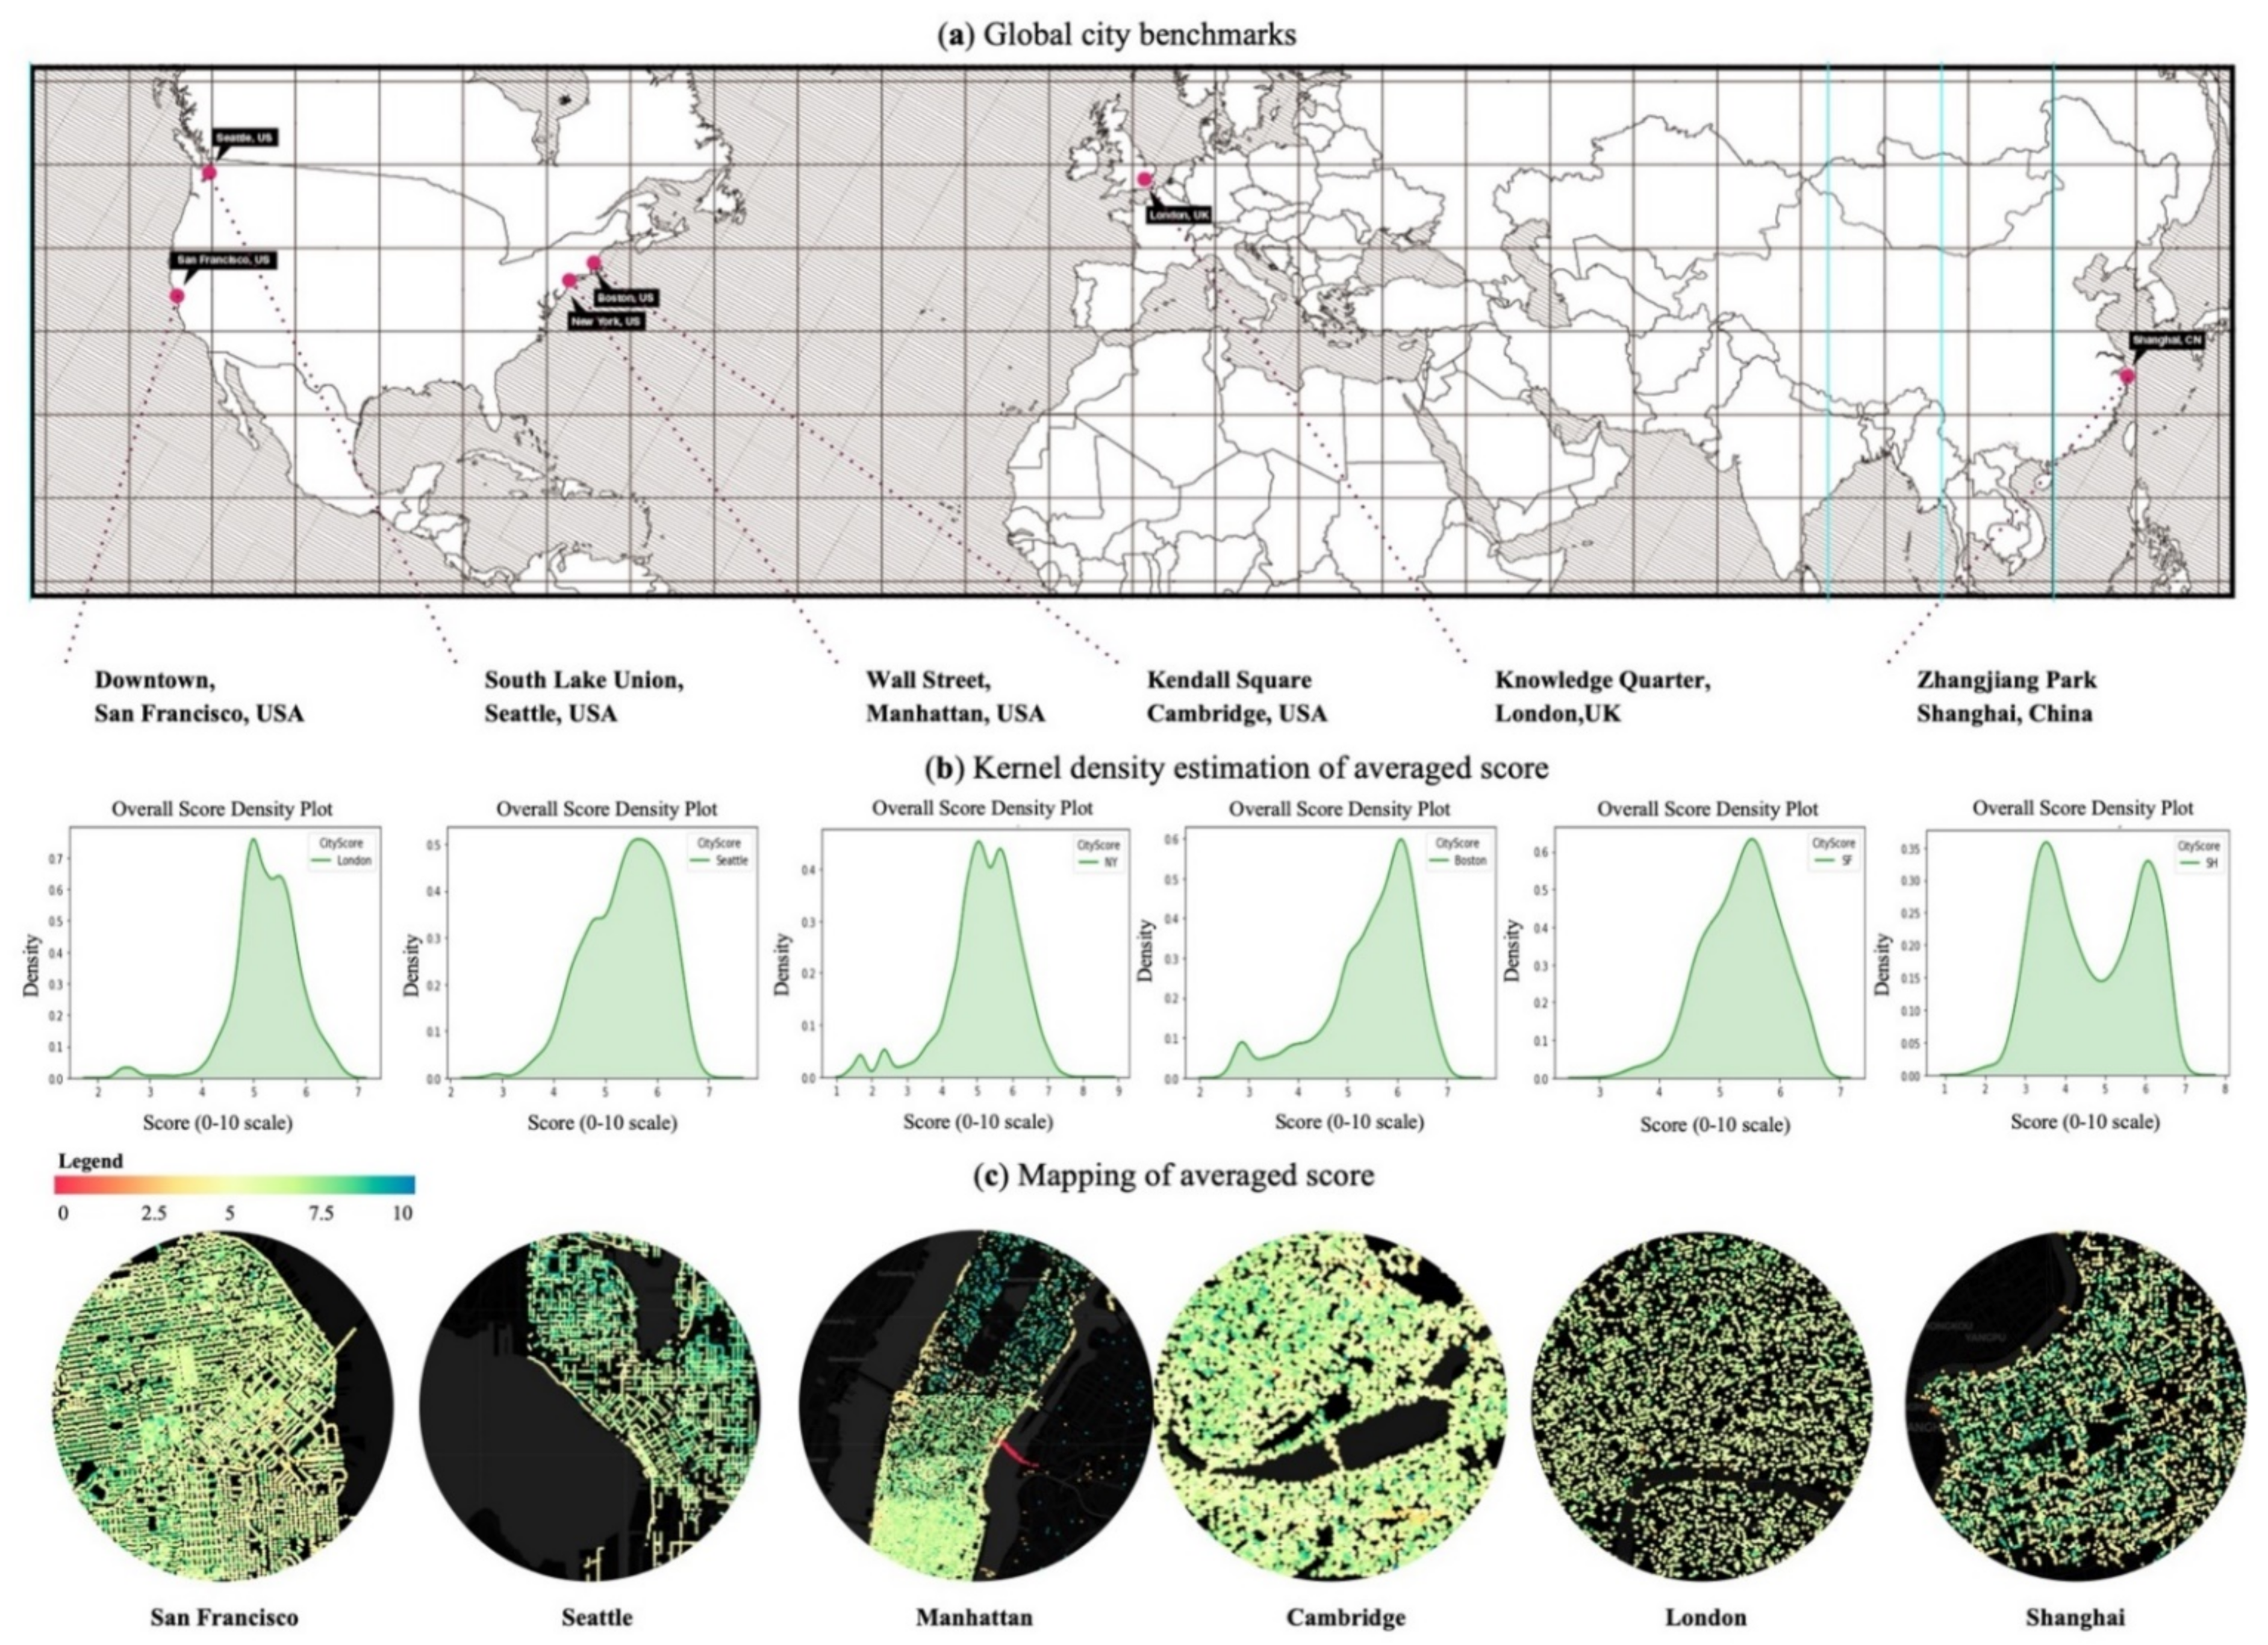
Averaging the four perception scores and comparing Pudong to other five global best practices (Figure 7a), we found the uneven distribution of the perceived quality in Pudong prevails. Taking the same sized area (3km radius) of the urban core as the one used in the study areas, Pudong has the lowest average score (Figure 7b), indicating that more design implementation should be taken into account to improve the overall appreciation of the street environment if the government’s goal is to make Pudong a globally leading district for urban innovation. Good street environment quality has been identified to facilitate innovation and quality of life [10].
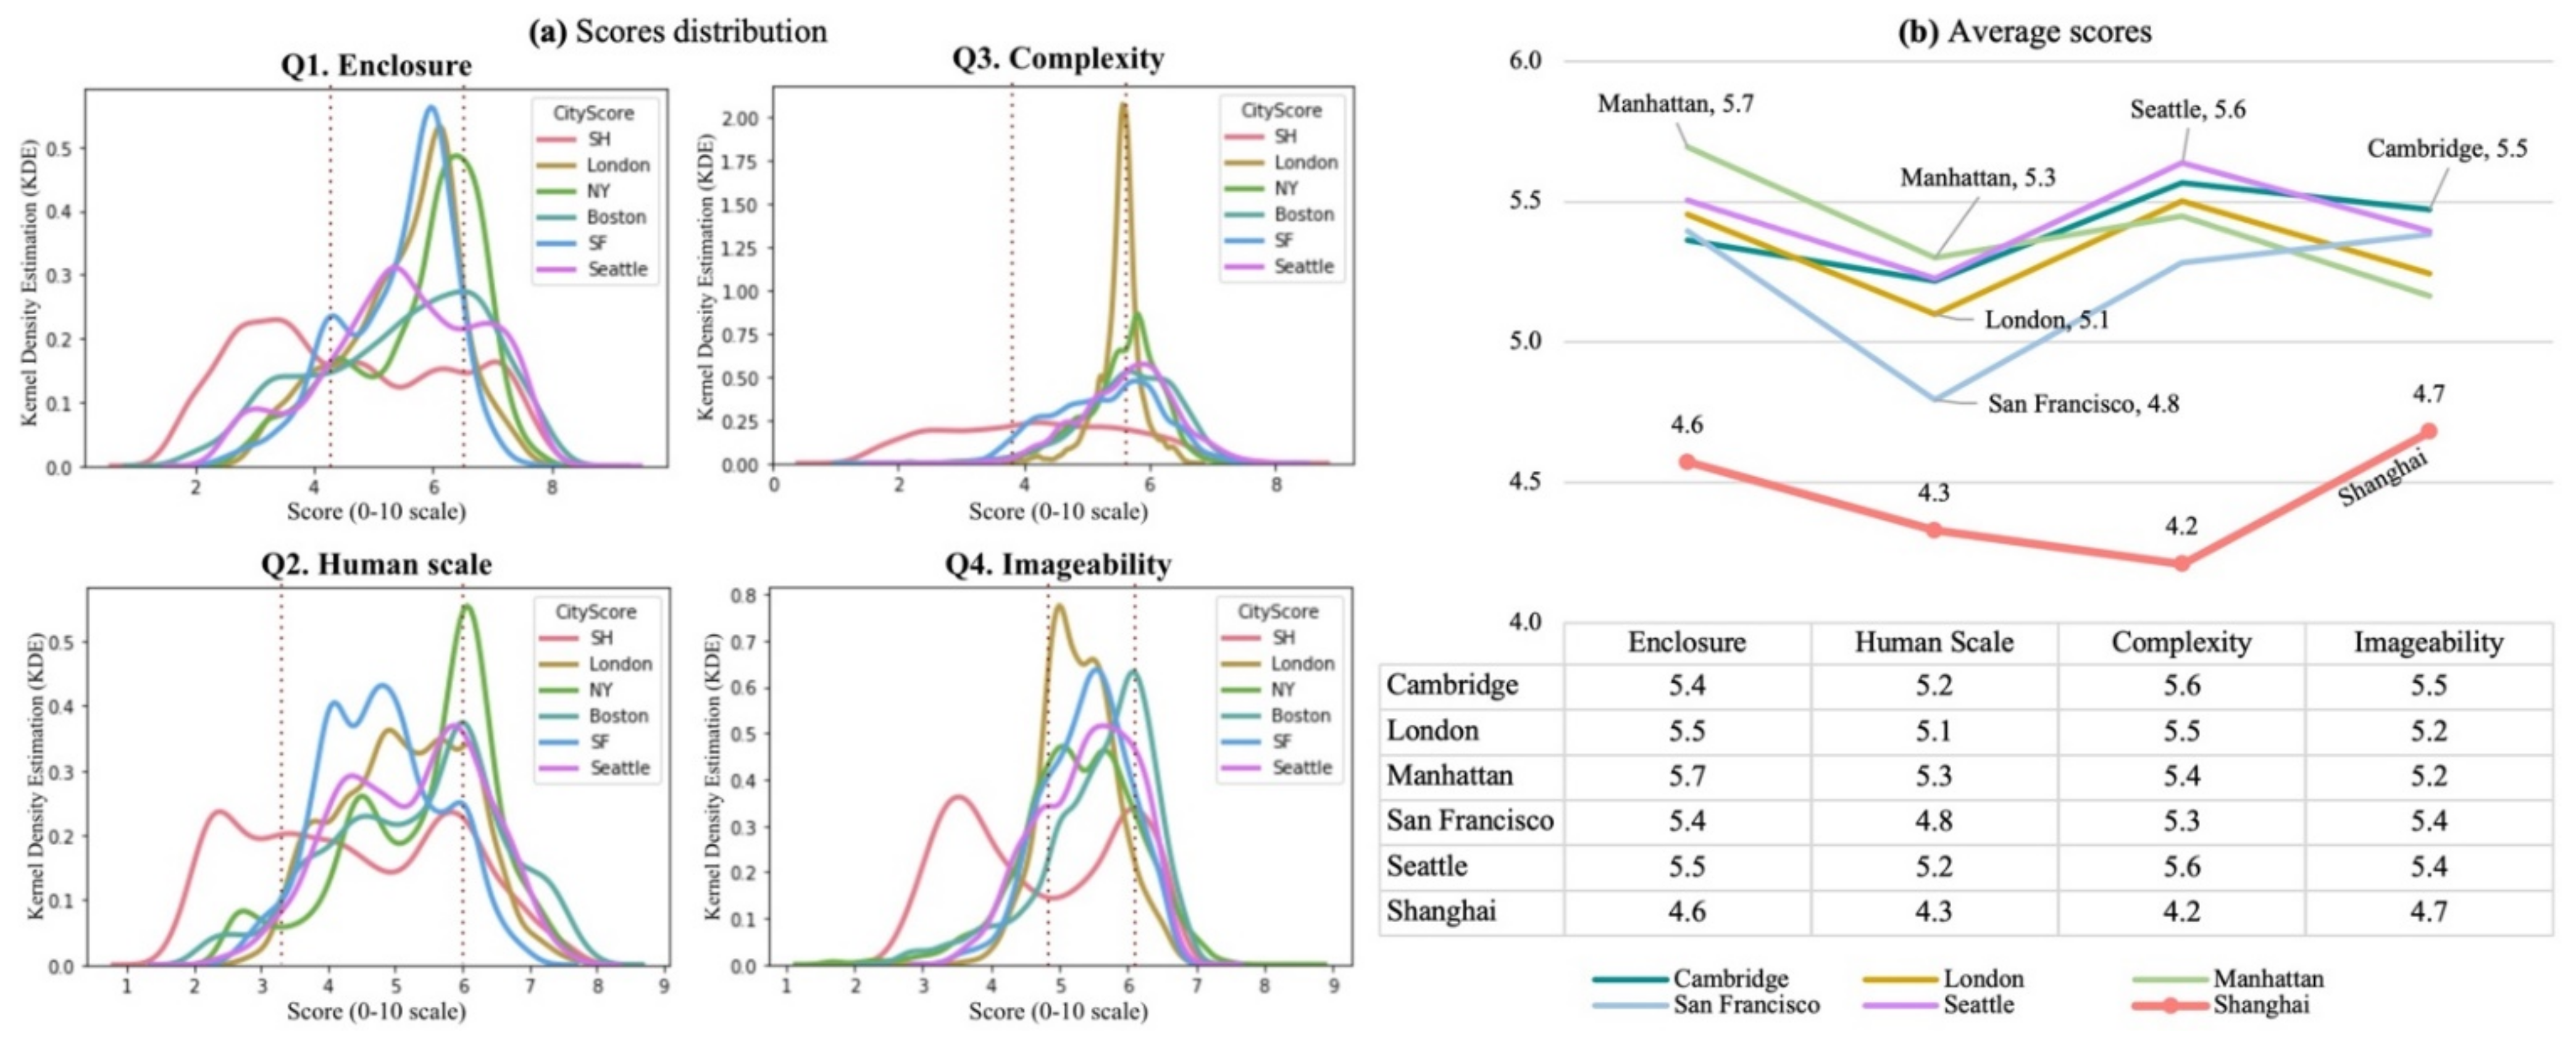
Specifically, depicted by Table 4, all five of the global districts have smaller variance (1.14 to 2.27) and standard deviation (1.07 to 1.51) in the average score, compared to that of Shanghai Pudong (3.38 and 1.84). Our findings suggest that the averaged street design quality of the Pudong area has large potential to increase. Meanwhile, the qualities in Pudong are highly polarized (Figure 8a), implying its biased and uneven urban development. It also suggests future study to investigate whether such uneven distribution has posed inequitable issues to specific population segments [9]. Moreover, the global comparison results confirm that our proposed method is applicable to a wide range of regions, and the results are reproducible and comparable.
Regarding individual quality perception, Pudong is still perceived the most unevenly and has a polarized distribution, with its mean score in all four dimensions being the lowest (Figure 8a and Table 4). Figure 8b depicts that the enclosure and complexity scores see the largest gap between Pudong and other best practice locations. Based on our previous analysis, sky, building, trees, and people significantly affect the quality of these two perceptions. Therefore, tailored urban design actions, such as adjusting zoning codes to increase the maximum FAR allowed and encouraging more transportation-oriented development (TOD), could potentially improve the perceived enclosure and complexity.
4.7. Cross-Reference to Zoning Metrics
To provide more actionable policy suggestions for urban renewal, we cross-referenced perception scores to several important objective metrics from urban form and density (Figure 9). The compared metrics, such as average block size, street width, and floor area ratio (FAR), all have significant implications for travel demand, pedestrian behavior, and urban design [3]. Zhangjiang has the widest roads but the lowest measured density, which explains why it has the lowest perceived enclosure, since lower building heights and wider streets lead to less enclosure [4]. Less enclosure limits the neighborhood walkability and results in less walking behaviors, which is confirmed by the pedestrian counts from the SVIs.
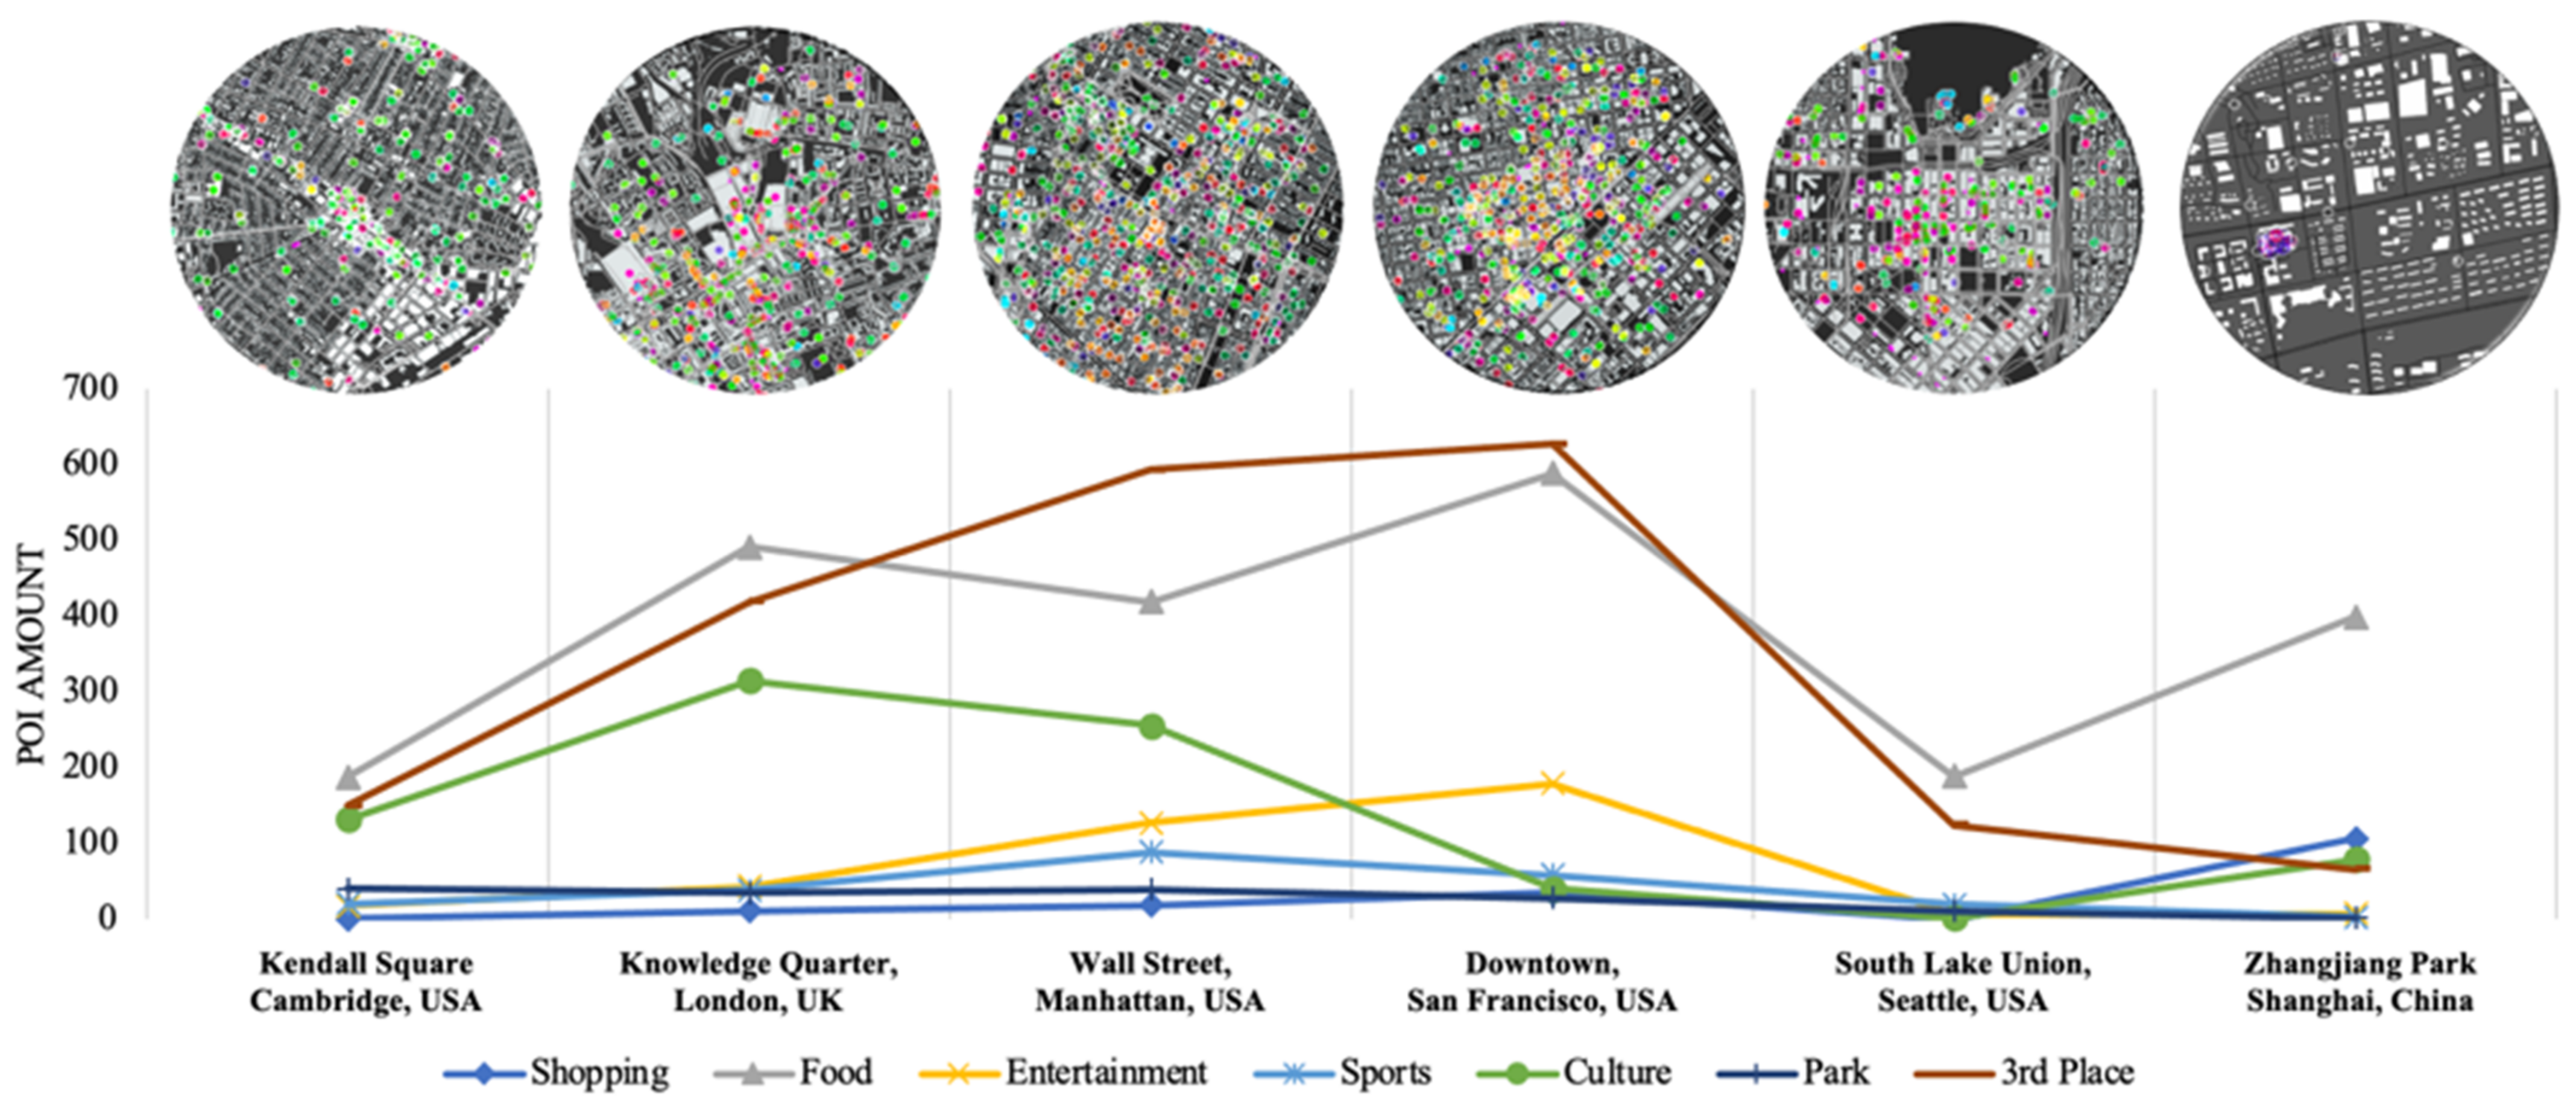
Regarding the number of POIs with amenities and services, Zhangjiang also has the least density (Figure 10). In addition, all amenity POIs are concentrated within a specific spot, which is the shopping complex next to a metro station. For other cities, such as London, Downtown San Francisco, or Cambridge, the distribution of amenities is more homogeneous and even. Figure 10 depicts that the amenities in urban cores of other global cities, and shows how they are all more reachable and within a reasonable walking distance. This finding is also consistent with our analysis that Zhangjian is perceived as the worst city regarding complexity score compared to the other studied areas.
5. Conclusions
5.1. The Effectiveness of Proposed Subjective Measure Framework
While this method may not immediately replace the long-existing techniques in urban environment auditing, it offers many merits. For example, it is closely related to the pedestrians’ perspective, has a low-cost, requests nothing from proprietary software or methods, and can be commonly applied to where an SVI dataset is available. The proposed method provides a useful alternative for planners and policymakers.
First, the cross-study of six global urban cores including the Pudong district confirms the generalizability of our proposed framework. Our proposed framework is viable to consistently predict perceptions from open-source SVI datasets that widely exist. The results are reproducible and are therefore comparable for cross-study purposes. All of the four important human perceptions suggested by urban design theory have been successfully operationalized in our study. Notably, we improved the accuracy rates regarding R2 after comparing it to prior work [2], largely owing to capability of pre-trained CV models in accurately extracting more kinds of street features at a large-scale compared to collecting this information through human labor. Our results are also better because ML models perform better in predicting tasks with higher dimensional feature space when they are compared to conventional regression models used by Ewing and Handy [2].
Second, subjective measures capture more comprehensive and subtle human perceptions than using individual view indices. On the one hand, our findings that “enclosure” and “complexity” are positively correlated are consistent with the literature [2]. On the other hand, we found seriously correlated associations between human scale and enclosure, which indicates future studies to more explicitly investigate the divergence and coherence between subjective measures. Furthermore, more streetscape features were found to be significant in affecting human perception compared to the literature, while some elements that are conventionally perceived important, such as the streetlights and the signboards, were not highly ranked in our study.
Third, although they were simply measured from images, perceptual scores capture many urban space qualities and characteristics that have only been accessible when using objectively measured urban metrics. For example, the perceived “complexity” exabits a strong correlation with the POI density of urban amenities and services. When cross-referencing “enclosure” and “human scale” to urban density and urban form metrics like FAR, street width, building height, block size, we also found a significant correlation.
Fourth, while objective metrics must be measured using massive POIs and urban 3D model data with complicated workflows with ArcGIS and Rhino, our framework can stand alone without any licensed programs and software. All of the information that is needed is open- source. Therefore, compared to other objective measures of urban form, our proposed framework is more accessible and has higher throughput. Furthermore, unlike deep learning frameworks [8,9] that predict perceptual scores directly from generic image features, our approach follows fundamental urban design theory and identifies a wide range of streetscape features affecting different perceptions. Therefore, it provides more actionable policy implications for urban designers and planners.
Finally, the cross-study indicates that the polarized and uneven urban development in the Pudong District is prevailing, especially compared to global best practices. Unlike other benchmark cities, Pudong has the largest score variances and the lowest average scores within all four perceptions. Particularly, the perceived “enclosure” and “complexity” see the largest gap. On the one hand, our findings suggest the need for a more equable and wise allocation of urban design efforts and resources invested to improve periphery areas, especially in residential and innovative industrial parks like Zhangjiang. Street qualities are vital to the quality of life to urban residents as well as to facilitate urban innovation. On the other hand, since sky, buildings, trees, and people significantly affect these two perceptions, more tailored urban design actions should be applied. For example, adjusting zoning codes to increase the allowed FAR and encouraging more transportation-oriented development (TOD) and mixed-use development could potentially improve the perceived enclosure and complexity in Pudong.
5.2. Limitations and Next Steps
Our studies have several limitations. First, limited by time and resourced, our SVI segmentation only used pre-trained CV models on the most common streetscape classifications. Future studies could train specific classification models to fulfil more tailored tasks, such as to extract building façades and windows and to identify façade styles, which significantly affect many design quality related human perceptions [2,18,48]. Second, our training data size was limited by the scarcity of volunteer raters. Only 23 raters were involved, and 300 sample SVIs were rated. A larger sample size and more participants could potentially increase the accuracy and reliability of perception predictions. Meanwhile, the subjective perceptual scores were not randomly selected. They were collected from a very specific and small study group consisting of only designers. In the future, inputs from volunteers with other areas of knowledge such as those working in real estate or home buyers will be more desirable, which would likely shed light on more unbiased civic preferences. Third, thanks to our reviewers, our data might provide more convincing and reliable information on streetscape feature importance if the experiment design performs the feature classification first and asks raters to not only compare street scenes, but to also select the most attractive features from the scene. Fourth, further investigation could be done to address the divergence and coherence between subjective perceptions and the objective metrics of urban forms. Last, the data source could be further improved. Although the acquired street-level images could help us understand the quality of public streets, the impacts of the private streets of inner blocks remained unknown due to the lack of SVI data.
Author Contributions
Conceptualization, W.Q. and X.H.; methodology, W.Q.; software, W.Q. and X.L.; validation, W.Q.; formal analysis, W.Q.; investigation, W.Q.; resources, W.Q., W.L., X.L. and X.H.; data curation, W.Q., W.L. and X.L.; writing—original draft preparation, W.Q.; writing—review and editing, W.Q. and W.L.; visualization, W.Q.; supervision, W.Q.; project administration, W.Q.; funding acquisition, W.Q. All authors have read and agreed to the published version of the manuscript.
Funding
This research received the 2019 Kermit C. & Janice I. Parsons Scholarship from the City and Regional Planning Department, Cornell University.
Institutional Review Board Statement
Ethical review and approval were waived for this study due to the fact that the analyzed datasets are properly anonymized, and no participant can be identified.
Informed Consent Statement
Written informed consent was waived due to the fact that the analyzed datasets are properly anonymized, and no participant can be identified.
Data Availability Statement
The data presented in this study are available upon request from the corresponding author.
Acknowledgments
We would like to thank the participants who helped rank SVI perception qualities in the 2020 Digital Future Workshop as well as the sponsors and organizers of the workshop—Philip Yuan and Tongji University. We also want to thank Ruijun Liu from Harvard GSD, Shuyi Shao from Carnegie Mellon University, and Xiaotong Yang from Cornell CRP for their helps.
Conflicts of Interest
The authors declare no conflict of interest.
References
- Dubey, A.; Naik, N.; Parikh, D.; Raskar, R.; Hidalgo, C.A. Deep Learning the City: Quantifying Urban Perception at A Global Scale. In European Conference on Computer Vision; Springer: Cham, Switzerland, 2016. [Google Scholar]
- Ewing, R.; Handy, S. Measuring the Unmeasurable: Urban Design Qualities Related to Walkability. J. Urban Des. 2009, 14, 65–84. [Google Scholar] [CrossRef]
- Cervero, R.; Kockelman, K. Travel Demand and the 3Ds: Density, Diversity, and Design. Transp. Res. Part D Transp. Environ. 1997, 2, 199–219. [Google Scholar] [CrossRef]
- Yin, L.; Wang, Z. Measuring Visual Enclosure for Street Walkability: Using Machine Learning Algorithms and Google Street View Imagery. Appl. Geogr. 2016, 76, 147–153. [Google Scholar] [CrossRef]
- Zhang, F.; Zhou, B.; Liu, L.; Liu, Y.; Fung, H.H.; Lin, H.; Ratti, C. Measuring Human Perceptions of a Large-Scale Urban Region Using Machine Learning. Landsc. Urban Plan. 2018, 180, 148–160. [Google Scholar] [CrossRef]
- Yin, L.; Cheng, Q.; Wang, Z.; Shao, Z. ‘Big Data’ for Pedestrian Volume: Exploring the Use of Google Street View Images for Pedestrian Counts. Appl. Geogr. 2015, 63, 337–345. [Google Scholar] [CrossRef]
- Lin, L.; Moudon, A.V. Objective versus Subjective Measures of the Built Environment, Which Are Most Effective in Capturing Associations with Walking? Health Place 2010, 16, 339–348. [Google Scholar] [CrossRef] [PubMed]
- Naik, N.; Philipoom, J.; Raskar, R.; Hidalgo, C. Streetscore—Predicting the perceived safety of one million streetscapes. In Proceedings of the 2014 IEEE Conference on Computer Vision and Pattern Recognition Workshops, Columbus, OH, USA, 11–15 June 2014; pp. 793–799. [Google Scholar]
- Salesses, P.; Schechtner, K.; Hidalgo, C.A. The Collaborative Image of The City: Mapping the Inequality of Urban Perception. PLoS ONE 2013, 8, e68400. [Google Scholar] [CrossRef] [Green Version]
- Ma, X.; Ma, C.; Wu, C.; Xi, Y.; Yang, R.; Peng, N.; Zhang, C.; Ren, F. Measuring Human Perceptions of Streetscapes to Better Inform Urban Renewal: A Perspective of Scene Semantic Parsing. Cities 2021, 110, 103086. [Google Scholar] [CrossRef]
- Ewing, R.; Cervero, R. Travel and the Built Environment: A Meta-Analysis. J. Am. Plann. Assoc. 2010, 76, 265–294. [Google Scholar] [CrossRef]
- Lynch, K. The Image of the City; The MIT Press: Cambridge, MA, USA, 1960; Volume 11, ISBN 978-0-262-12004-3. [Google Scholar]
- Li, X.; Zhang, C.; Li, W.; Ricard, R.; Meng, Q.; Zhang, W. Assessing Street-Level Urban Greenery Using Google Street View and a Modified Green View Index. Urban For. Urban Green. 2015, 14, 675–685. [Google Scholar] [CrossRef]
- Rundle, A.G.; Bader, M.D.M.; Richards, C.A.; Neckerman, K.M.; Teitler, J.O. Using Google Street View to Audit Neighborhood Environments. Am. J. Prev. Med. 2011, 40, 94–100. [Google Scholar] [CrossRef] [Green Version]
- Chen, L.; Yao, X.; Liu, Y.; Zhu, Y.; Chen, W.; Zhao, X.; Chi, T. Measuring Impacts of Urban Environmental Elements on Housing Prices Based on Multisource Data—A Case Study of Shanghai, China. ISPRS Int. J. Geo-Inf. 2020, 9, 106. [Google Scholar] [CrossRef] [Green Version]
- Qiu, W.; Li, W.; Zhang, Z.; Li, X.; Liu, X.; Huang, X. Subjective and Objective Measures of Streetscape Perceptions: Relationships with Property Value in Shanghai. Preprints 2021. [Google Scholar] [CrossRef]
- Glaeser, E.L.; Kominers, S.D.; Luca, M.; Naik, N. Big data and big cities: The promises and limitations of improved measures of urban life: Big data and big cities. Econ. Inq. 2018, 56, 114–137. [Google Scholar] [CrossRef]
- Ewing, R.; Handy, S.; Brownson, R.C.; Clemente, O.; Winston, E. Identifying and Measuring Urban Design Qualities Related to Walkability. J. Phys. Act. Health 2006, 3, S223–S240. [Google Scholar] [CrossRef] [PubMed]
- Herbrich, R.; Minka, T.; Graepel, T. TrueSkill: A bayesian skill rating system. In Proceedings of the 19th International Conference on Neural Information Processing Systems, Vancouver, BC, Canada, 4–7 December 2006; pp. 569–576. [Google Scholar]
- Fu, X.; Jia, T.; Zhang, X.; Li, S.; Zhang, Y. Do Street-Level Scene Perceptions Affect Housing Prices in Chinese Megacities? An Analysis Using Open Access Datasets and Deep Learning. PLoS ONE 2019, 14, e0217505. [Google Scholar] [CrossRef]
- Zhao, H.; Shi, J.; Qi, X.; Wang, X.; Jia, J. Pyramid Scene Parsing Network. arXiv, 2016; arXiv:1612.01105. [Google Scholar]
- Gong, F.-Y.; Zeng, Z.-C.; Zhang, F.; Li, X.; Ng, E.; Norford, L.K. Mapping Sky, Tree, and Building View Factors of Street Canyons in a High-Density Urban Environment. Build. Environ. 2018, 134, 155–167. [Google Scholar] [CrossRef]
- He, K.; Gkioxari, G.; Dollár, P.; Girshick, R. Mask R-CNN. arXiv, 2017; arXiv:1703.06870. [Google Scholar]
- Jain, A.K.; Chandrasekaran, B. 39 Dimensionality and sample size considerations in pattern recognition practice. In Handbook of Statistics; Classification Pattern Recognition and Reduction of Dimensionality; Elsevier: Amsterdam, The Netherlands, 1982; Volume 2, pp. 835–855. [Google Scholar]
- Nembrini, S.; König, I.R.; Wright, M.N. The Revival of the Gini Importance? Bioinformatics 2018, 34, 3711–3718. [Google Scholar] [CrossRef] [Green Version]
- Pedregosa, F.; Varoquaux, G.; Gramfort, A.; Michel, V.; Thirion, B.; Grisel, O.; Blondel, M.; Prettenhofer, P.; Weiss, R.; Dubourg, V.; et al. Scikit-Learn: Machine Learning in Python. J. Mach. Learn. Res. 2011, 12, 2825–2830. [Google Scholar]
- Feng, H.; Shu, Y.; Wang, S.; Ma, M. SVM-Based Models for Predicting WLAN Traffic. In Proceedings of the 2006 IEEE International Conference on Communications, Istanbul, Turkey, 11–15 June 2006; Volume 2, pp. 597–602. [Google Scholar]
- Hankey, S.; Zhang, W.; Le, H.T.K.; Hystad, P.; James, P. Predicting Bicycling and Walking Traffic Using Street View Imagery and Destination Data. Transp. Res. Part D Transp. Environ. 2021, 90, 102651. [Google Scholar] [CrossRef]
- Safat, W.; Asghar, S.; Gillani, S.A. Empirical Analysis for Crime Prediction and Forecasting Using Machine Learning and Deep Learning Techniques. IEEE Access 2021, 9, 70080–70094. [Google Scholar] [CrossRef]
- Willmott, C.J.; Matsuura, K. Advantages of the Mean Absolute Error (MAE) over the Root Mean Square Error (RMSE) in Assessing Average Model Performance. Clim. Res. 2005, 30, 79–82. [Google Scholar] [CrossRef]
- Esmaeilpoorarabi, N.; Yigitcanlar, T.; Guaralda, M. Place Quality in Innovation Clusters: An Empirical Analysis of Global Best Practices from Singapore, Helsinki, New York, and Sydney. Cities 2018, 74, 156–168. [Google Scholar] [CrossRef] [Green Version]
- Esmaeilpoorarabi, N.; Yigitcanlar, T.; Guaralda, M.; Kamruzzaman, M. Evaluating Place Quality in Innovation Districts: A Delphic Hierarchy Process Approach. Land Use Policy 2018, 76, 471–486. [Google Scholar] [CrossRef]
- Jiang, X.; Fu, W.; Li, G. Can the Improvement of Living Environment Stimulate Urban Innovation? Analysis of High-Quality Innovative Talents and Foreign Direct Investment Spillover Effect Mechanism. J. Clean. Prod. 2020, 255, 120212. [Google Scholar] [CrossRef]
- Zeng, G.; Liefner, I.; Si, Y. The Role of High-Tech Parks in China’s Regional Economy: Empirical Evidence from the IC Industry in the Zhangjiang High-Tech Park, Shanghai. Arch. Sci. Geogr. 2011, 65, 43–53. [Google Scholar] [CrossRef]
- Bevilacqua, C.; Pizzimenti, P. Urban Planning and Innovation: The Strength Role of the Urban Transformation Demand. The Case of Kendall Square in Cambridge. In New Metropolitan Perspectives; Calabrò, F., Della Spina, L., Bevilacqua, C., Eds.; Springer International Publishing: Cham, Switzerland, 2019; pp. 272–281. [Google Scholar]
- Hu, R. Urban Design Plans for Downtown San Francisco: A Paradigm Shift? J. Urban Des. 2013, 18, 517–533. [Google Scholar] [CrossRef]
- Bowles, J.; Giles, D. New Tech City; Center for an Urban Future: New York, NY, USA, 2012. [Google Scholar]
- O’Mara, M. The Environmental Contradictions of High-Tech Urbanism. In Now Urbanism; Routledge: Milton Park, UK, 2014; pp. 40–56. ISBN 978-1-315-75306-5. [Google Scholar]
- Cooke, P. Knowledge Economies: Clusters, Learning and Cooperative Advantage; Routledge: Milton Park, UK, 2002; ISBN 978-0-415-75716-4. [Google Scholar]
- Bergquist, K.; Raffo, J.; Fink, C. Identifying and Ranking the World’s Largest Clusters of Inventive Activity; WIPO Economic Research Working Papers; WIPO: Geneva, Switzerland, 2017. [Google Scholar]
- Marra, A.; Cassetta, E.; Antonelli, P. Emerging Specialisations and Software Metropolitan Clusters—A Comparative Network Analysis on San Francisco, New York and London. Int. J. Technol. Learn. Innov. Dev. 2017, 9, 17–41. [Google Scholar] [CrossRef]
- Yigitcanlar, T.; Han, H.; Kamruzzaman, M.; Ioppolo, G.; Sabatini-Marques, J. The Making of Smart Cities: Are Songdo, Masdar, Amsterdam, San Francisco and Brisbane the Best We Could Build? Land Use Policy 2019, 88, 104187. [Google Scholar] [CrossRef]
- Ye, Y.; Xie, H.; Fang, J.; Jiang, H.; Wang, D. Daily Accessed Street Greenery and Housing Price: Measuring Economic Performance of Human-Scale Streetscapes via New Urban Data. Sustainability 2019, 11, 1741. [Google Scholar] [CrossRef] [Green Version]
- Jansson, C. Factors Important to Street Users’ Perceived Safety on a Main Street; Skolan För Arkitektur Och Samhällsbyggnad: Stockholm, Sweden, 2019. [Google Scholar]
- Li, X.; Zhang, C.; Li, W. Does the Visibility of Greenery Increase Perceived Safety in Urban Areas? Evidence from the Place Pulse 1.0 Dataset. ISPRS Int. J. Geo-Inf. 2015, 4, 1166–1183. [Google Scholar] [CrossRef] [Green Version]
- Yu, H.; Kim, S. SVM Tutorial—Classification, Regression and Ranking. In Handbook of Natural Computing; Rozenberg, G., Bäck, T., Kok, J.N., Eds.; Springer: Berlin/Heidelberg, Germany, 2012; pp. 479–506. ISBN 978-3-540-92910-9. [Google Scholar]
- Pranckevičius, T.; Marcinkevicius, V. Comparison of naive bayes, random forest, decision tree, support vector machines, and logistic regression classifiers for text reviews classification. Balt J. Mod. Comput. 2017. [Google Scholar] [CrossRef]
- Jacobs, J. The Death and Life of Great American Cities; Vintage Books: New York, NY, USA, 1992; ISBN 978-0-679-74195-4. [Google Scholar]
Figure 1.
Analytical framework (a) based on literature in urban design qualities and (b) the selection of the four perceptual qualities and their contributing features.
Figure 1.
Analytical framework (a) based on literature in urban design qualities and (b) the selection of the four perceptual qualities and their contributing features.

Figure 2.
Downloading Baidu SVIs (a) SVI sample sites. (b) A typical SVI downloaded for this study. (c) The camera settings were controlled using “heading”, “FOV”, “pitch”, and “resolution”.
Figure 2.
Downloading Baidu SVIs (a) SVI sample sites. (b) A typical SVI downloaded for this study. (c) The camera settings were controlled using “heading”, “FOV”, “pitch”, and “resolution”.

Figure 3.
Collecting collaborative images of streetscapes with an online survey platform. (a) Our online survey system asked participants to click on one imagine in a pair of SVIs in response to evaluative questions. (b) High score and low score example images as well as the histogram of score distribution for each of the four perceived street qualities.

Figure 4.
CV Segmentation results. (a) Pairwise PSPNet semantic segmentation results with its raw input. (b) Mask R-CNN instance segmentation results counting objects.
Figure 4.
CV Segmentation results. (a) Pairwise PSPNet semantic segmentation results with its raw input. (b) Mask R-CNN instance segmentation results counting objects.

Figure 5.
Top 15 important features in predicting four subjective scores.

Figure 6.
Mapping of (a) correlations between complexity score and POI density. (b) Cognitive maps of four subjectively predicted perceptual qualities.
Figure 6.
Mapping of (a) correlations between complexity score and POI density. (b) Cognitive maps of four subjectively predicted perceptual qualities.

Figure 7.
Comparing the perceptual qualities of six cities. (a) Locations. (b) Average score distribution. (c) SVI samples and study area mapping.
Figure 7.
Comparing the perceptual qualities of six cities. (a) Locations. (b) Average score distribution. (c) SVI samples and study area mapping.

Figure 8.
Comparing the perceptual qualities of six cities. (a) Score distributions. (b) Averaged scores.
Figure 8.
Comparing the perceptual qualities of six cities. (a) Score distributions. (b) Averaged scores.

Figure 9.
Comparing (a) urban fabrics and block metrics and (b) development density and metrics.

Figure 10.
Comparing amounts of urban amenities and services especially the 3rd place.


Table 1.
Descriptive summary of 30 streetscape features.
| FID | Physical Feature | Mean | Std. Dev. | Min | Max |
|---|---|---|---|---|---|
| View Index using PSPNet | |||||
| 1 | Sky | 32.57% | 17.61% | 0.00% | 76.20% |
| 2 | Buildings | 22.71% | 19.60% | 0.00% | 96.37% |
| 3 | Trees | 18.63% | 16.26% | 0.00% | 81.10% |
| 4 | Roads | 10.74% | 5.21% | 0.00% | 22.33% |
| 5 | Sidewalks | 2.21% | 2.48% | 0.00% | 17.57% |
| 6 | Walls | 1.86% | 6.42% | 0.00% | 75.05% |
| 7 | Fences | 1.65% | 2.26% | 0.00% | 13.13% |
| 8 | Overpasses | 1.58% | 7.67% | 0.00% | 57.10% |
| 9 | Plants | 1.24% | 2.05% | 0.00% | 14.91% |
| 10 | Grass | 1.10% | 2.05% | 0.00% | 13.94% |
| 11 | Signs | 0.65% | 1.06% | 0.00% | 7.41% |
| 12 | Bridges | 0.37% | 2.80% | 0.00% | 36.87% |
| 13 | Railings | 0.34% | 1.01% | 0.00% | 7.89% |
| 14 | Skyscrapers | 0.32% | 1.67% | 0.00% | 19.95% |
| 15 | Earth | 0.20% | 1.02% | 0.00% | 13.89% |
| 16 | Vans | 0.14% | 0.68% | 0.00% | 7.00% |
| 17 | Columns | 0.13% | 0.86% | 0.00% | 13.00% |
| 18 | Streetlights | 0.07% | 0.13% | 0.00% | 0.93% |
| 19 | Awnings | 0.04% | 0.25% | 0.00% | 2.87% |
| 20 | Ashcans | 0.01% | 0.07% | 0.00% | 1.05% |
| 21 | Windows | 0.01% | 0.05% | 0.00% | 0.80% |
| 22 | Booths | 0.01% | 0.03% | 0.00% | 0.66% |
| 23 | Sculptures | 0.01% | 0.07% | 0.00% | 1.26% |
| 24 | Mountains | 0.01% | 0.00% | 0.00% | 0.03% |
| 25 | Fountains | 0.01% | 0.02% | 0.00% | 0.41% |
| Absolute counts using MASK R-CNN | |||||
| 26 | People | 3.11 | 4.17 | 0.00 | 37.00 |
| 27 | Cars | 5.56 | 5.91 | 0.00 | 39.00 |
| 28 | Bicycles | 0.13 | 0.46 | 0.00 | 3.00 |
| 29 | Motorcycles | 0.21 | 0.78 | 0.00 | 10.00 |
| 30 | Benches | 0.25 | 0.84 | 0.00 | 6.00 |
Table 2.
Performance of machine learning algorithms.
| Model | Enclosure | Human Scale | Complexity | Imageability | ||||
|---|---|---|---|---|---|---|---|---|
| R2 | MAE | R2 | MAE | R2 | MAE | R2 | MAE | |
| Linear Regression | 0.38 | 1.31 | 0.22 | 1.81 | 0.15 | 1.69 | 0.19 | 1.82 |
| K-Nearest Neighbors (KNN) | 0.34 | 1.31 | 0.07 | 1.81 | 0.36 | 1.70 | 0.21 | 1.77 |
| Support Vector Machine (SVM) | 0.41 | 1.25 | 0.24 | 1.79 | 0.48 * | 1.51 * | 0.49 * | 1.50 * |
| Random Forest (RF) | 0.47 * | 1.19 * | 0.29 | 1.73 | 0.43 | 1.55 | 0.27 | 1.63 |
| Decision Tree (DT) | 0.18 | 1.58 | 0.05 | 2.36 | 0.26 | 2.29 | 0.08 | 2.14 |
| Voting Selection (VS) | 0.43 | 1.26 | 0.26 | 1.78 | 0.35 | 1.60 | 0.31 | 1.60 |
| Gradient Boosting (GB) | 0.47 | 1.21 | 0.51 * | 1.62 * | 0.41 | 1.52 | 0.14 | 2.01 |
| Adaptive Boost (ADAB) | 0.26 | 1.53 | 0.20 | 1.84 | 0.41 | 1.52 | 0.32 | 1.63 |
* Denotes best performance models for each perception score prediction.
Table 3.
Pearson correlation of four subjectively measured perceptions.
| Enclosure | Human Scale | Complexity | Imageability | |
|---|---|---|---|---|
| Enclosure | 1.00 | 0.91 *** | 0.84 *** | 0.51 *** |
| Human scale | 0.91 *** | 1.00 | 0.82 *** | 0.51 *** |
| Complexity | 0.84 *** | 0.82 *** | 1.00 | 0.34 *** |
| Imageability | 0.51 *** | 0.51 *** | 0.34 *** | 1.00 |
*** p < 0.01.
Table 4.
Average scores, standard deviation and variances.
| City | Sample | Enclosure | Human Scale | Complexity | Imageability | Avg. Score | Variance | Std. Dev. |
|---|---|---|---|---|---|---|---|---|
| Cambridge | 6354 | 5.36 | 5.22 | 5.57 | 5.47 | 5.41 | 2.16 | 1.47 |
| London | 6019 | 5.45 | 5.10 | 5.50 | 5.24 | 5.33 | 1.22 | 1.10 |
| Manhattan | 6716 | 5.70 | 5.30 | 5.45 | 5.17 | 5.40 | 1.14 | 1.07 |
| San Francisco | 6410 | 5.40 | 4.79 | 5.28 | 5.38 | 5.21 | 1.41 | 1.19 |
| Seattle | 6517 | 5.51 | 5.23 | 5.64 | 5.40 | 5.44 | 2.27 | 1.51 |
| Shanghai | 14,274 | 4.57 | 4.33 | 4.21 | 4.68 | 4.45 | 3.38 | 1.84 |
Publisher’s Note: MDPI stays neutral with regard to jurisdictional claims in published maps and institutional affiliations. |
© 2021 by the authors. Licensee MDPI, Basel, Switzerland. This article is an open access article distributed under the terms and conditions of the Creative Commons Attribution (CC BY) license (https://creativecommons.org/licenses/by/4.0/).
Share and Cite
MDPI and ACS Style
Qiu, W.; Li, W.; Liu, X.; Huang, X. Subjectively Measured Streetscape Perceptions to Inform Urban Design Strategies for Shanghai. ISPRS Int. J. Geo-Inf. 2021, 10, 493. https://0-doi-org.brum.beds.ac.uk/10.3390/ijgi10080493
AMA Style
Qiu W, Li W, Liu X, Huang X. Subjectively Measured Streetscape Perceptions to Inform Urban Design Strategies for Shanghai. ISPRS International Journal of Geo-Information. 2021; 10(8):493. https://0-doi-org.brum.beds.ac.uk/10.3390/ijgi10080493
Chicago/Turabian StyleQiu, Waishan, Wenjing Li, Xun Liu, and Xiaokai Huang. 2021. "Subjectively Measured Streetscape Perceptions to Inform Urban Design Strategies for Shanghai" ISPRS International Journal of Geo-Information 10, no. 8: 493. https://0-doi-org.brum.beds.ac.uk/10.3390/ijgi10080493
Note that from the first issue of 2016, this journal uses article numbers instead of page numbers. See further details here.