
Water Yield Modelling, Sensitivity Analysis and Validation: A Study for Portugal


NOVA Information Management School (NOVA IMS), Universidade Nova de Lisboa, 1070-312 Lisboa, Portugal
*
Author to whom correspondence should be addressed.
ISPRS Int. J. Geo-Inf. 2021, 10(8), 494; https://0-doi-org.brum.beds.ac.uk/10.3390/ijgi10080494
Submission received: 31 May 2021
/
Revised: 11 July 2021
/
Accepted: 19 July 2021
/
Published: 21 July 2021
(This article belongs to the Special Issue Advances in GIS Hydrological Modeling)
Abstract
:The spatially explicit assessment of freshwater is key to introduce the ecosystem services (ES) concept into decision-making processes. Many tools are being developed to model water balance and to analyze the effects of meteorological conditions on water ES behaviors at multiple spatial scales. The current study uses the InVEST Annual Water Yield Model (WYM) to assess water availability in watersheds of the mainland of Portugal. The methodology included sensitivity analysis to test different parameters of the model and validation using the European Environment Agency (EEA) database on the quantity of Europe’s water resources. To evaluate the models’ sensitivity, Pearson’s correlation coefficients and statistical methods were calculated for each simulation. Results at the national level show a correlation coefficient of 0.803 with statistical significance for 0.01 one-tail. Water yield was underestimated by 56.5 mm/ha/year in the North of the country and overestimated by 58.1 mm/ha/year in the South. This difference was explained through the spatial-temporal assessment of the main climatic variables used as input. This study contributes to a methodology to assess the level of confidence in the WYM outputs and can be used to support the trustworthiness of water availability studies, using open-access data and software.
1. Introduction
Most of Nature’s contributions to people are not fully replaceable, and some are irreplaceable [1]. The long-term security of many ecosystem functions and services, especially in changing environments, is likely to depend upon local biodiversity, which has been facing growing pressures from human activities [2]. Some of those activities result in modifications in the natural landscapes around rivers and wetlands to the point that their biodiversity is put at risk [3]. Water yield is a key ecosystem function index [4], as it is vital to balancing socio-economic development and ecological security [5]. Climate and land use/land cover (LULC) changes are the main driving factors affecting water yield [4]. For the seventh consecutive year, the Global Risks Report 2018 listed water crises among the top five global risks both in terms of impact and in terms of likelihood [6]. To address these concerns, a good understanding of LULC impacts on the hydrological cycle affecting water yield is crucial [7] to increase the adaptation capacity of river basins [8]. The water yield capacity, positively correlated with precipitation, is highest under grassland vegetation and lowest in cultivated and unused land [5]. Since 1970, land-use change has had the largest relative negative impact on this service, followed by direct exploitation, in particular, overexploitation [1].
A River Basin District (RBD) represents the natural boundaries of a complex ecological system [9] and is defined as the area of land and sea, made up of one or more neighboring river basins together with their associated groundwaters and coastal waters. According to the report carried out by the Water Resources Group in 2009, by 2030 over a third of the world population will be living in river basins that will have to cope with significant water stress [10].
Droughts and water abstraction have been reported to be relevant for a major part of Portugal, representing significant pressures on both surface and groundwater ecosystems with direct impacts on water availability [11]. The seriousness of ecosystem degradation and scarcity of the services, as well as the existing institutional context, should always be the starting point for designing analysis and governance solutions [1].
A step towards the harmonisation of water, ecosystems and society can be achieved through the assessment, mapping and valuation of ES [8]. Water yield calculation and its mapping are one of the most important inputs for water resources planning and management [7]. The existing challenges to introduce the ESs concept into decision-making processes are related to the requirement for accurate mapping and evaluation, and a deep understanding of models’ sensitivities [12].
Nowadays, we are seeing a more explicit quantification of the value of nature in defining human-water interactions [3]. Several spatially-based decision support tools have emerged for ES assessment [13], and one of them is the Integrated Valuation of Ecosystem Services and Tradeoffs (InVEST), developed by the Stanford University Natural Capital Project. The InVEST Reservoir Hydropower Production Water Yield Model (WYM) estimates the relative contributions of water from different parts of a landscape, offering insights into how changes in land-use patterns affect water balance, freshwater provision accounts and hydropower production [12].
All parameters in the InVEST WYM display some degree of sensitivity [14]. Previous studies (e.g., [4,15]) show that the model can be very sensitive to changes in drivers such as meteorological data and land-use. Extremes variations in those drivers can alter hydrologic cycles, affecting patterns of evapotranspiration, infiltration, and water retention [16]. The goal of the InVEST model is not to reproduce observations with a high degree of accuracy and precision, but to provide reliable geospatial information to support decisions [17]. However, an important and often overlooked question is how accurate are the outputs of the WYM with empirical observations [12].
This paper aims to answer this question by studying the WYM uncertainties and estimating their accuracy. The model’s sensitivity is evaluated by testing: two different sources of climatic data; different values for the seasonality coefficient (Ζ; different grids of plant available water content. Model’s outputs are validated using the European Environment Agency (EEA) database on the quantity of Europe’s water resources of 2018. Model’s accuracy was calculated comparing mean estimated water yield with mean observed values from the validation data, and to evaluate the model’s sensitivity, Pearson’s correlation coefficients and statistical methods were calculated for each simulation. Analysing the sensitivity of the WYM and estimating its accuracy aim to build confidence in the model’s outputs, and to support studies related to the spatial estimation of water availability and water ES behaviours.
2. Materials and Methods
2.1. Study Area
Portugal is in the Iberian Peninsula (south-western Europe) comprising a continental part and two autonomous regions the Azores and Madeira archipelagos. The territory total area is 92,072 km2 and the population is about 9.8 million [18]. At a national level, the main problems associated with the management of water resources are related to water quality, nature conservation, supply and demand, water domain and planning, irrigation, information and knowledge, economic and financial regime, and energy security [19].
Like other southern European regions, Portugal is quite vulnerable to climate variability, namely to droughts and desertification, especially in the southern sector [20]. An estimate suggests that 58% of continental Portugal’s territory is vulnerable to desertification [21]. In the climatic perspective, it lays in the transitional region between the subtropical anticyclone and the sub-polar depression zones [22]. The most conditioning climate factors are latitude, orography and the effect of the Atlantic Ocean, characterizing high spatial and temporal variability [23] that affect the water cycle primarily through changes in the precipitation and temperature [24]. In mainland Portugal, the large temporal variability of the precipitation rates leads to precipitation extreme events and intense dry months, resulting in impacts in water resources, fire risk and ecosystem degradation [23].
Mean annual precipitation ranges from less than 500 mm in the South of Portugal up to 3000 mm in the North, with 40% of the annual amount falling in winter [22]. High temperatures and high evapotranspiration lead to higher average water consumption per hectare in southern European countries [25]. Water abstraction for irrigated agriculture has changed the flow regime of many river basins and lowered groundwater levels, particularly in these European regions [26]. Episodes of water scarcity occur in PTRH5 (Tejo and Ribeiras do Oeste) and in all RBDs to the south of it, where rain is more concentrated in fewer days during the year, and the “normal” year corresponds closely to a “dry” year [11]. Nevertheless, if there is suitable sustainable water management, the available water resources are sufficient to satisfy the needs [19].
The most represented land use classes in Portugal are agricultural areas and forest and semi-natural areas, namely transitional woodland-shrub [27]. The proportion of extensive crop production and extensive grazing is particularly high (59%) which could lead to better ecosystem condition under reduced pressures [28]. Therefore, changes in the vegetation cover and a poorly planned and managed forests have considerable impacts on the water cycle causing pressures on the water environment [26]. Portugal is one of the European countries with the highest diversity of organisms and farming systems, but at the same time is one of the countries more vulnerable to the loss of that diversity [19].
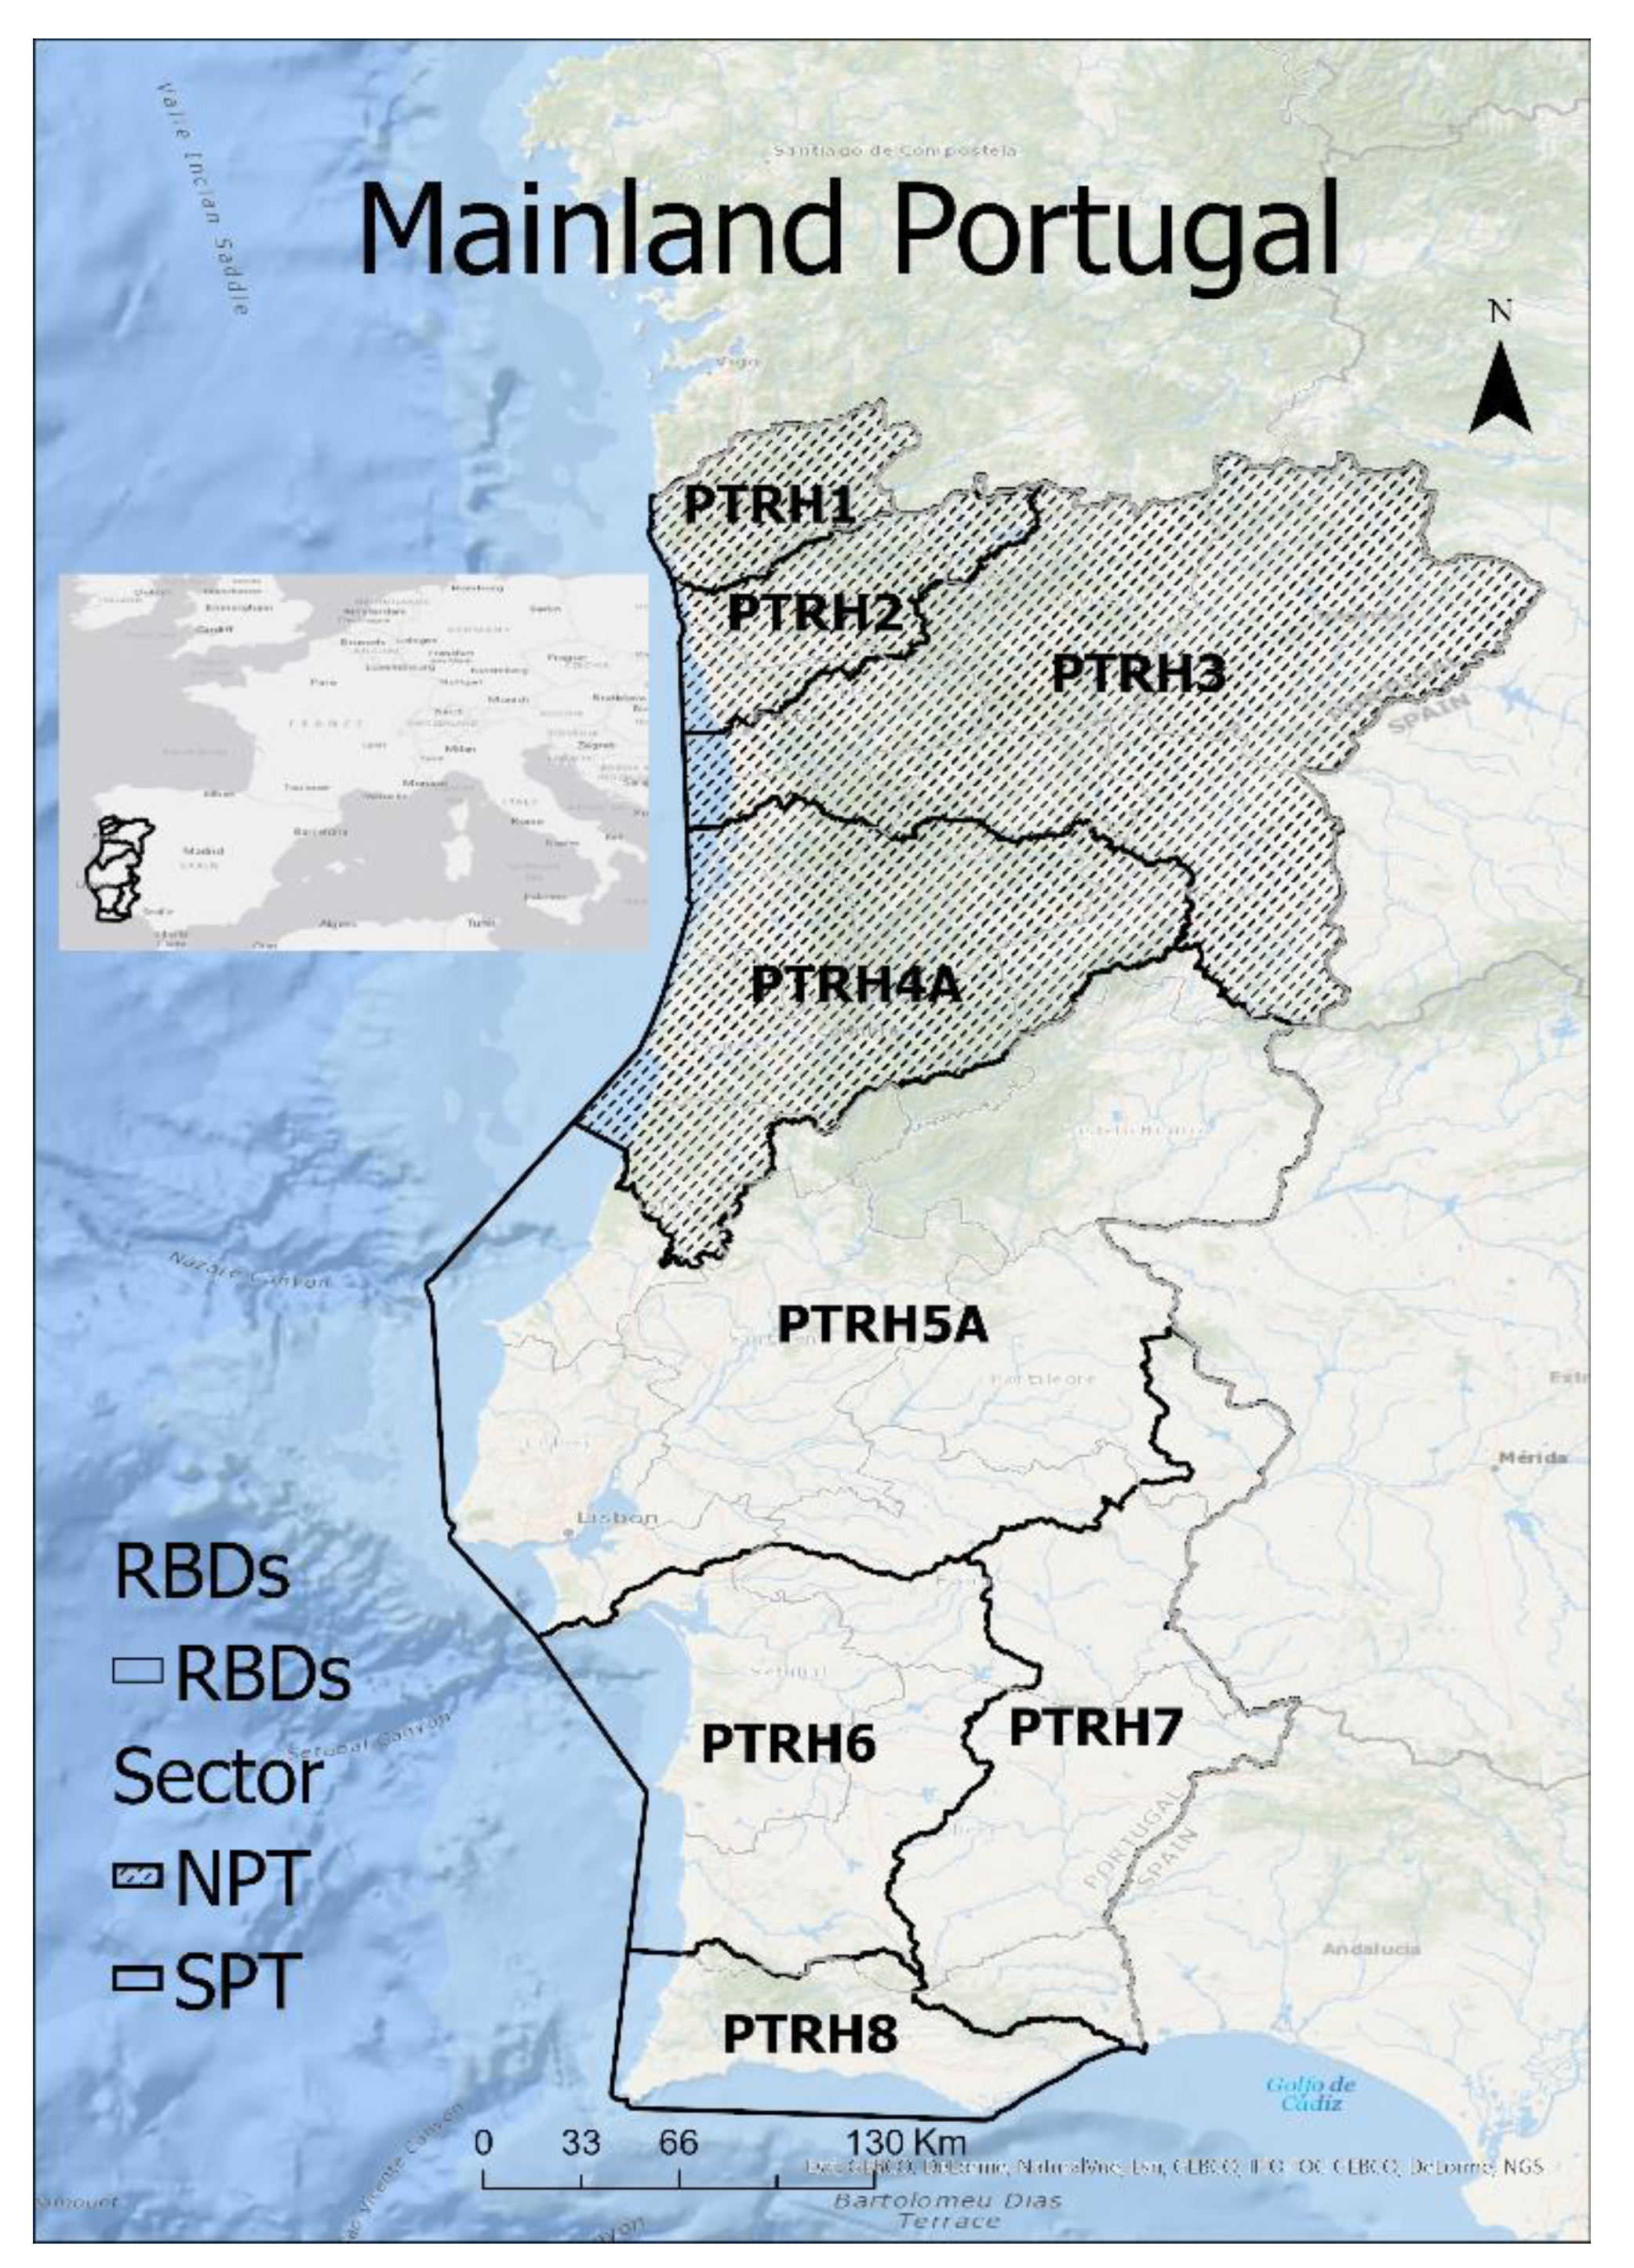
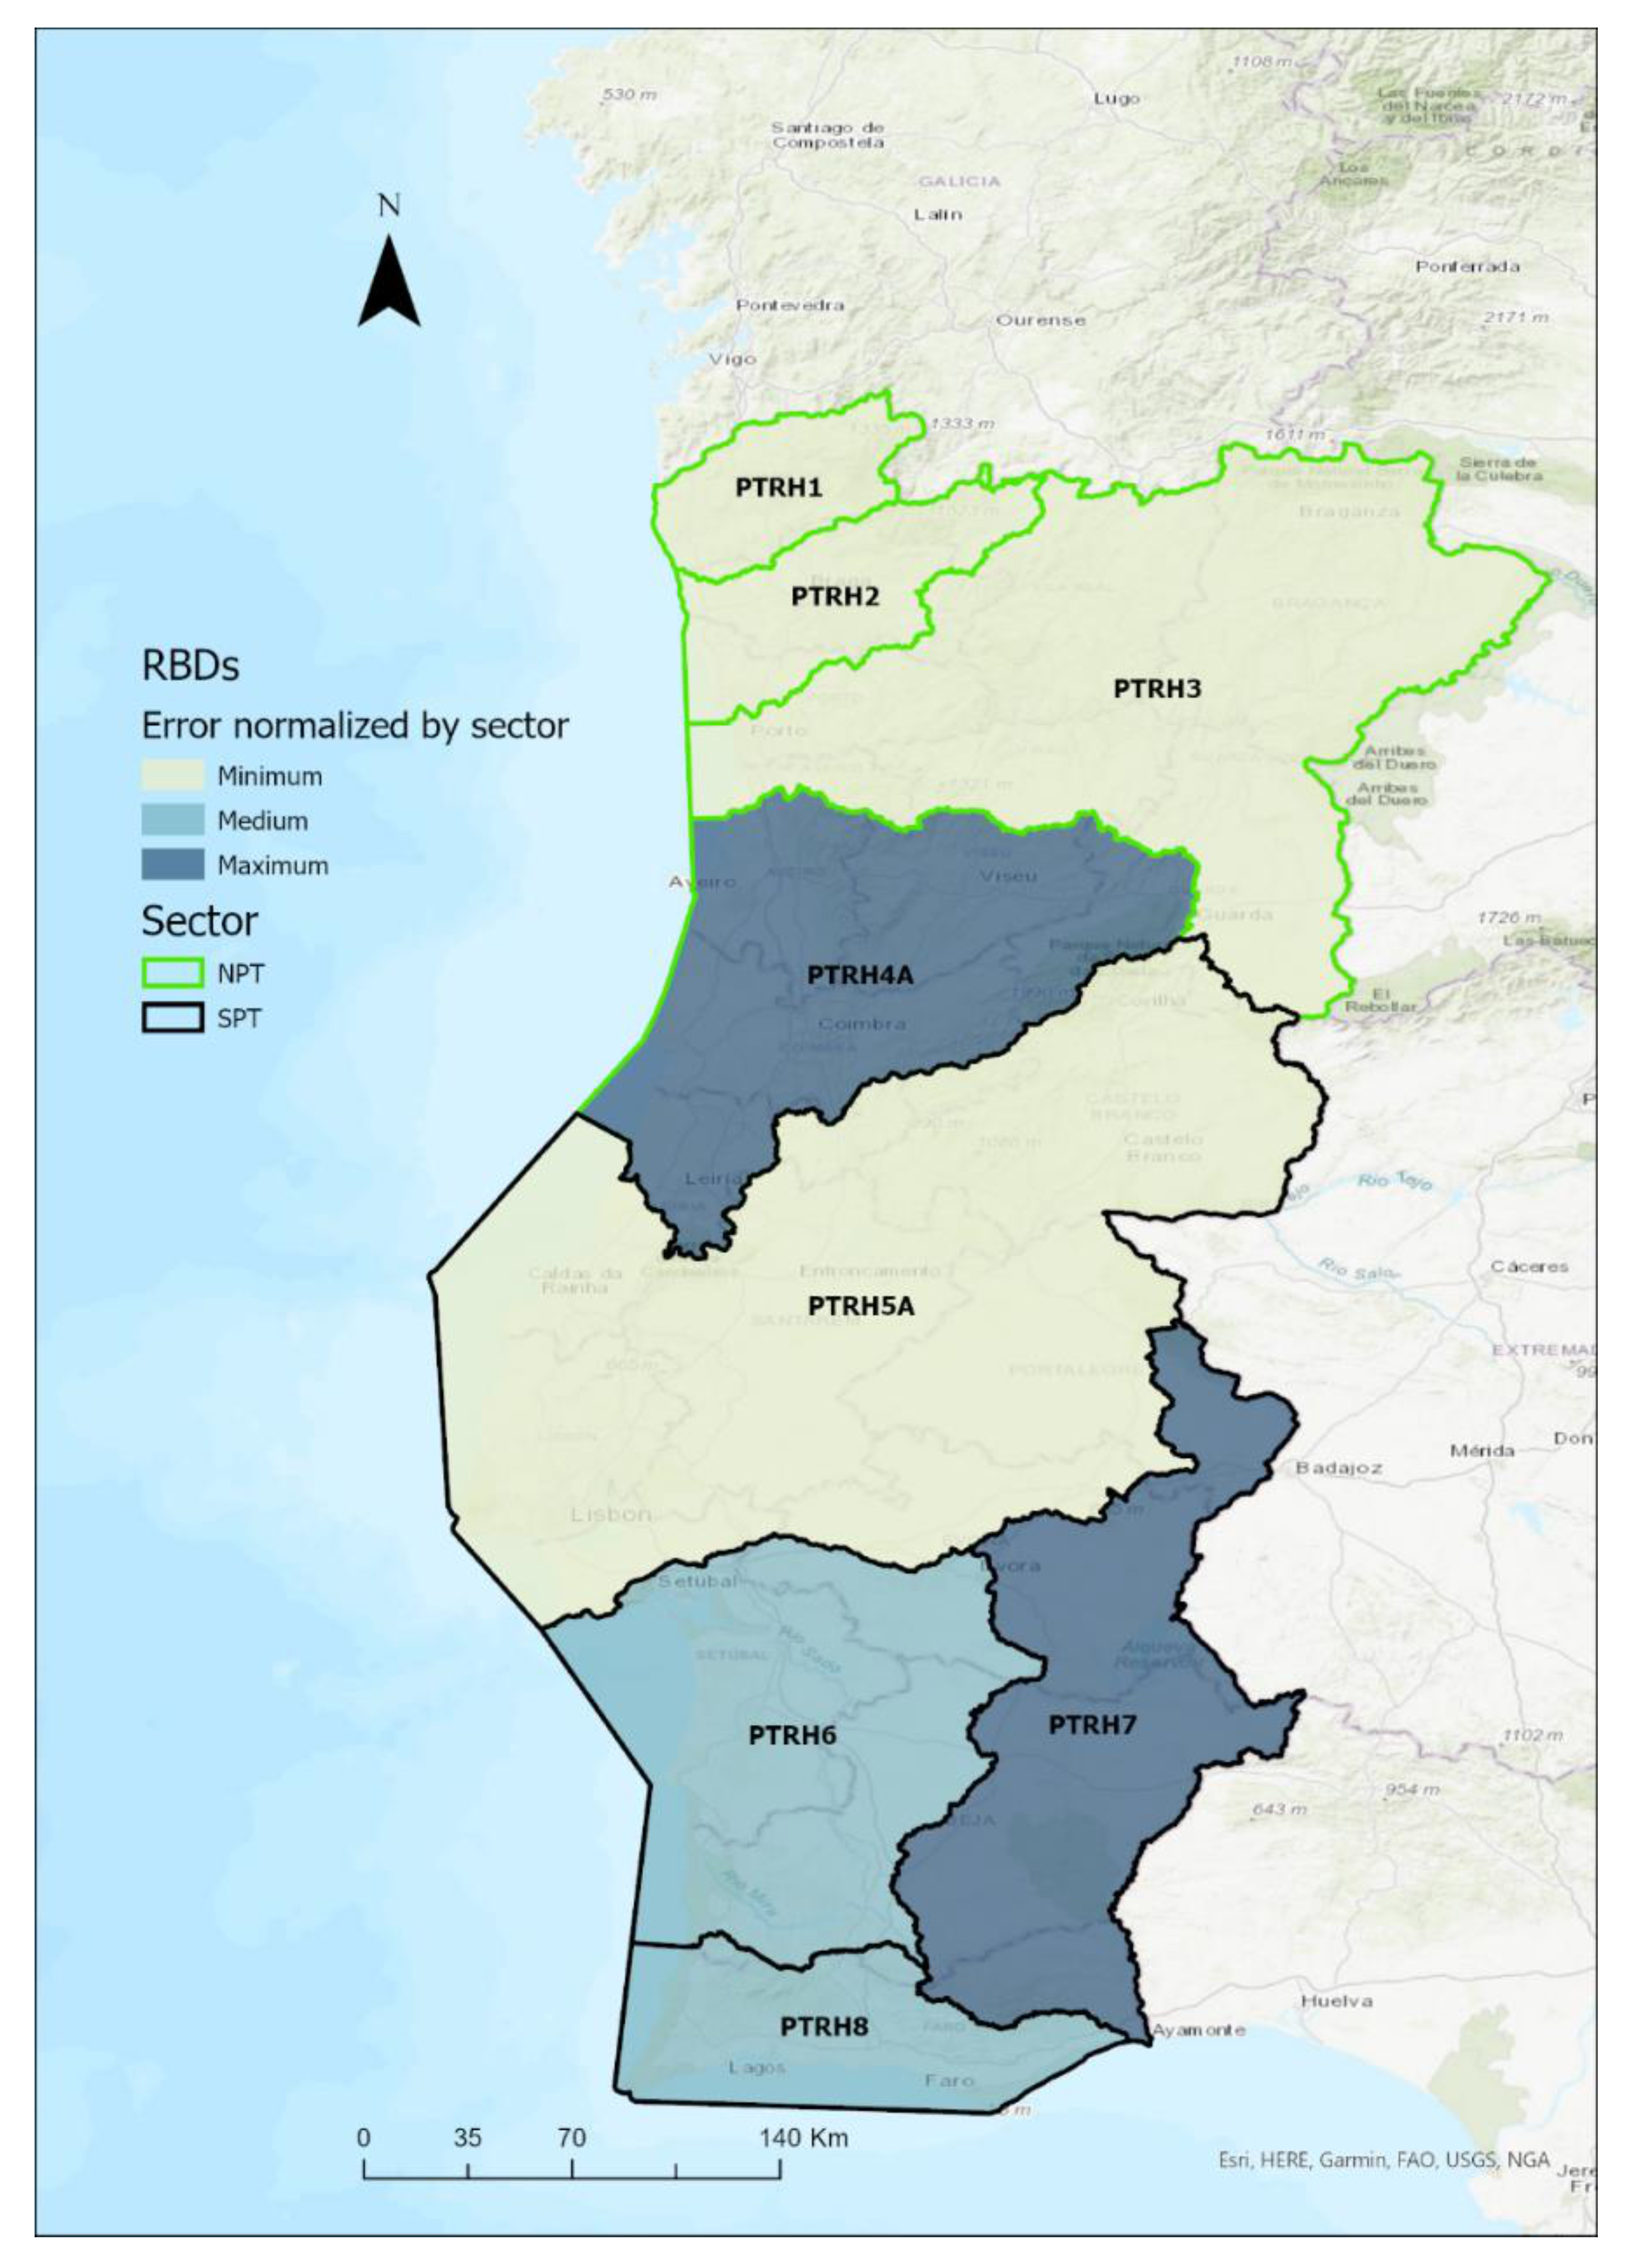
This research is following the Water Framework Directive (WFD) implemented for mainland Portugal comprising 8 RBDs (PTRH1 to PTRH8). The river basins districts that cover Portugal continental were studied organized by two sectors (NPT and SPT) as showing in Figure 1. The boundaries of the RBDs are displayed using version 1.4 of the Water Information System for Europe (WISE) River Basin Districts dataset provided by the European Environment Agency [29]. This dataset is based on data reported to WISE by the EU Member States.
The north of the country (NPT) represents 40.62% of the total study area including the RBDs: PTRH1, PTRH2, PTRH3, PTRH4A; and SPT (Southern Portugal) is representing 59.38% and include: PTRH5A, PTRH6, PTRH7, PTRH8. The name of each RBD and the approximate area are summarized on Table 1.
2.2. The InVEST Annual Water Yield Model
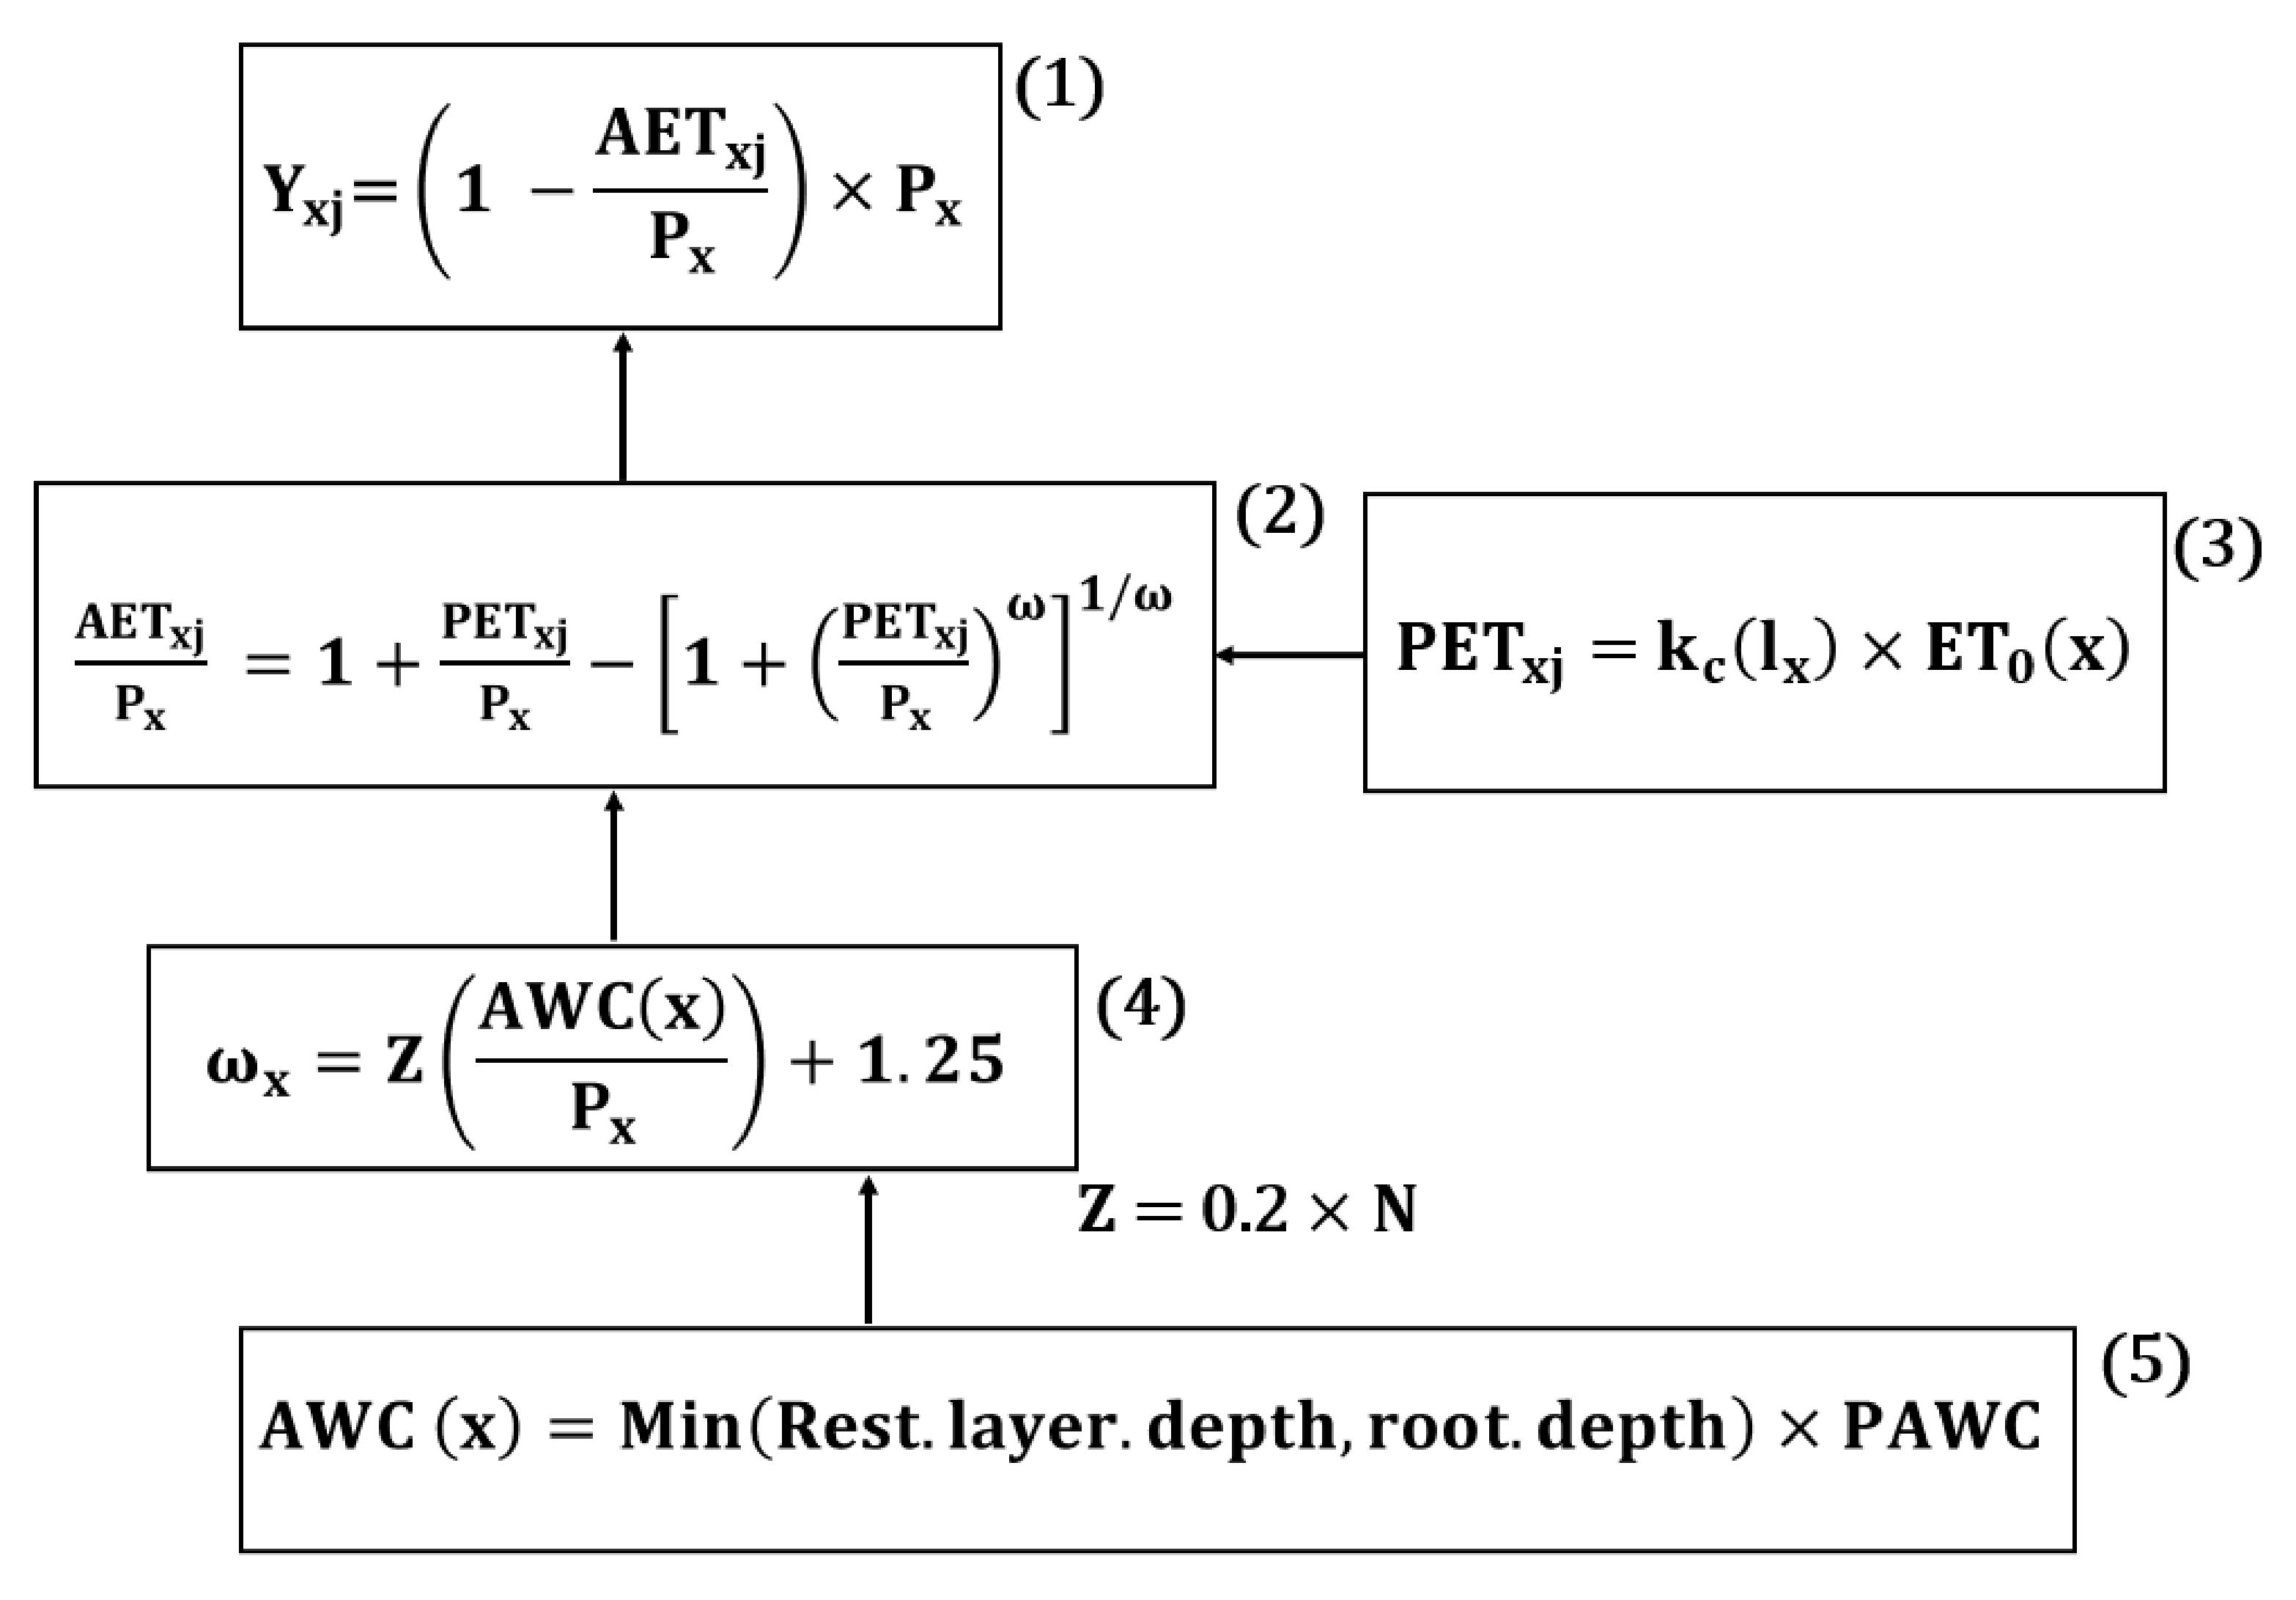
The WYM is defined by physical expressions and spatial and temporal resolutions, providing as outputs maps, outcomes of water services, impacts of environmental changes and analyses of spatial patterns. The model runs on a gridded map and estimates the quantity of water in each pixel based on the principle of water balance [30]. The annual water yield (Yxj) for each pixel is calculated by Equation (1) in Figure 2 through annual precipitation on pixel x (Px) minus annual actual evapotranspiration (AETxj) for pixel x on the land use type j.
The InVEST WYM approach relates (AETxj) to (PETxj) using Equation (2), which was developed by Budyko and later adapted by [31]. Actual evapotranspiration on pixel x is estimated in a spatially explicit way considering (PETxj) defined as the potential evapotranspiration for pixel x on land use type j, and ω is an empirical parameter which defines the shape of the curve relating potential to actual evapotranspiration expressing climate–soil properties [7]. PETxj can be calculated by Equation (3) in Figure 2 where Kc(lx) is the vegetation evapotranspiration coefficient associated with the land use type (lx) in each pixel. In (4) ω(x) is related to the average annual values of available water capacity (AWC), precipitation, and the Zhang parameter (Z) which is positively correlated with the number of rainfall events (N) per year (Z = 0.2 × N) [4]. AWC(x) is estimated as the product of plant-available water content (PAWC) on pixel x, the minimum of root restricting layer depth and vegetation rooting depth as showing in Equation (5).
2.3. Data
In the InVEST WYM, the runoff from each pixel cell in a catchment is determined based on the water balance concept [32]. For that, the model requires five biophysical parameters as georeferenced rasters (LULC, root depth and plant available water content (PAWC), annual precipitation and evapotranspiration), a biophysical table in CSV format and a vectorial format layer delimiting the study catchment areas [31].
All required data were obtained from research centres and public institutions (open-access data). The datasets Root restriction layer depth and PAWC were provided by the European Soil Data Centre (ESDAC), a European reference Centre for soil-related data [33]. The annual precipitation was obtained from WorldClim database [34] and the reference evapotranspiration from the Consortium of Spatial Information, Global-Aridity and Global-PET Database [35], a product derived from the WorldClim global data. These datasets were modelled based on a high number of climate observations and Shuttle Radar Topography Mission (SRTM) data. The other source of climatic data was obtained by the National Information System of Hydric Resources [36] who collects, processes, and publishes meteorological data at the national scale.
LULC data for years (1990, 2000, 2006, 2012 and 2018) were obtained from Copernicus Global Land Service products [37]. Land cover maps represent spatial information on different types (a total of 44 classes) of physical coverage of the Earth’s surface, using a Minimum Mapping Unit (MMU) of 25 hectares (ha) for areal phenomena and a minimum width of 100 m for linear phenomena.
2.4. Sensitivity Analysis
Sensitivity analysis was performed by adapting the methodologies proposed by: [12,15,17]. Two different data sources of precipitation (P1; P2) and evapotranspiration (E1; E2) were tested. P1 and E1 are referred to precipitation and evapotranspiration indices based on satellite data from WordClim database; P2 and E2 were collected, processed, and published by the National Information System of Hydric Resources (SNIRH). The model was also tested with two different PAWC. The main PAWC is the official dataset provided by ESDAC. In mainland Portugal this dataset has pixels values varying between 0.03 and 0.14 with a mean value equal to 0.08. The lowest values are mostly related to coarse-textured soils (sands and loamy sands) which have low ability to retain water [40]. Apart from particle size affecting the volume of water that can be stored, different degrees of PAWC fractions depend on soil depth [41]. To test the model under extreme values of PAWC and soil depth, a new dataset was created by reclassifying the original PAWC, obtaining fractions between 0.03 and 0.98. The reclassification was meant to test the model to the maximum possible value, which is 1.
Z is an empirical constant that captures the local precipitation pattern and hydrogeological characteristics. The sensitivity of the model to this coefficient can also be interpreted as the sensitivity to the PAWC since these parameters play a similar role in the model structure [17]. The Z coefficient (Z1, Z2) is estimated at 0.2 × N, where N is the number of rain days (>1 mm) per year [31]. The N1 values were obtained from the Portal do Clima PROJECT [42] which provides several climatic indicators aiming to quantify the occurrence and risk of different atmospheric events [43]. The N2 values were obtained from the Portuguese Institute of the Sea and the Atmosphere [44] database [23]. This institution supports the nation with wide climate-related information products. Table 2 shows the assigned values to this seasonality term (Z) for mainland Portugal.
Considering the increasing of fire events in the last years [1] and assuming that they have impacts on water ecosystem functions due to loss of diversity and modifications on vegetation structure [45], an alternative biophysical table was created decreasing the plant evapotranspiration coefficient (kc) of the Corine LULC classified as 334 (burnt areas). Kc for bare soil ranges from 0.3 to 0.7 depending on climate (in particular rainfall frequency). The referential biophysical table has kc = 0.5 for burnt areas [45] and the modified biophysical table has (kc = 0.2). Uncertainties on this parameter are large since it remains difficult to provide accurate estimates of the actual evapotranspiration from forests [17]. Table 3 summarizes the input data and their sources by the sensitivity analysis tests.
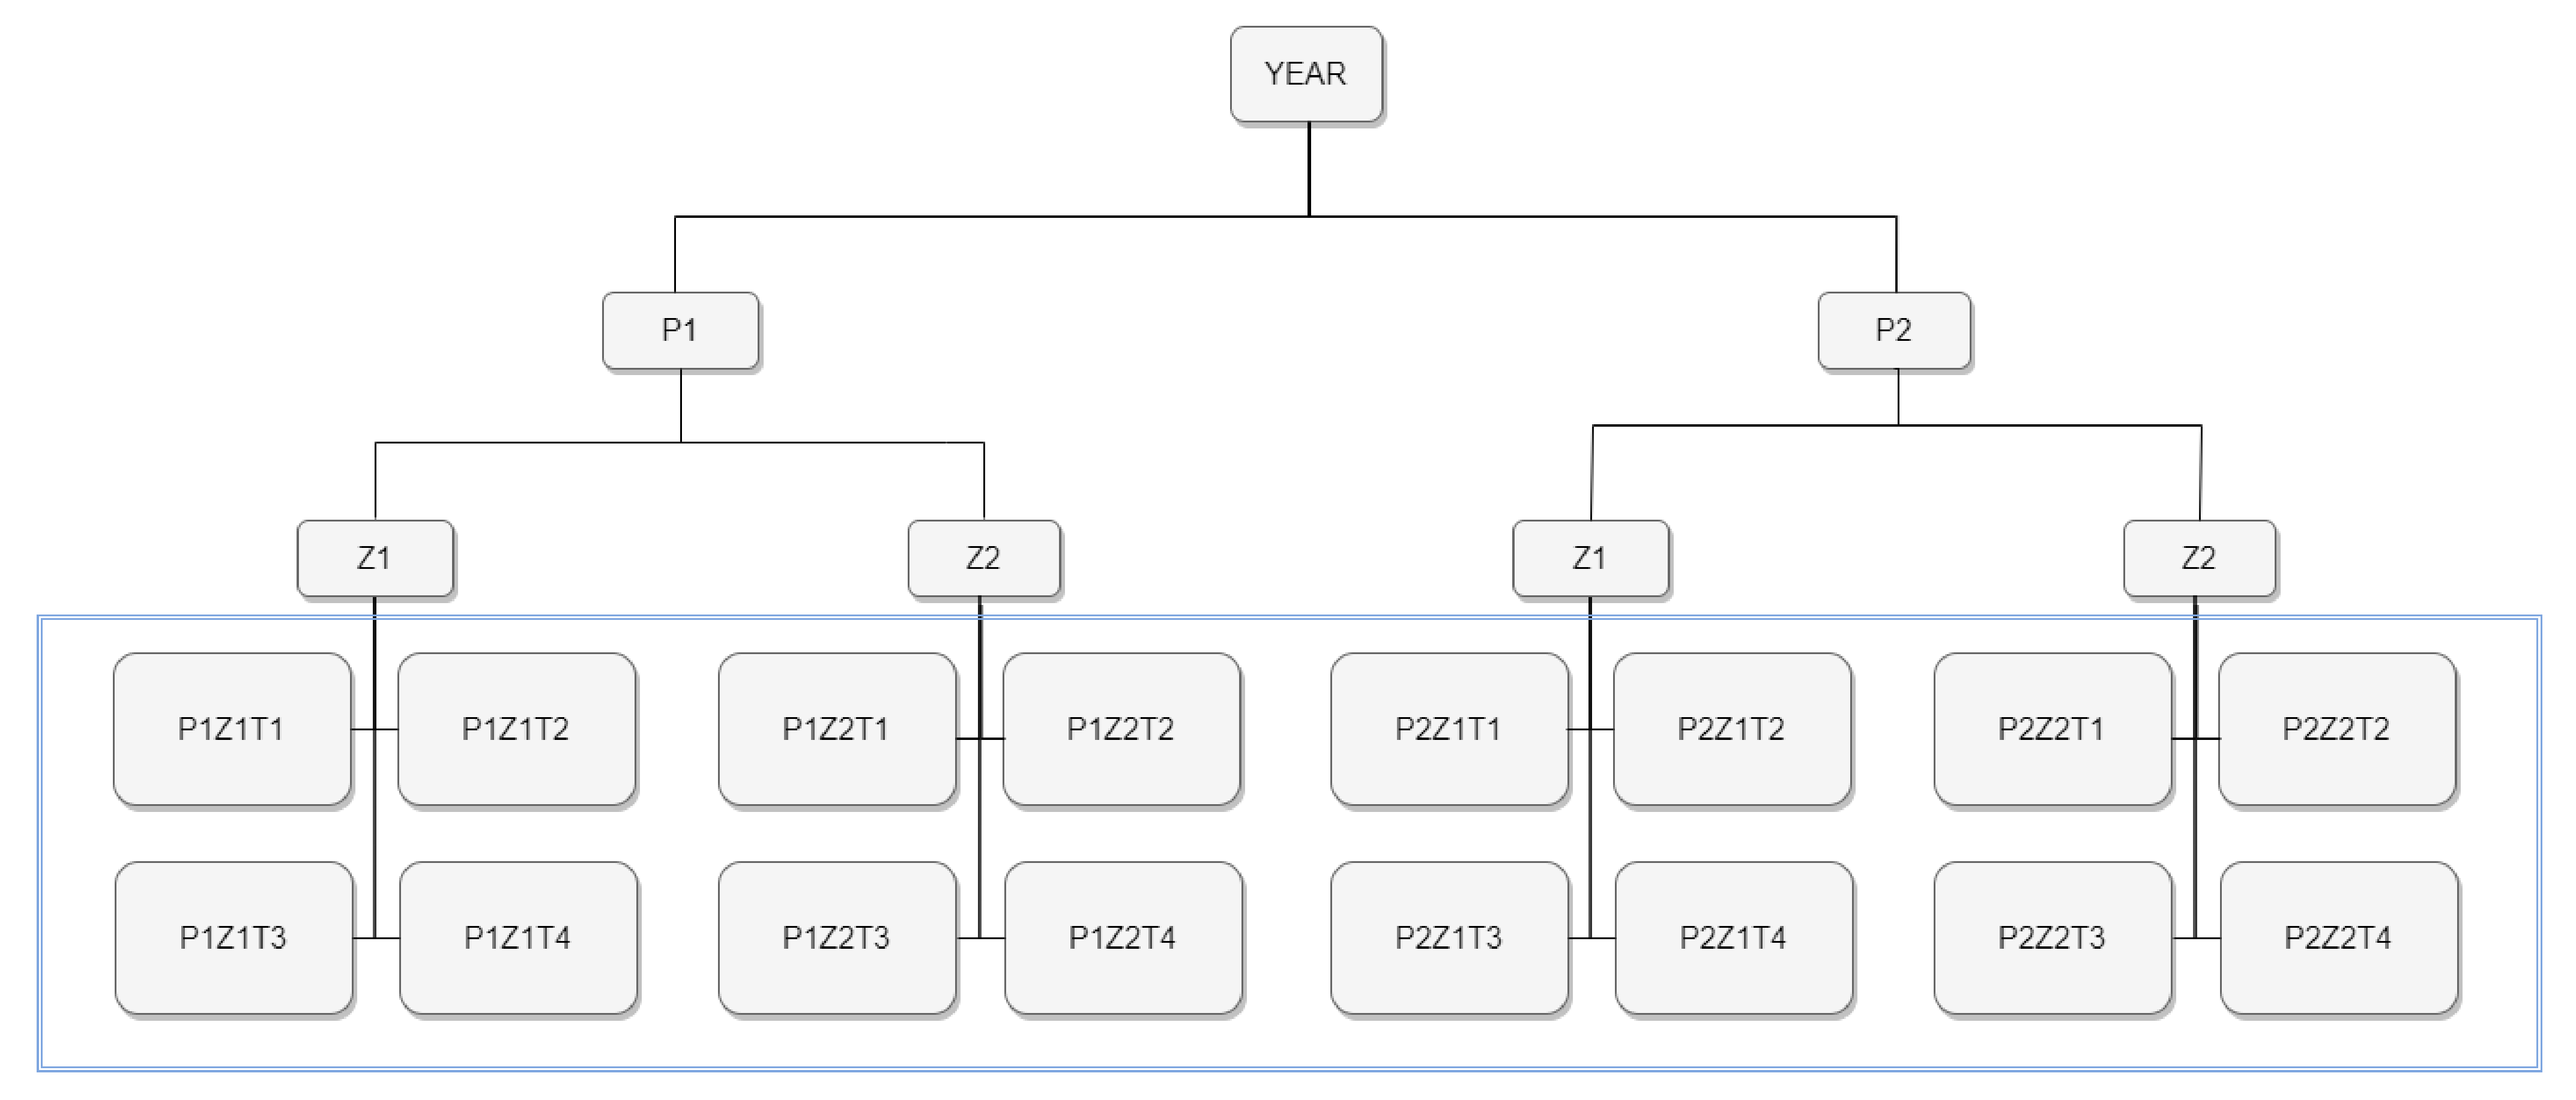
The methodology applied to test the sensitivity of the model is summarized in Figure 3. The diagram flow shows the configuration applied in the sensitivity analysis tests for studied years (1990, 2000, 2012, and 2018). The simulations resulted in 16 values of estimated water yield by year, with an exception for 2006, that had Z1 equal to Z2, resulting in eight estimated water yield values, four simulations with P1 and four simulations with P2. For the five studied years, a total of 72 water yield values were estimated by RBD. The area highlighted on the diagram is referring to the 16 simulations by year.
2.5. Validation
The minimum requirement when validating assessment models is to establish an adequate scientific basis for credibility [46]. The model is said to be validated if its accuracy and predictive capability in the validation period have been proven to lie within acceptable limits [47]. If a test determines that a model does not have enough accuracy for any of the sets of experimental conditions, then the model is invalid. However, determining that a model has sufficient accuracy for numerous experimental conditions does not guarantee that a model is valid everywhere in its applicable domain [48].
This study reports the water yield estimated for the eight RBDs (PTRH1 to PTRH8) covering all mainland Portugal’s extent. These districts represent the administrative jurisdictions responsible to manage the Water Framework Directive (WFD) on the national scale. The model was validated by comparing the mean estimated water yield in the RBDs to the European Environment Agency (EEA) database on the quantity of Europe’s water resources. The EEA’s Waterbase [29] contains data on water resources availability, delivered by EEA member countries, in the scope of the current WISE SoE—Water Quantity (WISE-3) Water Information System for Europe (WISE).
3. Results and Discussion
3.1. Meteorological Data Analysis
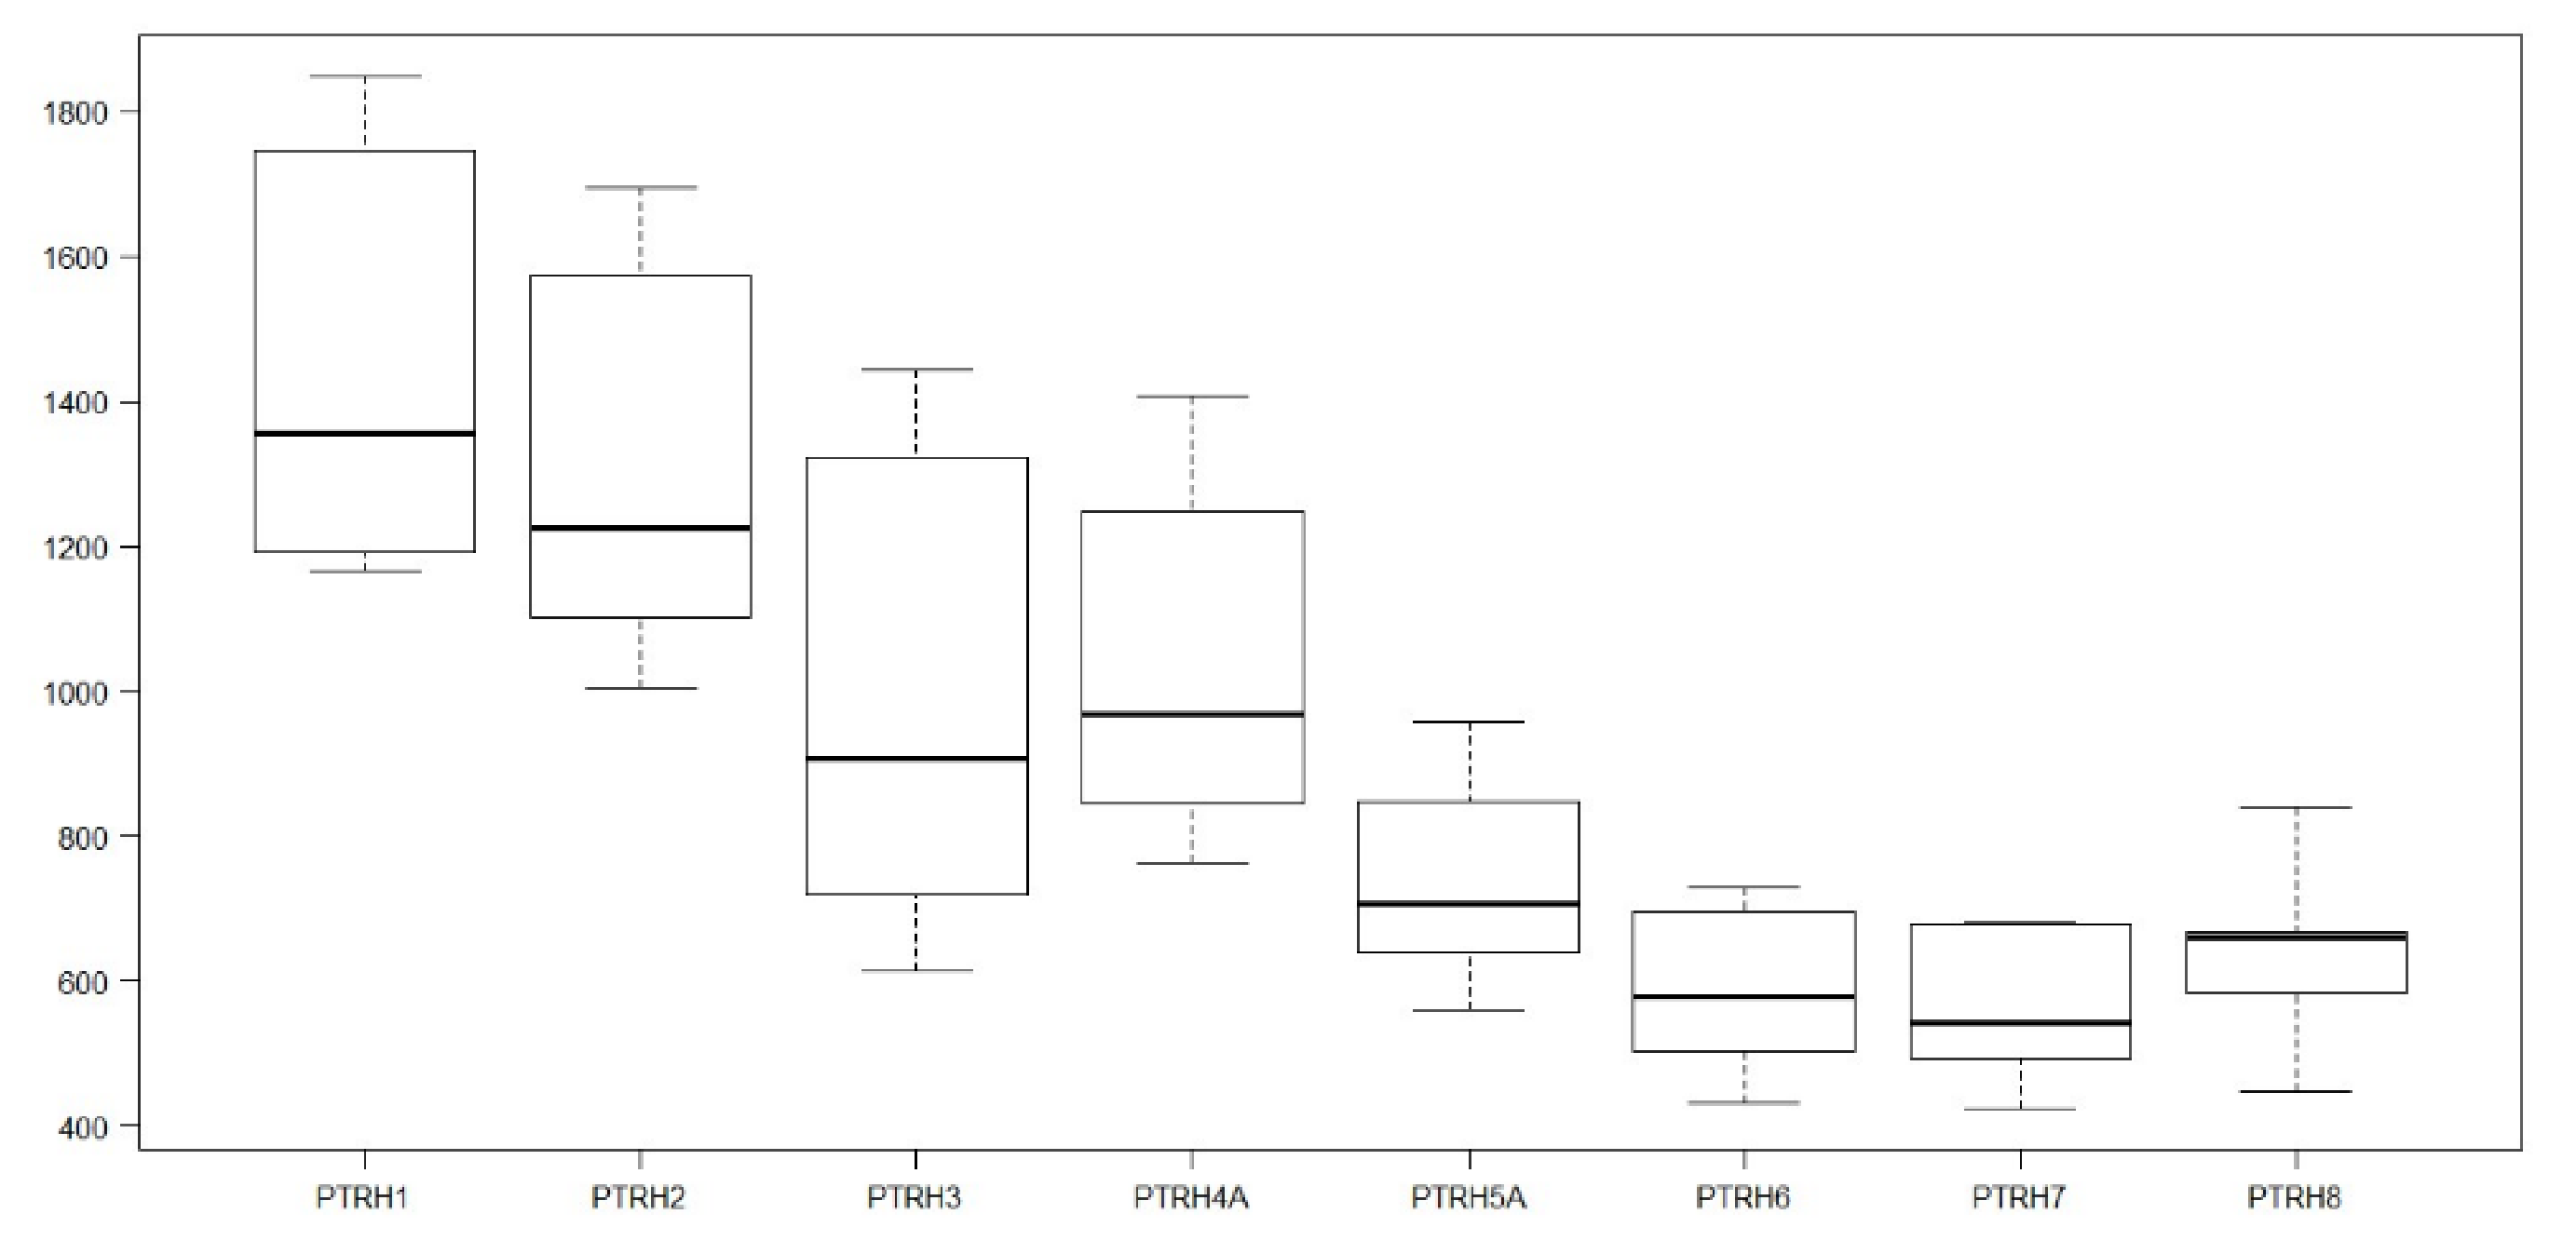
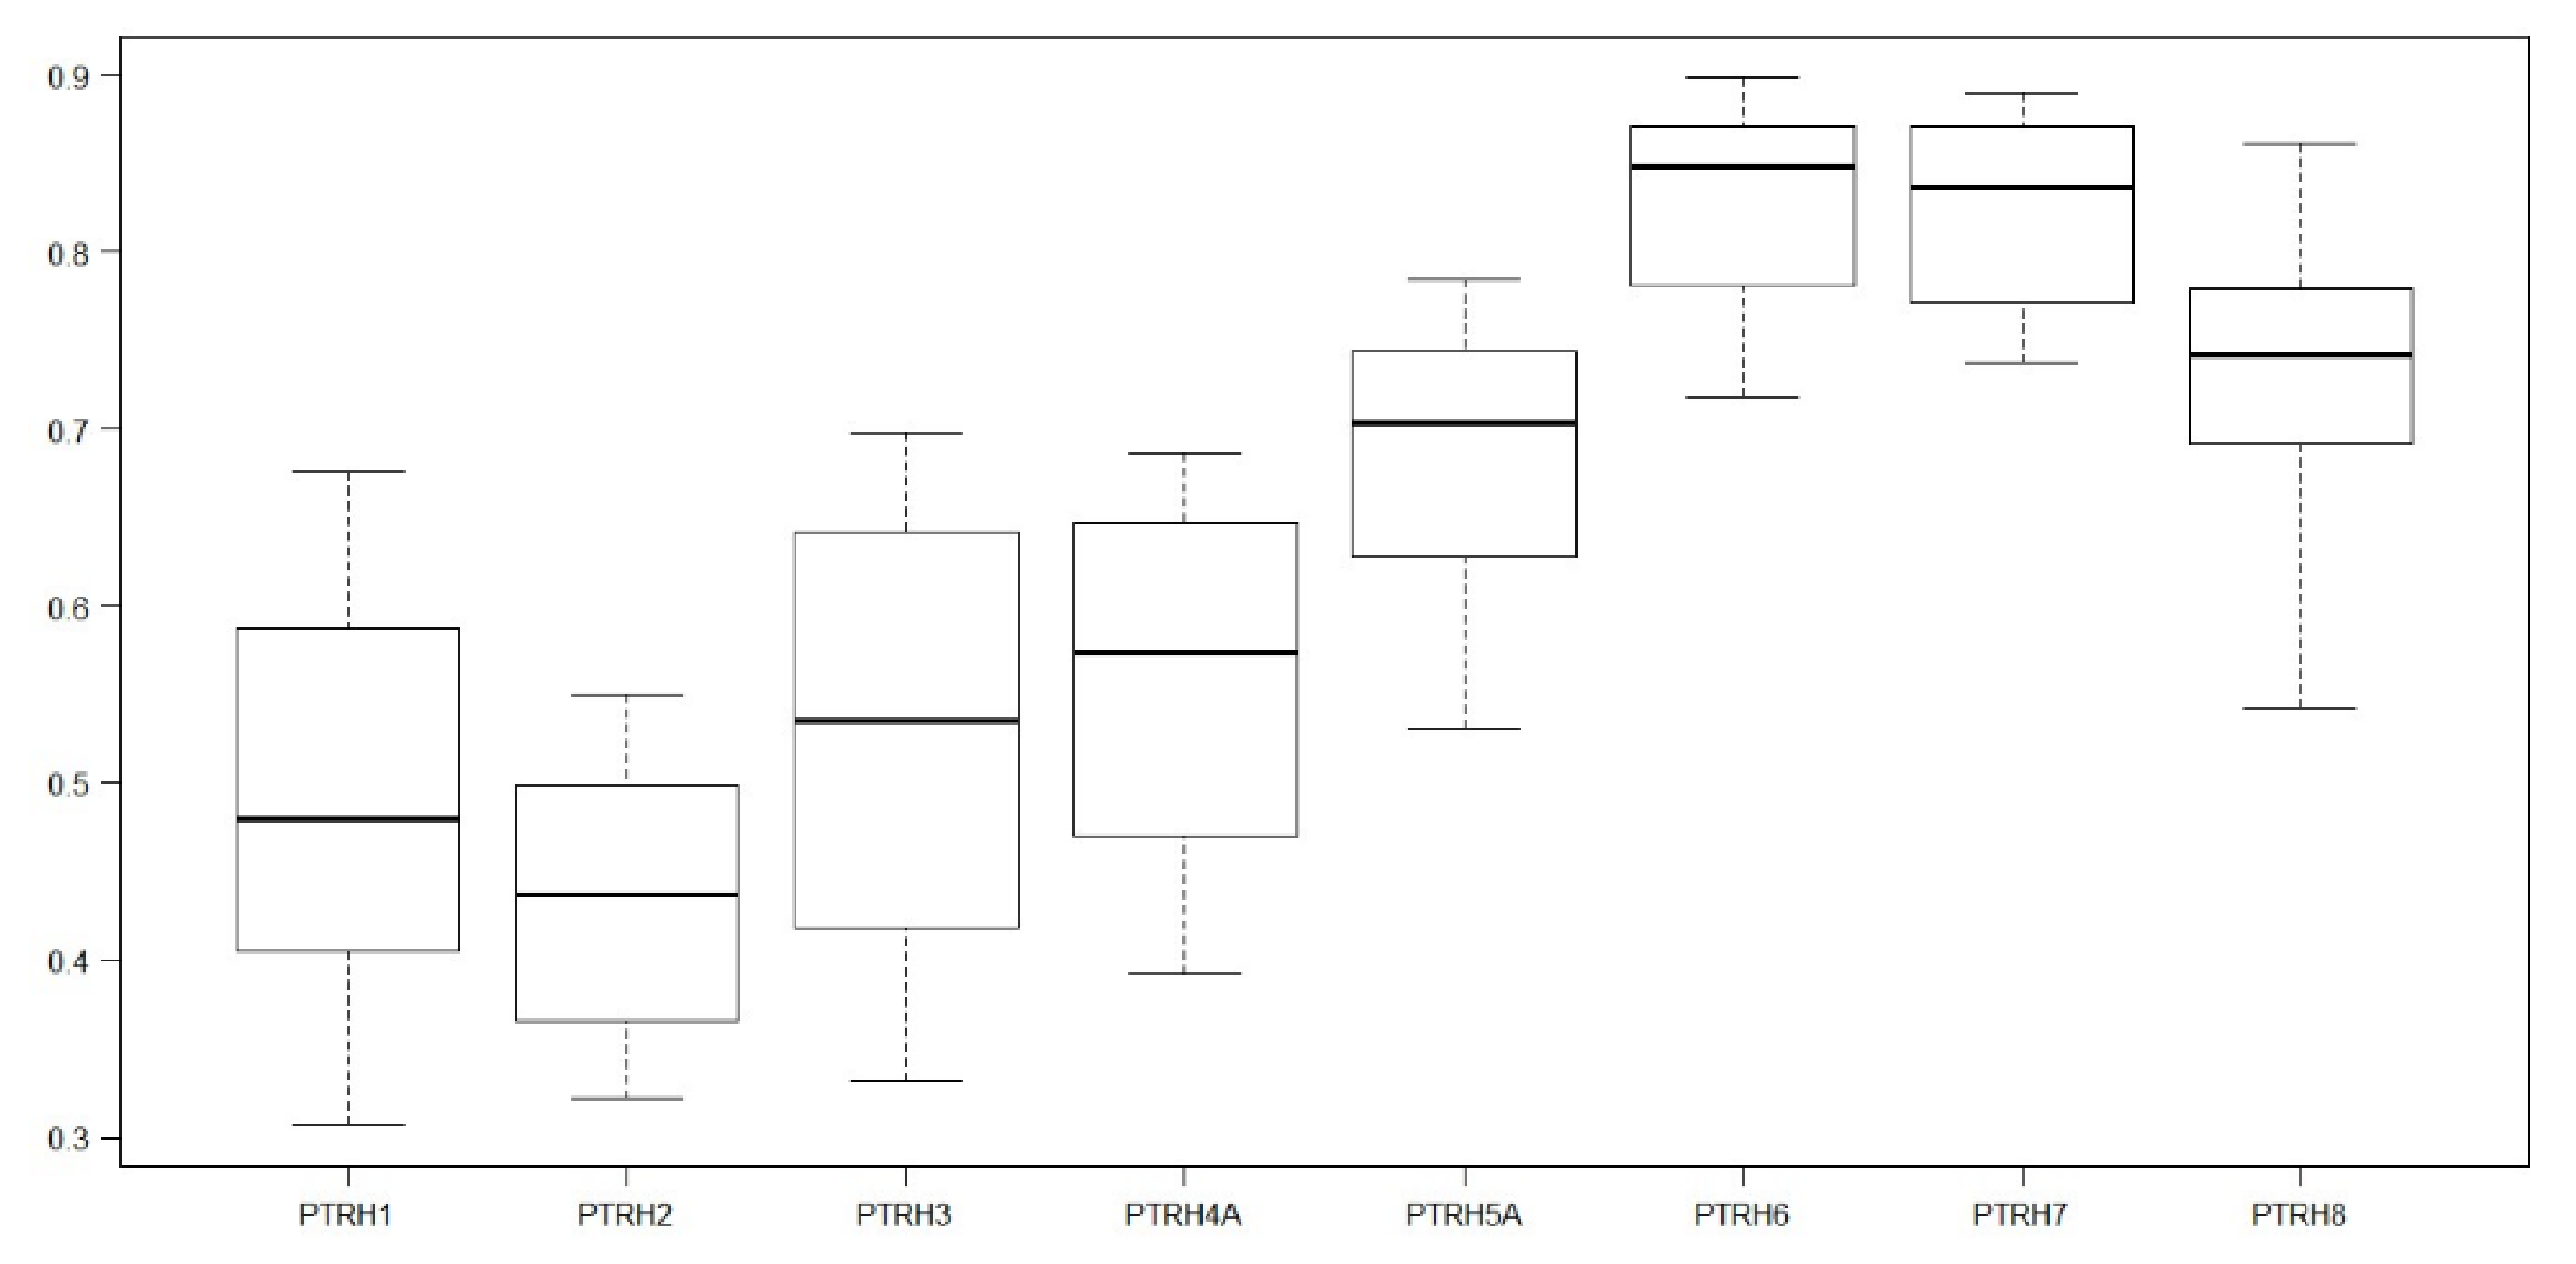
In the WYM, precipitation and actual evapotranspiration are related to the spatial distribution of meteorological factors and land cover types [32]. The boxplots in Figure 4 show the average annual precipitation by river basin district (RBD). The value is maximum (1850 mm) in the RBD (PTRH1) located in the northwest coast of the country, where the high elevation in the coastal zones contributes to the development of convective systems that promote the occurrence of precipitation events [23]. The minimum value (less than 500 mm) is in the PTRH8 district in the south of Portugal, where are located the most vulnerable regions to drought events, being observed the lowest precipitation indices and the highest temperatures [11].
This exploratory analysis is suggesting two main patterns, one with the highest precipitation indices and other with the lowest. Through a spatially exploratory analysis in a GIS environment, the study area could be divided into two sectors, following the concept that Portugal is divided between North and South by the Tagus river that cuts the territory East to West [49].
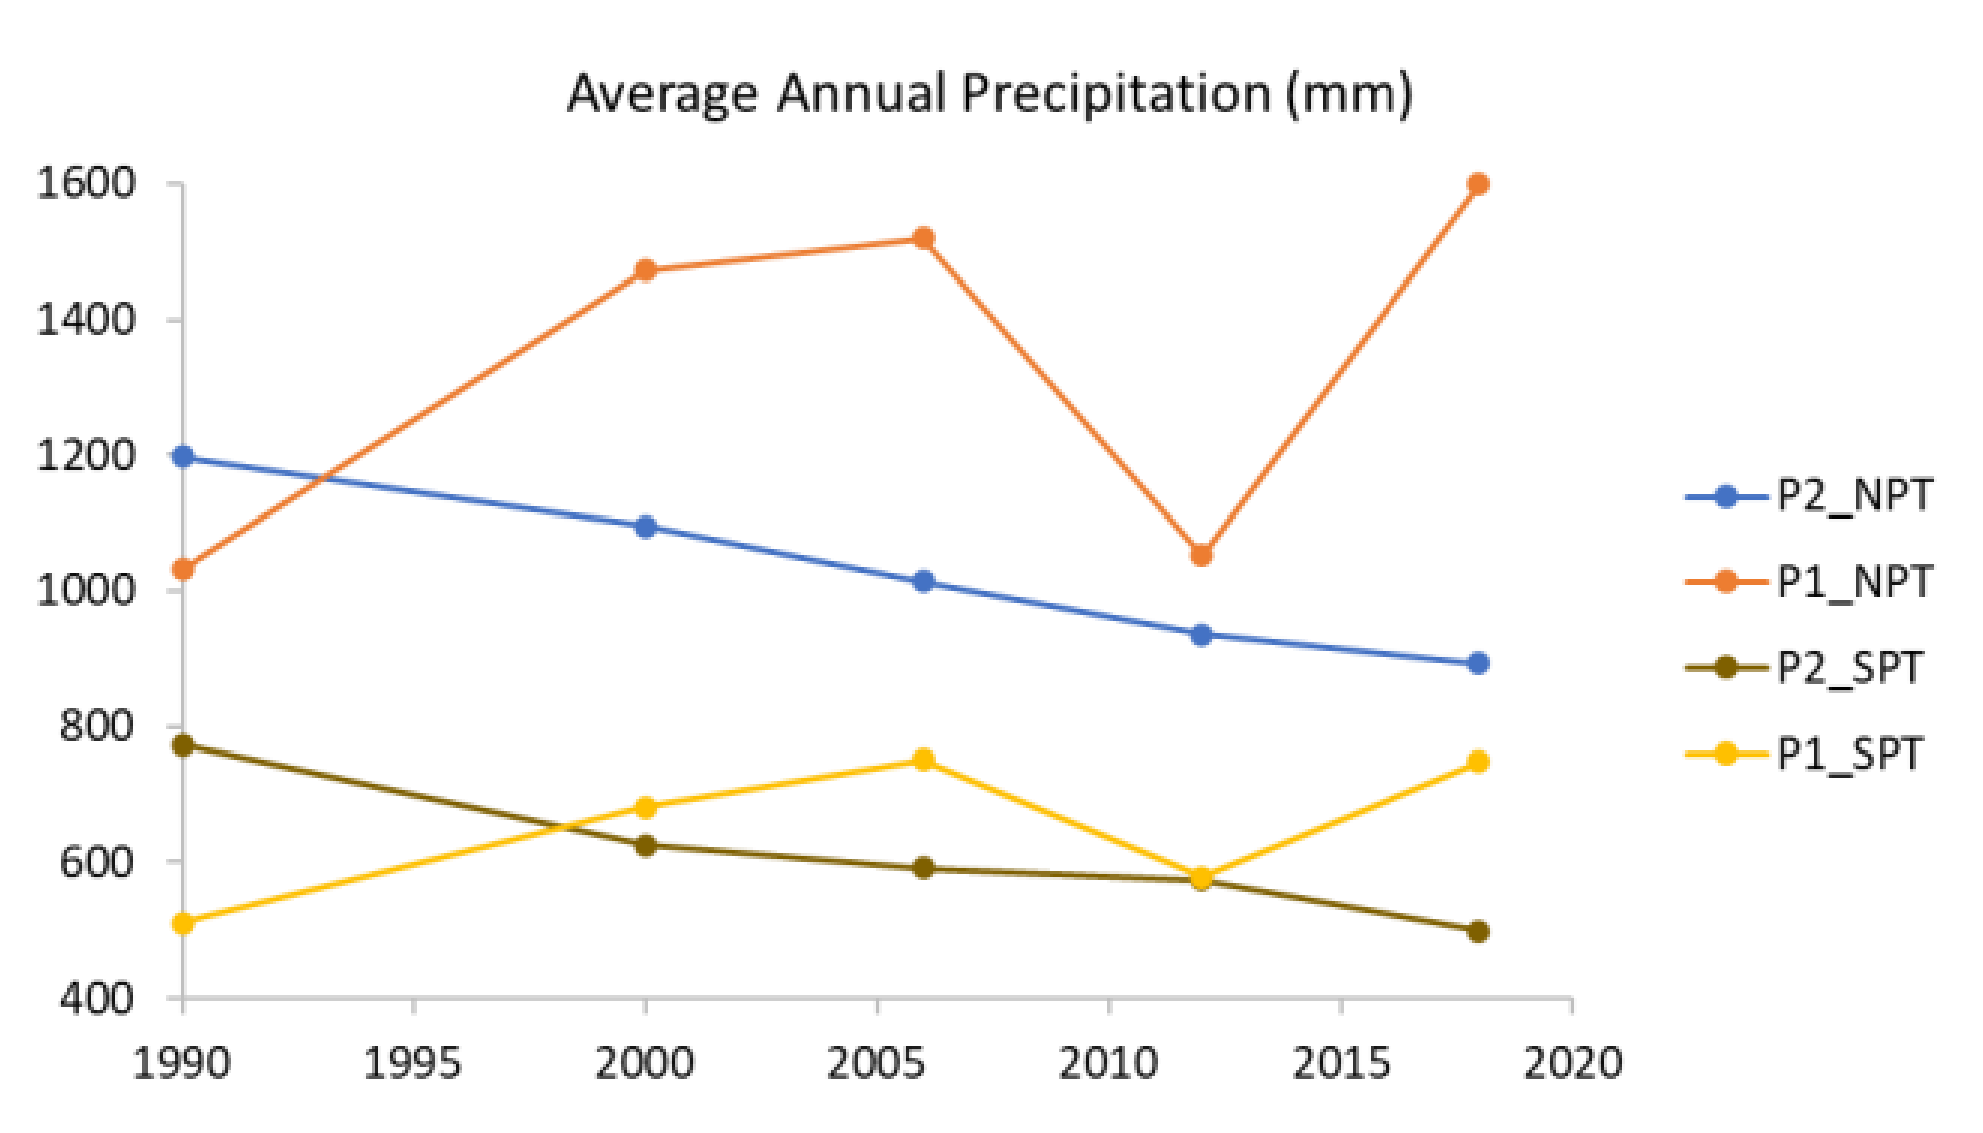
Figure 5 is showing plots of the average annual precipitation (P1—WorldClim; P2—SNIRH) in the study years (1990, 2000, 2006, 2012 and 2018), by these 2 sectors, P1, P2 for NPT (North of Portugal) and P1, P2 for SPT (South of Portugal).
The precipitation data from SNIRH (P2) shows a continuous decreasing of the values over the years, while the data from WordClim (P1) shows high variability. Pearson’s correlation between P1 and P2 in the NPT sector is equal to −0.409, in the SPT sector is −0.754. The spatial variability from North to South of Portugal is explained by the latitude and topographic configuration that influence the rain events and their temporal distribution [23]. As referred by [22], the years 1990 and 2012 are identified as being particularly dry within the Iberian Peninsula territory recording severe drought events.
3.2. Dryness Index and Evaporative Index Outcomes
The Budyko curve relates to the dryness index (DI) and the evaporative index (EI). Together, these indexes define the energy limit and the water limit of a hydrologic system. The DI is also applied to derive climate classifications for different zones: hyper-arid (DI > 20), arid (5 < DI ≤ 20), semiarid (2 < DI ≤ 5), dry sub-humid (1.5 < DI ≤ 2) and humid (DI < 1.5) [50]. The EI values close to 1 mean that almost all amount of rain is returning to the atmosphere by evapotranspiration from the vegetation and soil, and the lowest values indicate higher water yield availability.
The University of Leuven, with support of the International Water Management Institute and the International Centre for Integrated Mountain Development [35] estimated for mainland Portugal an area of 46,365 km2 that is highly vulnerable to drought events and is classified as an arid zone. This area represents 50.36% of the country’s extent, which is comparable with the sector (SPT—South of Portugal) that represents 59.38%.
The mean difference between the global reference evapotranspiration (E1) and that obtained from the national database (E2) is nearly −10%. E1 shows a standard deviation equal to 31 mm against 2.5 mm in E2, these values were obtained comparing datasets from years (1990, 2000, 2006, 2012 and 2018). The following boxplots are representing the DI (Figure 6) and EI (Figure 7) results by RBD. It is showing the same pattern occurred with the precipitation data permitting to group the national river basin districts in two sectors, NPT—North of Portugal (PTRH1, PTRH2, PTRH3, PTRH4) and SPT—South of Portugal (PTRH5, PTRH6, PTRH7, PTRH8).
The highest DI & EI values are in the SPT sector. These values are showing the high vulnerability of this sector to severe drought events. The EI values classify SPT sector in Dry sub-humid and Semiarid zone and the NPT sector as Humid/Dry sub-humid zone as proposed by the Global Map Aridity [35].
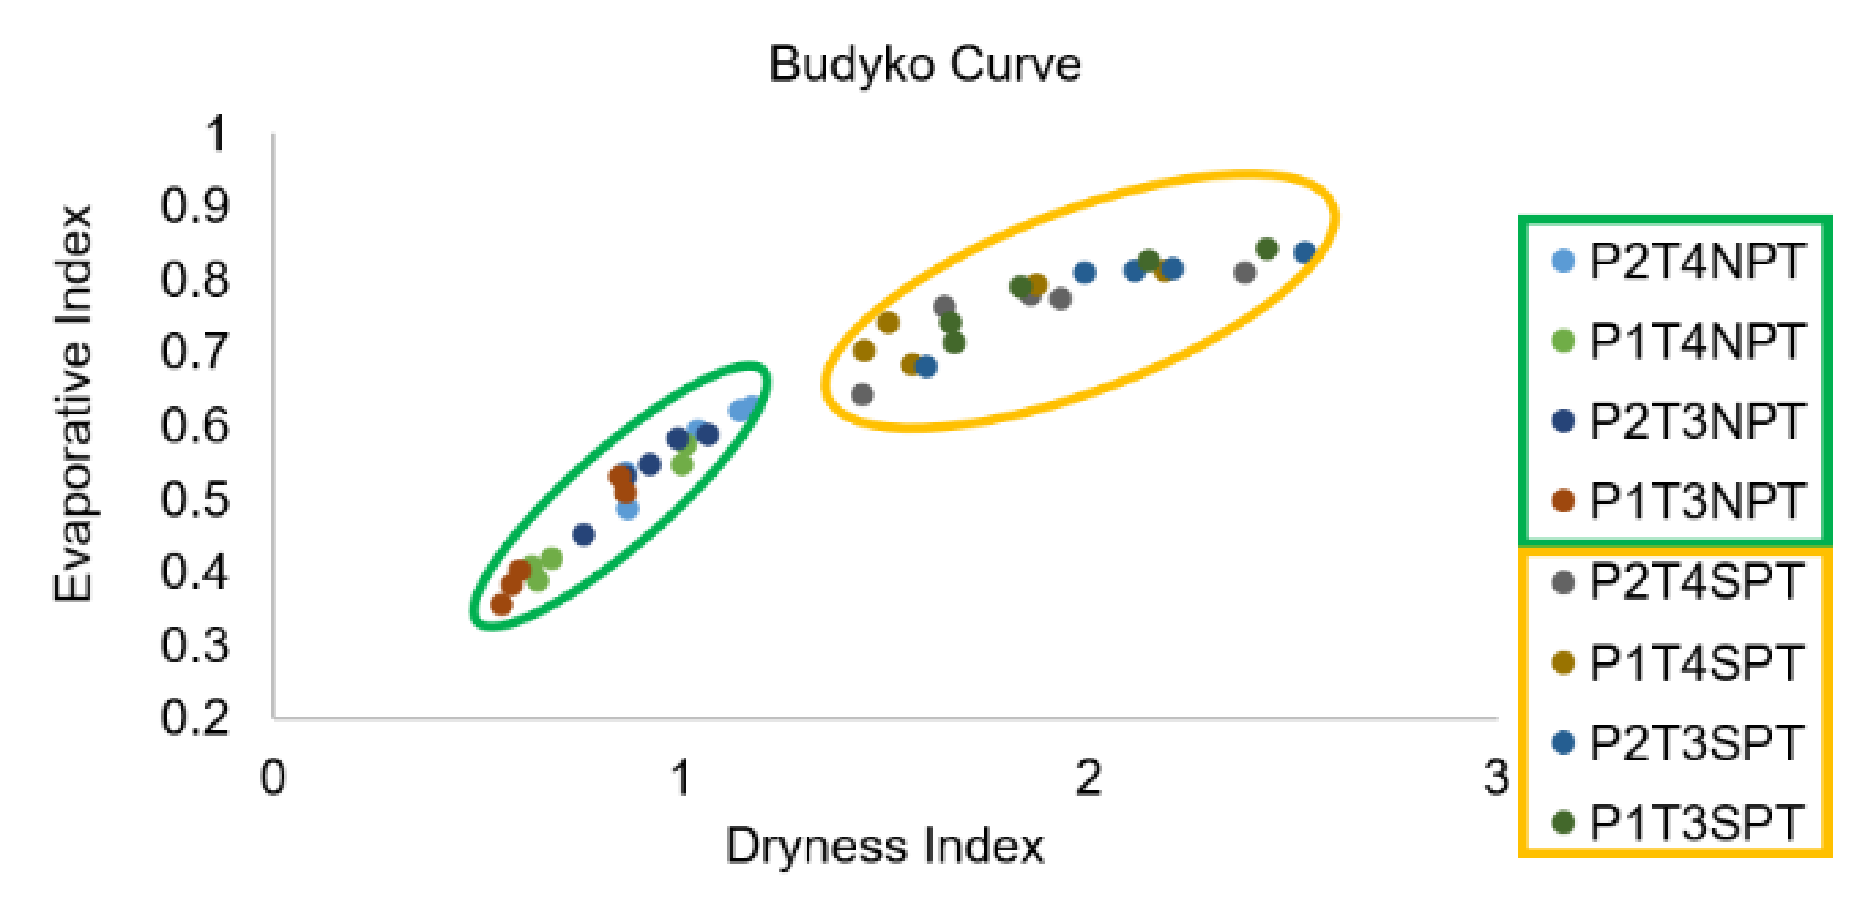
The Budyko curve is bounded by two limits—an energy limit in which actual evapotranspiration (AET) is equal to the potential evapotranspiration, and a water limit for which actual evapotranspiration is equal to precipitation [31]. Due to spatial and temporal variability in climate forcing, the asynchronicity of water availability (P) and demand (PET), the imperfect capacity of the root zone to buffer that asynchronicity, and lateral redistribution of water within the catchment, the Budyko curve lies below those two limits [17]. To understand the concept and to verify the WYM, a Budyko curve graphic with DI & EI outcomes is plotted in Figure 8. It shows results of the sensitivity analysis simulations for tests T3 (E1) and T4 (E2).
Examining the Budyko curve with mean values of DI and EI of the five studied years, is possible to distinguish two main clusters referring to these two sectors, NPT (North of Portugal) and SPT (South of Portugal). As water yield is greater in those points close to zero, the cluster formed by points from the NPT sector show better water availability, with the greatest value in the simulation T3 using P1 and E1, and for the SPT sector, with test T4 using P2 and E2.
3.3. Corine LULC Changes
The change in land use can influence the integrity of natural systems [51] and the WYM is assessing the impacts of land cover changes in each pixel cell offering insights into how changes in land-use patterns affect annual surface water yield [31]. The five main categories of the Corine land cover datasets are artificial surfaces (1), agricultural areas (2), forest and semi-natural areas (3), wetlands (4) and water bodies (5).
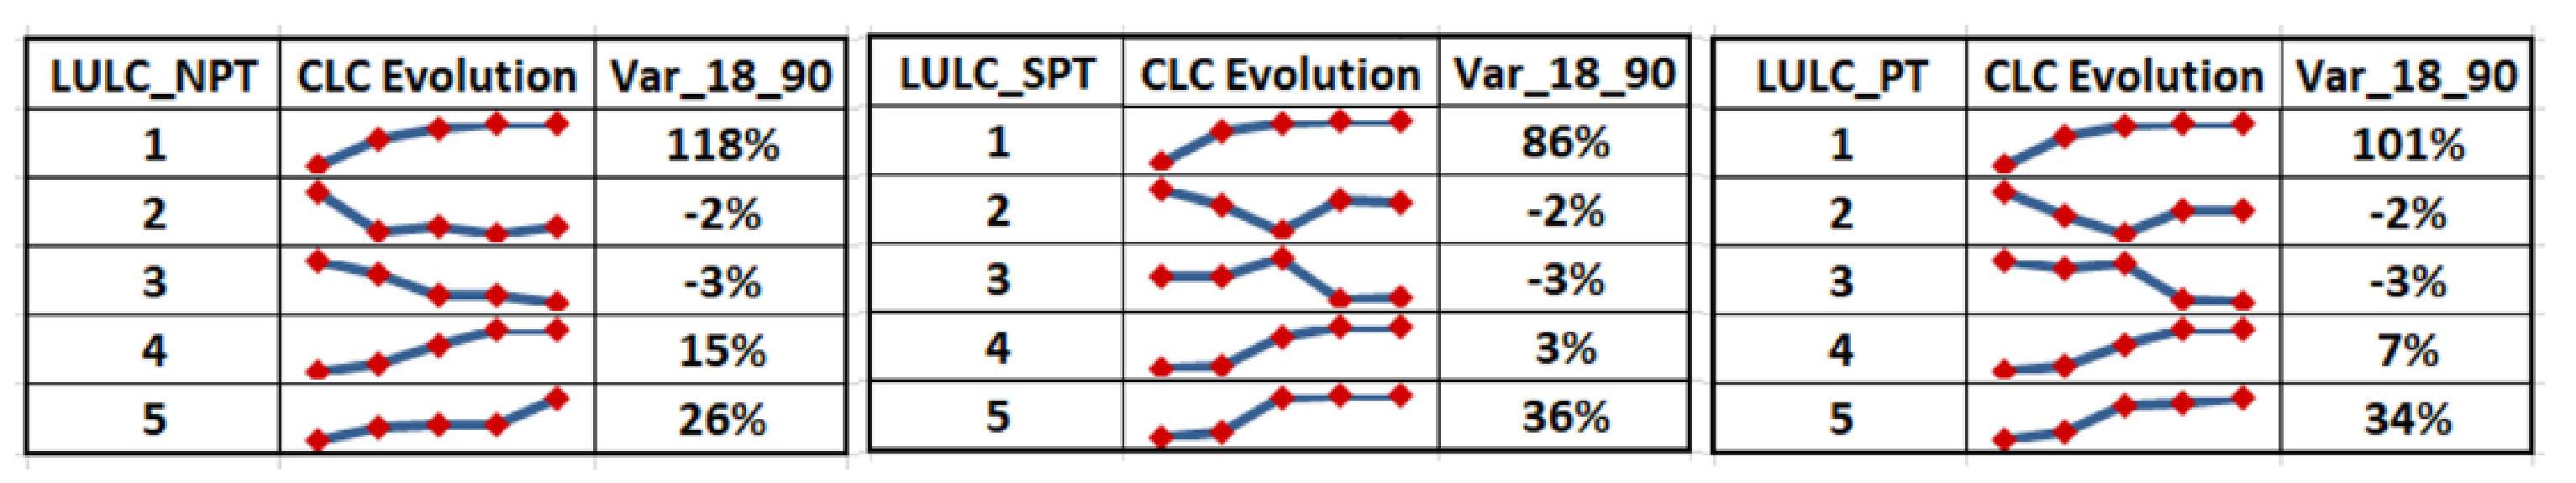
Analyzing the land cover changes in national scale (LULC_PT) in the five main Corine Land Cover categories between 1990 and 2018, the numbers show that artificial areas have increased more than 100%, followed by surface water bodies and wetlands, with 34% and 7%, respectively. Agricultural, and forest and semi-natural areas have decreased by 2% and 3%, respectively. The studied categories followed the same pattern in the NPT and SPT sectors (LULC_NPT; LULC_SPT).
Figure 9 shows the evolution (CLC_Evolution) and variation (Var_18_90) for the main land use/land cover categories of Corine data (1-Artificial surfaces, 2-Agricultural area, 3-Forest and seminatural areas, 4-wetlands, 5-water bodies). Each red dot is referring to values estimated for the studied years (1990, 2000, 2006, 2012, and 2018). The variable Var_18_90 is the variation between years 1990 and 2018.
At the national scale, as the number of artificial areas increased the number of superficial water bodies also increased, showing a Person’s correlation equal to 0.897. The inverse situation is observed when comparing artificial areas with agricultural and forest areas, showing a Person’s correlation equal to −0.702 and −0.661, respectively.
The growing of the artificial areas demands an effort of the water-related ecosystems services. To respond to that, in the last 18 years, many dams have been constructed, to satisfy water supply, agriculture irrigation, industry and to deal with water scarcity in the most vulnerable regions. The Alqueva dam, located in the SPT sector is the largest superficial water body in Europe [29], and it started being operational in 2002 in the Guadiana River.
3.4. Sensitivity Analysis
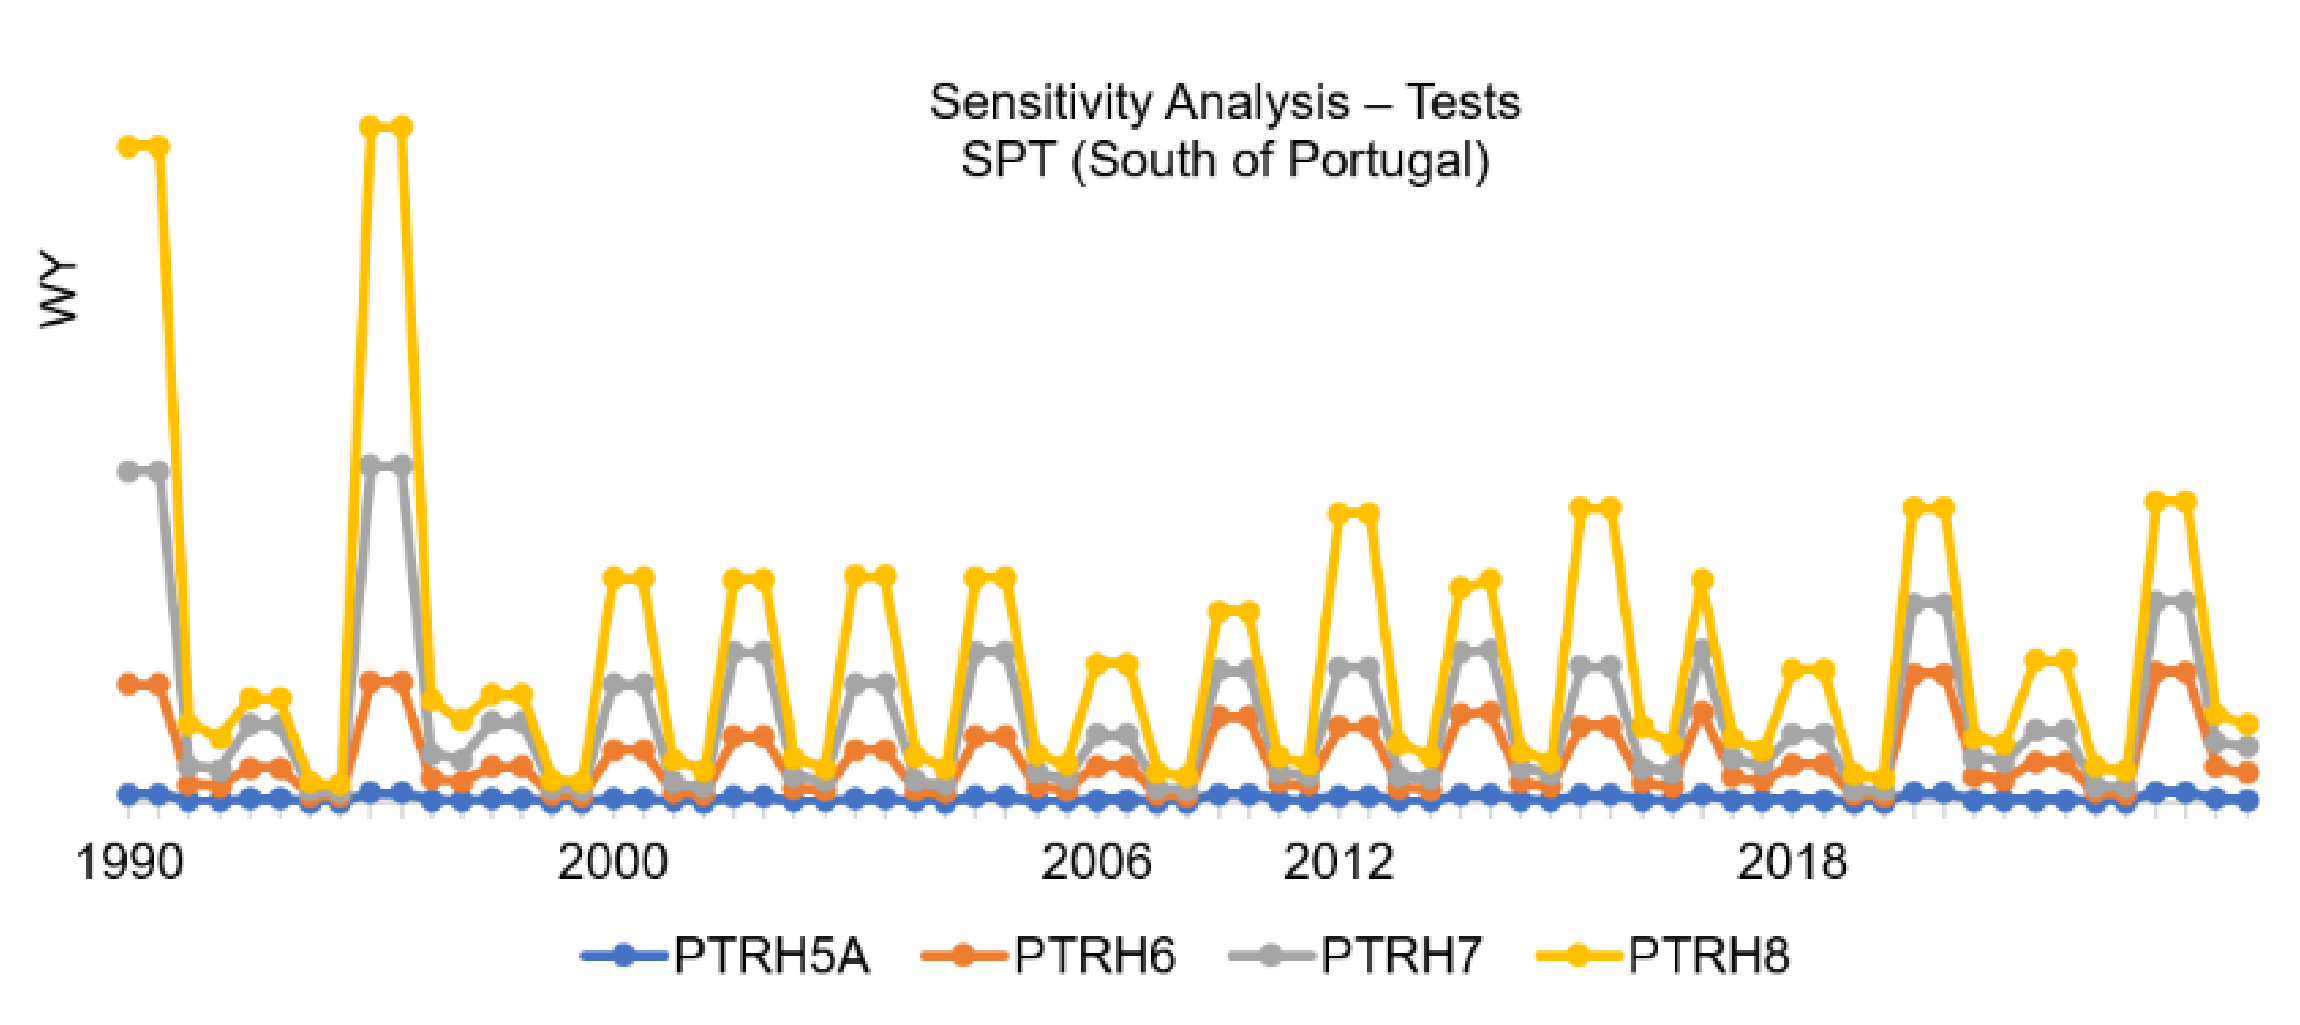
Sensitivity analysis provides a logical and verifiable method of optimizing the distribution of resources used to determine the most important parameters [46]. Considering the spatial pattern established by the meteorological outcomes, this step began investigating the sensitivity of the WYM outcomes by sectors NPT (North of Portugal) and SPT (South of Portugal), assessing and comparing the model’s performance over sensible ranges to determine the effect of these variations. Figure 10 shows water yield result of each test by RBD for NPT sector. The year 2006 has only 8 estimated WY values because Z1 was equal to Z2.
In the NPT sector, 91% of the simulations show a Person’s correlation of more than 0.85, against 0.58 in the SPT sector (Figure 11). The lowest correlation observed on both sectors was 0.6. The NPT sector shows sensitivity to all the tests throughout the studied years. The SPT sector shows high sensitivity, especially in the years 1990, 2012 and 2018. In most of the tests, when using the largest value to Z (Z2), the results are slightly higher when compared to Z1. The PTRH5A shows the lowest variations between tests.
The RBDs in the SPT sector show higher sensitivity to the alternative PAWC (T1 and T2). In both sectors, the model shows higher sensitivity to the tests in the years 1990 and 2012, where is known that the annual precipitation was lower due to the drought events occurred in those years, as referred in the literature [22]. The storage capacities provided by reservoirs and lakes drive the possibility for water to be spared between periods with recharge (high precipitation indices) and periods of consumption [52]. Catchments with high resistance can store water over long periods (months or years) and release water gradually to the stream [53] that can also affect the results.
The highest sensitivity in the PTRH7 is observed when running the model with an alternative PAWC (T1, T2) and alternative biophysical table (T1). Those extremes values have occurred because in this RBD exists the largest superficial water body in Europe, the Alqueva dam [11], and the PAWC in those pixels had a maximum possible value which is 0.98. The reservoir behaves as a “tank” receiving water from rainfall on the surface and inlets or returns and exporting water through evaporation, infiltration, losses, withdrawals and outlets [52].
3.5. Model Validation
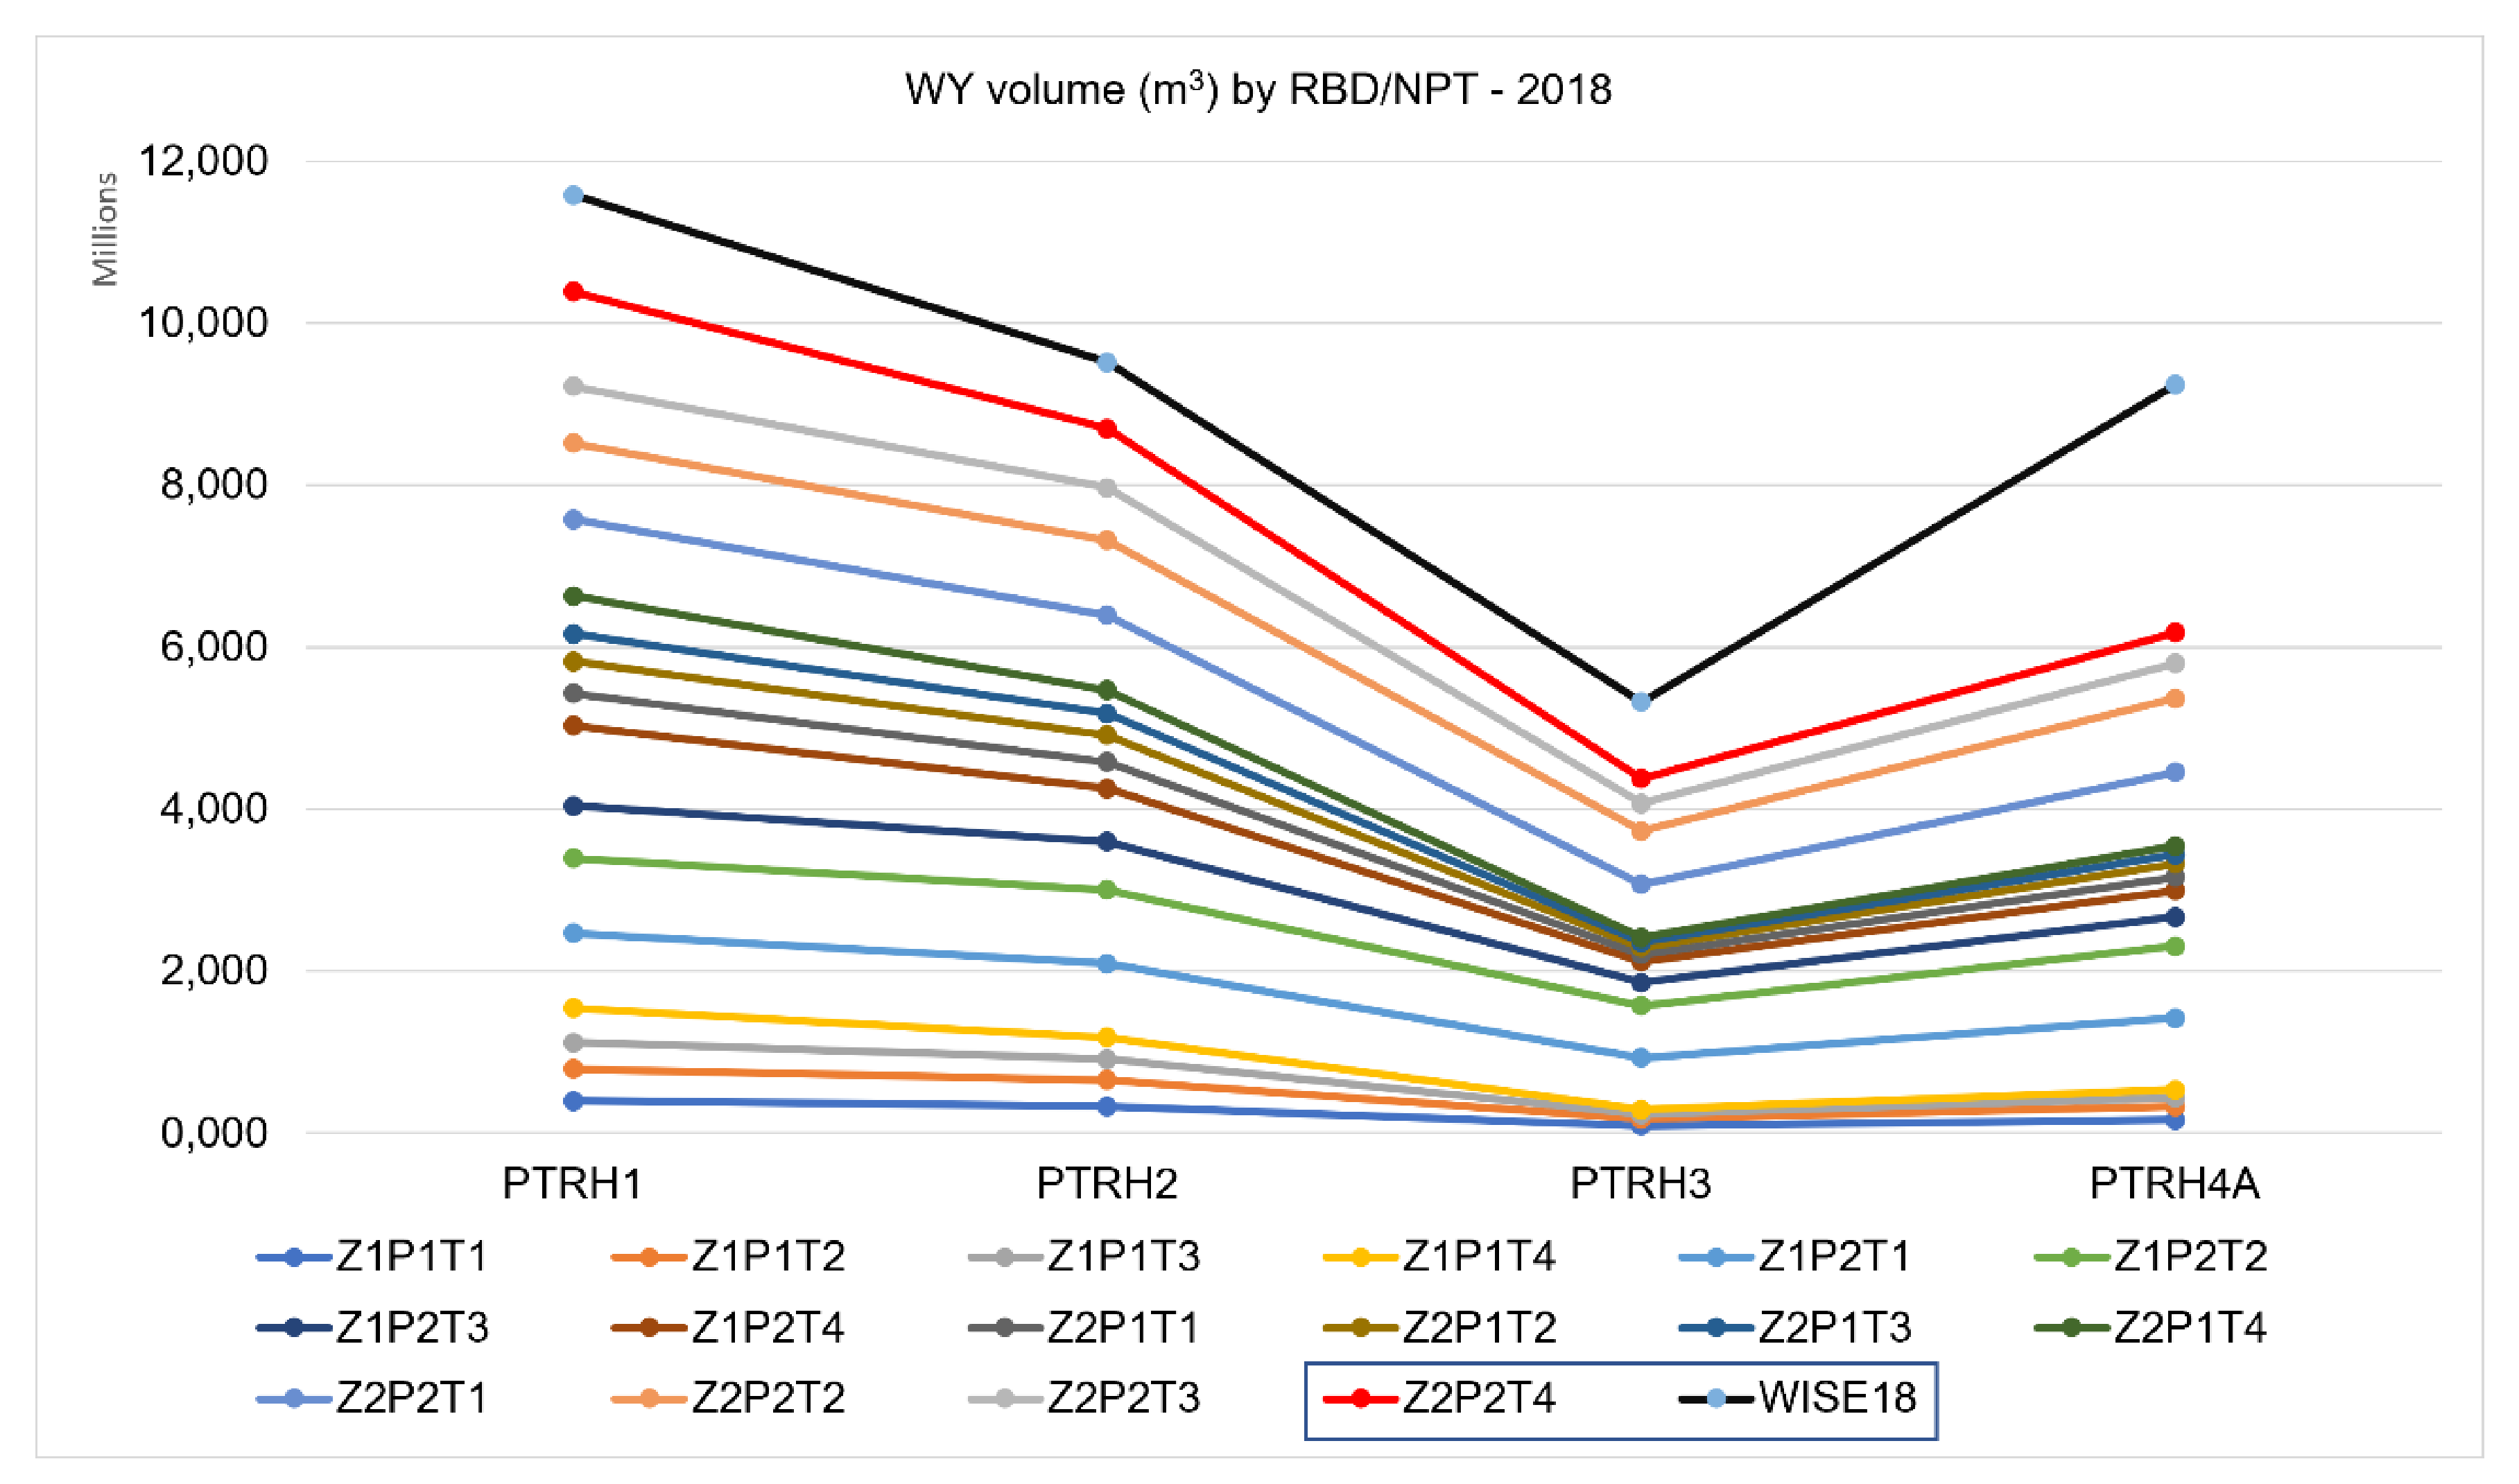
The most convincing evidence that a scientific theory or model is correct is through direct comparison of model predictions with experimental observations [46]. The Waterbase [29] hosted at the European Environment Agency (EEA), provides a central access point to several data based on reporting from countries as part of implementation of EU directives. The validation dataset contains the volume of freshwater resources by RBD for 2018, that will be compared with the best simulations for the same year. Thee data are available for download in the Supplementary Materials section (Validation_WY_2018.xlsx). Figure 12 presents the estimated volume of water yield in 2018 by RBD of the North of Portugal and the observed volumes (WISE18). The best performance simulation in this year was Z2P2T4 which is marked in the legend of the image.
In the SPT sector (Figure 13) the best simulation was considering the test Z1P1T4. The differences between these two tests are on the number of rain days considered, and the source of the precipitation data.
After calibrating the model by sectors with the best simulation performance in 2018, the mean volume of the estimated water yield by RBD was compared with the freshwater resources availability volume, published by [29]. Results at the national level show a correlation coefficient of 0.803 with statistical significance for 0.01 one-tail. Table 4 has the values used to estimate model’s accuracy.
Model validation demonstrates that a given site-specific model as the WYM can make sufficiently accurate estimations. The WY in the NPT sector was underestimated by 56.5 mm/ha/year and the SPT sector was overestimated by 58.1 mm/ha/year. The difference in the estimations by sectors is explained by the spatial and temporal variability of precipitation and the sensitivities of the model to the climatic variables. Figure 14 shows the spatially assessment of the errors normalized by each sector. In the NPT sector, aside of the RBD PTRH4A that has the maximum error, all others RBDs show minimum normalized errors. In the SPT sector the maximum error was in the RBD PTRH7, medium errors in the PTRH6 and PTRH8, and minimum normalized error in the PTRH5A.
The errors in the estimations can be explained by other variables that were not considered in the modelling process, such as surface runoff, losses or gains to groundwater systems, and storage dynamics. Complex land use patterns or underlying geology may induce complex water balances as it is not precisely captured by the model [31]. However, the InVEST WY model shows a good capability to model water balance and water circulation through sub-surface porous media, and to analyse the effects of meteorological pressures on water ecosystem conditions at RBD level.
4. Conclusions
Through analytical examination this study contributes to the process of building scientific confidence in the spatially explicit assessment of water yield at river basin districts level. The sensitivity of the WYM to the climatic variables was confirmed when comparing simulations with two different climatic datasets, and its sensitivity to land cover changes was confirmed when running simulations with the alternative PAWC. The drought events which occurred in mainland Portugal in the years 1990 and 2012, helped to understand the effects of the meteorological conditions in the water availability and water ES’ behaviours. Comparing the model’s performance for the sensitivity tests, the WYM shows to be reactive to changes in the Z coefficient (number of rain days in a year), precipitation, and evapotranspiration indices. The model has shown the highest sensitivities when extreme climate conditions occurred.
The models’ accuracy was verified by calculating the correlation coefficient at the RBD level and comparing the mean estimated water yield with mean observed values at the same scale. Those data are available for download in the Supplementary Materials (Validation_WY_2018.xlsx). Mean WY was underestimated in the NPT sector and overestimated in the SPT sector. The estimations would be better if the model was calibrated and run separately for each RBD. Nevertheless, the model shows correlation coefficient of 0.803 with statistical significance for 0.01 one-tail. The uncertainties that exist in the model, such as the fact that the WYM is not considering surface water and groundwater interactions and is not differentiating surface runoff and baseflow, combined with complex land-use patterns, such as wetlands, or underlying geology, such as alluvial deposits, could explain the difference between estimated values and observed values.
The comparison of the simulations’ tests and the validation of the model were important to build confidence in the models’ outputs, to support studies related to the spatial estimation of water availability at sub-watershed, watershed, or RBD, and to provide guidance for future research. The best performance can be achieved considering multi-site calibration/validation and multi-parameters checks, especially if spatially variability is observed, and complex land cover and geology are known.
Supplementary Materials
The following are available online at https://0-www-mdpi-com.brum.beds.ac.uk/article/10.3390/ijgi10080494/s1, Validation_WY_2018.xlsx.
Author Contributions
Conceptualization, Bruna Almeida and Pedro Cabral; methodology, Bruna Almeida and Pedro Cabral; formal analysis, Bruna Almeida; investigation, Bruna Almeida and Pedro Cabral; writing—original draft preparation, Bruna Almeida; writing—review and editing, Bruna Almeida and Pedro Cabral; visualization, Bruna Almeida; supervision, Pedro Cabral. All authors have read and agreed to the published version of the manuscript.
Funding
This study was supported through the FCT (Fundação para a Ciência e a Tecnologia) under the projects PTDC/CTA-AMB/28438/2017—ASEBIO and UIDB/04152/2020—Centro de Investigação em Gestão de Informação (MagIC).
Institutional Review Board Statement
Not applicable.
Informed Consent Statement
Not applicable.
Data Availability Statement
The data that support the findings of this study are available on reasonable request from the corresponding author.
Conflicts of Interest
The authors declare no conflict of interest.
References
- IPBES. Summary for Policymakers of the Global Assessment Report on Biodiversity and Ecosystem Services of the Intergovernmental Science-Policy Platform on Biodiversity and Ecosystem Services; IPBES Secretariat: Bonn, Germany, 2019; ISBN 9783947851133. [Google Scholar] [CrossRef]
- Newbold, T.; Hudson, L.N.; Hill, S.L.L.; Contu, S.; Lysenko, I.; Senior, R.A.; Börger, L.; Bennett, D.J.; Choimes, A.; Collen, B.; et al. Global effects of land use on local terrestrial biodiversity. Nature 2015, 520, 45–50. [Google Scholar] [CrossRef] [PubMed] [Green Version]
- Green, P.A.; Vörösmarty, C.J.; Harrison, I.; Farrell, T.; Sáenz, L.; Fekete, B.M. Freshwater ecosystem services supporting humans: Pivoting from water crisis to water solutions. Glob. Environ. Chang. 2015, 34, 108–118. [Google Scholar] [CrossRef]
- Wei, P.; Chen, S.; Wu, M.; Deng, Y.; Xu, H.; Jia, Y.; Liu, F. Using the invest model to assess the impacts of climate and land use changes on water yield in the upstream regions of the shule river basin. Water 2021, 13, 1250. [Google Scholar] [CrossRef]
- Yang, X.; Yang, X.; Yang, X.; Chen, R.; Chen, R.; Chen, R.; Meadows, M.E.; Meadows, M.E.; Ji, G.; Ji, G.; et al. Modelling water yield with the InVEST model in a data scarce region of northwest China. Water Sci. Technol. Water Supply 2020, 20, 1035–1045. [Google Scholar] [CrossRef]
- The Global Risks Report 2018, 13th ed.; Insight Report; World Economic Forum: Geneva, Switzerland, 2018; ISBN 9781944835156.
- Jafarzadeh, A.A.; Mahdavi, A.; Shamsi, S.R.F.; Yousefpour, R. Annual water yield estimation for different land uses by GISBased InVEST model (Case study: Mish-khas Catchment, Ilam Province, Iran). J. Rangel. Sci. 2019, 9, 1–12. [Google Scholar]
- Liquete, C.; Maes, J.; Notte, A.; Bidoglio, G. Securing water as a resource for society: An ecosystem services perspective. Ecohydrol. Hydrobiol. 2011, 11, 247–259. [Google Scholar] [CrossRef]
- Vogt, J.; Soille, P.; de Jager, A.; Rimavičiūte, E.; Mehl, W.; Foisneau, S.; Bódis, K.; Dusart, J.; Paracchini, M.L.; Haastrup, P.; et al. A Pan-European River and Catchment Database; EU Publications Office: Luxembourg, 2007; ISBN 9789279069413. [Google Scholar]
- Addams, L. Charting Our Water Future: Economic Frameworks to Inform Decision-Making; Routledge: Abingdon, UK, 2009; Volume 21. [Google Scholar]
- Second River Basin Management Plans—Member State: Portugal Report from the Commission to the European Parliament and the Council on the Implementation of the Water Framework Directive (2000/60/EC) and the Floods Directive (2007/60/EC); European Parliament: Brussels, Belgium, 2019.
- Redhead, J.W.; Stratford, C.; Sharps, K.; Jones, L.; Ziv, G.; Clarke, D.; Oliver, T.H.; Bullock, J.M. Empirical validation of the InVEST water yield ecosystem service model at a national scale. Sci. Total Environ. 2016, 569–570, 1418–1426. [Google Scholar] [CrossRef] [Green Version]
- Posner, S.; Verutes, G.; Koh, I.; Denu, D.; Ricketts, T. Global use of ecosystem service models. Ecosyst. Serv. 2016, 17, 131–141. [Google Scholar] [CrossRef]
- Hoyer, R.; Chang, H. Assessment of freshwater ecosystem services in the tualatin and Yamhill basins under climate change and urbanization. Appl. Geogr. 2014, 53, 402–416. [Google Scholar] [CrossRef]
- Sánchez-Canales, M.; López Benito, A.; Passuello, A.; Terrado, M.; Ziv, G.; Acuña, V.; Schuhmacher, M.; Elorza, F.J. Sensitivity analysis of ecosystem service valuation in a Mediterranean watershed. Sci. Total Environ. 2012, 440, 140–153. [Google Scholar] [CrossRef]
- Terrado, M.; Acuña, V.; Ennaanay, D.; Tallis, H.; Sabater, S. Impact of climate extremes on hydrological ecosystem services in a heavily humanized Mediterranean basin. Ecol. Indic. 2014, 37, 199–209. [Google Scholar] [CrossRef]
- Hamel, P.; Guswa, A.J. Uncertainty analysis of a spatially explicit annual water-balance model: Case study of the Cape Fear basin, North Carolina. Hydrol. Earth Syst. Sci. 2015, 19, 839–853. [Google Scholar] [CrossRef] [Green Version]
- European Commission. Eurostat/Regions and Cities Illustrated (RCI). Available online: https://ec.europa.eu/eurostat/cache/RCI/ (accessed on 10 July 2021).
- Pereira, H.M.; Domingos, T.; Vicente, L. Portugal Millennium Ecosystem Assessment: State of the Assessment Report; Centro de Biologia Ambiental, Faculdade de Ciências da Universidade de Lisboa: Lisbon, Portugal, 2004; pp. 1–68. [Google Scholar]
- Miranda, P.M.A.; Coelho, F.E.S.; Tomé, A.R.; Valente, M.A.; Carvalho, A.; Pires, C.; Pires, H.O.; Pires, V.C.; Ramalho, C. 20th Century Portuguese Climate and Climate Scenarios. In Climate Change in Portugal. Scenarios, Impacts and Adaptation Measures; Gradiva Publishers: Lisbon, Portugal, 2002; pp. 23–83. [Google Scholar]
- Abreu Lopes, H. Combating desertification—The Portuguese Tribunal de Contas auditing the National Action Program to Combat Desertification. Clim. Chang. Audit. J. 2020. Available online: https://medium.com/ecajournal/combating-desertification-the-portuguese-tribunal-de-contas-auditing-the-national-action-program-529391c468c3 (accessed on 16 July 2021).
- De Lima, M.I.P.; Santo, F.E.; Ramos, A.M.; Trigo, R.M.; Isabel de Lima, M.P.; Espírito Santo, F.; Ramos, A.M.; Trigo, R.M. Trends and correlations in annual extreme precipitation indices for mainland Portugal, 1941–2007. Theor. Appl. Climatol. 2014, 119, 55–75. [Google Scholar] [CrossRef]
- Belo-Pereira, M.; Dutra, E.; Viterbo, P. Evaluation of global precipitation data sets over the Iberian Peninsula. J. Geophys. Res. Atmos. 2011, 116, 1–16. [Google Scholar] [CrossRef]
- Oliveira, M.M.; Novo, M.E.; Lobo Ferreira, J.P. Models to predict the impact of the climate changes on aquifer recharge. In Water in Celtic Countries: Quantity, Quality and Climate Variability; IAHS Publishing: Wallingford, UK, 2007; pp. 103–110. [Google Scholar]
- UNEP. Hydropolitical Vulnerability and Resilience along International Waters; UNEP: Nairobi, Kenya, 2009; ISBN 9789280730364. [Google Scholar]
- EEA. Catchments and Rivers Network System ECRINS v1.1—Rationales, Building and Improving for Widening Uses to Water Accounts and WISE Applications; EU Publications Office: Luxembourg, 2012; ISBN 9789292133207. [Google Scholar] [CrossRef]
- Ramos, T.B.; Horta, A.; Gonçalves, M.C.; Pires, F.P.; Duffy, D.; Martins, J.C. The INFOSOLO database as a first step towards the development of a soil information system in Portugal. Catena 2017, 158, 390–412. [Google Scholar] [CrossRef]
- Maes, J.; Liquete, C.; Teller, A.; Erhard, M.; Paracchini, M.L.; Barredo, J.I.; Grizzetti, B.; Cardoso, A.; Somma, F.; Petersen, J.E.; et al. An indicator framework for assessing ecosystem services in support of the EU Biodiversity Strategy to 2020. Ecosyst. Serv. 2016, 17, 14–23. [Google Scholar] [CrossRef] [Green Version]
- European Environment Agency. WISE—Water Framework Directive Database. Available online: https://www.eea.europa.eu/data-and-maps/data/wise-wfd-4 (accessed on 10 July 2021).
- Yin, G.; Wang, X.; Zhang, X.; Fu, Y.; Hao, F.; Hu, Q. InVEST model-based estimation of water yield in North China and its sensitivities to climate variables. Water 2020, 12, 1692. [Google Scholar] [CrossRef]
- Sharp. Annual Water Yield—InVEST 3.8.9.post10+ug.gf658986 Documentation. Available online: http://releases.naturalcapitalproject.org/invest-userguide/latest/reservoirhydropowerproduction.html#limitations-and-simplifications (accessed on 10 July 2021).
- Xu, J.; Xiao, Y.; Xie, G.; Jiang, Y. Ecosystem Service Flow Insights into Horizontal Ecological Compensation Standards for Water Resource: A Case Study in Dongjiang Lake Basin, China. Chin. Geogr. Sci. 2019, 29, 214–230. [Google Scholar] [CrossRef] [Green Version]
- Panagos, P.; Van Liedekerke, M.; Jones, A.; Montanarella, L. European Soil Data Centre: Response to European policy support and public data requirements. Land Use Policy 2012, 29, 329–338. [Google Scholar] [CrossRef]
- Fick, S.E.; Hijmans, R.J. WorldClim 2: New 1-km spatial resolution climate surfaces for global land areas. Int. J. Climatol. 2017, 37, 4302–4315. [Google Scholar] [CrossRef]
- Trabucco, A.; Zomer, R.J. Global Aridity Index and Potential Evapotranspiration (ET0) Climate Database v2. CGIAR Consort. Spat. Inf. 2018, 10. [Google Scholar] [CrossRef]
- SNIRH. Sistema Nacional de Informação de Recursos Hídricos. Available online: https://snirh.apambiente.pt/ (accessed on 10 July 2021).
- CGLS Copernicus Global Land Service. Available online: https://land.copernicus.eu/global/ (accessed on 10 July 2021).
- Allen, R.G.; Pereira, L.S.; Raes, D.; Smith, M.; Ab, W. FAO Irrigation and Drainage Paper No. 56; FAO: Rome, Italy, 1998; p. 300. [Google Scholar] [CrossRef]
- Cabral, P.; Feger, C.; Levrel, H.; Chambolle, M.; Basque, D. Assessing the impact of land-cover changes on ecosystem services: A first step toward integrative planning in Bordeaux, France. Ecosyst. Serv. 2016, 22, 318–327. [Google Scholar] [CrossRef] [Green Version]
- O’Geen, A.T. Soil Water Dynamics. Nature Education Knowledge. Available online: https://0-www-nature-com.brum.beds.ac.uk/scitable/knowledge/library/soil-water-dynamics-103089121/ (accessed on 10 July 2021).
- Dalgliesh, N.; Foale, M. Soil Matters; Cranbrook Press: Toowoomba, Australia, 2005. [Google Scholar]
- Climate Change Portal. Available online: http://portaldoclima.pt/en/ (accessed on 10 July 2021).
- Gomes, S.; Deus, R.; Nogueira, M.; Viterbo, P.; Miranda, M.; Antunes, S.; Silva, A.; Miranda, P. The Portuguese Climate Portal. Geophys. Res. Abstr. EGU Gen. Assem. 2016, 18, 16517. [Google Scholar]
- IPMA Portuguese Institute for Sea and Atmosphere. Available online: https://www.ipma.pt/en/produtoseservicos/index.jsp?page=dataset.pt02.xml (accessed on 10 July 2021).
- Cardinale, B.J.; Duffy, J.E.; Gonzalez, A.; Hooper, D.U.; Perrings, C.; Venail, P.; Narwani, A.; Mace, G.M.; Tilman, D.; Wardle, D.A.; et al. Biodiversity loss and its impacton humanity. Nature 2012, 486, 59–67. [Google Scholar] [CrossRef] [PubMed]
- Mallants, D.; Bekele, E.; Schmid, W.; Miotlinski, K. Human and Environmental Exposure Conceptualisation: Soil to Shallow Groundwater Pathways; Office of Water Science Department of the Environment and Energy: Canberra, Australia, 2017. [Google Scholar]
- Refsgaard, J.C. Parameterisation, calibration and validation of distributed hydrological models. J. Hydrol. 1997, 198, 69–97. [Google Scholar] [CrossRef]
- Sargent, R.G. Validation and verification of simulation models. In Proceedings of the Winter Simulation Conference, Washington, DC, USA, 5–8 December 2004. [Google Scholar]
- Ferreira, A.M.P.J. Caracterização de Portugal Continental. In Dados Geoquímicos de Base de Sedimentos Fluviais de Amostragem de Baixa Densidade de Portugal Continental: Estudo de Factores de Variação Regional; Universidade de Aveiro: Aveiro, Portugal, 2000; pp. 19–61. [Google Scholar]
- Gunkel, A.; Lange, J. Water scarcity, data scarcity and the Budyko curve—An application in the Lower Jordan River Basin. J. Hydrol. Reg. Stud. 2017, 12, 136–149. [Google Scholar] [CrossRef]
- Bassi, A.M.; Gallagher, L.A.; Helsingen, H. Green Economy Modelling of Ecosystem Services along the “Road to Dawei”. Environments 2016, 3, 19. [Google Scholar] [CrossRef] [Green Version]
- European Commission. Preparatory Action—Development of Prevention Activities to Halt Desertification in Europe—Service Contract to Contribute to the Building of Water and Ecosystem Accounts at EU Level. Water Accounts System and Results; European Commission: Brussels, Belgium, 2012. [Google Scholar]
- Carey, S.K.; Tetzlaff, D.; Seibert, J.; Soulsby, C.; Buttle, J.; Laudon, H.; Mcdonnell, J.; Mcguire, K.; Caissie, D.; Shanley, J.; et al. Inter-comparison of hydro-climatic regimes across northern catchments: Synchronicity, resistance and resilience. Hydrol. Processes 2010, 3602, 3591–3602. [Google Scholar] [CrossRef]
Figure 1.
Overview of Portugal’s River Basin Districts organized by sector NPT (North of Portugal) and SPT (North of Portugal).
Figure 1.
Overview of Portugal’s River Basin Districts organized by sector NPT (North of Portugal) and SPT (North of Portugal).

Figure 2.
Model’s physical expressions.

Figure 3.
Diagram flow representing the sensitivity analysis tests applied to the InVEST WYM for years (1990, 2000, 2012, and 2018).
Figure 3.
Diagram flow representing the sensitivity analysis tests applied to the InVEST WYM for years (1990, 2000, 2012, and 2018).

Figure 4.
Boxplots: Average annual precipitation by river basin district (mm).

Figure 5.
Average annual precipitation (mm) by data source and sectors. P1—WorldClim; P2—SNIRH; NPT—North of Portugal (PTRH1, PTRH2, PTRH3, PTRH4); SPT—South of Portugal (PTRH5, PTRH6, PTRH7, PTRH8).
Figure 5.
Average annual precipitation (mm) by data source and sectors. P1—WorldClim; P2—SNIRH; NPT—North of Portugal (PTRH1, PTRH2, PTRH3, PTRH4); SPT—South of Portugal (PTRH5, PTRH6, PTRH7, PTRH8).

Figure 6.
Boxplots: Dryness indexes by RBD.

Figure 7.
Boxplots: Evaporative indexes by RBD.

Figure 8.
Budyko curve by sensitivity analysis tests. P1—WorClim; P2—SNIRH; T3—E1; T4—E2; Green Cluster: NPT (PTRH1, PTRH2, PTRH3, PTRH4); Yellow Cluster: SPT (PTRH5, PTRH6, PTRH7, PTRH8).
Figure 8.
Budyko curve by sensitivity analysis tests. P1—WorClim; P2—SNIRH; T3—E1; T4—E2; Green Cluster: NPT (PTRH1, PTRH2, PTRH3, PTRH4); Yellow Cluster: SPT (PTRH5, PTRH6, PTRH7, PTRH8).

Figure 9.
Tables showing Corine Land Cover evolution (CLC_Evolution) and variation (Var_18_90) for the main land use/land cover categories. 1-Artificial surfaces, 2-Agricultural area, 3-Forest and seminatural areas, 4-wetlands, 5-water bodies. Each red dot is referring to values estimated for the studied years (1990, 2000, 2006, 2012, and 2018). LULC (Land Use/Land Cover), NPT (North of Portugal), SPT (South of Portugal), PT (mainland Portugal).

Figure 10.
Sensitivity analysis tests by river basin district (RBD) of the North of Portugal.

Figure 11.
Sensitivity analysis tests by river basin district (RBD) of the South of Portugal.

Figure 12.
Estimated WY volume (m3) in 2018 by RBD/NPT sector and observed values.

Figure 13.
Estimated WY volume (m3) in 2018 by RBD/SPT sector and observed values.

Figure 14.
RBD error normalized by the mean error of each sector.


Table 1.
Portugal’s River Basin Districts organized by sector NPT and SPT [11].
Table 1.
Portugal’s River Basin Districts organized by sector NPT and SPT [11].
| Sector | RBD | Name | Total Area (km2) |
|---|---|---|---|
| NPT | PTRH1 | Minho and Lima | 2465 |
| PTRH2 | Cávado, Ave and Leça | 3584 | |
| PTRH3 | Douro | 19,219 | |
| PTRH4A | Vouga, Mondego and Lis | 16,981 | |
| SPT | PTRH5A | Tejo and Ribeiras do Oeste | 25,665 |
| PTRH6 | Sado and Mira | 12,149 | |
| PTRH7 | Guadiana | 11,611 | |
| PTRH8 | Ribeiras do Algarve | 5511 |
Table 2.
The number of rain days (N1, N2) per year and the values assigned to the Z coefficient (Z = 0.2 × N).
Table 2.
The number of rain days (N1, N2) per year and the values assigned to the Z coefficient (Z = 0.2 × N).
| Year | N1 [42] | Z1 | N2 [44] | Z2 |
|---|---|---|---|---|
| 1990 | 82 | 16 | 99 | 20 |
| 2000 | 106 | 21 | 115 | 23 |
| 2006 | 100 | 20 | 102 | 20 |
| 2012 | 94 | 19 | 129 | 26 |
| 2018 | 93 | 18 | 123 | 25 |
Table 3.
Input data required in the WYM grouped by the 4 sensitivity analysis tests.
| WYM Parameters | Data Source | Temporal Scale | Spatial Scale | Test 1 (T1) | Test 2 (T2) | Test 3 (T3) | Test 4 (T4) |
|---|---|---|---|---|---|---|---|
| Average Annual precipitation (mm) | P1 (WorldClim-CSI); P2 (SNIRH) | Annual | P1 (Global); P2 (National) | P1; P2 | P1; P2 | P1; P2 | P1; P2 |
| Seasonality coefficient (Z) | Z1 (Portal do Clima PROJECT); Z2 (IPMA) | Annual | Z1; Z2 (National) | Z1; Z2 | Z1; Z2 | Z1; Z2 | Z1; Z2 |
| Land use/land cover (LULC) | LULC (Copernicus) | 1990; 2000; 2006; 2012; 2018 | Europe | LULC | LULC | LULC | LULC |
| Average annual evapotranspiration (mm) | E1 (WorldClim-CSI); E2 (SNIRH) | Annual | E1 (Global); E2 (National) | E1 | E1 | E1 | E2 |
| Plant available water content fraction | PAWC1 (ESDAC); PAWC2 (ESDAC Reclassified) | 2013 | Europe | PAWC2 | PAWC2 | PAWC1 | PAWC1 |
| Watersheds | EEA-WISE | 2020 | Europe | RBD | RBD | RBD | RBD |
| Root restricting layer depth (mm) | ESDAC | 2013 | Europe | ESDAC | ESDAC | ESDAC | ESDAC |
| Biophysical Table | B1 (Referential Biophysical Table—FAO); B2 (Modified Referential Biophysical Table—FAO) | 1990; 2000; 2006; 2012; 2018 | National | B2 | B1 | B1 | B1 |
Table 4.
Mean estimated WY, observed values and the error in the estimations.
| Sector | NPT | SPT | ||||||
|---|---|---|---|---|---|---|---|---|
| Best Performance/Sector | Z2P2T4 | Z1P1T4 | ||||||
| RBD | PTRH1 | PTRH2 | PTRH3 | PTRH4A | PTRH5A | PTRH6 | PTRH7 | PTRH8 |
| area (ha) | 246,500 | 358,400 | 1,921,900 | 1,698,100 | 2,566,500 | 1,214,900 | 1,161,100 | 551,100 |
| WY_Est_2018 (m3/ha) | 4746 | 2037 | 159 | 224 | 31 | 468 | 449 | 2323 |
| WY_Obs_2018 (m3/ha) | 4851 | 2280 | 492 | 1801 | −176 | 1455 | −1368 | 1033 |
| error/RBD (m3/ha) | −105 | −243 | −333 | −1577 | 207 | −988 | 1817 | 1290 |
| Mean error/sector | −56.5 mm/ha/year | 58.1 mm/ha/year | ||||||
WY_Est_2018 (mean estimated WY); WY_Obs_2018 (mean observed WY—WISE WaterBase).
Publisher’s Note: MDPI stays neutral with regard to jurisdictional claims in published maps and institutional affiliations. |
© 2021 by the authors. Licensee MDPI, Basel, Switzerland. This article is an open access article distributed under the terms and conditions of the Creative Commons Attribution (CC BY) license (https://creativecommons.org/licenses/by/4.0/).
Share and Cite
MDPI and ACS Style
Almeida, B.; Cabral, P. Water Yield Modelling, Sensitivity Analysis and Validation: A Study for Portugal. ISPRS Int. J. Geo-Inf. 2021, 10, 494. https://0-doi-org.brum.beds.ac.uk/10.3390/ijgi10080494
AMA Style
Almeida B, Cabral P. Water Yield Modelling, Sensitivity Analysis and Validation: A Study for Portugal. ISPRS International Journal of Geo-Information. 2021; 10(8):494. https://0-doi-org.brum.beds.ac.uk/10.3390/ijgi10080494
Chicago/Turabian StyleAlmeida, Bruna, and Pedro Cabral. 2021. "Water Yield Modelling, Sensitivity Analysis and Validation: A Study for Portugal" ISPRS International Journal of Geo-Information 10, no. 8: 494. https://0-doi-org.brum.beds.ac.uk/10.3390/ijgi10080494
Note that from the first issue of 2016, this journal uses article numbers instead of page numbers. See further details here.