
Smartphone GPS Locations of Students’ Movements to and from Campus


1
Human Performance Lab, Faculty of Kinesiology, University of Calgary, Calgary, AB T2N 1N4, Canada
2
School of Architecture, Planning, and Landscape, University of Calgary, Calgary, AB T2N 1N4, Canada
3
The Alberta Children’s Hospital Research Institute, University of Calgary, Calgary, AB T3B 6A8, Canada
4
Environmental Studies, University of Victoria, Victoria, BC V8P 5C2, Canada
5
Faculty of Forestry, University of British Columbia, Vancouver, AB V6T 1Z4, Canada
6
Department of Biological Sciences, University of Calgary, Calgary, AB T2N 1N4, Canada
*
Author to whom correspondence should be addressed.
ISPRS Int. J. Geo-Inf. 2021, 10(8), 517; https://0-doi-org.brum.beds.ac.uk/10.3390/ijgi10080517
Submission received: 8 June 2021
/
Revised: 17 July 2021
/
Accepted: 26 July 2021
/
Published: 31 July 2021
(This article belongs to the Special Issue Spatial Data Management in Geosciences, Urban Planning, Land Management, and Cultural Heritage)
Abstract
:For many university students, commuting to and from campus constitutes a large proportion of their daily movement, and therefore it may influence their ability and willingness to spend time on campus or to participate in campus activities. To assess student engagement on campus, we collected smartphone GPS location histories from volunteers (n = 280) attending university in a major Canadian city. We investigated how campus visit length and frequency were related to characteristics of the commute using Bayesian regression models. Slower commutes and commutes over longer distances were associated with more time spent but less frequent visits to campus. Our results demonstrate that exposure to campus life, and therefore the potential for student engagement, may relate not just to whether a student lives on or near campus, but also to urban environmental factors that interact to influence the commuting experience.
1. Introduction
Post-secondary education has become an increasingly popular option for high school graduates [1]. Increases in campus participation have not necessarily been paralleled by more students living on or near campus, resulting in an increase in the proportion of students who need to commute to classes [2]. In 2016, there were almost 1.2 million students in degree programs on Canadian campuses [3,4] and commuting students made up one-third or more of this population [2,5,6].
In general, commuting has important consequences for individuals [7], as it can occupy a large proportion of the day and represents a substantial component of their ongoing day-to-day activities. Individual commutes can vary substantially in terms of distance, speed, and mode of transport [8]. Understanding how differences among commutes and how they may relate to student engagement in campus activities is a relatively unresearched area in Canada. Therefore, studying the overall experience for students, may offer evidence-based support for strategies intended to improve student engagement, which may include shorter commute times or no commute by increasing campus housing or timetable selection and structuring [8].
The National Survey of Student Engagement (NSSE), which in the last decade has become an essential analytical tool for Canadian universities provides data on educational quality. The time and effort that students spend on academic pursuits and campus activities has been conceptualised as student engagement [9]. Factors that influence attendance that are in the control of the university include living on/off campus, lecture schedule options available to the students, and transportation to and from campus [10]. Studies have shown that commuter students tend to score lower on engagement metrics [9,11,12]. In contrast, living in a campus residence has been identified as the single most important variable explaining academic engagement [11,13]. While commuting to campus is considered non-traditional in parts of the world (e.g., Europe) [14,15], such findings are concerning given the large proportion of commuter students that are increasingly represented in campus populations at North American universities [2]. Additionally, many studies comparing the engagement of commuter and residential students treat commuting as a binary experience and do not consider the conditions of the commute itself. Due to the variations in student commuter experiences, it may be important for each institution to study its commuters, and to use information specific to the university’s environment to guide policy and programs rather than basing decisions on aggregate data collected at a national scale [16,17].
Differences in students’ commuting behaviours may be driven by economic decisions such as staying with family members to reduce living costs. The decision to choose to commute by public transport or using a personal vehicle, rather than an active form of travel such as walking or cycling, can also be influenced by a student’s economic status [18]. For students living in residential suburbs, this combination of factors may result in long-distance and time-consuming commutes from areas that, in many North American cities, may be relatively poor in terms of affordable access to public transportation options [19]. In general, students use a variety of methods (i.e., mode share) to commute to and from campus. In Canada, almost half of all students drive, either alone (34%) or with others (11%), 25% use public transportation and 20% walk to campus [20].
The commute demands a large portion of time during a student’s day and likely plays a role when planning their university course schedule and deciding how much time they will be able to spend on campus [21]. A measure of how much time students spend on campus can give valuable insight into student’s real-time engagement in campus activities and how this correlates with their commuting behavior. For example, daily commutes may be seen by students as more demanding than commuting a couple of times a week. In this case, the risks of non-engagement and isolation may be greater, however the challenges of commuting are reduced. Similarly, how long students remain on campus per visit is likely influenced by the ease of the associated commute.
The recent introduction of GPS data collected from smartphones to mobility and transport research allows for real-time tracking of locations following the daily travelled routes of individuals, thereby, describing spatial behaviour more precisely than traditional sources of data [22,23]. Such data collection methods provide high-precision activity measures [24] without the need for a large financial investment in technology [25]. Qualitative and questionnaire-based analysis of students’ travel has been described extensively [26]. Previous pilot research used smartphone applications to track student travel patterns during a public transportation bus lockout [27]. Another pilot study in Barcelona used GPS tracking on smartphones to compare the urban travel patterns of students and faculty, reporting that students had smaller activity spaces than their professors [25]. Travel patterns of students have also been explored using GPS smartphone data to understand their travel times and activity spaces around their campus [28]. Despite these recent studies, travel behaviour analysis [29] has yet to be applied to commuting students even though it has been used in other populations [30,31]. This is surprising considering their high representation among the commuting public [32,33]. Although questionnaire-based data on student engagement involves information on time spent on campus [34], it is much more straightforward to extract this information from the measurement of GPS location data.
In this study, we used student smartphone GPS location data to investigate how a student’s residential location relative to campus and the characteristics of their commute influence time spent on the campus. We characterised engagement indirectly in terms of the duration of the campus visit per commute, and the weekly frequency of visits, which are likely to increase if students are more involved in both curricular and extra-curricular campus activities. Students face a trade-off between time and energy expended through commuting versus time spent on campus. We investigated if a student’s time on campus was related to factors associated with their campus commute, such as distance, speed and variables that characterise ease of commute, as well as temporal covariates such as time of the year (semester) and the day of the week.
We compared multiple models representing competing hypotheses for factors that influence the length and frequency of campus visits; these include models with variables calculated using information on an individual’s residence (i.e., that could be obtained from a GIS analysis using home address) and models that incorporate characteristics of the commute (i.e., from spatial and temporal descriptors that have been estimated from the archive of smartphone GPS location data). We predicted that when students have a more challenging commute (e.g., further, longer, using active or public modes of transport), they will increase their visit duration to campus, but reduce their visit frequency. Conversely, we predicted that students facing an easier commute (e.g., shorter, faster, or using a personal vehicle) would decrease their time on campus through shorter but more frequent visits. Lastly, we predicted that students would spend more time on campus and visit campus more frequently based on their course schedule, i.e., during the fall and winter semesters and would spend more time on campus during the week relative to the weekends.
2. Materials and Methods
2.1. Study Area
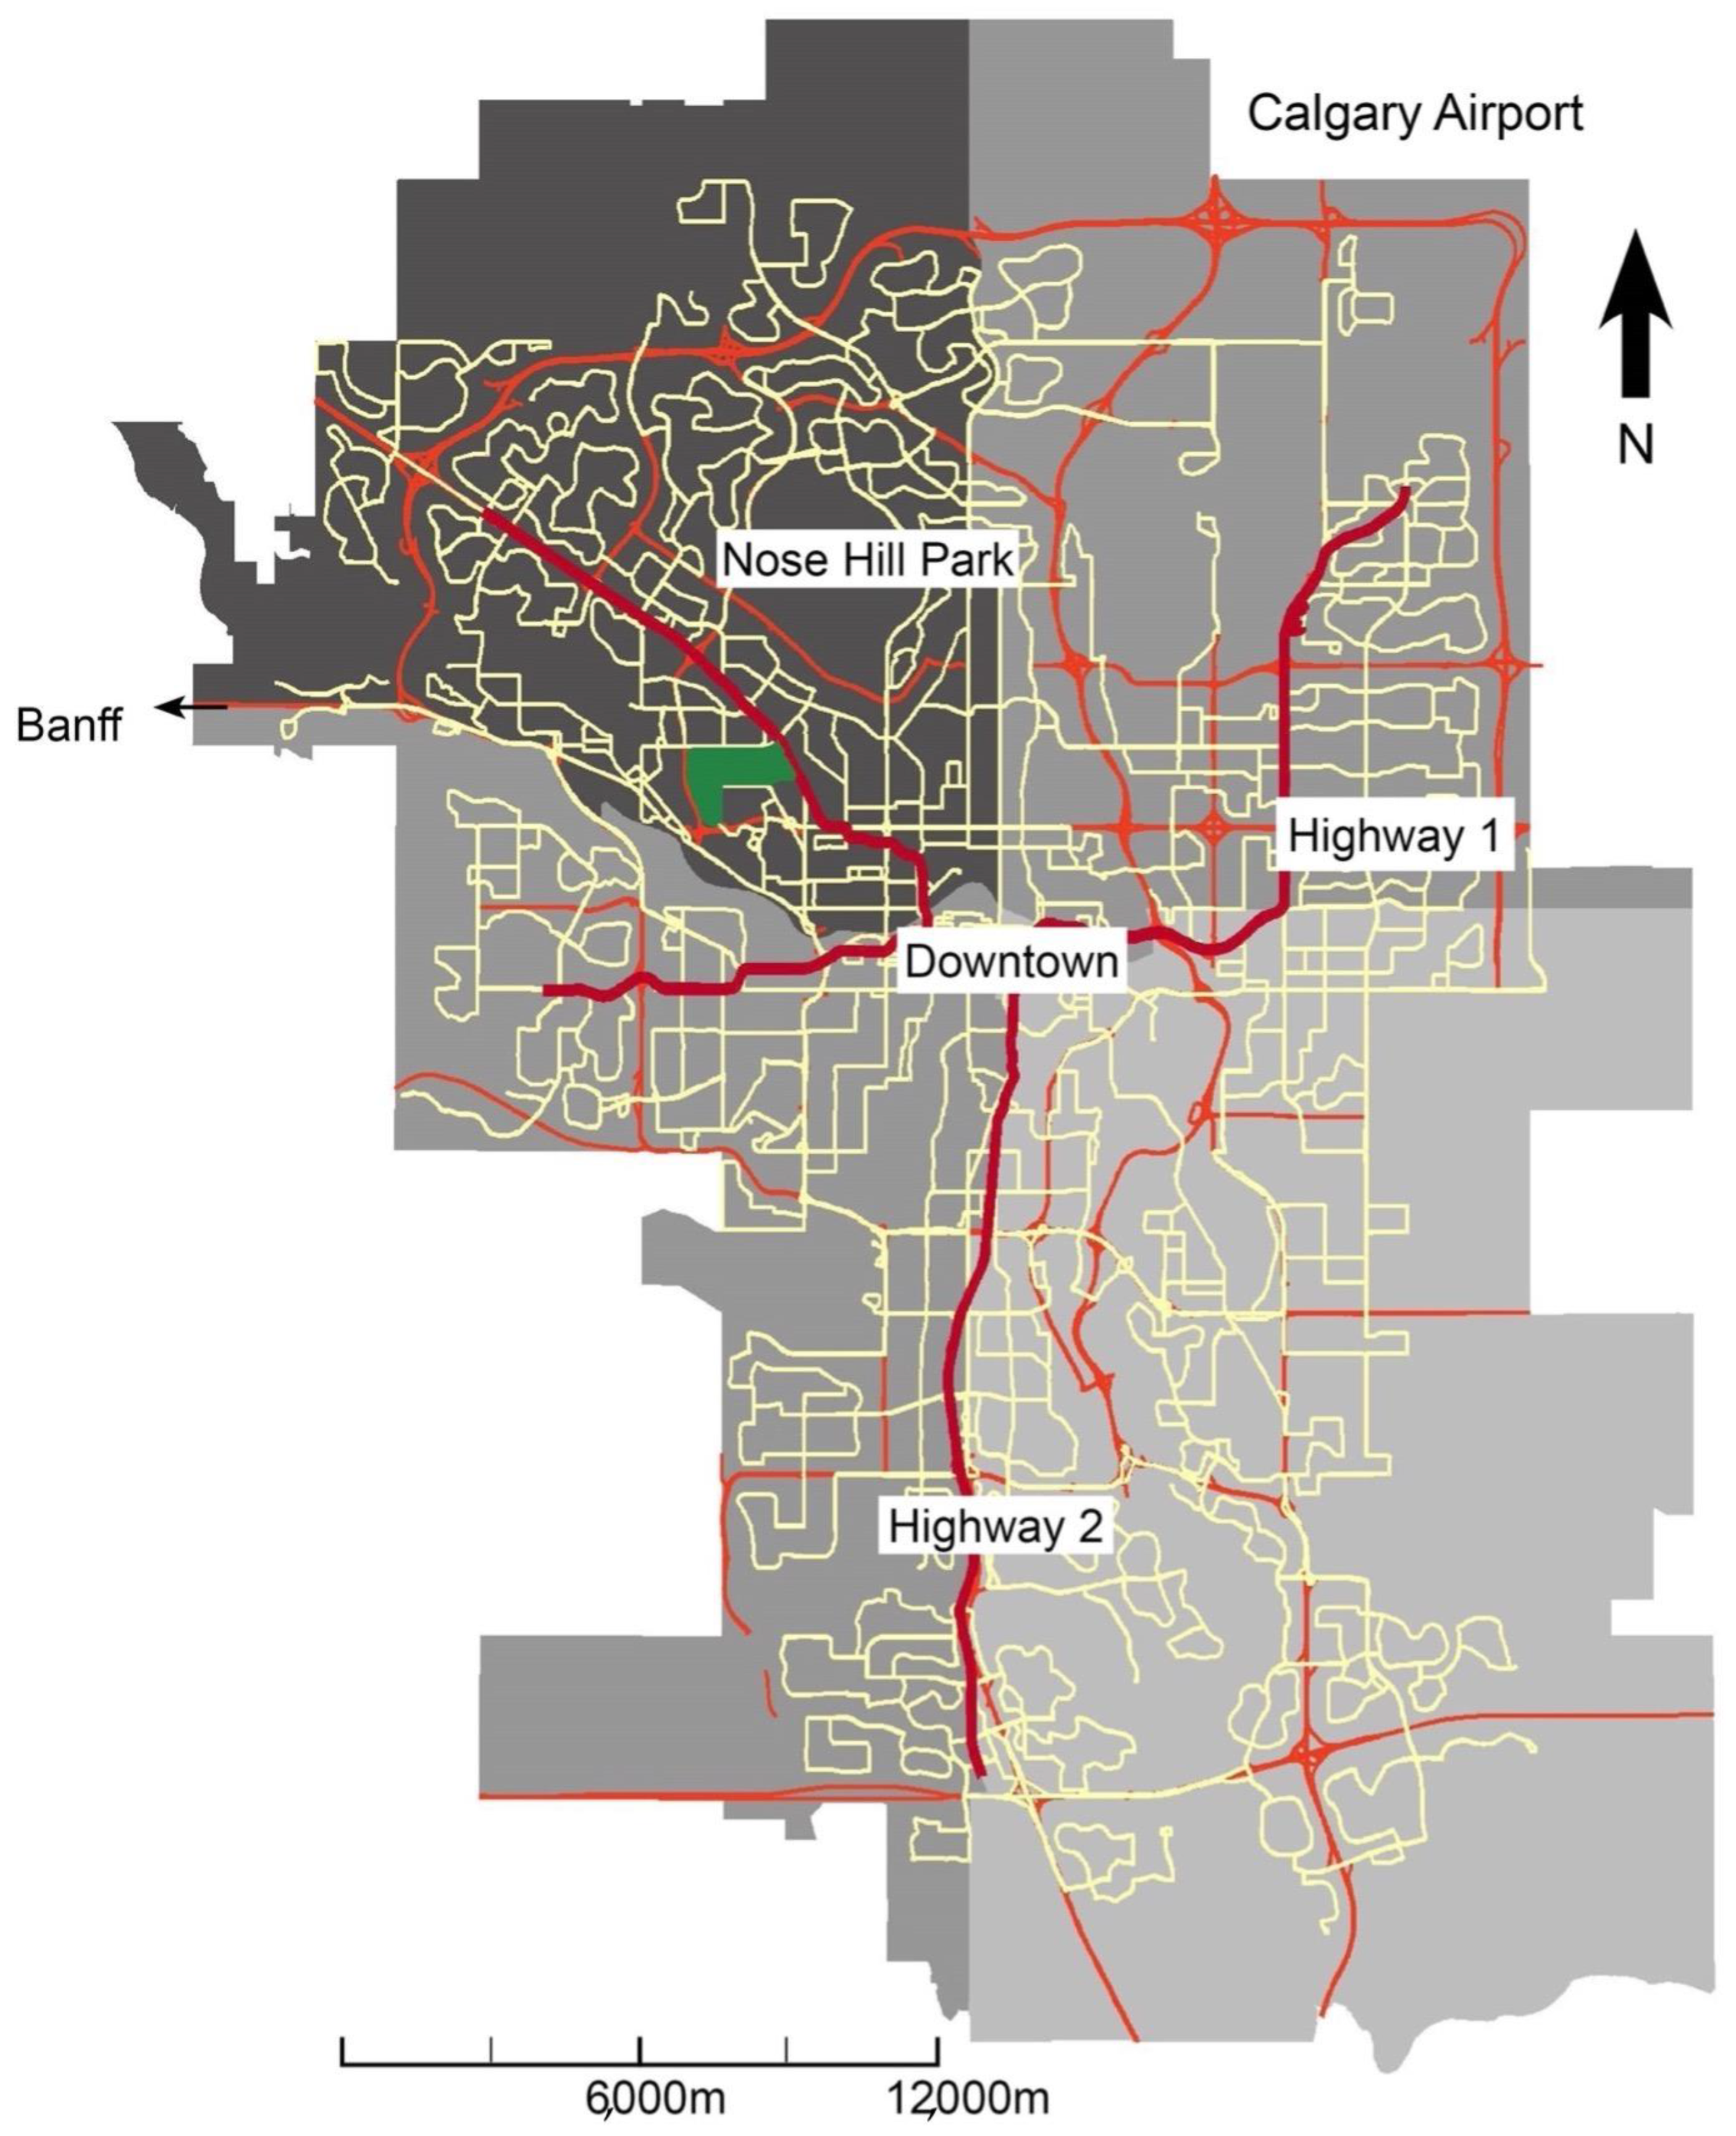
This study was conducted in the City of Calgary, Alberta, which is the fourth largest metropolitan area in Canada by population (1.47 million) [35] and is home to several post-secondary institutions, the largest being the University of Calgary with approximately 33,000 students [36]. The university is situated in the northwest quadrant of the city and is located on several bus routes and the light-rail transit (LRT) line, which connects the campus with the downtown core as well as other areas of the city (see Figure 1). Like many urban universities in North America, the University is primarily a commuter campus, with ~95,000 commute bouts taking place daily (79%) [37]. Based on a 2015 survey of student commuting habits (1016 students) [38], the majority of University of Calgary students (54.3%) use public transportation as their main mode of commute, while the remaining students use personal motorised transport (25.4%) or use active forms of transport such as walking or cycling (20.1%).
2.2. Mobile Phone GPS Data
We recruited 280 University of Calgary students over a two-year period starting in April 2015. Students volunteered GPS location data, downloaded from personal Google Android devices using the “takeout” service freely provided by Google [39]. A full description of the data collection methods has been previously published in Galpern et al. [24]. All spatial data was filtered and removed if the locations fell outside the City of Calgary boundaries. To improve the quality, we also excluded data where the spatial accuracy was greater than 100 m, and relocation frequency (time between location t and location t + 1) was less than 30 s, which may be caused by several factors including a poor GPS signal. We then created linear features between consecutive GPS relocations (hereby referred to as “steps”). In addition, we calculated speed as the step length (Euclidean distance between two consecutive relations) divided by the time interval (km/h), and removed any locations where this was greater than 150 km/h.
2.3. Identifying Residence–Campus Commutes
We defined a student’s primary place of residence as the most used location between 2200 and 0500 h. We calculated residence locations for each participant–month combination for each year, as students may reside in multiple residences across a single calendar year. All locations within a 200-metre buffer of the participant’s residence and those within the boundaries of the University of Calgary campus were categorised as being at the residence location or campus location, respectively, and intermediary relocations were grouped and classified as a single commuter “bout”. Several variables, predicted to influence the time each participant would spend on campus, were extracted for each commuter bout (see Table 1). We then combined to and from campus bouts to identify campus “trips”. Trips consisted of all steps combined into a single linear feature (see above). To avoid including trips that were poor representations of the actual routes taken by participants, we removed any trips that contained on average less than one location per kilometre and any that contained steps (i.e., segments that are combined to create the trip) longer than 10 km. We also removed bouts that were longer than two hours, as these were likely bouts that were indirect trips to or from campus.
2.4. Campus Experience
We used two proxy measures for student campus engagement: (1) duration of campus visit, calculated as the proportion of the day spent on campus per visit; and (2) visit frequency, calculated as the number of days with campus visits per week. We identified each visit to campus and quantified the amount of time the participant spent within the campus boundary by subtracting the time of the first point on campus from the last point before leaving campus to return home (in hours) and then dividing by hours of the day (24). For visit frequency, we summed the number of days that included a campus trip and calculated the mean values across each week for each independent variable.
2.5. Analysis
We constructed Bayesian multi-level regression models [40] and used LOOIC criteria [41,42] to compare model performance (see Table 2). Specifically, we contrasted spatial covariates that were constructed using information on the home location of the participant (local), with spatial and temporal covariates measured using information along the route taken to and from campus (commute).
We fit the daily proportion of time spent on campus (visit length) as a beta distributed response variable, and the number of days of the week that included a campus visit (visit frequency) was modelled as a cumulative ordered logit response [43]. We included a nested group-level intercept of trip ID (visit length models only), week (visit frequency models only), and whether it was to campus or from campus bout. For both measures of campus engagement, we included participant ID as a random effect on the intercept to control for unmeasured variations in individual behaviour.
All continuous independent variables were scaled and centered to improve model convergence and allow for comparison of effect sizes across variables. We used the brms package [43] in R [44] to fit the models. Each model was run with four MCMC chains with 1000 warmup iterations followed by 1000 sampling iterations, with vague priors for all coefficients.
3. Results
Between 2015 and 2017, we identified 30,877 bouts to and from the University of Calgary campus and the associated length of campus visits by 168 participants (mean number of bouts per participant = 184, range = 11–1218). Bouts contained an average of 13 locations (range = 2–180), which when taking distance and time into account, translated into an average of 3.1 locations per km (range = 1–65), and an average of 35.6 locations per hour (range = 1–240), respectively. We calculated 11,641 weekly visit frequencies (mean per participant = 69.3, range = 8–330). Each week consisted of an average of 4.5 recorded bouts per week (range = 1–26). Campus visit length per round-trip commute varied both within and across participants (mean visit length = 6.31 h, range = 2.4–11.3, standard deviation (SD) across participants = 1.69, mean SD within participants = 2.93). Similarly, there was variation across participants in terms of how many weekdays they undertook a commute to campus (mean visit frequency = 3.1 days per week per participant, range = 1–4.6, SD across participants = 0.74, mean SD within participants = 1.19).
3.1. Model Comparison
We compared model support using leave one out (LOO) information criteria, a well-established method for Bayesian model comparison [41]. To estimate the relative confidence in each model, we calculated the model weights using pseudo-Bayesian model averaging (pseudo-BMA).
In both model sets (see Table 2), the highest-supported models were the full commute models. Pseudo-BMA model averaging resulted in 100% support in the full commuting model. Model support was considerably higher for the full model incorporating variables along the commute compared to models that included variables related only to participants’ proposed residences. Given the high statistical support for the full commute model, the remainder of the results discussion pertains to the full commute model.
3.2. Visit Length
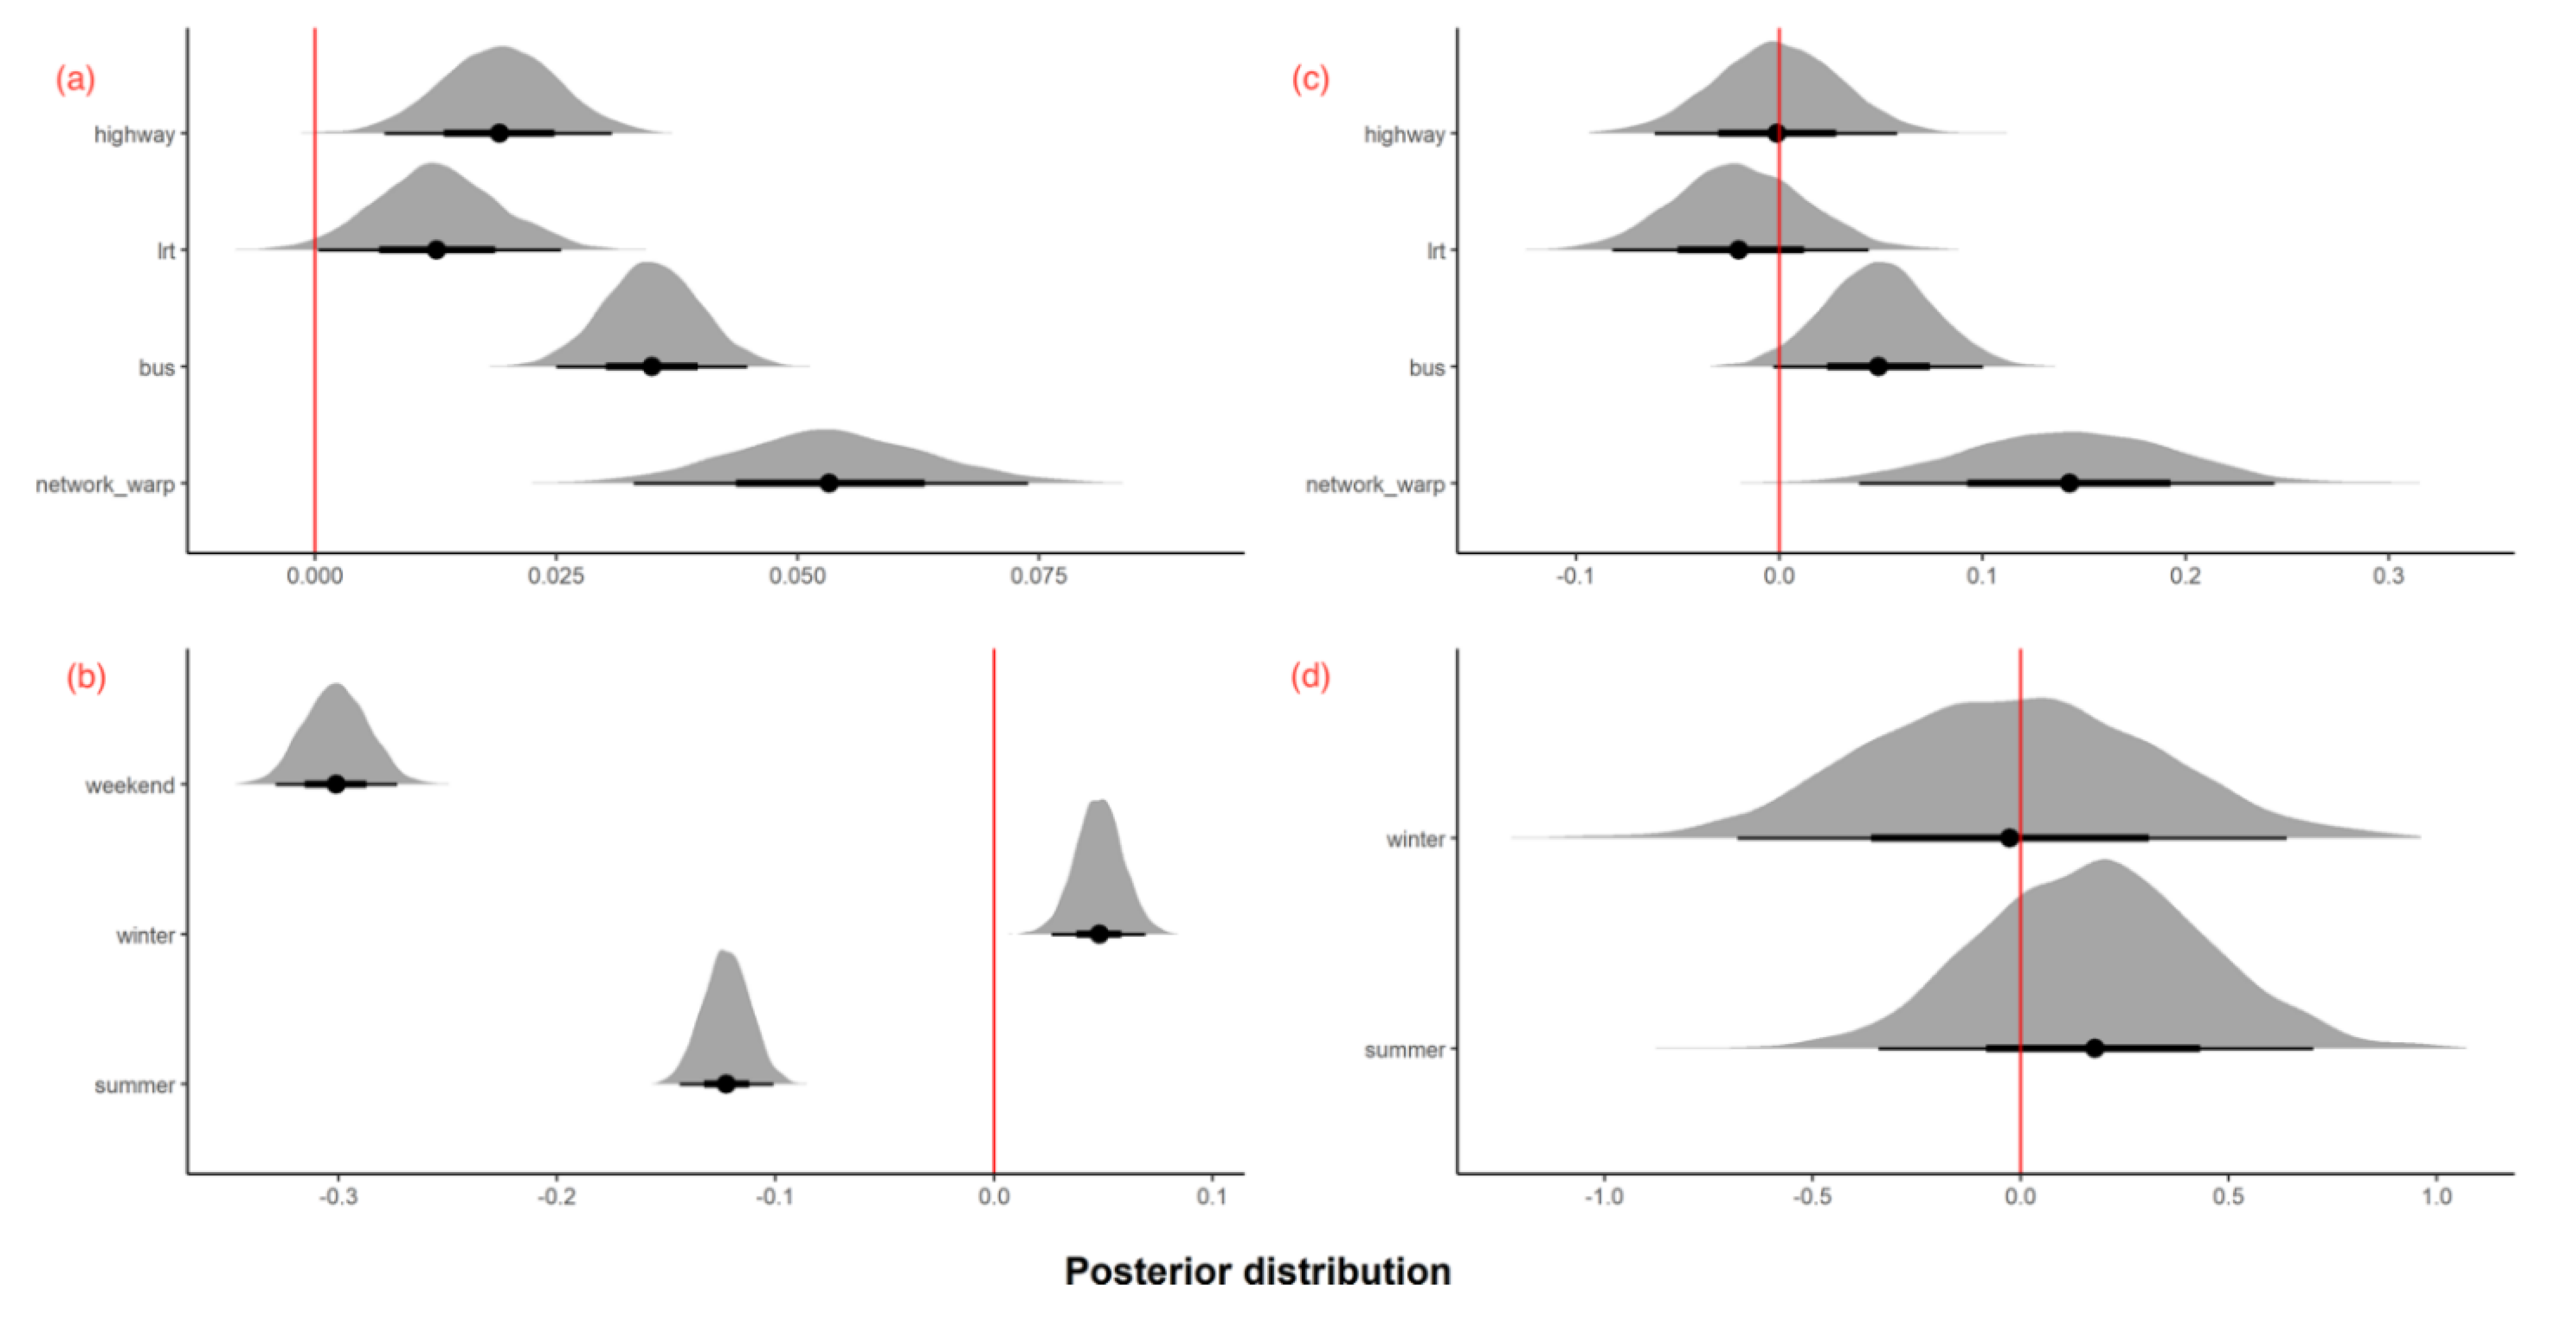
The distribution of posterior probability estimates for beta coefficients are shown in Figure 2a. Commutes that contained high proportions of bus routes were associated with increased visit lengths (βbus = 0.03; Figure 2a). Positive associations (i.e., beta coefficient values greater than zero) were also estimated for the proportion of LRT line (βLRT = 0.01, Figure 2a) and highways (βhighways = 0.02, Figure 2a), however, with a smaller effect size. Commutes from homes with higher surrounding street connectivity (network warp) were also associated with longer stays on campus (βnetwork warp = 0.05; Figure 2a). Visit length was highest during the winter (βwinter|fall = 0.05, Figure 2b) and lowest during the summer (βsummer|fall = −0.12, Figure 2b) semester and participants had considerably shorter campus visits during the weekend relative to the weekday (βweekend|weekday = −0.30; Figure 2b). Visit length varied depending on where the participant’s residence was located, and those participants located in the southwest quadrant spent the least amount of time on campus.
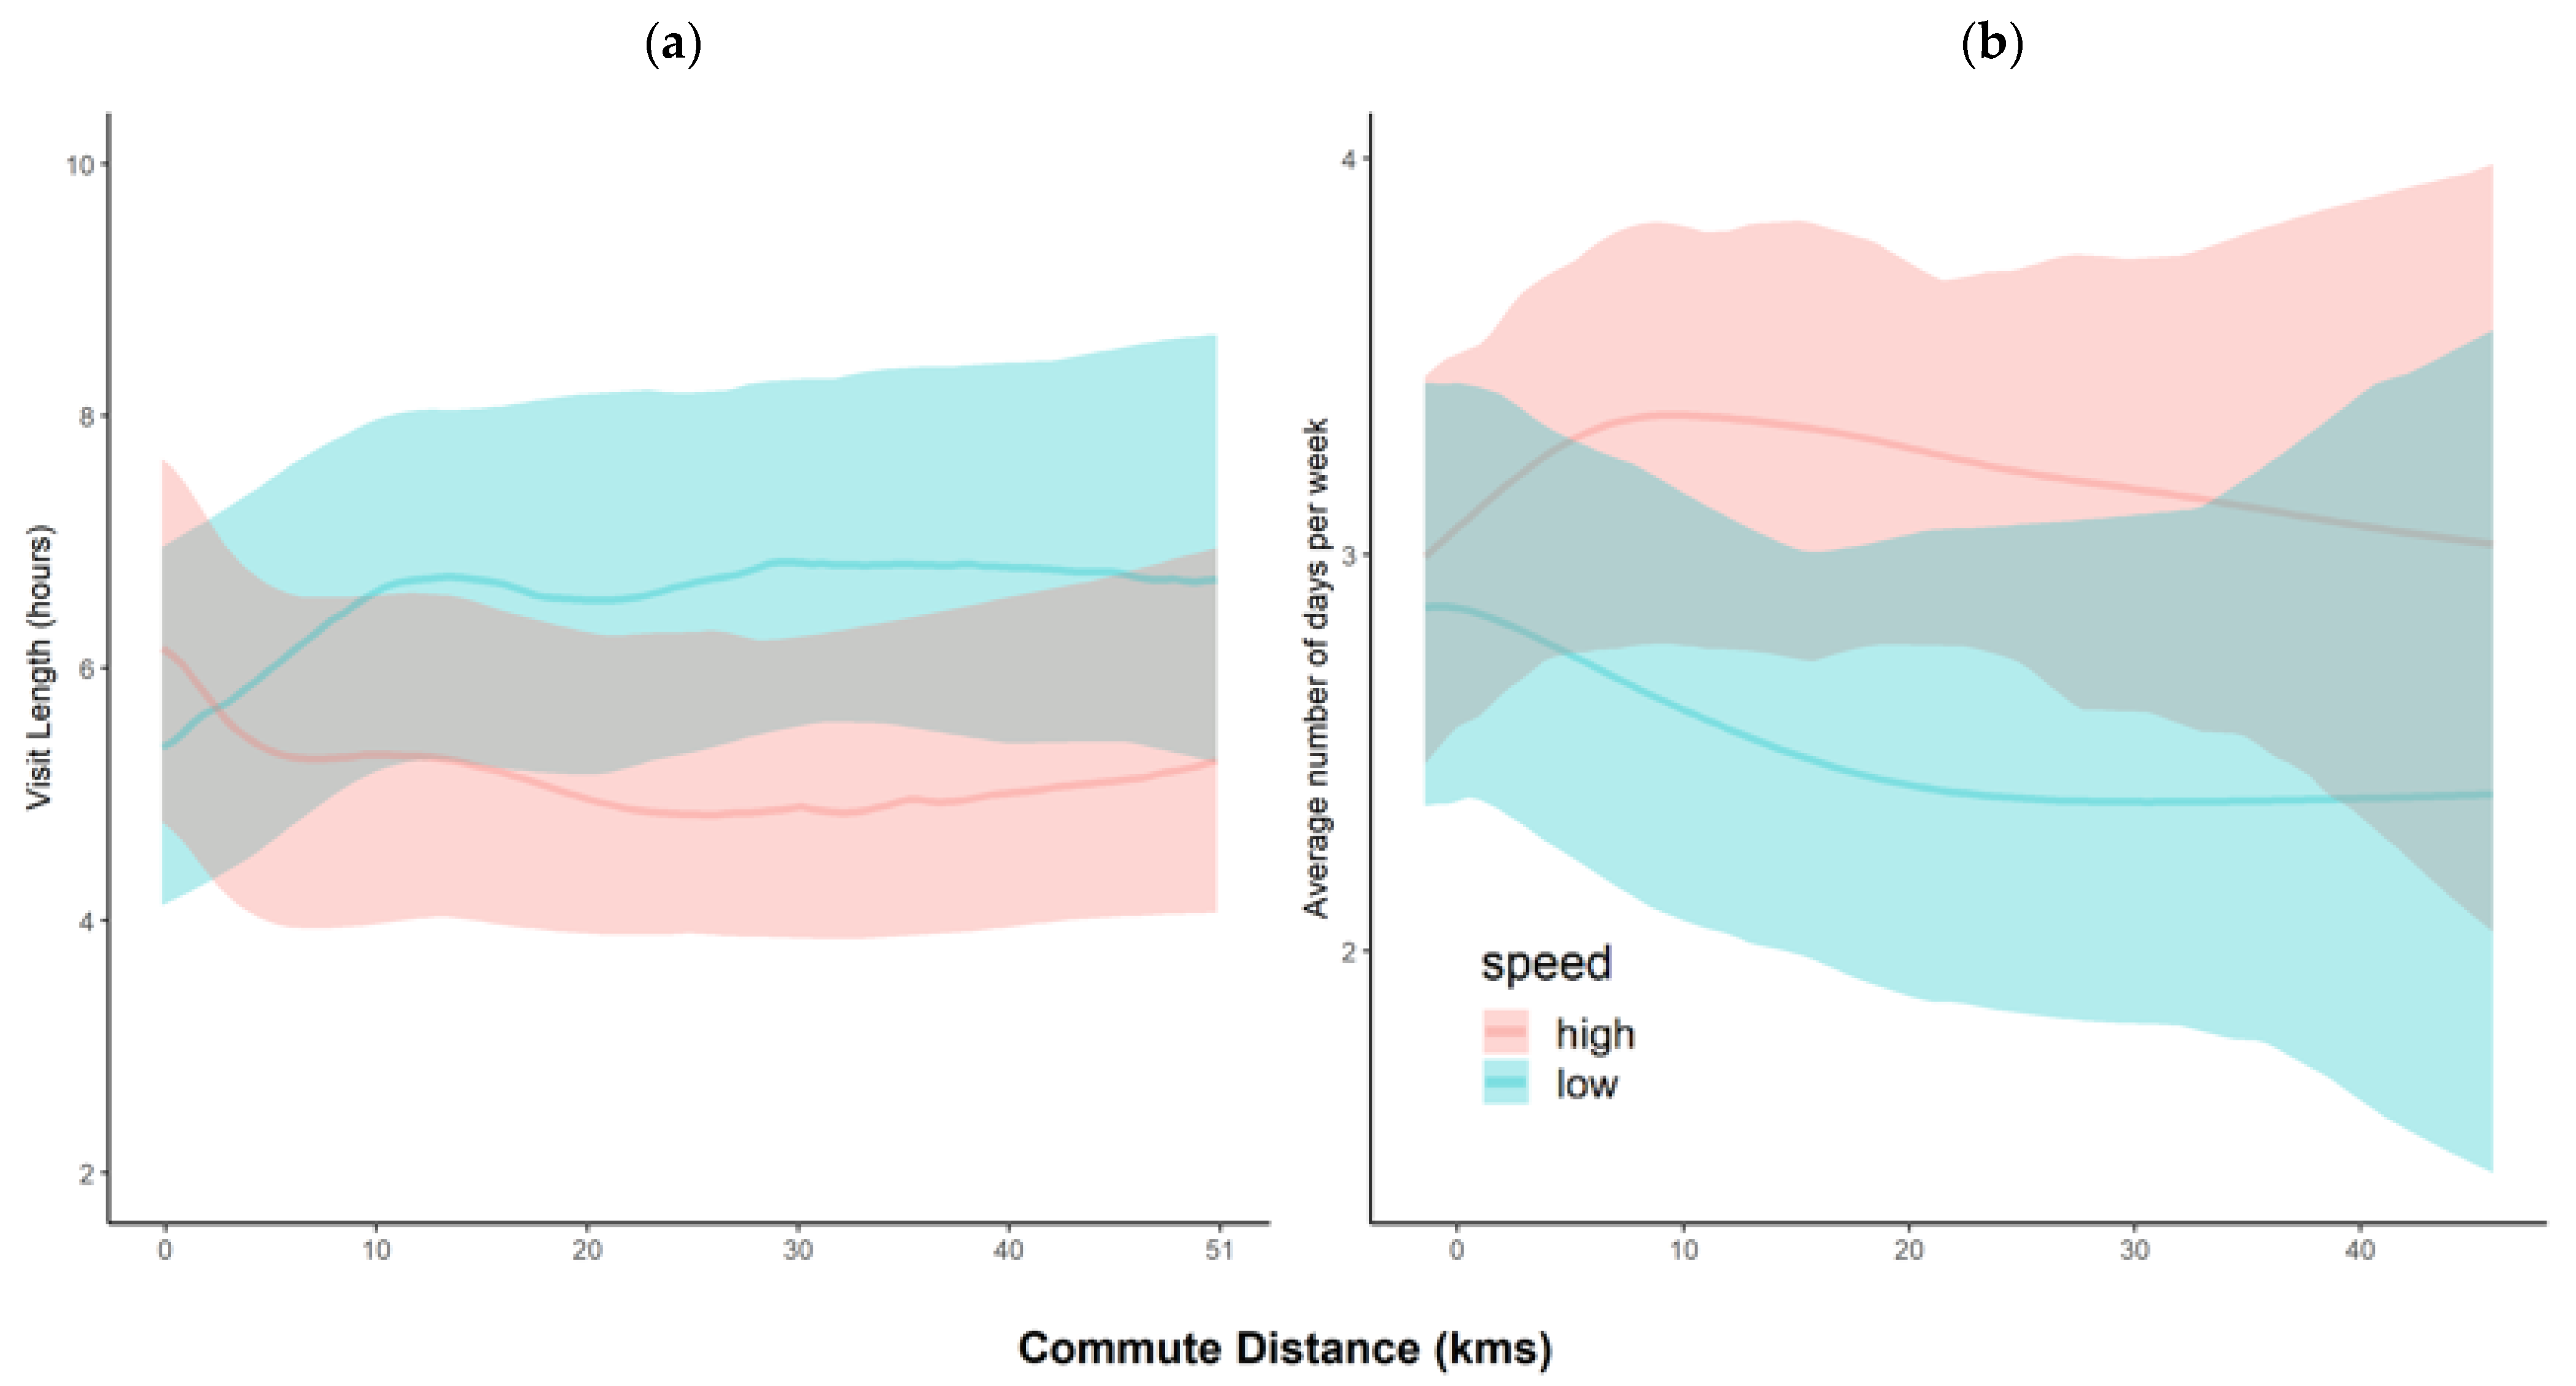
The relationship between commute length and visit length varied based on the average speed of the commute (see Figure 3a). Visit length increased as commute length increased when the average speed along the commute was high (95th quantile = 34 km/h), however, the inverse was true when the average speed of the commute was low (5th quantile = 3 km/h).
3.3. Visit Frequency
Distributions of posterior probability estimates for beta coefficients can be seen in Figure 2b,d. Similar patterns were identified as estimated for visit length, however, a greater proportion of the probability mass was near zero, suggesting there is less evidence for these effects (i.e., the probability of a non-zero coefficient is lower) (Figure 2b,d). Visit frequency was positively associated with proportion of commute along bus routes (βbus = 0.05; Figure 2b), as well as with network warp (βnetwork warp = 0.14; Figure 2a).
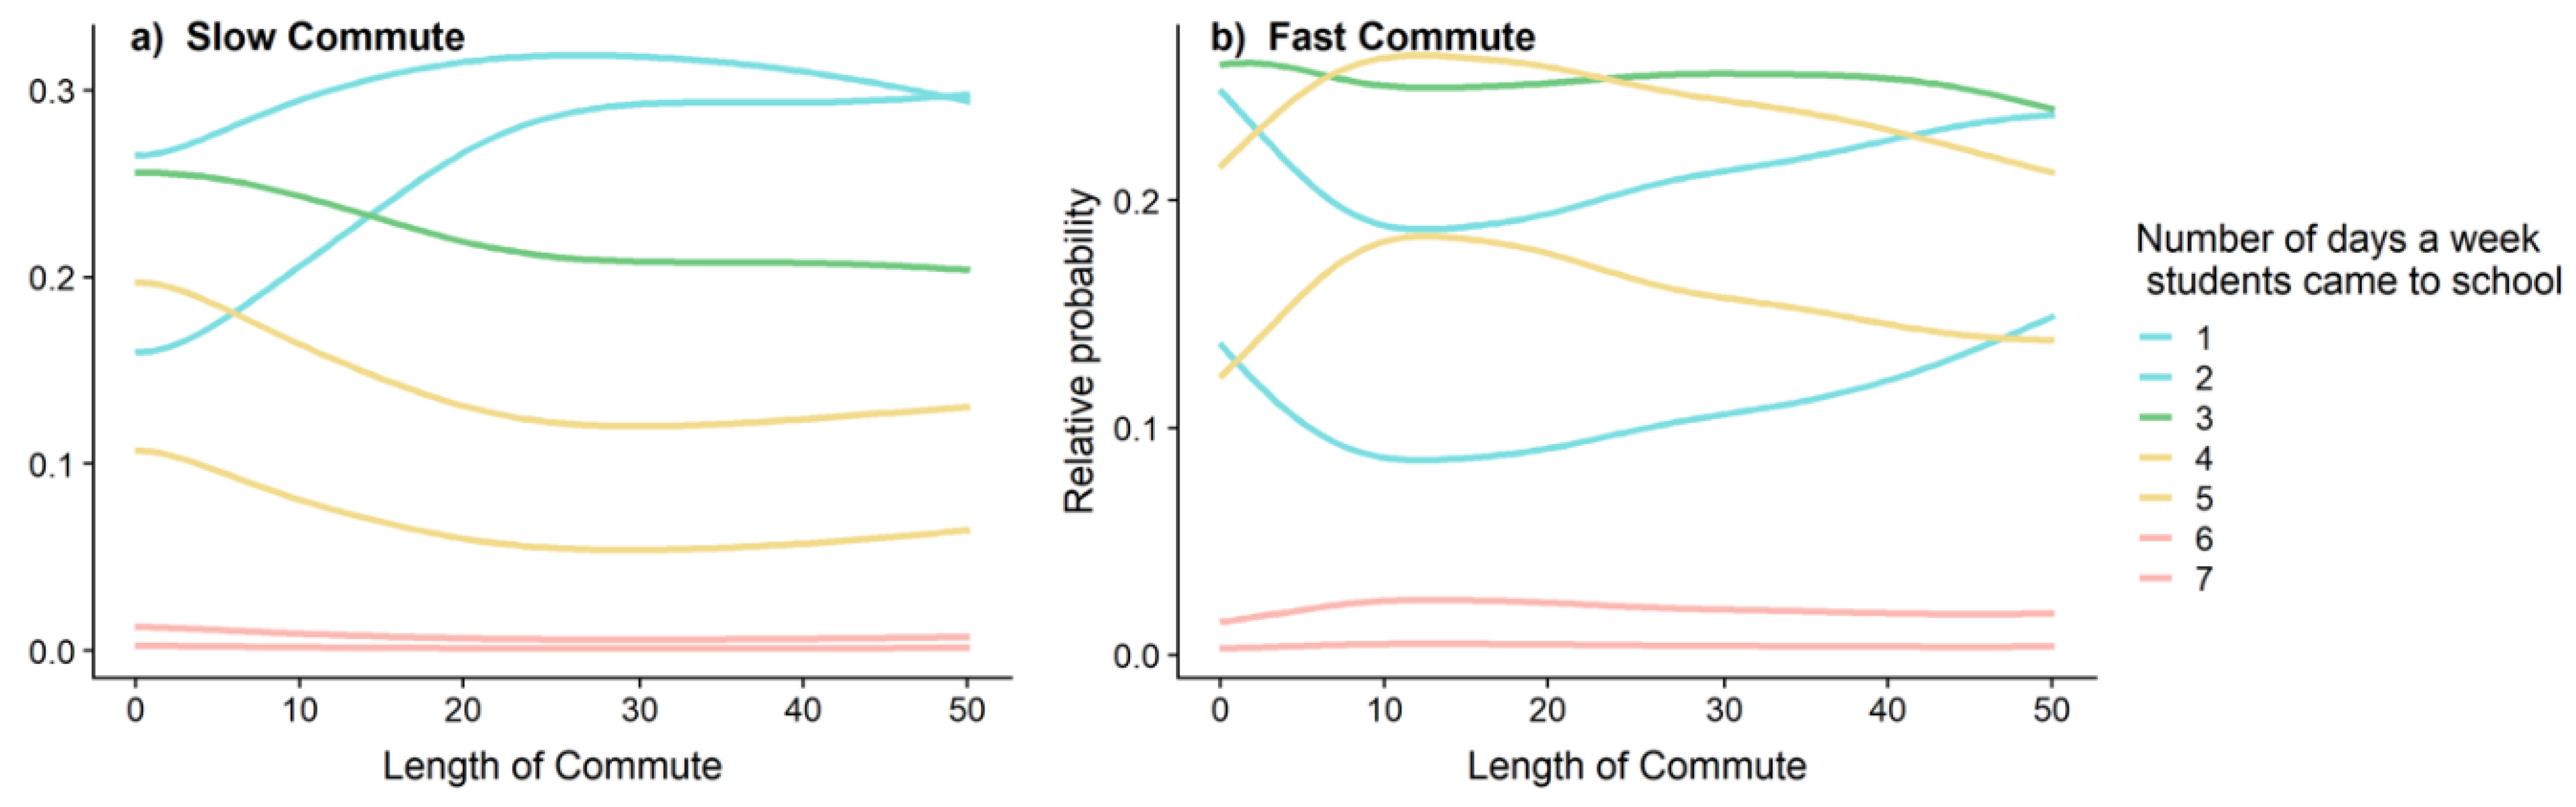
The relationship between visit frequency and commute length was influenced by the average speed of commute for that week. In summary, students tended to visit campus more frequently when the commute speed was fast and independent of the commute distance (see Figure 3b). More specifically, weeks where the commute speed was low, students were more likely to visit for 1–2 days of the week relative to 4–5 days of the week as the distance of the commute increased (see Figure 4a). However, a fast commute resulted in participants being more likely to visit campus 4–5 days of the week at intermediate commute lengths, however, this probability dropped off for short and long commutes (see Figure 4b).
4. Discussion
Our results demonstrate that both the length of campus visits and the frequency of visits to campus by students are influenced by characteristics of their campus commute, including distance and average speed of the commute. Students spent more hours of the day on campus when they lived further from campus, however, this was only true if they had a relatively high-speed commute. Students with slow commutes tended to come to the campus fewer days of the week, and even less frequently if they lived farther from campus. These results expand upon previous studies that have attempted to identify differences in student engagement brought on by commuting patterns [12,45,46], by incorporating measures of the commute itself and showing that such variables influence students’ time spent on campus. Additionally, incorporating metrics estimated using spatially and temporally resolved GPS location data helps to further increase our understanding of the above relationship when compared to models that only incorporate residence-specific variables, which can be easily obtained through survey methods. This result highlights the value and role that smartphone GPS data can play in improving our understanding of the relationship between commuting and student engagement.
Students increase their time on campus per visit if their commute overlaps with public transit routes, specifically bus routes. In terms of speed and duration, public transport is likely seen as a more invested commute than using a personal vehicle [47]. Public transport is also a more active commute, typically requiring walking to and from transit stops. Students, therefore, choose to maximise their time on campus if the commute is time demanding. The lack of a similarly strong relationship with visit frequency potentially reflects reduced flexibility when it comes to visits to campus when compared to the duration they choose to spend on campus. We observed this in how students alter the visit length and frequency as a function of temporal variables. Students showed different visit durations based on semester, however, the number of days of the week that they came to campus was consistent across semesters. This is unsurprising as students are required to be on campus for a set number of days, irrespective of the semester. Therefore, visit frequency is more constrained by a student’s timetable than the duration of their visit and is less responsive to external features such as semester, or more fine-scale commute characteristics.
Current research has shown that commuting students vary their levels of engagement based on whether or not they are living with their parents [48,49]. Low network warp, i.e., low street connectivity, is strongly associated with suburban areas of the city [24]. Our finding that both visit length and frequency are positively associated with network warp is interesting, particularly given that suburban areas are more likely associated with family-living. This result could be indicative that students living with parents may be less engaged in their university experience as a whole. In our study case, this was represented by reduced time spent on campus. This relationship is indirect however, and further details specific to individual’s living arrangements would clarify if this relationship is causal rather than driven by an alternative, unknown variable. High network warp is also associated with more pedestrian behaviour in Calgary [24], and increased engagement may result from the improved ease of walking near home, for example, when home is near campus, or from home to a nearby transit stop.
To date, there has been limited research looking at variation in students’ commutes and how this influences their level of engagement. The distance of students’ commutes to campus varied from as little as 300 m to as much as 30 km, with the average speed ranging from 1 km/h to 50 km/h, most likely representing the use of different forms of transportation. To treat students with such variable commuting experiences as equal is unrealistic and likely masks considerable differences in their behaviour associated with campus engagement. As we show here, further and slower commutes result in longer stays on campus but fewer visits per week. Such a tradeoff between visit frequency, and duration of stay when students do make the commute, should be of significant interest to universities. This result could be especially pertinent if students are picking courses to fit a timetable that allows for longer, but fewer days, rather than due to a genuine academic interest in the course itself [50,51]. Additionally, such behaviour could limit extracurricular involvement, which may occur at times that would require an additional commute. This conclusion demonstrates how the characteristics of the commute itself may have a positive or negative impact on students’ campus engagement by altering when and for how long they are willing and able to spend time on campus [11,52,53].
The use of students’ smartphone GPS location data to characterise commuting behaviour as well as estimate proxies for student engagement is novel and builds on previous research by incorporating fine-scale spatio-temporal information on how students choose to travel to university campus. Our results showed that by incorporating such information, we were able to improve model support when compared to models that only included information relative to students’ homes. The latter data is such that could be easily obtained through survey-based approaches. Spatio-temporally resolved data on the commute itself would normally require more extensive travel log-based approaches [54]. Smartphone GPS location data is an excellent alternative that allows for the collection of relatively unbiased, high-resolution data in large sample sizes [22,24]. These data, although offering these advantages, come with their own limitations. For example, to obtain data on time spent on campus and commute behaviour requires students to carry their phones on their person and for the phone to be switched on. Additionally, individual phones vary in their frequency and accuracy of GPS location collection, and this is important to consider when exploring movement-based analyses where the frequency of relocation influences the precision by which we can identify the route taken by an individual. Additionally, although this approach reduces several caveats associated with bias from survey-based methods, smartphone GPS data collection is volunteered by individuals, and therefore, might still be influenced by participation bias [22,24]. Incorporating a group-level effect for the participant controls for potential individual-level variation in phone-use and other factors such as battery life of the phone, and potential differences in location frequency and accuracy. Despite this, we recommend collecting survey information alongside GPS location data to better partition and resolve such attributes that could explain unknown variance. Controlling for variation in relocation frequency requires either thorough data checks and removal (as we did in this study), more nuanced statistical approaches or greater control over the smartphones GPS settings prior to data collection, most often through the use of a GPS app that obtains GPS locations at a fixed temporal interval.
5. Conclusions
In conclusion, by using a novel dataset in the form of smartphone GPS location data, this study identified how aspects of students’ commutes to campus impact the time they spend on campus, which we interpreted as a measure of student engagement. By looking beyond defining individuals as either resident or commuter students, we have shown that factors that characterise a commute i.e., distance and average speed, influence the length of students’ visits to campus as well as the weekly number of trips to campus that they are willing to make. Further, the addition of fine-scale, temporally-defined information obtained through smartphone GPS data improved our understanding of the relationship between commuting and student engagement, beyond what is possible using less spatio-temporally resolved metrics available from survey-based approaches. Such information is valuable when assessing to what extent students may benefit from increased affordable housing closer to campus, or perhaps all that is required is improved and direct public transport services that minimise the time taken up by commuting. Equally, these findings suggest initiatives to create street layouts in existing or new neighbourhoods that improve walkability, which may also lead to improved engagement for students by facilitating the commute. Combining GPS data that allows researchers to directly quantify commuting behaviour with survey data aimed at better encapsulating students’ campus experience can help university management and planners prioritise and make decisions aimed at maximising the university experience for students. More broadly, such approaches can aid in identifying how commuting impacts the general commuter beyond engagement by exploring additional variables more directly related to, for example, measures of success, or physical and mental wellbeing.
Author Contributions
Conceptualization Andrew Ladle; formal analysis, Andrew Ladle funding acquisition, Patricia K. Doyle-Baker and Paul Galpern; investigation, Patricia K. Doyle-Baker and Paul Galpern. methodology, Patricia K. Doyle-Baker, Andrew Ladle and Angela Rout; project administration, Patricia K. Doyle-Baker and Paul Galpern. Software Andrew Ladle supervision, Patricia K. Doyle-Baker and Paul Galpern; Visualization, Andrew Ladle and Paul Galpern; writing—original draft, Patricia K. Doyle-Baker, Paul Galpern. Andrew Ladle and Angela Rout; writing—review and editing, Patricia K. Doyle-Baker, Paul Galpern, Andrew Ladle and Angela Rout. All authors have read and agreed to the published version of the manuscript.
Funding
Funding support for this study was by The University of Calgary—Vice-President (Research) to implement a transformative research initiative that addressed one or more of the Human Dynamics in a Changing World Grand Challenges. The funding sources were not involved in the design, investigation, analysis or writing of this manuscript.
Institutional Review Board Statement
This study was conducted according to the guidelines of the TriCouncil Policy Statement: Ethical Conduct for Research Involving Humans (TCPS), and approved by the Conjoint Human Research Ethics Board, UNIVERSITY OF CALGARY (REB 15-1471; 9 June 2015).
Informed Consent Statement
All participants completed an informed consent.
Data Availability Statement
The data are not publicly available due to ethical approvals at the time.
Conflicts of Interest
The authors declare no conflict of interest.
References
- Schofer, E.; Meyer, J.W. The Worldwide Expansion of Higher Education in the Twentieth Century. Am. Sociol. Rev. 2005, 70, 898–920. [Google Scholar] [CrossRef]
- Newbold, J.J.; Mehta, S.S.; Forbus, P. Commuter students: Involvement and identification with an institution of higher education. Acad. Educ. Leadersh. J. 2011, 15, 141. [Google Scholar]
- Association of Universities and Colleges of Canada. Trends in Higher Education: Volume 1—Enrollment; AUCC: Ottawa, Canada, 2011; pp. 1–70. Available online: https://www.gov.uk/government/organisations/department-for-business-energy-and-industrial-strategy (accessed on 26 July 2021).
- Universities Canada. Available online: https://www.univcan.ca/universities/facts-and-stats/ (accessed on 2 June 2021).
- Hasnine, S.; Lin, T.; Weiss, A.; Habib, K.M.N. The Role of Urban Travel Context in Defining Mode Choices for School Trips of Post-secondary Students in Toronto. Available online: https://uttri.utoronto.ca/files/2017/05/The-Role-of-Urban-Travel-Context-in-Defining-Mode-Choices-for-School-Trips-of-Post-secondary-Students-in-Toronto.pdf (accessed on 26 July 2021).
- Office of Institutional Research and Planning. Available online: https://www.ucalgary.ca/provost/sites/default/files/teams/1/academicplan2012.pdf (accessed on 2 June 2021).
- Humphreys, D.K.; Goodman, A.; Ogilvie, D. Associations between active commuting and physical and mental wellbeing. Prev. Med. 2013, 57, 135–139. [Google Scholar] [CrossRef] [Green Version]
- de Sá, T.H.; Parra, D.C.; Monteiro, C.A. Impact of travel mode shift and trip distance on active and non-active transportation in the São Paulo Metropolitan Area in Brazil. Prev. Med. Rep. 2015, 2, 183–188. [Google Scholar] [CrossRef] [Green Version]
- Kuh, G.D.; Gonyea, R.M.; Palmer, M. The disengaged commuter student: Fact or fiction. Commut. Perspect. 2001, 27, 2–5. [Google Scholar]
- Kelly, G.E. Lecture attendance rates at university and related factors. J. Furth. High. Educ. 2012, 36, 17–40. [Google Scholar] [CrossRef]
- Astin, A.W. Student involvement: A developmental theory for higher education. J. Coll. St. Personnel. 1984, 25, 297–308. [Google Scholar]
- Jacoby, B.; Garland, J. Strategies for enhancing commuter student success. J. Coll. Stud. Ret. 2005, 6, 61–79. [Google Scholar] [CrossRef]
- Turley, R.N.L.; Wodtke, G. College residence and academic performance: Who benefits from living on campus? Urban Educ. 2010, 45, 506–532. [Google Scholar] [CrossRef]
- Ogren, C. Rethinking the “nontraditional” student from a historical perspective: State normal schools in the late nineteenth and early twentieth centuries. J. Higher Educ. 2003, 74, 640–664. [Google Scholar] [CrossRef]
- Southall, J.; Watson, H.; Avery, B. Non-traditional, commuter students and their transition to higher education—A synthesis of recent literature to enhance understanding of their needs. Stud. Engagem. Exp. J. 2016, 5, 1–15. [Google Scholar]
- Dugan, J.P.; Garland, J.L.; Jacoby, B.; Gasiorski, A. Understanding commuter student self-efficacy for leadership: A within-group analysis. NASPA J. 2008, 45, 282–310. [Google Scholar] [CrossRef]
- Jacoby, B. The Student as Commuter: Developing a Comprehensive Institutional Response; ASHE-ERIC Report No. 7; School of Education and Human Development: Washington, DC, USA, 1989; pp. 1–7. Available online: https://files.eric.ed.gov/fulltext/ED319297.pdf (accessed on 6 June 2021).
- Molina-Garcia, J.; Castillo, I.; Sallis, J.F. Psychosocial and environmental correlates of active commuting for university students. Prev. Med. 2010, 51, 136–138. [Google Scholar] [CrossRef]
- Feitelson, E.; Rotem-Mindali, O. Chapter 19: Spatial implications of public transport investments in metropolitan areas: Some empirical evidence regarding light rail and bus rapid transit. In Handbook on Transport and Development; Banister, D., Bonilla, D., Givoni, M., Hickman, R., Eds.; Edward Elgar Publishing, Incorporated: Cheltenham, UK, 2015; pp. 290–300. [Google Scholar] [CrossRef] [Green Version]
- Canadian University Survey Consortium. 2011 Undergraduate University Student Survey Master Report. Available online: https://www.cusc-ccreu.ca/publications/CUSC_2011_UG_MasterReport.pdf (accessed on 1 June 2021).
- Keller, T.; Farran, S.; University Students Grade Their Schools. Which Universities Get Top Marks? 90,000 Have Their Say. Maclean’s 2009. Available online: https://www.macleans.ca/education/unirankings/university-students-grade-their-schools/ (accessed on 1 June 2021).
- Ladle, A.; Galpern, P.; Doyle-Baker, P.K. Measuring the use of green space with urban resource selection functions: An application using smartphone GPS locations. Landsc. Urban Plan. 2018, 179, 107–115. [Google Scholar] [CrossRef]
- Zenk, S.N.; Schulz, A.J.; Matthews, S.A.; Odoms-Young, A.; Wilbur, J.E.; Wegrzyn, L.; Gibbs, K.; Braunschweig, C.L.; Stokes, C. Activity space environment and dietary and physical activity behaviors: A pilot study. Health Place 2011, 17, 1150–1161. [Google Scholar] [CrossRef] [Green Version]
- Galpern, P.; Ladle, A.; Alaniz Uribe, F.; Sandalack, B.; Doyle-Baker, P.K. Assessing urban connectivity using volunteered mobile phone GPS locations. Appl. Geogr. 2018, 93, 37–46. [Google Scholar] [CrossRef]
- Vich, G.; Marquet, O.; Miralles-Guasch, C. Suburban commuting and activity spaces: Using smartphone tracking data to understand the spatial extent of travel behaviour. Geogr. J. 2017, 183, 426–439. [Google Scholar] [CrossRef]
- Das, R.; Vishal Kumar, S.; Prakash, B.; Dharmik; Subbarao, S.S.V. Analysis of university students travel behaviour: En route to sustainable campus. Indian J. Sci. Technol. 2016, 9. [Google Scholar] [CrossRef] [Green Version]
- Stanley, K.; Bell, S.; Kreuger, L.K.; Bhowmik, P.; Shojaati, N.; Elliot, A.; Osgood, N.D. Opportunistic natural experiments using digital telemetry: A transit disruption case study. Int. J. Geogr. Inf. Sci. 2016, 30, 1853–1872. [Google Scholar] [CrossRef]
- Zhang, L.; Rong, P.; Xia, H.; Qin, Y.; Cui, P.; Zhang, Y. Smartphone-based spatiotemporal behaviour analysis on college students in Chinese newly developed campus: A case study for Henan University. In Proceedings of the International Conference on Geoinformatics, Buffalo, NY, USA, 2–4 August 2017; pp. 1–5. [Google Scholar]
- Wu, J.; Yang, M. Modeling commuters’ travel behavior by Bayesian networks. Procedia Soc. Behav. Sci. 2013, 96, 512–521. [Google Scholar] [CrossRef] [Green Version]
- Johansson, K.; Laflamme, L.; Hasselberg, M. Active commuting to and from school among Swedish children–A national and regional study. Eur. J. Public Health 2012, 2, 209–214. [Google Scholar] [CrossRef] [Green Version]
- Garvill, J.; Marell, A.; Nordlund, A. Effects of increased awareness on choice of travel mode. Transportation 2003, 30, 63–79. [Google Scholar] [CrossRef]
- Khattak, A.; Wang, X.; Son, S.; Agnello, P. Travel by university students in Virginia: Is this travel different from travel by the general population? Transp. Res. Board Natl. Acad. 2011, 137–145. [Google Scholar] [CrossRef]
- Zhou, J. Sustainable commute in a car-dominant city: Factors affecting alternative mode choices among university students. Transp. Res. Part A Policy Pract. 2012, 46, 1013–1029. [Google Scholar] [CrossRef]
- Jacques, C.; Chakour, V.; Mathez, A.; Manaugh, K.; Barreau, G.; Hatzopolou, M.; Eluru, N.; El-Geneidy, A. An Examination of Commuting Patterns to McGill University: Results of the 2011 McGill Transportation Survey. Available online: https://www.mcgill.ca/sustainability/files/sustainability/mcgill_report_final_acknow_fixed.pdf (accessed on 1 June 2021).
- Government of Canada. 2016 Census. Available online: https://www12.statcan.gc.ca/census-recensement/2016/dp-pd/index-eng.cfm (accessed on 2 June 2021).
- University of Calgary, Facts and Figures. Available online: https://www.ucalgary.ca/about/our-story/facts-and-figures (accessed on 2 June 2021).
- University of Calgary, Transportation. Available online: https://www.ucalgary.ca/sustainability/our-sustainable-campus/transportation (accessed on 2 June 2021).
- The Sustainability Tracking, Assessment & Rating System. Available online: https://stars.aashe.org/institutions/university-of-calgary-ab/report/2016-12-21/OP/transportation/OP-16/ (accessed on 2 June 2021).
- Google Takeout. Available online: https://takeout.google.com/settings/takeout (accessed on 2 June 2021).
- Gelman, A.; Carlin, J.B.; Stern, H.S.; Rubin, D.B. Bayesian Data Analysis, 2nd ed.; Chapman & Hall/CRC: Boca Raton, FL, USA, 2003. [Google Scholar]
- Vehtari, A.; Gelman, A.; Gabry, J. Practical Bayesian model evaluation using leave-one-out cross-validation and WAIC. Stat. Comp. 2017, 27, 1413–1432. [Google Scholar] [CrossRef] [Green Version]
- Yao, Y.; Vehtari, A.; Simpson, D.; Gelman, A. Using stacking to average Bayesian predictive distributions. Bayesian Anal. 2018, 13, 917–1007. [Google Scholar] [CrossRef]
- Bürkner, P.C. brms: An R package for Bayesian multilevel models using Stan. J. Stat. Softw. 2017, 80, 1–28. [Google Scholar] [CrossRef] [Green Version]
- R: A Language and Environment for Statistical Computing. Vienna, Austria. Available online: https://www.R-project.org/ (accessed on 2 June 2021).
- Hafezi, M.H.; Sultana Daisy, N.; Liu, L.; Millward, H. Daily activity and travel sequences of students, faculty and staff at a large Canadian university. Transpor. Plan. Techn. 2018, 41, 536–556. [Google Scholar] [CrossRef]
- Thomas, L.; Jones, R. Student Engagement in the Context of Commuter Students. Available online: https://tsep.org.uk/wp-content/uploads/2017/04/CommuterEngagement_A4-lowres.pdf (accessed on 1 June 2021).
- van Exel, N.J.A.; Rietveld, P. Perceptions of public transport travel time and their effect on choice-sets among car drivers. J. Transp. Land. Use 2010, 2, 75–86. [Google Scholar] [CrossRef]
- Holdsworth, C. ‘Don’t you think you’re missing out, living at home?’ Student experiences and residential transitions. Sociol. Rev. 2006, 54, 495–519. [Google Scholar] [CrossRef]
- Holton, M. Traditional or non-traditional students? Incorporating UK students’ living arrangements into decisions about going to university. J. Furth. High. Educ. 2018, 42, 556–569. [Google Scholar]
- Seeley, E.; Goddard, T.; Mellado Miller, R. Ge-whiz! How students choose their general education classes. J. Appl. Res. High. Educ. 2018, 10, 322–332. [Google Scholar] [CrossRef]
- Stevens, M.; Harrison, M.; Thompson, M.E.; Lifschitz, A.; Chaturapruek, S. Choices, identities, paths: Understanding college students’ academic decisions. SSRN Electron. J. 2018. [Google Scholar] [CrossRef] [Green Version]
- Hawkins, A. Involvement Matters: The Impact of Involvement in Student Clubs and Organization on Student Retention and Persistence at Urban Community Colleges. Ph.D. Thesis, Texas Tech University, Lubbock, TX, USA, 2015. [Google Scholar]
- Thibodeaux, J.; Deutsch, A.; Kitsantas, A.; Winsler, A. First-year college students’ time use: Relations with self-regulation and GPA. J. Adv. Acad. 2017, 28, 5–27. [Google Scholar] [CrossRef]
- Liao, Y.; Gil, J.; Pereira, R.H.M.; Yeh, S.; Verendel, V. Disparities in travel times between car and transit: Spatiotemporal patterns in cities. Sci. Rep. 2020, 10, 4056. [Google Scholar] [CrossRef] [PubMed]
Figure 1.
Map of study area. University of Calgary campus location can be seen in green. Transport infrastructure, visible on the map includes bus routes (yellow), LRT line (bold red) and highways (red). Different quadrants are defined by varying shadings (grey).
Figure 1.
Map of study area. University of Calgary campus location can be seen in green. Transport infrastructure, visible on the map includes bus routes (yellow), LRT line (bold red) and highways (red). Different quadrants are defined by varying shadings (grey).

Figure 2.
Estimated posterior probability distributions for parameters representing spatial variables for: (a) visit length and (b) visit frequency, and temporal variables for (c) visit length and (d) visit frequency. All distributions presented here were estimated using the full commute models.
Figure 2.
Estimated posterior probability distributions for parameters representing spatial variables for: (a) visit length and (b) visit frequency, and temporal variables for (c) visit length and (d) visit frequency. All distributions presented here were estimated using the full commute models.

Figure 3.
Posterior distribution of predicted (a) visit length and (b) visit frequency as a function of commute distance (kms) for average high (red) and low (blue) speed commutes. Shading represents 95% credible intervals.
Figure 3.
Posterior distribution of predicted (a) visit length and (b) visit frequency as a function of commute distance (kms) for average high (red) and low (blue) speed commutes. Shading represents 95% credible intervals.

Figure 4.
Posterior probability estimates for number of days of the week commuting to campus as a function of commute distance for a (a) slow commute and (b) fast commute, for different number of weekdays the student visited campus. Estimate represents the probability of visiting campus a specific number of times per week, as denoted by line colour.


Table 1.
Covariates predicted to influence commuting students’ time spent on campus.
| Type | Variable Name | Source |
|---|---|---|
| Temporal | Commute time | Time between point leaving home and arriving on campus (hours) |
| Year | - | |
| Weekday | Weekend versus weekday | |
| Spatial (local) | Bus and LRT | Length of bus and LRT routes within 500 m buffer of home |
| Speed | Distance from campus/commute time | |
| Network warp | Mean network warp within 500 m buffer of home | |
| Euclidean length | Euclidean distance between home and nearest edge of campus (metres) | |
| Quadrant | Quadrant of city home is located | |
| Spatial (commute) | Average speed | Cumulative step length/commute time |
| Commute length | Sum of distance between consecutive relocations (steps) within bout | |
| Proportion on highway | Proportion of points along commute within 100 m of a highway | |
| Proportion on LRT | Proportion of points along commute within 100 m of LRT | |
| Proportion on bus route | Proportion of points along commute within 100 m of a bus route | |
| Random effects | Participant ID | - |
| Bout type | Home to campus/campus to home | |
| Trip ID | - |
Table 2.
Description of candidate models included in our two model sets: (1) visit length and (2) visit frequency. The notation “1|” represents a random effect, “*” represents an interaction effect and “s” indicates that the variable was incorporated as a spline term, rather than a linear effect.
Table 2.
Description of candidate models included in our two model sets: (1) visit length and (2) visit frequency. The notation “1|” represents a random effect, “*” represents an interaction effect and “s” indicates that the variable was incorporated as a spline term, rather than a linear effect.
| Response Variable | Model Set | Model Name | Model Structure |
|---|---|---|---|
| Visit length | Local | Spline | visit_length ~ s (euclidean_length) + network_warp + length_bus + length_ctrain + length_highways+ quadrant + weekday + year + semester + (1|trip*bout_type) + (1|userid) |
| Distance | visit_length ~ euclidean_length + network_warp + length_bus + length_ctrain + length_highways+ quadrant + weekday + year + semester + (1|trip*bout_type) + (1|userid) | ||
| Base | visit_length ~ euclidean_length + weekday + semester + year + (1|trip*bout_type) + (1|userid) | ||
| Commute | Spline | visit_length ~ s (commute_length * speed) + network_warp + prop_bus + prop_ctrain + prop_highways + weekday + year + semester + quadrant + (1|trip*bout_type) + (1|userid) | |
| Speed | commute_length * speed + network_warp + prop_bus + prop_ctrain + prop_highways + weekday + year + semester + quadrant + (1|trip*bout_type) + (1|userid) | ||
| Distance | visit_length ~ commute_length + network_warp + prop_bus + prop_ctrain + prop_highways + weekday + year + semester + quadrant + (1|trip*bout_type) + (1|userid) | ||
| Base distance | visit_length ~ commute_length + weekday + semester + year + (1|trip*bout_type) + (1|userid) | ||
| Visit frequency | Local | Spline | Visit_freq ~ s (euclidean_length) + network_warp + length_bus + length_ctrain + length_highways + weekday + year + semester + quadrant |
| Distance | Visit_freq ~ euclidean_length + network_warp + length_bus + length_ctrain + length_highways + weekday + year + semester + quadrant | ||
| Base | |||
| Commute | Spline | visit_freq ~ s (commute_length * speed) + network_warp + prop_bus + prop_ctrain + prop_highways + year + semester + quadrant + (1|trip/bout_type) + (1|userid) | |
| Speed | visit_freq ~ commute_length * speed + network_warp + prop_bus + prop_ctrain + prop_highways + year + semester + quadrant + (1|trip/bout_type) + (1|userid) | ||
| Distance | visit_freq ~ commute_length + network_warp + prop_bus + prop_ctrain + prop_highways + year + semester + quadrant + (1|trip*bout_type) + (1|userid) | ||
| Base distance | visit_freq ~ commute_length + semester + year + (1|trip*bout_type) + (1|userid) |
Publisher’s Note: MDPI stays neutral with regard to jurisdictional claims in published maps and institutional affiliations. |
© 2021 by the authors. Licensee MDPI, Basel, Switzerland. This article is an open access article distributed under the terms and conditions of the Creative Commons Attribution (CC BY) license (https://creativecommons.org/licenses/by/4.0/).
Share and Cite
MDPI and ACS Style
Doyle-Baker, P.K.; Ladle, A.; Rout, A.; Galpern, P. Smartphone GPS Locations of Students’ Movements to and from Campus. ISPRS Int. J. Geo-Inf. 2021, 10, 517. https://0-doi-org.brum.beds.ac.uk/10.3390/ijgi10080517
AMA Style
Doyle-Baker PK, Ladle A, Rout A, Galpern P. Smartphone GPS Locations of Students’ Movements to and from Campus. ISPRS International Journal of Geo-Information. 2021; 10(8):517. https://0-doi-org.brum.beds.ac.uk/10.3390/ijgi10080517
Chicago/Turabian StyleDoyle-Baker, Patricia K., Andrew Ladle, Angela Rout, and Paul Galpern. 2021. "Smartphone GPS Locations of Students’ Movements to and from Campus" ISPRS International Journal of Geo-Information 10, no. 8: 517. https://0-doi-org.brum.beds.ac.uk/10.3390/ijgi10080517
Note that from the first issue of 2016, this journal uses article numbers instead of page numbers. See further details here.