
Spatial Analysis of Gunshot Reports on Twitter in Mexico City


1
Center for Research and Teaching of Economics, Division of Legal Studies, Mexico City 01210, Mexico
2
National Geointeligence Laboratory, Center for Research in Geospatial Information Sciences, Mexico City 14240, Mexico
*
Author to whom correspondence should be addressed.
ISPRS Int. J. Geo-Inf. 2021, 10(8), 540; https://0-doi-org.brum.beds.ac.uk/10.3390/ijgi10080540
Submission received: 19 June 2021
/
Revised: 3 August 2021
/
Accepted: 5 August 2021
/
Published: 12 August 2021
(This article belongs to the Special Issue Geographic Crime Analysis)
Abstract
:The quarantine and stay-at-home measures implemented by most governments significantly impacted the volume and distribution of crime, and already, a body of literature exists that focuses on the effects of lockdown on crime. However, the effects of lockdown on firearm violence have yet to be studied. Within this context, this study analyzes reports of gunshots in Mexico City registered on Twitter from October 2018 to 2019 (pre-COVID-19) and from October 2019 to 2020 (during COVID-19), using a combination of spatial (nearest neighbor ratio, Ripley’s K function and kernel estimation) and non-spatial (Fisher’s exact test) methods. The results indicate a spatial concentration of gunshot reports in Mexico City and a reduction in frequency of reports during the pandemic. While they show no change in the overall concentration of gunshots during lockdown, they do indicate an expansion in the patterns of spatial intensity (moving from the west to the center of the city). One possible explanation is the capacity of possible victims of firearm crimes in certain municipalities to comply with lockdown measures and thus avoid exposure to such crimes.
1. Introduction
On 31 December 2019, the World Health Organization (WHO) first reported an outbreak of a new coronavirus (COVID-19) illness in Wuhan, China. A few days later (in January 2020), the first death as a result of the new virus was registered in Wuhan, and just 48 h later, a case was reported in Thailand. By the end of January, cases had been identified in the USA, followed by Europe and Latin America in February. The WHO declared a global health emergency, and countries began adopting measures to contain the spread of the virus and mitigate its danger by eliminating or restricting social proximity. In general, by March, with the exception of essential services (e.g., trash collecting, medical services, electricity, water and public security), across the world, companies, industries and private and public institutions were closed, and a large proportion of the population was quarantined or subject to serious restrictions on mobility [1] (p.1). Nevertheless, much variation exists between countries and even within different regions of a single country. The measures also varied across time, with countries sometimes relaxing or intensifying, for example, their social distancing protocols.
In Mexico, the Health Ministry declared a national health emergency (“Jornada Nacional de Sana Distancia”: https://www.gob.mx/cms/uploads/attachment/file/541687/Jornada_Nacional_de_Sana_Distancia.pdf, accessed on 23 March 2020), when the country was transitioning from phase one of the pandemic (imported cases) to phase two (community spread of the virus). This involved limiting large concentrations of people, suspending the public sector (except essential services such as the police and health services), closure of all educational institutions, closures of cultural sites such as museums, cultural centers and archaeological areas and limitations on recreational sites, such as cinemas, theaters, restaurants and bars. The initiative aimed to “encourage” the population to avoid physical contact and included a call to voluntarily “stay at home”. These measures were later intensified with the suspension of all non-essential activity across all economic sectors, with the threat of fines, closures and criminal charges in the event of non-compliance (although this rarely occurred). By the end of March, Mexico City was practically paralyzed, with the closure of shopping malls, offices and businesses. In May, the “Plan to Return to Normality” ("Plan de Vuelta a la Normalidad": https://covid19.cdmx.gob.mx/nuevanormalidad, accessed on 26 March 2020) was enacted, which set out steps for the gradual resumption of social and economic activities using a “traffic light” system that would progressively restart non-essential economic activities while taking into consideration new rates of infection, hospital occupancy and the percentage of positive cases.
These measures had a significant impact on crime behavior, particularly on the volume and distribution of crime [2]. For any public policy regarding security during the pandemic, it is important to understand the impact of these social distancing measures on crime. Such an understanding may also provide crucial information on crime in general. In fact, there is a growing body of literature that studies the effects of COVID-19-related lockdowns on crime and violence [3,4,5,6]. Results vary according to the type of crime and location under study (and in some cases, on the empirical information available, such as that in Latin America [7,8,9]).
One pending issue is the particular effect of the quarantine and lockdown on gun violence. In the USA, the sudden increase in arms purchases indicated a possible rise in gun violence [10] and resulted in specific research that studied this issue, either as part of a set of crimes [11,12] or on its own [13,14,15]. In the rest of the American continent, the analysis of gun violence has generally been included in studies of homicides and battery (during the pandemic [16]), but it is mostly not analyzed as a specific phenomenon (e.g., shootings), possibly due to the lack of official information.
The majority of the emerging studies on COVID-19 and crime are framed within the routine activities approach [17,18,19]. This framework easily explains the relationship between daily activities and crime behavior and can be explained simply: if the streets are empty, there are no adequate targets for street robbery, and the same applies to public transport, businesses, cars in the street and other environments.
Within this context, we propose a specific analysis of changes in the distribution of shootings (which do not necessarily end in homicides or battery but serve as a proxy for violence). This paper focuses on shootings in Mexico City from 6 October 2019 to 6 October 2020 by analyzing tweets that reported gunshots. Calls to 911 were not used, as people tend to not call the police when they hear gunshots. One possible explanation for this may be that the population, out of distrust or fear, do not generally seek to involve themselves directly by calling the police (see barriers to calling 911 such as fear of becoming involved because of law enforcement or financial or immigration status [20]); rather, they comment on shootings on Twitter with other social network users and thereby keep their personal details confidential. In Mexico City, Twitter may thus be an alternative source of information regarding this issue to incidents of calls to the police or 911. Of course, it should be remembered that while the abundance of data regarding gunshots on Twitter compared to official data may be an indicator of quality, it may also point to a certain bias (of who is tweeting). Despite any weakness in the information coming from Twitter, it nevertheless complements, to some degree, official information, especially considering that the “dark figure of crime” impacts 92.3% of all crime in Mexico City [21].
1.1. Crime during the Pandemic
There is growing research on the effects of the pandemic on crime. Authors such as Mohler et al. (2020) [22] showed that crimes committed on the street, such as robbery of passersby, businesses or homes, have decreased, given that the streets are empty, businesses are closed and homes are permanently occupied. This reduction is reflected, for example, in Oakland and San Francisco, where Shayegh and Malpede found an overall decrease of 40% in all categories of crime (2020) [23].
The most studied crimes are also the most common, such as battery, burglary, robbery of passersby, theft [12], homicide [16], vandalism [22] and car and autoparts robbery [24]. In general, these studies use official sources of information, which include police calls [22] (p.2) or incident reports ([12] (p.13), [23] (p.3), [24]).
Overall, these studies come to similar conclusions and show a decrease in crime due to social distancing public policies introduced as a result of COVID-19 (although Eisner and Nivette (2020) [16] showed an increase in homicides in Latin America following a brief initial decline). The only real exception to this is domestic violence, which has increased substantially since the start of lockdown [25,26,27,28]. There is also emerging research focused on the appearance of new types of crimes, such as violations of isolation measures [29,30,31].
Gun violence has also been studied, particularly in the USA, either as part of a set of crimes [11,12] or individually [13,14,15]. Most of these studies begin by registering “a surge in gun sales, driven by public panic and unfounded fears” [32] (p.53). In this regard, Hoops et al. studied the broad availability of weapons and legislation in states such as Missouri and Nevada that guarantee the sale of weapons during states of emergency (2020) [15]. According to a survey conducted by Kravits-Wirtz et al. (2020) [33], in California alone, 110,000 people bought weapons in response to the pandemic, of which 47,000 were first-time owners. Paradoxically, this partially explains why “stay-at-home” (SAH) policies did not result in a decrease in firearm violence, but rather the contrary (for example, in Philadelphia [32]). Baltimore (2%), Chicago (23%) and New York (11.7%) also experienced relative increases in gun-related violence in comparison with 2019 [34]. These authors attempted to explain these increases in terms of increased rates of unemployment, arms sales and alcohol consumption in these cities. Donnelly et al. (2021) [35] corroborated the increased rate of firearm incidents in Ohio (although there were no changes in California), with an even greater increase in firearm incidents, deaths and injuries following the reopening in 2020 in comparison with the SAH 2020 period and previous years (2018 and 2019). Evidence exists that access to firearms increases the lethality and damage caused by violence, both interpersonally as well as individually [36].
Possibly the most comprehensive study on gun violence during the pandemic is that of Dae and Phillips, who studied changes in gun violence in response to the pandemic and the types of gun violence that experienced the greatest changes in Buffalo (NY), with data from before and after “stay-at-home” policies. Using the ARIMA and Poisson models, they concluded the following: “There were gradual and permanent increases in the number of both non-fatal and gang related shootings during the pandemic” [14] (p.8). These results contrast with other studies, such as that of Abrams (2020) [11], who did not find significant increases in shootings in 25 large US cities, and Campedelli et al. (2020) [12], who also found no significant changes in the rates of homicide and assault with deadly weapons in Los Angeles (although not all shootings end in homicides).
As far as we know, there are still no empirical studies in Latin America that look at shootings in the region during the COVID-19 pandemic. Despite this, there is a growing body of criminological research that studies the effects of the pandemic and the various restrictions imposed in the region on, for example, changes in crime pattens in Mexico City during the pandemic, such as crimes associated with public transport [8], burglary, vehicle theft [9], violence against women [37] and homicides [7]. There are also studies on problems related to prisons and the difficulties faced by various Latin American governments to resolve these [38,39]. It is possible that the issue of shootings has not yet been systematically dealt with due to the lack of empirical data or the challenge of accessing such data in the region.
1.2. Data
The data were obtained from reports of shootings posted on Twitter between 6 October 2018 and 6 October 2020, using the Autómata Geointeligente de Internet platform of analysis [40] developed by the Center for Investigation in the Sciences of Geospatial Information. The platform does not offer open access, given the budgetary restriction for public research centers in Mexico [41], and it was thus necessary to request authorization to use its computing capacity. The platform administrator allowed access on 6 October 2020, and thus the acquisition of tweets corresponded to the two-year period prior to the authorization.
The platform gathers information from Twitter and provides information on the tweet ID, user, content, date and time of publication and, in some cases, geographic coordinates.
Of the total universe of 9,819,255,653 tweets analyzed, 3588 contained the word “gunshots” and had enough information (x, y coordinates) to be georeferenced within the administrative borders of Mexico City. Due to the available computing capacity, the search was carried out in blocks of 4–5 months (Table 1).
The 3588 tweets that contained the word “gunshots” in the message text were manually read and classified to filter out those that were not related to reports of gunshots by firearms. The first step was to filter messages with references to abstract situations of violence. This meant discarding tweets dealing with violence in the news connected to drug trafficking, messages regarding the general climate of fear in the country over security issues and critiques of the Mexican government’s public security strategies. The second step consisted of analyzing the informal language style of the tweets to eliminate reports that did not involve situations of violence. Tweets that contained colloquial uses of the word “gunshots” (balazos) in Mexico were thus discarded (e.g., “balazo en el pie” (shoot oneself in the foot) or “abrazos, no balazos” (hugs not gunshots)). The remaining 242 tweets reported the sound of a gunshot near the location of the Twitter user. Some messages requested a police presence to investigate the event. However, as these messages did not include information regarding the event that provoked the message, it was difficult to identify the related events or changes in the words used in the messages. Tweets were also excluded if they referred to situations where gunshots may have been implicit to a situation (e.g., domestic violence episodes, bar fights and robberies). Rather, tweets were only included if they contained an explicit mention of the sound of gunshots by the user. Thus, each of the 242 messages reported an individual event of the firing of a firearm.
The database was divided into two periods in order to analyze the impact of COVID-19 on spatial concentration and distribution. The first period encompassed from October 2018 to 2019 (pre-COVID-19) with 141 tweets, with the second period corresponding to the period from October 2019 to 2020 (during COVID-19) with 101 tweets. The information was gathered in October 2020, the end of the first wave of infections in Mexico. Although the first COVID-19 case in Mexico dates back to February 2020, the data available until October 2020 facilitated the study of changes in spatial patterns during the period of the first lockdown in Mexico City. While the period under analysis may be limited in terms of studying the effects of COVID-19, it is difficult to establish clear limits for the study of the impact of the pandemic on crime in cities, as the pandemic is still not over. Our study of the seasonal variation that may have existed by month and day of the week for reports of gunshots on Twitter was thus framed by the date from which we were able to collect information, corresponding to the first lockdown and the historical record of the two previous years.
1.3. The Area of Study of Mexico City (Municipalities)
Mexico City, the capital of the country, is one of the largest metropolitan areas in the world, with more than 21 million inhabitants [42]. The city is divided administratively into 16 municipalities with varying populations and surface areas (Table 2). Each municipality has a local administrative government, which is directly elected every 3 years. The public administration of Mexico City as a whole falls to the mayor, who is elected every 6 years, coinciding with the presidential elections. Each of these three levels of government (municipal, city and federal) undertake crime prevention and prosecution. The municipalities do not have councils but work through neighborhood committees elected in each territorial unit.
The city Congress is responsible for determining the territorial division based on the population, geographic configuration, infrastructure, urban equipment, number and extension of neighborhoods and municipal town or housing units, expenditure budget and income forecasts for the entity, among other factors.
The city is located in the central part of Mexico (Figure 1). Most of the municipalities border the State of Mexico. The metropolitan area in the north comprises Gustavo Madero (005) and Azcapotzalco (002). The central part of the city from east to west is made up of Miguel Hidalgo (016), Cuauhtemoc (015), Venustiano Carranza (017), Benito Juarez (014), Iztacalco (006) and Iztapalapa (007), and it is the ancient urban center inhabited from preHispanic and colonial times. Finally, the remaining municipalities located in the south of the city are, on average, localities with the lowest levels of urban development and low per capita income levels in comparison with the other areas of the city (Table 2 and Figure 1).
1.4. Limitations of the Data
In some cases, the georeferenced location of the tweet may have georeferenced the antenna of the cellphone company from which the tweet was sent, thus modifying the distance and affecting the calculation of the nearest neighbor ratio statistic. Nevertheless, given the scope of the antennas, the variation in distance should not have modified the global patterns detected, given the high number of antennas in densely populated areas of Mexico City, precisely to provide better connectivity and avoid the saturation of networks.
The second limitation relates to the fact that people may use synonyms for “gunshots” in their Spanish language tweets, such as “disparos” (shots) or colloquial terms. The search for “disparos” (shots) involved a high proportion of “noise”, and this impeded obtaining reliable results. We opted for the use of the word “balazo” (gunshot), as it is the most used term when referring to the use of firearms. In any case, the use of tweets with “disparos” and an adequate filter should not have modified the global patterns detected.
2. Materials and Methods
A combination of methods was used to analyze the spatial grouping of the tweets, estimate their degree of clustering and measure the intensity of the spatial criminological process they reported [44,45,46].
We began by calculating the nearest neighbor ratio (NNR) through the Euclidean distance of each point to the closet neighboring point in order to obtain an average distance for all points. This average distance was divided by a random scenario [44] to generate a vector of distances of each point to the closest neighbor (R). This facilitated the study of changes in the degree of clustering in both periods. The NNR estimation allowed for the testing of the statistical significance of the spatial clustering with a normal distribution z significance test (ArcGIS).
To avoid the modifiable area unit problem—the scale effect and zonal effect [47,48,49]—continuous space in Mexico City was used to conduct a first and second order analysis of intensity for different distances. This was based on the understanding that the addition of spatial data in different area sizes or in areas with different administrative boundaries would alter the results as compared with continuous surface analysis.
Kernel estimation was used to study the intensity and location of tweets in Mexico City, Silverman’s criterion was used for the bandwidth, and Ripley’s K function was employed to analyze spatial clustering at different distances (software R).
Finally, as a complement to the spatial analysis, the differences in reports between both periods (pre-COVID-19 and during COVID-19) were analyzed. The concentration of tweets by the month, week and hour of the day and their variation between periods was analyzed using Fisher’s exact test [50], while the frequency of tweets and their locations in the municipalities of Mexico City were analyzed through the use of a geographic information system (QGIS). The statistical significance of the change in frequency of tweets in the periods considered was also studied with Fisher’s exact test [50]. The results section ends with this non-spatial analysis that contextualizes the results of the spatial clustering and intensity within the criminological environment of the city.
3. Results
3.1. Clusters of Tweets about Gunshots in Mexico City
The nearest neighbor ratio calculations estimated a spatial clustering of reports of gunshots in Mexico City with a confidence level greater than 99%, and thus reports of gunshots were spatially clustered in both periods under observation (Table 3).
The results obtained in the statistical calculation (NNR) indicate that a distance greater than a kilometer between each reported gunshot was considered to be random. Nevertheless, an average distance of 265.82 m and 278.21 m was registered for the period prior to the COVID-19 pandemic and during lockdown, respectively (Table 3).
Despite the fall in frequency of reports—from 141 to 101 tweets—the distance between points increased slightly. This increase in spatial dispersion during the second period is reflected in the distribution of the distances between the est neighbors. The first quartile increased from 6471.3 to 9002.7 m, the second quartile increased from 10,635.4 to 13,068 m, and the third quartile registered a change from 13,384.4 to 17,322.1 m.
3.2. Spatial Clustering at All Distances
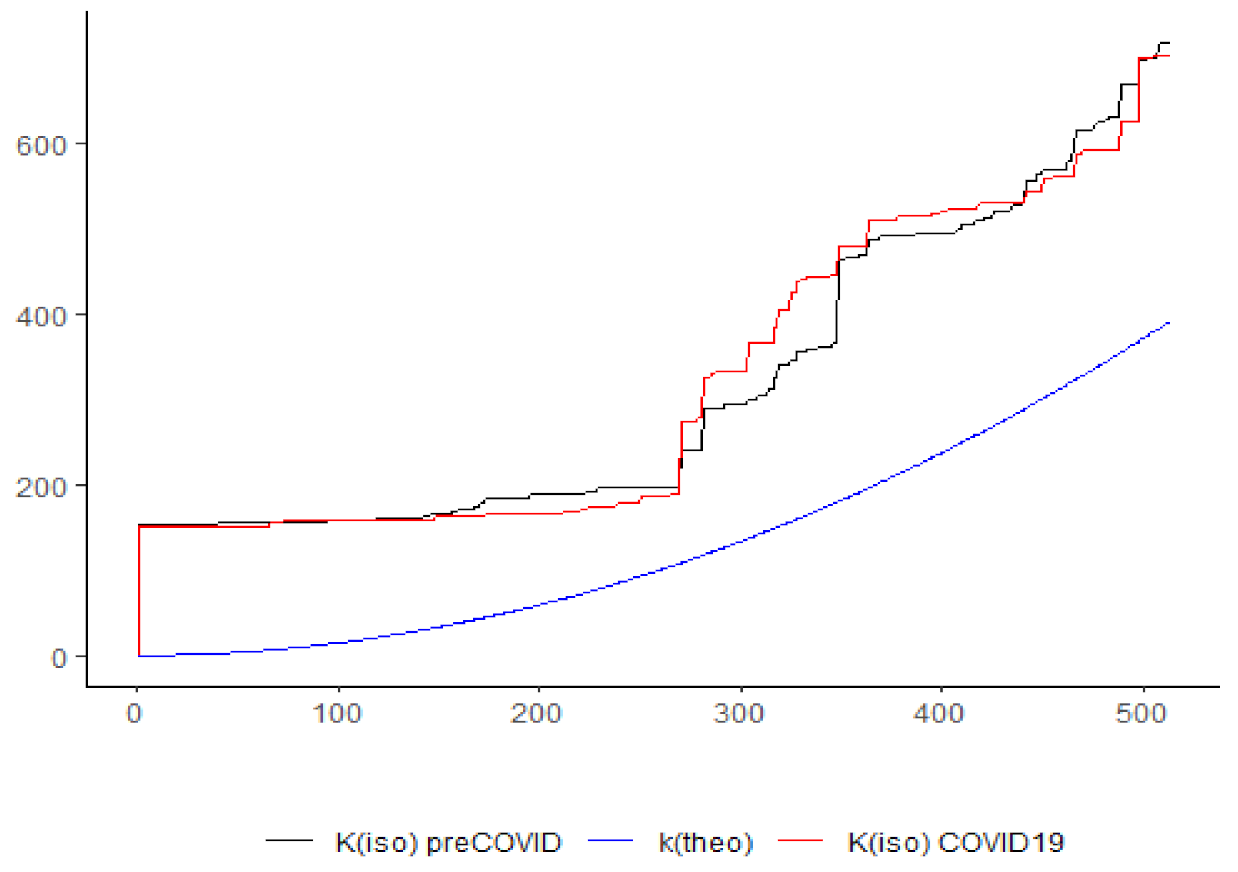
The results of the Ripley’s K function estimation also detected the spatial concentrations for both periods. In Figure 2, Ripley’s isotropic functions are presented, estimated for gunshot reports before the pandemic (black line) and during lockdown (red line). The theoretical model of complete spatial randomness was the same for both periods, , shown in blue.
In both cases, Ripley’s isotropic K function (black and red lines) was above the random uniform distribution , suggesting spatial clustering of gunshot reports at any scale within Mexico City, consistent with the nearest neighbor ratio test. The period of lockdown did not appear to affect the spatial patterns of tweets in the city due to the similarity of the estimated functions. Figure 2 shows the isotropic correction of Ripley’s K function due to the number of tweets and with the assumption of no stationary process. We included in the appendices the estimations of the function with different corrections of the and edge effects for both periods [45] (pp. 147, 216).
3.3. Location of Spatial Intensity in Mexico City
Two maps of intensity were developed with kernel estimation: one for the period before lockdown and one for during the COVID-19 pandemic (Figure 3). In both images, the areas shaded in yellow show the peaks in intensity of gunshot reports in Mexico City.
The period before COVID-19 contained a greater intensity of tweets reporting gunshots in the city than the period during the health emergency. On the left of Figure 3, the highest intensity peak across the city had an estimated probability of 0.35. In contrast, during the pandemic, the intensity decreased to a probability of 0.22 in the highest peak. The smoothing out detected in the second period dispersed the intensity of reports across a greater area toward the east, corresponding to the central area of the city, although to a lesser degree (right side of Figure 3). Thus, the location of the greatest intensity of gunshot reports on the left side of Figure 3 corresponds to the western limit of the city. The pandemic modified the pattern detected by the kernel estimation from the west toward the center of the city on the left side of Figure 3.
In both periods, reports of gunshots were concentrated in the central area of the city, leaving the northern and southern parts of the city out of the first order intensity detected in both cases. Although the absolute frequency of reports on Twitter was lower in the second period (from 141 to 101 tweets), the spatial dispersion and distance between points during lockdown was greater. The kernel estimation analysis undertaken revealed the displacement of the spatial pattern of intensity of gunshots in Mexico City during the COVID-19 pandemic.
To analyze the underlying criminological processes that could explain the change in the intensity pattern of tweets about gunshots, we present below the locations of the points in the administrative areas that correspond to the 16 municipalities of Mexico City (Figure 4). This geographic management of data does not consider spatial analysis with polygons but rather serves to contextualize the detected pattern of intensity.
3.4. Prevalence by City Municipalities
The peaks in intensity detected by the kernel estimation corresponded to the neighboring municipalities of Miguel Hidalgo (016) for the period prior to the pandemic and Cuauhtemoc (015) during the COVID-19 pandemic (Figure 4). The highest numbers of tweets were concentrated in these two municipalities, with 29 and 18 tweets, respectively. In both periods, the municipality of Iztapalapa (007) remained constant, with an average of 22 tweets for both periods. The size of the buffers in Figure 4 corresponds to the number of reports in the municipalities (Table 4), with the three municipalities mentioned identified by their official codes.
Regarding the rest of the city, in the first pre-COVID-19 period (blue), reports were concentrated in the municipalities of Miguel Hidalgo (29), Iztapalapa (23), Benito Juárez (18) and Magdalena Contreras (17). During lockdown (red), tweets were concentrated in the municipalities of Iztapalapa (21), Cuauhtemoc (18) and Benito Juárez (11) (Table 4). In both periods, the same municipalities did not report gunshots (Gustavo A. Madero and Milpa Alta).
Table 4 shows the decrease in the frequency of gunshot reports in the city by municipality from 141 tweets to 101. The municipalities of Miguel Hidalgo and La Magdalena Contreras registered the greatest decline in reports, from 29 tweets to 8 and from 17 to 7, respectively. In contrast, the municipality of Cuauhtemoc registered more gunshot reports in the second period (18) than before the lockdown. Another atypical value was registered in the municipality of Iztapalapa, with a slight decrease from 23 to 21 tweets, thus not experiencing the pronounced increase or decrease that occurred in other areas of the city. These changes in the frequency of reports by municipality between the two periods were statistically significant (Fisher’s exact test, a non-parametric test with a p-value of 0.05097; see Appendix A).
3.5. Tweets per Mmonth, Day of the Week and Hour of the Day
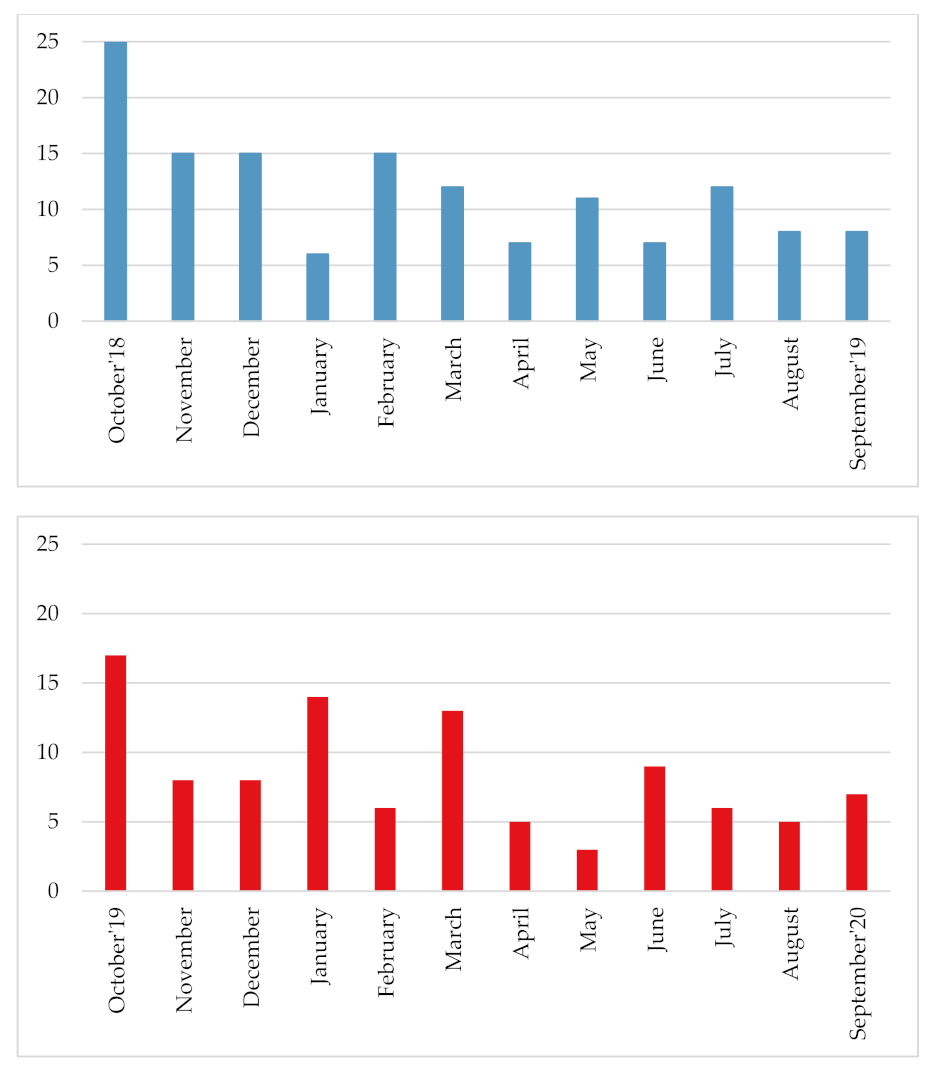
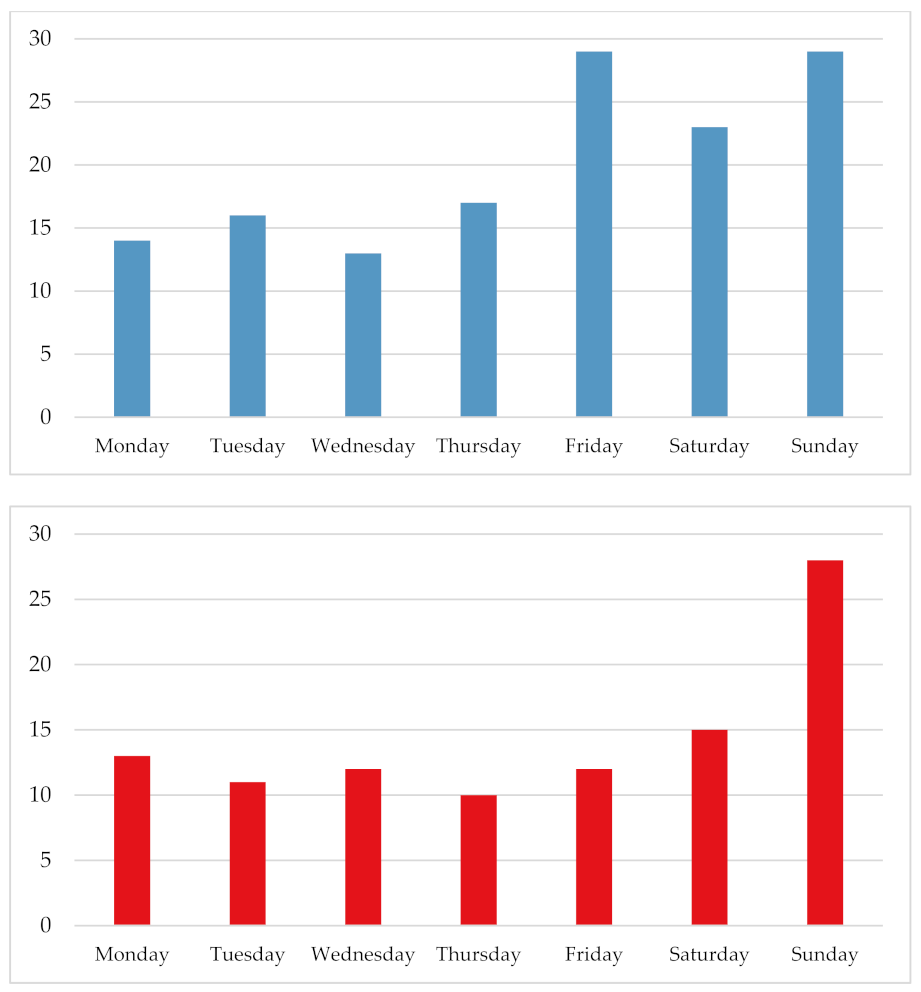
Before the pandemic, tweets about gunshots were predominantly in the last months of the year in 2018 (October, November and December) as well as in February 2019, accounting for 49.64% of the reports. During the pandemic, tweets were concentrated in the months of October 2019 and January, March and June 2020, constituting 52.47% of the reports. Tweets about gunshots were largely a weekend phenomenon; Fridays, Saturdays and Sundays accounted for 57.44% and 54.45% of the reports before and during the pandemic, respectively. They were most frequent on Sundays for both periods. Regarding the hour of the day, tweets were strongly evident at night after 8:00 p.m. and before 6:00 a.m., with a slight decrease during the COVID-19 period (from 76.59% to 71.28%). However, these variations in tweets by month, day of the week and hour of the day or night were not significant. The results of Fisher’s exact test to analyze variations did not allow for the rejection of the hypothesis of randomness of the observed frequencies. The estimated p-values were 0.2159 for months, 0.5322 for days of the week and 0.3729 for differences between day and night (based on 2000 replicates). In other words, there was no statistical evidence to suggest that the pandemic modified the regularity of reports in the months, days of the week or hours of the day in which the tweets regarding gunshots were generally concentrated in Mexico City.
4. Discussion
One of the most interesting findings of this analysis was that during lockdown in Mexico City, shootings appeared to have moved from one municipality to a neighboring one (Figure 4). The model suggests that the municipality of Cuauhtemoc (015) had the highest concentration of shootings and experienced a 50% increase in Twitter reports. In contrast, the neighboring municipality of Miguel Hidalgo (016) registered a reduction in the average frequency, with a pronounced fall in reports in the second period of 72.4% (Table 4). This may have been due to changes in crime patterns in the city.
In contrast to the studies conducted in Baltimore, Buffalo, Chicago, New York and Philadelphia, which found an increase in violence associated with firearms during the pandemic in comparison with 2019 [14,32,34], in Mexico City, an overall decrease in reports of gunshots was reported on Twitter across the two periods. This finding also differs from those studies that did not find significant increases in shootings in 25 large cities in the USA in general [11] or in Los Angeles [12].
The decrease in shootings in Mexico City is consistent with the significant decrease in other types of crimes in the city during the pandemic, such as robberies of public transport [8], burglary and vehicle theft [9]. On an international level, this study coincides with the effects of the pandemic on crime: an overall decrease, as indicated by, for example, Shayegh and Malpede (2020) [23] in San Francisco, by Mohler et al. (2020) [22] in Los Angeles and Indianapolis and by Campedelli (2020) [12] in Los Angeles.
Interestingly, this study shows not only a decrease in the reports of shootings but also a change in the spatial intensity of these reports. The kernel estimation spatial analysis shows that this decrease in frequency of reports was accompanied by a change in the spatial pattern of the intensity of tweets in the city. The change detected during the pandemic (right side of Figure 3) showed an evening out of intensity across the area, resulting in an almost equal probability of tweets in the central area of Mexico City as in the west. As illustrated in Figure 4, the municipalities of Miguel Hidalgo (016) and Cuauhtemoc (015) share an administrative border, and they registered the greatest frequency of reports for both periods. One explanation for the changes in the number of tweets may be that the municipalities border each other, and according to the first law of geography, “everything is related to everything else, but near things are more related than distant things” [51] (p.236).
One possible explanation for this phenomenon, based on the spatial proximity of the municipalities and the routine activities approach, is the differing financial capacity of potential victims of crimes committed with firearms to comply with lockdown measures. The municipality of Cuauhtemoc (015), which includes the historical center of the city, has many street vendors and informal businesses who, as a result of the severe decline in their income, struggled to respect the health lockdown (that is, they continued with their activities despite the restrictions). Furthermore, 48.07% of the occupied population in the municipality work in the informal sector [52]. In contrast, in the municipality of Miguel Hidalgo (016), which includes some of the highest income neighborhoods in the city (Polanco and Lomas de Chapultepec), the “stay-at-home” measures were relatively easier to follow, as businesses had the capacity to endure the closures (Figure 4). At the same time, there is less informal work (street vendors) in the municipality, with 40.50% of the population employed in the formal sector [52]. The decrease in commercial and pedestrian activity possibly gave rise to the displacement of crimes committed with firearms from Miguel Hidalgo (016) to Cuauhtemoc (015), where activity continued and criminal opportunities did not decrease significantly.
This explanation is further supported by the different income levels and business costs between municipalities. The proportion of employees reporting an income of more than 5 times the minimum wage in Miguel Hidalgo (016) is 14.64%, compared with 10.99% in the municipality of Cuauhtemoc (015) (the minimum wage in Mexico City is USD 7 [52]). The annual per capita income also reflects this difference between the municipalities. Miguel Hidalgo (016) has an average income of USD 8748.64 in comparison with that of Cuauhtemoc (015), which reports an average income of USD 6164 [43]. This difference plays out in all areas. For example, the monthly rental for a 100 m2 commercial property has an average cost of USD 1960.00 in Miguel Hidalgo (016), while in the Cuauhtemoc (015), such a property would go for two thirds of this cost at USD 1330.00 [53]. These figures illustrate the greater income opportunities available in the municipality of Miguel Hidalgo (016) in comparison with the Cuauhtemoc (015).
An alternative hypothesis regarding the increase in reports of gunshots in Cuauhtemoc (015) during the pandemic relates to the activities of drug trafficking organizations and their disputes over local markets (see spatial patterns and drug hotspots in Mexico City in Vilalta [54]). However, a recent study found that crimes associated with organized crime, such as robbery, kidnapping and homicides, remained at similar levels in Mexico City before and during the COVID-19 pandemic [9]. As activity levels of organized crime remain constant (for example, for homicide), then it is likely that a significant portion of the increase in tweets reporting gunshots in the municipality of Cuauhtemoc (015) was due to the displacement of other crimes committed with firearms from the neighboring municipality of Miguel Hidalgo (016). The notable fall in reports registered by the latter and the spatial proximity that modified the pattern of spatial intensity in the city, detected by the kernel estimation, supports this explanation.
This study also identified peaks in violence by gunshots in the city which did not appear to be related to either the criminological surroundings or to activity linked to the illicit drug market (Figure 4). For example, in the municipality of Iztapalapa (007), 42.5% of tweets reported parties by neighbors and religious celebrations as the origin of gunshots during the pandemic. However, it should be noted that this is simply conjecture based on qualitative comparisons by directly inspecting the data, as there was no systematic study conducted regarding this. It is recommended that future research look at the hypothesis linking the use of firearms and festivities in this part of the city.
These changes in spatial patterns are notable, especially in comparison with the little variation registered in both message content and in the periods of time in which tweets about gunshots were concentrated (weekends and at night). It is possible that the decrease in the use of firearms during the pandemic did not affect the temporal regularity and form in which gunshots were reported on Twitter (with little detail as to their origin), but it probably did modify the areas where these gunshots were heard.
A significant limitation exists regarding the analysis of changes in the dynamic of gunshots. Under-reporting is possible, as not all those who hear gunshots use Twitter or decide to tweet, and thus there may be a problem of self-selection of Twitter users. The location of tweets may be linked to areas in the city where the population has a higher average income (Table 2). The simple linear correlation between the location of tweets and the annual per capita income in the 16 municipalities of Mexico City is 0.535. Where incomes are the highest, there are more tweets. The correlation may suggest a positive link between users of Twitter and average income. Given this bias, the tweets may not be capturing the real gunshot dynamic in the city. Nevertheless, the change detected in the spatial pattern of the tweets was significant, and they occurred in the same areas that reported gunshots in both periods and thus probably reflected changes in the areas of the city where the population regularly tweeted about gunshots. While this may be only part of the story, it can contribute to an appreciation of the dynamics of firearm violence in the areas of Mexico City with the greatest Twitter use. An understanding of gunshot dynamics in the whole city could be gained with the availability of better data in future research. In this regard, it is currently estimated that 76.6% of the urban population in Mexico are internet users, and thus it is likely that the availability of data on reports of gunshots on social networks will continue improving [55].
Finally, this research has three main implications for the study of crime beyond the pandemic. First, this study contributes to those related to recurrent spatial clustering of crime phenomena [56,57], as it detected a clustering pattern of gunshots before and during the pandemic regardless of distance (according to the results of the Ripley’s K function estimation). Second, it identified that reports of gunshots may be related to three different phenomena: a decrease in commercial activity and criminal opportunities, an increase in activities related to the illicit drug market and the celebration of annual festivities (further studies are required to assess these relations more systematically). Third, the point pattern analysis of tweets may reveal hidden spatial patterns in global statistics, given that information on spatial patterns is not always available in police reports that report crime incident polygons. This study may advance the use of georeferenced reports on Twitter since, as far as we know, this information has never been used to analyze criminal intensity patterns in the cities of the region.
Author Contributions
Conceptualization, Gustavo Fondevila and Enrique García-Tejeda; methodology, Enrique García-Tejeda; software, Oscar S. Siordia; validation, Gustavo Fondevila and Enrique García-Tejeda; formal analysis, Gustavo Fondevila; investigation, Gustavo Fondevila and Enrique García-Tejeda; data curation, Enrique García-Tejeda and Oscar S. Siordia; writing—original draft preparation, Gustavo Fondevila and Enrique García-Tejeda; writing—review and editing, Gustavo Fondevila and Enrique García-Tejeda; visualization, Enrique García-Tejeda and Oscar S. Siordia; supervision, Enrique García-Tejeda; project administration, Gustavo Fondevila. All authors have read and agreed to the published version of the manuscript.
Funding
This research received no external funding.
Data Availability Statement
The data that support the findings of this study are available in the Geointeligente platform at the Center for Investigation in the Sciences of Geospatial Information (CentroGeo) (http://agei.geoint.mx/, accessed on 6 October 2020). Pre-authorisation is required.
Conflicts of Interest
The authors declare no conflict of interest.
Appendix A
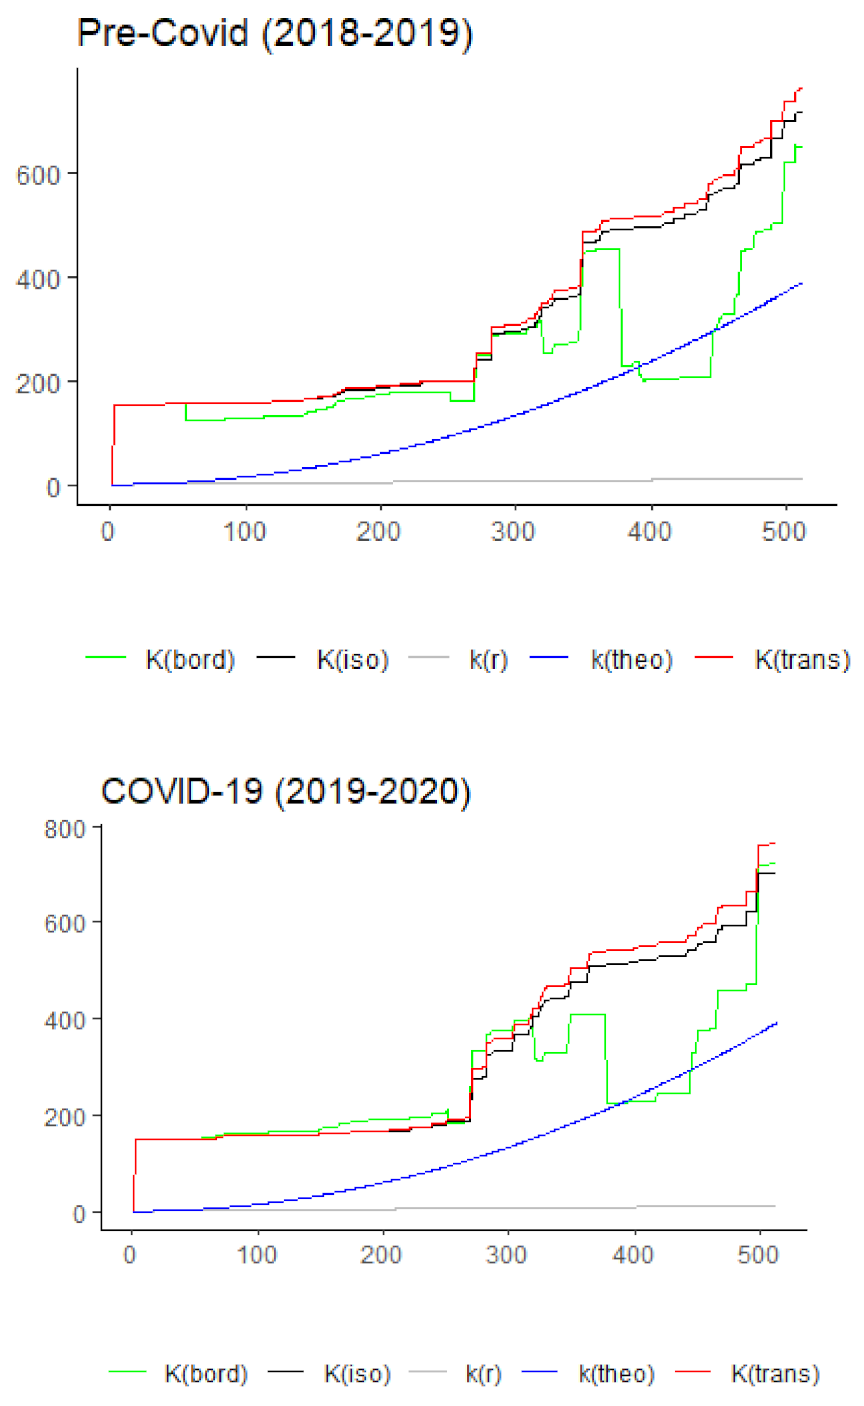
Figure A1.
Ripley’s K function(K-r) with border correction (K-bord), isotropic correction (K-iso), and translation correction (K-trans). K(theo) is the theoretical Poisson expected curve. Source: Authors’ own with R software.
Figure A1.
Ripley’s K function(K-r) with border correction (K-bord), isotropic correction (K-iso), and translation correction (K-trans). K(theo) is the theoretical Poisson expected curve. Source: Authors’ own with R software.


Table A1.
Fisher’s exact test for count data (n = 242 tweets).
| Fisher’s Exact Test for Count Data in R | |
|---|---|
| p-value | 0.05097 |
| n | 242 |
| number of zero cells | 5 |
| replicates | 2000 |
Source: Authors’ own with R software.
Figure A2.
Reports of gunshots pre-COVID-19 (blue) and during COVID-19 (red) in Mexico City for each month. September includes 6 days of October. Source: Authors’ own with office software.
Figure A2.
Reports of gunshots pre-COVID-19 (blue) and during COVID-19 (red) in Mexico City for each month. September includes 6 days of October. Source: Authors’ own with office software.

Figure A3.
Reports of gunshots pre-COVID-19 (blue) and during COVID-19 (red) in Mexico City for each day of the week. Source: Authors’ own with office software.
Figure A3.
Reports of gunshots pre-COVID-19 (blue) and during COVID-19 (red) in Mexico City for each day of the week. Source: Authors’ own with office software.

Figure A4.
Reports of gunshots pre-COVID-19 (blue) and during COVID-19 (red) in Mexico City for different times of the day. Source: Authors’ own with office software.
Figure A4.
Reports of gunshots pre-COVID-19 (blue) and during COVID-19 (red) in Mexico City for different times of the day. Source: Authors’ own with office software.


References
- Wilder-Smith, A.; Freedman, D.O. Isolation, quarantine, social distancing and community containment: Pivotal role for old-style public health measures in the novel coronavirus (2019-nCoV) outbreak. J. Travel Med. 2020, 27, taaa020. [Google Scholar] [CrossRef]
- Stickle, B.; Felson, M. Crime rates in a pandemic: The largest criminological experiment in history. Am. J. Crim. Justice 2020, 45, 525–536. [Google Scholar] [CrossRef]
- Felson, M.; Jiang, S.; Xu, Y. Routine activity effects of the COVID-19 pandemic on burglary in Detroit, March, 2020. Crime Sci. 2020, 9, 10. [Google Scholar] [CrossRef] [PubMed]
- Gerell, M.; Kardell, J.; Kindgren, J. Minor COVID-19 association with crime in Sweden, a five week follow up. Crime Sci. 2020, 9, 19. [Google Scholar] [CrossRef]
- Miller, J.M.; Blumstein, A. Crime, justice & the COVID-19 pandemic: Toward a national research agenda. Am. J. Crim. Justice 2020, 45, 515–524. [Google Scholar]
- Payne, J.; Morgan, A. Property crime during the COVID-19 pandemic: A comparison of recorded offence rates and dynamic forecasts (ARIMA) for March 2020 in Queensland, Australia. Preprint 2020. [Google Scholar] [CrossRef]
- Calderon-Anyosa, R.J.; Kaufman, J.S. Impact of COVID-19 Lockdown Policy on Homicide, Suicide, and Motor Vehicle Deaths in Peru. Prev. Med. 2021, 143, 106331. [Google Scholar] [CrossRef] [PubMed]
- Estévez-Soto, P.R. Crime and COVID-19: Effect of changes in routine activities in Mexico City. Crime Sci. 2021, 10, 15. [Google Scholar] [CrossRef] [PubMed]
- Balmori de la Miyar, J.R.; Hoehn-Velasco, L.; Silverio-Murillo, A. Druglords don’t stay at home: COVID-19 pandemic and crime patterns in Mexico City. J. Crim. Justice 2021, 72, 101745. [Google Scholar] [CrossRef] [PubMed]
- Federal Bureau of Investigation, 2020, NICS Firearm Checks: Month/Year. Available online: https://www.fbi.gov/file-repotory/nics_firearm_checks_-_month_year.pdf/view (accessed on 21 June 2021).
- Abrams, D. COVID and Crime: An Early Empirical Look, SSRN Scholarly Paper 2020, ID 3674032; Social Science Research Network: Rochester, NY, USA, 2020. [Google Scholar] [CrossRef]
- Campedelli, G.M.; Aziani, A.; Favarin, S. Exploring the effect of 2019-nCoV containment policies on crime: The Case of Los Angeles. Am. J. Crim. Justice 2020. Available online: https://osf.io/gcpq8/ (accessed on 20 June 2021).
- Beard, J.H.; Jacoby, S.F.; Maher, Z.; Dong, B.; Kaufman, E.J.; Goldberg, A.J.; Morrison, C.N. Changes in shooting incidence in Philadelphia, Pennsylvania, between March and November 2020. JAMA 2021, 325, 1327–1328. [Google Scholar] [CrossRef]
- Kim, D.Y.; Phillips, S.W. When COVID-19 and guns meet: A rise in shootings. J. Crim. Justice 2021, 73, 101783. [Google Scholar] [CrossRef]
- Hoops, K.; Johnson, T.; Grossman, E.R.; McCourt, A.; Crifasi, C.; Benjamin-Neelon, S.E. Stay-at-home orders and firearms in the United States during the COVID-19 pandemic. Prev. Med. 2020, 141, 106281. [Google Scholar] [CrossRef]
- Eisner, M.; Nivette, A. Violence and the Pandemic: Urgent Questions for Research; Harry Frank Guggenheim Foundation: New York, NY, USA, 2020. [Google Scholar]
- Cohen, L.E.; Felson, M. Social change and crime rate trends: A routine activity approach. Am. Sociol. Rev. 1979, 44, 588–608. [Google Scholar] [CrossRef]
- Clarke, R.V.G.; Felson, M. Routine Activity and Rational Choice; Transaction Publishers: New York, NY, USA, 1993. [Google Scholar]
- Eck, J.E.; Madensen, T.D. Meaningfully and Artfully Reinterpreting Crime for Useful Science: An Essay on the Value of Building with Simple Theory; Palgrave Macmillan: London, UK, 2015; pp. 5–18. [Google Scholar]
- Sasson, C.; Haukoos, J.S.; Ben-Youssef, L.; Ramirez, L.; Bull, S.; Eigel, B.; Padilla, R. Barriers to calling 911 and learning and performing cardiopulmonary resuscitation for residents of primarily Latino, high-risk neighborhoods in Denver, Colorado. Ann. Emerg. Med. 2015, 65, 545–552. [Google Scholar] [CrossRef] [PubMed] [Green Version]
- Encuesta Nacional De Victimización Y Percepción De Seguridad Pública -Envipe. Available online: https://www.inegi.org.mx/programas/envipe/2020/ (accessed on 25 July 2021).
- Mohler, G.; Bertozzi, A.L.; Carter, J.; Short, M.B.; Sledge, D.; Tita, G.E.; Uchida, C.D.; Brantingham, P.J. Impact of social distancing during COVID-19 pandemic on crime in Los Angeles and Indianapolis. J. Crim. Justice 2020, 68, 101692. [Google Scholar] [CrossRef] [PubMed]
- Shayegh, S.; Malpede, M. Staying Home Saves Lives, Really! Available online: https://ssrn.com/abstract=3567394 (accessed on 22 June 2021).
- Ashby, M.P.J. Initial evidence on the relationship between the coronavirus pandemic and crime in the United States. Crime Sci. 2020, 9, 6. [Google Scholar] [CrossRef] [PubMed]
- Boserup, B.; McKenney, M.; Elkbuli, A. Alarming trends in US domestic violence during the COVID-19 pandemic. Am. J. Emerg. Med. 2020, 38, 2753–2755. [Google Scholar] [CrossRef]
- Campbell, A.M. An increasing risk of family violence during the COVID-19 pandemic: Strengthening community collaborations to save lives. Forensic Sci. Int. Rep. 2020, 2, 100089. [Google Scholar] [CrossRef]
- Nigam, S. COVID-19, Lockdown and Violence against Women in Homes. 2020. Available online: https://ssrn.com/abstract=3587399 (accessed on 20 June 2021).
- Piquero, A.R.; Riddell, J.R.; Bishopp, S.A.; Narvey, C.; Reid, J.A.; Piquero, N.L. Staying home, staying safe? A short-term analysis of COVID-19 on Dallas domestic violence. Am. J. Crim. Justice 2020, 45, 601–635. [Google Scholar] [CrossRef]
- Kushner, G.S.; Wallace, G.S.; Pepinsky, T. Partisanship, health behavior, and policy attitudes in the early stages of the COVID-19 pandemic. PLoS ONE 2020, 16, e0249596. [Google Scholar]
- Lunn, P.D.; Timmons, S.; Belton, C.A.; Barjaková, M.; Julienne, H.; Lavin, C. Motivating social distancing during the COVID-19 pandemic: An online experiment. Soc. Sci. Med. 2020, 265, 113478. [Google Scholar] [CrossRef] [PubMed]
- Van Rooij, B.; de Bruijn, A.L.; Reinders, F.C.; Kooistra, E.; Kuiper, M.E.; Brownlee, M.; Olthuis, E.; Fine, A. Compliance with COVID-19 Mitigation Measures in the United States. 2021. Available online: https://ssrn.com/abstract=3582626 (accessed on 14 June 2021).
- Hatchimonji, J.S.; Swendiman, R.A.; Seamon, M.J.; Nance, M.L. Trauma does not quarantine: Violence during the COVID-19 pandemic. Ann. Surg. 2020, 272, e53. [Google Scholar] [CrossRef] [PubMed]
- Kravitz-Wirtz, N.; Aubel, A.; Schleimer, J.P.; Pallin, R.; Wintemute, G. Violence, firearms, and the coronavirus pandemic: Findings from the 2020 California Safety and Wellbeing Survey. MedRxiv 2020. [Google Scholar] [CrossRef]
- Sutherland, M.; McKenney, M.; Elkbuli, A. Gun violence during COVID-19 pandemic: Paradoxical trends in New york city, Chicago, Los Angeles and Baltimore. Am. J. Emerg. Med. 2021, 39, 225–226. [Google Scholar] [CrossRef]
- Donnelly, M.R.; Grigorian, A.; Inaba, K.; Kuza, C.M.; Kim, D.; Dolich, M.; Lekawa, M.; Nahmias, J. A dual pandemic: The influence of coronavirus disease 2019 on trends and types of firearm violence in California, Ohio, and the United States. J. Surg. Res. 2021, 263, 24–33. [Google Scholar] [CrossRef]
- Cukier, W.; Eagen, S.A. Gun violence. Curr. Opin. Psychol. 2018, 19, 109–112. [Google Scholar] [CrossRef]
- Hoehn-Velasco, L.; Silverio-Murillo, A.; de la Miyar, J.R.B. The great crime recovery: Crimes against women during, and after, the COVID-19 lockdown in Mexico. Econ. Hum. Biol. 2021, 41, 100991. [Google Scholar] [CrossRef]
- Marmolejo, L.; Barberi, D.; Bergman, M.; Espinoza, O.; Fondevila, G. Responding to COVID-19 in Latin American prisons: The cases of Argentina, Chile, Colombia, and Mexico. Vict. Offenders 2020, 15, 1–24. [Google Scholar] [CrossRef]
- Agoff, C.; Sandberg, S.; Fondevila, G. Women Providing and Men Free Riding: Work, Visits and Gender Roles in Mexican Prisons. Vict. Offenders 2020, 15, 1086–1104. [Google Scholar] [CrossRef]
- Autómata Geointeligente De Internet. Available online: https://www.centrogeo.org.mx/geointeligencia?view=project&id=8:automata-geointeligente-en-internet&catid=16 (accessed on 6 October 2020).
- Guglielmi, G. Mexican science suffers under debilitating budget cuts. Nature 2019, 572, 294–296. [Google Scholar] [CrossRef] [Green Version]
- National Institute of Statistics and Geography. Available online: https://inegi.org.mx/programas/ccpv/2020/ (accessed on 20 July 2021).
- Informe De Desarrollo Humano Municipal 2010–2015. Transformando México Desde Lo Local. Available online: https://www.mx.undp.org/content/mexico/es/home/library/poverty/informe-de-desarrollo-humano-municipal-2010–2015--transformando-.html (accessed on 20 May 2021).
- Fotheringham, A.S.; Brunsdon, C.; Charlton, M. Quantitative Geography: Perspectives on Spatial Data Analysis; Sage: London, UK, 2000. [Google Scholar]
- Baddeley, A.; Rubak, E.; Turner, R. Spatial Point Patterns: Methodology and Applications with R; CRC Press: Boca Raton, FL, USA, 2015. [Google Scholar]
- Floch, J.M.; Marcon, E.; Puech, F. Spatial distribution of points. In Handbook of Spatial Analysis: Theory and Application with R.; Loonis, V., Bellefon, M.P., Eds.; Institut National de la Statistique et des Études Économiques: Montrouge, France, 2018; Volume 131, pp. 77–111. [Google Scholar]
- Openshaw, S. The modifiable areal unit problem. In Quantitative Geography: A British View; Routledge: London, UK, 1981; pp. 60–69. [Google Scholar]
- Jelinski, D.E.; Wu, J. The modifiable areal unit problem and implications for landscape ecology. Landsc. Ecol. 1996, 11, 129–140. [Google Scholar] [CrossRef]
- Genebes, L.; Renaud, A.; Sémécurbe, F. Spatial smoothing. In Handbook of Spatial Analysis: Theory and Application with R.; Loonis, V., Bellefon, M.P., Eds.; Institut National de la Statistique et des Études Économiques: Montrouge, France, 2018; Volume 131, pp. 205–229. [Google Scholar]
- Mehta, C.R.; Patel, N.R. Algorithm 643: Fexact: A fortran subroutine for fisher’s exact test on unordered r× c contingency tables. ACM Trans. Math. Softw. 1986, 12, 154–161. [Google Scholar] [CrossRef]
- Tobler, W.R. A computer movie simulating urban growth in the Detroit region. Econ. Geogr. 1970, 46, 234–240. [Google Scholar] [CrossRef]
- Encuesta Nacional De Ocupación Y Empleo. Available online: https://www.inegi.org.mx/programas/enoe/15ymas/ (accessed on 5 April 2021).
- Reporte Del Mercado Inmobiliario 2020. Available online: https://www.lamudi.com.mx/reporte-del-mercado-inmobiliario-2020/ (accessed on 5 April 2021).
- Vilalta, C.J. The spatial dynamics and socioeconomic correlates of drug arrests in Mexico City. Appl. Geogr. 2010, 30, 263–270. [Google Scholar] [CrossRef]
- Encuesta Nacional Sobre Disponibilidad Y Uso de Tecnologías De La Información En Los Hogares. Available online: https://www.inegi.org.mx/programas/dutih/2019/ (accessed on 15 July 2021).
- Weisburd, D. The law of crime concentration and the criminology of place. Criminology 2015, 53, 133–157. [Google Scholar] [CrossRef]
- Lee, Y.; Eck, J.E.; SooHyun, O.; Martinez, N.N. How concentrated is crime at places? A systematic review from 1970 to 2015. Crime Sci. 2017, 6, 1–16. [Google Scholar] [CrossRef]
Figure 1.
Municipalities of Mexico City. The table on the right shows the city municipalities’ official names and codes [42]. Source: Authors’ own with QGIS software.
Figure 1.
Municipalities of Mexico City. The table on the right shows the city municipalities’ official names and codes [42]. Source: Authors’ own with QGIS software.

Figure 2.
Ripley’s K function, isotropic. Source: Authors’ own with R software.

Figure 3.
Kernel estimate of gunshot prevalence in Mexico City pre-COVID-19 (left) and during COVID-19 (right). Source: Authors’ own with R software.
Figure 3.
Kernel estimate of gunshot prevalence in Mexico City pre-COVID-19 (left) and during COVID-19 (right). Source: Authors’ own with R software.

Figure 4.
Reports of gunshots pre-COVID-19 (blue) and during COVID-19 (red) in Mexico City. The numbers on the map represent Miguel Hidalgo (016), Cuauhtémoc (015) and Iztapalapa (007). Source: Authors’ own with QGIS software.
Figure 4.
Reports of gunshots pre-COVID-19 (blue) and during COVID-19 (red) in Mexico City. The numbers on the map represent Miguel Hidalgo (016), Cuauhtémoc (015) and Iztapalapa (007). Source: Authors’ own with QGIS software.

Table 1.
Subset of georeferenced tweets on Twitter.
| Scheme 2018 | Tweets Analyzed | Tweets Georeferencing “Gunshots” |
|---|---|---|
| from 6 October 2018 to 6 February 2019 | 1,963,641,924 | 563 |
| from 7 February 2019 to 6 July 2019 | 1,963,765,625 | 606 |
| from 7 July 2019 to 6 December 2019 | 1,964,022,142 | 954 |
| from 7 December 2019 to 6 May 2020 | 1,963,793,442 | 790 |
| from 7 May 2020 to 6 October 2020 | 1,964,032,520 | 675 |
Source: Authors’ own with tweets from the AGEI [40].
| Municipality | Population | Area (km2) | Annual per Capita Income (USD) |
|---|---|---|---|
| Álvaro Obregón | 759,137 | 96.17 | 4440.91 |
| Azcapotzalco | 432,205 | 33.66 | 4682.48 |
| Benito Juárez | 434,153 | 26.63 | 9544.92 |
| Coyoacán | 614,447 | 54.4 | 5470.09 |
| Cuajimalpa | 217,686 | 80.95 | 4815.84 |
| Cuauhtémoc | 545,884 | 32.4 | 6164.74 |
| Gustavo A. Madero | 1,173,351 | 94.07 | 3946.49 |
| Iztacalco | 404,695 | 23.3 | 5553.65 |
| Iztapalapa | 1,835,486 | 117 | 3699.78 |
| Magdalena Contreras | 247,622 | 74.58 | 3747.39 |
| Miguel Hidalgo | 414,470 | 46.99 | 8748.64 |
| Milpa Alta | 152,685 | 228.41 | 2933.25 |
| Tláhuac | 392,313 | 85.34 | 3127.62 |
| Tlalpan | 699,928 | 312 | 4252.02 |
| Venustiano Carranza | 443,704 | 33.4 | 4520.47 |
| Xochimilco | 442,178 | 122 | 3379.10 |
Table 3.
Nearest neighbor ratio.
| NNR | Pre-COVID October 2018–2019 | COVID-19 October 2019–2020 |
|---|---|---|
| Nearest Neighbor Ratio | 0.239556 *** | 0.212260 *** |
| Observed Mean Distance | 265.82 m | 278.21 m |
| Expected Mean Distance | 1,109.65 m | 1,310.71 m |
| z-score | −17.274584 | −15.145186 |
| p-value | 0.0000001 | 0.0000001 |
*** denotes rejection of the null hypothesis at 1%. Source: Authors’ own with ArcGIS software.
Table 4.
Number of tweets per municipality.
| Municipality | Pre-COVID-19 | During COVID-19 |
|---|---|---|
| Iztapalapa | 23 | 21 |
| Miguel Hidalgo | 29 | 8 |
| Cuauhtémoc | 12 | 18 |
| Benito Juárez | 18 | 11 |
| La Magdalena Contreras | 17 | 7 |
| Coyoacán | 11 | 11 |
| Tlalpan | 10 | 8 |
| Venustiano Carranza | 8 | 3 |
| Iztacalco | 4 | 4 |
| Xochimilco | 2 | 1 |
| Azcapotzalco | 2 | 5 |
| Tláhuac | 3 | 0 |
| Cuajimalpa de Morelos | 1 | 2 |
| Álvaro Obregón | 1 | 2 |
| Milpa Alta | 0 | 0 |
| Gustavo A. Madero | 0 | 0 |
| Total | 141 | 101 |
Publisher’s Note: MDPI stays neutral with regard to jurisdictional claims in published maps and institutional affiliations. |
© 2021 by the authors. Licensee MDPI, Basel, Switzerland. This article is an open access article distributed under the terms and conditions of the Creative Commons Attribution (CC BY) license (https://creativecommons.org/licenses/by/4.0/).
Share and Cite
MDPI and ACS Style
García-Tejeda, E.; Fondevila, G.; Siordia, O.S. Spatial Analysis of Gunshot Reports on Twitter in Mexico City. ISPRS Int. J. Geo-Inf. 2021, 10, 540. https://0-doi-org.brum.beds.ac.uk/10.3390/ijgi10080540
AMA Style
García-Tejeda E, Fondevila G, Siordia OS. Spatial Analysis of Gunshot Reports on Twitter in Mexico City. ISPRS International Journal of Geo-Information. 2021; 10(8):540. https://0-doi-org.brum.beds.ac.uk/10.3390/ijgi10080540
Chicago/Turabian StyleGarcía-Tejeda, Enrique, Gustavo Fondevila, and Oscar S. Siordia. 2021. "Spatial Analysis of Gunshot Reports on Twitter in Mexico City" ISPRS International Journal of Geo-Information 10, no. 8: 540. https://0-doi-org.brum.beds.ac.uk/10.3390/ijgi10080540
Note that from the first issue of 2016, this journal uses article numbers instead of page numbers. See further details here.