
Site Selection of Fire Stations in Large Cities Based on Actual Spatiotemporal Demands: A Case Study of Nanjing City


Abstract
:1. Introduction
2. Literature Review
3. Introduction of the Model and Method
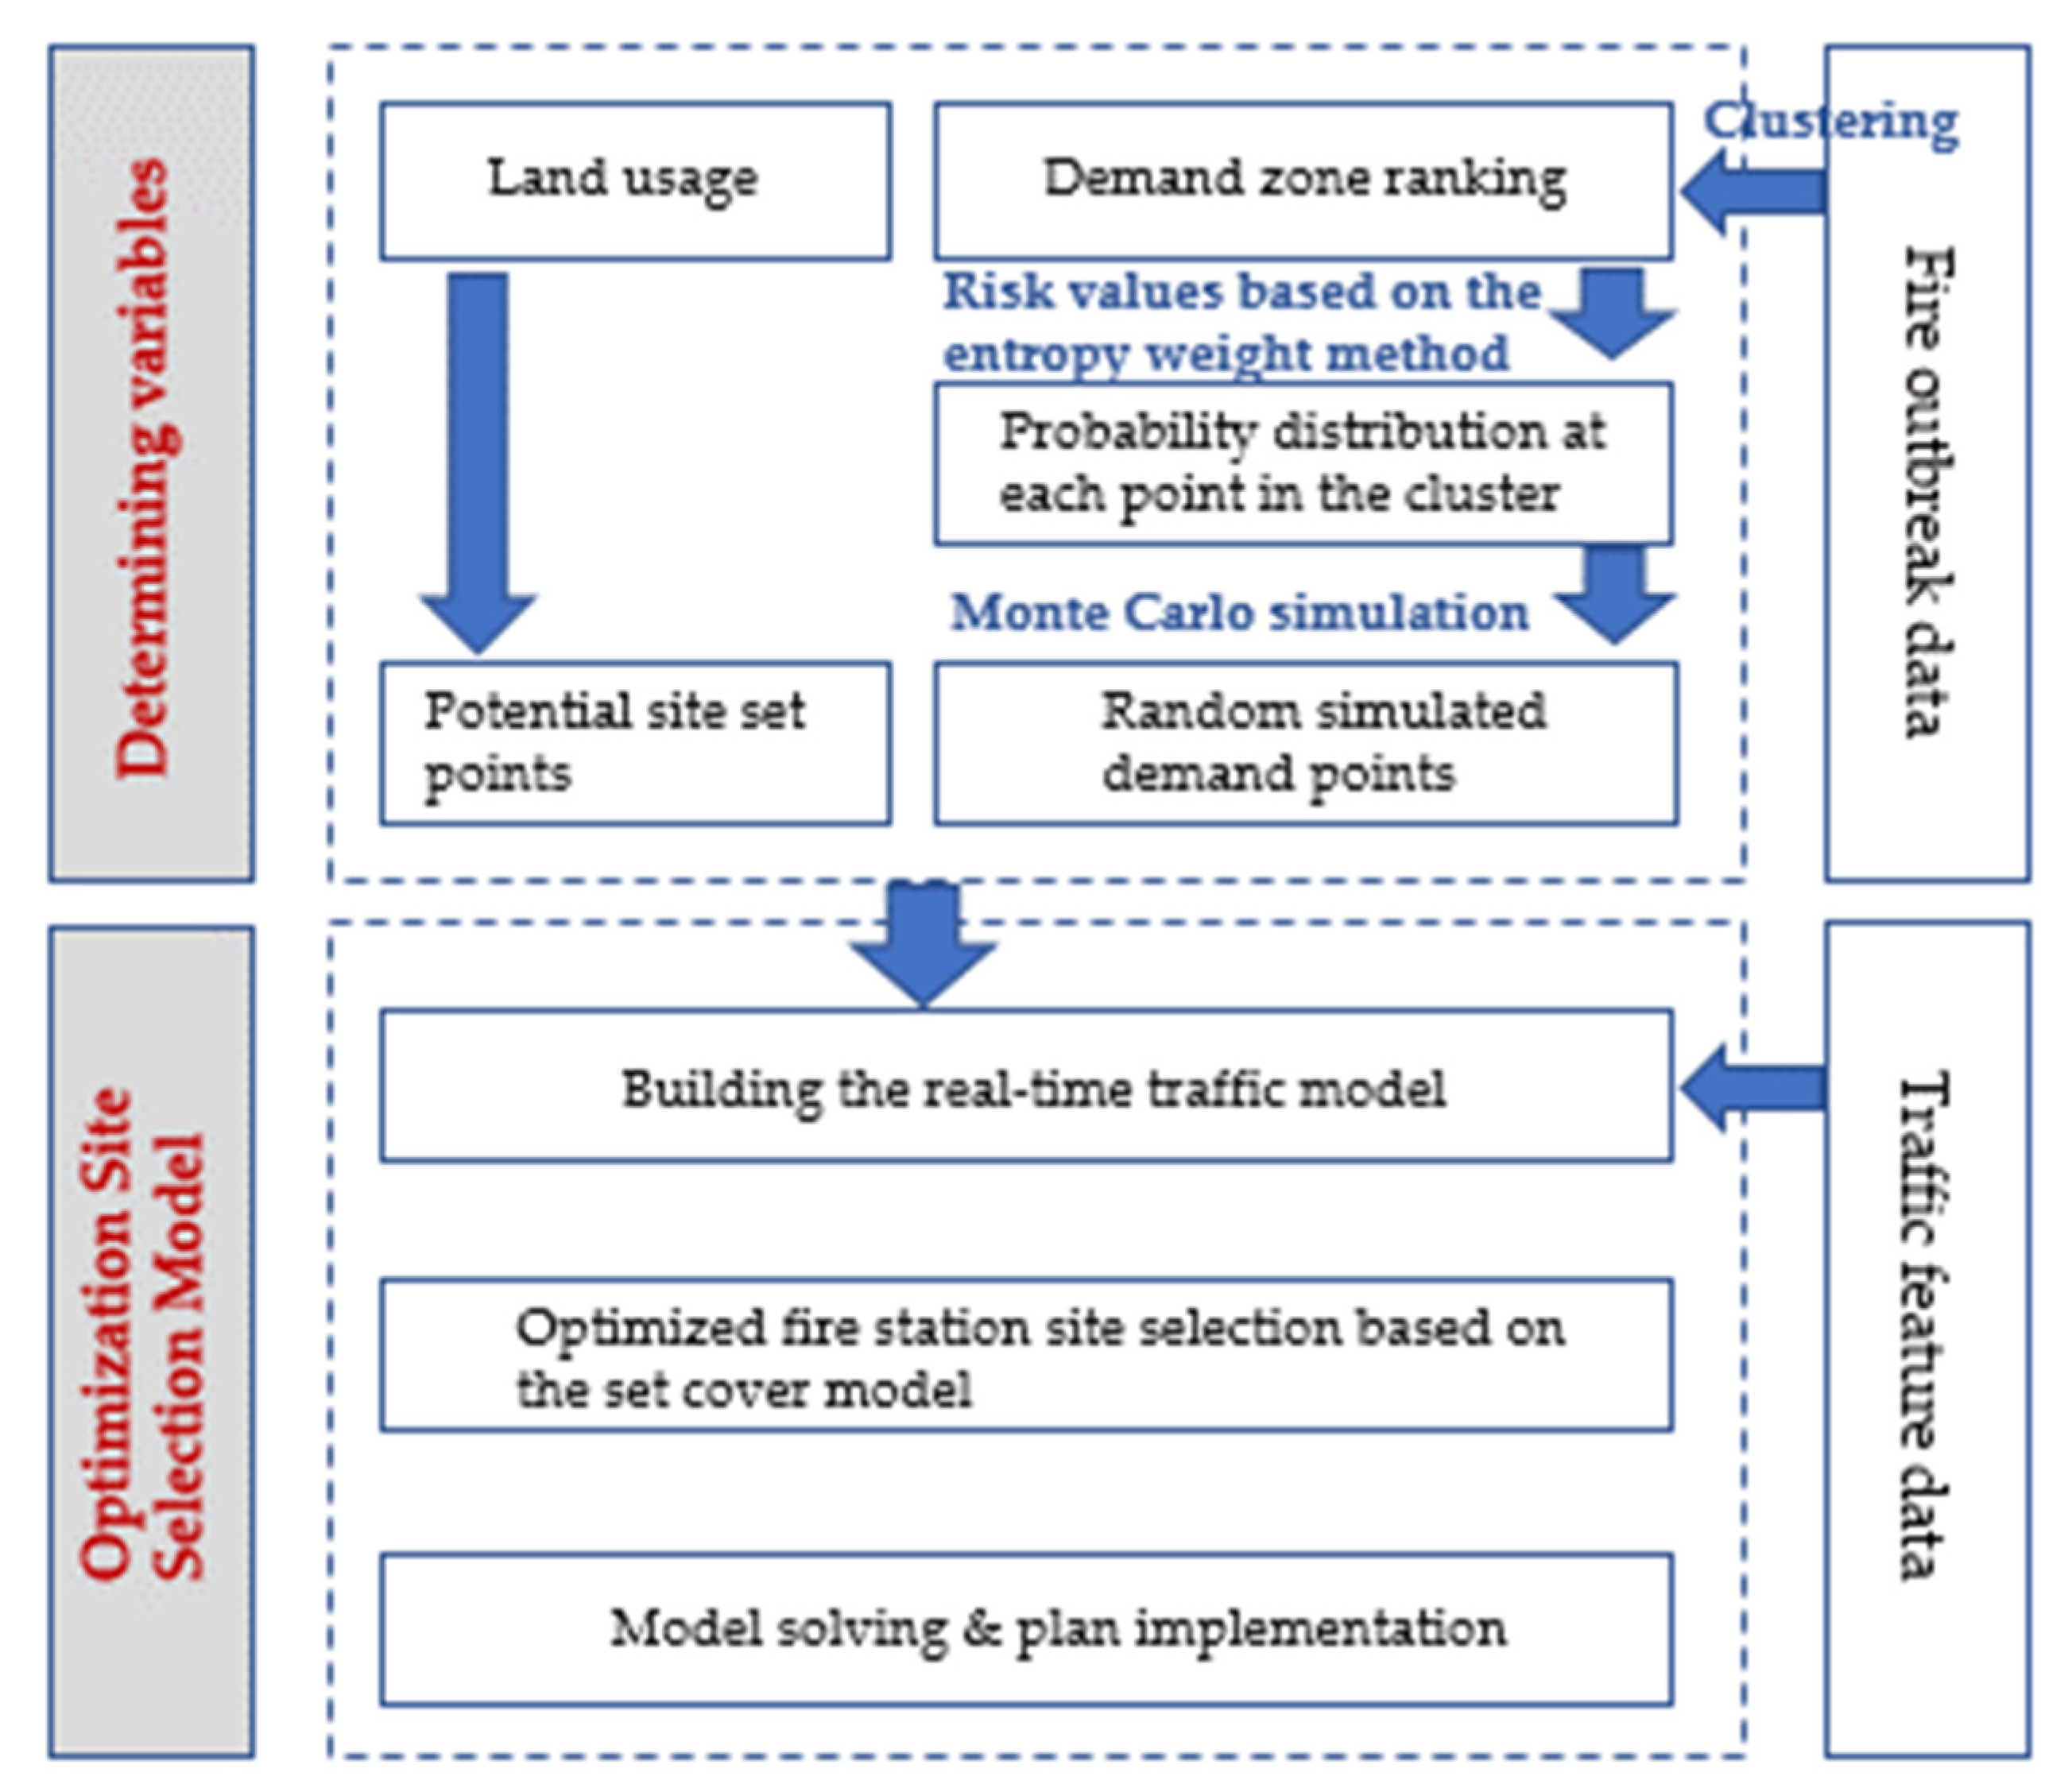
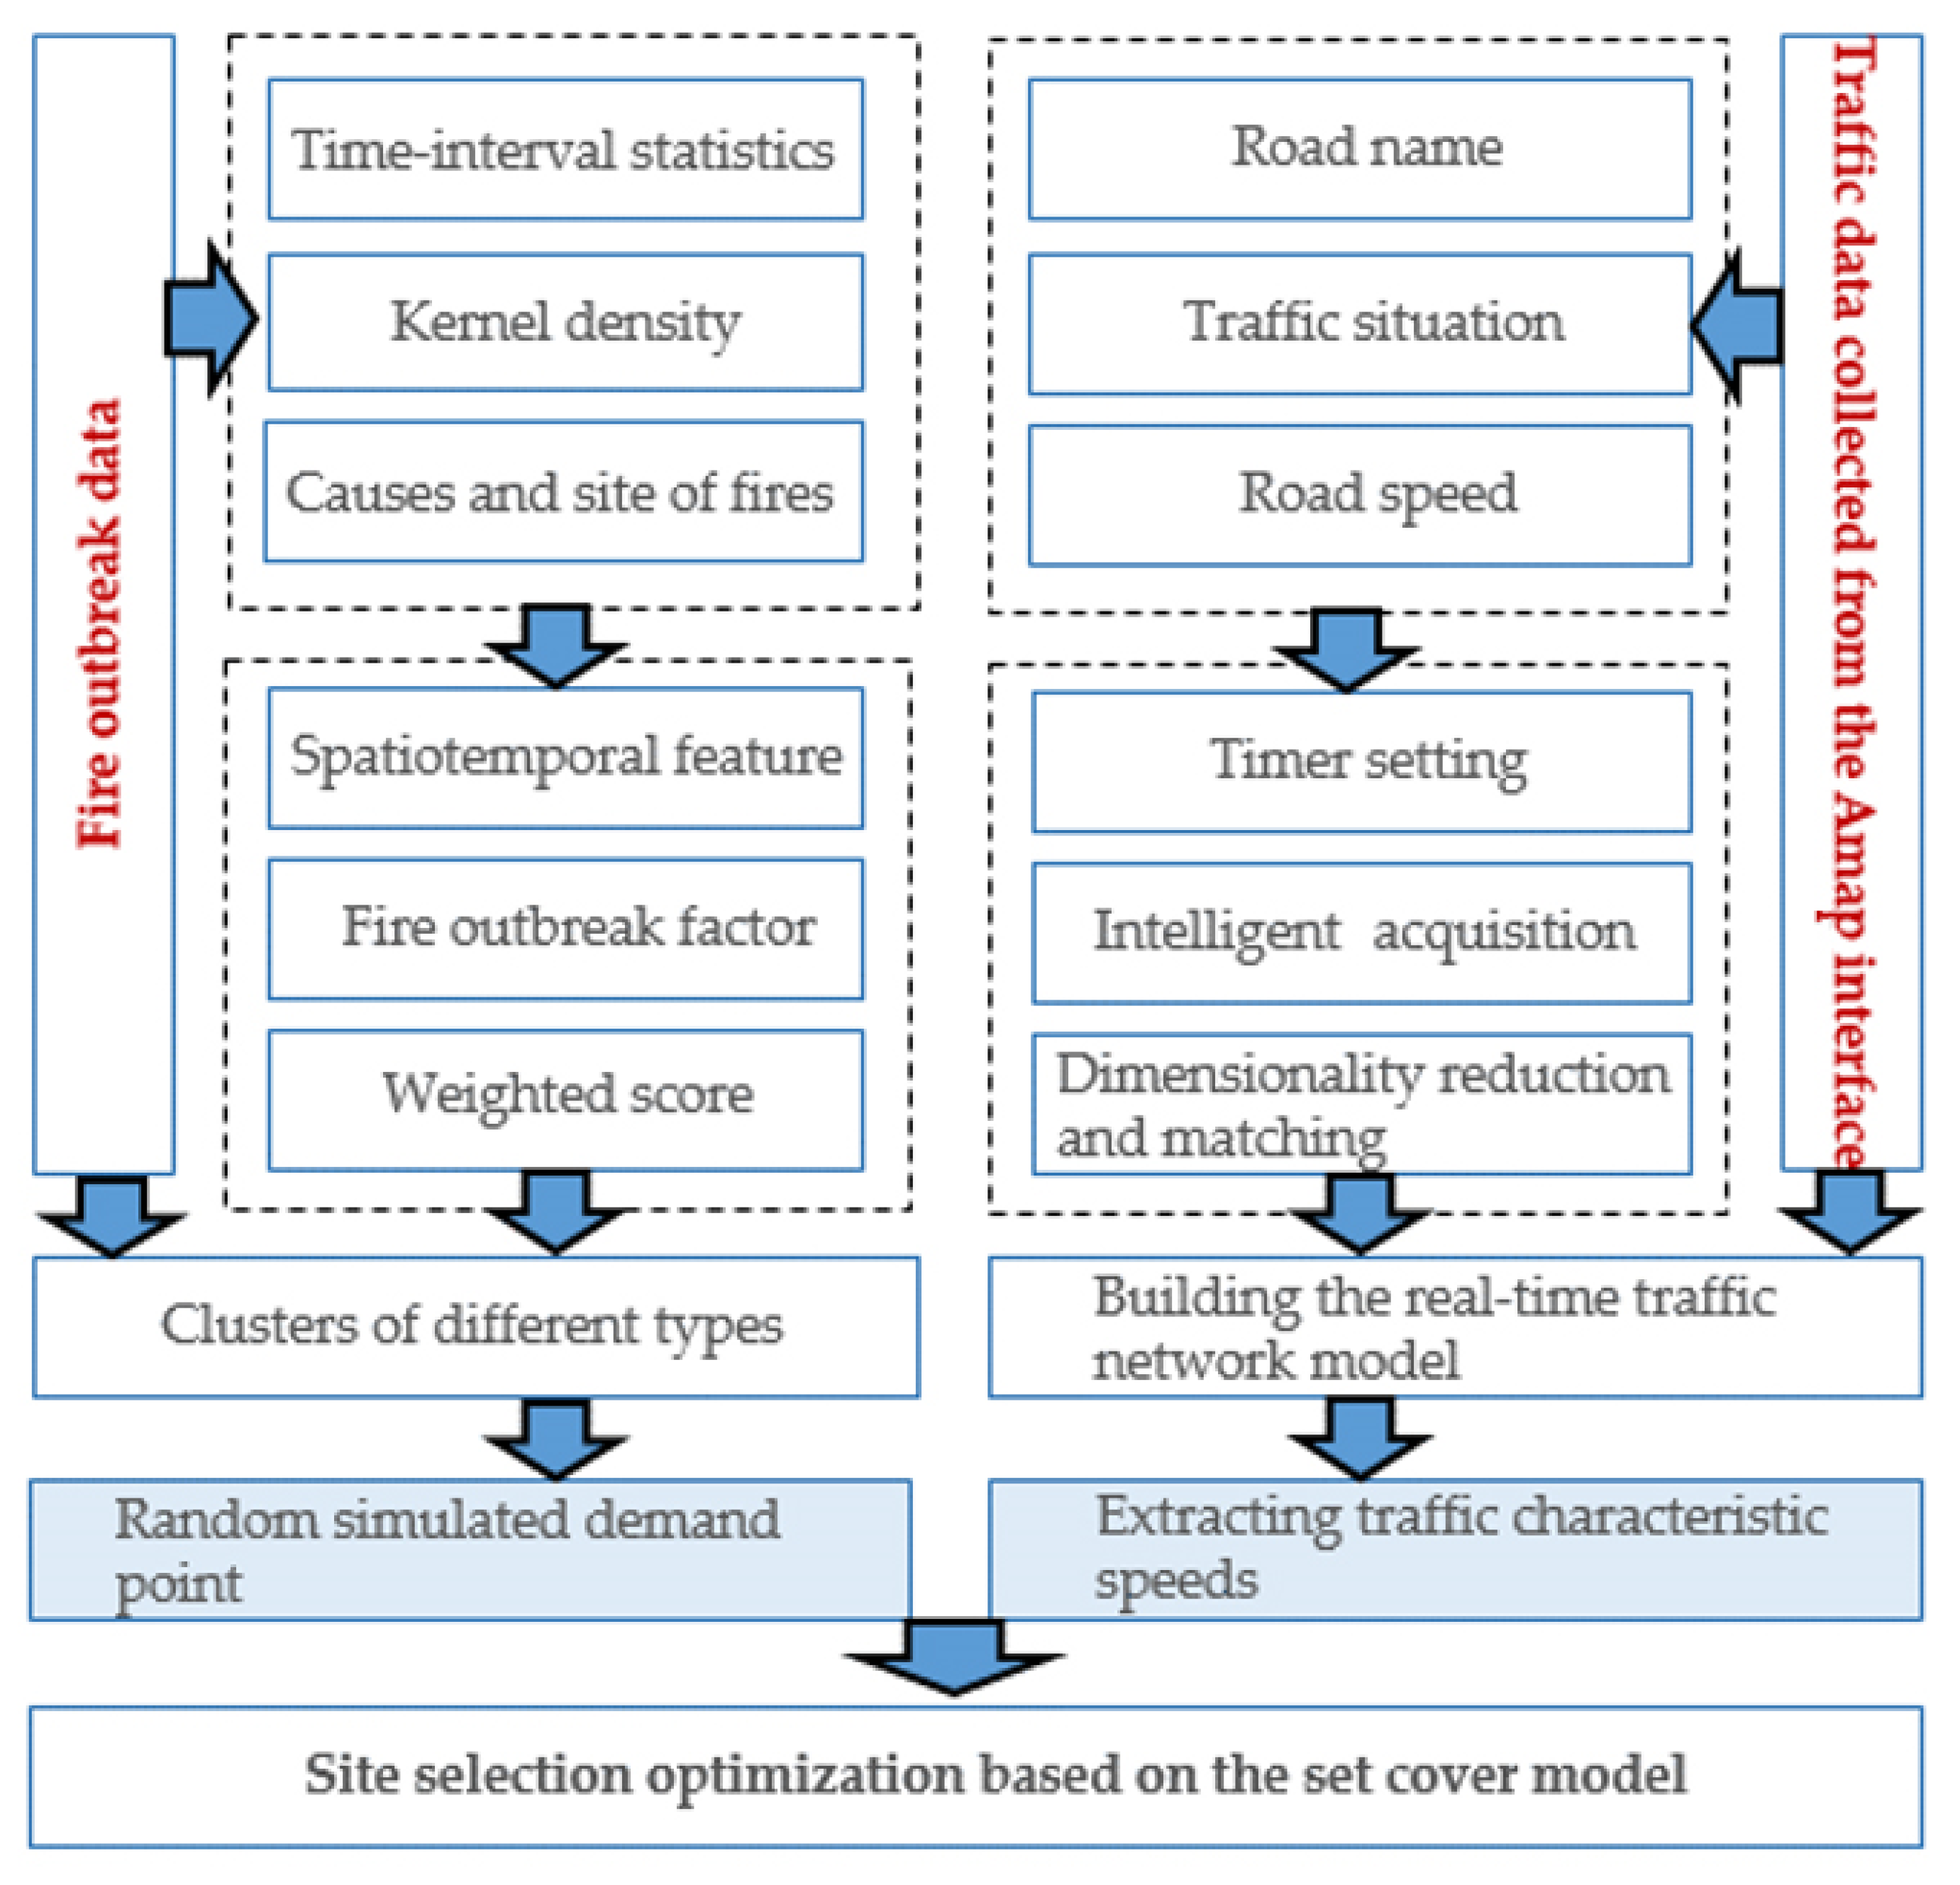
3.1. Methodology
3.2. The Improved LSCP Model
3.2.1. Generation of Random Demand Points
- (a)
- Standardizing the original positive index data:where is the original value of the i-th sample and the j-th index, is the standardized index value, and are the average and standard deviation of the j-th index, respectively.
- (b)
- Quantifying all indexes in the same way and calculating the weight of the i-th factor in the j-th index ():where n is the number of samples (indexes) and m is the number of indexes.
- (c)
- Calculating the entropy value of the j-th index ():where and ≥ 0.
- (d)
- Calculating the difference coefficient () of the j-th index:
- (e)
- Normalizing the difference coefficient and calculating the weight of the j-th index
3.2.2. Traffic Model T Incorporating Traffic Jam
3.2.3. Site Selection Model Based on Random Simulated Demand Points and Traffic Characteristic Speeds
4. Data Sources
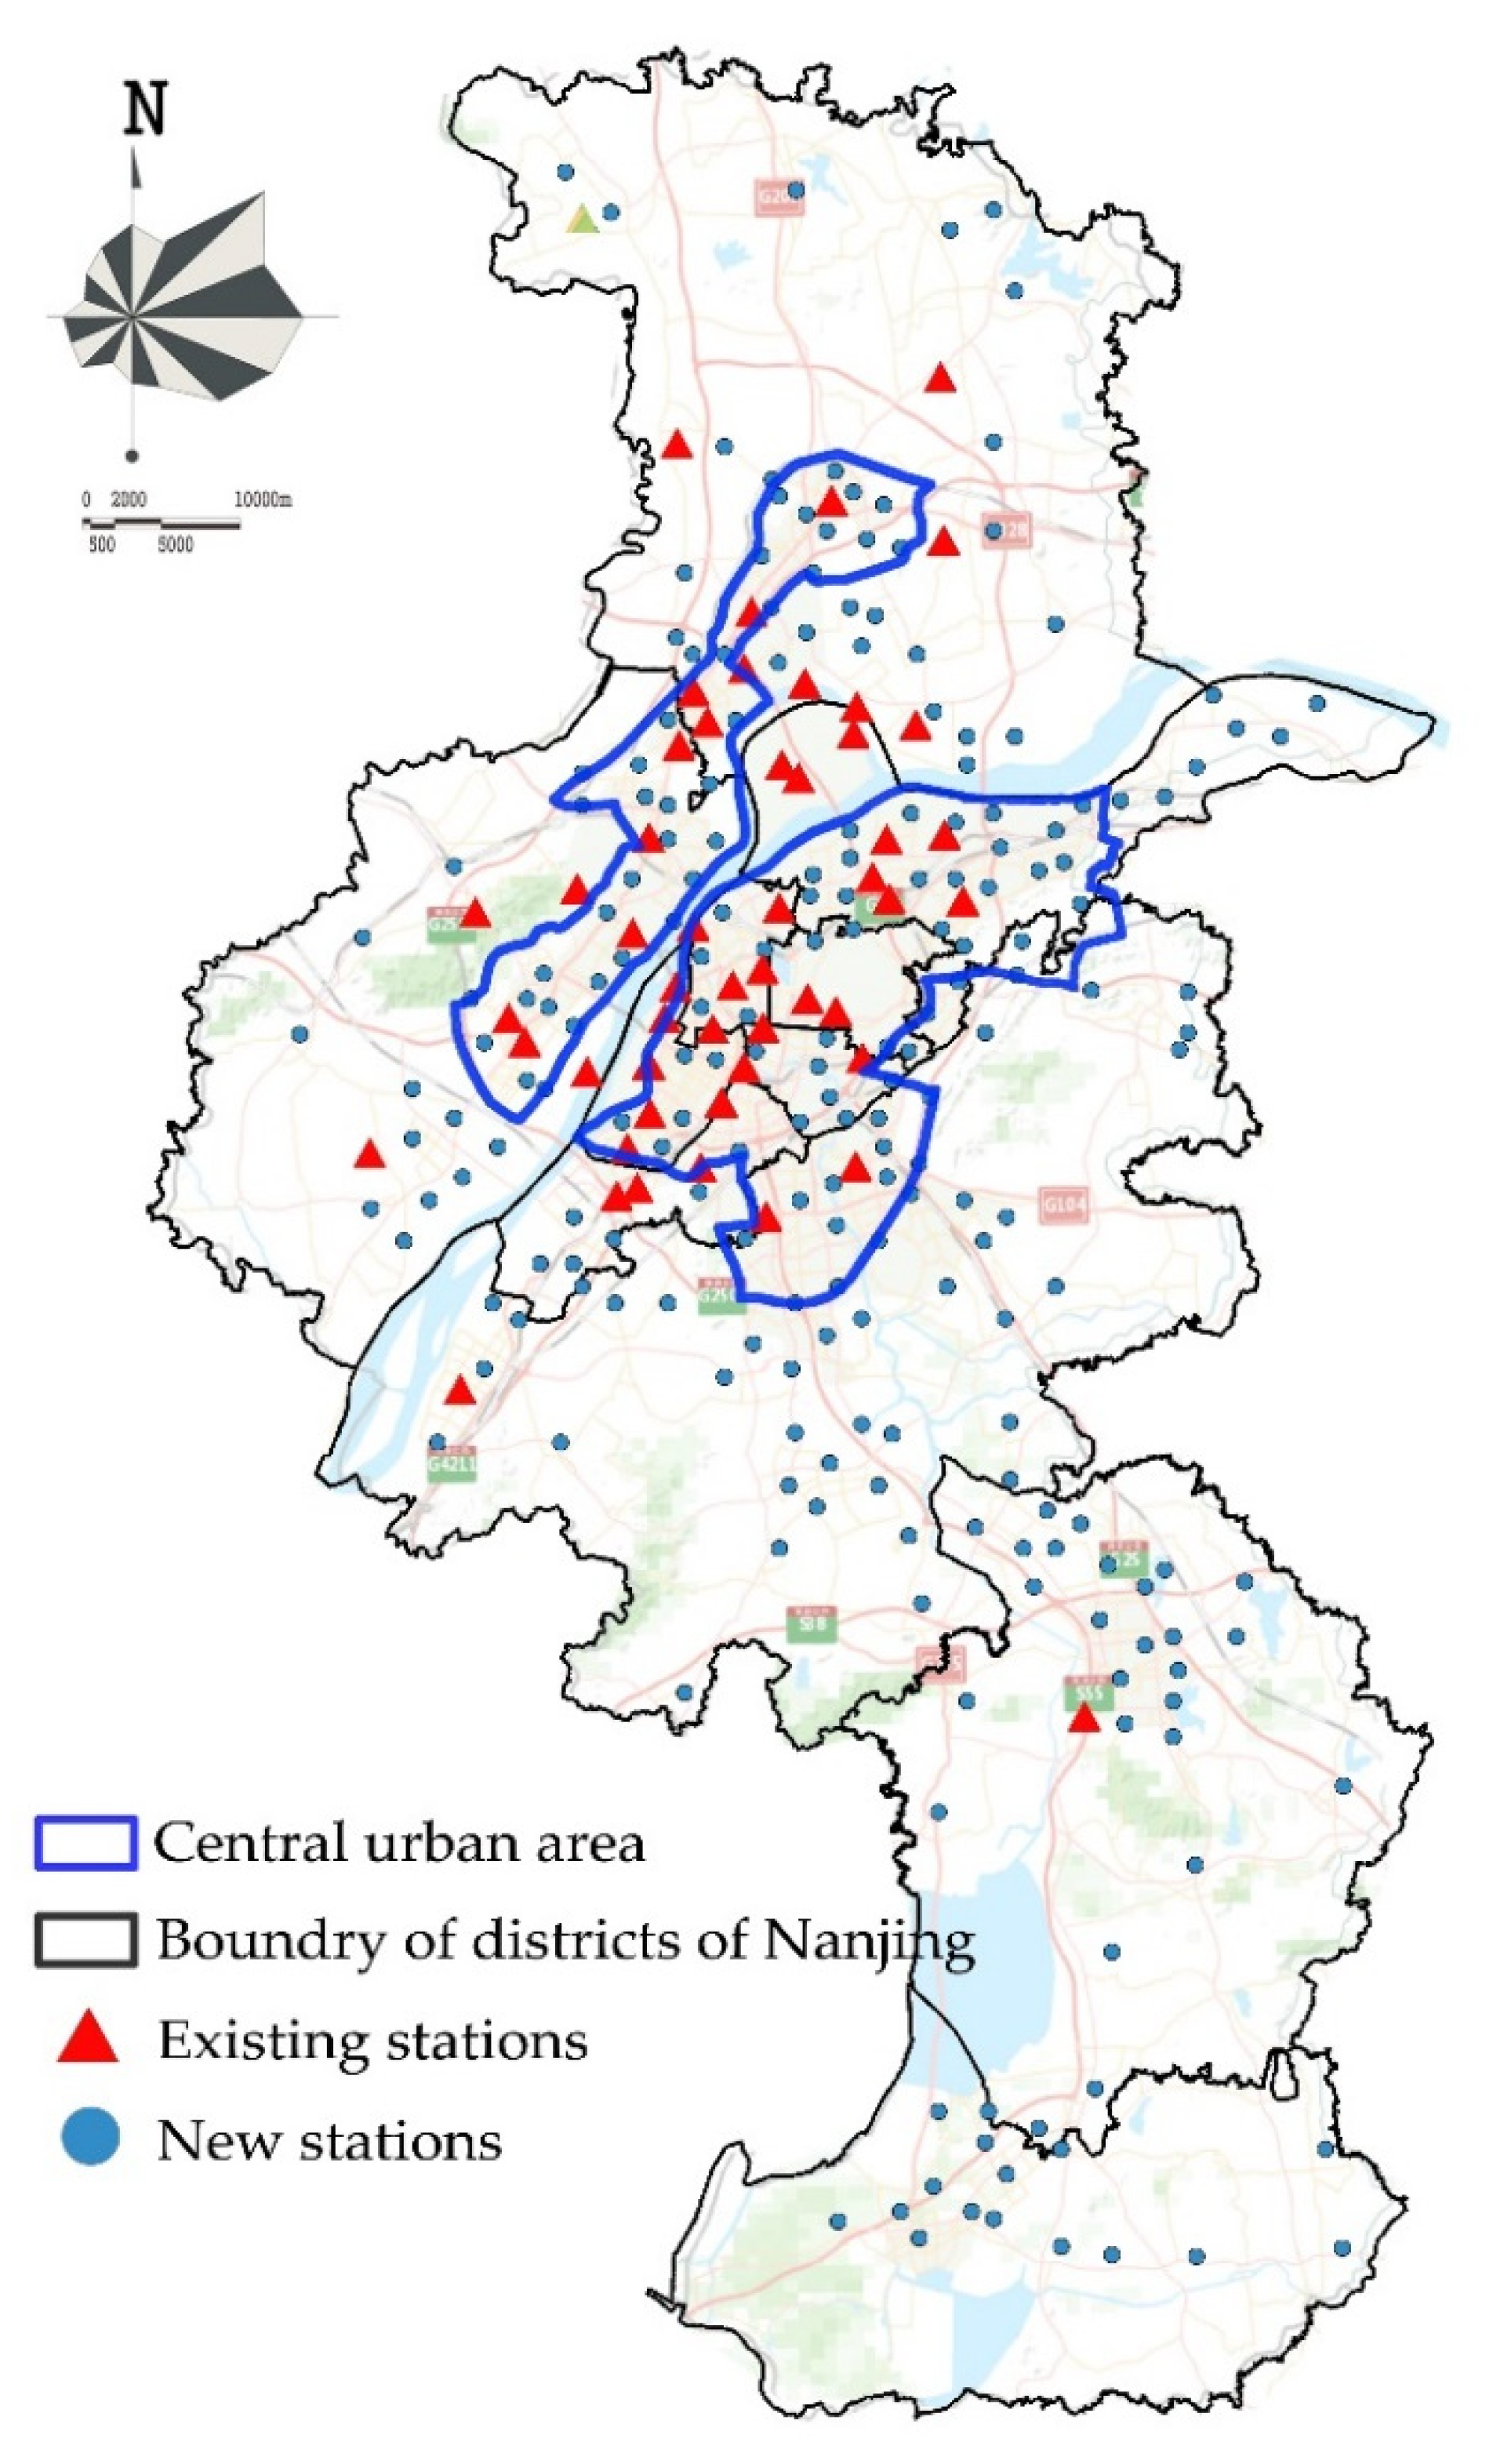
4.1. Study Area
4.2. Fire Outbreak Data
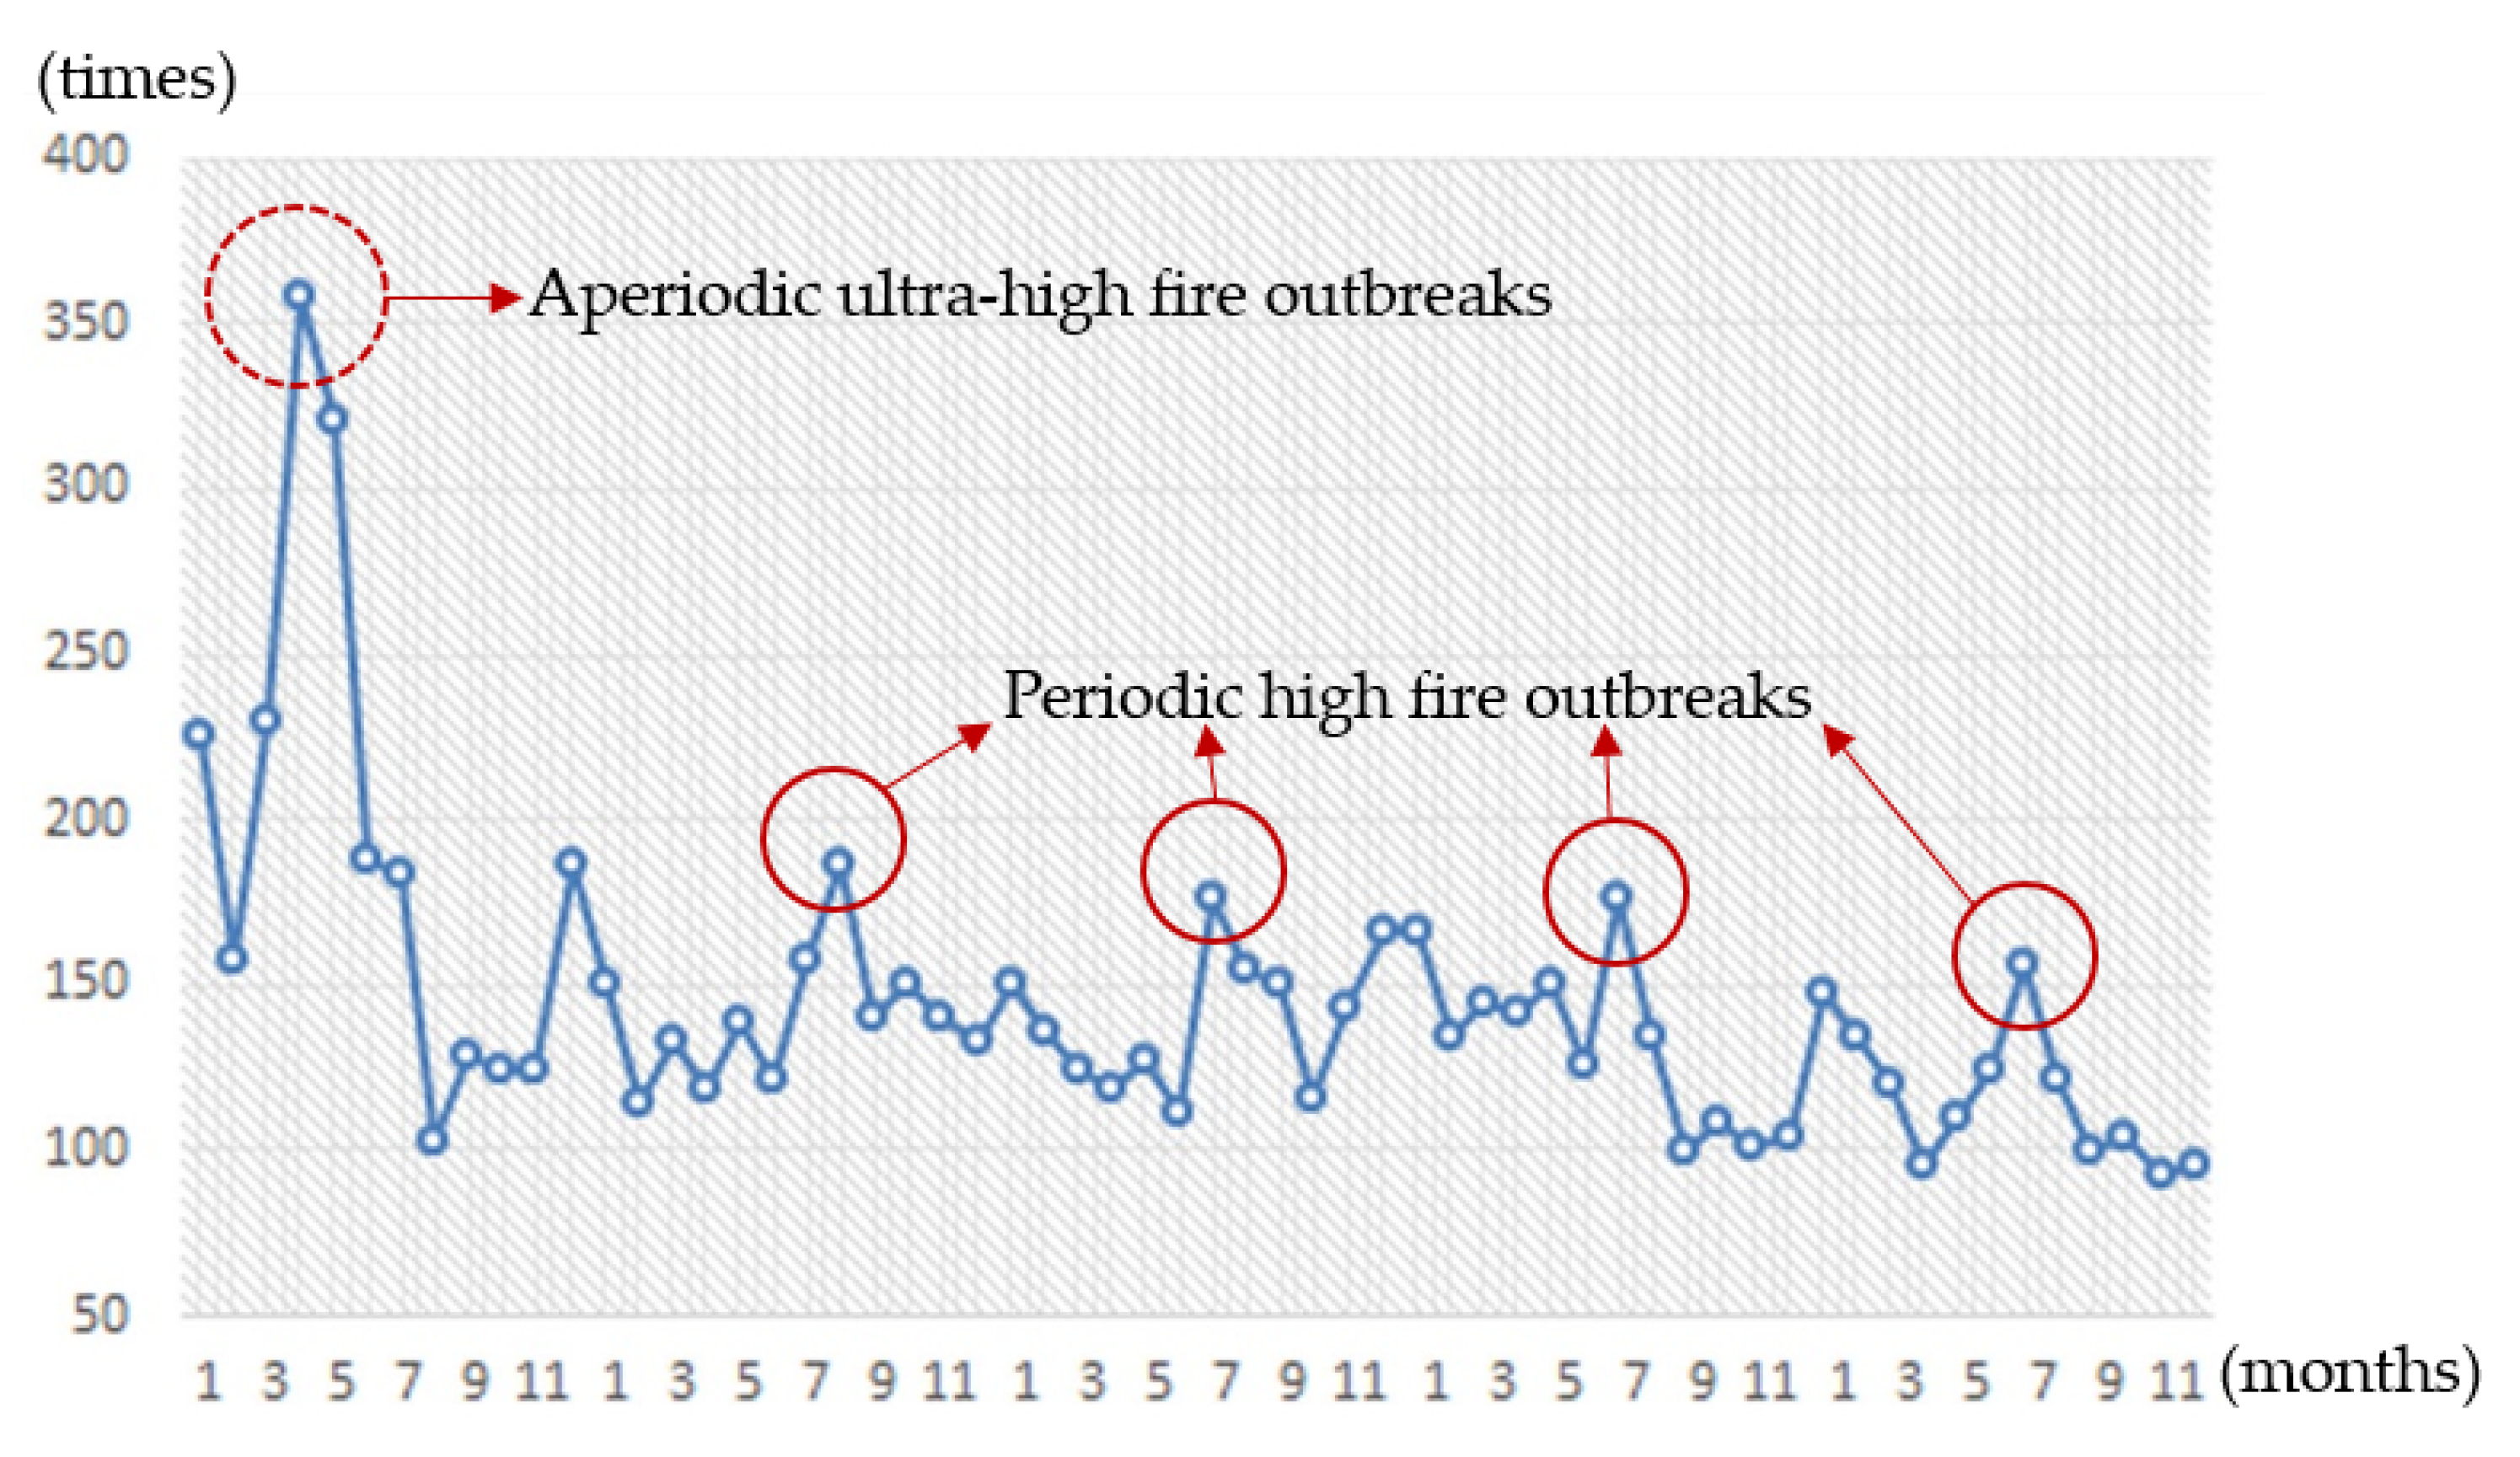
4.2.1. Basic Characteristics of Fire Outbreaks
4.2.2. Fire-Triggering Factors
5. Optimization and Application of the Site Selection Model
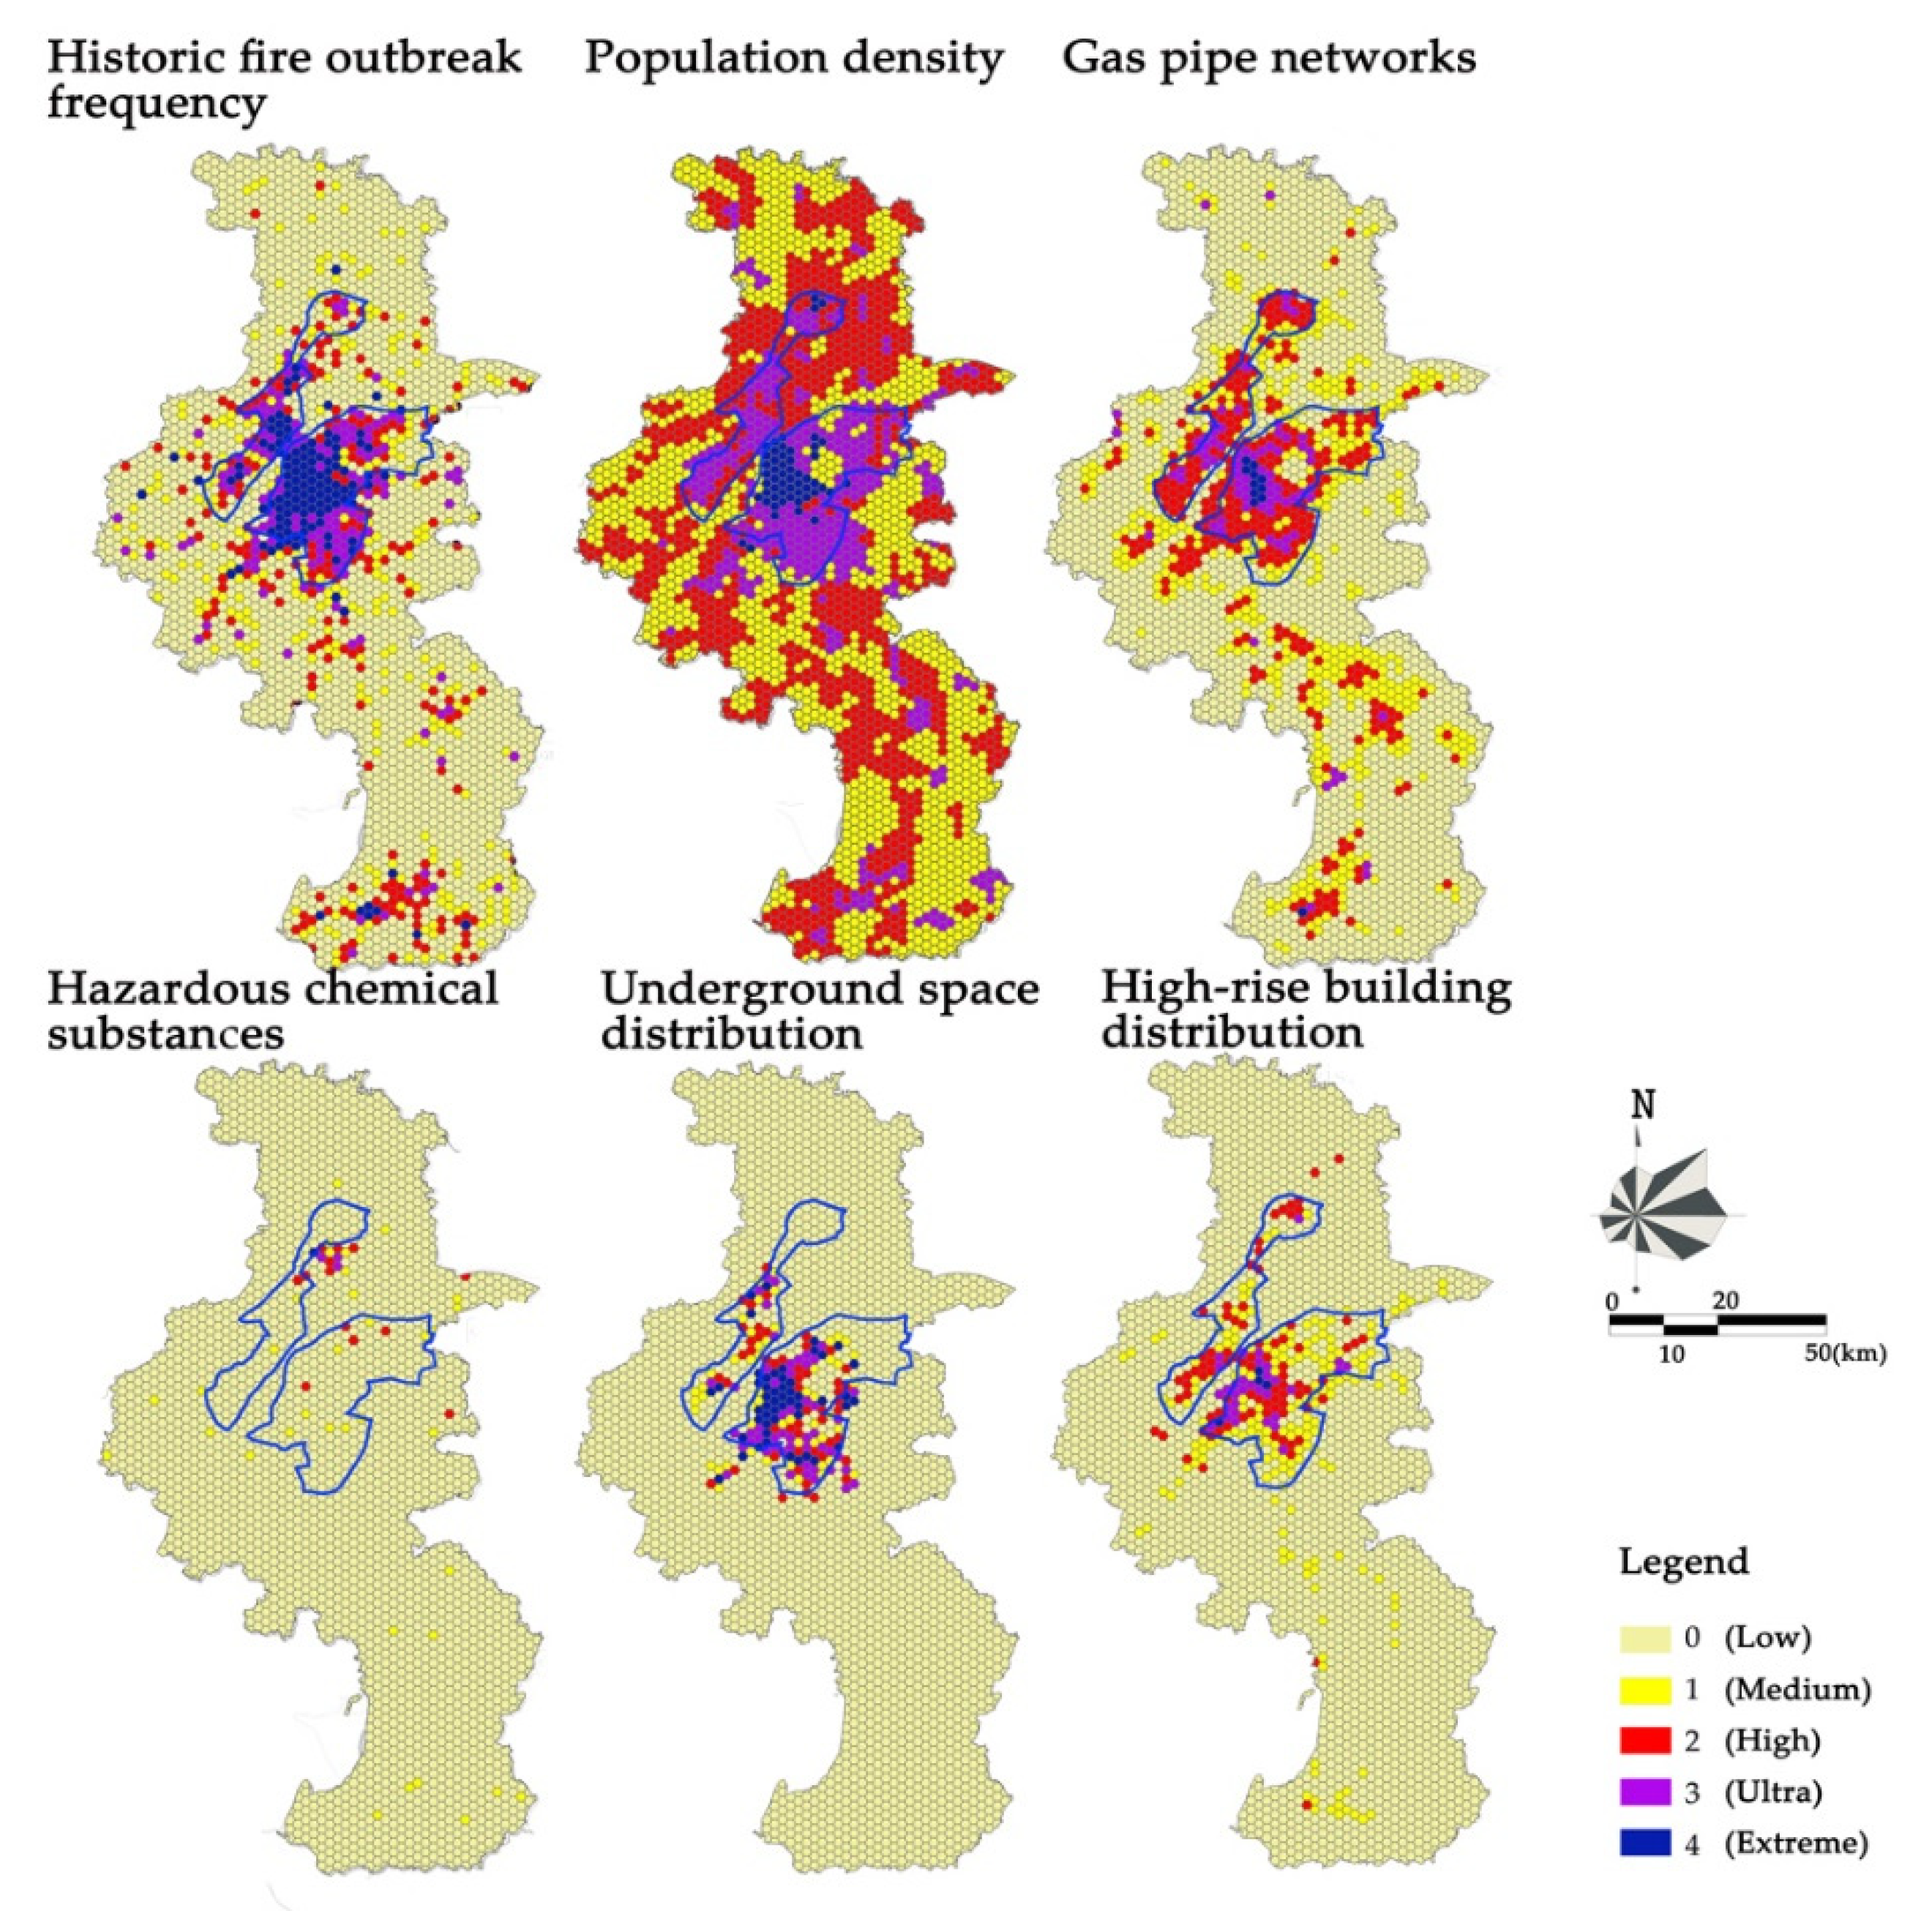
5.1. Underlying Fire Risk Evaluation
5.2. Ranking of Demand Zones
5.2.1. Determining the Fire Station Site Candidates with the Urban Planning Taken into Consideration
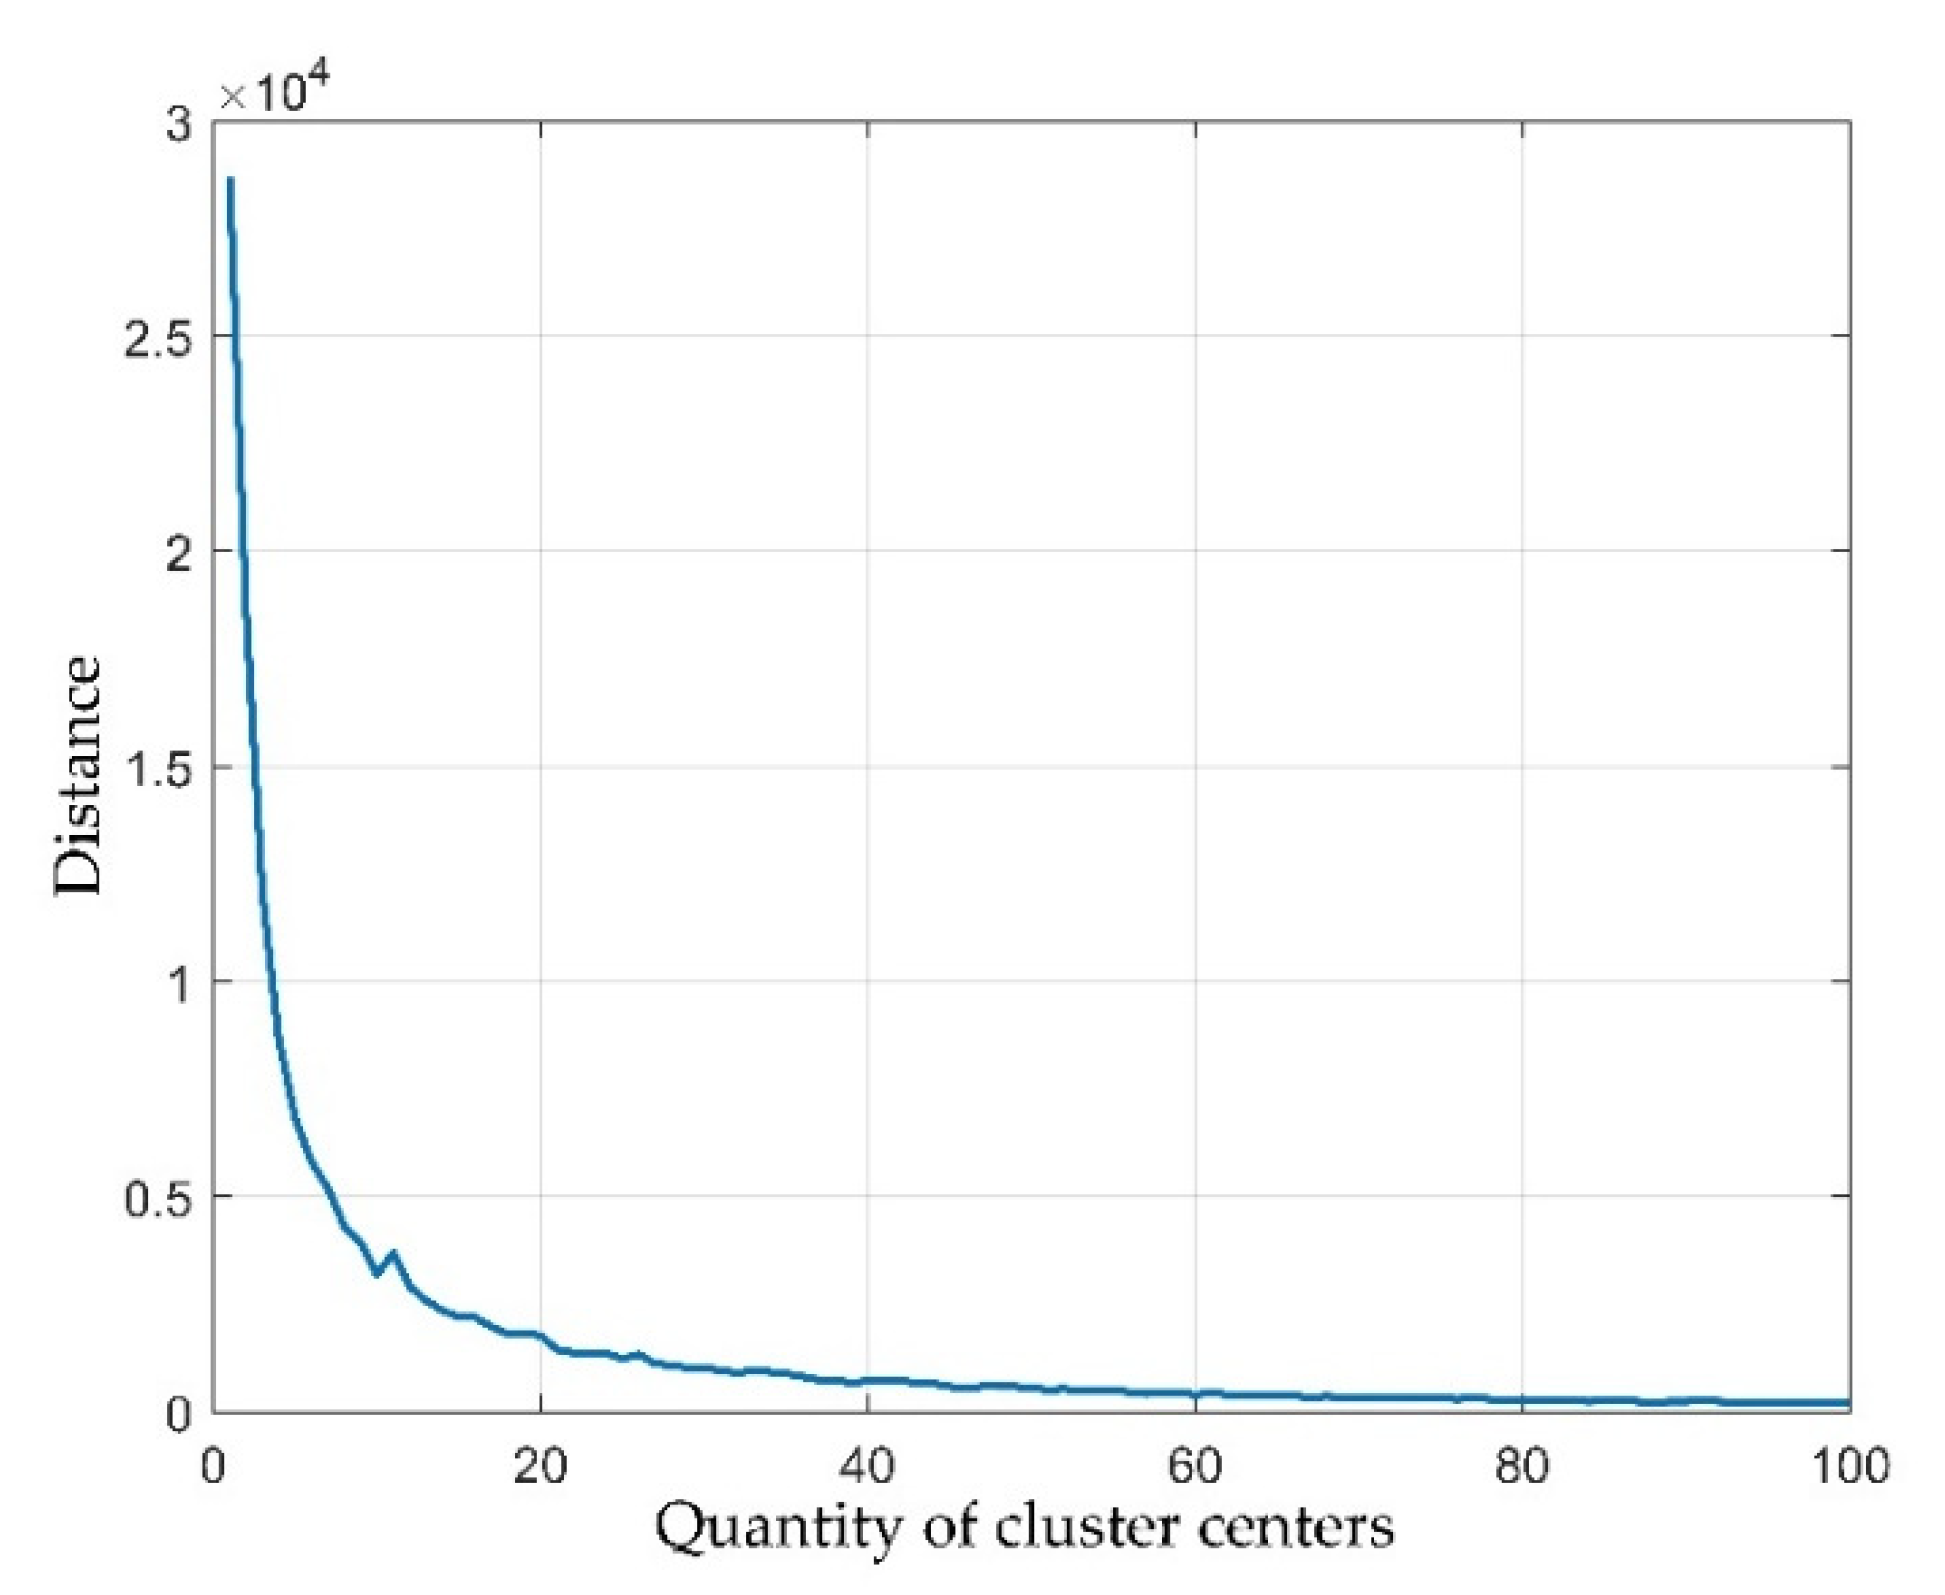
5.2.2. Clustering and Simulation of Historic Firefighting Data
5.2.3. Building the Traffic Network Model and Calculating the Minimal Time Matrix tij
5.2.4. Generating the Set of the Planned Sites W
5.2.5. Adjusting the Model-Produced Results and Reviewing the Planned Land Use for the Fire Station Sites According to the Regulatory Plans of Each District to Ensure the Feasibility of the Ultimate Planned Fire Station Layout
6. Discussion
7. Conclusions
Author Contributions
Funding
Data Availability Statement
Acknowledgments
Conflicts of Interest
References
- Shin, S.C. Study on the emergency mechanism of major public events. China Saf. Prod. Sci. Technol. 2005, 1, 24–26. [Google Scholar]
- Chen, C.; Ren, A.Z. Optimization of fire station locations using computer. J. Tsinghua Univ. Nat. Sci. Ed. 2003, 43, 94–97. [Google Scholar] [CrossRef]
- Chen, H. Study on Optimization of the Spatial Distribution of Urban Fire Station; Tongji University: Shanghai, China, 2007. [Google Scholar]
- Feng, F.B. Study on Set Coverage Problem; Shandong University: Jinan, China, 2014. [Google Scholar]
- Badri, M.A.; Mortagy, A.K.; Alsayed, C.A. A multi-objective model for locating fire stations. Eur. J. Oper. Res. 1998, 110, 243–260. [Google Scholar] [CrossRef]
- Chen, T.; Zhao, X.F. Creating & application of facility location model. J. Nanjing Univ. Inf. Sci. Technol. Nat. Sci. Ed. 2010, 2, 211–215. [Google Scholar]
- Barr, R.C.; Caputo, A.P. Planning fire station locations. In Fire Protection Handbook; Cote, A.E., Ed.; National Fire Protection Association: Quincy, MA, USA, 1996; pp. 311–318. [Google Scholar]
- Yoshida, Y. Evaluating building fire safety through egress prediction: A standard application in Japan. Fire Technol. 1995, 31, 158–174. [Google Scholar] [CrossRef]
- Bukowski, R.W.; Clarke, F.B.; Hall, J.R.J.; Stiefel, W.S. Fire Risk Assessment Method: Description of Methodology; National Fire Protection Association: Quincy, MA, USA, 1999. [Google Scholar]
- Insurance Services Office. The Fire Suppression Schedule; ISO Press: New York, NY, USA, 1999. [Google Scholar]
- Zhang, Y.X.; Bian, Z.H. Initial probing the fire risks grades of Soozhou’s Old City Region. Fire Technol. Prod. Inf. 2003, 02, 10–12. [Google Scholar]
- Du, X.; Zhang, X.; Liu, T.Q.; Ma, Y.H. The current status and applying of city fire risk assessment technology in foreign country. Fire Sci. Technol. 2004, 23, 137–139. [Google Scholar] [CrossRef]
- Lian, D.J.; Dong, X.L.; Wu, L.Z. A summary of fire risk assessment of city area. Fire Sci. Technol. 2004, 23, 240–242. [Google Scholar] [CrossRef]
- Li, B.H. Research of Urban Fire Risk Assessment Based on Fuzz Information Optimization Method; University of Science and Technology of China: Hefei, China, 2010. [Google Scholar]
- Chen, G.L.; Hu, R.; Wei, G.Z. Study on comprehensive assessment index system of urban fire risk in Beijing City. China Saf. Sci. J. 2007, 17, 119–124. [Google Scholar] [CrossRef]
- Wu, X.T.; Wu, L.P. Evaluation of the Fire Emergency Rescue Capability in Urban Community. Procedia Eng. 2011, 11, 536–540. [Google Scholar] [CrossRef] [Green Version]
- Zhang, C.W.; Xia, C.H.; Zhong, S.B. GIS application framework of urban fire risk regionalization. Fire Sci. Technol. 2012, 31, 1233–1237. [Google Scholar] [CrossRef]
- Chevalier, P.; Thomas, I.; Geraets, D.; Goetghebeur, E.; Janssens, O.; Peeters, D.; Plastria, F. Locating fire stations: An integrated approach for Belgium. Socio Econ. Plan. Sci. 2012, 46, 173–182. [Google Scholar] [CrossRef] [Green Version]
- Chen, Z.F.; Chen, J.; Huang, C.F.; Tan, M.Y. Fire risk assessment index system for large-scale public places(II): Indexes and their weights. J. Nat. Disasters 2006, 15, 164–168. [Google Scholar] [CrossRef]
- Hu, C.P. Research on Regional Fire Risk Assessment and Flighting Rescue Strength Layout Optimization; Tongji University: Shanghai, China, 2006. [Google Scholar]
- Wang, D.B. Practice and Thought of the Applies of Fire Risk Evaluation to Fire Station Layout; Northeast Normal University: Changchun, China, 2009. [Google Scholar]
- Wang, Q.H.; Zhang, J.; Deng, J.; Zhu, H.Y. Optimization location of Fire Fighting stations based on fire risk assessment theory—A case study of Yaofeng town of Xia city in Shanxi province. J. Xi’an Univ. Sci. Technol. 2014, 34, 681–685. [Google Scholar]
- Xu, Z.B.; Zhou, L. Hierarchical coverage location model for fire station based on urban fire risk: A case study on urban area in Jinan. Geogr. Sci. Prog. 2018, 4, 87–98. [Google Scholar] [CrossRef]
- Zhibang, X.; Liang, Z.; Ting, L.; Zhonghui, W.; Li, S.; Rongwei, W. Spatial optimization of mega-city fire station distribution based on Point of Interest data: A case study within the 5th Ring Road in Beijing. Geogr. Sci. Prog. 2018, 37, 535–546. [Google Scholar] [CrossRef] [Green Version]
- Zhang, G. Urban fire risk evaluation and its application based on spatial analysis: A case study of Xi’an. City Plan. 2016, 40, 59–64. [Google Scholar] [CrossRef]
- Lin, J.X.; Jiang, X.; Zhu, J.G.; Cao, C.W.; Kong, Y. Application of GIS model in urban fire station layout planning. City Plan. 2018, 42, 65–70. [Google Scholar] [CrossRef]
- Wang, W.; Xu, Z.; Sun, D.; Lan, T. Spatial Optimization of Mega-City Fire Stations Based on Multi-Source Geospatial Data: A Case Study in Beijing. ISPRS Int. J. Geo Inf. 2021, 10, 282. [Google Scholar] [CrossRef]
- Li, X.; Claramunt, C.; Kung, H.-T.; Guo, Z.; Wu, J. A Decentralized and Continuity-Based Algorithm for Delineating Capacitated Shelters’ Service Areas. Environ. Plan. B Plan. Des. 2008, 35, 593–608. [Google Scholar] [CrossRef]
- Ni, J.; Wang, J.; Rui, Y.; Qian, T.; Wang, J. An Enhanced Variable Two-Step Floating Catchment Area Method for Measuring Spatial Accessibility to Residential Care Facilities in Nanjing. Int. J. Environ. Res. Public Health 2015, 12, 14490–14504. [Google Scholar] [CrossRef] [PubMed] [Green Version]
- Chen, Z.F.; Li, J.W.; Lu, F.X.; Li, Q. Optimizing location of fire stations and it’ s enlightenments for Xiongan New Area. China Saf. Prod. Sci. Technol. 2018, 14, 12–17. [Google Scholar] [CrossRef]
- Tao, Z.; Cheng, Y.; Dai, T.; Rosenberg, M.W. Spatial optimization of residential care facility locations in Beijing, China: Maximum equity in accessibility. Int. J. Health Geogr. 2014, 13, 33. [Google Scholar] [CrossRef] [Green Version]
- Xu, Q.; He, X.S. New fire station location problem based on AHP and set coverage model. Inf. Comput. 2019, 26–28. [Google Scholar]
- Wang, X.J. Research on Urban Fire Station Location Optimization Based on Key Factor Analysis–ShenZhen Scenarios; South China University of Technology: Guangzhou, China, 2013. [Google Scholar]
- Mao, K.; Chen, Y.; Wu, G.; Huang, J.; Yang, W.; Xia, Z. Measuring Spatial Accessibility of Urban Fire Services Using Historical Fire Incidents in Nanjing, China. ISPRS Int. J. Geo Inf. 2020, 9, 585. [Google Scholar] [CrossRef]
- Ming, J.; Richard, J.-P.P.; Zhu, J. A Facility Location and Allocation Model for Cooperative Fire Services. IEEE Access 2021, 9, 90908–90918. [Google Scholar] [CrossRef]
- Toregas, C.; Swain, R.; Revelle, C.; Bergman, L. The Location of Emergency Service Facilities. Oper. Res. 1971, 19, 1363–1373. [Google Scholar] [CrossRef]
- Friedrich, C.J.; Weber, A. Alfred Weber’s Theory of the Location of Industries; University of Chicago Press: Chicago, IL, USA, 1929. [Google Scholar]
- Church, R.; Revelle, C. The maximal covering location problem. Pap. Reg. Sci. Assoc. 1974, 32, 101–118. [Google Scholar] [CrossRef]
- Hakimi, S.L. Optimum Locations of Switching Centers and the Absolute Centers and Medians of a Graph. Oper. Res. 1964, 12, 450–459. [Google Scholar] [CrossRef]
- Hakimi, S.L. Optimum Distribution of Switching Centers in a Communication Network and Some Related Graph Theoretic Problems. Oper. Res. 1965, 13, 462–475. [Google Scholar] [CrossRef]
- Murray, A.T.; Tong, D.; Kim, K. Enhancing Classic Coverage Location Models. Int. Reg. Sci. Rev. 2009, 33, 115–133. [Google Scholar] [CrossRef]
- Ding, W.B.; Wang, J.P. Urban regional fire risk assessment with the method of BP neural network. J. Yunnan Univ. Nat. Sci. Ed. 2009, S2, 232–235. [Google Scholar]


| Administrative District | Fire Time | Fire Location | Fire Site | Cause of Fire |
|---|---|---|---|---|
| Yuhuatai District | 31 December 2015 16:12:00 | The fourth block of Langshilv | Others | Unknown |
| Jianye District | 31 December 2015 14:50:00 | The Eighth Bureau of Construction, Youth Olympic Village, Jianye District | Waste | Other-residual fire |
| Yuhuatai District | 31 December 2015 13:53:00 | Jindi Free City reed marshes | Others | Unknown |
| Xuanwu District | 31 December 2015 12:30:00 | East of Jiming Temple, Xuanwu District | Others | Electrical fire-electrical circuit failure-other |
| Yuhuatai District | 31 December 2015 08:55:00 | Old glass factory next to Oasis Machinery Factory | Others | Unknown |
| Gulou District | 31 December 2015 03:03:00 | North Gate of Workers’ New Village, Gulou District | Others | Electrical fire-electrical circuit failure-other |
| Gulou District | 30 December 2015 21:48:00 | 1st Floor, No.49 Yucai Apartment, Gulou District | Residence | Electrical fire-electrical circuit failure-other |
| Gulou District | 30 December 2015 16:48:00 | Room 101, Unit 7, Building 16, Xinyi Village, Jinling Community, Gulou District | Residence | Electrical fire-electrical circuit failure-other |
| Underlying Fire Risk Ranking | ||
|---|---|---|
| Risk Factor | Evaluation Factors | Weight |
| Fire outbreak probability | Historic fire outbreak frequency | 0.14 |
| Population density | 0.15 | |
| Fire hazardous source | Gas pipe networks | 0.24 |
| Hazardous chemical substances | 0.14 | |
| Regional disaster resistance | Underground space distribution | 0.12 |
| High-rise building distribution | 0.17 | |
Publisher’s Note: MDPI stays neutral with regard to jurisdictional claims in published maps and institutional affiliations. |
© 2021 by the authors. Licensee MDPI, Basel, Switzerland. This article is an open access article distributed under the terms and conditions of the Creative Commons Attribution (CC BY) license (https://creativecommons.org/licenses/by/4.0/).
Share and Cite
Han, B.; Hu, M.; Zheng, J.; Tang, T. Site Selection of Fire Stations in Large Cities Based on Actual Spatiotemporal Demands: A Case Study of Nanjing City. ISPRS Int. J. Geo-Inf. 2021, 10, 542. https://0-doi-org.brum.beds.ac.uk/10.3390/ijgi10080542
Han B, Hu M, Zheng J, Tang T. Site Selection of Fire Stations in Large Cities Based on Actual Spatiotemporal Demands: A Case Study of Nanjing City. ISPRS International Journal of Geo-Information. 2021; 10(8):542. https://0-doi-org.brum.beds.ac.uk/10.3390/ijgi10080542
Chicago/Turabian StyleHan, Bing, Mingxing Hu, Jiemin Zheng, and Tan Tang. 2021. "Site Selection of Fire Stations in Large Cities Based on Actual Spatiotemporal Demands: A Case Study of Nanjing City" ISPRS International Journal of Geo-Information 10, no. 8: 542. https://0-doi-org.brum.beds.ac.uk/10.3390/ijgi10080542