Article

Semantic Enhancement of Human Urban Activity Chain Construction Using Mobile Phone Signaling Data

1
Key Laboratory of Virtual Geographic Environment, Ministry of Education, Nanjing Normal University, Nanjing 210023, China
2
State Key Laboratory Cultivation Base of Geographical Environment Evolution, Nanjing 210023, China
3
Jiangsu Center for Collaborative Innovation in Geographical Information Resource Development and Application, Nanjing 210023, China
*
Author to whom correspondence should be addressed.
ISPRS Int. J. Geo-Inf. 2021, 10(8), 545; https://0-doi-org.brum.beds.ac.uk/10.3390/ijgi10080545
Submission received: 18 June 2021 / Revised: 10 August 2021 / Accepted: 10 August 2021 / Published: 13 August 2021

Abstract

:
Data-driven urban human activity mining has become a hot topic of urban dynamic modeling and analysis. Semantic activity chain modeling with activity purpose provides scientific methodological support for the analysis and decision-making of human behavior, urban planning, traffic management, green sustainable development, etc. However, the spatial and temporal uncertainty of the ubiquitous mobile sensing data brings a huge challenge for modeling and analyzing human activities. Existing approaches for modeling and identifying human activities based on massive social sensing data rely on a large number of valid supervised samples or limited prior knowledge. This paper proposes an effective methodology for building human activity chains based on mobile phone signaling data and labeling activity purpose semantics to analyze human activity patterns, spatiotemporal behavior, and urban dynamics. We fully verified the effectiveness and accuracy of the proposed method in human daily activity process construction and activity purpose identification through accuracy comparison and spatial-temporal distribution exploration. This study further confirms the possibility of using big data to observe urban human spatiotemporal behavior.

1. Introduction

Urban human mobility modeling is the prerequisite for traffic demand modeling [1], tourist behavior analysis [2,3], functional urban structure exploration [4,5], spatial allocation of service facilities [6], etc. With the rapid development of ICT (Information and Communication Technology), the emergence of massive, passive, and positive human tracking data makes it possible to model and analyze urban activities [7,8]. Data-driven analysis of human activities and urban dynamics has become a hot topic in academia [9,10,11,12]. However, related studies mostly assess the distribution of human activity intensity without distinguishing the content of human activities, which greatly reduces the understanding of human behaviors and urban dynamics. Furthermore, it also weakened its ability to support urban planning, travel needs, and public resource allocation. This paper aims to propose an effective technique to build human activity chains with massive urban sensing data.
In recent years, various positive and passive human footprints have been organized to uncover human movement patterns within the city [13,14,15,16,17]. Travel surveys and geotagged social media data (geotagged tweets or social media check-in data) are typically used to characterize tourist flow [18], detect events [19], model traffic demands [20,21,22], and explore human mobility patterns [23]. Although these data provide activity purposes and precise locations, the population bias [24] and sparse sample [25] constrains its reliability in modeling continuous, large-scale human activities. Mobile phone signaling (MPS) data has gradually been recognized as a promising data source for estimating the population’s spatial distribution [26,27,28], monitoring urban dynamics [29,30,31,32], and understanding human behaviors [33,34,35]. Though MPS data do not provide the spatiotemporal precise personal traces as traditional travel survey data or geotagged social media data do, it can be obtained at a much lower cost and on a greater scale [36]. Related literature coincidentally uses mobile phone location data to build activity-based trips [37,38,39]. Scholars generally agree that the spatial-temporal uncertainty of mobile phone location becomes a big challenge for inferring the types of human activities (e.g., home, work, shopping, etc.).
So far, researchers have proposed two types of approaches to implement MPS data-based activities inference: prior knowledge rules-based methods and machine learning related algorithms, respectively.
Usually, people’s destination choices are closely related to the types/purpose of activities. Therefore, semantically rich geospatial data provide a direct basis for activity type inference. Several studies have examined the characteristics of home-centered urban mobility patterns based on where people most often visit [36]. Another part of the study inferred the possible purpose of human activities based on the land-use status [37,40]. However, such studies ignore the diverse complexity and spatiotemporal dynamics of human activities, limiting the value of the method for generalization.
The development of machine learning techniques has produced a large number of excellent classification models. More and more researchers use machine learning classification algorithms to infer urban activity types [41]. Depending on whether they need a given training sample, the relevant methods include supervised learning-based and unsupervised learning-based activity inference.
The supervised learning-based activity inference method [42,43] uses many spatiotemporal stays with activity annotations as supervised samples to infer activity types for mobile phone users. For example, Tu et al. (2017) proposed a hidden Markov activity type recognition model by combining the social media check-in data and mobile phone data [43]. Based on the learned knowledge of human social activities as supervision, their work inferred seven types of activities, including In-home, Working, Shopping, Transportation, Schooling, Recreation, and Entertainment. However, it is difficult to obtain such effective supervision samples, and the quality of social media data is often difficult to control.
Unsupervised learning-based activity inference method [38,44] infer the types of human activities based on statistical probability, e.g., a round-trip in the same place in a day is considered a home activity with high probability. Widhalm et al. (2015) used Probability Graphical Models (PGM) to cluster activities by modeling the dependencies between activity type, arrival time, duration of stays, and land use types via a Relational Markov Network (RMNs) [38]. Essentially, they tried to construct a joint posterior distribution of land use characteristics and human activity types to implement urban activity types labeling and inferring. Since the potential functions of RMNs need to be defined manually, their ability to characterize complex human spatiotemporal behavior is greatly reduced. Besides, due to the high spatiotemporal complexity of the association patterns between the stay objects, the posterior distribution of these activity labels is difficult to converge.
Aiming at the shortcomings of the above urban activity type recognition methods, we define an individual daily activity chains model and propose an effective method to construct user activity chains by annotating their activity purposes semantically, based on semi-supervised learning. The advantage of this method includes: (1) it does not need to collect a large number of supervised learning samples as input for classification; (2) it can achieve high type inference accuracy supported by easily accessible data. The technique could provide reliable data models and methodologies for human movement pattern mining, urban crowd spatiotemporal hotspot detection, dynamic urban monitoring, etc. In turn, it provides decision support for smart city management and services such as traffic demand analysis, travel behavior analysis, and service resource allocation.
We use the MPS data of a communication operator in Nanjing from April 1 to 14 as the experimental data source to verify the proposed urban activity chain and type inference method. This paper realizes the inference of seven urban activity types: Home, Work, Shopping and Catering, Leisure and recreation, Medical, Sports and Others. The classification of these activity types regards the travel purpose classification of urban travel survey. Since the real activity types of mobile phone users are not available, we verify the superiority and reliability of this method in two aspects: (1) to explore the advantages in activity recognition accuracy by comparing with the methods of RMNs-based model; (2) to analyze the spatial and temporal characteristics of human activities obtained in this paper against the real urban land use status and universal pattern of human activity behavior.

2. Methodology

Our tasks of this method are to build user’s daily trips based on MPS data and infer the type of activity for each stay during trips. Before elaborating on the detailed methodology, it is necessary to give some essential definitions.
Definition 1.
Urban activities are activities that people do in a specific spatiotemporal context within the urban scene, such as working, fitness, school, etc. It contains both the time and place where the activity takes place as well as the subject and category information of the activity.
At present, the classification of urban activities has not formed a unified standard. Different studies of activity-based human mobility patterns using MPS data also vary in their classification of activity types [36,43,44]. The spatiotemporal uncertainty of mobile phone location data makes it difficult to distinguish between types of urban activities finely. Regarding urban residents’ travel questionnaire survey [45,46] and activity classification of related studies, this paper classifies urban activity types into seven categories: Medical, Shopping and catering, Home, Work, Leisure and recreation, Sports, and Others. The specific activity contents of each activity category are shown in Table A1.
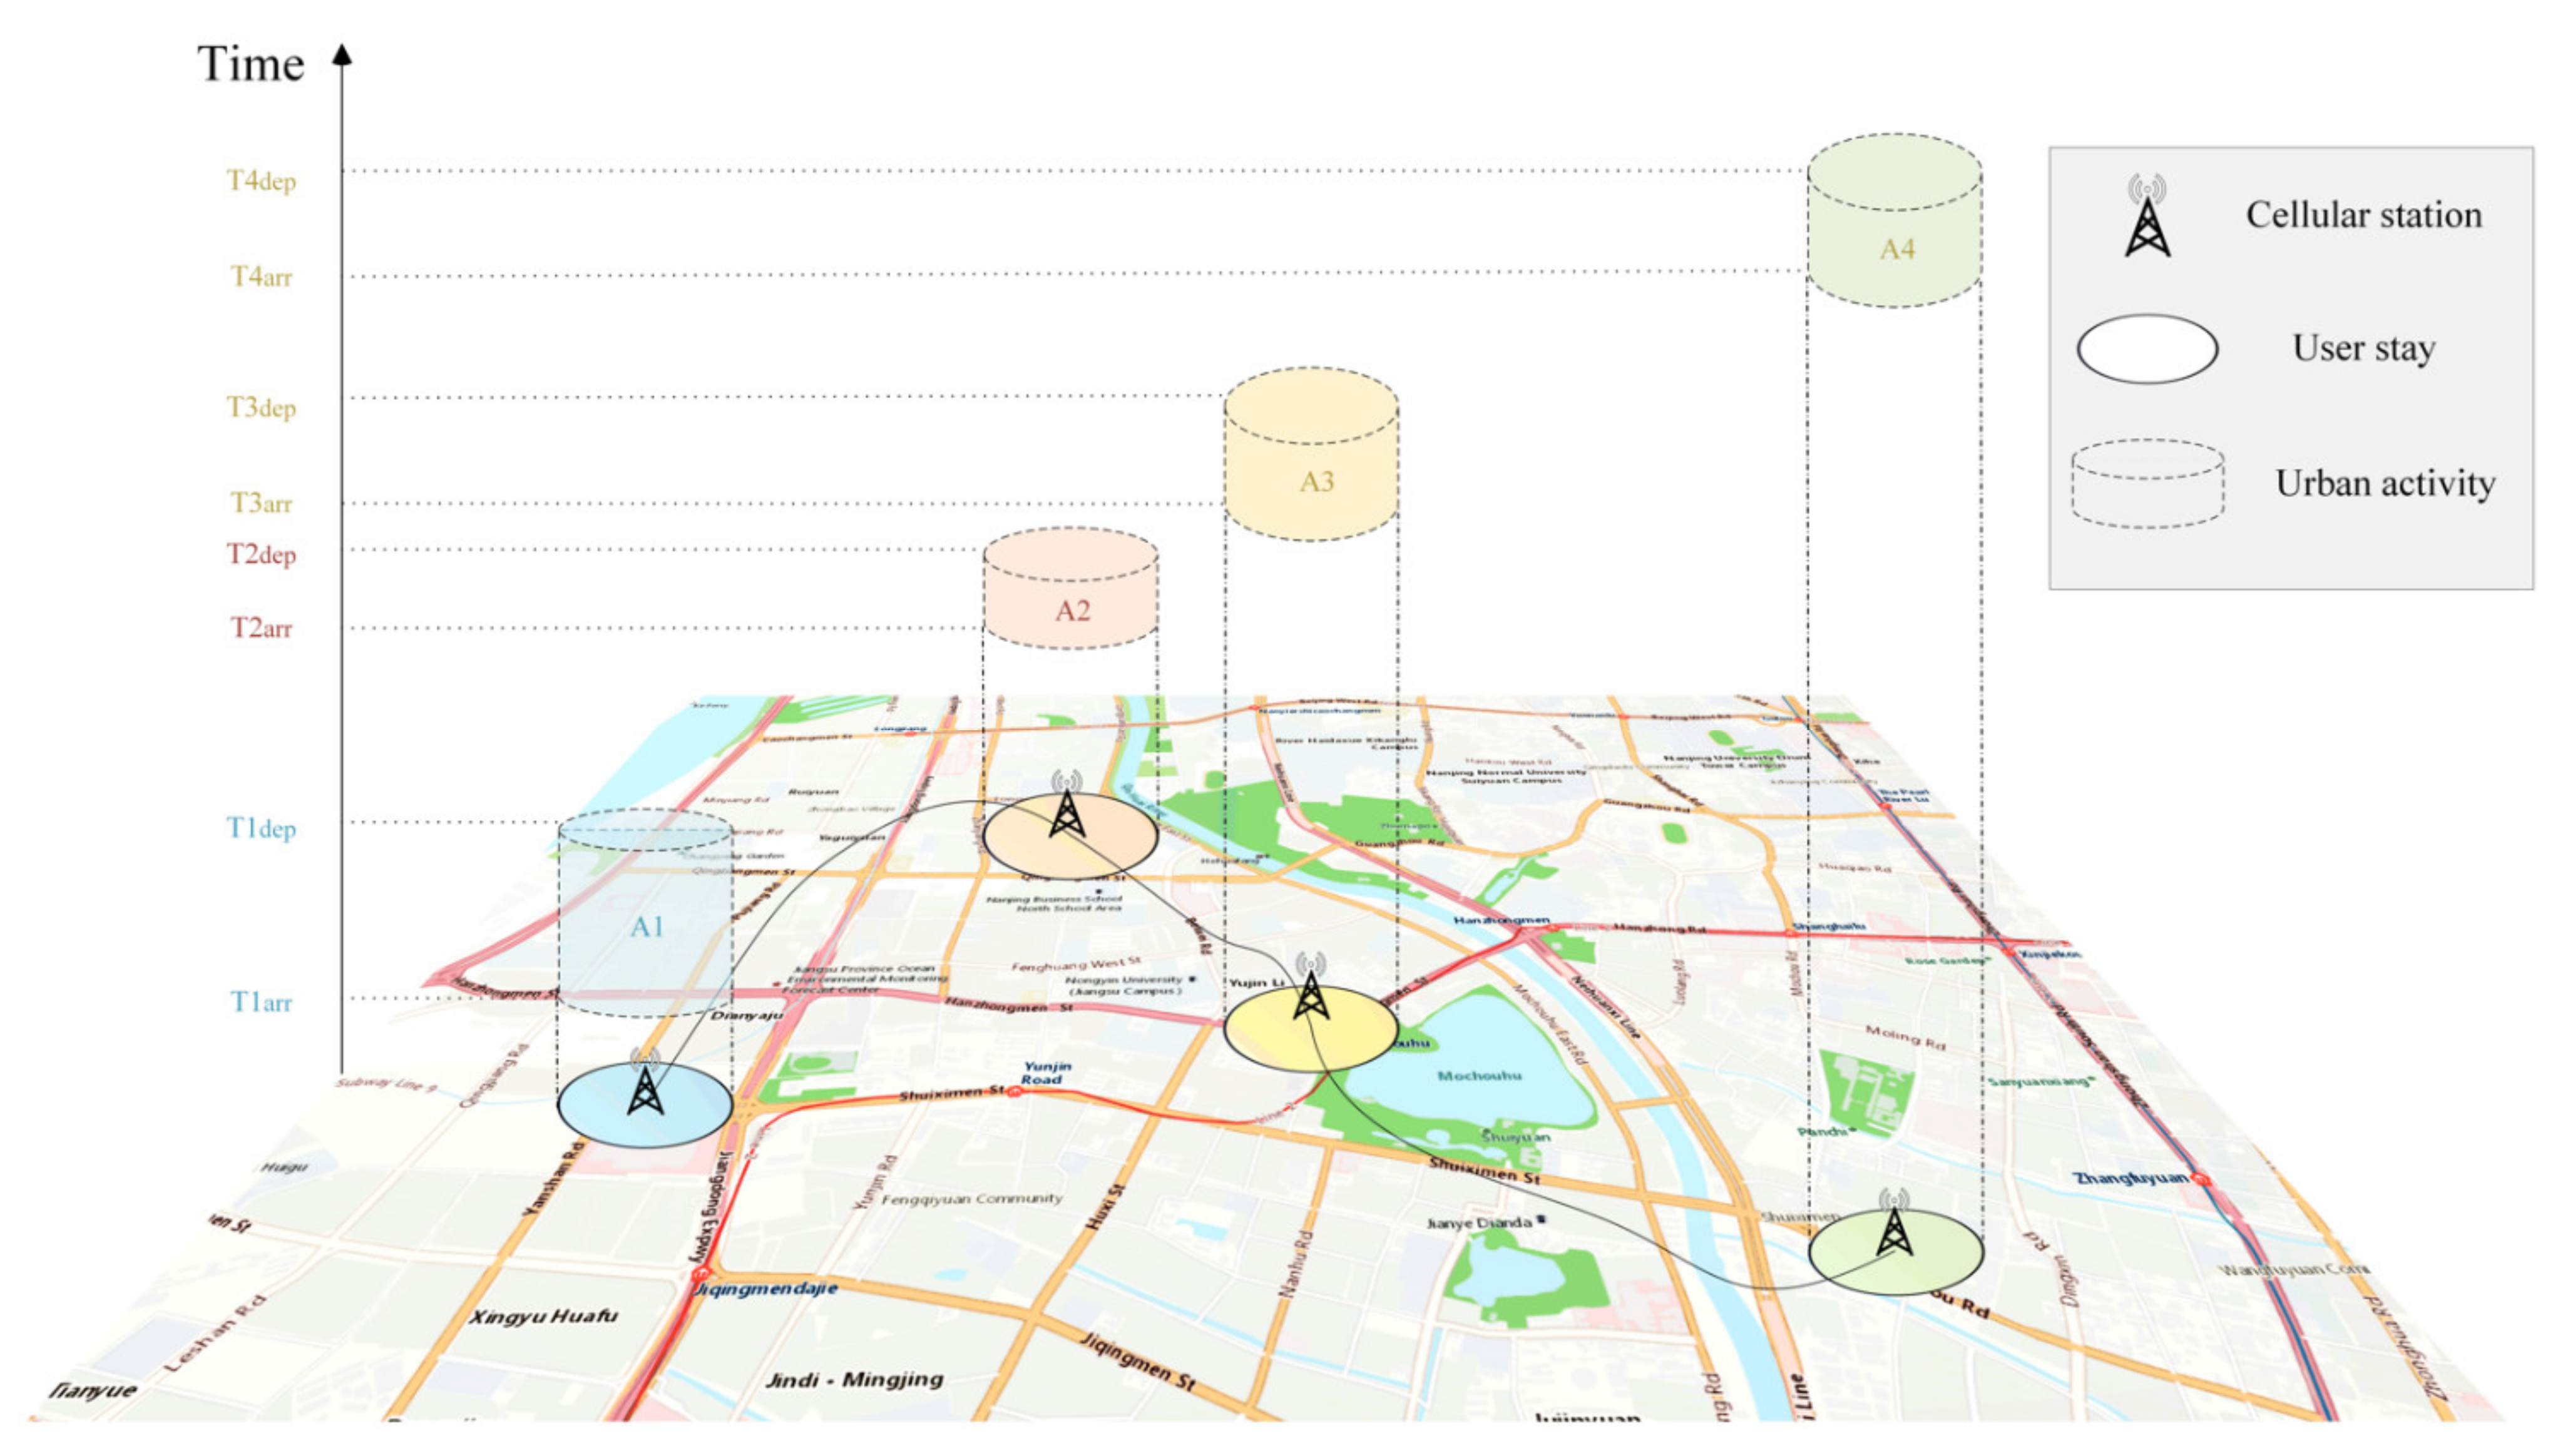
Definition 2.
The daily activity semantic stay chain is an activity-based chain that portrays urban user mobility with labeled activity purposes. It is a chronological group of user stays, as shown in Figure 1. A stay is composed of the location, start and end time, and the purpose of the stay (type of activity).

2.1. Recognition of Stay and Construction of User Daily Activity Semantic Stay Chain

The MPS data continuously and uninterruptedly records the moments and base stations of communication activities such as user calls, sending and receiving SMS, accessing the Internet, switching base stations, and periodic reporting in standby (usually reporting every half an hour). Compared with GPS and travel survey data, the spatial measurement accuracy and the temporal sampling rate of MPS data are low [39]. Ulm, Widhalm, and Brandle (2015) analyzed the spatial distribution of errors in the cellular positioning method by comparing cellular positioning data with collected GPS location data [47]. They found that the median of antenna positioning inaccuracy in Vienna was 507.6 m. Moreover, the density of the base station is positively correlated with the positioning inaccuracy. The Voronoi polygons take the urban ground as a homogeneous surface, and that is not a desirable method for base stations’ coverage areas acquisition. Considering the spatiotemporal uncertainty characteristics of the cellular location, we propose the following steps to construct a personal daily activity chain by combing the research mentioned above on cellular positioning errors.
(1) In chronological order, original signaling records of successive same cell ID are merged into user stays to construct an initial user daily activity chain. This data can be described as:
T r a c k = L i s t i   =   u i d ,   C 1 , C 2 , , C n   ,
C i   =   C e l l i , A r r T i m e i , D e p T i m e i , S t a y T i m e i ,
in which, T r a c k represents the user’s daily activity chain, and u i d is a unique identity. A stay C i consists of base station ID, arrival time, departure time, and duration of stay.
(2) Due to the spatial uncertainty of cellular positioning, we create a buffer of a certain size for each base station, which is called “potential active area”. The size of the “potential active area” varies with the density of the base stations. Furthermore, the initial activity chain of step (1) is transformed into “user daily activity region chain”:
T r a c k   =   R 1 , R 2 , , R n .
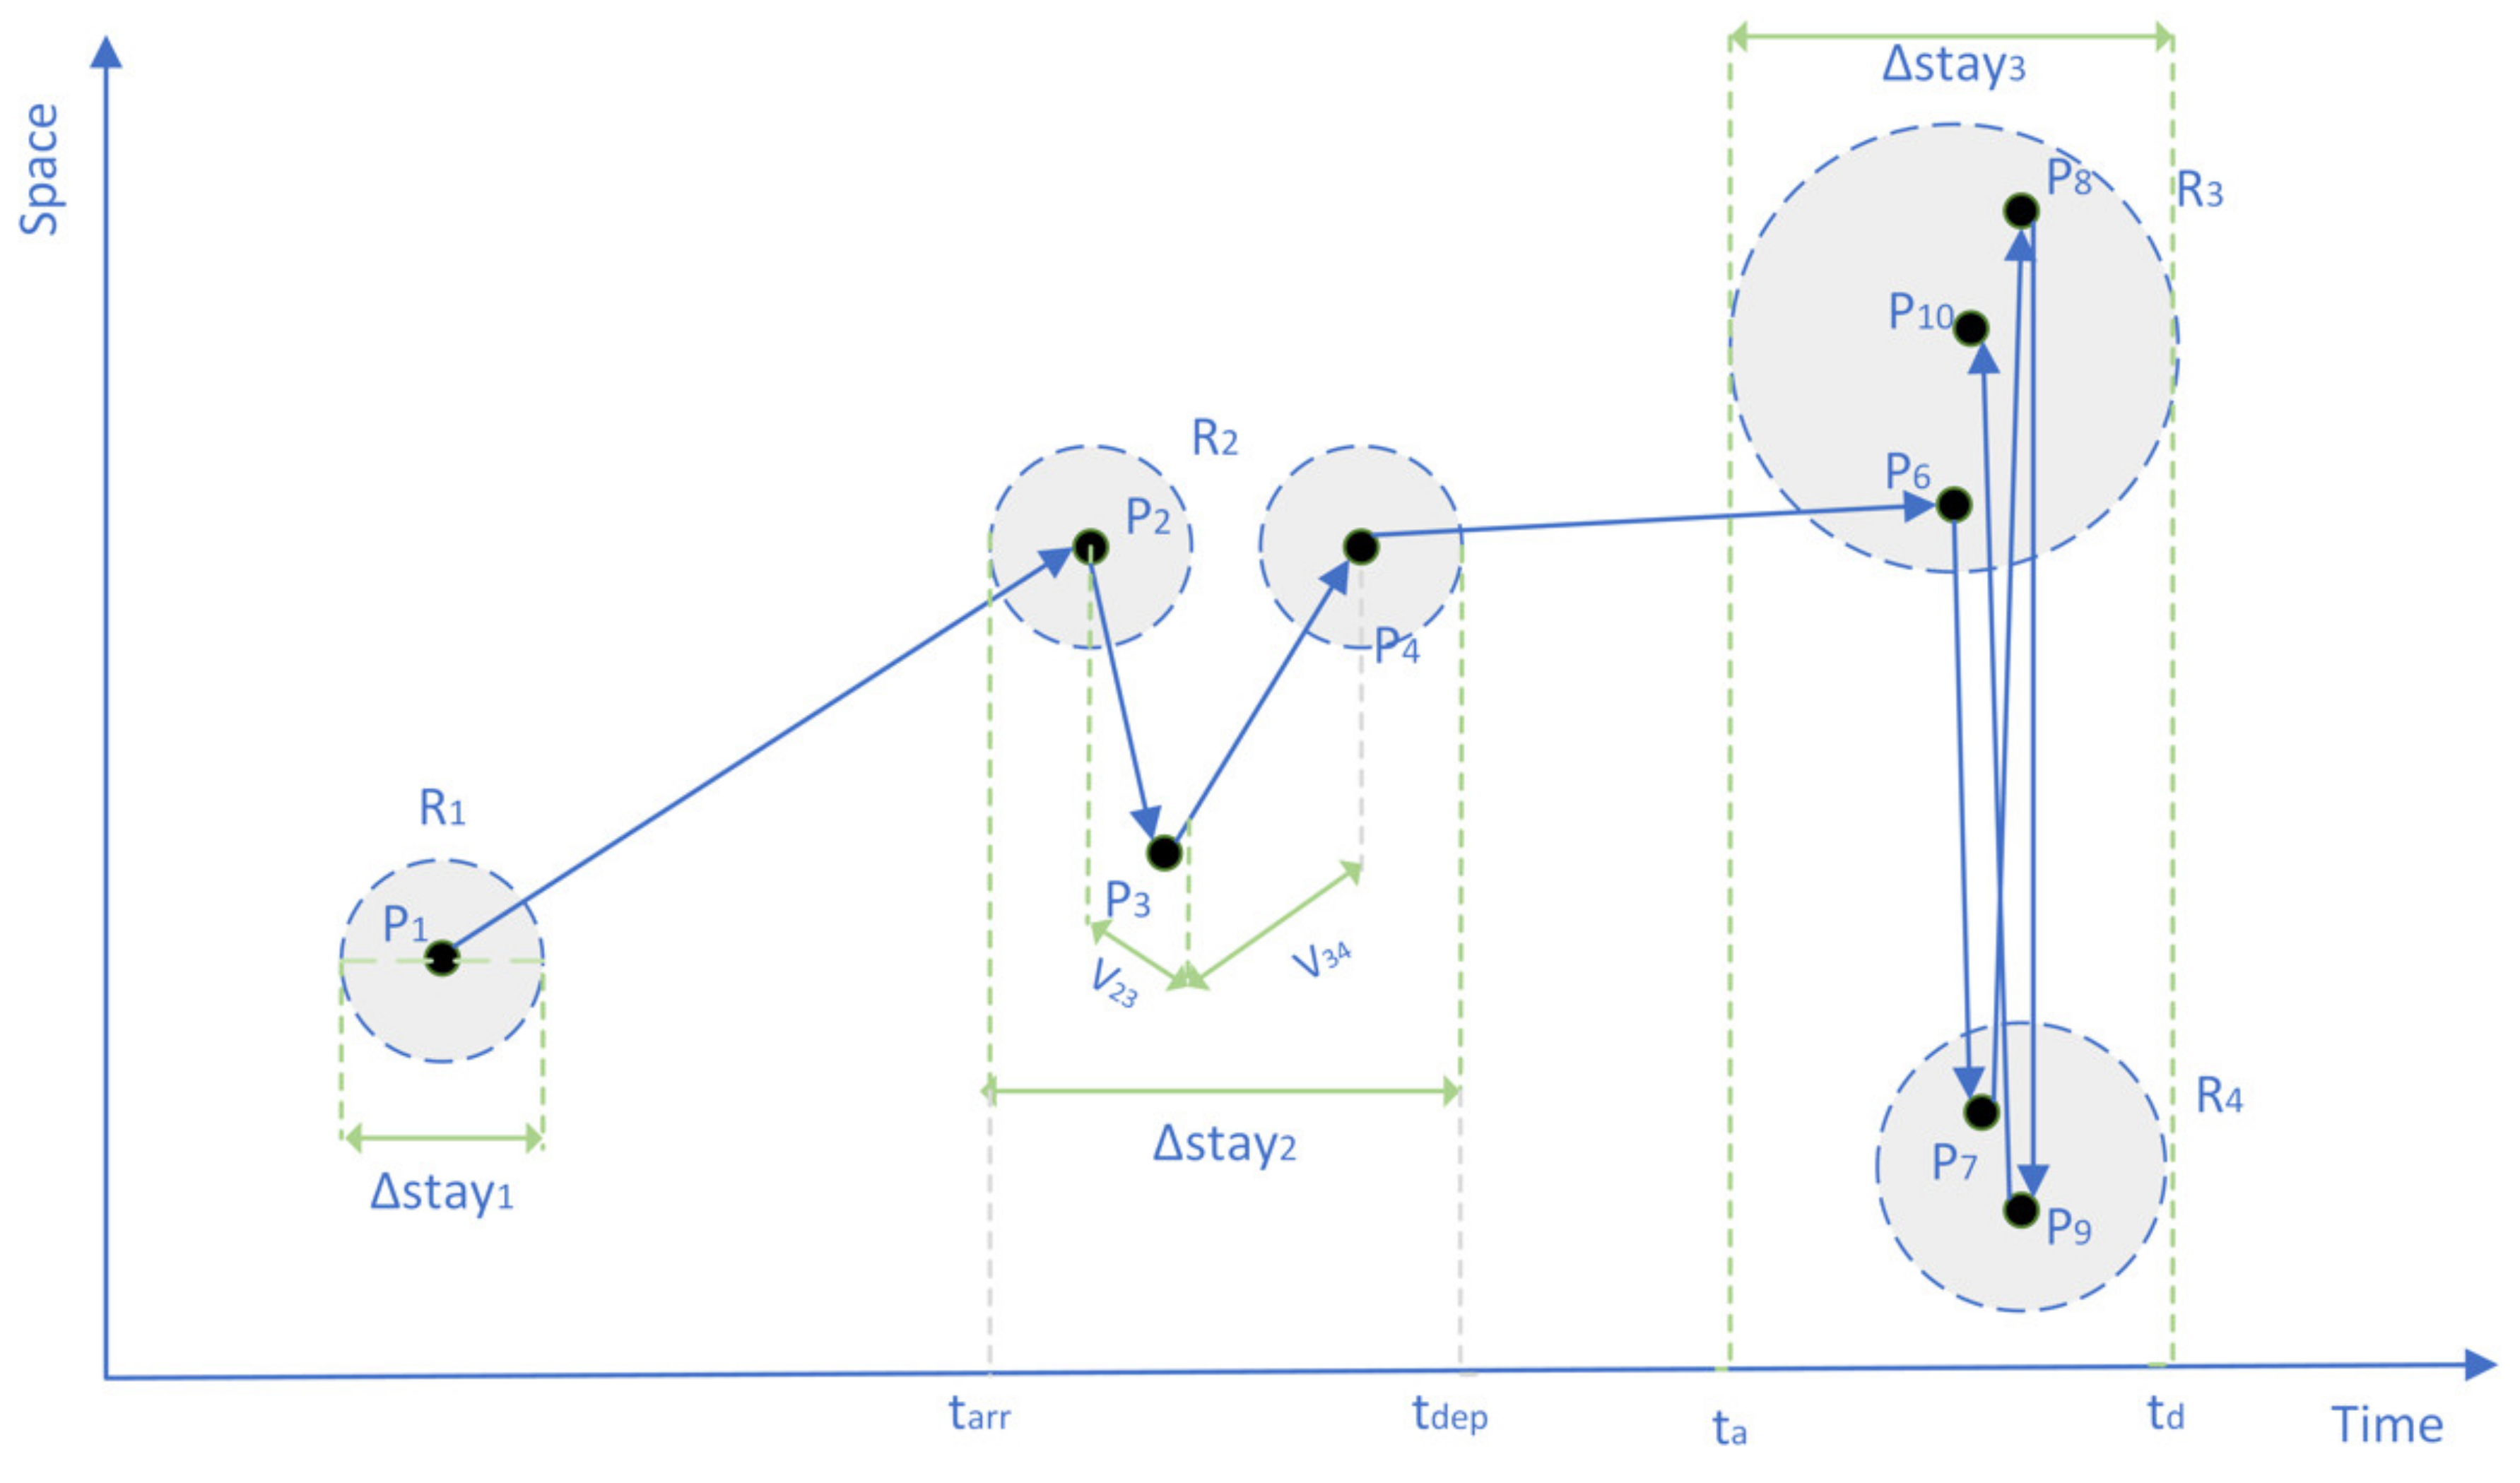
(3) Cell phone signal propagation is often affected by the physical environment, dynamic load balancing, and other factors. The MPS data will suddenly jump to a remote base station and then turn back in a short time. This is called “drift data” [48]. Besides, mobile phone location data can also swing back and forth in two or more adjacent areas, which is called the “ping-pong” effect [49].
As shown in Figure 2, P 2 ~ P 4 show the drift phenomenon, and P 3 is the drift point. Speed from P 2 to P 3 and P 3 to P 4 is faster than normal human walking speed ( v n o r m a l ), thus the activities between P 2 ~ P 4 are combined into one stay R 2 , the time of arrival is t a r r , the time of departure is t d e p , the duration of stay is Δ s t a y 2 . P 6 ~ P 10 show the “ping-pong switch” phenomenon. The user jumps back and forth between multiple base stations in adjacent locations, which takes a very short time. The speed of movement is much higher than v n o r m a l , therefore the region R 3 with more occurrence times of dots will be regarded as the potential active area, and the duration of stay is Δ s t a y 3 . When the number of occurrences is the same, the possible active area could be randomly selected.
(4) The recursive look-ahead filter method, which achieved the best performance compared to the recursive naïve filter and Kalman filter [50], combined with low-pass filtering, is used to filter users’ outliers. Calculate the user’s movement speed v m o v e based on the distance between adjacent stops ( R b e f o r e , R a f t e r ) and the travel time. If the speed does not exceed v n o r m a l , the user is considered to have a visit in the zone, and the two stops are combined into one stay. Otherwise, R b e f o r e is identified as the crossing point and is removed from the activity region chain.

2.2. Annotating Home and Work Activities for Different User Groups

In probabilistic inference based on Graph Neural Networks, providing the labels of some nodes as known information helps improve the prediction accuracy of network learning [51]. Home and work are the most important two activities in people’s daily urban life [35,52], and they have a strong regularity. This paper realizes the identification of Home and Work activities by constructing knowledge rules. Labeling some nodes in the user’s daily activity chain with Home or Work can reduce the uncertainty of activity type inference and support building a semi-supervised activity type inference model.
The behavior of different groups varies widely. We divide the urban population into locals and visitors and then identify their homes and work separately. Locals generally live in residential areas or dormitories, while visitors tend to live in hotels. Locals typically have a relatively fixed place of work, whereas visitors do not. Therefore, this study proposes the following rules to recognize Home and Work, taking into account the behavioral differences for different groups (which has not been considered in the existing literature):
(1) User group segmentation. Benefitting from the long-term observation of MPS data, we use the number of days people appeared in the same city during two weeks as the basis for user group segmentation. The total number of days of appearance ( d a y ) and the average total duration per day ( t i m e ) are used as parameters for the determination. It is considered that the users whose days exceed d a y and daily activity duration exceeds t i m e are residents. Otherwise, they are visitors.
(2) Home (H) and Work (W) recognition. Based on population division, this paper makes the following strategies to detect people’s homes and workplaces to distinguish family and work activities.
  • The total length of stay in each activity region during the daytime (09:00~17:00) and late-night (00:00~07:00) for each person were counted, respectively.
  • Places with the longest cumulative duration of stay are identified as locals’ workplaces or residences.
  • The surrounding land is used to determine the above places’ activity type with the longest cumulative stay (refer to Table A2). If the main land use in the area is residential, it is determined to be the user’s home location. Otherwise, it is the user’s workplace.
  • Places with the longest cumulative duration of stay are identified as visitors’ residences (hotels or friends’ residences).
  • Label the user’s daily activity chain with the corresponding activity type for stays occurring at home and workplace. Due to the existence of night shift or no workgroups, all possible combinations of day and night activity types are limited to “H-W”, “W-H”, or “H-H”.

2.3. Urban Activity Inference Model (UAIM) for Annotating Urban Activities

Type labeling of mobile phone activity chains using machine learning algorithms has gained wide acceptance for its higher scientific validity and accuracy than methods that rely only on prior knowledge [38,41,43,44]. Many supervised and unsupervised learning methods, such as support vector machines, decision trees, hidden Markov network models, are applied to annotate MPS data with activity types. The supervised learning methods require long-term individual tracking data as the basis for probabilistic inference. The unsupervised learning approach requires manual construction of relational functions and cannot express complex characteristics of human activities. This paper uses a semi-supervised learning technique to annotate urban activities.
GMNN (Graph Markov Neural Networks) model is a deep learning model that combines advantages of statistical relational learning (SRL) and graph neural network (GNN). It learns the network nodes’ characteristics through GNN and simultaneously models the conditional distribution between node labels to implement object classification [53]. It is a graph relational dataset classification algorithm with high recognition accuracy from comparison results on public datasets such as Cora and Citeseer.
Urban activities tend to follow certain rules, and most revolve around the family-centered diet and living and the work-centered business office. There is a potential connection between each stay. For example, people usually choose to go home after work in the evening, go home after eating, or shopping outside. Thus, we use this widespread potential association of human spatiotemporal movement behavior (activity transfer) to construct graph datasets. Combined with the annotation of Home and Work in the activity chain in 
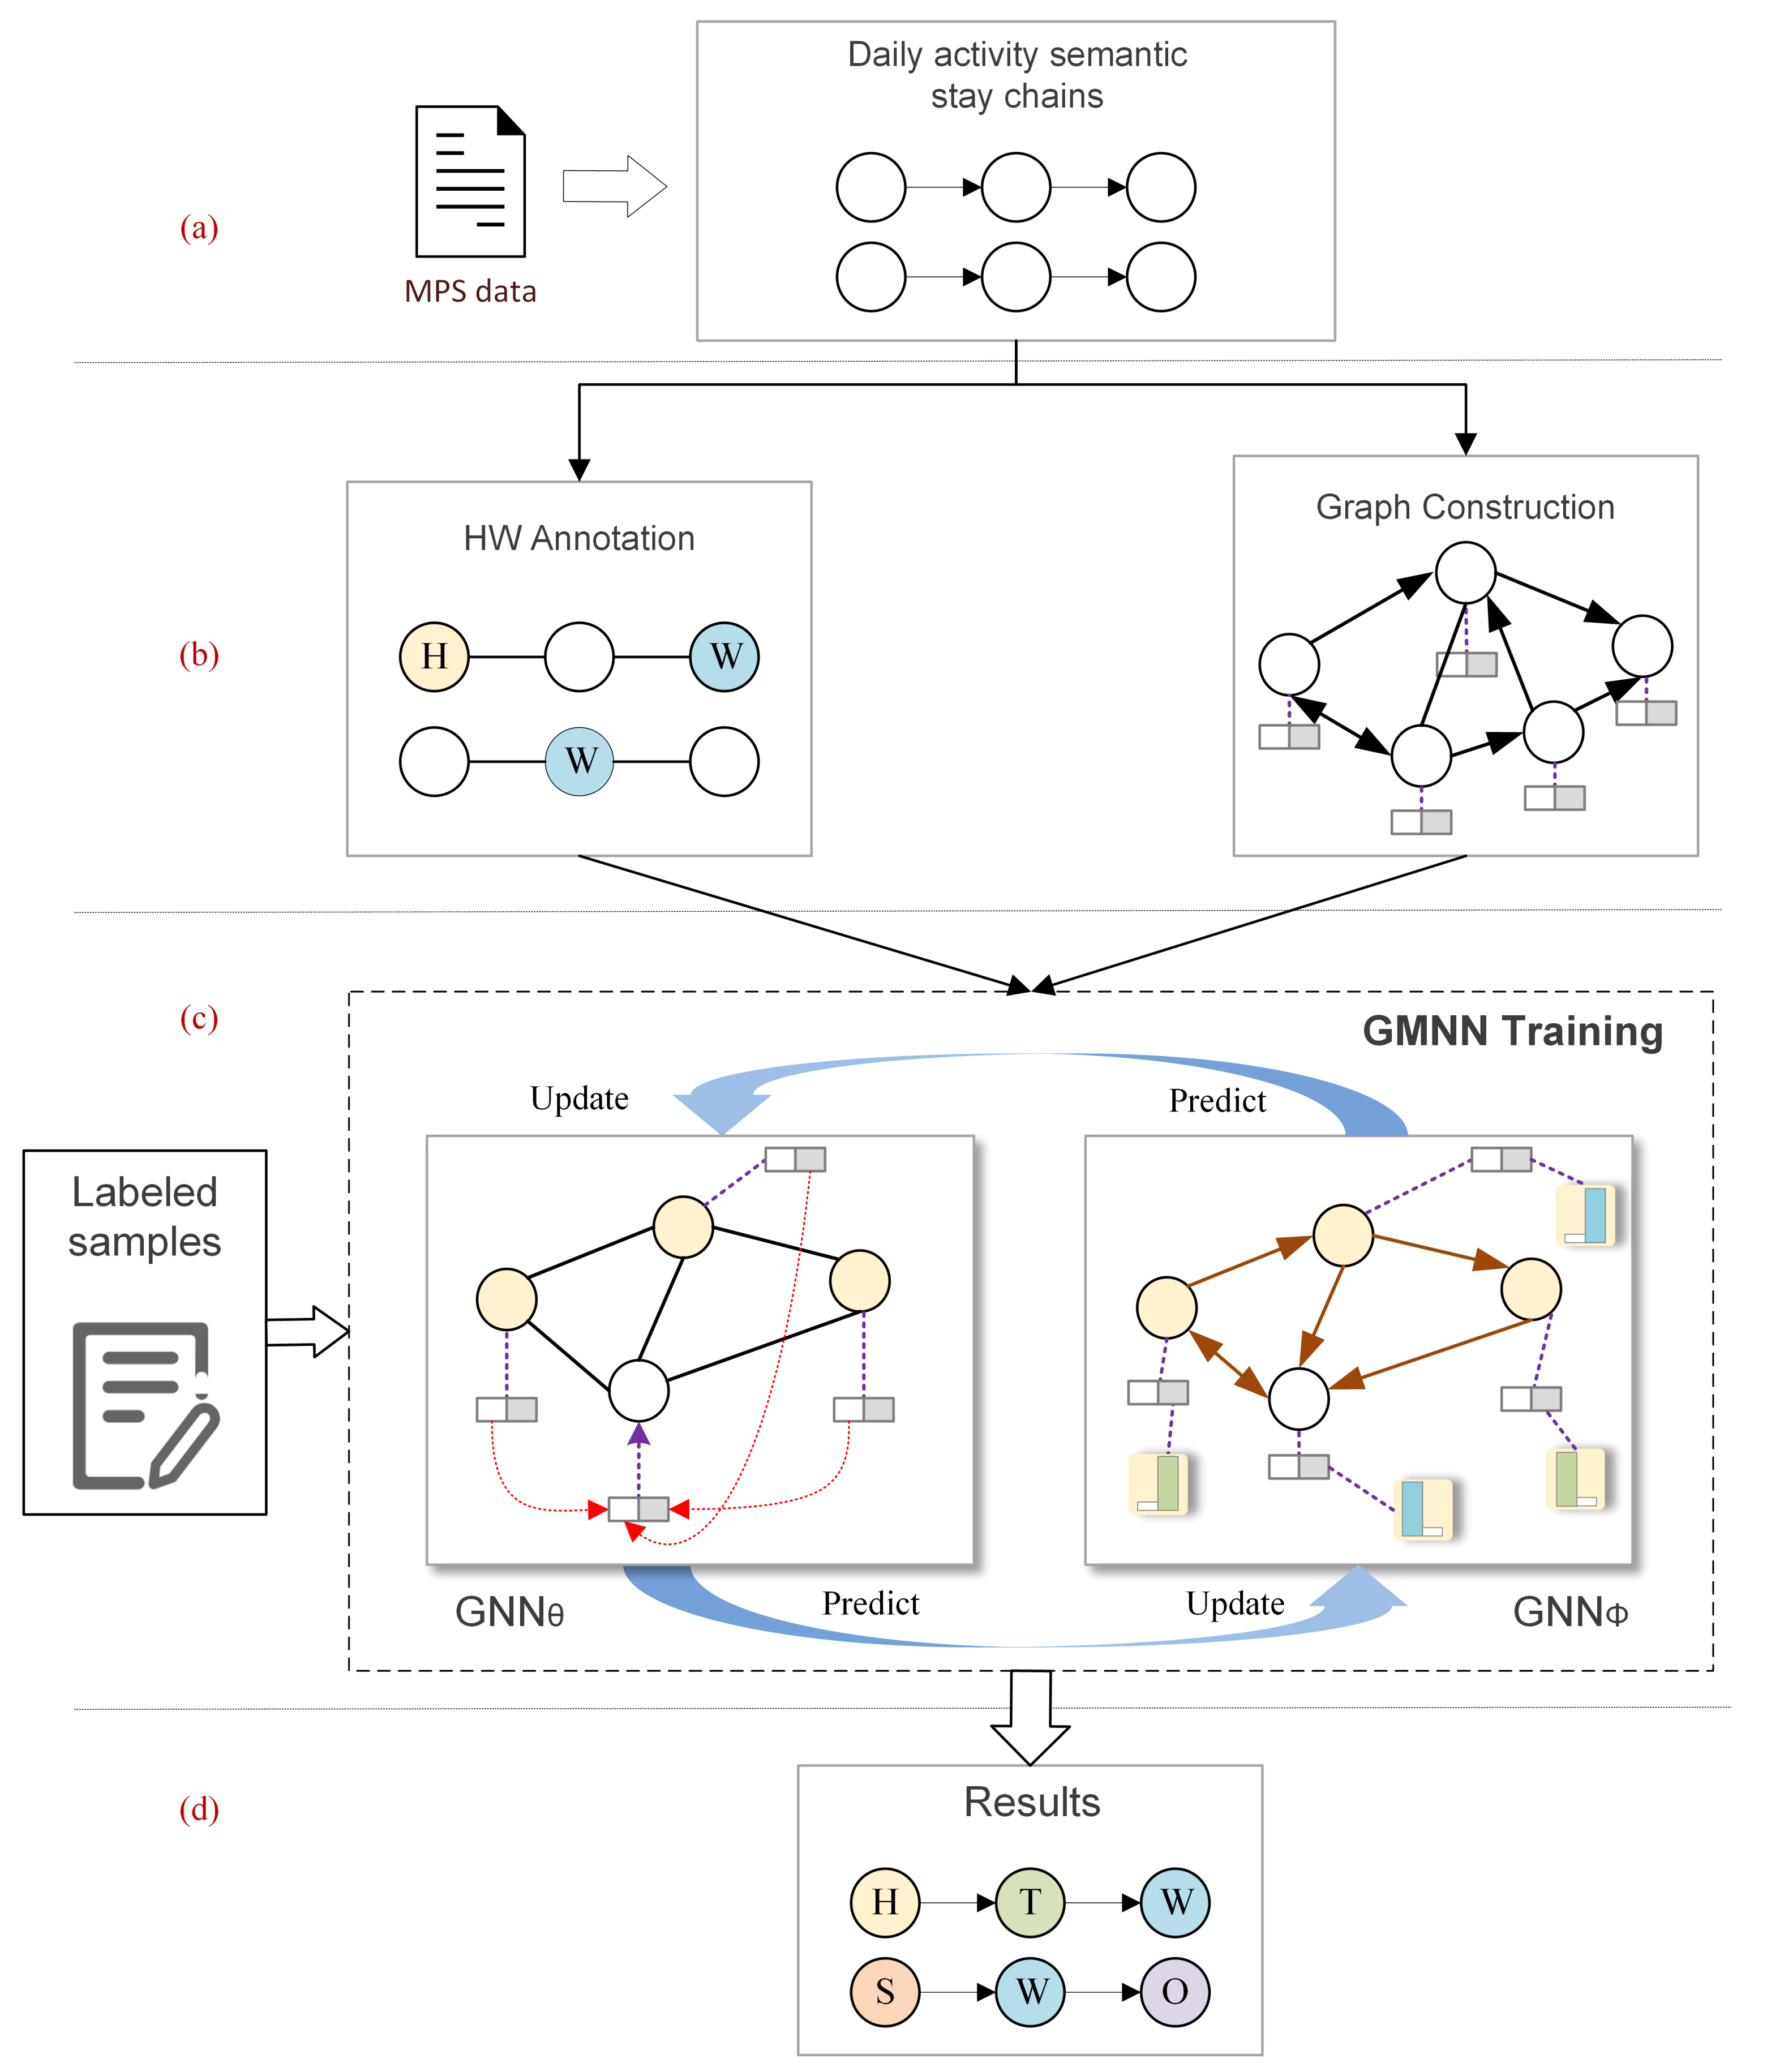
Section 2.2, we propose a semi-supervised learning framework based on GMNN to classify the unlabeled types of stays in the user’s daily activity chain. The framework of the Urban Activity Inference Model (UAIM) is shown in Figure 3.
Since the relationship pattern between activity stays is very complex, the GMNN model realizes the fusion of feature learning and statistical relationship learning by constructing two GNN models. It introduces alternate training for two GCN models to approximate the target distribution, and here the two GNNs are denoted as p   ( GNN ) and q θ   ( GNN θ ). On the one hand, taking the attributes of network nodes and their neighbor nodes as input constructs a q θ y U | x V model can be used to learn abstract features of user stays and predict the urban activity type of each node. On the other hand, taking the node labels predicted in q θ as input, builds a p ( y U | y L , x V ) model to model the correlation between node labels and constructs their joint posterior distribution. GMNN makes the probability distribution obtained from p approximate to the distribution q θ as much as possible, prompting the two models to constrain each other and accelerate model convergence. This model uses the pseudo-likelihood variational inference EM algorithm to achieve the above mutual approximation process.
Below, we describe how to construct the graph and the feature vectors of nodes (user stays) based on daily human activity stay chains. In addition, to efficiently build the posterior distribution among activity features, network relationships, and node labels, it needs to label some nodes for semi-supervised learning manually.
(1) Graph construction
In graph neural networks, the graph connection of common social networks and paper citation networks can be directly built based on the data’s subscription and citation relationships. These relationships represent the potential consistency of interest, topic, and field [54]. However, for human activities, this connection is more abstract. The following rules are proposed to construct the network graph for activity nodes (user stays):
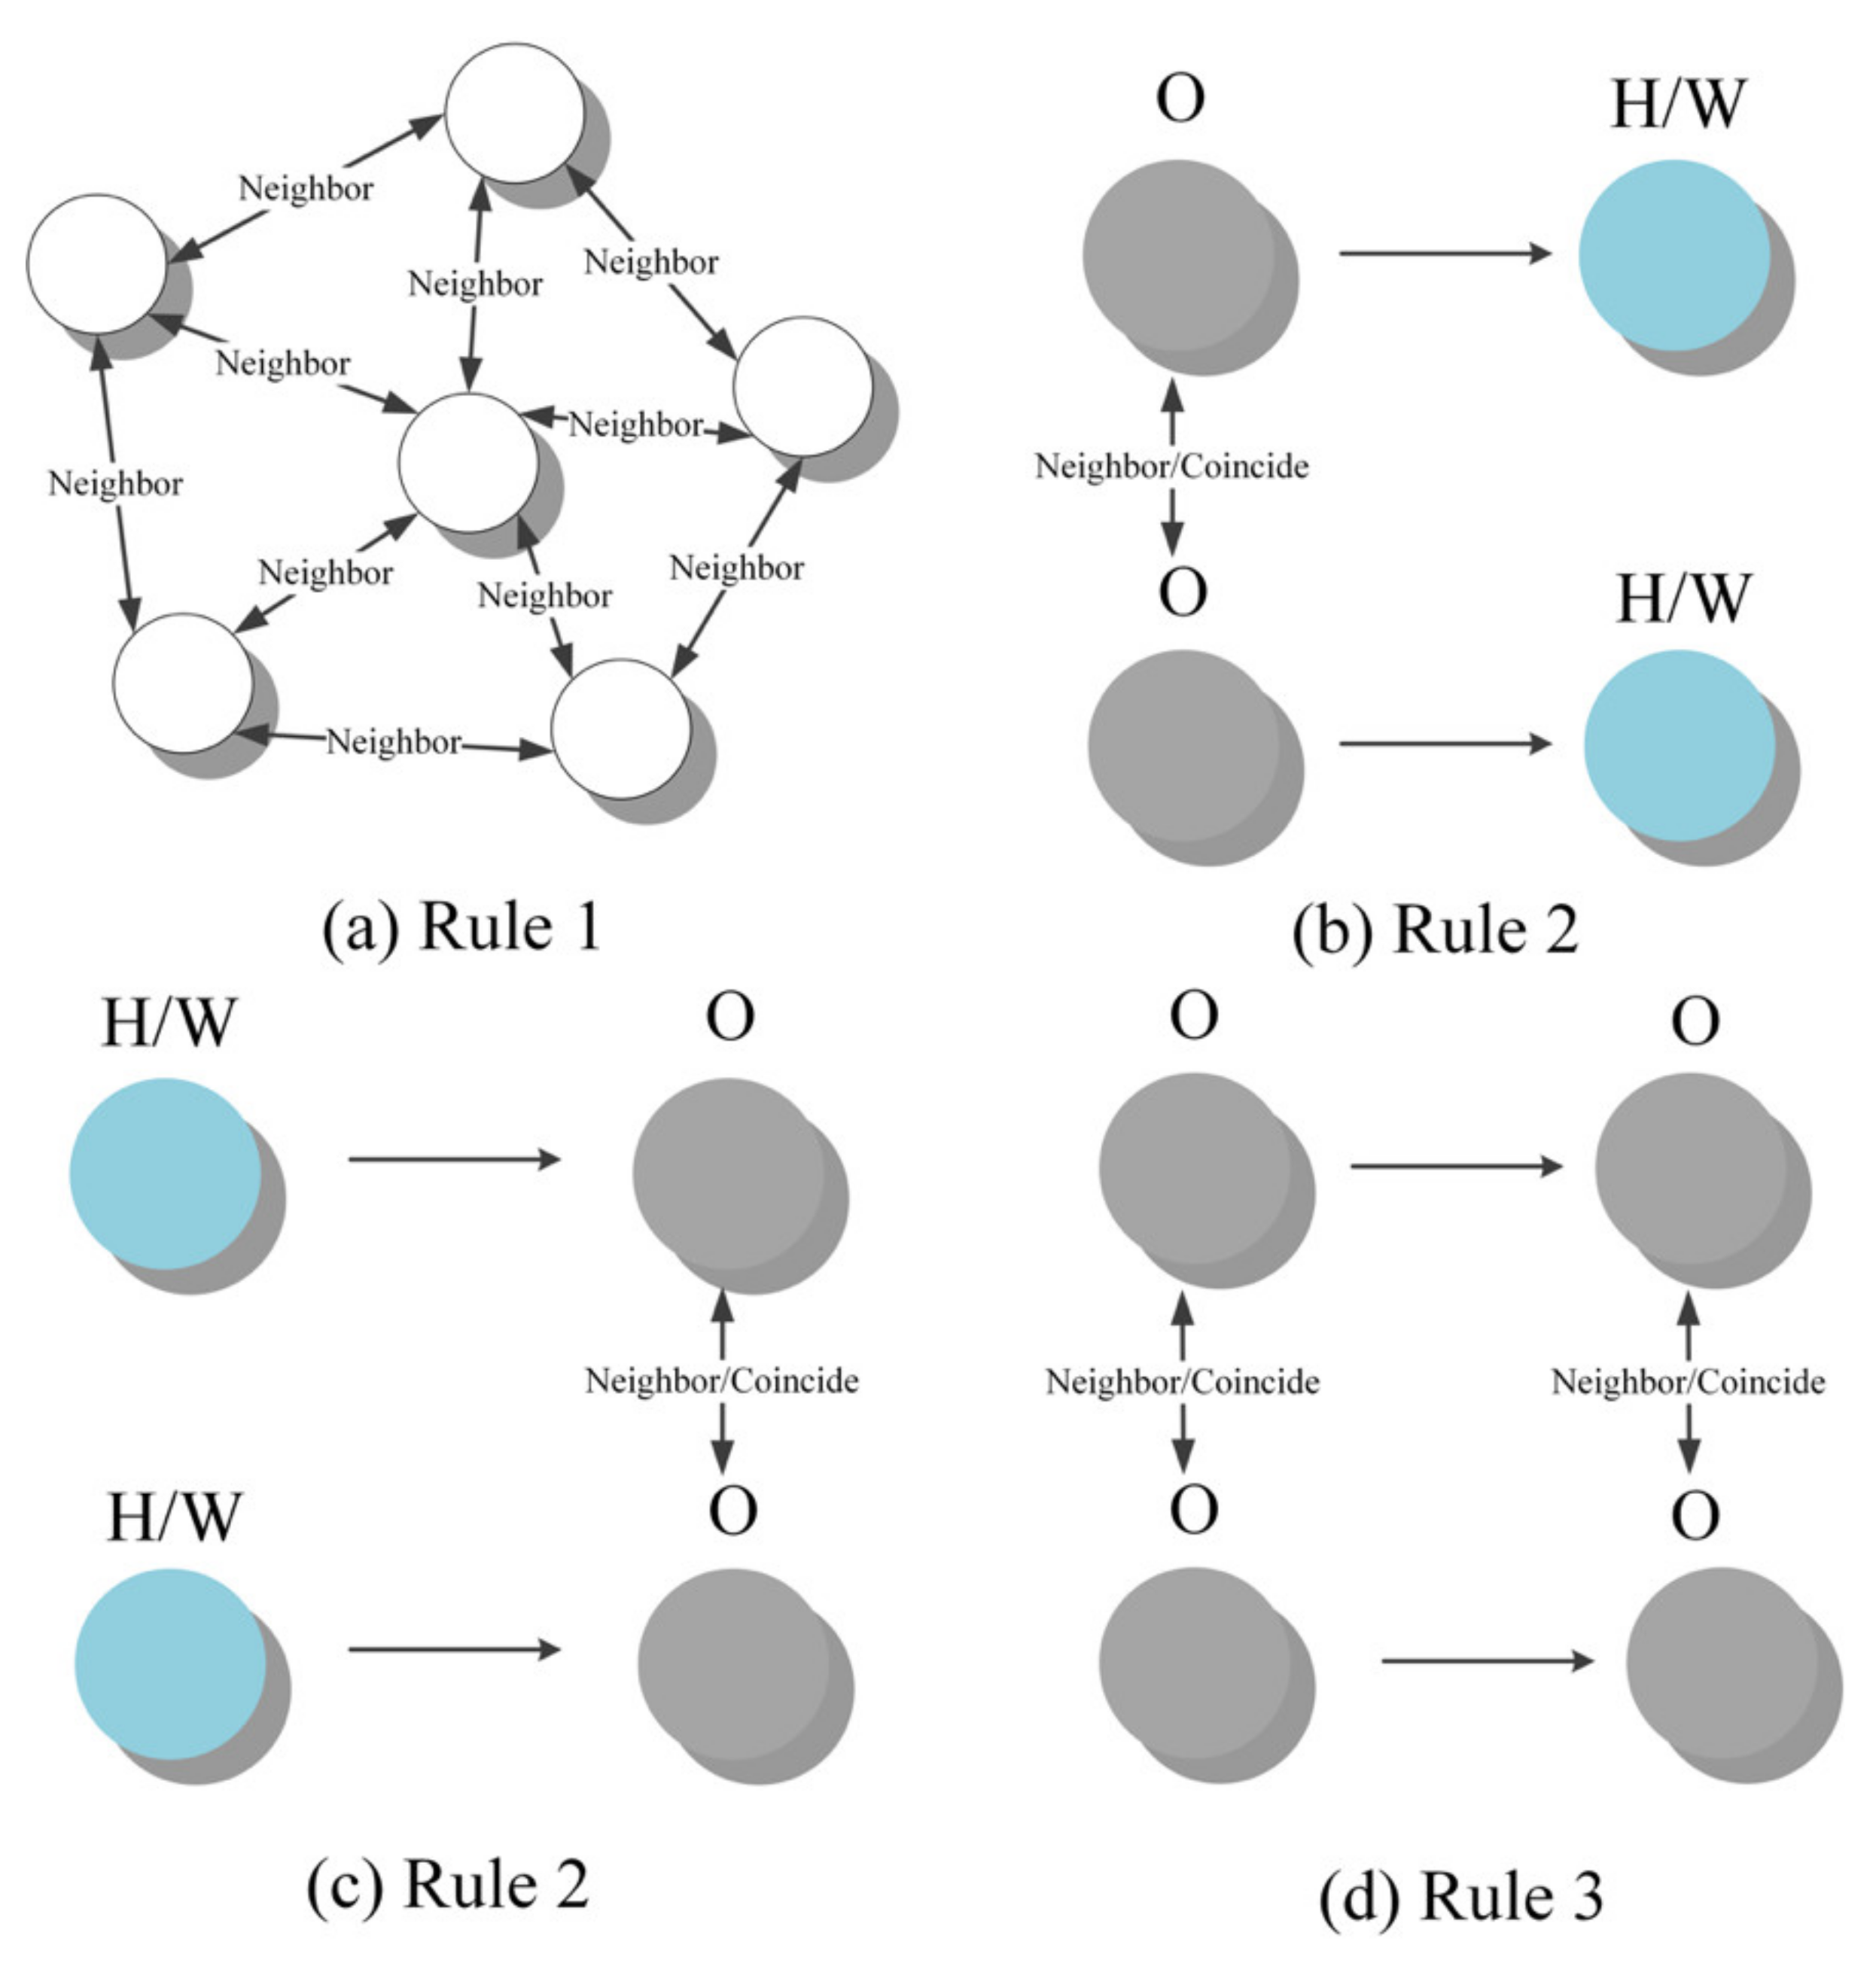
Firstly, we believe that human activities largely conform to the “First Law of Geography” [55]: activities adjacent to space will be more similar. Therefore, this article uses the adjacent spatial relationship as the premise of establishing a connection between the activity stays, as shown in Figure 4a.
Secondly, the choice of the next activity from the same activity has a high probability of being the same (for example, the next destination that people start from home is often the place of work), especially when the destination location is close. In the same way, the previous activity of the same type of activity also has a high probability of convergence. Based on the identified Home and Work, we establish net connections for the nodes that are spatially adjacent to the target location of the next activity and the nodes that are spatially adjacent to the previous activity location, as shown in Figure 4b,c.
Thirdly, similar to the previous rule, two consecutive unlabeled activities are considered to have a similar activity type transfer relationship if there is a spatial proximity relationship between them. A net connection is established between them, as shown in Figure 4d.
(2) Activity feature vectors
The feature variables of objects are the key input data for UAIM learning and training. The purpose of the activities is usually closely related to time and place. In this study, user activity feature vectors are used as the input of graph neural network nodes. The feature vectors of each node are expressed as:
V   =   v l a n d , v t i m e s ,
where v l a n d and v t i m e s represent land use and activity time characteristics, respectively.
(1) Temporal dimensional feature vector construction. We use a time-segmentation strategy to quantify the time-dimensional vectors to prevent over-fitting training and accelerate model convergence. Here, a day is divided into 144 periods with intervals of 10 min, and the binarization method is adopted to characterize the time feature of user activities. Let the value of the part where the 144 time periods overlap with the user’s stay be 1; otherwise, it is 0. Thus, the time feature vector of each stay node is represented as 144 binary sequences composed of 0 and 1.
(2) Spatial dimension feature vector construction. The urban land-use status depicts the spatial characteristics of user activities. Specifically, it uses the proportion of land use types covering each stay’s “potential active area” to characterize the spatial features. This paper divides land use types into eight categories, as shown in Table A2 in the Appendix B.
(3) Manually label the training data set
According to the basic principles of training sample screening in machine learning, the manual labeling training set selects 1% of samples from personal daily activity chains. In order to make the data cover the diverse characteristics of people’s activities and behaviors as much as possible, the following strategies are used to filter the data set.
  • Excludes users with only contain ‘H’ and ‘W’ activities.
  • The activity chains covering various areas of the city are randomly selected.
  • All urban land types should be covered within the selected activity areas.
  • The activity chain data of 2, 3, 4, 5, and more than five stays were selected at a ratio of about 20%.
On this basis, several volunteers were selected to annotate the activity types of these selected samples, and cross-verification was carried out to ensure that the labeled activity types were as close to the real situation as possible.

3. Model Training and Comparison Experiments

3.1. Data Description

In this paper, the MPS data from April 1 to 14, 2019 in Nanjing are obtained from a Chinese operator, which has about 1/3 of the subscriber base of mobile phone users in Nanjing (the resident population of Nanjing is 8.5 million in 2019 and the subscribers of this operator in Nanjing is near 3 million according to our statistics). Two weeks of data are used as input for home and workplace identification, while MPS data for April 8 (Monday) are used to construct activity semantic stay chains. The 250 and 500 m buffers for base stations in urban areas and outside urban areas constitute the “potential active area”. After processing, 2,528,540 users’ daily stay chains are built, containing 14,084,200 stays. We obtained AOI (Area of Interest) data from the largest online map site in China (Gaode map, https://ditu.amap.com/, accessed on 9 August 2021) as a data source for evaluating urban land use status. Based on the filter rules proposed in Section 2.3, parts of the user’s stay chains are selected for manual activity labeling. Details of the data composition, sources, and storage methods are shown in Table 1.
Machine learning tasks typically divide sample data into three datasets: a training dataset, a validation dataset, and a test dataset. The training dataset is used to train the model. The validation dataset is also called the cross-validation set, which is used to select the best model. The test dataset is used to evaluate the algorithm’s operation status unbiasedly and calculate the accuracy of the results. By convention, the manually annotated dataset is divided into the above three data sets at a ratio of 60%, 20%, and 20%. When the error rates of both the training and test sets are small, the resulting model is more desirable.

3.2. Model Parameter Setting

In order to obtain the best running results for the UAIM model, some parameters are set here to train the model, as shown in Table 2.
The neuronal activation function ReLU enables sparse activation. When training a deep classification model, several relevant feature variables can be efficiently selected to better mine data features and fit the training dataset. Max pooling method can effectively obtain the abstract summary characteristics of the datasets. The RMSprop algorithm is an adaptive learning rate method, and the same adaptive learning methods include Adagrad and Adam methods. Lr and Lr decay are the decay parameters of the optimizer, representing the step length of the gradient descent and the slowing rate of the decay. They determine the speed of learning and the speed of model convergence. After comparing and verifying multiple value combinations, the above parameters and algorithms achieved the best learning effect.

3.3. Model Training and Result Accuracy

Our model is a spectral-based graph neural network, and the entire graph needs to be loaded into the memory for calculation simultaneously. Therefore, it would take a lot of time to construct the relationship network for processing large-scale nodes. We partition all the data into groups of 10,000 user activity chains and sequentially perform the type inference task for each data group. Finally, we complete 175 activity type annotation tasks for user daily activity chains on April 8. The accuracy distribution (based on the test set) obtained for each training is shown in Figure 5a, and the average accuracy reaches 84.47%. The accuracy improvement process in a single training is shown in Figure 5b. When the number of cycles goes 300, the model comes convergence.

3.4. Comparing with RMNs-Based Model

Most of the existing methods in the literature require a large amount of movement traces with activity purposes, making it impossible to reproduce this type of method. Therefore, we implemented the RMNs-based activity inference model [38] as a comparator for the UAIM method. The test dataset of this experiment is used as the verified sample data. Indicators of accuracy and recall are compared for the two models, as shown in Table 3. The results of both indicators indicate that the activity type inference framework based on the GMNN model proposed in this paper outperforms existing statistical relational learning-based algorithms. Since the RMNs-based model adopts the sequence of activities to construct the statistical correlations, it is difficult to infer the activity types for many users with very few stops. As a result, the recall of the RMNs-based model could not reach 100%.

4. Results and Discussion

We get the final urban activity chains with seven activity types based on the above experimental parameters and methods. Table 4 shows the statistical results of various human activities (not include “Others”). According to Table 4, we can find that: (1) In addition to Others (the number of other activities is 4670.37 thousand), Home and Work account for the highest proportions. People often go home many times in a day, so the ratio of Home is higher than that of Work. (2) Among the “Shopping and catering”, “Leisure and recreation” and “Medical” activities, “Shopping and catering” occupies an absolute leading position, while the other two have close proportions. (3) Sports are the least in the number of various activities on that day (a normal working day).
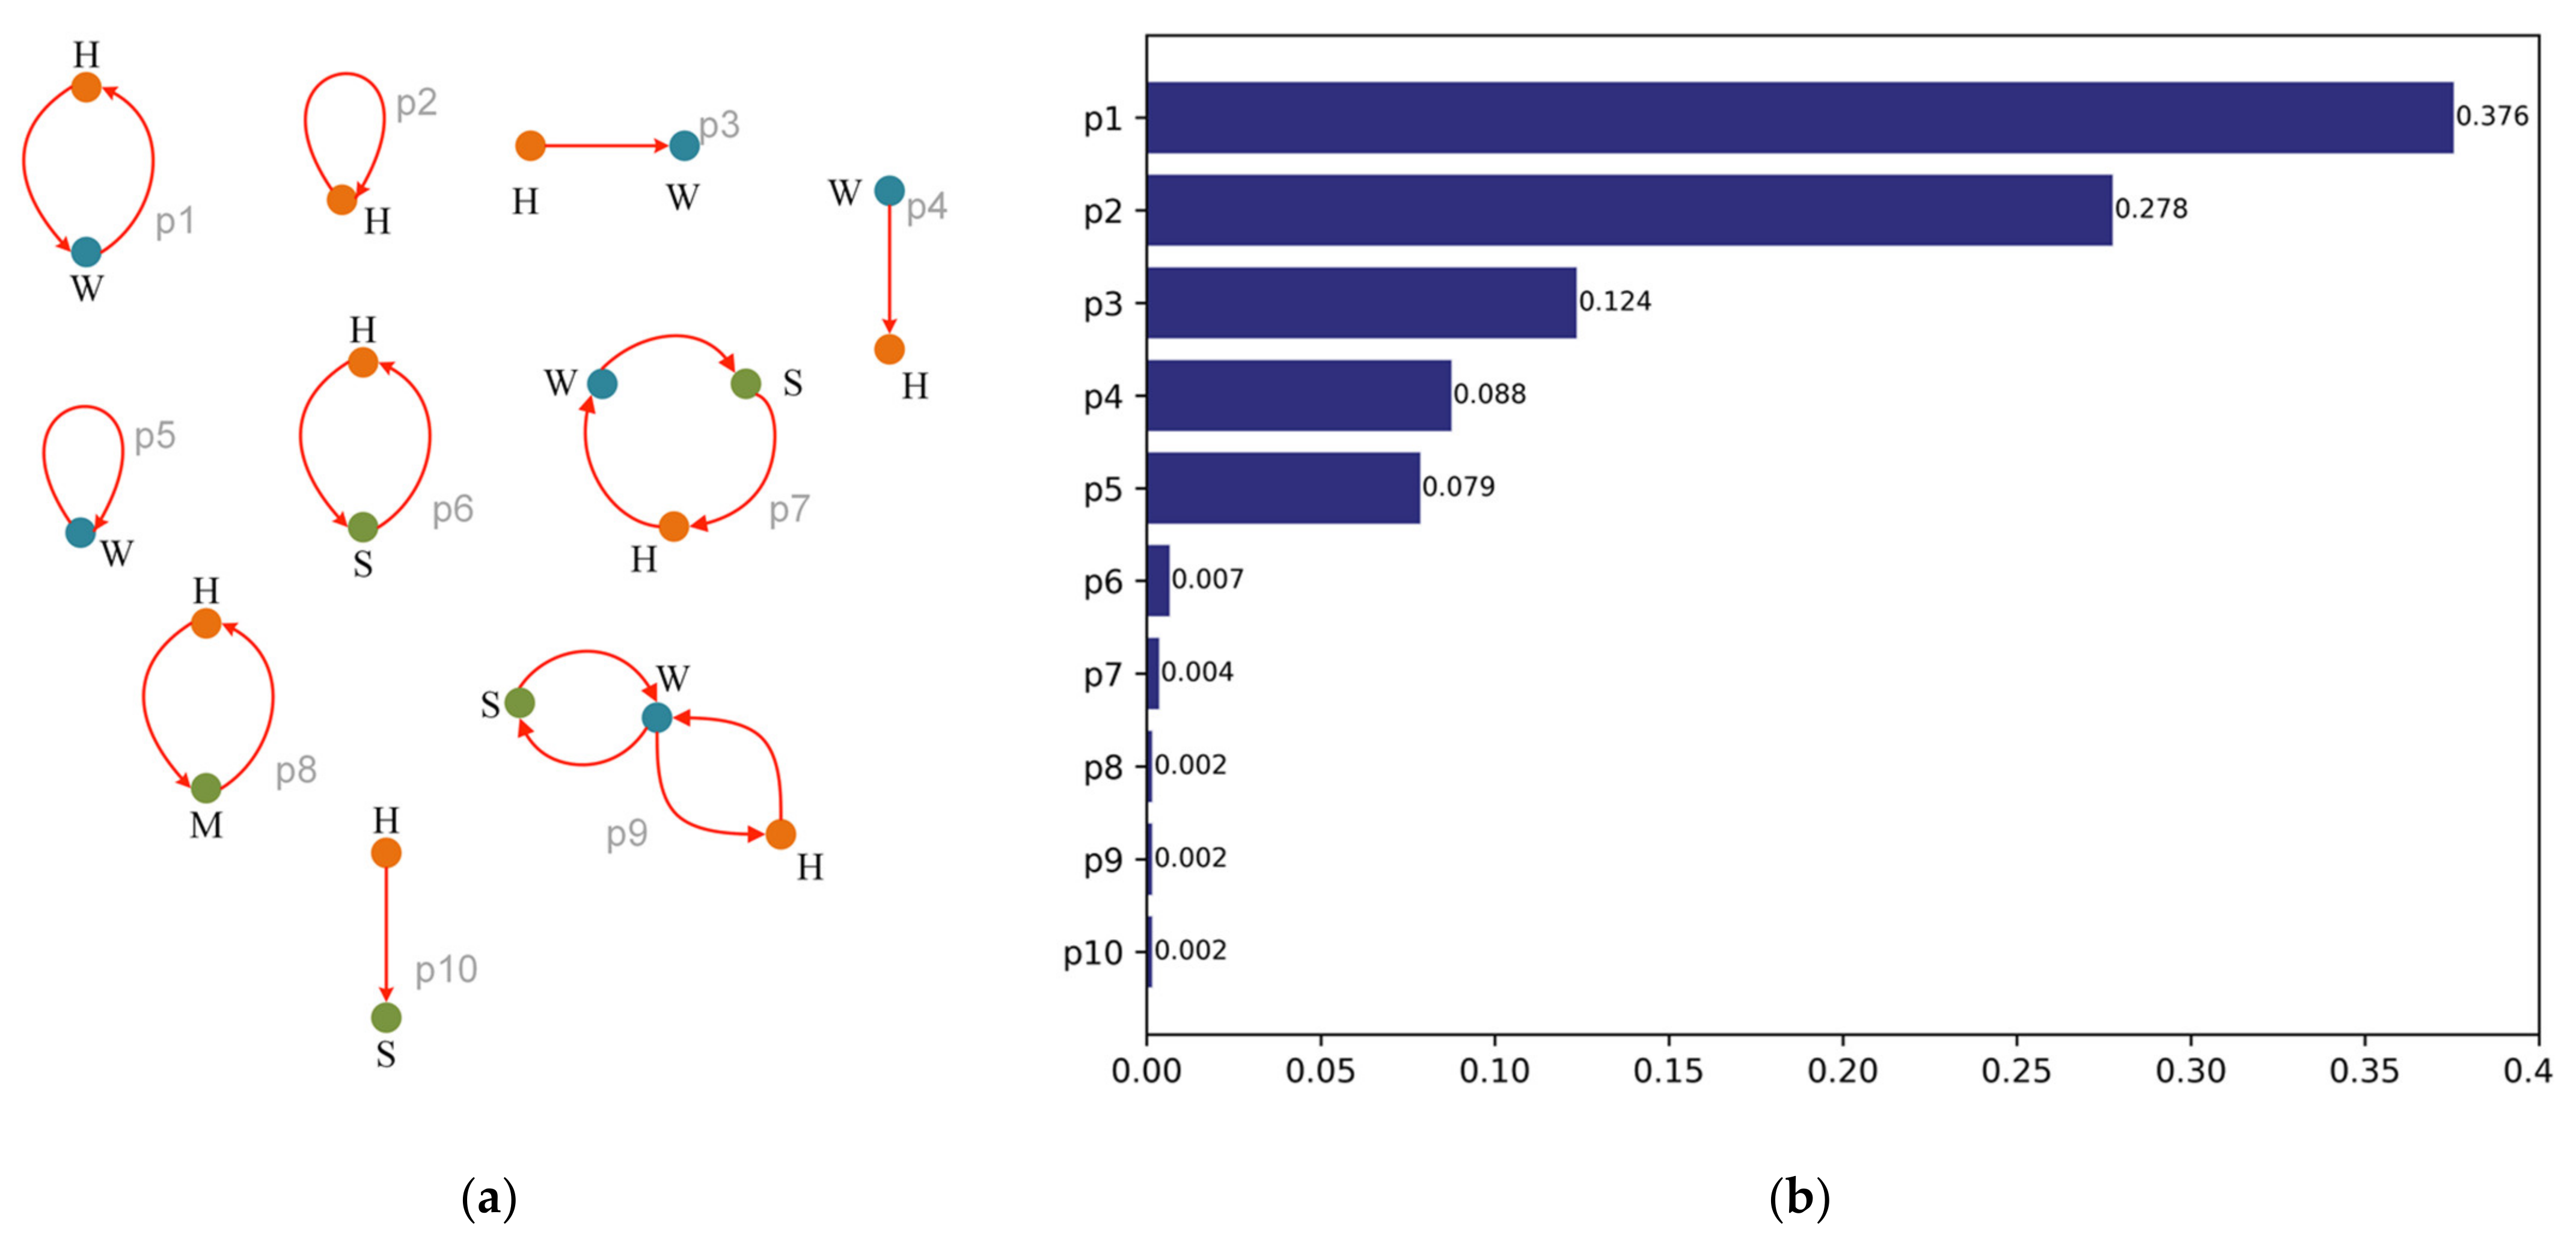
This article extracts major daily activity mobility patterns (“Others” are excluded) by filtering the top 10 daily movements with the highest proportion, as shown in Figure 6. According to Figure 6a,b, the mobility pattern of “H-W-H” is the most frequent, and the top five mobility patterns center on Home and Work. It exactly reflects the laws of people’s daily life. Patterns “p6” and “p7” show that shopping and catering venues are the third main space of people’s daily life. Overall, a two-point lifestyle is dominant among the major mobility patterns, while three or more activities are relatively rare. The activities that people are most likely to undertake centered around Home are: Work, Shopping and catering, and Medical.
To further explore the reliability of the UAIM method, we present an in-depth discussion from both the temporal dynamics and spatial distribution of urban activities.

4.1. Temporal Dynamics of Urban Activities

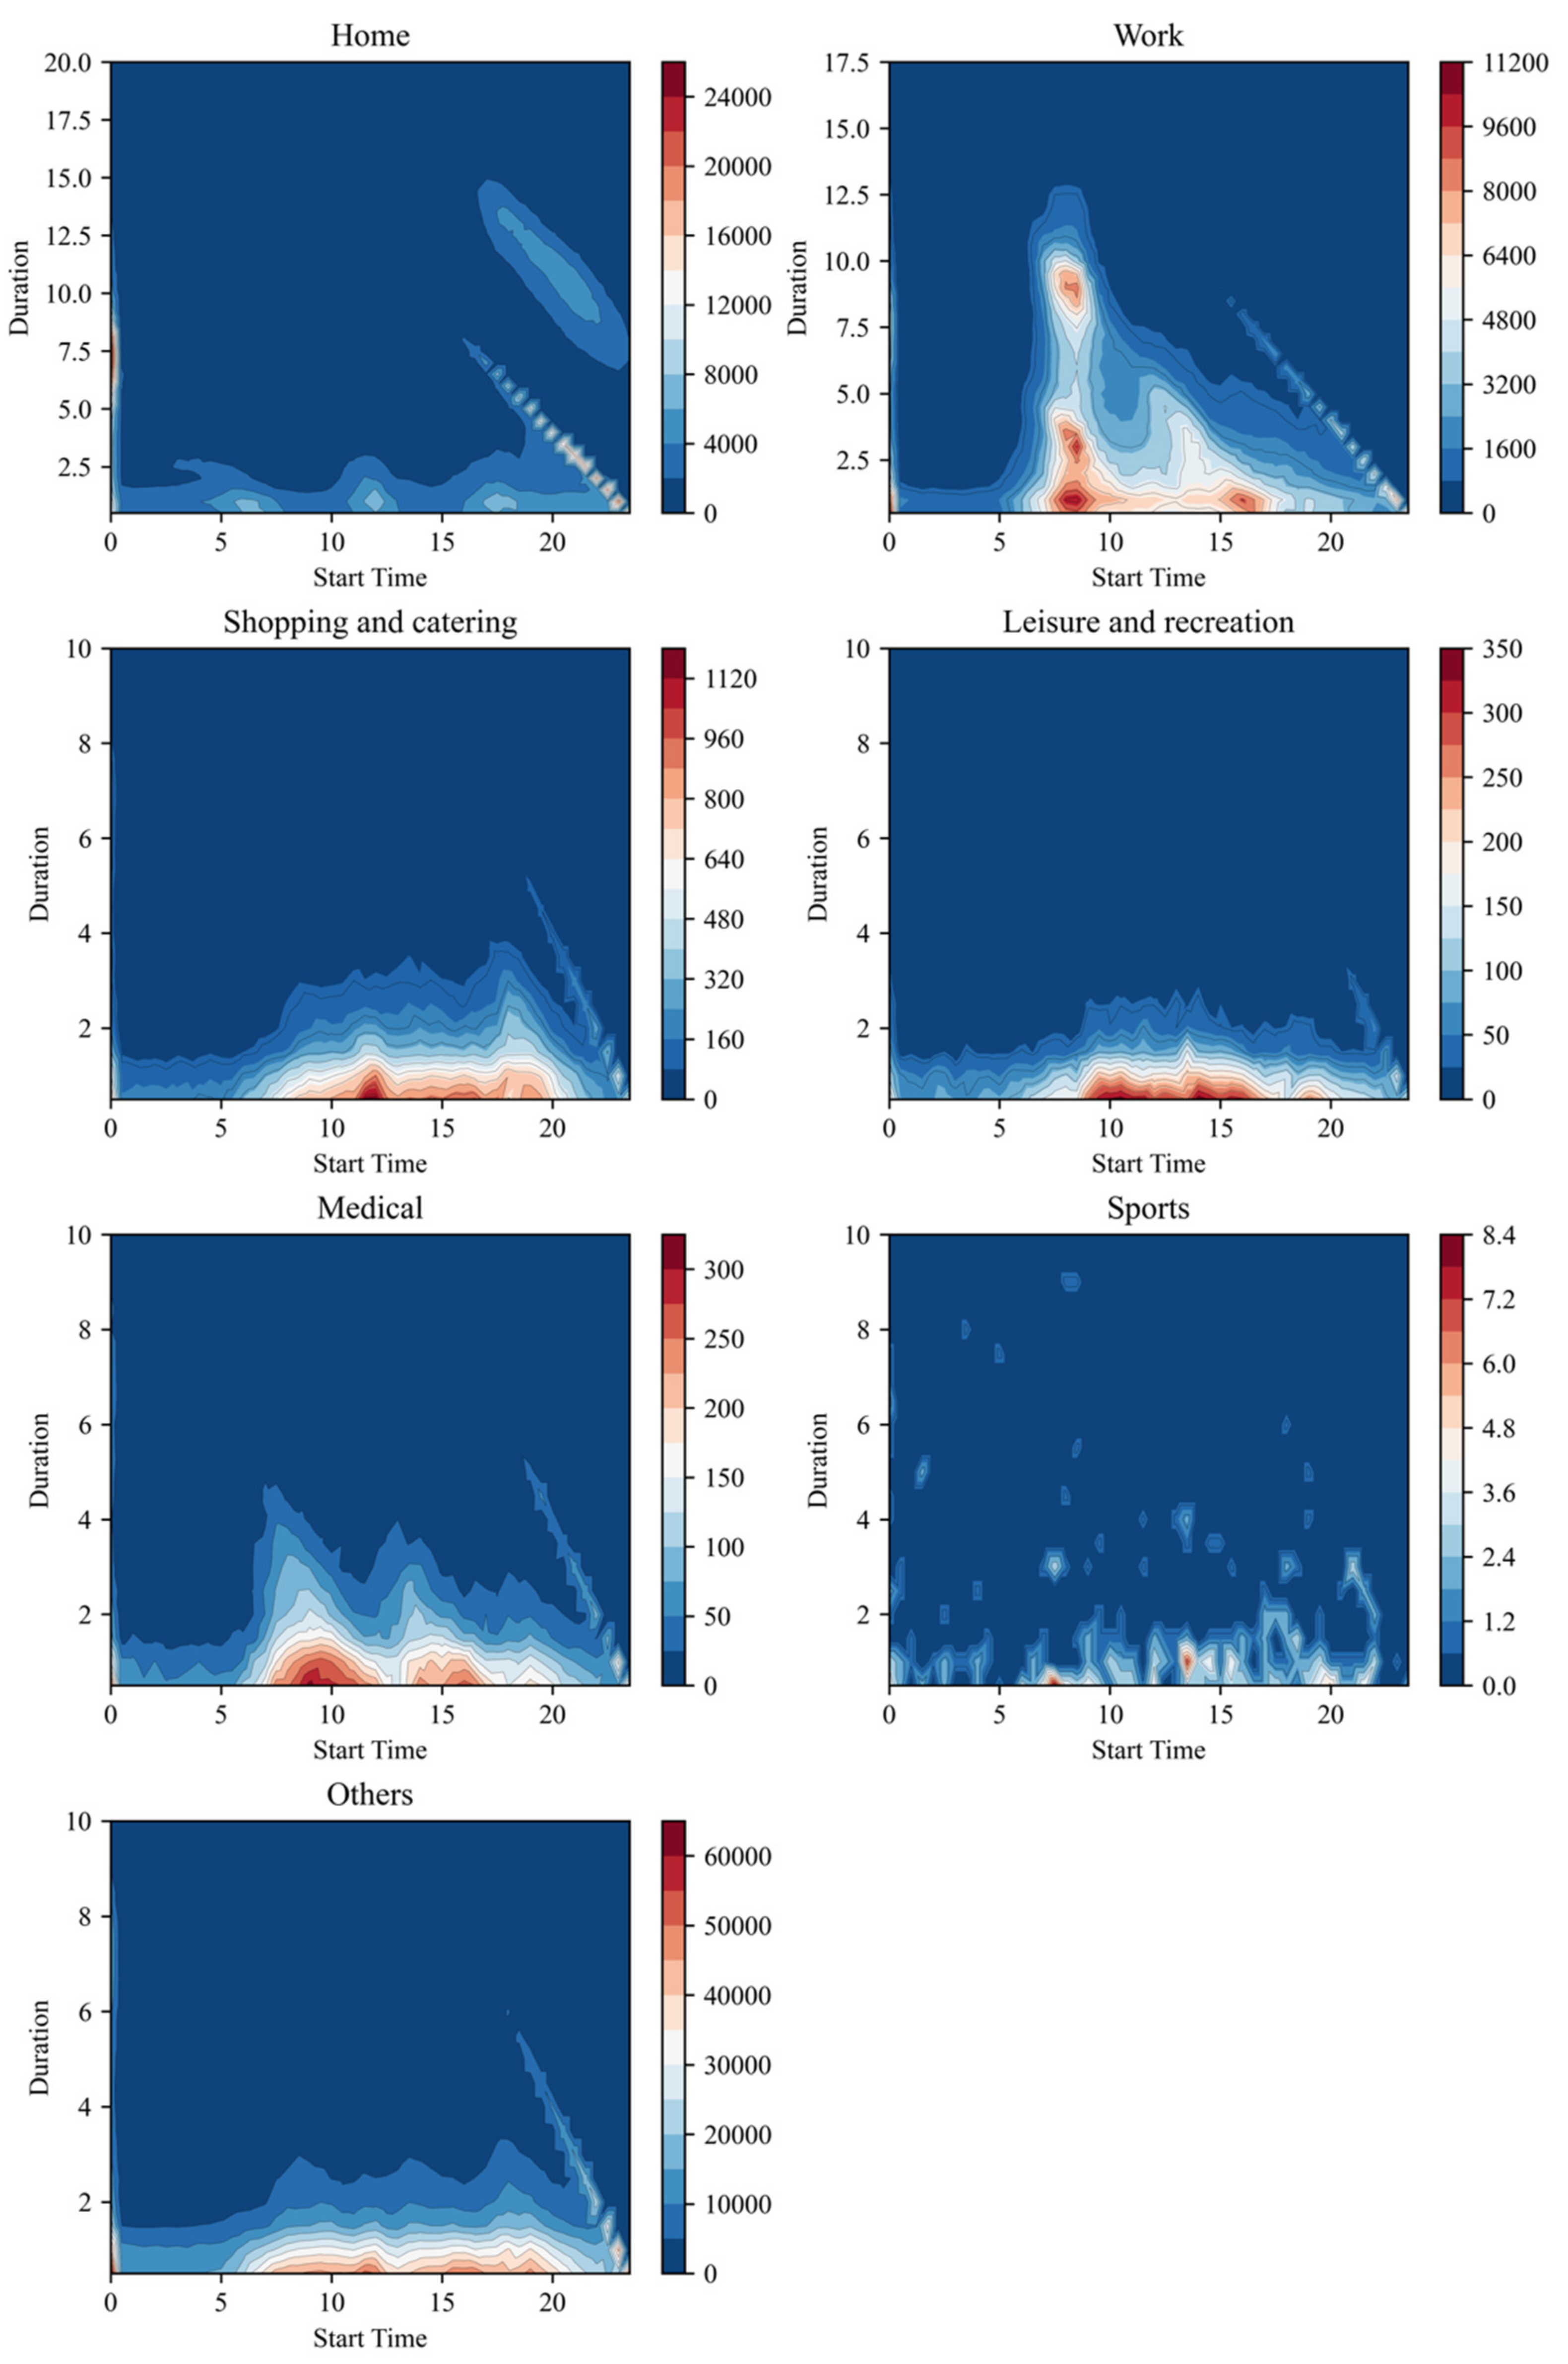
Here, half an hour is used as the statistical unit to explore the temporal dynamic pattern of various urban activities. The contour heat map shows the time dynamic distribution of all recognized activities, and the results are shown in Figure 7.
Figure 7 clearly shows that Home and Work concentrate on the opposite time. The main Working hours are between 6 o’clock and 18 o’clock, and the duration is about 4 to 10 h. Nine o’clock is the peak time to start work, and there are two groups: One group works for up to 8–10 h, while the others work for about 2 h in the morning and then carry out other activities (e.g., go home at lunchtime) and return to work in the afternoon. The two most active times for Home are between 0:00 and 1:00 and after 17:00. The duration time of Home is mostly 5–10 h. The duration of people at home from 18 to 24 pm is about 8 to 13 h (sleeping time). The above time distribution characteristics fit perfectly with people’s work and rest patterns on weekdays.
Except for Home and Work, the main temporal characteristics of the remaining activities are as follows: “Shopping and Catering” are mainly distributed from 10:00 to 20:00, and the two concentrated periods are around 12 noon and 7 pm. The hottest period of “Leisure and recreation” is from 9 to 16 o’clock with a relatively short duration. Compared to the above two types of activities, the characteristics of the bimodal distribution of “Medical” activity are more prominent, and its duration is relatively longer. Sports activities have no obvious regularity, the distribution is relatively scattered, and the number of people is small. Others have the widest distribution time, and the amount of this activity is large. It has a greater relationship with the spatiotemporal sampling uncertainty of mobile phone positioning data.
Based on the above analysis, the temporal dynamic patterns of people’s various urban activities estimated based on the UAIM method in this paper are consistent with the regularity and rhythm of urban human life on working days [52,57]. This well confirms the reliability of the activity type inference results of this method.

4.2. Verification of Urban Activity Spatial Distribution with Ground Truth

It has been widely proved that a strong correlation exists between urban land use and human activities [17,58,59,
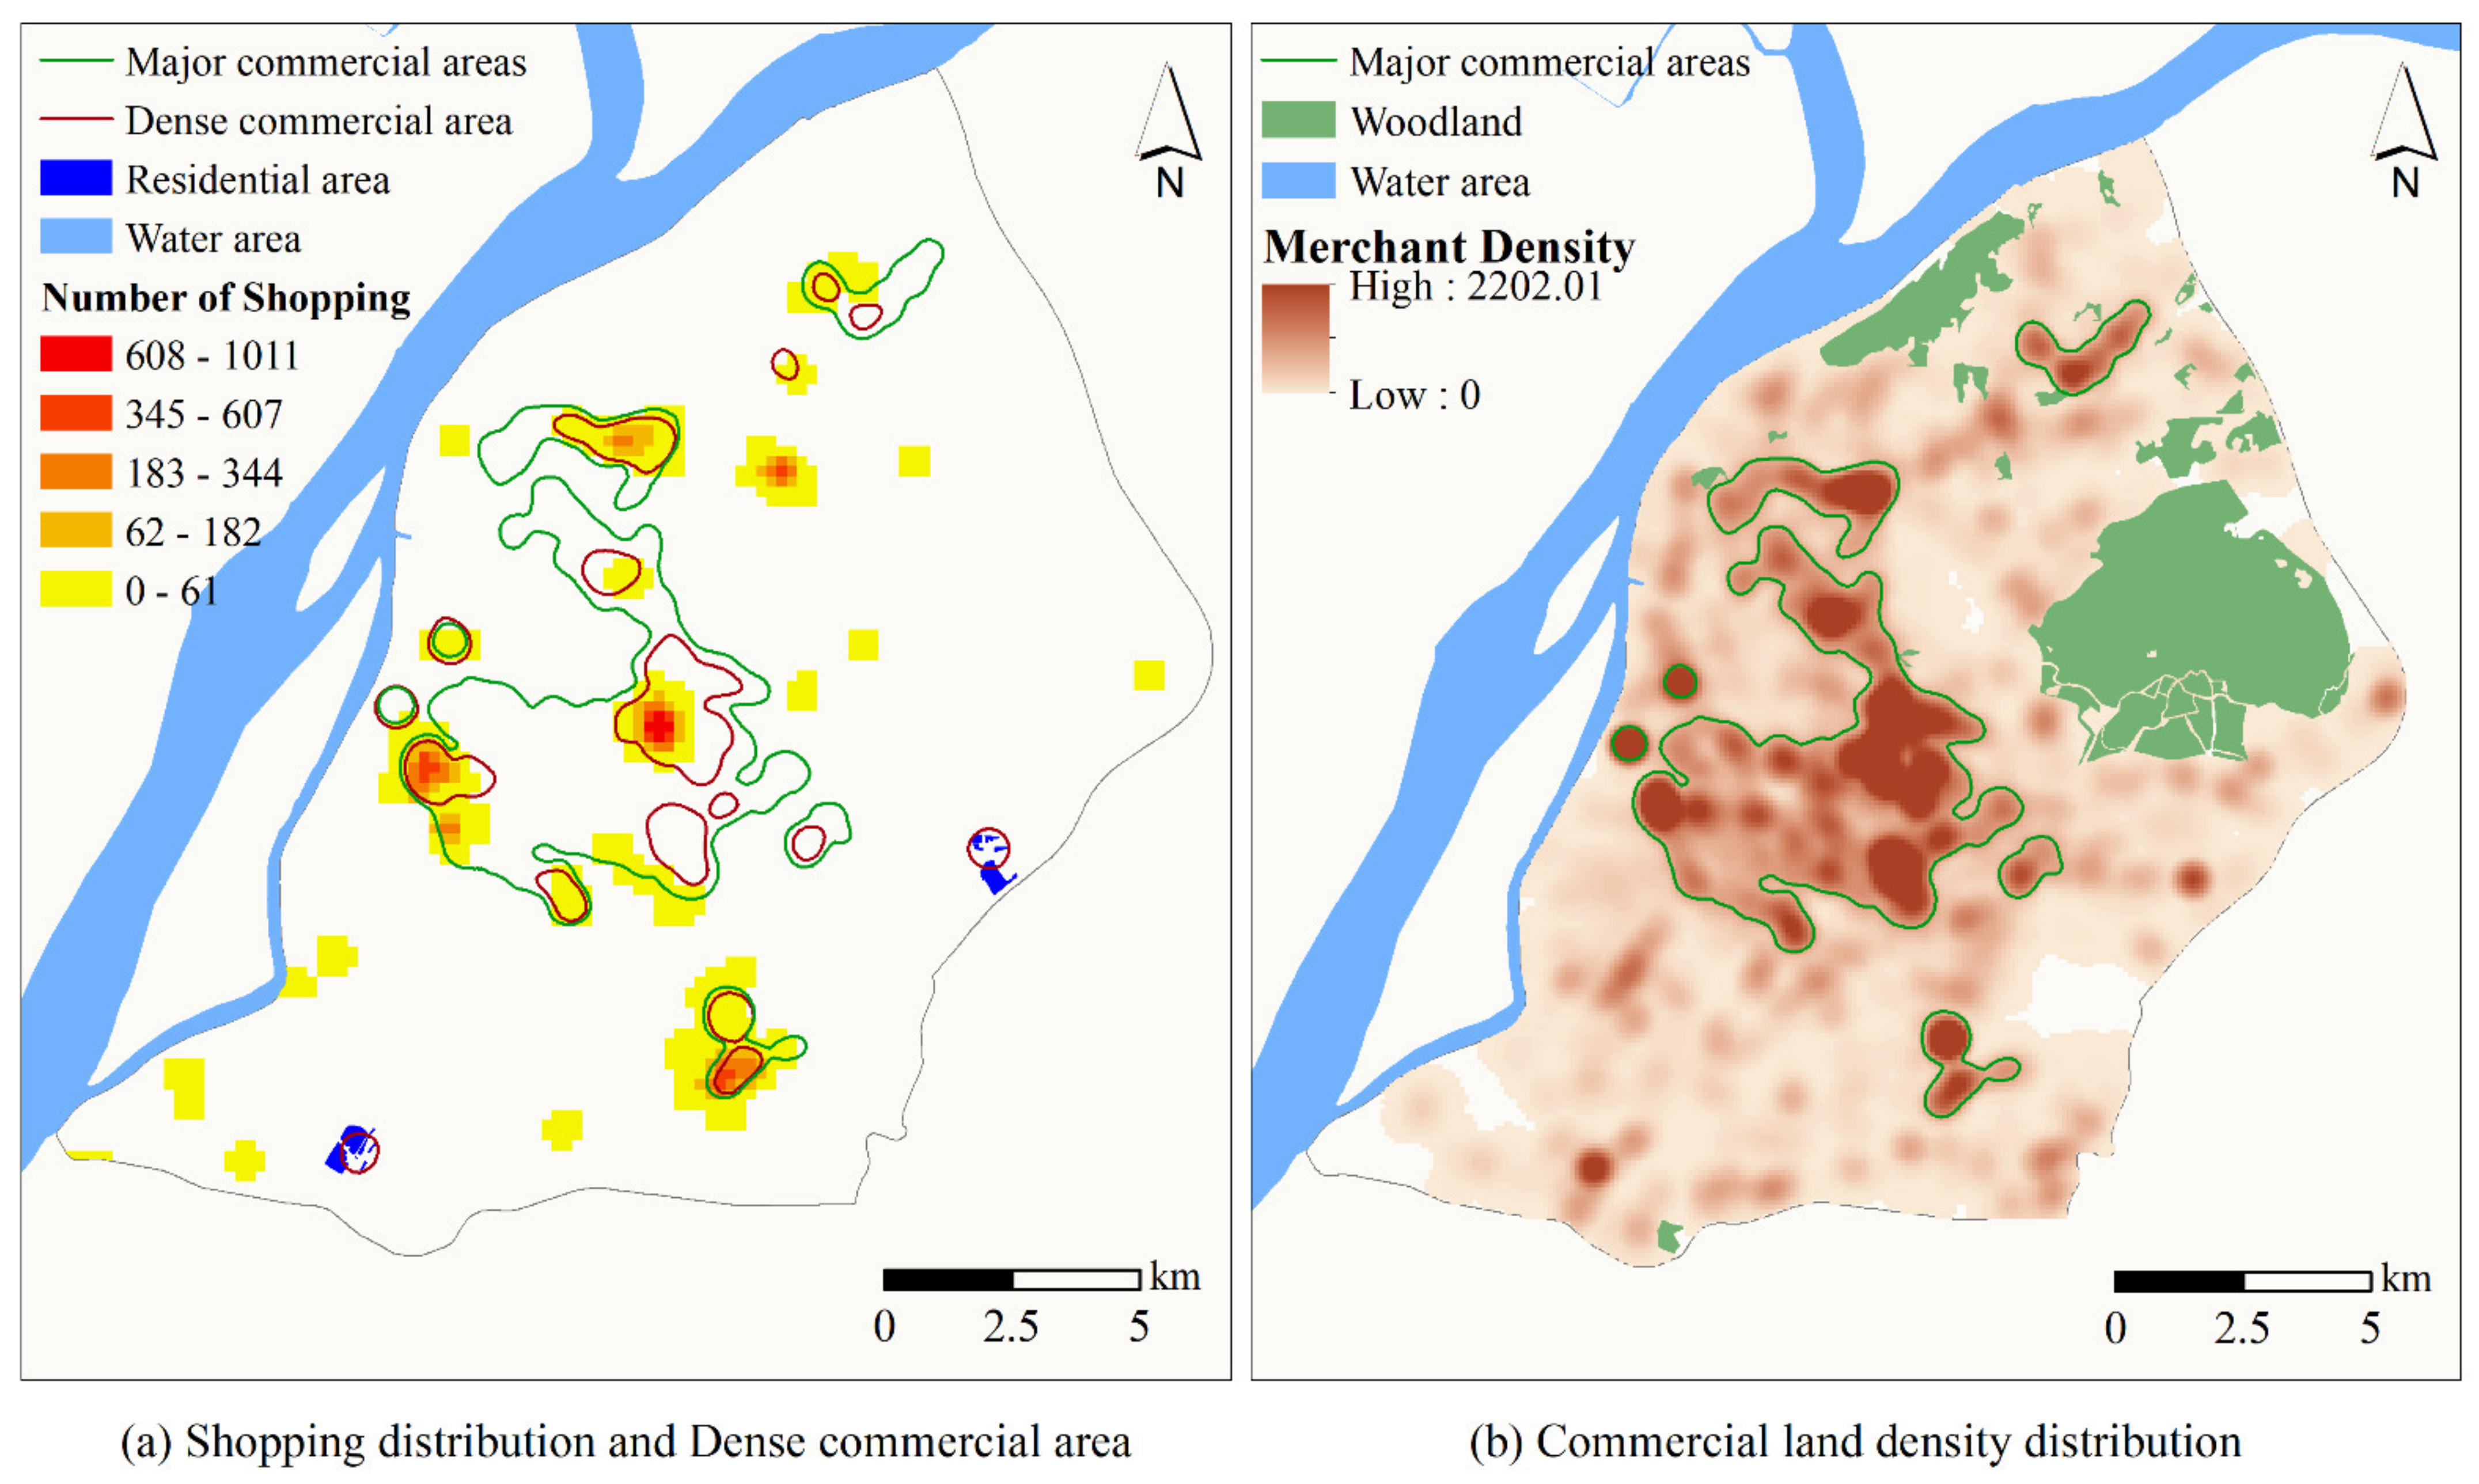
60]. Here, we chose to compare the spatial distribution of “Home” and “Shopping and Catering” with the ground truth of the corresponding urban land use. To better show the detailed features, we take the main urban area of Nanjing with diverse and complex human activities as the spatial scope of analysis here. Using ESRI’s ArcGIS spatial analysis tools, we estimate the population distribution for “Home” and “Shopping and Catering” activities with 200 m grid unit based on IDW interpolation and zonal statistical methods (as shown in Figure 8a and Figure 9a).
Figure 8a overlays the main contours of the residential area and the distribution of “Home” activity. The outer shape of the “Residential Area” recognized in Figure 8a is added in Figure 8b to help us compare the activity identification results with the land use ground truth. On the one hand, the areas that cannot host “Home” activity are effectively-identified here, e.g., the woodland and the large water area has a fairly small amount of family activities. On the other hand, the areas where “Home” activity is active are highly compatible with the scopes of residential areas.
We extracted the areas with dense commercial service facilities from Figure 9b and overlaid them in Figure 9a. The distribution pattern of areas with high-intensity commercial activities identified by the UAIM method is consistent with the distribution pattern of high-density commercial facilities. Due to the uncertainty of the spatial location of MPS data, some shopping and catering activities that stay briefly near office or residential areas are difficult to identify. As a result, few dense commercial areas exist with no shopping activities, such as the red circles on the right and bottom left in Figure 9a.

5. Conclusions and Future Research

With the development and maturity of big data and ubiquitous sensing technologies, urban dynamics and human spatiotemporal behavior analysis based on massive data have become research hotspots in smart cities, spatial big data mining, and environmental protection. However, mostly these researches focus on modeling and analyzing crowd activity intensity but pay little attention to people’s activity purposes. Only a few studies have proposed technologies for inferring the urban activity types based on mobile phone data. However, there are still problems such as relying on massive effective supervision samples, using limited prior knowledge for modeling, and lacking the ability to characterize complex human activities.
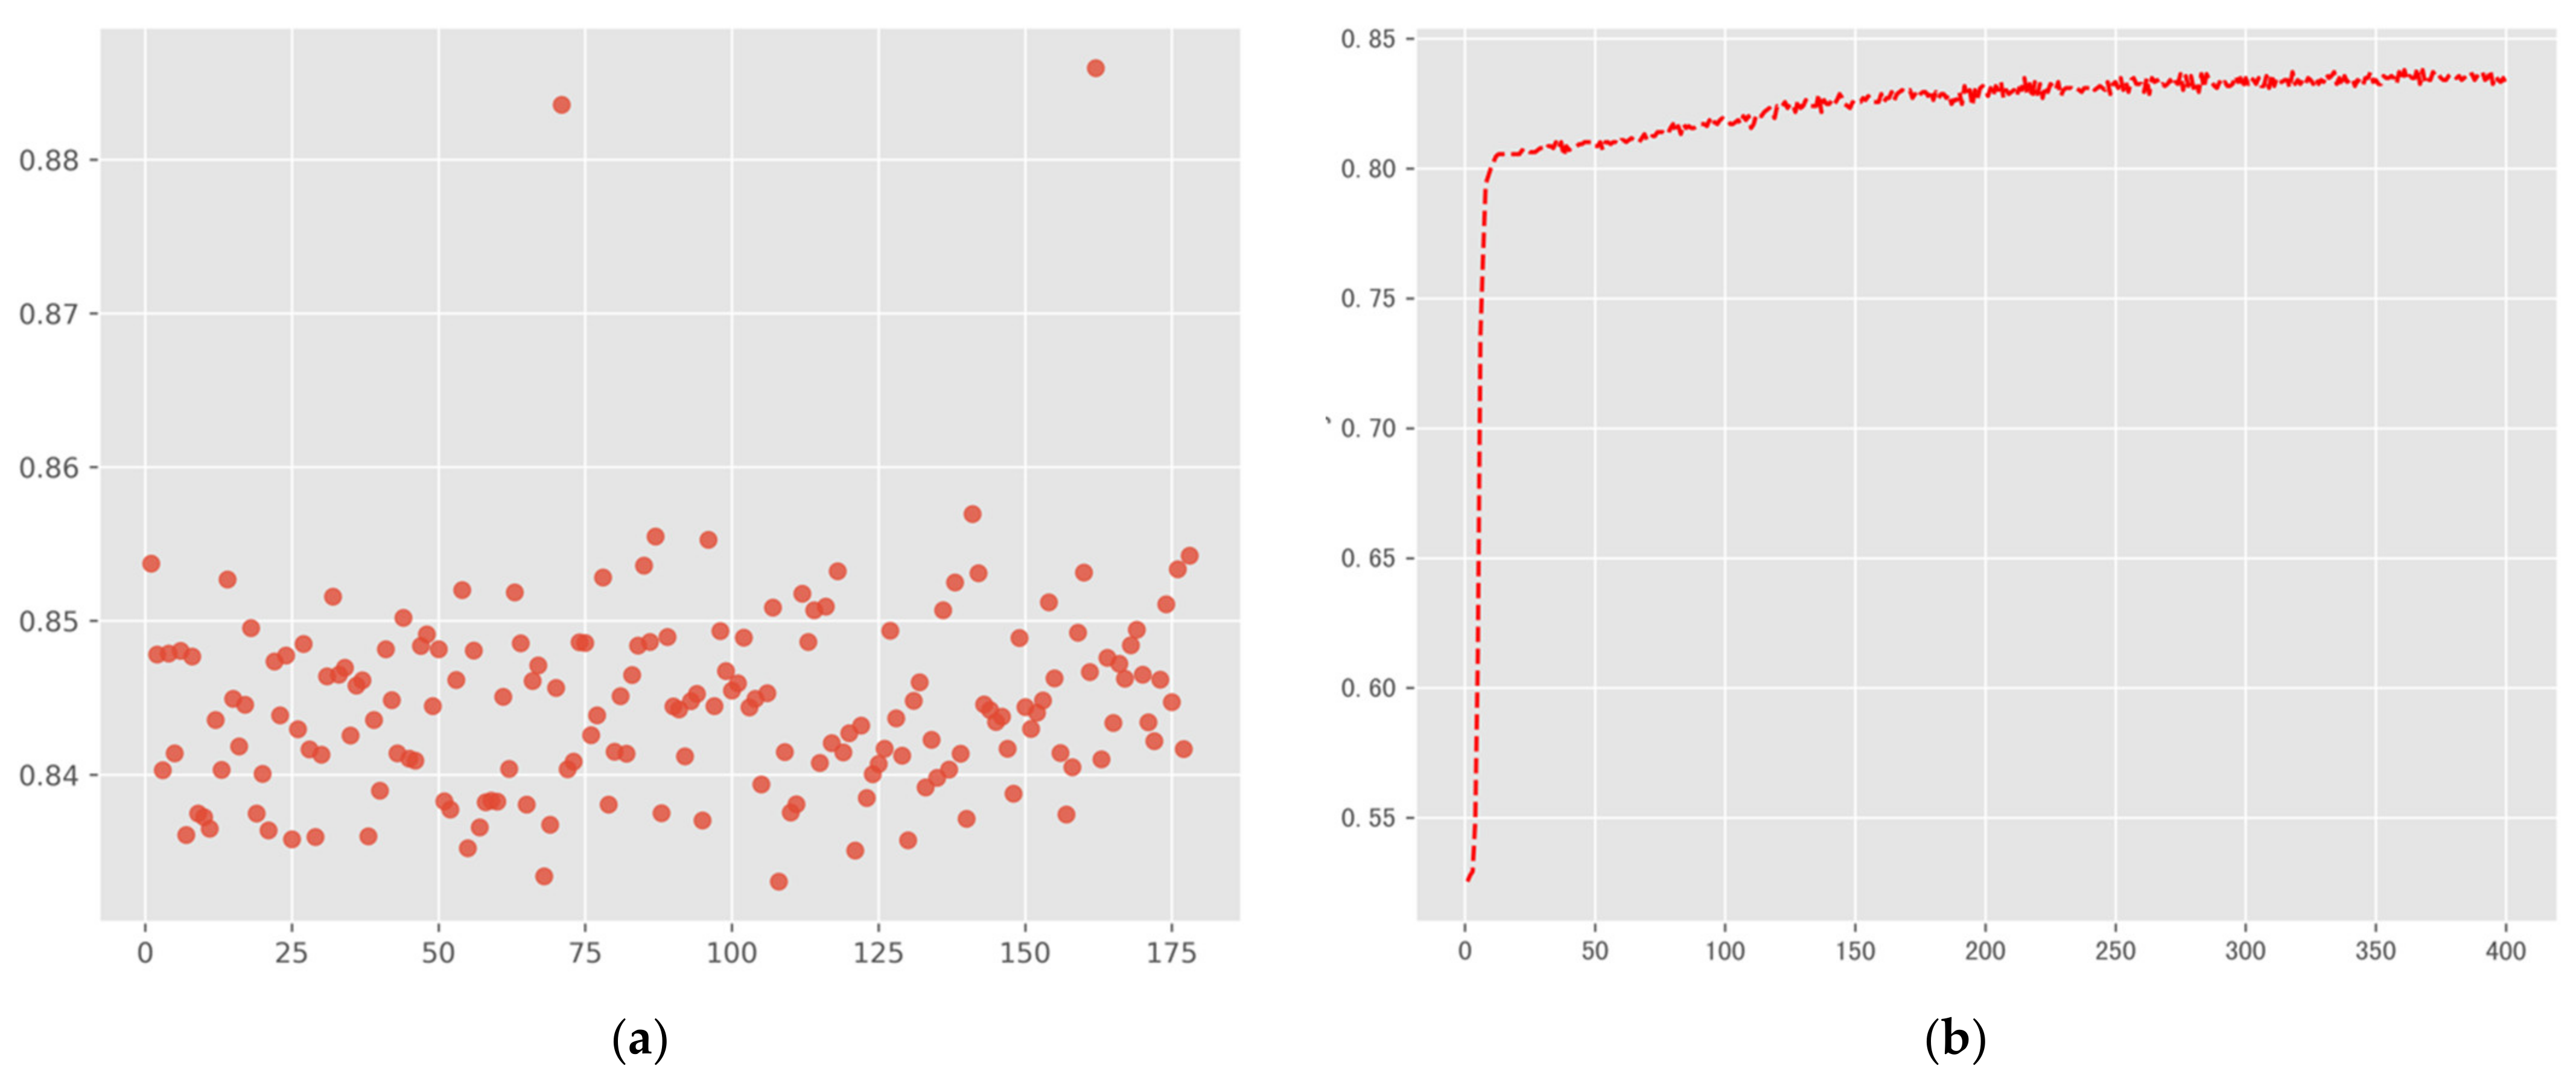
In this context, this paper proposes constructing the “Daily activity semantic stay chain” based on MPS data, which aims to organize and speculate on people’s urban life trajectories effectively. Therefore, we design the UAIM framework to implement the modeling and type annotating of human activity chains. In conclusion, our work contributes in the following two aspects: (1) We propose a generic mobile phone data-oriented daily activity semantic stay chain model and its construction technique, which is a development of a human trajectory data model. Based on this, the model can deepen our knowledge of human dynamic patterns in cities. (2) The UAIM approach achieves higher recognition accuracy and recall than the existing literature on activity type inference. Our average accuracy of activity type recognition can reach 84.47%, and the highest accuracy is about 88.5%. Meanwhile, the recognition accuracy and recall are better than the RMNs-based method [38] through comparison experiments. Our activity type inference method does not need to depend on a large number of supervised samples. It also overcomes weakened feature learning ability caused by the manual construction of potential functions for the statistical relational learning model.
We analyzed the characteristics and reliability of the urban activities modeling results from multiple perspectives by investigating the human movement patterns, the temporal dynamics of human activities, and comparing the spatial distribution of “Home” and “Shopping and catering” with the ground land use. Nevertheless, our approach inevitably has some limitations, which leads to a large scale of “Others” being identified. We believe that people’s social-demographic attributes such as occupations and the correctness of manual labeling have a crucial impact on the accuracy of the activity labeling. Besides, the GMNN learning model adopts a spectrum-based network construction and learning method. It needs to add the graph structure and feature vector to the memory for calculation simultaneously, which greatly improves the computational complexity and the computation time. In the future, we can optimize the activity modeling and inference algorithm in the following aspects:
Firstly, the different ages and occupations of users have different behavior patterns, which greatly affects the inference of the purpose of the activity. We do not have access to this data due to the constraints of personal privacy protection. We propose to realize the category segmentation of the urban population by analyzing the long-term personal movement trajectory, designing diverse behavior recognition strategies for different user groups (students, senior citizens, taxi drivers, office workers, etc.) to circumvent the influence of this factor on urban activity type labeling.
Secondly, the manually annotated samples in this paper are manually discriminated by combining the user’s before-and-after position and activity trajectory of multiple consecutive days as the basic knowledge. The inability to compare the manual annotation results of activities with the real activity purpose of users makes it difficult to obtain an accurate and high-quality sample. In the future, we will sign a confidentiality agreement to obtain the real MPS data and GPS tracks of a certain number of volunteers. We will design a more accurate activity purpose inference method by analyzing the impact of the mobile phone positioning error on human activity labeling.
Thirdly, the behavior analysis would be extended more than the spatial and temporal distributions. The characteristics of individual trajectories, such as the daily range of travel, movement radius, and movement entropy [61], will be further discussed. The exploration results will enrich our knowledge of individual behavior and provide reliable decision support for rational allocation of urban services and facilities, traffic planning, etc.
Finally, a space-based method will be considered to realize the convolution operation of adjacent networks in subsequent studies to improve computational efficiency.

Author Contributions

Conceptualization, Shaojun Liu and Yi Long; methodology, Shaojun Liu; software, Shaojun Liu; validation, Shaojun Liu and Ling Zhang; formal analysis, Shaojun Liu; investigation, Shaojun Liu; resources, Shaojun Liu; data curation, Shaojun Liu and Hao Liu; writing—original draft preparation, Shaojun Liu; writing—review and editing, Shaojun Liu and Ling Zhang; visualization, Shaojun Liu; supervision, Yi Long; project administration, Shaojun Liu; funding acquisition, Ling Zhang. All authors have read and agreed to the published version of the manuscript.

Funding

This research was funded by the National Key Research and Development Program of China (2017YFB0503500); the National Natural Science Foundation of China (41930104).

Institutional Review Board Statement

Ethical review and approval were waived for this study due to the fact that the analyzed datasets are properly anonymized, and no participant can be identified.

Informed Consent Statement

Written informed consent was waived due to the fact that the analyzed datasets are properly anonymized, and no participant can be identified.

Data Availability Statement

Not applicable.

Conflicts of Interest

The authors declare no conflict of interest.

Appendix A

Table A1. Urban activity types and their specific activities description.
Category NumberClassification of ActivitiesActivity Description
1Home (H)Homelife, rest, recreation, and other activities
2Working (W)Work activities in factories, government agencies, enterprises, and institutions as well as education and research activities in primary and secondary schools, universities, and research institutes
3Shopping and catering (S)Shopping and dining out activities
4Leisure and recreation (T)Visits, leisure, and sightseeing activities in tourist attractions, playgrounds, parks, zoos, and other areas; as well as entertainment activities in bars, KTVs, theaters, and other related places
5Sports (G)Track and field, playing ball, swimming, and other exercise or fitness activities
6Medical (M)Medical treatment activities
7Others (O)Except for the above urban activities, such as transportation, religious activities, etc.

Appendix B

Table A2. Classification of urban land types and usage description.
Land-Use TypeCodeDescription
Residential landRResidential construction land, including residential areas, apartments, student and staff dormitories, hotels, etc.
Commercial service landBAll kinds of commercial, business, and entertainment facilities, including shopping malls, supermarkets, restaurants, agricultural products sales, wholesale markets, furniture markets, etc.
Office spaceMIndustrial construction land used for production, technological innovation, industrial parks, factory workshops, government offices, etc.
Land for Education and ResearchEPlaces for the construction of education and scientific research, including universities, primary and secondary schools, scientific research institutes, etc.
Sightseeing LandTAreas providing leisure and recreation services for the public, including parks, squares, entertainment grounds, tourist attractions, museums, cultural centers, heritage sites, etc.
Sports and Recreation LandSLand for all kinds of entertainment and health facilities, including theatres, cinemas, stadiums, golf courses, fishing gardens, etc.
Medical and health useHPlaces that provide medical treatment, health care, sanitation, epidemic prevention, and rehabilitation services to the public, including general hospitals, specialized hospitals, community health service stations, and epidemic prevention stations.
Other landsUIncluding transportation facilities, public service facilities (fire, power supply, communication, etc.), natural waters, green space, and other areas.
This land classification combines the National Standard for Classification of Urban Land (GB50137-2011) [62].

References

  1. Melnikov, V.R.; Krzhizhanovskaya, V.V.; Lees, M.H.; Boukhanovsky, A.V. Data-driven travel demand modelling and agent-based traffic simulation in Amsterdam urban area. Procedia Comput. Sci. 2016, 80, 2030–2041. [Google Scholar] [CrossRef] [Green Version]
  2. McKercher, B.; Shoval, N.; Ng, E.; Birenboim, A. First and repeat visitor behaviour: GPS tracking and GIS analysis in Hong Kong. Tour. Geogr. 2012, 14, 147–161. [Google Scholar] [CrossRef]
  3. Caldeira, A.M.; Kastenholz, E. Spatiotemporal tourist behaviour in urban destinations: A framework of analysis. Tour. Geogr. 2020, 22, 22–50. [Google Scholar] [CrossRef]
  4. Jiang, S.; Ferreira, J.; González, M.C. Discovering urban spatial-temporal structure from human activity patterns. In Proceedings of the ACM SIGKDD International Workshop on Urban Computing (UrbComp’12), Beijing, China, 12 August 2012; ACM: New York, NY, USA, 2012; pp. 95–102. [Google Scholar] [CrossRef] [Green Version]
  5. Zhong, C.; Huang, X.; Müller Arisona, S.; Schmitt, G.; Batty, M. Inferring building functions from a probabilistic model using public transportation data. Comput. Environ. Urban Syst. 2014, 48, 124–137. [Google Scholar] [CrossRef]
  6. Shi, Y.; Yang, J.; Shen, P. Revealing the Correlation between Population Density and the Spatial Distribution of Urban Public Service Facilities with Mobile Phone Data. ISPRS Int. J. Geo. Inf. 2020, 9, 38. [Google Scholar] [CrossRef] [Green Version]
  7. Hashem, I.A.T.; Chang, V.; Anuar, N.B.; Adewole, K.; Yaqoob, I.; Gani, A.; Ahmed, E.; Chiroma, H. The role of big data in smart city. Int. J. Inf. Manage. 2016, 36, 748–758. [Google Scholar] [CrossRef] [Green Version]
  8. Chen, B.Y.; Wang, Y.; Wang, D.; Li, Q.; Lam, W.H.K.; Shaw, S.-L. Understanding the impacts of human mobility on accessibility using massive mobile phone tracking data. Ann. Am. Assoc. Geogr. 2018, 108, 1115–1133. [Google Scholar] [CrossRef]
  9. Liu, L.; Biderman, A.; Ratti, C. Urban Mobility Landscape: Real Time Monitoring of Urban Mobility Patterns. In Proceedings of the International Conference on Computers in Urban Planning and Urban Management, Hong Kong, China, 16–18 June 2009. [Google Scholar]
  10. Ahas, R.; Aasa, A.; Yuan, Y.; Raubal, M.; Smoreda, Z.; Liu, Y.; Ziemlicki, C.; Tiru, M.; Zook, M. Everyday space–time geographies: Using mobile phone-based sensor data to monitor urban activity in Harbin, Paris, and Tallinn. Int. J. Geogr. Inf. Sci. 2015, 29, 2017–2039. [Google Scholar] [CrossRef]
  11. Calabrese, F.; Diao, M.; Di Lorenzo, G.; Ferreira, J.; Ratti, C. Understanding individual mobility patterns from urban sensing data: A mobile phone trace example. Transp. Res. Part C Emerg. Technol. 2013, 26, 301–313. [Google Scholar] [CrossRef]
  12. Fang, Z.; Yang, X.; Xu, Y.; Shaw, S.L.; Yin, L. Spatiotemporal model for assessing the stability of urban human convergence and divergence patterns. Int. J. Geogr. Inf. Sci. 2017, 31, 2119–2141. [Google Scholar] [CrossRef]
  13. Zhong, C.; Manley, E.; Müller Arisona, S.; Batty, M.; Schmitt, G. Measuring variability of mobility patterns from multiday smart-card data. J. Comput. Sci. 2015, 9, 125–130. [Google Scholar] [CrossRef]
  14. Singh, P.; Oh, K.; Jung, J.-Y. Flow Orientation Analysis for Major Activity Regions Based on Smart Card Transit Data. ISPRS Int. J. Geo. Inf. 2017, 6, 318. [Google Scholar] [CrossRef] [Green Version]
  15. Siła-Nowicka, K.; Vandrol, J.; Oshan, T.; Long, J.A.; Demšar, U.; Fotheringham, A.S. Analysis of human mobility patterns from GPS trajectories and contextual information. Int. J. Geogr. Inf. Sci. 2016, 30, 881–906. [Google Scholar] [CrossRef] [Green Version]
  16. Xu, Y.; Shaw, S.L.; Zhao, Z.; Yin, L.; Fang, Z.; Li, Q. Understanding aggregate human mobility patterns using passive mobile phone location data: A home-based approach. Transportation 2015, 42, 625–646. [Google Scholar] [CrossRef]
  17. García-Palomares, J.C.; Salas-Olmedo, M.H.; Moya-Gómez, B.; Condeço-Melhorado, A.; Gutiérrez, J. City dynamics through Twitter: Relationships between land use and spatiotemporal demographics. Cities 2018, 72, 310–319. [Google Scholar] [CrossRef]
  18. Chua, A.; Servillo, L.; Marcheggiani, E.; Moere, A. Vande Mapping Cilento: Using geotagged social media data to characterize tourist flows in southern Italy. Tour. Manag. 2016, 57, 295–310. [Google Scholar] [CrossRef]
  19. Xie, K.; Xia, C.; Grinberg, N.; Schwartz, R.; Naaman, M. Robust detection of hyper-local events from geotagged social media data. In Proceedings of the Thirteenth International Workshop on Multimedia Data Mining, Chicago, IL, USA, 11 August 2013; pp. 1–9. [Google Scholar]
  20. Long, Y.; Thill, J.C. Combining smart card data and household travel survey to analyze jobs-housing relationships in Beijing. Comput. Environ. Urban Syst. 2015, 53, 19–35. [Google Scholar] [CrossRef] [Green Version]
  21. Deng, Z.; Ji, M. Deriving rules for trip purpose identification from GPS travel survey data and land use data: A machine learning approach. In Proceedings of the 7th International Conference on Traffic and Transportation Studies, Kuming, China, 3–5 August 2010; pp. 768–777. [Google Scholar]
  22. Sun, X.; Wilmot, C.G.; Kasturi, T. Household travel, household characteristics, and land use: An empirical study from the 1994 Portland activity-based travel survey. Transp. Res. Rec. 1998, 1617, 10–17. [Google Scholar] [CrossRef]
  23. Jurdak, R.; Zhao, K.; Liu, J.; AbouJaoude, M.; Cameron, M.; Newth, D. Understanding human mobility from Twitter. PLoS ONE 2015, 10, e0131469. [Google Scholar] [CrossRef]
  24. Malik, M.M.; Lamba, H.; Nakos, C.; Pfeffer, J. Population bias in geotagged tweets. In Proceedings of the 2015 ICWSM Workshop on Standards and Practices in Large-scale Social Media Research, Oxford, UK, 26–29 May 2015; Volume 1, pp. 18–27. [Google Scholar]
  25. Chen, S.; Yuan, X.; Wang, Z.; Guo, C.; Liang, J.; Wang, Z.; Zhang, X.; Zhang, J. Interactive visual discovering of movement patterns from sparsely sampled geo-tagged social media data. IEEE Trans. Vis. Comput. Graph. 2015, 22, 270–279. [Google Scholar] [CrossRef]
  26. Järv, O.; Tenkanen, H.; Toivonen, T. Enhancing spatial accuracy of mobile phone data using multi-temporal dasymetric interpolation. Int. J. Geogr. Inf. Sci. 2017, 31, 1630–1651. [Google Scholar] [CrossRef]
  27. Chen, J.; Pei, T.; Shaw, S.L.; Lu, F.; Li, M.; Cheng, S.; Liu, X.; Zhang, H. Fine-grained prediction of urban population using mobile phone location data. Int. J. Geogr. Inf. Sci. 2018, 32, 1770–1786. [Google Scholar] [CrossRef]
  28. Kubíček, P.; Konečný, M.; Stachoň, Z.; Shen, J.; Herman, L.; Řezník, T.; Staněk, K.; Štampach, R.; Leitgeb, Š. Population distribution modelling at fine spatio-temporal scale based on mobile phone data. Int. J. Digit. Earth 2019, 12, 1319–1340. [Google Scholar] [CrossRef]
  29. Calabrese, F.; Colonna, M.; Lovisolo, P.; Parata, D.; Ratti, C. Real-time urban monitoring using cell phones: A case study in Rome. IEEE Trans. Intell. Transp. Syst. 2011, 12, 141–151. [Google Scholar] [CrossRef]
  30. Calabrese, F.; Ferrari, L.; Blondel, V.D. Urban Sensing Using Mobile Phone Network Data: A Survey of Research. ACM Comput. Surv. 2014, 47, 1–20. [Google Scholar] [CrossRef]
  31. Sagl, G.; Blaschke, T.; Beinat, E.; Resch, B. Ubiquitous geo-sensing for context-aware analysis: Exploring relationships between environmental and human dynamics. Sensors 2012, 12, 9800–9822. [Google Scholar] [CrossRef]
  32. Yuan, Y.; Raubal, M. Extracting dynamic urban mobility patterns from mobile phone data. In Geographic Information Science; Xiao, N., Kwan, M.P., Goodchild, M.F., Shekhar, S., Eds.; Springer: Berlin/Heidelberg, Germany, 2012; pp. 354–367. [Google Scholar]
  33. Deville, P.; Linard, C.; Martin, S.; Gilbert, M.; Stevens, F.R.; Gaughan, A.E.; Blondel, V.D.; Tatem, A.J. Dynamic population mapping using mobile phone data. Proc. Natl. Acad. Sci. USA 2014, 111, 15888–15893. [Google Scholar] [CrossRef] [PubMed] [Green Version]
  34. Calafiore, A.; Palmer, G.; Comber, S.; Arribas-Bel, D.; Singleton, A. A geographic data science framework for the functional and contextual analysis of human dynamics within global cities. Comput. Environ. Urban Syst. 2021, 85, 101539. [Google Scholar] [CrossRef]
  35. Schneider, C.M.; Belik, V.; Couronné, T.; Smoreda, Z.; González, M.C. Unravelling daily human mobility motifs. J. R. Soc. Interface 2013, 10, 20130246. [Google Scholar] [CrossRef] [Green Version]
  36. Jiang, S.; Ferreira, J.; Gonzalez, M.C. Activity-Based Human Mobility Patterns Inferred from Mobile Phone Data: A Case Study of Singapore. IEEE Trans. Big Data 2017, 3, 208–219. [Google Scholar] [CrossRef] [Green Version]
  37. Jiang, S.; Fiore, G.A.; Yang, Y.; Ferreira, J.; Frazzoli, E.; González, M.C. A review of urban computing for mobile phone traces: Current methods, challenges and opportunities. In Proceedings of the ACM SIGKDD International Conference on Knowledge Discovery and Data Mining, Chicago, IL, USA, 11–14 August 2013. [Google Scholar]
  38. Widhalm, P.; Yang, Y.; Ulm, M.; Athavale, S.; González, M.C. Discovering urban activity patterns in cell phone data. Transportation 2015, 42, 597–623. [Google Scholar] [CrossRef] [Green Version]
  39. Yang, Y.; Widhalm, P.; Athavale, S.; González, M.C. Mobility sequence extraction and labeling using sparse cell phone data. In Proceedings of the 30th AAAI Conference on Artificial Intelligence (AAAI 2016), Phoenix, AZ, USA, 12–17 February 2018; pp. 4276–4277. [Google Scholar]
  40. Phithakkitnukoon, S.; Horanont, T.; Di Lorenzo, G.; Shibasaki, R.; Ratti, C. Activity-aware map: Identifying human daily activity pattern using mobile phone data. In Human Behavior Understanding; Salah, A., Gevers, T., Sebe, N., Vinciarelli, A., Eds.; Springer: Berlin/Heidelberg, Germany, 2010; Volume 6219, pp. 14–25. [Google Scholar]
  41. Liu, F.; Janssens, D.; Wets, G.; Cools, M. Annotating mobile phone location data with activity purposes using machine learning algorithms. Expert Syst. Appl. 2013, 40, 3299–3311. [Google Scholar] [CrossRef] [Green Version]
  42. Noulas, A.; Mascolo, C.; Frias-Martinez, E. Exploiting foursquare and cellular data to infer user activity in urban environments. In Proceedings of the—IEEE International Conference on Mobile Data Management, Milan, Italy, 3–6 June 2013; Volume 1, pp. 167–176. [Google Scholar]
  43. Tu, W.; Cao, J.; Yue, Y.; Shaw, S.L.; Zhou, M.; Wang, Z.; Chang, X.; Xu, Y.; Li, Q. Coupling mobile phone and social media data: A new approach to understanding urban functions and diurnal patterns. Int. J. Geogr. Inf. Sci. 2017, 31, 2331–2358. [Google Scholar] [CrossRef]
  44. Diao, M.; Zhu, Y.; Ferreira, J.; Ratti, C. Inferring individual daily activities from mobile phone traces: A Boston example. Environ. Plan. B Plan. Des. 2016, 43, 920–940. [Google Scholar] [CrossRef] [Green Version]
  45. Dalcanale, F. Polymer Derived Ceramics Process in Biomedical Applications: Pacemaker Electrode; ETH Zurich: Zürich, Switzerland, 2017; p. 147. [Google Scholar]
  46. Gov.UK. National Travel Survey. Available online: https://www.gov.uk/government/collections/national-travel-survey-statistics#latest-national-travel-survey-statistics (accessed on 9 August 2021).
  47. Ulm, M.; Widhalm, P.; Brändle, N. Characterization of mobile phone localization errors with OpenCellID data. In Proceedings of the IEEE International Conference on Advanced Logistics and Transport, Valenciennes, France, 20–22 May 2015; pp. 100–104. [Google Scholar]
  48. Zhong, G.; Wan, X.; Zhang, J.; Yin, T.; Ran, B. Characterizing passenger flow for a transportation hub based on mobile phone data. IEEE Trans. Intell. Transp. Syst. 2016, 18, 1507–1518. [Google Scholar] [CrossRef]
  49. Lin, H.-P.; Juang, R.-T.; Lin, D.-B. Validation of an improved location-based handover algorithm using GSM measurement data. IEEE Trans. Mob. Comput. 2005, 4, 530–536. [Google Scholar]
  50. Horn, C.; Klampfl, S.; Cik, M.; Reiter, T. Detecting outliers in cell phone data. Transp. Res. Rec. 2014, 2405, 49–56. [Google Scholar] [CrossRef] [Green Version]
  51. Benamira, A.; Devillers, B.; Lesot, E.; Ray, A.K.; Saadi, M.; Malliaros, F.D. Semi-supervised learning and graph neural networks for fake news detection. In Proceedings of the 2019 IEEE/ACM International Conference on Advances in Social Networks Analysis and Mining (ASONAM), Vancouver, BC, Canada, 27–30 August 2019; pp. 568–569. [Google Scholar]
  52. Ahas, R.; Aasa, A.; Silm, S.; Tiru, M. Daily rhythms of suburban commuters’ movements in the Tallinn metropolitan area: Case study with mobile positioning data. Transp. Res. Part C Emerg. Technol. 2010, 18, 45–54. [Google Scholar] [CrossRef]
  53. Qu, M.; Bengio, Y.; Tang, J. GMNN: Graph markov neural networks. arXiv 2019, arXiv:1905.06214. [Google Scholar]
  54. Xu, B.; Huang, J.; Hou, L.; Shen, H.; Gao, J.; Cheng, X. Label-Consistency based Graph Neural Networks for Semi-supervised Node Classification. In Proceedings of the 43rd International ACM SIGIR Conference on Research and Development in Information Retrieval, Xi’an, China, 25–30 July 2020; pp. 1897–1900. [Google Scholar]
  55. Tobler, W.R. A Computer Movie Simulating Urban Growth in the Detroit Region. Econ. Geogr. 1970, 46, 234. [Google Scholar] [CrossRef]
  56. Aspelin, K.; Carey, N. Establishing Pedestrian Walking Speeds. Project Report, Portland State University, ITE Student Chapter. 2005, pp. 5–25. Available online: https://www.google.rs/url?sa=t&rct=j&q=&esrc=s&source=web&cd=&ved=2ahUKEwiVkdavkqvyAhVNgf0HHcWdBjgQFnoECAQQAQ&url=https%3A%2F%2Fwww.westernite.org%2Fdatacollectionfund%2F2005%2Fpsu_ped_summary.pdf&usg=AOvVaw1HWxPDg8rfHi0wmweJys6Y (accessed on 9 August 2021).
  57. Hasan, S.; Zhan, X.; Ukkusuri, S.V. Understanding urban human activity and mobility patterns using large-Scale location-based data from online social media. In Proceedings of the 2nd ACM SIGKDD International Workshop on Urban Computing, Chicago Sheraton, Chicago, IL, USA, 11–14 August 2013; pp. 1–8. [Google Scholar]
  58. Toole, J.L.; Ulm, M.; González, M.C.; Bauer, D. Inferring land use from mobile phone activity. In Proceedings of the ACM SIGKDD International Workshop on Urban Computing—UrbComp’12, Beijing, China, 12 August 2012; ACM: New York, NY, USA, 2012; pp. 1–8. [Google Scholar]
  59. Liu, X.; Kang, C.; Gong, L.; Liu, Y. Incorporating spatial interaction patterns in classifying and understanding urban land use. Int. J. Geogr. Inf. Sci. 2016, 30, 334–350. [Google Scholar] [CrossRef]
  60. Maat, K.; Van Wee, B.; Stead, D. Land use and travel behaviour: Expected effects from the perspective of utility theory and activity-based theories. Environ. Plan. B Plan. Des. 2005, 32, 33–46. [Google Scholar] [CrossRef] [Green Version]
  61. Zhao, Z.; Shaw, S.-L.; Xu, Y.; Lu, F.; Chen, J.; Yin, L. Understanding the bias of call detail records in human mobility research. Int. J. Geogr. Inf. Sci. 2016, 30, 1738–1762. [Google Scholar] [CrossRef]
  62. China Academy of Urban Planning and Design. Land (GB50137-2011); The Ministry of Housing and Urban-Rural Development of the People’s Republic of China: Beijing, China, 2012; Volume 36, pp. 42–48. [Google Scholar]
Figure 1. An example of someone’s daily activity semantic stay chain. The different colored cylinders indicate various types of urban activities that occur at different times and places.
Ijgi 10 00545 g001
Figure 2. Potential active area judgment method for user “ping-pong” switch and drift data. The horizontal coordinates represent time, the vertical coordinates represent space, the black dots marked with P indicate the location of the base station, the area marked with R represents the potential active area, and the solid blue line with arrows represents the user’s mobility trace.
Ijgi 10 00545 g002
Figure 3. The architecture of UAIM. The characteristic of each node is represented by a white and gray regular rectangle, and a bar chart represents the probability distribution of the activity type labels. The process of the UAIM is composed of four steps, (a) personal daily activity semantic stay chains generation based on MPS data, (b) HW annotation and graph construction, (c) GMNN model training with the results of (b) as input, and (d) the output of activity type recognition result.
Ijgi 10 00545 g003
Figure 4. Graph connection construction rules of UAIM. All activities except Home (‘H’) and Work (‘W’) are marked as ‘O’. (a)–(d) are the constructing topological graph rules based on spatial neighborhood relationships and labeled Home/Work nodes.
Ijgi 10 00545 g004
Figure 5. Activity type inference accuracy results of the experimental data set. (a) Activity type inference accuracy of each group set (a set contains 10,000 user daily activity chains); (b) Accuracy improvement process of a single model training.
Ijgi 10 00545 g005
Figure 6. Major daily activity mobility patterns and the proportion of volume in each pattern. (a) Top ten Human Activity Patterns (HAP). (b) The statistical distribution of HAP ratios.
Ijgi 10 00545 g006
Figure 7. Temporal heat map of various urban activities modeled and recognized in this paper.
Ijgi 10 00545 g007
Figure 8. The spatial distribution of “Home” and the spatial pattern of residential areas within the main urban area. (a) The distribution of “Home” activity is estimated by spatial interpolation method. The data source for the residential land is the community profile data (AOIs) from the Open Online map website (b).
Ijgi 10 00545 g008
Figure 9. The spatial distribution of “Shopping and Catering” and the density distribution of commercial service facilities within the main urban area. The spatial distribution of commercial service land in (b) was obtained based on the kernel density analysis of commercial service POIs. The closed borders of “Major commercial areas” and “Dense commercial areas” identified from (b) are added to (a).
Ijgi 10 00545 g009
Table 1. Experimental data composition and description.
Data SetTypeScaleMemory MediumData Organization
Mobile location dataOriginal data150 GBHDFSUser ID, time, Cell ID, latitude, and longitude of a base station
AOI dataGIS data8861GDBShape, name, land use type, area
Activity chainsIntermediate data2.6 GBHDFSUser ID, daily activity chain (each node is composed of stop area ID, arrival time, and stay duration)
Manually annotate datasetSample data1759 user chains 1TXTSame as above
Network Relationship Data Sets (Edges)Graph relational data49.009 million recordsTXTThe ID of a stay node, the ID of the associated node
Activity Feature Data Set (Nodes)Feature vector data13.678 million recordsTXTThe ID of a stay node, time-dimensional feature (144 entries), space-dimensional feature (8 entries)
1 The manually labeled sample size here is 1% of the remaining user daily activity chains, excluding 1.3 million users who only stay at home or workplace during this day.
Table 2. Model training parameters and environment settings.
ParameterValuesIllustration
v n o r m a l 4.96 ft/sMaximum average pedestrian walking speed of young people [56]
Neuronal activation functionReLU (Rectified linear unit)Piecewise linear function with one-sided suppression
Hidden dimension16Multi-level abstraction of input features
Dropout0.5At this time, the randomly generated network structure is the most
Iteration10Number of iterations
Epochs200Training times
DrawMax-poolingPooling method
optimizerRMSpropOptimizer algorithm
Lr0.01Learning rate
Lr decay5 × 10−4Learning rate attenuation rate
Table 3. Evaluation of UAIM Model and RMNs-based Model Results.
ModelAccuracyRecall
UAIM87.4228%100%
RMNs-based Neural Network Model65.6133%79%
Table 4. Statistical distribution of the number of people in various types of urban activities in Nanjing on April 8.
ActivitiesH (Home)W (Work)S (Shopping and Catering)T (Leisure and Recreation)M (Medical)G (Sports)
Number (thousand)3974.1142482.62584.04220.75625.5840.274
Ratio60.329%37.688%1.276%0.315%0.388%0.004%
Publisher’s Note: MDPI stays neutral with regard to jurisdictional claims in published maps and institutional affiliations.

