
Zero Watermarking for the TIN DEM Data Based on the Edge Length


1
Key Laboratory of Virtual Geographic Environment (Nanjing Normal University), Ministry of Education, Nanjing 210023, China
2
State Key Laboratory Cultivation Base of Geographical Environment Evolution, Nanjing 210023, China
3
Jiangsu Center for Collaborative Innovation in Geographical Information Resource Development and Application, Nanjing 210023, China
*
Author to whom correspondence should be addressed.
ISPRS Int. J. Geo-Inf. 2021, 10(8), 559; https://0-doi-org.brum.beds.ac.uk/10.3390/ijgi10080559
Submission received: 6 July 2021
/
Revised: 13 August 2021
/
Accepted: 15 August 2021
/
Published: 18 August 2021
(This article belongs to the Special Issue Geomorphometry and Terrain Analysis)
Abstract
:How to keep the fidelity of the digital elevation model (DEM) data is a crucial problem in the current watermarking research, as the watermarked DEM data need to preserve their accuracy. We proposed a zero watermarking method for the triangulated irregular network (TIN) DEM data. It takes full advantage of the characteristics of the edge length in the TIN DEM data. First, the radio of the edge lengths is quantified to the watermark index, and then the comparison of the edge lengths is quantified to the watermark bit. Finally, the watermark is constructed by combing the watermark bits according to the watermark indices with the help of the majority voting mechanism. In the method, the TIN DEM data are only used to construct the watermark, not to be embedded by the watermark. Therefore, the data quality is preserved to the greatest extent. Experiments verify the theoretical achievements of this method and demonstrate the method is lossless to the TIN DEM data. Simulation results also show that the method has good robustness on translation, rotation, scaling, and cropping attacks.
1. Introduction
Digital elevation model (DEM) data is one of the most common data in geographic analysis, and its application scenarios are fairly extensive [1,2,3,4]. The security of the DEM data has always been the research hotspot [5,6,7], in which digital watermarking is the main approach for copyright protection and integrity authentication for the DEM data [8,9]. Digital watermarking refers to the practice of imperceptibly modifying the data to embed watermark information, whether in the space domain or the transform domain [10,11,12]. However, Lü & Liu [13] found that watermarking cannot avoid DEM quality degradation through studying watermarking algorithms which consider visual models. This has an inevitable impact on the accuracy of the DEM data and makes watermarked DEM data limitable in geographical applications. Thus, addressing the contradiction between copyright protection and practical application is a hot issue in DEM watermarking research.
The DEM watermarking algorithms can be divided into two categories: The first category is reversible watermarking [14,15]. This type of method ensures the original data is lossless through compression or other means when embedding watermarks. The watermark is eliminated, and the original data is restored after extracting the watermark. For example, literature [16] embeds the watermark by modifying the generalized histogram of the DEM data and can restore the original data losslessly without the help of the original data. This kind of method preserves the accuracy of the DEM data through a reversible process of watermark embedding and eliminating. However, its shortcomings are very obvious. Because the watermark is removed during the watermark extraction process, the DEM data will be no longer protected by watermarking.
The second category is non-reversible watermarking [17,18]. Contrary to reversible watermarking, this type of method always keeps the embedded watermark within the DEM data instead of deleting it in the process of watermark extracting. This method achieves near-lossless [19] on the DEM data accuracy by controlling the watermark embedding position [20,21], embedding strength [22,23], etc. For example, literature [21] believes that the slope error of the DEM data is mainly concentrated in flat areas, so it embeds watermarks in regions with large terrain complexity using wavelet transform. When the slope and aspect precisions of the DEM data are given, the literature [22] derives an adaptive model in which the watermark embedding strength can be decided automatically by the quality demands of the slope and the aspect. This type of method meets the accuracy requirements of the DEM data under certain conditions. However, the embedded watermark does change the data accuracy of the DEM data. Further, the usage of the watermarked DEM data is greatly limited, especially in scenarios with high fidelity requirements, such as flood storage calculations and military combat simulations.
Based on the above analysis, it can be seen that reversible watermarking makes the DEM data accuracy lossless by embedding and then removing the watermark, while the DEM data is no longer protected by the watermark. Non-reversible watermarking achieves near-lossless by adjusting the watermark instead of removing it from the DEM data. However, once the watermark is kept within the DEM data, the data quality will be damaged to a certain degree. Therefore, how to preserve the DEM data accuracy in watermarking is a critical issue.
Aiming to address the issue, we propose a zero watermarking algorithm based on the edge length for the triangulated irregular network (TIN) DEM data. Zero watermarking is a kind of digital watermarking technology without modifying the original data, which constructs a watermark from the data and then registers the watermark in a third-party intellectual property rights (IPR) repository [24,25,26]. Based on the working principle of zero watermarking, the watermark of the proposed method is constructed from the characteristics of the edge length and registered in the IPR repository instead of being embedded in the TIN DEM data. Consequently, there is no degradation to the TIN DEM data. It is also the first time introducing zero watermarking to the TIN DEM data in the state-of-the-art of watermarking research. The remainder of this paper is organized as follows. Section 2 introduces the methodology. Section 3 gives the experimental design. In Section 4, experimental results and analyses are presented. Then, Section 5 provides discussions. Finally, Section 6 concludes this paper.
2. Methodology
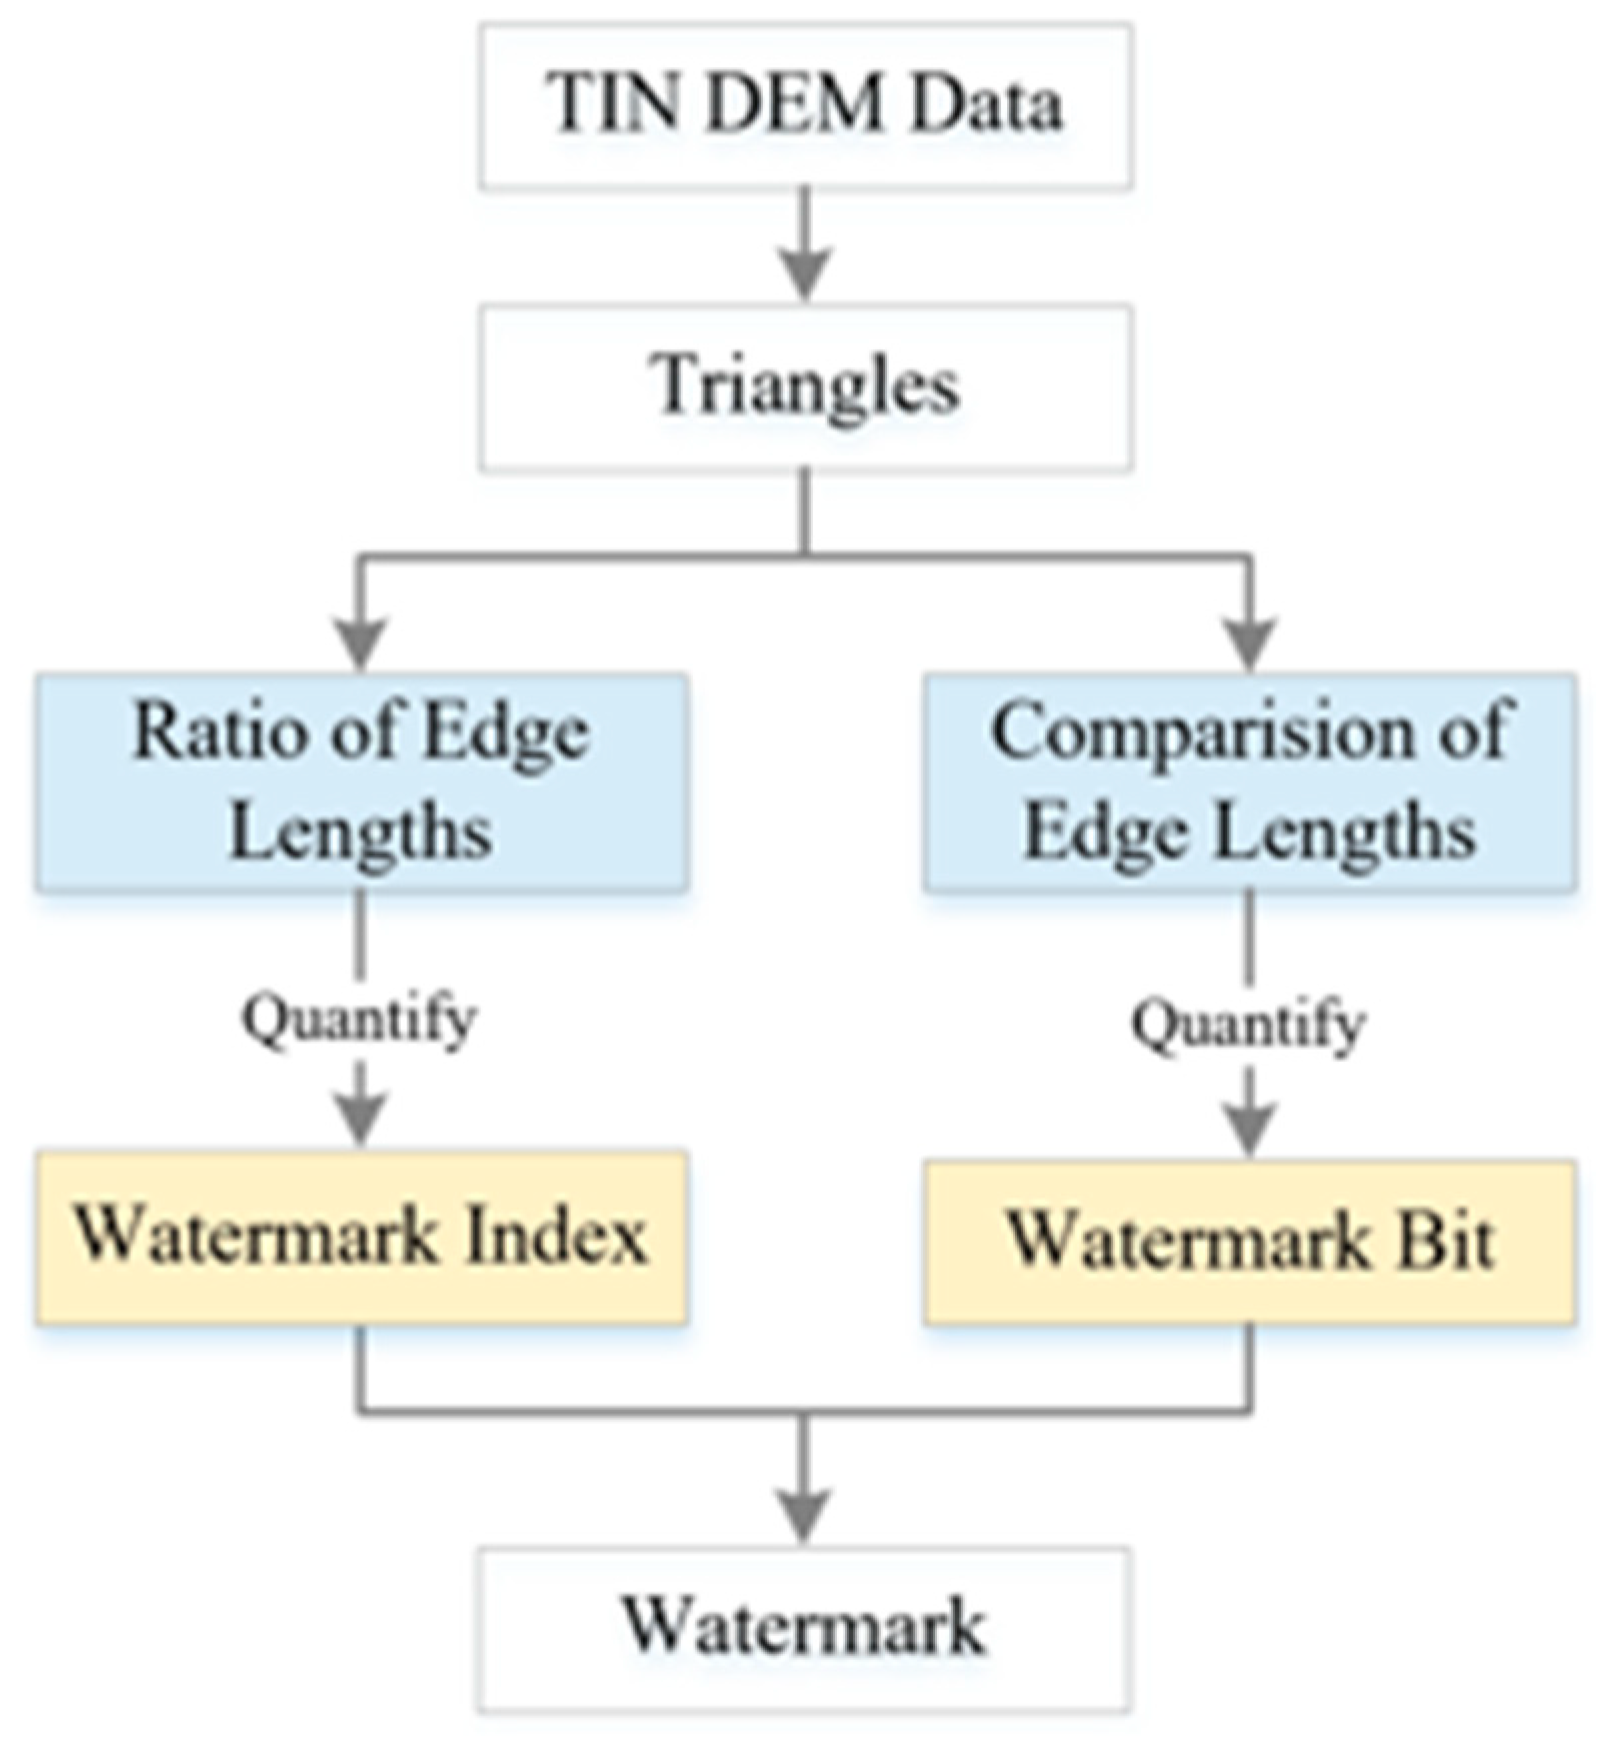
This paper employs the TIN DEM data as the target of watermarking. In the TIN DEM data, the TIN represents a surface as contiguous non-overlapping triangles [27] (p. 164). Each triangle is composed of vertices and edges. It is based on the relationship between the edge lengths that we proposed a zero watermarking algorithm. The main framework of the proposed method is shown in Figure 1, in which we focus on the construction of the zero watermark. First, collect all the triangles from the original data. Then, the ratio of edge lengths is quantified to the watermark index for every triangle. Similarly, the comparison of the edge lengths is quantified to the watermark bit. In this way, each triangle gets a watermark index and a watermark bit. Finally, combine the watermark indices and the watermark bits into a watermark.
2.1. Zero Watermarking
As a kind of watermarking technology, zero watermarking has been widely applied in copyright protection for many different types of data [28,29,30,31]. One does not embed a watermark in the data in the zero watermarking scheme but constructs a watermark from the features of the data. The constructed watermark is registered and stored in a third-party IPR repository. When checking whether a data contains a watermark, construct the watermark from the data first, and then compare it with the registered watermark in the IPR repository. If the correlation of the two watermarks meets a specific condition, the suspected data is considered to contain the registered watermark. It is easy to see that the data keeps raw in the process of zero watermarking. This is also the reason why zero watermarking does not cause data precision degraded.
In particular, the core part of zero watermarking involves the selection of the stable characteristic and the construction of the watermark. A stable characteristic means that no matter what type and intensity of attacks the data are subjected to, the characteristic should maintain unchanged or slightly changed. The robustness of zero watermarking mainly comes from this. Base on the stable characteristic, the watermark is constructed using quantization approaches. In the proposed method, the relationship of edge lengths is the stable characteristic of the TIN DEM data. The watermark construction will be described in detail in the following. As for how to choose an authoritative IPR repository and register the constructed watermark, it is not covered in this paper.
2.2. The Usage of Edge Lengths
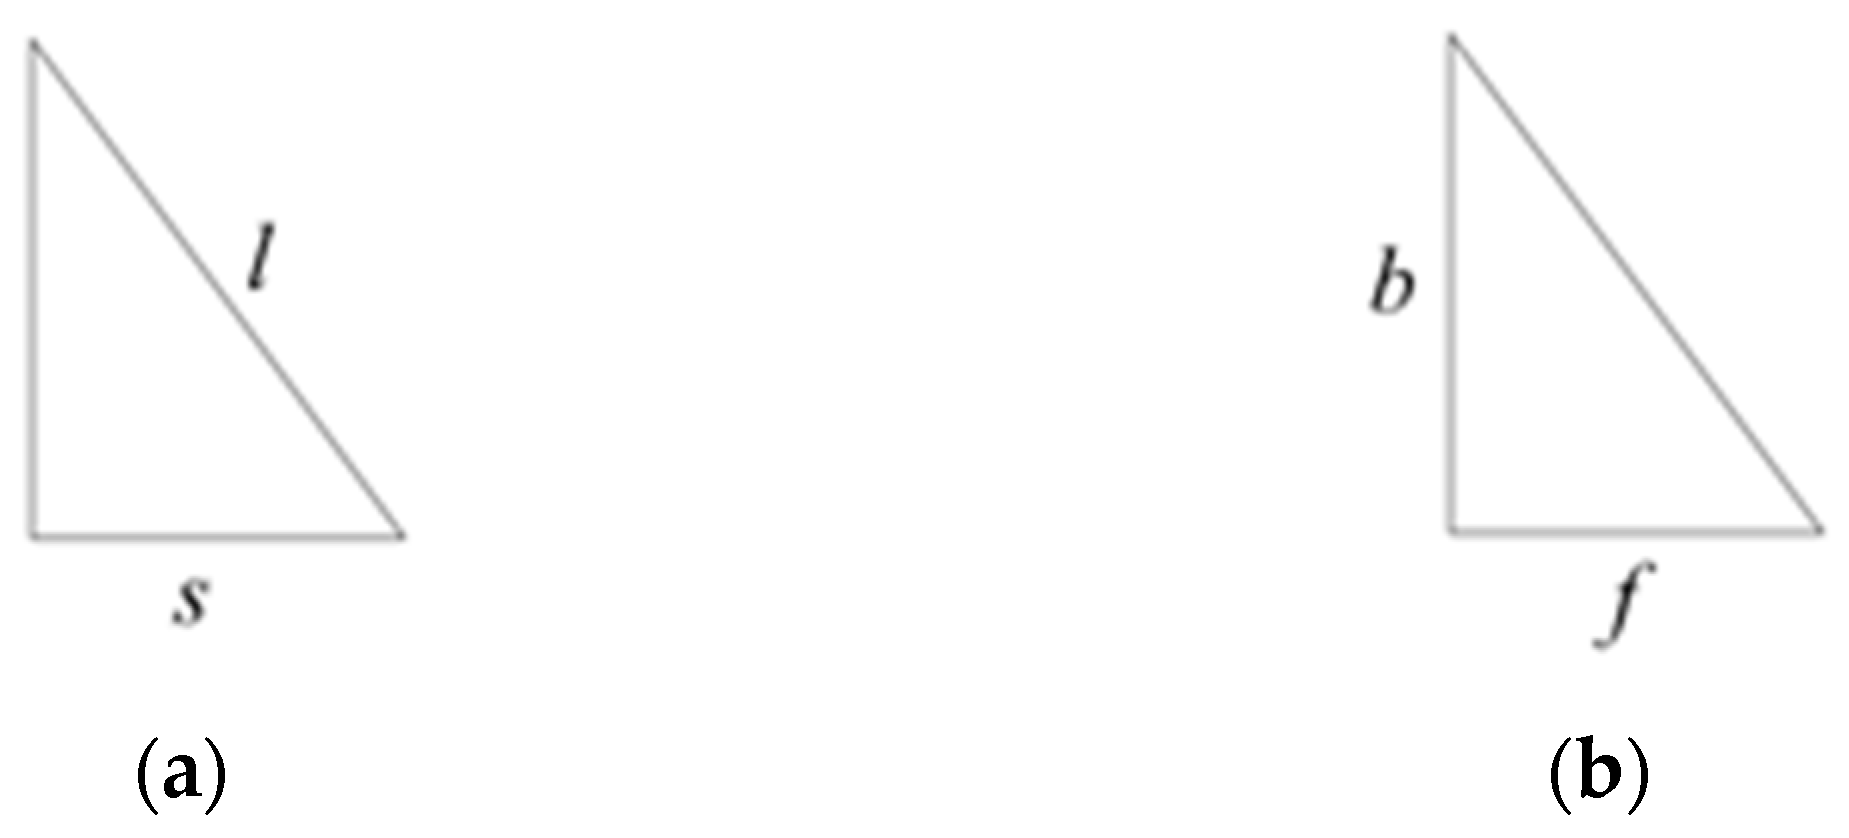
The basis of the proposed method is the usage of edge lengths. The triangle in the TIN DEM data is mapped to one watermark index and one watermark bit. We use a fixed-length binary sequence to represent the watermark, and the watermark bit is 0 or 1. Set the watermark length to N, and then the watermark index ranges from 1 to N. In the triangle of the TIN DEM, there are three edges. We denoted the length of the longest edge as l and that of the shortest one as s. The ratio of l and s is quantified to the watermark index by using the following equation:
where Mod is the modulo operation, ⌊⌋ is the floor rounding, and c is the expansion factor that can adjust the distribution of the watermark index.
Then, observe the three edges clockwise. Take the longest edge as the reference and denote the length of its front one as f and that of the back one as b. The comparison result can be quantified to the watermark bit by using the Equation (2):
Following is a demonstration of the edge usage in Figure 2. It takes a triangle T as an example, the three edges of which are 3, 4, and 5 in length. In Figure 2a, l = 5 and s = 3. If we set N to 32 and c to 1000, then the watermark index of T is 3 calculated by Equation (1). In Figure 2b, b = 4 and f = 3. According to Equation (2), we can obtain that the watermark bit of T is 1.
2.3. Watermark Generation and Extraction
Both watermark generation and watermark extraction belong to the procedure of watermark construction but occur at different times [32]. In the stage of watermark generation, the watermark is constructed from the original data to register in the IPR repository. However, in the stage of watermark extraction, the watermark is constructed from the suspicious data to compare with the registered ones in the IPR repository. As for how to evaluate the comparison results between two watermarks, the details will be given later.
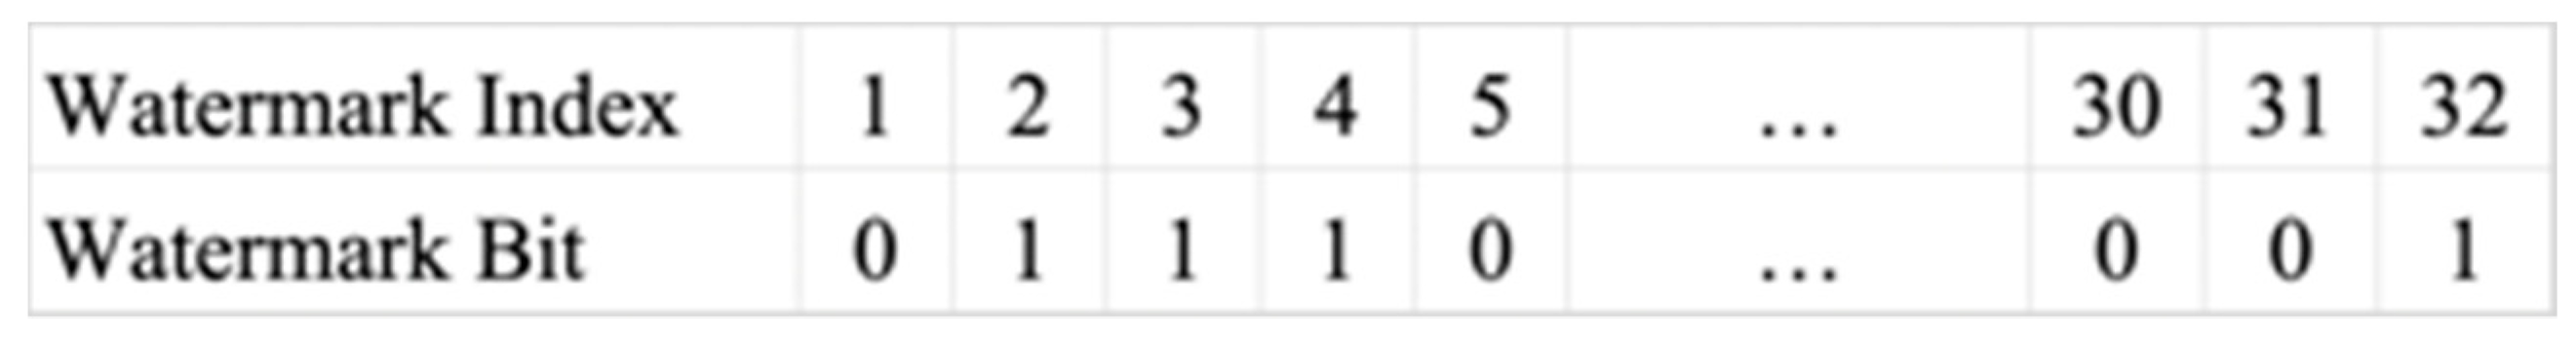
As mentioned above, the watermark we used is a binary sequence with the length N. Supposed that there is a TIN DEM data with M triangles. Based on Section 2.1, we can obtain a watermark index array and a watermark bit array . If there are duplicates in WI, it means that multiple triangles have the same watermark index. In other words, there are multiple watermark bits on one watermark index. Thus, the majority voting mechanism [33,34] will be introduced to figure this out. For a watermark index, if the number of zeros in its watermark bit is more than that of ones, then its watermark bit is 0, otherwise 1. Finally, the watermark is constructed. Figure 3 demonstrates a constructed watermark “01110…001”, where N = 32.
When a data infringement event occurs, we first extract the watermark from the suspicious data and then calculate the correlation with the watermark registered in the IPR repository. The normalized correlation (NC) is employed to indicate the correlation of and , which ranges from 0 to 1. The closer the NC is to 1, the greater the correlation between and . The NC is defined as
Meanwhile, it is necessary to introduce the threshold of the NC, an empirical value [32]. When the NC is larger than or equal to the predefined threshold, the suspicious data corresponding to is considered infringing data.
3. Experiments
3.1. Datasets
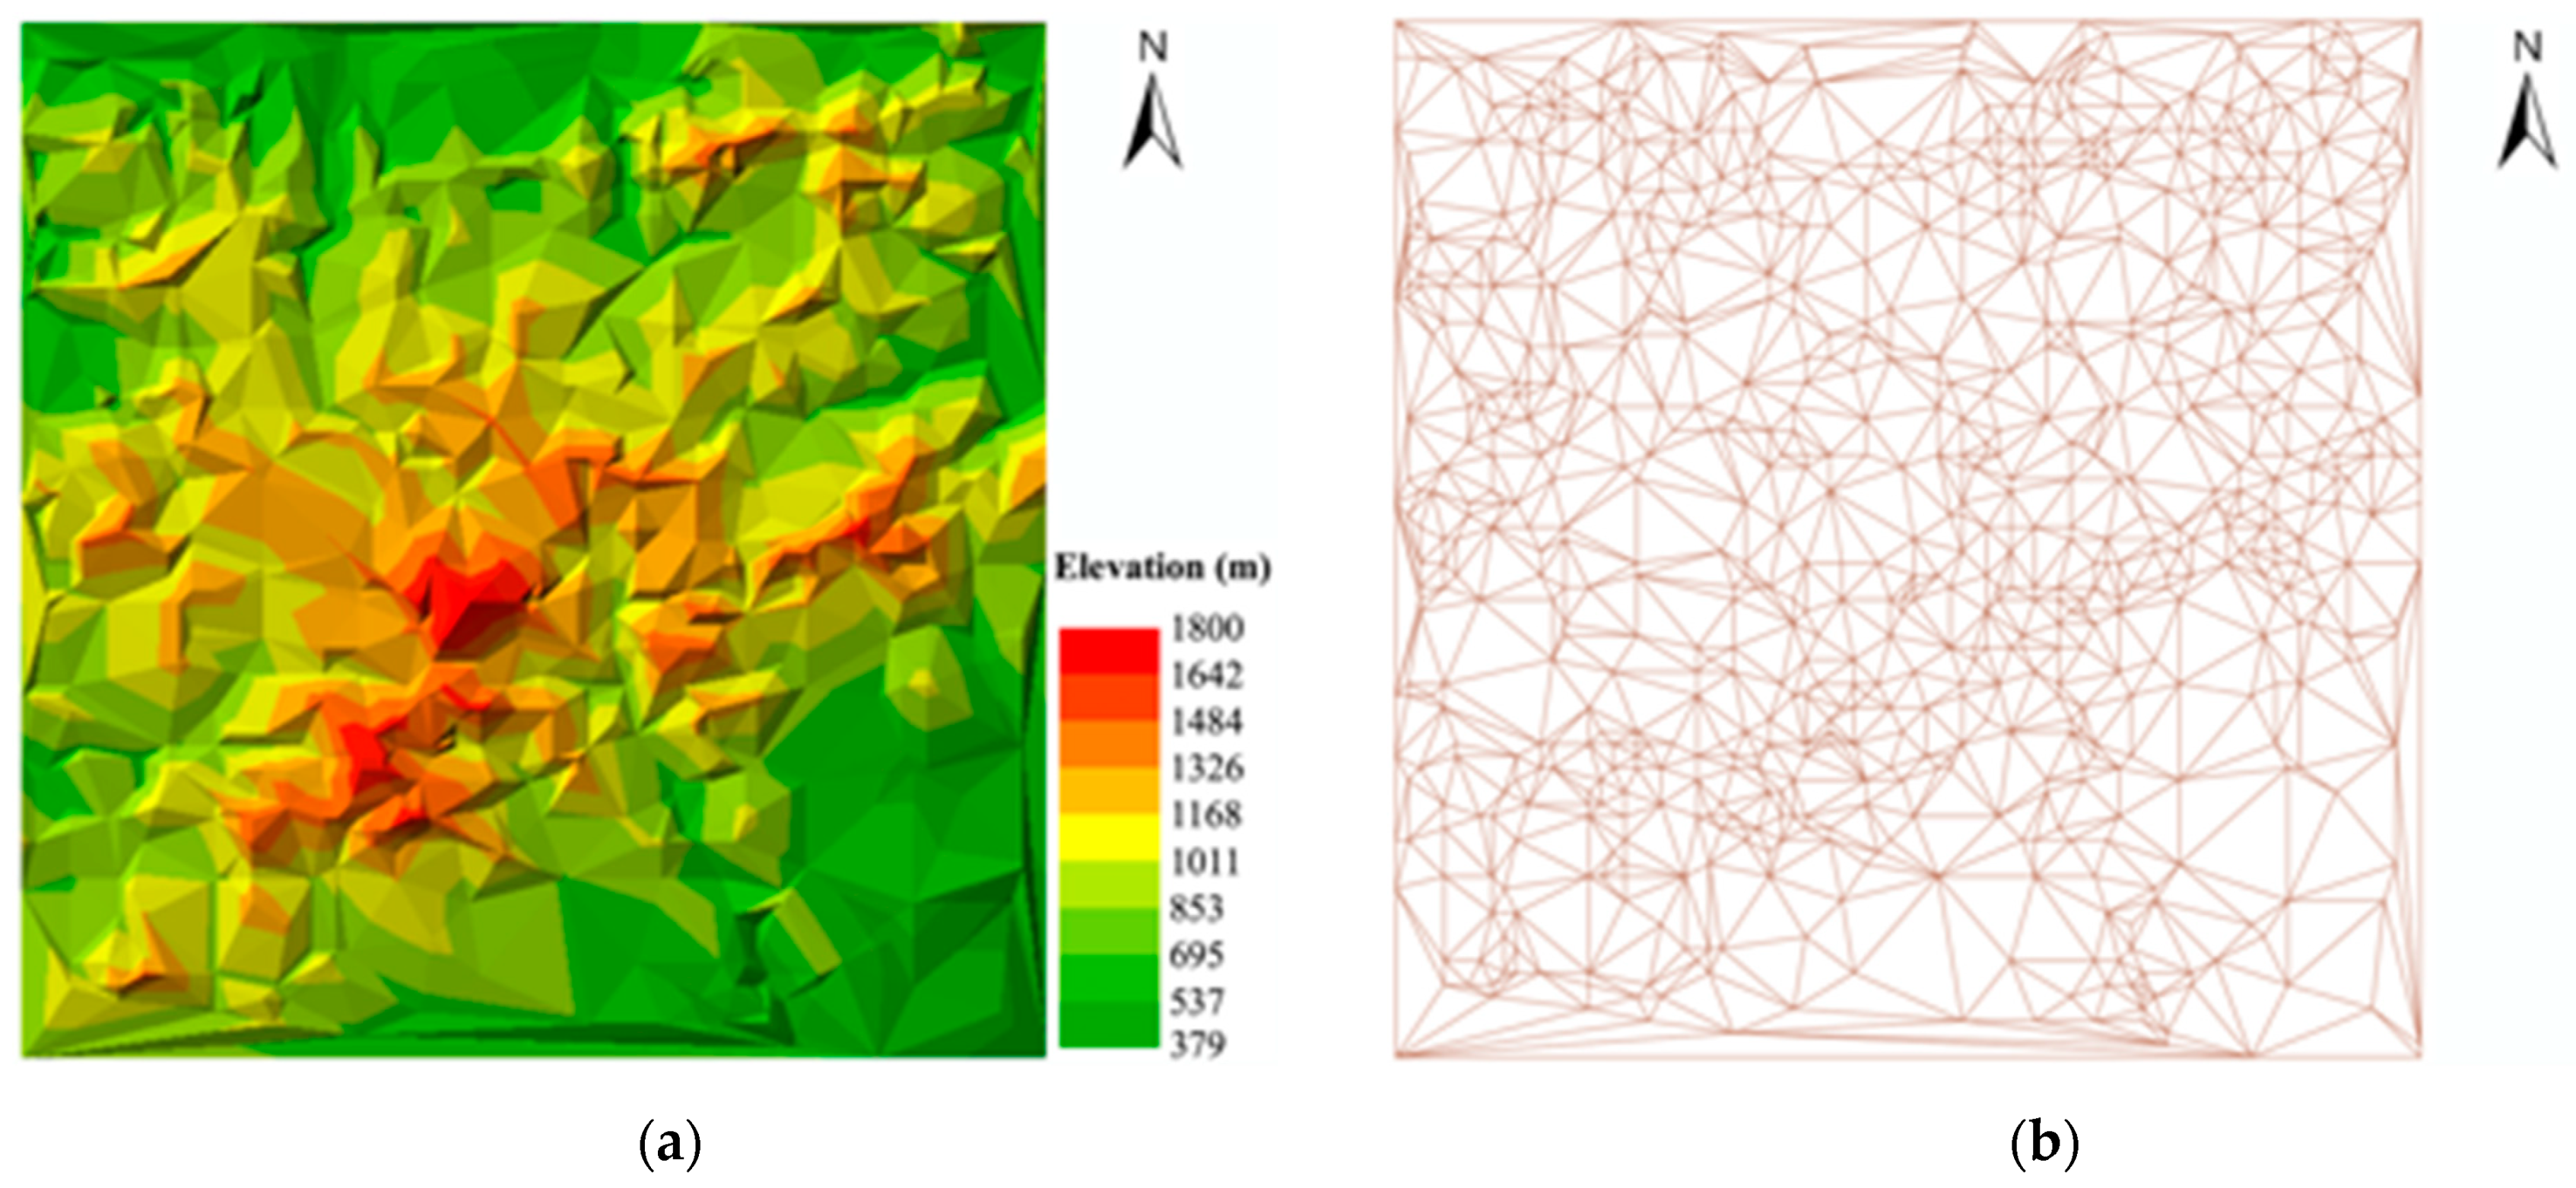
A TIN DEM data from a certain area in China is selected as the experimental data, which belongs to the ESRI TIN format. The TIN DEM data contains 1566 triangles, 796 nodes, and 2361 edges, with elevation from 379 m to 1800 m, as shown in Figure 4. Figure 4a presents the TIN DEM data with a graduated color ramp, from green to yellow and then to red, indicating that the elevation gradually increases. Figure 4b shows the edges of the data. The projection of the data is Gauss–Krüger projection [35,36] in a 3-degree zone with the central meridian 111° E. The corresponding geographic coordinate system is China Geodetic Coordinate System 2000.
3.2. Experiment Design and Implementation
To verify the performance of the proposed algorithm, we design and implement the following experiments. First, in the parameter settings, we set the watermark length N to 32 and the threshold of NC to 0.75. It should be noted that the threshold of NC is an empirical value, so its value refers to the literature [32]. Wei’s method [37] (pp. 32–40) is chosen as the representative of non-reversible watermarking to compare with the proposed method. In Wei’s method, two strategies are adopted to minimize the damage of the precision of the TIN DEM data: (a) By compressing the TIN, only remaining triangles are selected to embed the watermark instead of the whole data. (b) There are three components, x, y, and z, in the node coordinate, but only the x component is selected to embed the watermark. In the compression process, Wei introduces a threshold to determine whether a node should be removed. If the angle between any two normal vectors of all adjacent triangles of a node is less than the threshold, then the node is removed. In the experiment, we set the compression threshold to 5°. Then, under the same conditions, the accuracy analysis and the robustness comparison will be taken for the two methods.
3.2.1. Accuracy Evaluation
Accuracy evaluation is to analyze how much the watermark affects the accuracy of the TIN DEM data. A qualified watermarking algorithm should minimize the impact on data accuracy, meaning that the embedded watermark requires high imperceptibility [38]. The accuracy of the TIN DEM data mainly depends on the coordinate value of the node. However, the change in accuracy not only is reflected in the coordinate value but also in topographic features, such as the slope and the aspect. Therefore, we choose the following four perspectives to implement accuracy evaluation: (a) the error on the XOY plane; (b) the error of the elevation; (c) the error of the slope; (d) the error of the aspect.
Record the nodes of the original data as , where n is the number of nodes, is the coordinate value of the i-th node, and z represents the evaluation. Similarly, record the nodes of the watermarked data as . It is easy to calculate the offsets of the position on the XOY plane and the elevation between P and . Then, statistic maximum, minimum, average, and root mean square error (RMSE). Among them, the first three items are statistics of the absolute value of the error, and the RMSE of the position on the XOY plane is defined as:
In addition to the perspective of coordinates, the evaluation is also carried out from a topographic standpoint. The slope and the aspect are the most commonly used in digital terrain analysis. The slope is expressed as the angle of the inclination from the XOY plane. It can be converted into the angle between the normal vector of the triangle surface and the unit vector of the Z-axis. In a triangle, the three vertices are denoted as P, A, and B, in the counterclockwise direction viewed from the +Z-axis side. Then, the normal vector of the triangle can be calculated by the following equation.
where means cross product. Denote the unit vector of the Z-axis as , then the calculation formula for the slope (in degree) of the triangle is:
where ‖ ‖ means the Euclidean norm and means dot product.
For the triangle surface, the aspect represents the direction of the projection on the XOY plane of its normal vector. We define the aspect as the angle of the projection and the north by convention, which starts from the north (0°) clockwise to the north again (360°). If the normal vector of the triangle is , then one projection of on the XOY plane is . Thus, the aspect (in degree) can be calculated as follows:
where it should be noted that when and are both 0, this means that the surface is a flat area without downslope direction, that is, no aspect. Finally, like the error on the XOY plane and the error of the elevation, the same statistics are also performed on the slope and the aspect.
3.2.2. Robustness Evaluation
Besides imperceptibility, robustness is also an important indicator to evaluate whether a watermarking algorithm is qualified. Robustness refers to the ability to detect the watermark after attacks [39] (p. 40). Strong robustness refers to that watermark information should be retained in watermarked data despite any kinds of attacks. Therefore, some kinds of common attacks are set up in the experiments. Given that the comparison algorithm, Wei’s method, does not modify the elevation to embed the watermark, so the attacks we adopt only operate on the XOY plane. They are translation, rotation, scaling, and cropping attacks.
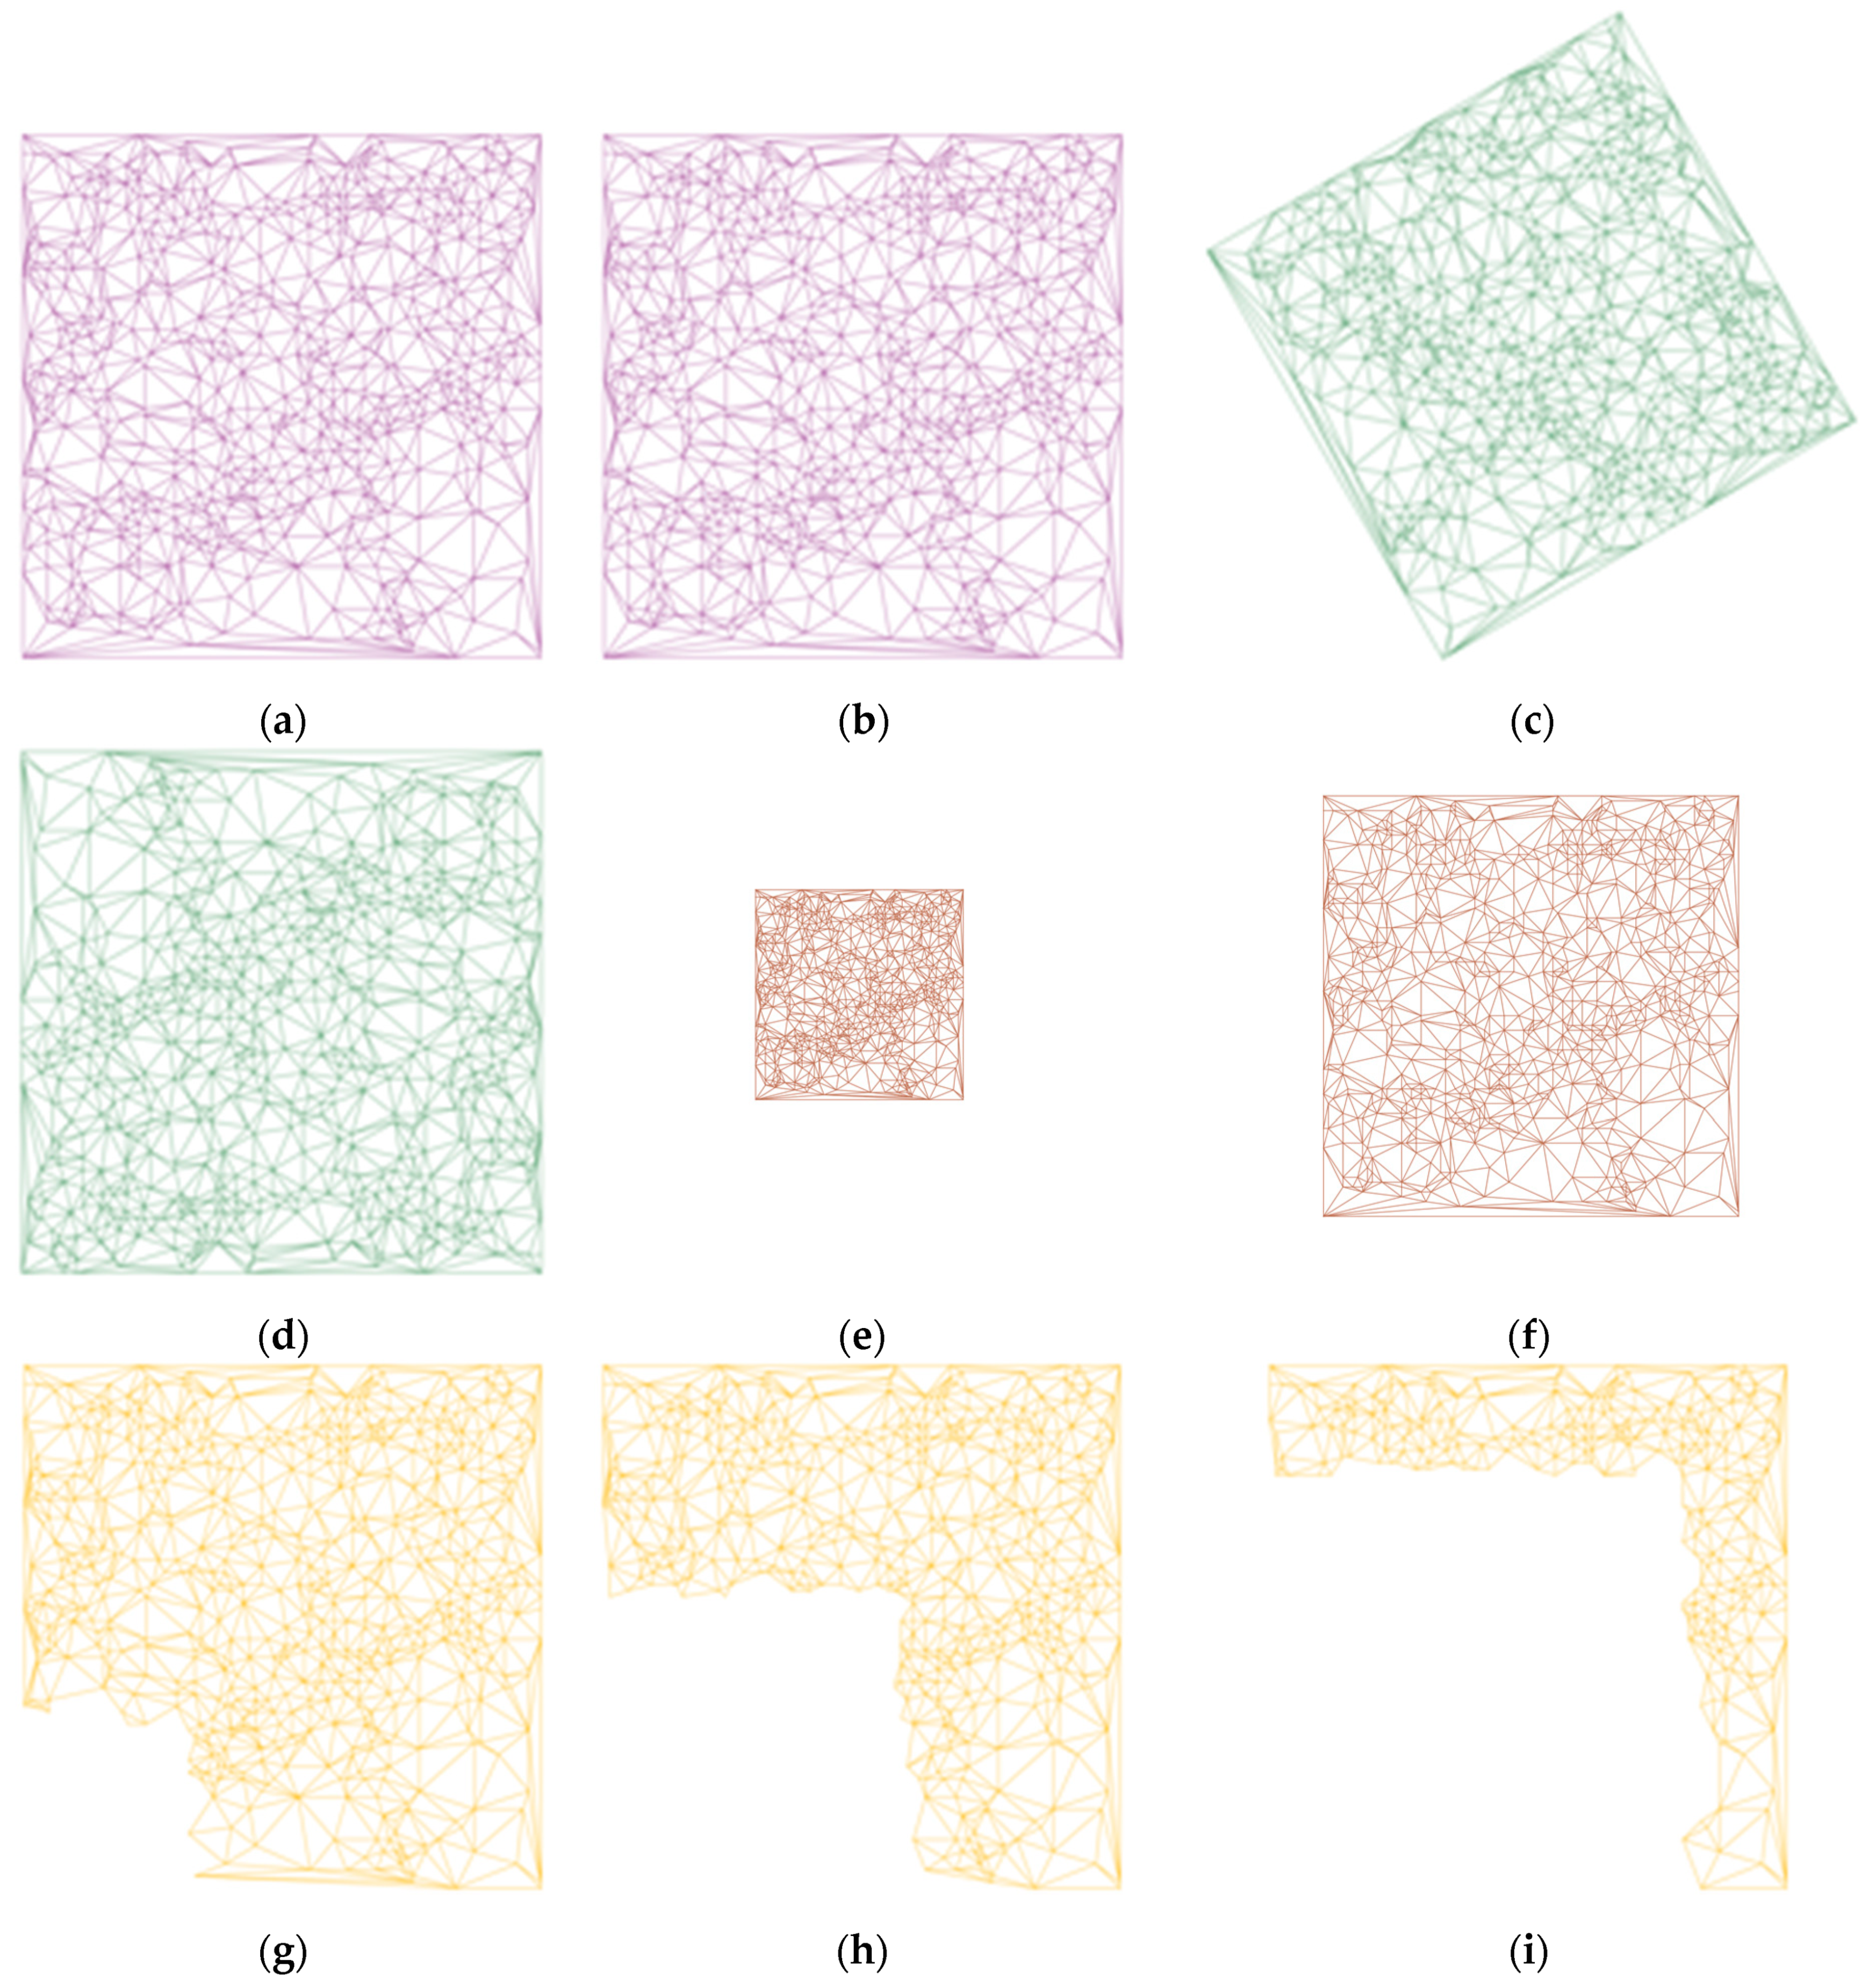
In translation attacks, the TIN DEM data is translated by a certain distance in both the X-axis and Y-axis directions at the same time. This distance is set from 0 m to 600 m with an interval of 100 m. In rotation attacks, we rotate the TIN DEM data clockwise around its center from 0° to 360°, with a gap of 60°. In scaling attacks, the type of uniform scaling is adopted. The scaling factors in the X-axis and the Y-axis directions are equal. The TIN DEM data is scaled with the following scaling factors: 0.4, 0.6, 0.8, 1, 2, 3, and 4. This involves both the reduction and the enlargement of the data scale. As for cropping attacks, we crop a part of the data from the lower-left corner with a cropping ratio. The cropping ratio is calculated by dividing the number of cropped nodes by the number of original nodes, which is set from 0% to 60% with a gap of 10%. Some results in the form of edges after being attacked with different intensities are shown in Figure 5.
In Figure 5a–f, it is easy to see that translation, rotation, and uniform scaling are shape-preserving attacks. Among them, all or most of the coordinate values on the XOY plane are modified, so this is challenging to keep the watermark for watermarking algorithms that only rely on independent coordinates instead of the relationship between coordinates. In Figure 5g–i, a part of the data is cropped, and then the shape of the data is changed. However, one good thing is that the remaining coordinate values do not be modified. Therefore, if the watermark capacity is large enough for a watermarking algorithm and its watermark distribution in the data is uniform sufficiently, the watermark can be successfully extracted from the remaining data.
4. Results
4.1. The Results of Accuracy Evaluation
Table 1, Table 2, Table 3 and Table 4 show the results of the accuracy evaluation. Overall, the errors of the proposed method are less than or equal to that of Wei’s approach, whether it is the error of coordinates or the error of topographic features. In detail, all of the errors of the proposed method are zero from Table 1, Table 2, Table 3 and Table 4. Even the maximum errors and RMSEs are zero. This is because the proposed method is a zero watermarking method. It only constructs the watermark from the data instead of inserting the watermark into the data, so the data will not be modified, and neither will the data accuracy.
However, only on the elevation, Wei’s method has no error, as shown in Table 2. On the contrary, in Table 1, Wei’s maximum error and RMSE on the XOY plane are 0.500 m and 0.308 m, respectively. Table 3 and Table 4 show that the average errors in the slope and the aspect are 0.003° and 0.007°, respectively. This indicates that Wei’s method does cause data accuracy damaged. It is unacceptable for the TIN DEM data with high strategic importance in some scenarios. Besides, for Wei’s method, all the minimum errors are always zero. This is due to Wei choose a part of the data instead of all the data to embed the watermark, so there are some nodes without errors. To sum up, the proposed method is better than Wei’s on accuracy preserving, and the proposed method achieves lossless to the data.
4.2. The Results of Robustness Evaluation
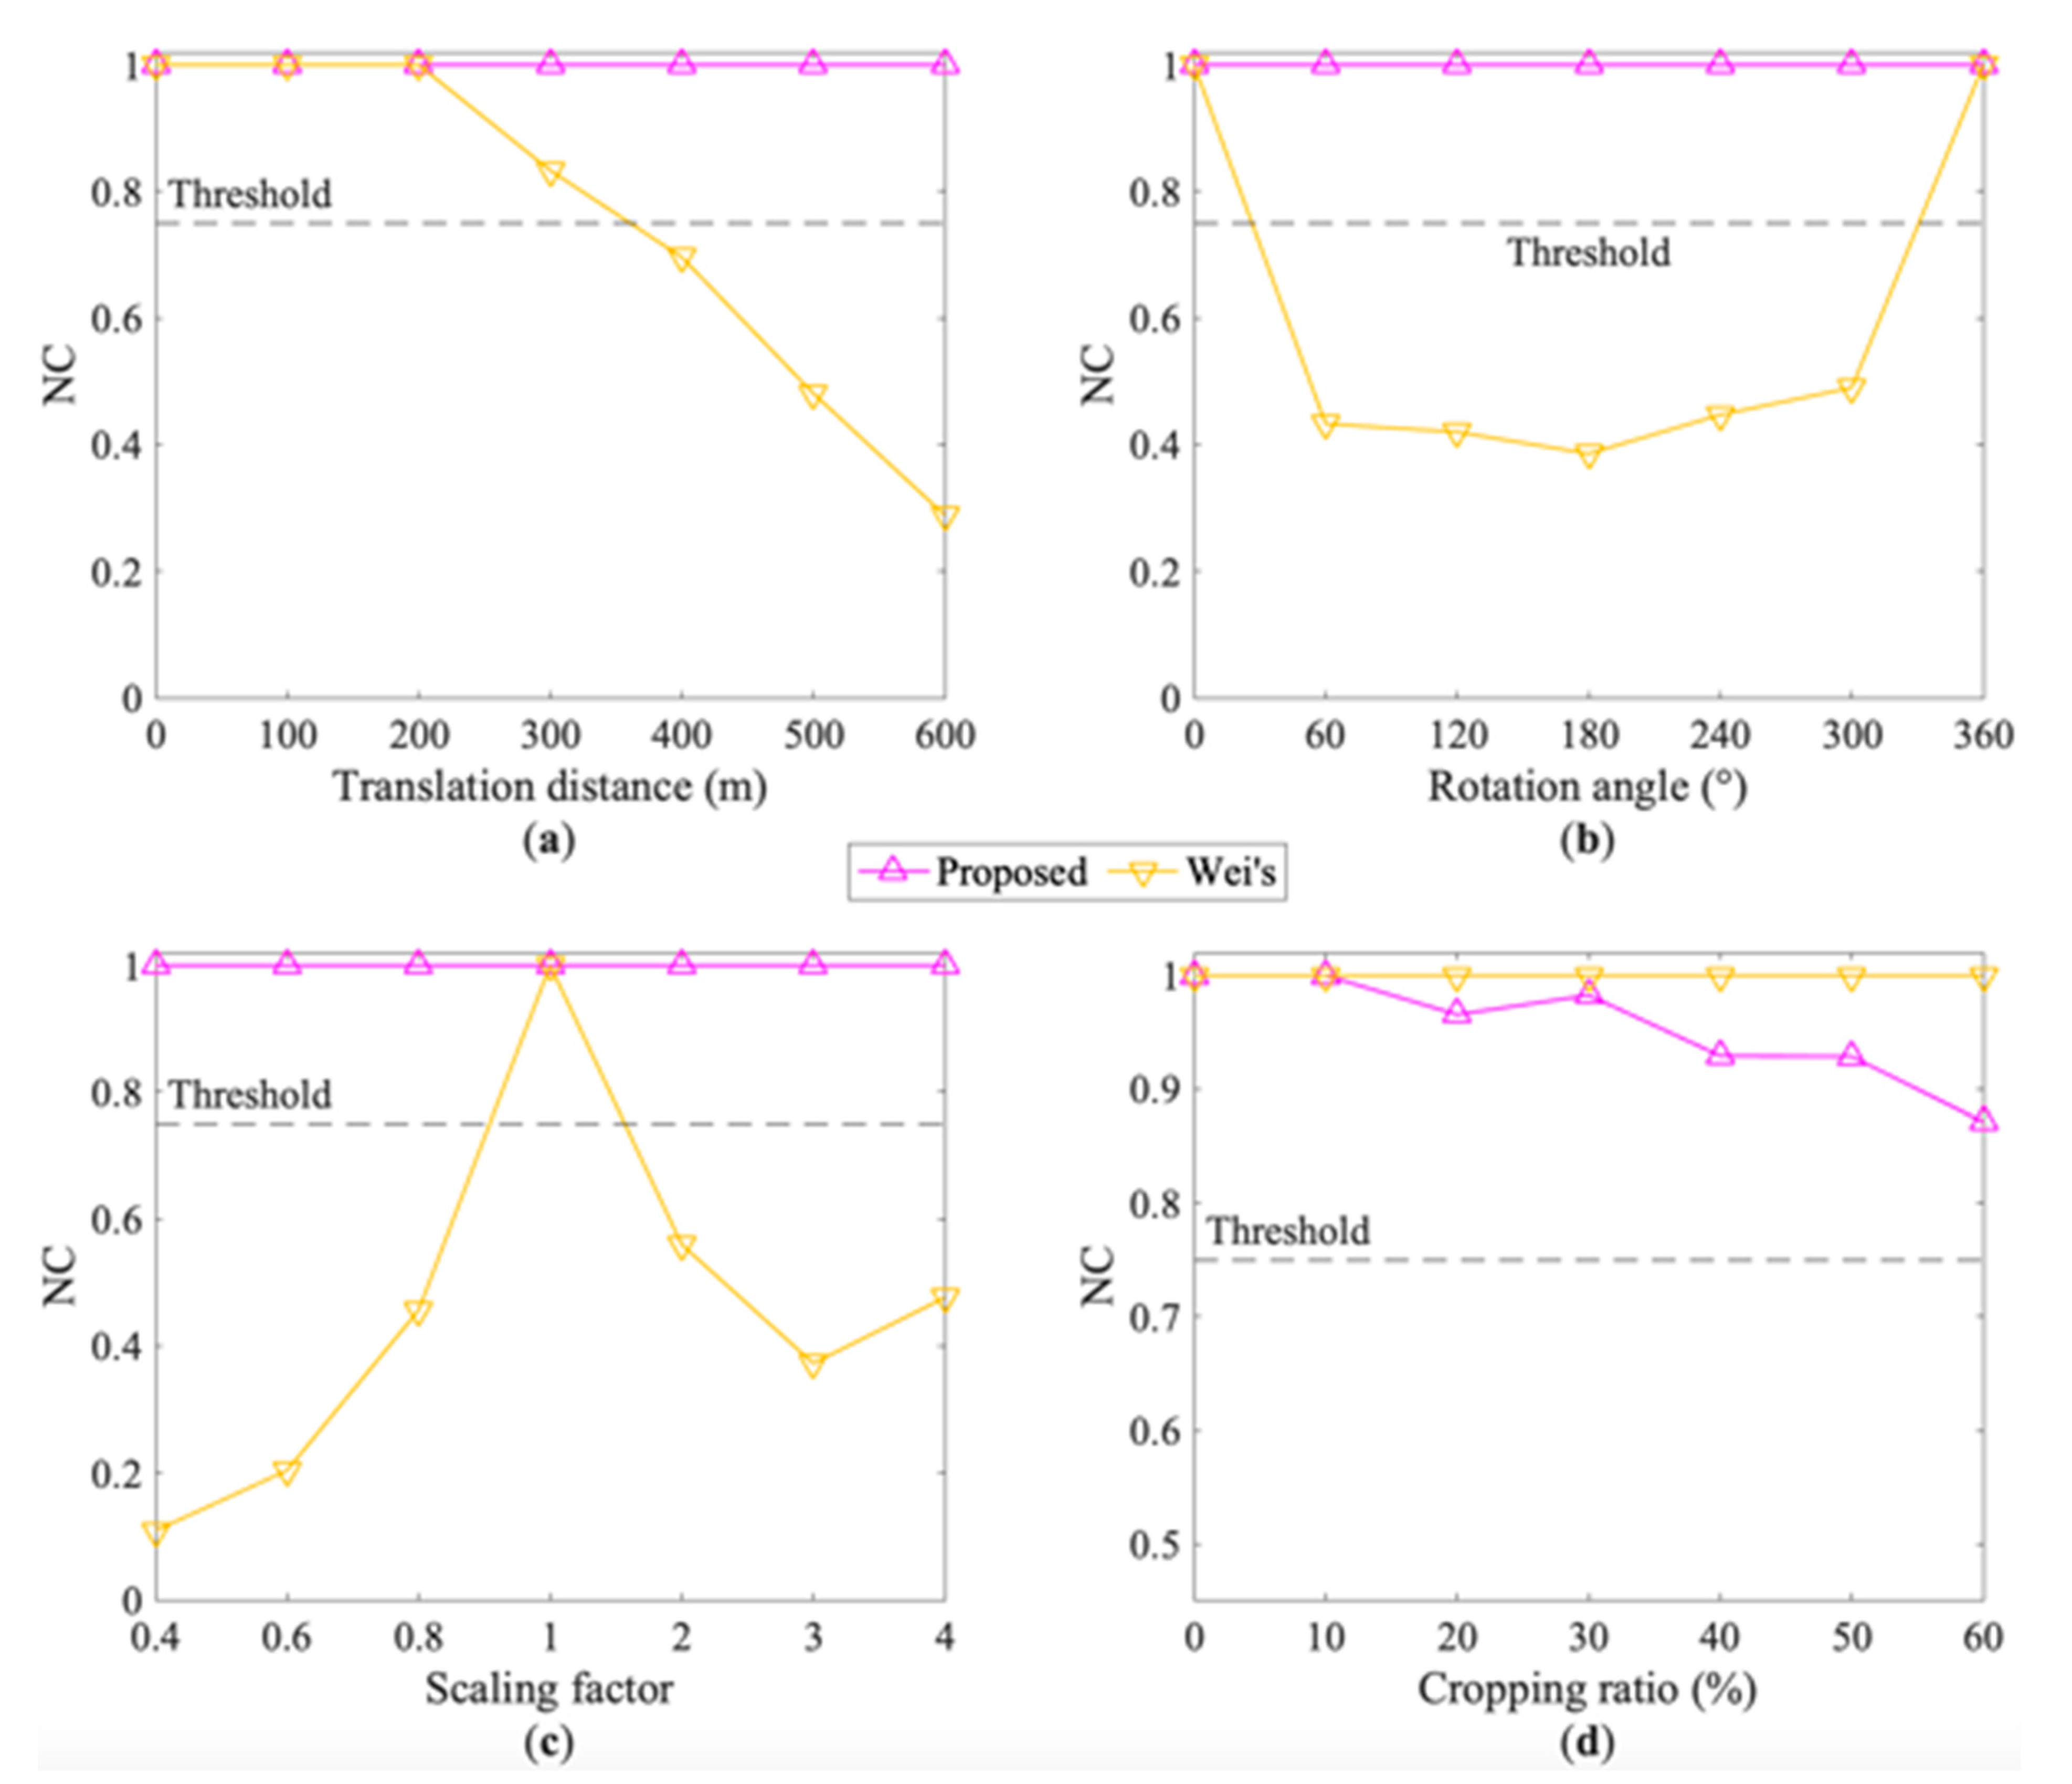
Figure 6a–d show the results of robustness evaluation. It is easy to see that the NC value of the proposed method is always higher than the threshold of 0.75, while that of Wei’s approach is sometimes lower than the threshold. In detail, in translation, rotation, and scaling attacks, the NC of the proposed method keeps at 1.00 all the time, as shown in Figure 6a–c, no matter how intense the attack is. Wei’s approach exhibits a downward trend in translation attacks as the translation distance increases. When translating 400 m, the NC starts to be less than the threshold. In Figure 6b,c, almost all of its NC is below the threshold, except when the data is not attacked at all (rotating 0 and 360°, as well as scaling 1). This shows that the proposed method can completely resist translation, rotation, and scaling attacks. In contrast, Wei’s approach can only resist relatively short-range translation attacks and cannot resist rotation and scaling attacks.
In Figure 6d, Wei’s method performs better than the proposed method on the whole. When the cropping ratio increases from 10% to 60%, Wei’s NC always remains at 1.00. However, the proposed method shows a downward trend with a small fluctuation. For example, when the cropping ratio is 20%, the NC of the proposed method starts to be less than 1.00 and falls to 0.97. It bounces to 0.98 as the cropping ratio becomes 30%. Finally, it continues to decline. When the cropping ratio is 60%, the NC drops to 0.87. Nevertheless, it is still above the threshold. Thus, the proposed method is not strong as Wei’s but still has good resistance as for the robustness to cropping attacks.
5. Discussion
The above experiments compare the proposed method with Wei’s in terms of accuracy and robustness. The results show that, in general, the proposed method performs better than Wei’s. Specifically, the proposed method achieves lossless to the fidelity of the TIN DEM data. The method can also completely resist translation, rotation, and scaling attacks, and can resist cropping attacks to a certain extent. To better understand the characteristic of the proposed method, further discussions from two aspects will be made in the following.
5.1. Resistance to Translation, Rotation, and Scaling Attacks
In the proposed method, the ratio of the edge lengths determines the watermark index, and the comparison of the edge lengths determines the watermark bit. It is easy to see that the latter is not affected by translation, rotation, and scaling attacks and is more stable than the former. Therefore, the robustness of the proposed method essentially depends on the ratio of the edge lengths. As for Wei’s approach, both the watermark index and the watermark bit rely on the x coordinate. Thus, the robustness of Wei’s method depends on the stability of the x coordinate.
In the TIN DEM data, record , and as three nodes in a triangle. PA and PB are the longest edge and shortest edge, respectively. Then, the formula for calculating the ratio of the edge lengths (denoted as r) is as follows:
However, in Wei’s algorithm, , , and determine the watermark.
Take the translation attack as an example and set the translation distance as d in both the X-axis and the Y-axis. The new three vertices are , and after translation. For Wei’s method, the x coordinates change from , , to , , , in turns; consequently, it is hard to retain the embedded watermark. For the proposed method, the new ratio of the edge lengths (denoted as ) becomes:
Therefore, as shown in Equation (9), the ratio of the edge lengths keeps unchanged after translations. This is the reason why the proposed method can resist translation attacks. Similarly, we can also prove that the ratio of the edge lengths does not change in rotation and uniform scaling attacks, but Wei’s algorithm does not. These analyses are also consistent with the results of Figure 6a–c.
5.2. The Losslessness and the Quality of the Watermark
The proposed method achieves losslessness to the TIN DEM data due to the characteristic of zero watermarking, which is proved by the results of accuracy evaluation. However, as the watermark is not actually embedded in the data, is there any disadvantage for zero watermarking? Let us start with the watermark capacity [40,41] first. The watermark capacity refers to the number of watermark bits that are embedded in the host data [42] (p. 71), usually in bits, and is the key factor in cropping attacks. In the proposed method, one triangle is embedded by one watermark bit, while in Wei’s approach, one node is embedded by one watermark bit. There are 796 vertices and 1566 triangles in the experimental data, and the remaining nodes after Wei’s compression are 792. Therefore, for this experimental data, the proposed method embeds 1566 bits watermark, and Wei’s embeds 792 bits watermark. Obviously, the watermark capacity of the proposed method is larger than that of Wei’s. Nevertheless, why does Wei’s algorithm perform better than the proposed algorithm in cropping attacks in Figure 6d? This involves the quality of the embedded watermark.
As mentioned in Section 2.2, there are situations where multiple triangles are mapped to the same watermark index, but the watermark bits of the triangles are not the same in the proposed method. Therefore, the majority voting mechanism is introduced. Table 5 shows some watermark indices and their watermark bits in the experiments. It is easy to see that all the watermark bits of these indexes are 1, but the factors contributing to them are different.
In Table 5, for index 18 and index 21, there are the same number of triangles that mapped to them, 33. But the difference between the number of the watermark bit of 1 and the number of the watermark bit of 0 is 17 and 3, respectively. When encountering cropping attacks, index 18 has more probability to maintain the watermark bit 1 than index 21. Similarly, for the indexes 20 and 21, the difference between the number of the watermark bit 0 and the number of the watermark bit 1 is the same 3, but the number of triangles they mapped is 9 and 33, respectively. When encountering cropping attacks, index 20 has more probability to retain the watermark bit 1 than index 21. Based on the analysis, an equation is given to evaluate the quality of the watermark:
where and are the number of the watermark bit 0 and the number of the watermark bit 1 corresponding to the watermark index i. The watermark quality ranges from 0 to 1, and the closer to 1, the better the watermark quality. According to Equation (10), the watermark quality of the proposed method is 0.33, and Wei’s is 1.00. Thus, we can find one of the disadvantages of zero watermarking: the quality of the watermark is low. This also explains why the proposed method is weaker than Wei’s in resisting cropping attacks, as shown in Figure 6d. More research is needed on evaluating and improving the watermark quality of zero watermarking, which will be the focus of our next study.
6. Conclusions
To solve the contradiction between copyright protection and accuracy preservation, a zero watermarking method based on the edge length is proposed for the TIN DEM data. In the method, the relationship of the edge length in the TIN DEM data is employed to be quantified to the watermark index and the watermark bit. The watermark bits in the corresponding watermark index are combined based on the majority voting mechanism, and in this way, the zero watermark is constructed. Error analyses are carried out in coordinates and topographic features in the accuracy evaluation experiments. The error of the proposed method is always zero. That is, it does not cause the data quality to be degraded. Simultaneously, robustness evaluation experiments demonstrate that the method can completely resist translation, rotation, and scaling attacks, regardless of the intensity of the attack, which has also been proved in the discussion section. Although the method is not as good as the comparison approach in cropping attacks, it still achieves that the NC is always above the threshold. This is the first time the zero watermarking technology is applied to the TIN DEM data, achieving lossless accuracy and finding a better balance between copyright protection and accuracy maintenance. Consequently, this research meets the needs of practical applications, especially in industries that require extremely high data quality. This is an important supplement to the research on DEM digital watermarking. However, zero watermarking still has the problem of low watermark quality. Our next study will focus on evaluating and improving the watermark quality of zero watermarking.
Author Contributions
Conceptualization, Qifei Zhou and Changqing Zhu; methodology, Qifei Zhou, Changqing Zhu, and Na Ren; validation, Qifei Zhou and Na Ren; formal analysis, Qifei Zhou and Changqing Zhu; writing—original draft preparation, Qifei Zhou and Changqing Zhu; writing—review and editing, Changqing Zhu and Na Ren; visualization, Qifei Zhou and Na Ren; supervision, Changqing Zhu and Na Ren; funding acquisition, Changqing Zhu, Na Ren, and Qifei Zhou. All authors have read and agreed to the published version of the manuscript.
Funding
This research was funded by the National Natural Science Foundation of China under Grant 42071362, 41971338; the Natural Science Foundation of Jiangsu Province under Grant BK20191373; and the Graduate Research and Innovation Projects of Jiangsu Province under Grant KYCX20_1182.
Conflicts of Interest
The authors declare no conflict of interest.
References
- Lakshmi, S.E.; Yarrakula, K. Review and critical analysis on digital elevation models. Geofizika 2019, 35, 129–157. [Google Scholar] [CrossRef]
- Xiong, L.; Tang, G.; Yang, X.; Li, F. Geomorphology-oriented digital terrain analysis: Progress and perspectives. J. Geogr. Sci. 2021, 31, 456–476. [Google Scholar] [CrossRef]
- Saleem, N.; Huq, M.E.; Twumasi, N.Y.D.; Javed, A.; Sajjad, A. Parameters Derived from and/or Used with Digital Elevation Models (DEMs) for Landslide Susceptibility Mapping and Landslide Risk Assessment: A Review. ISPRS Int. J. Geo-Inf. 2019, 8, 545. [Google Scholar] [CrossRef] [Green Version]
- Polidori, L.; El Hage, M. Digital Elevation Model Quality Assessment Methods: A Critical Review. Remote Sens. 2020, 12, 3522. [Google Scholar] [CrossRef]
- Chen, L.Y.; Song, G.M. Study of DEM Information Security in Geographic Information Service. Appl. Mech. Mater. 2015, 713–715, 2147–2151. [Google Scholar] [CrossRef]
- Hayat, K.; Puech, W.; Gesquiere, G.; Chaumont, M. Wavelet-based data hiding of DEM in the context of real-time 3D visualization. In Proceedings of the Visualization and Data Analysis 2007; Erbacher, R.F., Roberts, J.C., Gröhn, M.T., Börner, K., Eds.; SPIE: San Jose, CA, USA, 2007; Volume 6495, p. 64950N. [Google Scholar]
- Martin, A.; Gesquiere, G.; Puech, W.; Thon, S. Real-time 3D visualization of DEM combined with a robust DCT based data-hiding method. In Proceedings of the Visualization and Data Analysis 2006; Erbacher, R.F., Roberts, J.C., Gröhn, M.T., Börner, K., Eds.; SPIE: San Jose, CA, USA, 2006; Volume 6060, p. 60600G. [Google Scholar]
- Liu, X.; Wang, J.; Luo, Y. Lossless DEM Watermark Signature Based on Directional Wavelet. In Proceedings of the 2009 2nd International Congress on Image and Signal Processing, Tianjin, China, 17–19 October 2009; pp. 1–5. [Google Scholar]
- Wang, Y.; Zhu, C.; Wang, Z. Research on Digital Watermark Based DEM Data Security Technology. In International Conference on Instrumentation, Measurement, Circuits and Systems (ICIMCS 2011); ASME Press: New York, NY, USA, 2011; pp. 1437–1441. ISBN 9780791859902. [Google Scholar]
- Abubahia, A.; Cocea, M. Advancements in GIS map copyright protection schemes—A critical review. Multimed. Tools Appl. 2017, 76, 12205–12231. [Google Scholar] [CrossRef] [Green Version]
- Vybornova, Y.; Sergeev, V. A new watermarking method for vector map data. In Proceedings of the Eleventh International Conference on Machine Vision (ICMV 2018); Nikolaev, D.P., Radeva, P., Verikas, A., Zhou, J., Eds.; SPIE: Munich, Germany, 2019; Volume 1104111, pp. 1–8. [Google Scholar]
- AL-ardhi, S.; Thayananthan, V.; Basuhail, A. A new vector map watermarking technique in frequency domain based on LCA-transform. Multimed. Tools Appl. 2020, 79, 32361–32387. [Google Scholar] [CrossRef]
- Lü, G.; Liu, A. Applicability of Watermarking Techniques to DEM. J. Remote Sens. 2008, 12, 810–818. [Google Scholar]
- Qiu, Y.; Duan, H.; Sun, J.; Gu, H. Rich-information reversible watermarking scheme of vector maps. Multimed. Tools Appl. 2019, 78, 24955–24977. [Google Scholar] [CrossRef]
- Menendez-Ortiz, A.; Feregrino-Uribe, C.; Hasimoto-Beltran, R.; Garcia-Hernandez, J.J. A Survey on Reversible Watermarking for Multimedia Content: A Robustness Overview. IEEE Access 2019, 7, 132662–132681. [Google Scholar] [CrossRef]
- Luo, Y.; Zhao, Y.; Cheng, L.; Wang, J.; Liu, X. Lossless Visible Three-Dimensional Watermark of Digital Elevation Model Data. In Transactions on Edutainment VIII, LNCS 7220; Springer: Berlin/Heidelberg, Germany, 2012; pp. 138–147. [Google Scholar]
- Ding, H.; Liu, A. A Near-lossless Digital Watermarking Algorithm of DEM Based on DCT. In Proceedings of the Geomorphometry 2013; Geomorphometry.org: Nanjing, China, 2013; pp. 1–2. [Google Scholar]
- Wei, Z.; Yan, H.; Zhang, L. A blind watermarking algorithm for grid DEM resisting elevation translations and cropping attacks. Sci. Surv. Mapp. 2016, 41, 170–173. [Google Scholar] [CrossRef]
- Barni, M.; Bartolini, F.; Cappellini, V.; Magli, E.; Olmo, G. Near-lossless digital watermarking for copyright protection of remote sensing images. Int. Geosci. Remote Sens. Symp. 2002, 3, 1447–1449. [Google Scholar] [CrossRef] [Green Version]
- Zhu, C.; Wang, Z.; Long, Y.; Yang, C. An adaptive watermarking algorithm for DEM based on DFT. In Proceedings of the 24th International Cartographic Conference, Santiago de Chile, Chile, 15–21 November 2009; pp. 1–8. [Google Scholar]
- Wang, Z.; Zhu, C.; Yang, C. A Digital Watermarking Algorithm of DEM Based on the Analysis of Slope. Geogr. Geo-Inf. Sci. 2009, 25, 91–94. [Google Scholar]
- Liu, A.; Ding, H.; Tian, D.; Wang, L.; Wang, S. A DCT DEM Digital Watermarking Algorithm Based on the Analysis of Slope and Aspect. Geomat. Inf. Sci. Wuhan Univ. 2016, 41, 903–910. [Google Scholar] [CrossRef]
- He, X.; Liu, J. A Digital Watermarking Algorithm for DEM Image Based on Stationary Wavelet Transform. In Proceedings of the 2009 Fifth International Conference on Information Assurance and Security, Xi’an, China, 18–20 August 2009; Volume 1, pp. 221–224. [Google Scholar]
- Ren, N.; Zhao, Y.; Zhu, C.; Zhou, Q.; Xu, D. Copyright Protection Based on Zero Watermarking and Blockchain for Vector Maps. ISPRS Int. J. Geo-Inf. 2021, 10, 294. [Google Scholar] [CrossRef]
- Fierro-Radilla, A.; Nakano-Miyatake, M.; Cedillo-Hernandez, M.; Cleofas-Sanchez, L.; Perez-Meana, H. A Robust Image Zero-watermarking using Convolutional Neural Networks. In Proceedings of the 2019 7th International Workshop on Biometrics and Forensics (IWBF), Cancun, Mexico, 2–3 May 2019; pp. 1–5. [Google Scholar]
- Roček, A.; Javorník, M.; Slavíček, K.; Dostál, O. Zero Watermarking: Critical Analysis of Its Role in Current Medical Imaging. J. Digit. Imaging 2021, 34, 204–211. [Google Scholar] [CrossRef]
- Longley, P.A.; Goodchild, M.F.; Maguire, D.J.; Rhind, D.W. Geographic Information Science and Systems; John Wiley & Sons: Hoboken, NJ, USA, 2015. [Google Scholar]
- Dhavale, S.V.; Deodhar, R.S.; Pradhan, D.; Patnaik, L.M. A robust zero watermarking algorithm for stereo audio signals. Int. J. Inf. Comput. Secur. 2016, 8, 330–346. [Google Scholar] [CrossRef]
- Yamni, M.; Karmouni, H.; Sayyouri, M.; Qjidaa, H. Robust zero-watermarking scheme based on novel quaternion radial fractional Charlier moments. Multimed. Tools Appl. 2021, 80, 21679–21708. [Google Scholar] [CrossRef]
- Ali, Z.; Imran, M.; Alsulaiman, M.; Zia, T.; Shoaib, M. A zero-watermarking algorithm for privacy protection in biomedical signals. Futur. Gener. Comput. Syst. 2018, 82, 290–303. [Google Scholar] [CrossRef] [Green Version]
- Abdelhedi, K.; Chaabane, F.; Ben Amar, C. A SVM-Based Zero-Watermarking Technique for 3D Videos Traitor Tracing. In Lecture Notes in Computer Science (Including Subseries Lecture Notes in Artificial Intelligence and Lecture Notes in Bioinformatics); Springer: Cham, Switzerland, 2020; Volume 12002, ISBN 9783030406042. [Google Scholar]
- Zhou, Q.; Zhu, C.; Ren, N.; Chen, W.; Gong, W. Zero Watermarking Algorithm for Vector Geographic Data Based on the Number of Neighboring Features. Symmetry 2021, 13, 208. [Google Scholar] [CrossRef]
- Singh, P.; Raman, B. A secured robust watermarking scheme based on majority voting concept for rightful ownership assertion. Multimed. Tools Appl. 2017, 76, 21497–21517. [Google Scholar] [CrossRef]
- Pourhashemi, S.M.; Mosleh, M.; Erfani, Y. A novel audio watermarking scheme using ensemble-based watermark detector and discrete wavelet transform. Neural Comput. Appl. 2021, 33, 6161–6181. [Google Scholar] [CrossRef]
- Bugayevskiy, L.M.; Snyder, J.P. Map Projections: A Reference Manual; CRC Press: London, UK, 1995. [Google Scholar]
- Turiño, C.E. Gauss Krüger projection for areas of wide longitudinal extent. Int. J. Geogr. Inf. Sci. 2008, 22, 703–719. [Google Scholar] [CrossRef]
- Wei, Z. Research on the Digital Watermarking Algorithms for DEM; Lanzhou Jiaotong University: Lanzhou, China, 2017. [Google Scholar]
- Nematollahi, M.A.; Vorakulpipat, C.; Rosales, H.G. Digital Watermarking; Springer Topics in Signal Processing; Springer: Singapore, 2017; Volume 11, ISBN 978-981-10-2094-0. [Google Scholar]
- Cox, I.J.; Miller, M.L.; Bloom, J.A.; Fridrich, J.; Kalker, T. Digital Watermarking and Steganography, 2nd ed.; Morgan Kaufmann Publishers: Burlington, MA, USA, 2008. [Google Scholar]
- Wang, N.; Zhang, H.; Men, C. A high capacity reversible data hiding method for 2D vector maps based on virtual coordinates. CAD Comput. Aided Des. 2014, 47, 108–117. [Google Scholar] [CrossRef]
- Bastani, A.; Ahouz, F. High Capacity and Secure Watermarking for Medical Images Using Tchebichef Moments. Radioengineering 2020, 29, 636–643. [Google Scholar] [CrossRef]
- Abubahia, A. Spatial Data Mining Approaches for GIS Vector Data Processing; University of Portsmouth: Portsmouth, UK, 2018. [Google Scholar]
Figure 1.
The framework of the proposed method.

Figure 2.
Demonstrations of edge usage. (a) l and s for the watermark index; (b) b and f for the watermark bit.
Figure 2.
Demonstrations of edge usage. (a) l and s for the watermark index; (b) b and f for the watermark bit.

Figure 3.
Demonstration of a constructed watermark.

Figure 4.
The experimental data. (a) The TIN DEM data; (b) the edges of the TIN DEM data.

Figure 5.
The data after attacks. (a) Translate 100 m; (b) Translate 600 m; (c) Rotate 60°; (d) Rotate 180°; (e) Scale 0.4; (f) Scale 0.8; (g) Crop 10%; (h) Crop 30%; (i) Crop 60%.
Figure 5.
The data after attacks. (a) Translate 100 m; (b) Translate 600 m; (c) Rotate 60°; (d) Rotate 180°; (e) Scale 0.4; (f) Scale 0.8; (g) Crop 10%; (h) Crop 30%; (i) Crop 60%.

Figure 6.
The results after attacks. (a) The results of translation attacks; (b) the results of rotation attacks; (c) the results of scaling attacks; (d) the results of cropping attacks.
Figure 6.
The results after attacks. (a) The results of translation attacks; (b) the results of rotation attacks; (c) the results of scaling attacks; (d) the results of cropping attacks.


Table 1.
The error on the XOY plane.
| Error (m) | Maximum | Minimum | Average | RMSE |
|---|---|---|---|---|
| Proposed | 0.000 | 0.000 | 0.000 | 0.000 |
| Wei’s | 0.500 | 0.000 | 0.190 | 0.308 |
Table 2.
The error of the elevation.
| Error (m) | Maximum | Minimum | Average | RMSE |
|---|---|---|---|---|
| Proposed | 0.000 | 0.000 | 0.000 | 0.000 |
| Wei’s | 0.000 | 0.000 | 0.000 | 0.000 |
Table 3.
The error of the slope.
| Error (°) | Maximum | Minimum | Average | RMSE |
|---|---|---|---|---|
| Proposed | 0.000 | 0.000 | 0.000 | 0.000 |
| Wei’s | 0.051 | 0.000 | 0.003 | 0.006 |
Table 4.
The error of the aspect.
| Error (°) | Maximum | Minimum | Average | RMSE |
|---|---|---|---|---|
| Proposed | 0.000 | 0.000 | 0.000 | 0.000 |
| Wei’s | 0.144 | 0.000 | 0.007 | 0.014 |
Table 5.
The watermark index and the watermark bit.
| Watermark Index | Number of Triangles | Number of Watermark Bit 0 | Number of Watermark Bit 1 | Watermark Bit |
|---|---|---|---|---|
| 18 | 33 | 8 | 25 | 1 |
| 20 | 9 | 3 | 6 | 1 |
| 21 | 33 | 15 | 18 | 1 |
Publisher’s Note: MDPI stays neutral with regard to jurisdictional claims in published maps and institutional affiliations. |
© 2021 by the authors. Licensee MDPI, Basel, Switzerland. This article is an open access article distributed under the terms and conditions of the Creative Commons Attribution (CC BY) license (https://creativecommons.org/licenses/by/4.0/).
Share and Cite
MDPI and ACS Style
Zhou, Q.; Zhu, C.; Ren, N. Zero Watermarking for the TIN DEM Data Based on the Edge Length. ISPRS Int. J. Geo-Inf. 2021, 10, 559. https://0-doi-org.brum.beds.ac.uk/10.3390/ijgi10080559
AMA Style
Zhou Q, Zhu C, Ren N. Zero Watermarking for the TIN DEM Data Based on the Edge Length. ISPRS International Journal of Geo-Information. 2021; 10(8):559. https://0-doi-org.brum.beds.ac.uk/10.3390/ijgi10080559
Chicago/Turabian StyleZhou, Qifei, Changqing Zhu, and Na Ren. 2021. "Zero Watermarking for the TIN DEM Data Based on the Edge Length" ISPRS International Journal of Geo-Information 10, no. 8: 559. https://0-doi-org.brum.beds.ac.uk/10.3390/ijgi10080559
Note that from the first issue of 2016, this journal uses article numbers instead of page numbers. See further details here.