Article

Big Data-Driven Pedestrian Analytics: Unsupervised Clustering and Relational Query Based on Tencent Street View Photographs

1
Department of Real Estate and Construction, The University of Hong Kong, Hong Kong 999077, China
2
Faculty of Architecture, The University of Hong Kong, Hong Kong 999077, China
3
Department of Business Ecosystems, JD Technology, 67 South Zhongxing Road, Panyu District, Guangzhou 511495, China
*
Author to whom correspondence should be addressed.
ISPRS Int. J. Geo-Inf. 2021, 10(8), 561; https://0-doi-org.brum.beds.ac.uk/10.3390/ijgi10080561
Submission received: 1 June 2021 / Revised: 29 July 2021 / Accepted: 15 August 2021 / Published: 18 August 2021

Abstract

:
Recent technological advancements in geomatics and mobile sensing have led to various urban big data, such as Tencent street view (TSV) photographs; yet, the urban objects in the big dataset have hitherto been inadequately exploited. This paper aims to propose a pedestrian analytics approach named vectors of uncountable and countable objects for clustering and analysis (VUCCA) for processing 530,000 TSV photographs of Hong Kong Island. First, VUCCA transductively adopts two pre-trained deep models to TSV photographs for extracting pedestrians and surrounding pixels into generalizable semantic vectors of features, including uncountable objects such as vegetation, sky, paved pedestrian path, and guardrail and countable objects such as cars, trucks, pedestrians, city animals, and traffic lights. Then, the extracted pedestrians are semantically clustered using the vectors, e.g., for understanding where they usually stand. Third, pedestrians are semantically indexed using relations and activities (e.g., walking behind a guardrail, road-crossing, carrying a backpack, or walking a pet) for queries of unstructured photographic instances or natural language clauses. The experiment results showed that the pedestrians detected in the TSV photographs were successfully clustered into meaningful groups and indexed by the semantic vectors. The presented VUCCA can enrich eye-level urban features into computational semantic vectors for pedestrians to enable smart city research in urban geography, urban planning, real estate, transportation, conservation, and other disciplines.

1. Introduction

A city’s information infrastructure, which measures and extracts valuable data from the multi-faceted urban systems, is the foundation for enabling smart solutions for urban dwellers and defining public administration efficiency [1,2]. Urban data are evolving to urban big data along with the advancement of information and communication technology (ICT) infrastructure to improve resource allocation and supply, waste management, traffic control, energy conservation, health, crime prevention, and environmental issues [3]. More and more urban data are available from sensors, social media, and other interconnected systems, yet with fewer and fewer errors, less noise, and lower costs [4]. Thus, the fast-growing urban big data sets are seen as opportunities for smart cities [5]. For example, street view photographs cover not only comprehensive urban landscapes but also rich, eye-level urban features that can very well meet the four V’s of big data, i.e., volume, variety, velocity, and veracity [6]. However, only a certain degree of integration and understanding of big data and turning it into knowledge and smartness can lead to the realization of more sustainable urban environments in smart cities [7].
In the context of urban big data, artificial intelligence (AI) methods such as deep learning and evolutionary computation are becoming popular for complementing the conventional methods for extracting and enriching the semantics of urban data [8]. Example applications include urban street cleanliness assessment [9], traffic speed prediction [10], simulation of energy consumption for efficient decision-making [11], and exploring spatial-temporal travel patterns [12]. However, a massive workload of manual annotation is often required before training deep learning methods [13], so that some researchers dismiss AI as too “artificial” [14]. For inferring pedestrians’ semantics and other urban objects, the question that remains is to what extent the multi-faceted evidence can be extracted from urban big data at a low cost for a smart city’s information infrastructure.
This study proposes a novel approach named VUCCA (extraction of uncountable and countable objects for clustering and analysis) for analyzing the pedestrians in street-view photographs. Pedestrians are an essential element that can reflect road utilization, urban vitality, and citizens’ preferences. Although streets take up only a small portion of the urban space, they are key to smart urban living and smart mobility for pedestrians. Previous studies have made efforts in predicting the demographic makeup in neighborhoods [15], quantifying greenery, sky view, and building view factors in high-density streets [16], measuring human perceptions (e.g., depressing, lively, safe, wealthy, boring, and beautiful) of the city [8,17,18], estimating the inhabitants’ daily exposure to green or blue spaces for investigating correlations related to walking behavior [19] and mental health [20,21], and volumes of pedestrians [22]. These studies make significant progress in translating urban big data into specific knowledge about pedestrians. However, most of the studies failed to make full use of street-view data by limiting their efforts within small-scale data samples (not big data), bivariate analysis (not multifaceted), or the manually annotated training data annotation (costly), or individual detection (not systematic) for supervised learning. Thus, there is a lack of effort in unsupervised urban big data evidence, including multi-faceted semantics and relations between pedestrians and other urban objects, for smart city’s information infrastructure.
The VUCCA in this paper contributes in three ways. First, this study verifies that transductive transferring the convolutional neural network (CNN) and regional CNN (R-CNN) pre-trained elsewhere can be inexpensive and accurate, for processing both countable and uncountable objects in urban big data. Secondly, the relationship between urban objects such as pedestrians can be automatically clustered by a semantic vector of multi-faceted features. Finally, the big-data-driven semantic vector can well support indexing and queries in line with the urban information infrastructure that sheds new light on smart city applications.
Our study is presented with the following structure. Section 2 demonstrates the results and research gaps from a literature review. The proposed novel deep learning model is presented in Section 3. Section 4 displays the results of semantic segmentation, object recognition, and clustering. Discussion of results is found in Section 5, and Section 6 concludes.

2. Background

2.1. Urban Big Data and Street View Photography

Urban big data are immense, lively and created from physical and virtual entities, including urban facilities, organizations, and individuals, by employing emerging ICT infrastructure [23]. Big data at a city-scale can help people understand the dynamic status of urban stock and flow objects, systems, and operations and assist in making agile stock, flow and overall systems management decisions, thereby improving resources allocation, cutting urban operation costs, and fostering a more sustainable living environment [24]. Four “V” features are taken to define ‘big’ data [6]: volume (data size is large), velocity (data are created in real-time), variety (data comprises various types from different sources), and veracity (data quality and value). Furthermore, urban big data also has unique characteristics such as correlations, meaning that many types of urban data not only interact with each other when mining social knowledge, but also have potentials to be interrelated to enrich the meanings of data themselves [25]. Making full use of urban big data is part of the smart city vision for strengthening traditional urban governance capacity to provide services, conserving depletable shared urban resources, and improving the sustainable growth of cities [5]. Urban big data can uncover hidden relationships beyond conventional approaches and convert such information into novel knowledge for investigating urban growth and change [26]. Urban big data analytics for smart cities can benefit various domains, including transportation and logistics, energy consumption and resources, construction and buildings, public governance and environment, healthcare and education, social welfare and the economy [3].
However, it is not easy to access large volumes of informative urban data for identifying the relationships that provide value-added urban management information [27]. Street view photographs seem to be an ideal choice, providing massive data for the visual urban landscape with the advantages of high-level accessibility, resolution, and coverage. At the same time, advances in ICT and data science have produced new approaches for capturing behavioral and environmental information from image data, particularly at the micro-scale street level [28]. For example, street views of map databases were applied to identify specific areas for pedestrian access improvement [29], to assess damage caused by hurricanes [30], to quantify green view indicators in an evaluation of urban greenery quality [22], and to examine correlations between characteristics of built environment and health outcomes in the U.S. [31]. Furthermore, street view image databases are immersive 360° panoramas initially generated to help users navigate cities as virtual visitors, along urban streets, blocks, or indoors. Google, Tencent, Bing, and Baidu have launched their own street view service platforms, which now provide considerable image resources for urban studies [32]. With increasing availability of big data analytics such as deep neural networks, analyzing the massive data in street view photographs has become feasible. Street view data provides flexibility in extracting a wide variety of eye-level urban features. However, a standard methodology for this is far from developed and much research is required to optimize costs and outcomes of various approaches to multi-dimension and economy-saving information retrieval algorithms.

2.2. Deep Learning-Based Urban Semantic Features

Deep learning is a kind of machine learning based on multi-layer artificial neural networks for extracting more complex features from raw input [33]. For example, in an image processing of street view, lower layers of neural networks may identify colors by the pixel. In contrast, deep learning can recognize human-meaningful items, such as trees, roads, and people. Deep learning flourished since 2009, due to the advances in hardware, such as the graphics processing units (GPUs), which significantly speeds up the training process and reduce the running times [34]. However, many deep learning methods work well only when the training and test data come from the same feature space and the same variable distribution, and need large training data sets. Therefore, in many real-world cases, it is expensive or impossible to re-collect and re-label big data for solving problems in specific domains.
Transfer learning that reuses pre-trained models for new domains or tasks has been proved efficient and highly-accurate in general machine learning and deep learning [35]. For example, Wurm et al. [36] transferred a model trained on QuickBird to the datasets of Sentinel-2 and TerraSAR-X to efficiently segment the slums. For deep transfer learning, some deep models (e.g., Google Inception Model) have been pre-trained on the ImageNet dataset for image classification tasks. They can be transferred to predict the results of the new dataset [37]. Cira et al. [38] used hybrid segmentation models trained with high-resolution remote sensing imagery to identify the secondary road network. Kang et al. [39] categorized 13 tourist photo classifications by transfer a deep learning model to analyze the regions of attraction. Šerić et al. [40] transferred a model for lost persons to help predict their walking speed. Similar to image classification, natural language processing problems can also be solved using models (e.g., Stanford’s GloVe Model) pre-trained on huge corpora of text documents [41]. Zhong [42] proposed an approach for capturing semantic features in building-quality problems and automatic classification of the related complaints by building-users, into predefined kinds, improving the efficiency of complaint handling in the general building services management domain.
Several studies have employed deep transfer learning on the street view database. The most common task using deep neural networks is pixel-level semantic segmentation, which can extract multiple scene elements by classifying each pixel in massive street view photographic data. For example, Middel et al. [26] employed a fully convolutional network (FCN) to segment Google Street Views (GSV) images from three view directions (e.g., down, up, lateral) into six classes (e.g., trees, sky, buildings) for producing maps of urban form and composition. Similarly, Fu et al. [43], Lu et al. [20], and Gong et al. [16] applied the pyramid scene parsing network (PSPNet) to predict scene parsing, which achieved 80.2% mean IoU (intersection over union) over 150 object classes in Cityscapes. Chen et al. [44] assessed pedestrian volume by deploying street view images and machine learning methods and compared them with results from field observations, which was regarded as a large-scale validation test and produced reasonable accuracy.
Apart from semantic segmentation, the diversity of urban objects and their relations in street view photographs have also been studied using deep networks. For example, to detect and ‘understand’ information from images, Dubey et al. [8] adopted two CNNs to predict human perception (e.g., safe, lively, boring, wealthy, depressing, and beautiful) based on objective observational urban appearance, using a global crowdsourced dataset (including GSV). Zhang et al. [45] explored spatio-temporal urban mobility patterns by training a deep CNN model for a street classification task—e.g., mapping each street to a street view photograph—and then training another deep CNN model to predict taxi trips along a street by fine-tuning the pre-trained model. Srivastava et al. [46] proposed a multimodal approach with two CNNs to learn the features from two streams (e.g., overhead imagery and ground-based street view images) to perform a classification of land use categories. In order to reason about the connections between urban appearance and socioeconomic outcomes, Gebru et al. [14] deployed CNN for car classification in GSV images to determine make, model, body type, and year of each vehicle, which can be used to estimate demographic statistics and voter preferences. Salvador et al. [47] used pre-trained VGG-16 on a subset of street view images with ground truth data for measuring inequalities by separating best-off from worst-off in different social, environmental, and health outcomes., A pedestrian’s status can be even be detected by adopting deep neural networks based on street view photographs. For instance, the new attention-based deep neural network (HydraPlus-Net) with multi-directional feeds is developed to achieve fine-grained pedestrian analysis tasks [48]. In addition, Li et al. [49] concentrated on searching pedestrian in massive image databases by using natural language descriptions, which are expected to significantly rely on video surveillance.
However, few studies try to understand high-order object relations in street view photographs without exogenous knowledge and then leveraging these relations as information about co-occurrence and objects’ locations to feed into better automated domain reasoning. This work takes the pedestrians as an example to reason physical activities of pedestrians on sidewalks and streets for discovering more socioeconomic correlations and knowledge for smart cities. This is an essential step in automatically detecting deeper socioeconomic knowledge for smart city applications. Although Branson et al. [50] and Lin et al. [51] tried to build a multitask network with the integration of re-identification and then predicted pedestrian attributes, the transferability and scalability of pedestrian attributes were insufficient. Therefore, the challenge we take on, is to automatically understand and incorporate key semantic and spatial relationships in TSV for reasoning street activities.
This study investigates big data-driven semantic vectors for processing a street view database; we use the DeepLab V3 model to conduct pixel-level semantic segmentation [52], which performs better than PSPNet with an 81.3% mean IoU (see Figure 1; the tests were conducted by the authors).
Precision = true positive/(true positive + false positive)
Recall = true positive/(true positive + false negative)
Another task is to detect objects at an instance level, while the R-CNN candidate deep learning models are luminoth and YOLO. YOLO V3 is a well-used object detector inspired by GoogLeNet, having 24 convolutional layers followed by two fully connected layers [54]. However, segmenting each instance involves reasoning the scene composition and instances relationships, which can be conducted through a sequential process [47]. Thus, this study uses an R-CNN in the luminoth toolkit, which shows a good performance in object detection of street view photographs, as shown in Figure 2.

3. Research Methods

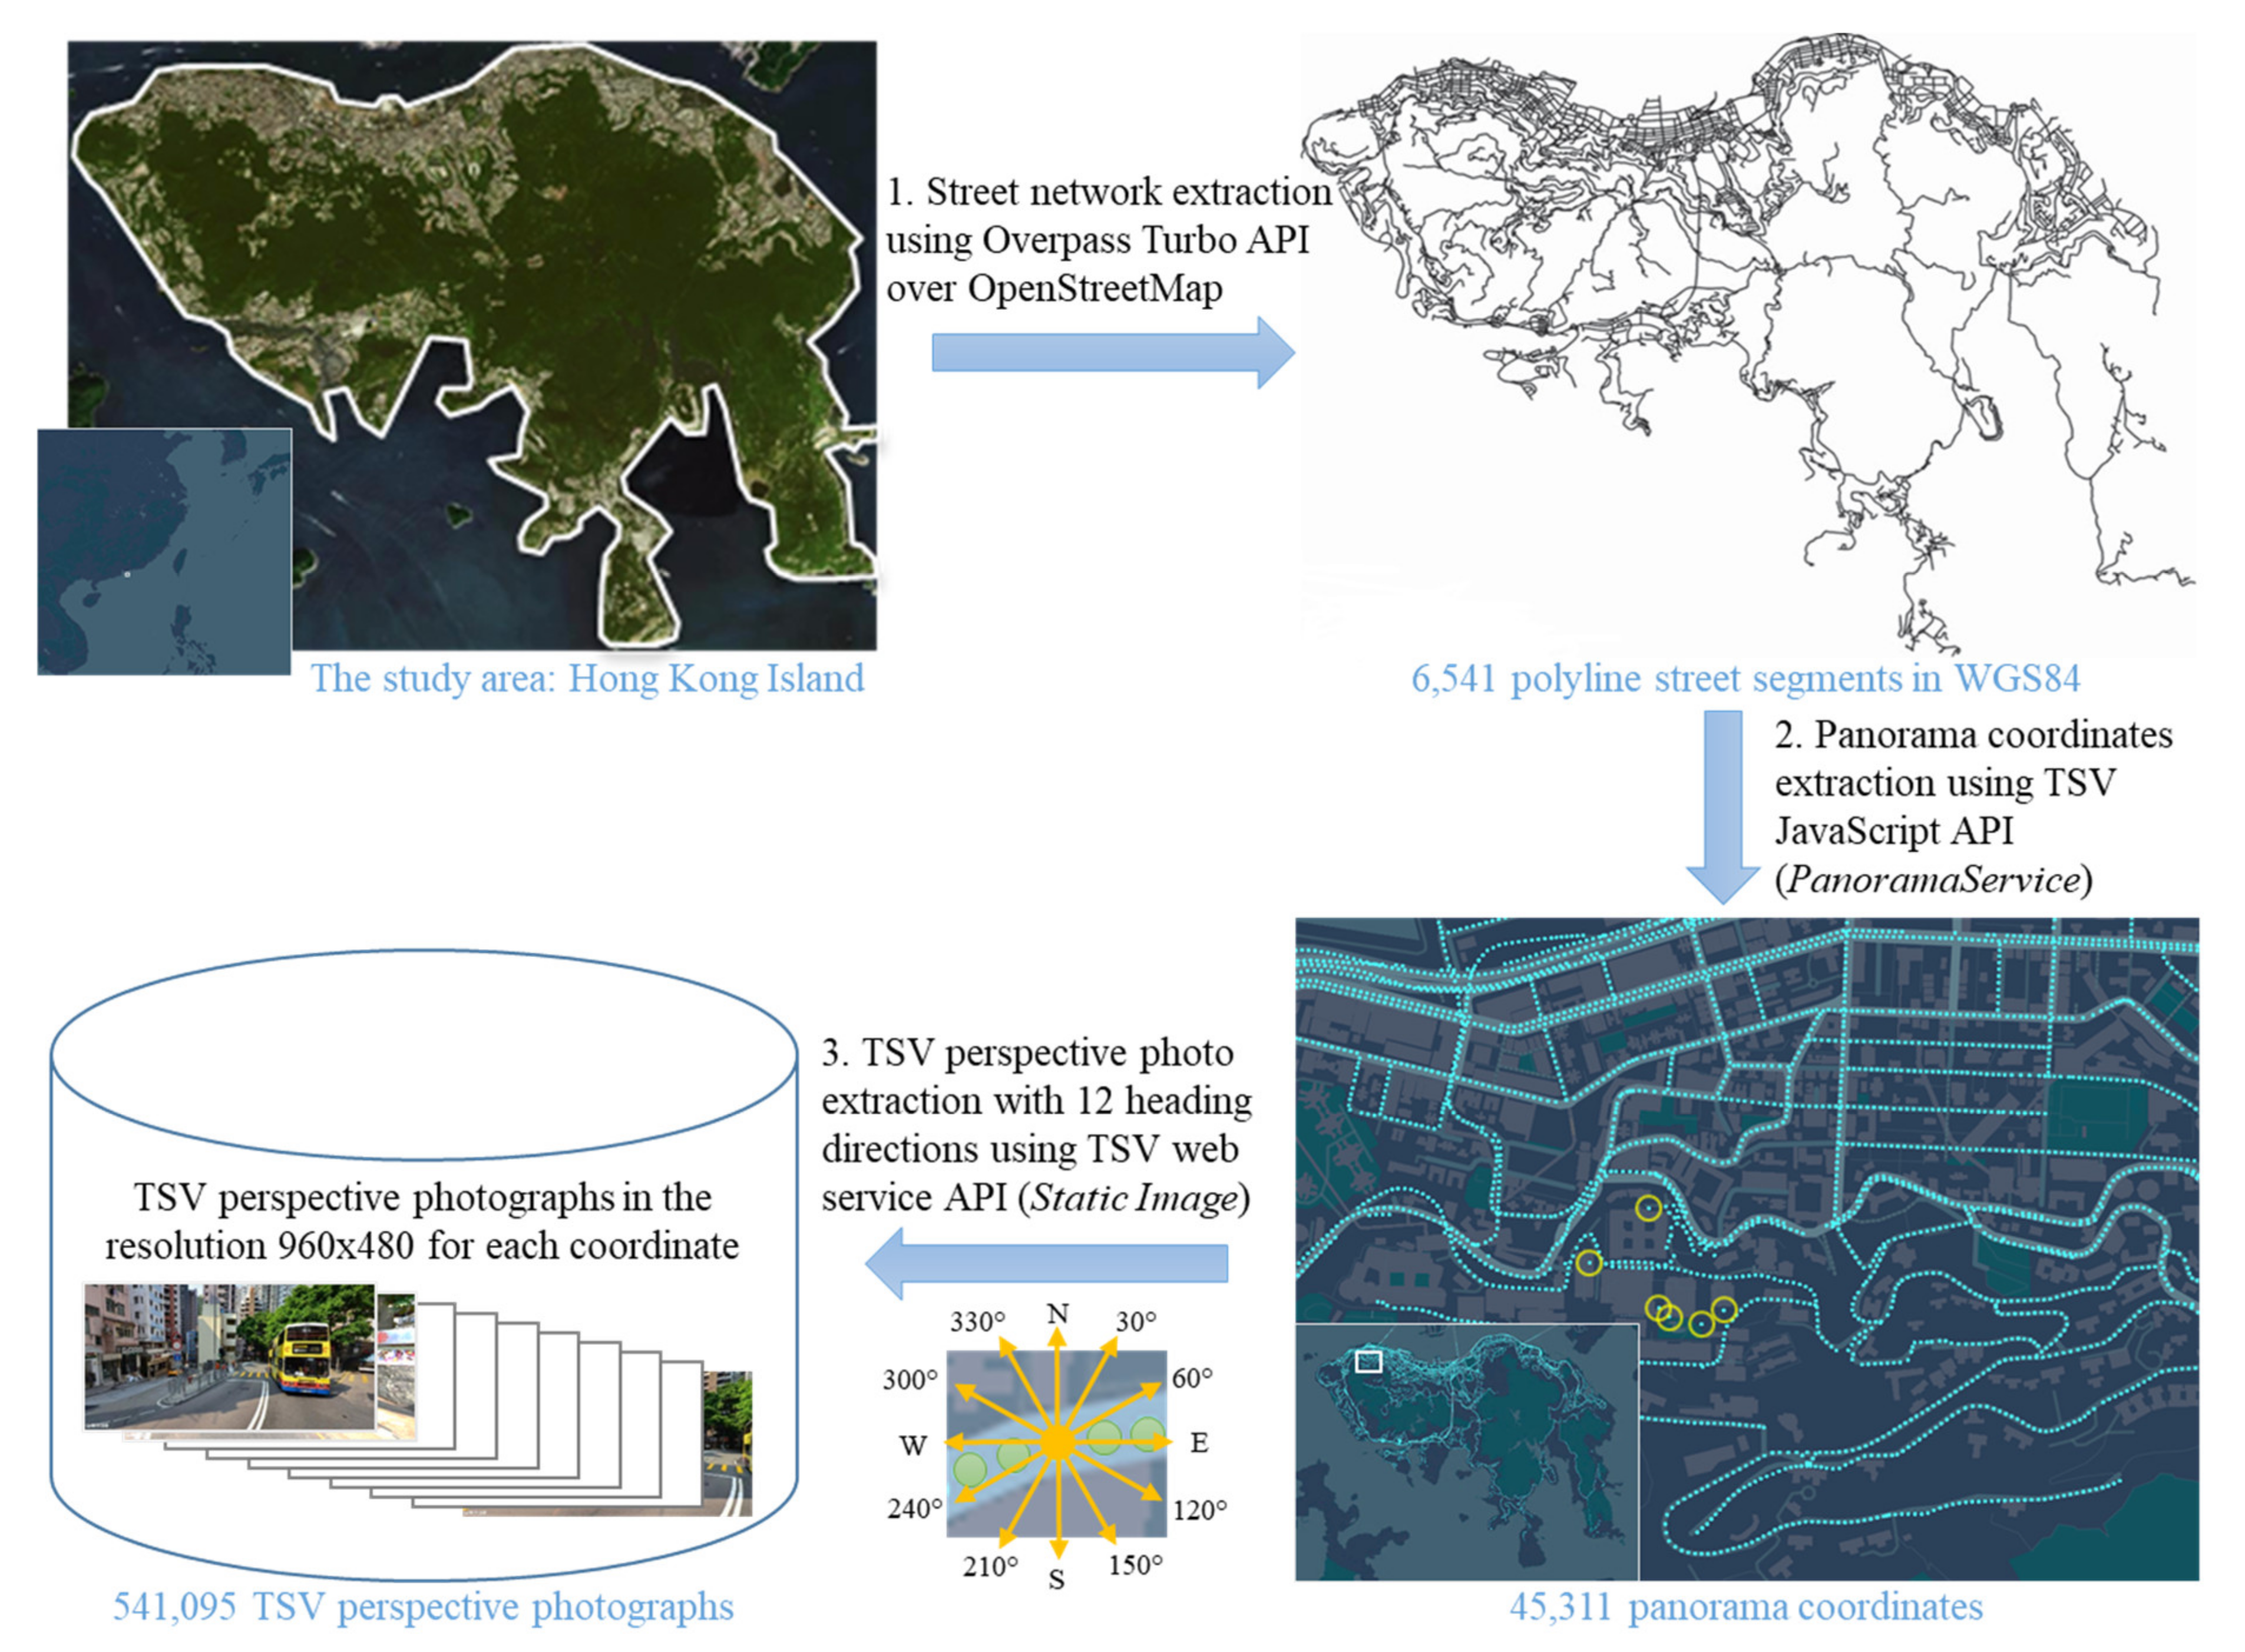
3.1. Study Area and Data Collection

This study collected perspective street view photographs of Hong Kong Island, as shown in Figure 3. Hong Kong is one of the most densely populated cities and has abundant city elements for an exploration of semantically significant elemental relationships captured in street view photographs. We prefer perspective photographs to panorama images for transfer deep learning in this paper due to the compatibility with the popular training datasets [53]. Tencent Map offered quality perspective TSV photographs and was selected as the data source [56]. The input is a geographical boundary on the map, as shown in Figure 3. The data to collect is a large set of perspective street view photographs within the boundary. The computer for data collection and processing was a Windows 10 workstation with dual Intel Xeon E5-2690 v4 (2.6 GHz, 28 cores), Nvidia Quadro P5000 GPU, and 64 GB memory.
The data collection process is shown in Figure 3. First, we extracted the street network of Hong Kong Island as 6541 polyline street segments from OpenStreetMap database [57] by using the Overpass Turbo API (application programming interface) to filter the ‘way’ entries [58]. The street segments are formatted in GeoJSON, and their reference systems are translated from WGS84 (World Geodetic System 1984, EPSG:4326) to TSV’s GCJ-02 reference system using a Python library pygcj (ver. 0.0.1).
The second step is to extract the panorama coordinates. The available coordinates were acquired along the polyline for each street segment through Tencent Map’s JavaScript API (version 2.0). The coordinates’ reference standards were translated from China’s GCJ-02 to WGS 84 (EPSG:4326) and Hong Kong Grid System 1980 (HKGS80, EPSG:2326). As shown in Figure 3, 45,331 panorama coordinates were found on 4056 segments (536.33 km in total). A few coordinates circled in yellow were from backpacks or 360 cameras instead of vehicle-borne cameras. The remaining 2485 segments were steps, corridors, private roads, and hiking paths with no TSV service. The average density was 84.5 pts/km, or one coordinate per 11.8 m. It should also be noted that there were some shared coordinates in segment connections.
The third step is to extract the perspective photograph. For each TSV coordinate, twelve shots of perspective photos—with a 30° angular gap between the heading directions—were downloaded through the TSV static photograph API. The resolution was set to 960 × 480 to mimic the Cityscapes Dataset to transfer deep learning [53]. The download consumed about ten days for transferring 541,095 photographs (50.3 GB on disk), or 99.47% of all requests, while the remaining 0.53% responded with data errors. The camera time showed that 99.9% of the photographs were taken between 9:00 to 15:59 within 21 days with clear weather from March to June 2014. The coordinates and photographs’ reference systems were translated from GCJ-02 back to WGS84 and Hong Kong Grid System 1980 (HKGS80, EPSG:2326).

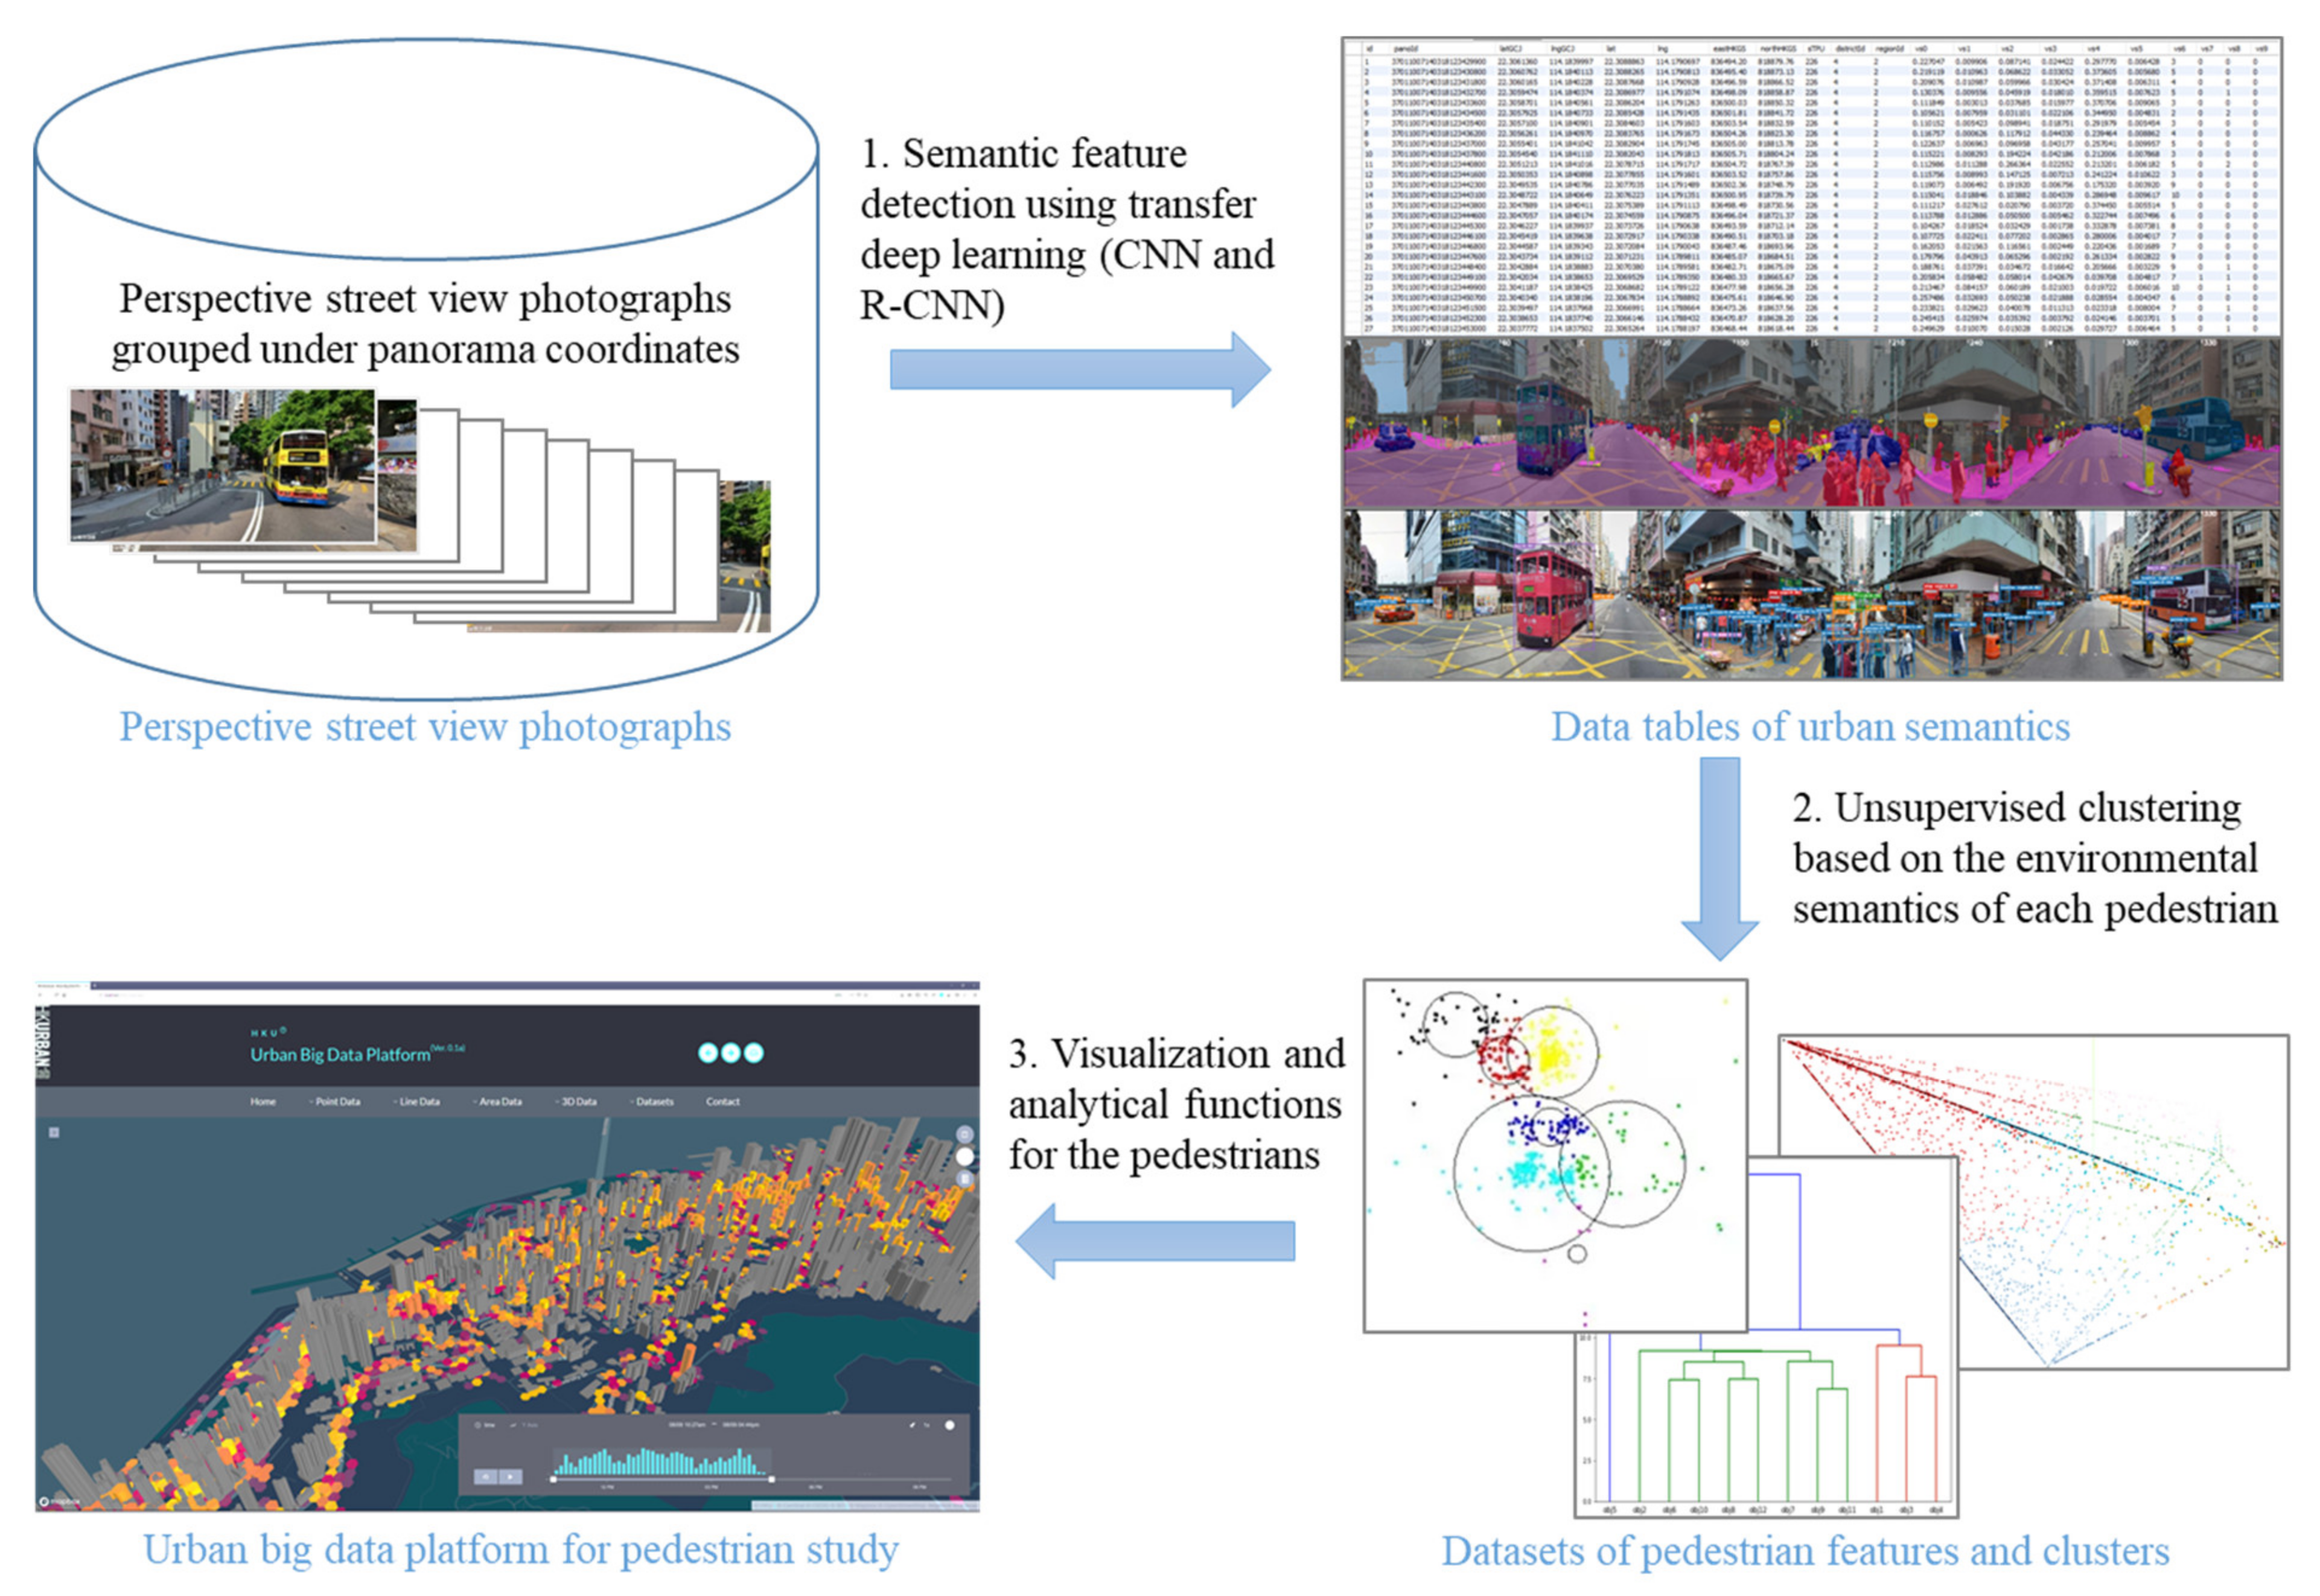
3.2. The VUCCA Approach

We developed an automatic approach vectors of uncountable and countable objects for clustering and analysis (VUCCA) to the processing of pedestrians in street view photographs to enrich smart city information infrastructure. The approach, as shown in Figure 4, consists of three steps of automatic detection and analysis. The input data is perspective street view photographs, and the outputs include a data table of semantic features, clusters, and urban object information. Step 1 includes semantic segmentation as well as object detection. The semantic segmentation is the task of classifying the pixels to visual fields of streetscape elements that are uncountable or difficult to count using a transfer CNN model. The object recognition is the task of annotating the instances of countable streetscape elements using a transfer R-CNN model. Step 2 is the unsupervised clustering of deep transfer learning results to identify new relations and activities. Step 3 includes validation and demonstrations of the relations and activities in the clustering results.

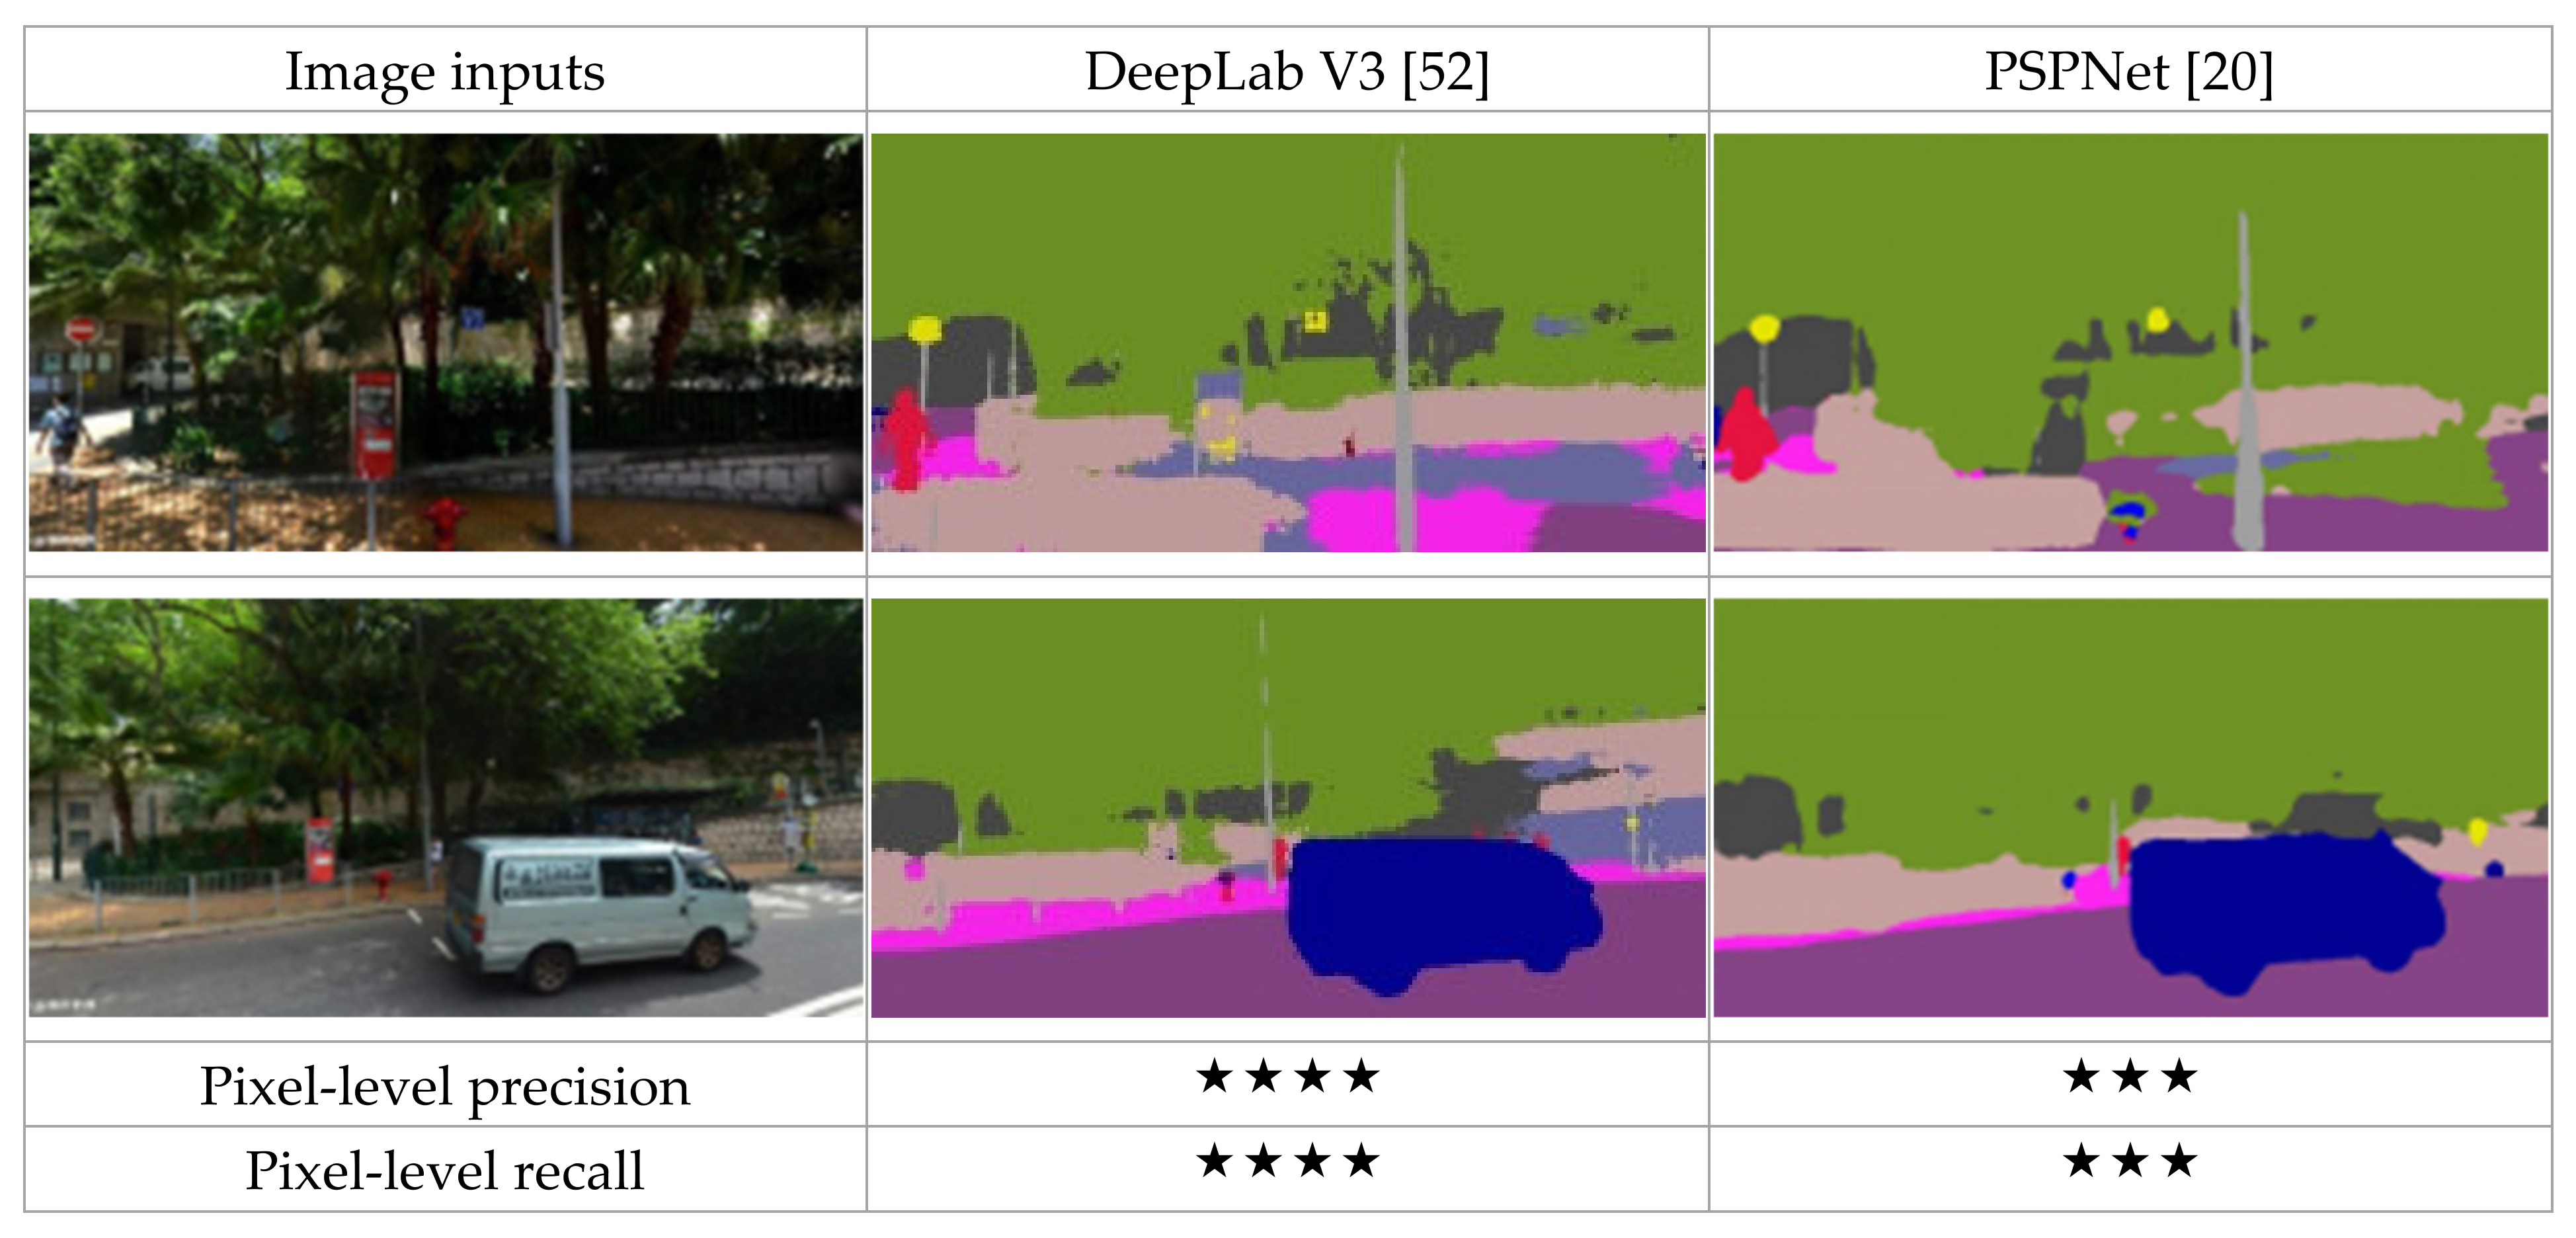
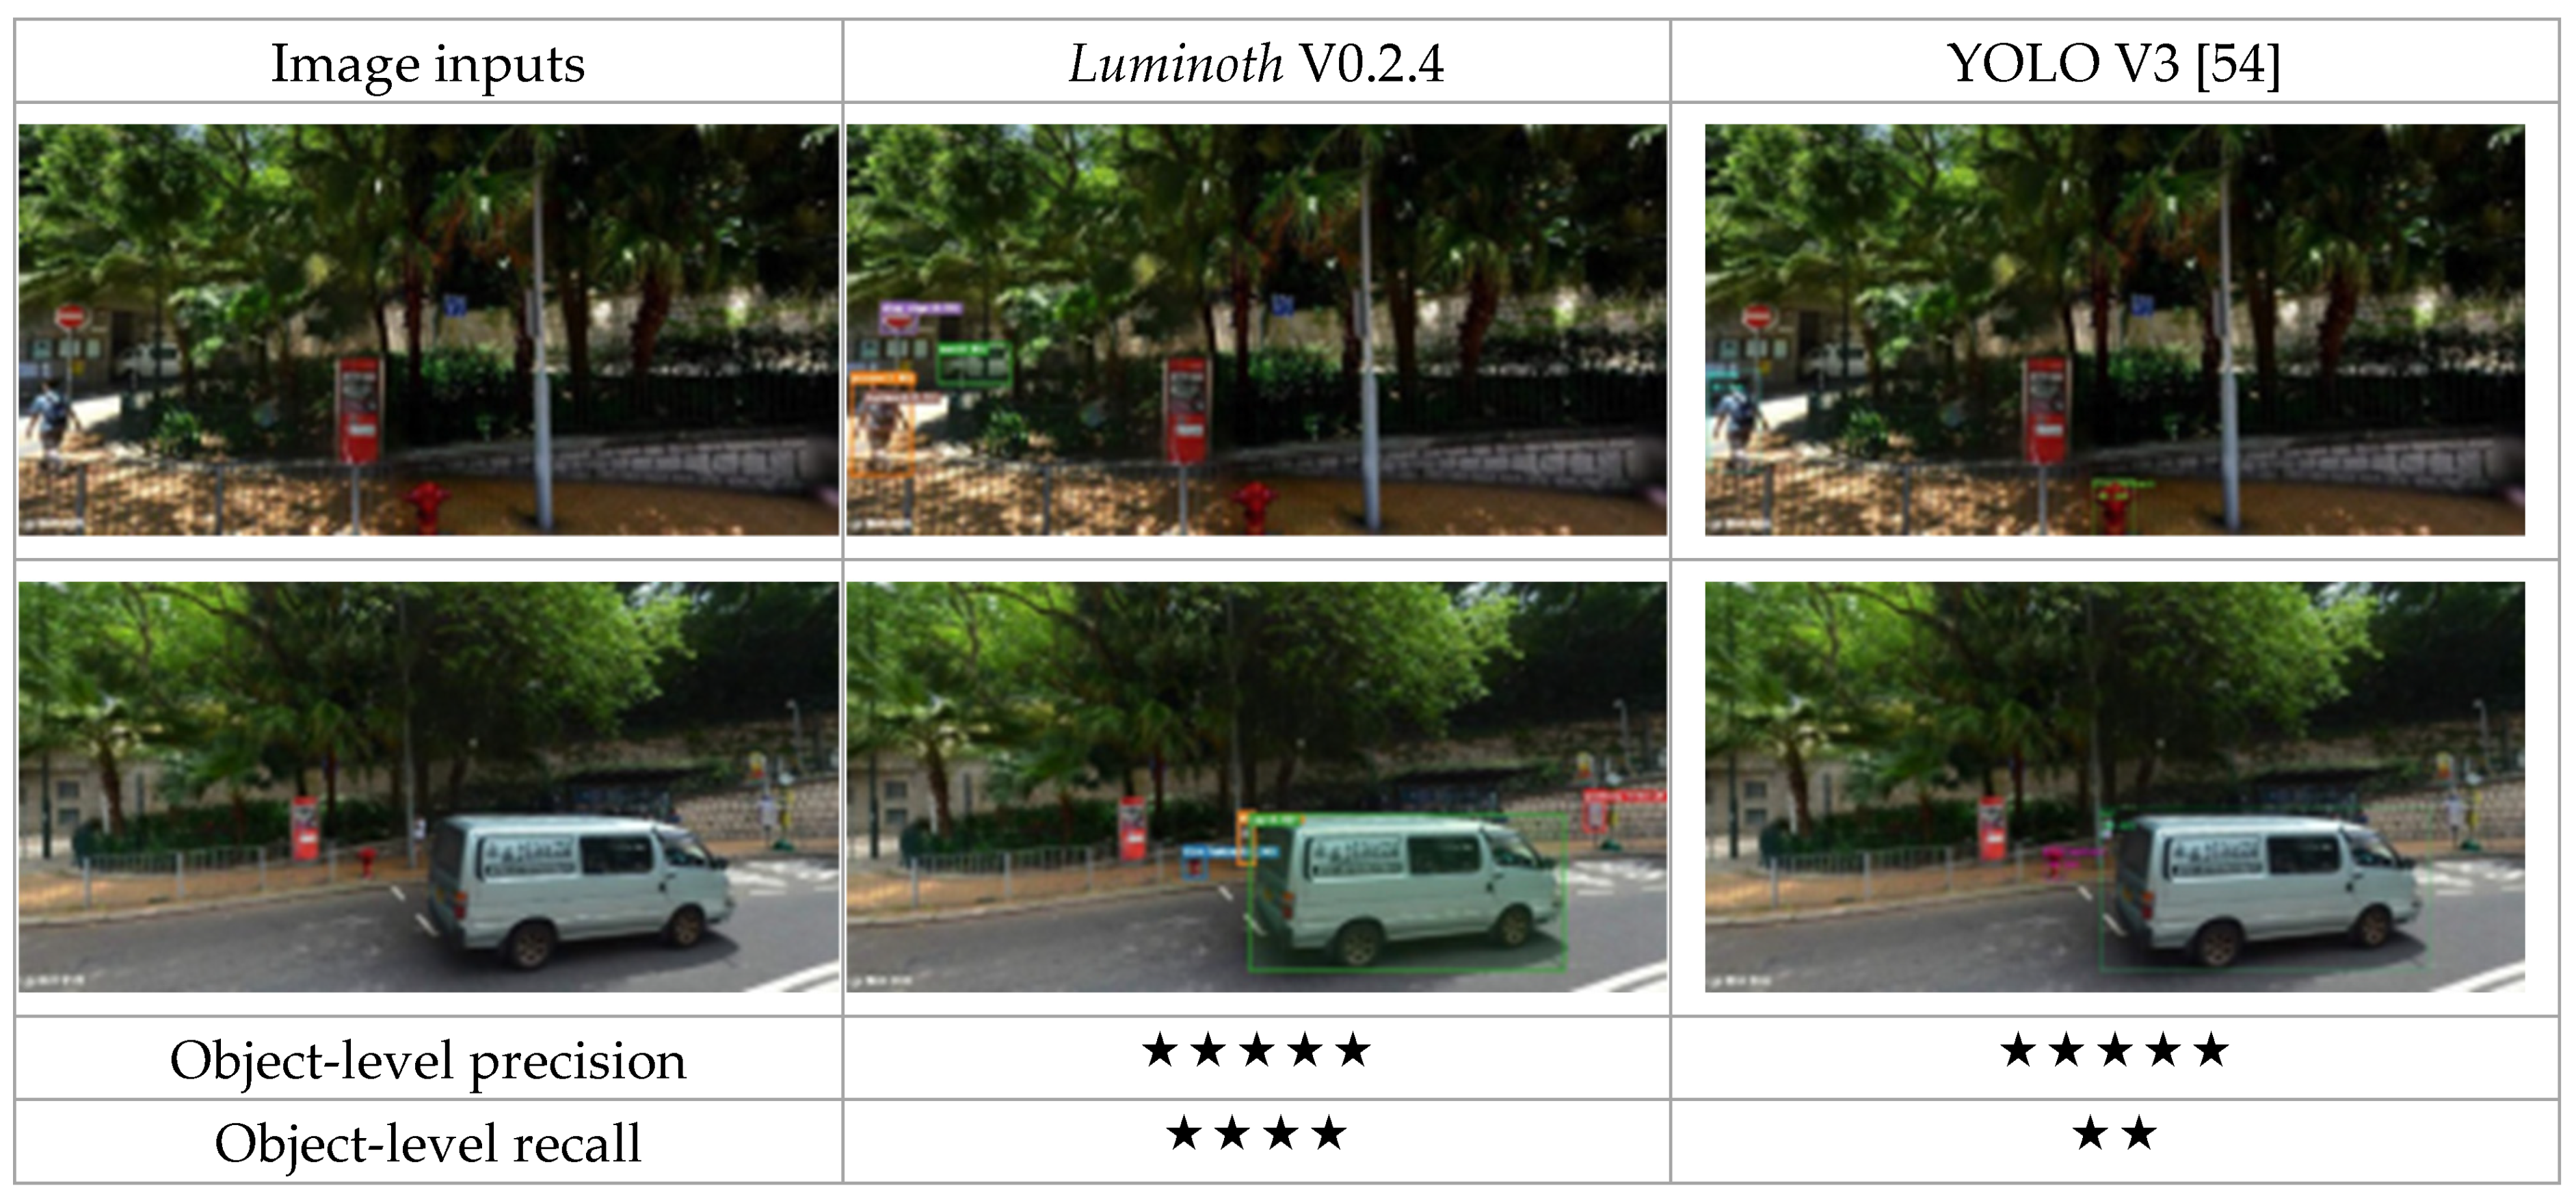
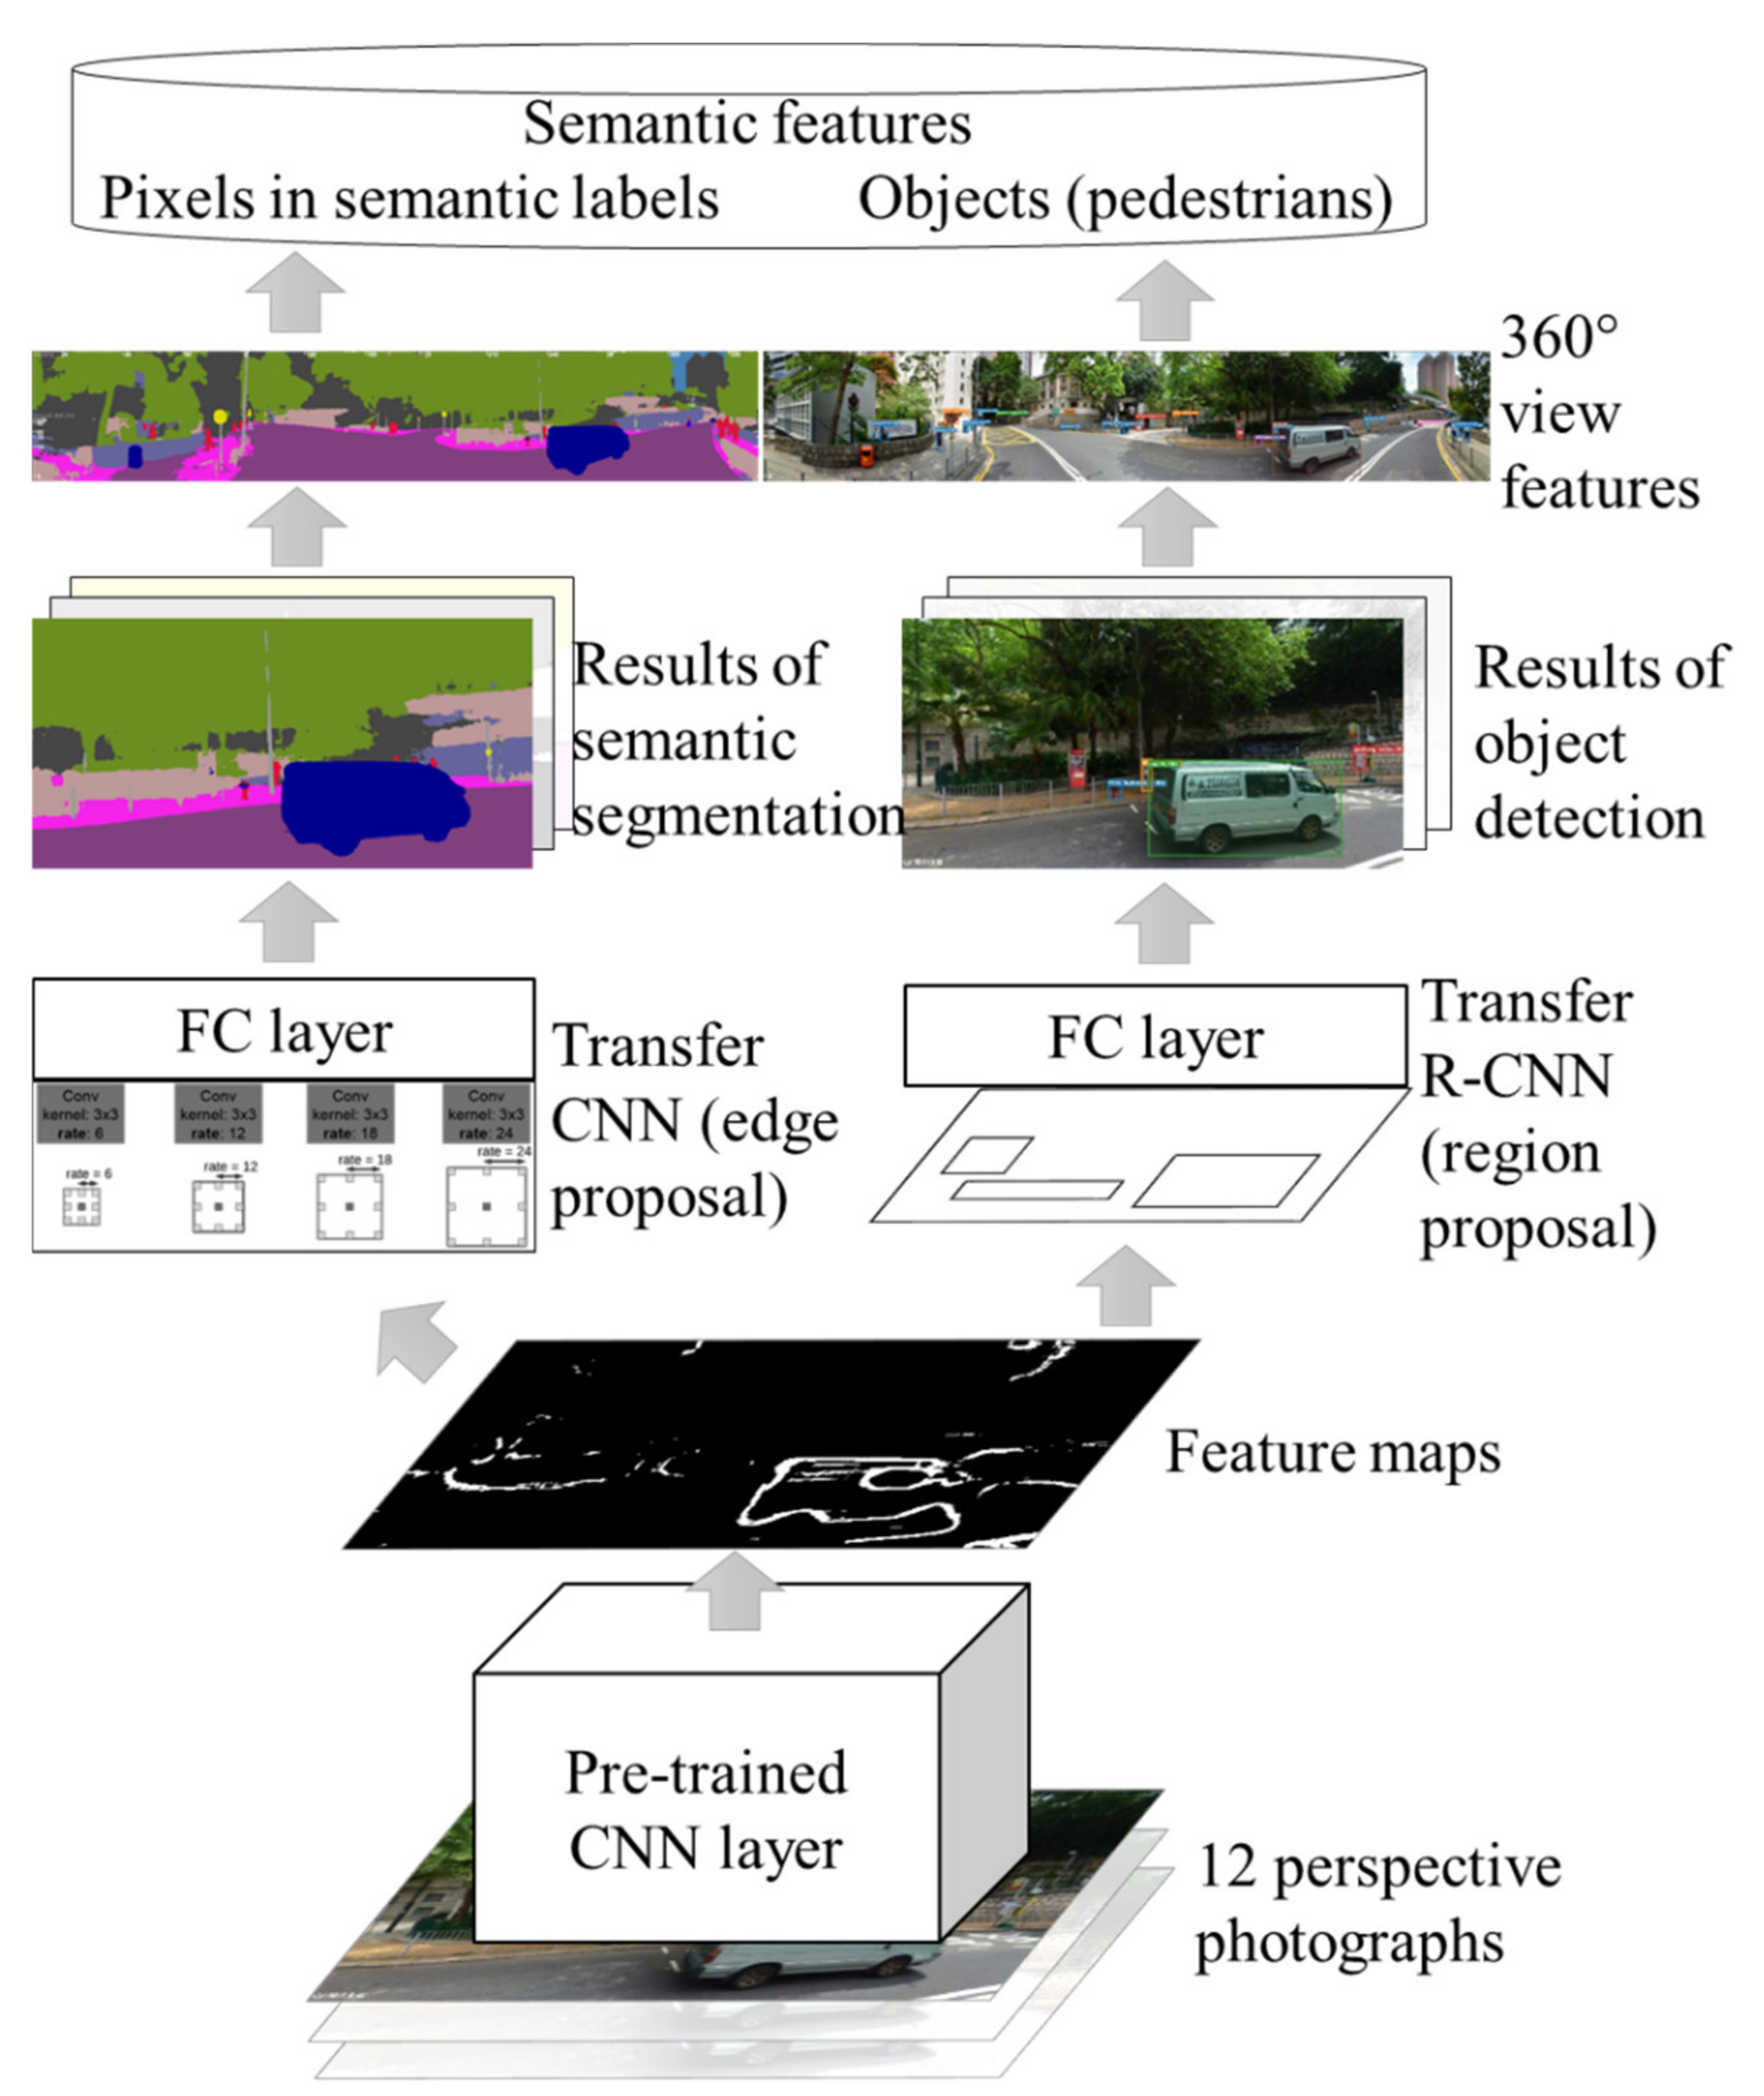
3.2.1. Semantic Feature Detection

The first step is automatic semantic feature extraction based on deep transfer learning. As shown in Figure 5, this step consists of three tasks, i.e., semantic segmentation using transfer CNN, object recognition using transfer R-CNN, and 360-view feature extraction. The input to this step is the twelve perspective TSV photographs of a coordinate, while the output is a list of semantic features describing the pedestrians and the environment such as the ground and background.
First, the input images are processed by pre-trained CNN layers for extracting feature maps. In the task of semantic segmentation, a deep CNN such as DeepLab’s ‘atrous CNN’ [52] can propose the edges for partitioning the pixels. The semantic label of the pixels can be classified by a fully connected (FC) layer such as a conditional random field (CRF) and support vector machines (SVM). As a result, the pixel-level semantics from the semantic segmentation can represent the uncountable or difficult to count street elements. In this study, we adopted DeepLab (version 3) pre-trained on the Cityscapes Dataset [53] because it is one of the best models evaluated on the open benchmarking dataset, Cityscapes [59,60].
The second task is the object recognition for annotating the instances of countable objects such as pedestrians. Other than the edges in semantic segmentation, a region of the bounding box is required to propose for each object in this task. The deep transfer learning model is a faster R-CNN model freely available in the Python package luminoth (version 0.2.4) and pre-trained on the COCO dataset [55]. The transfer R-CNN model won first place in the ECCV 2018 Joint COCO and Mapillary Recognition Challenge.
The third task consolidates the results of semantic segmentation and object detection for each coordinate. As shown in Figure 6, the central 30° areas of the results were combined to two images of 360° views, each in a resolution of 2664 × 480. The pedestrians can be filtered using the ‘person’ label from the results of transfer R-CNN. For each pedestrian, the distance and geolocation are triangulated by the camera’s location and the angle of dip according to the middle bottom of the bounding box.
The pixels of the lower edge of the bounding box, as shown in Figure 6c, indicates the ground, while the top edge represents the background. Ten categories of semantic features representing ground and background can be filtered from the predictions of transfer CNN (in Cityscapes), as listed in Table 1. A pedestrian’s ground features are the pixels of greenery (F1), roadway (F2), sidewalk (F3), construction (F4), sky and terrain (F5), air-conditioned vehicle (F6), vehicle (bike) (F7), street furniture (F8), pedestrian (F9), and others (F10). Similarly, feature data can be extracted for background and sides. Apart from pedestrians which are focused in this study, the semantic feature extraction also works well for other ground objects like urban animals, vehicles, and light poles.

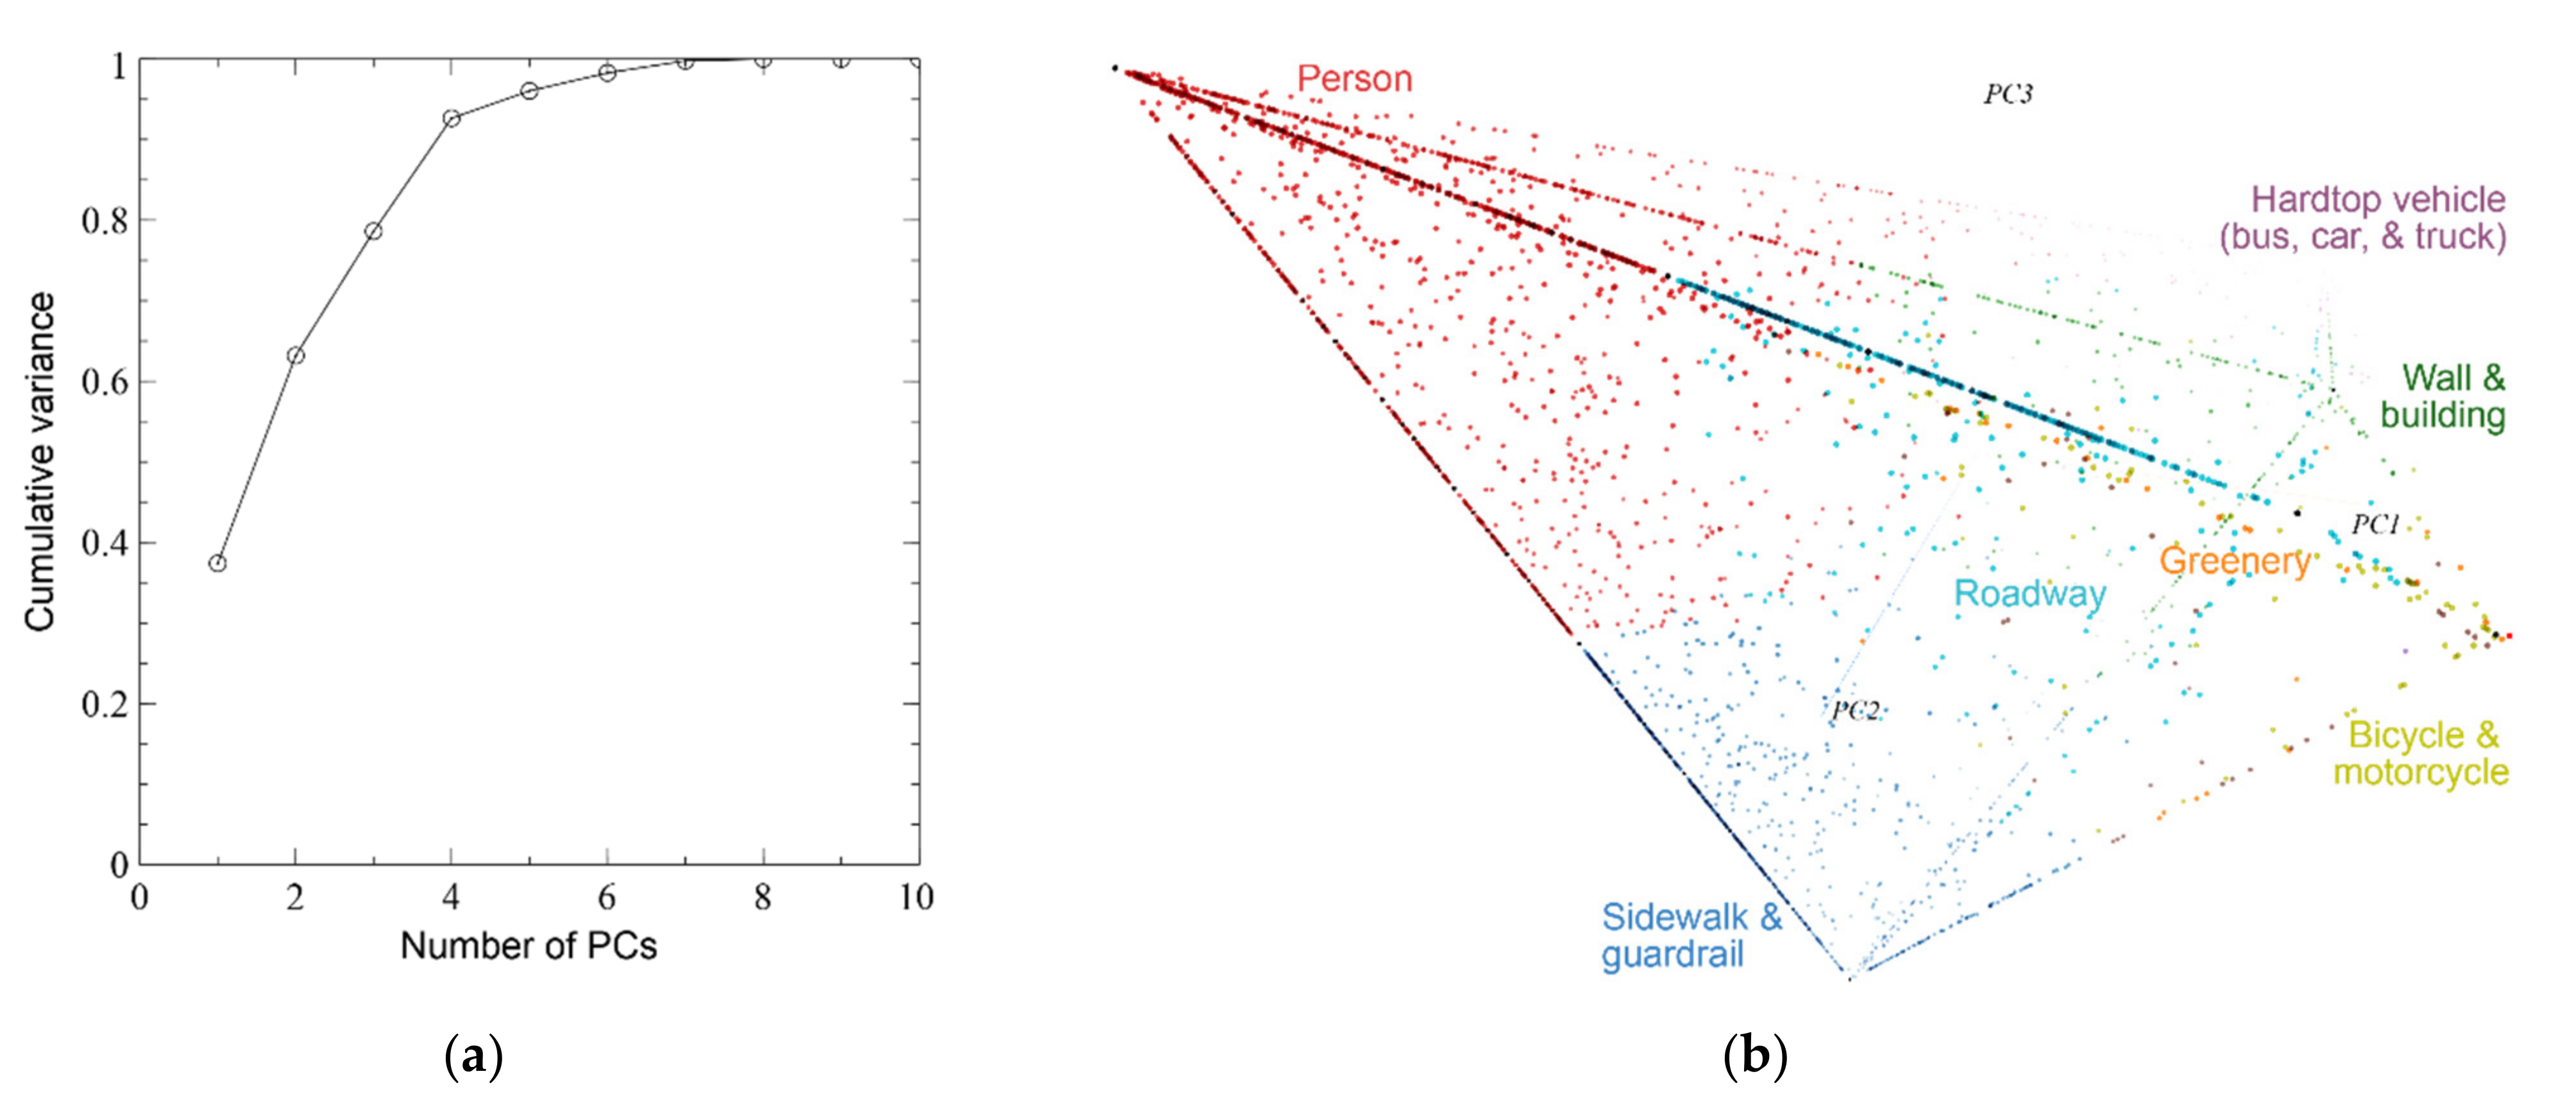
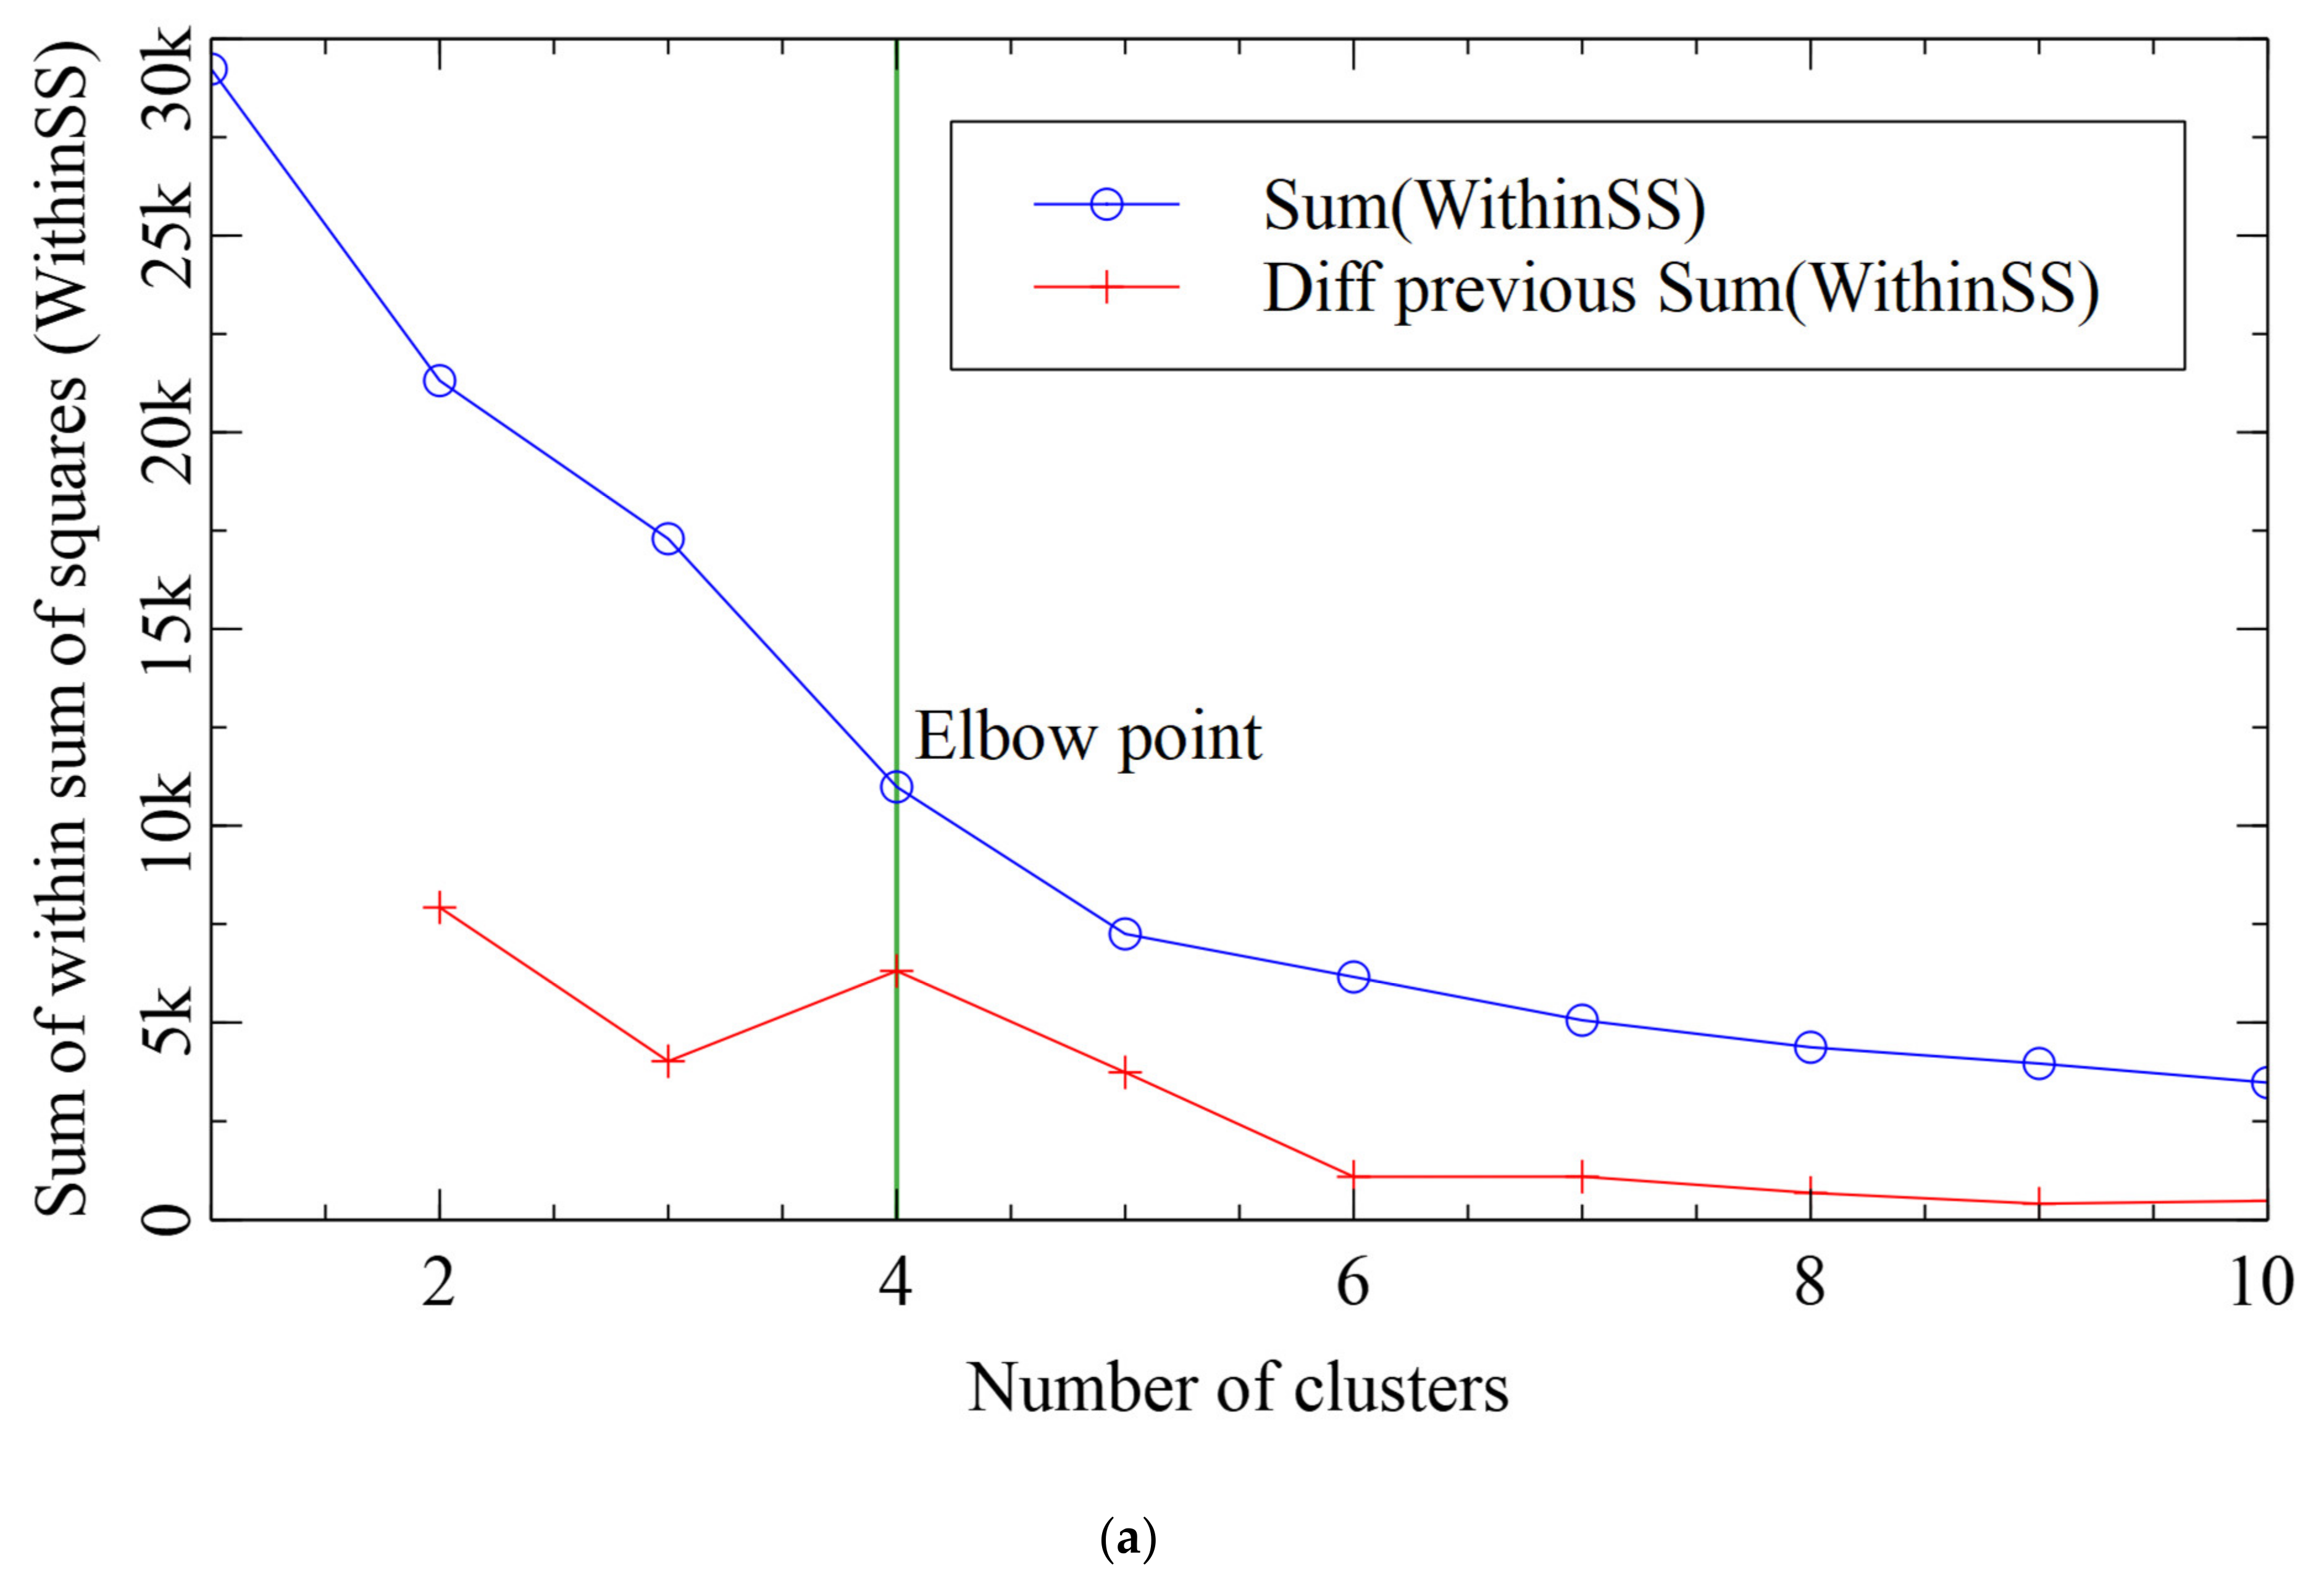
3.2.2. Unsupervised Clustering

To balance computation efficiency and effectiveness in capturing maximum information about the input dataset, reducing the dataset’s number of features is necessary before the clustering procedure. Semantic features are therefore pre-processed by principal component analysis (PCA) [61,62]. PCA is an optimal linear reduction approach that transforms high dimensional dataset to low dimensional data [63]. As PCA has the capacity to remove correlated features, it can significantly speed up the training, reduce overfitting, and improve visualization. Then, two unsupervised clustering algorithms are deployed to infer new activities. Firstly, we apply k-means clustering to the unlabeled semantic features for finding centroids [64]. For each centroid, the algorithm finds the nearest features in terms of Euclidean distance and assigns them to this centroid’s category. For each iteration, the centroid is updated by calculating the average of all features attributed to that category. The elbow method is used to determine the number of centroids by computing within-cluster sum of squares for a low variation level. Additionally, hierarchical clustering with an agglomerative technique is employed to aggregate above centroid into more specific clusters.

3.2.3. Analytical Functions

The pedestrian query function provides the possibility of diverse citizen-centric applications like street monitoring, video surveillance, autonomous vehicles, and intelligent robots. With its generally recognized characteristics of irregularities and ambiguities, it is laborious to extract factual information from unstructured data and deliver a full range of services. In this part of the research, we tried to acquire insight from unstructured and semi-structured information by transforming them to be detectable through vectorization, facilitating a search for the most similar pedestrians on the island.
Based on the pedestrians’ semantic vectors, semantic dissimilarities (and similarities) can be defined for urban computing. For example, one can define mean absolute error (MAE), root-mean-square error (RMSE), or cosine similarity to measure the relatedness or distance between the vectors of 10 semantic features of two pedestrians, A and B.
MAE = (‖FAFB1)/10
RMSE = (‖FAFB2)/10
Similarity = cos(θ) = FA · FB/(‖ FA2 · ‖ FB2)
where FA is the vector of features of pedestrian A, FB is that of B, ‖ X1 is the L1-norm (or Manhattan distance) of X, and ‖ X2 is the L2-norm (or Euclidean distance). Regarding the three vectors of ground, background, and sides, the above equations can be extended to measure the overall relatedness or distance, e.g.,
MAEA, B = [MAE (Fg,A, Fg,B) + MAE (Fb,A, Fb,B) + MAE (Fs,A, Fs,B)]/3
The MAE distance metric and other metrics serve as the key to matching pedestrians’ features to identify a particular behavior or status. A particular query can be triggered by an unstructured instance of pedestrians in photography, as well as from well-structured semantic clauses.

4. Results

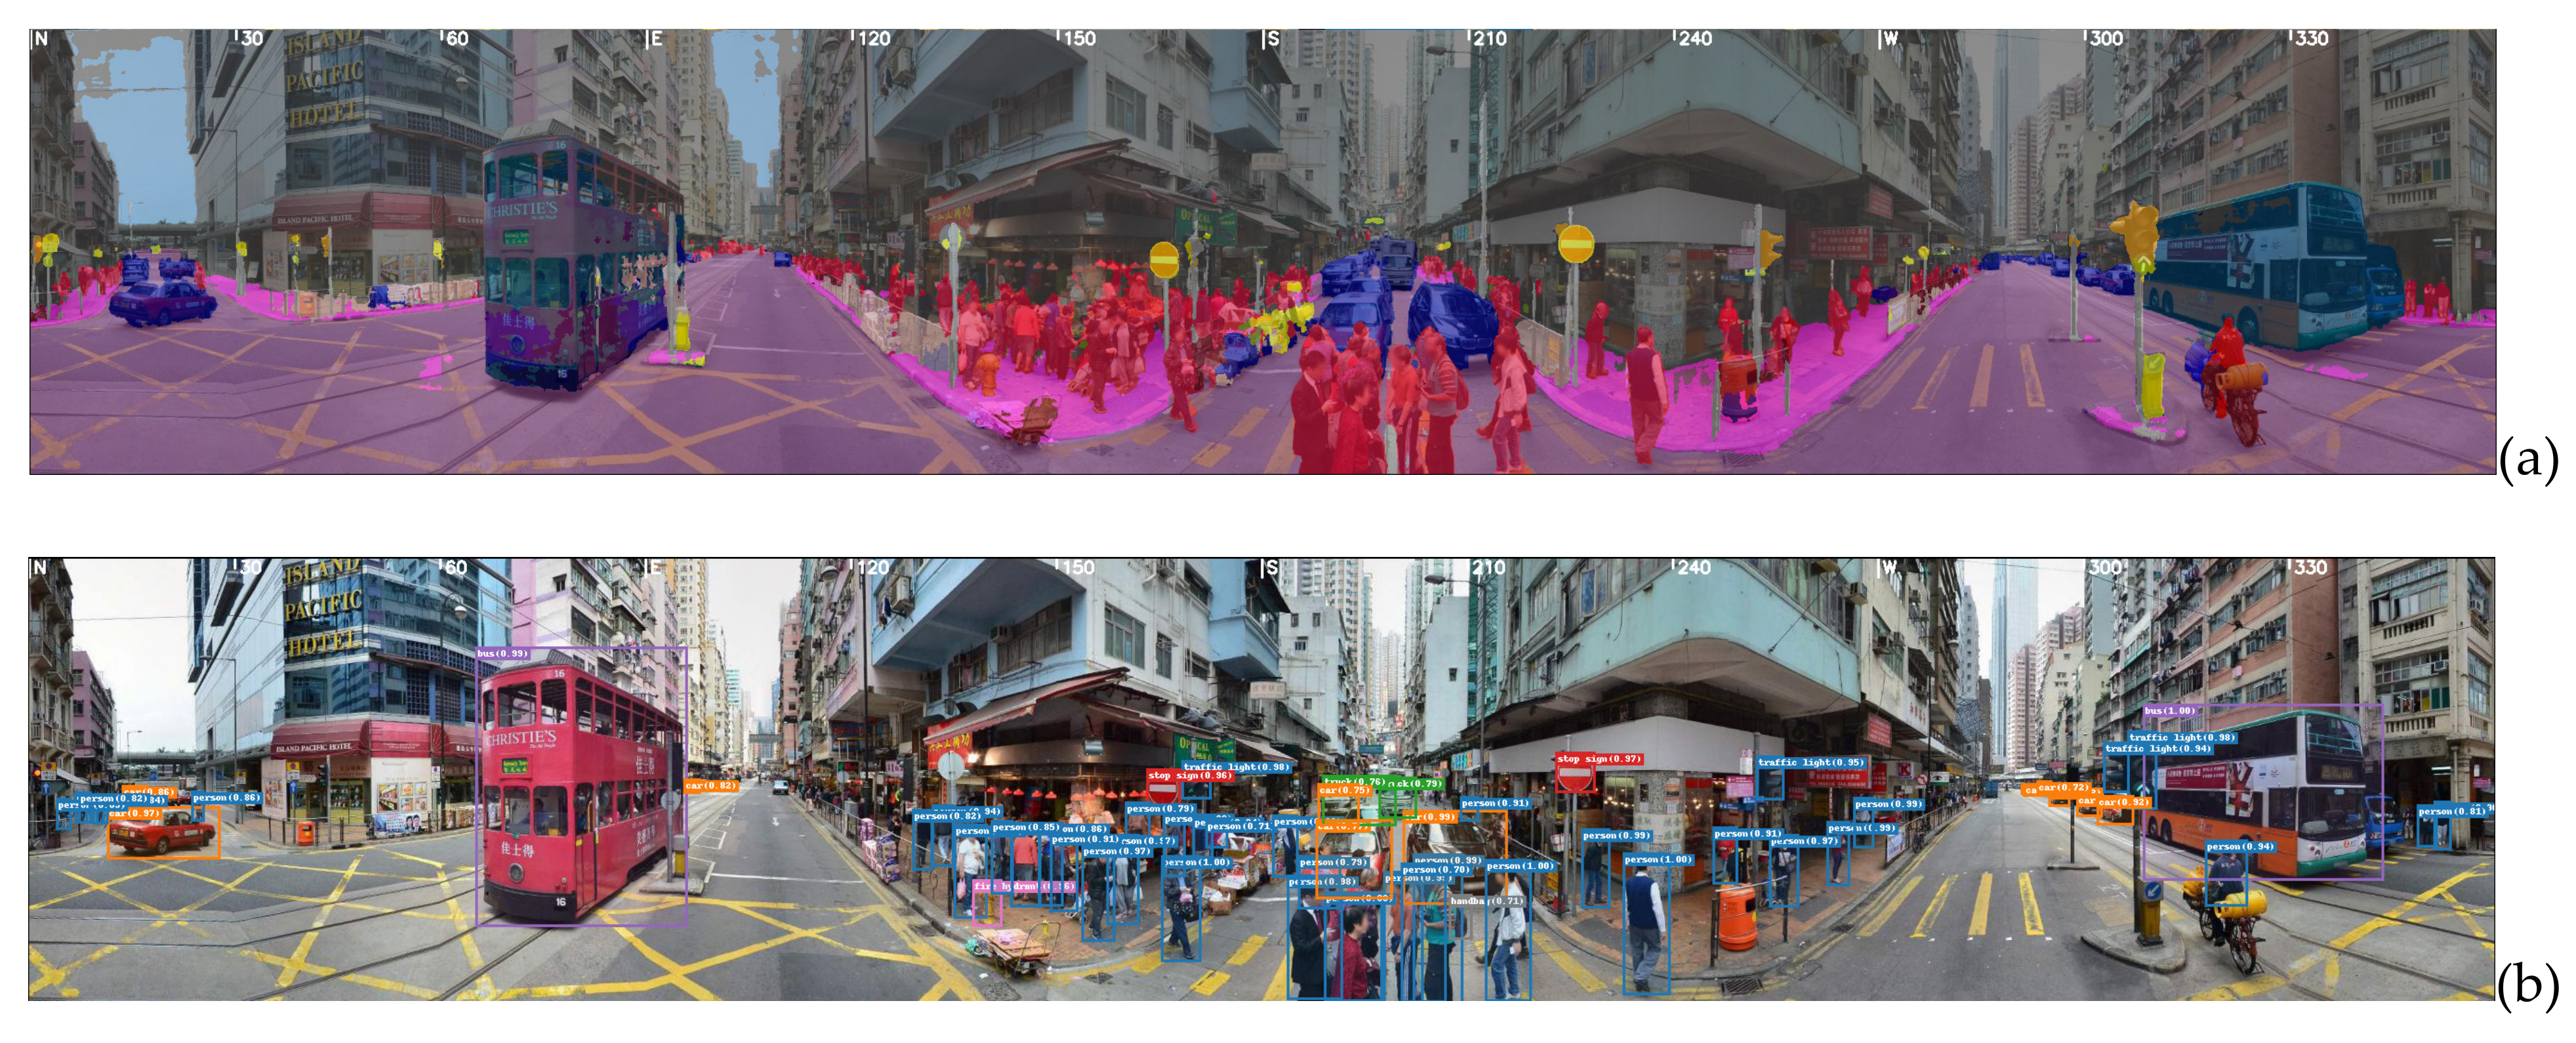
4.1. Semantic Pedestrian Detection

Figure 7 shows example results of semantic segmentation and object recognition. It can be seen that environmental features like roadway (F2), sidewalk (F3), construction (F4), sky and terrain (F5), air-conditioned vehicle (F6), vehicle (bike) (F7), street furniture (F8), pedestrian (F9), and ‘others’ (F10) have been detected. All the 530,000 TSV photographs were processed by the CNN and R-CNN deep learning models in 22 days.
Deep transfer learning results were validated in three sets of cases, that is, high-density, mid-density, and low-density urban areas. The results were reported for each set based on the average value of 50 randomly sampled cases, with ground truth provided by manual recognition. Among the sample cases, 23 belonged to ‘high-density’ areas, 10 from ‘low-density’ areas, and 17 from ‘medium-density’ areas. We spent three days annotating the ground truth of the uncountable and countable objects in the samples. Table 2 shows the average precision, recall rates, and F1 values for countable and uncountable urban objects. In brief, both indicators met with relatively high satisfaction, especially for distinct objects like construction sites, vehicles, and persons nearby. However, one set of unsatisfactory results arose from the different settings of pre-trained deep learning models. For instance, stop signs detection in the R-CNN model was confused because it was trained by the Microsoft COCO dataset in which traffic signs are not the same as Hong Kong’s. Another set of errors lay in fogged and tiny objects, such as cars and persons, of a few pixels in the far distance.
As a result, a total number of 248,168 bounding boxes of persons were detected in 530,000 TSV photographs. Through the geolocation triangulation shown in Figure 6b, the over 240,000 boxes were concluded to 61,788 instances of pedestrians by removing duplicated predictions according to the geolocation. Figure 8 maps the geospatial distribution of the 61,788 pedestrians. In addition, each pedestrian was associated with its nearest panoramic photographs for the clearest semantic features.

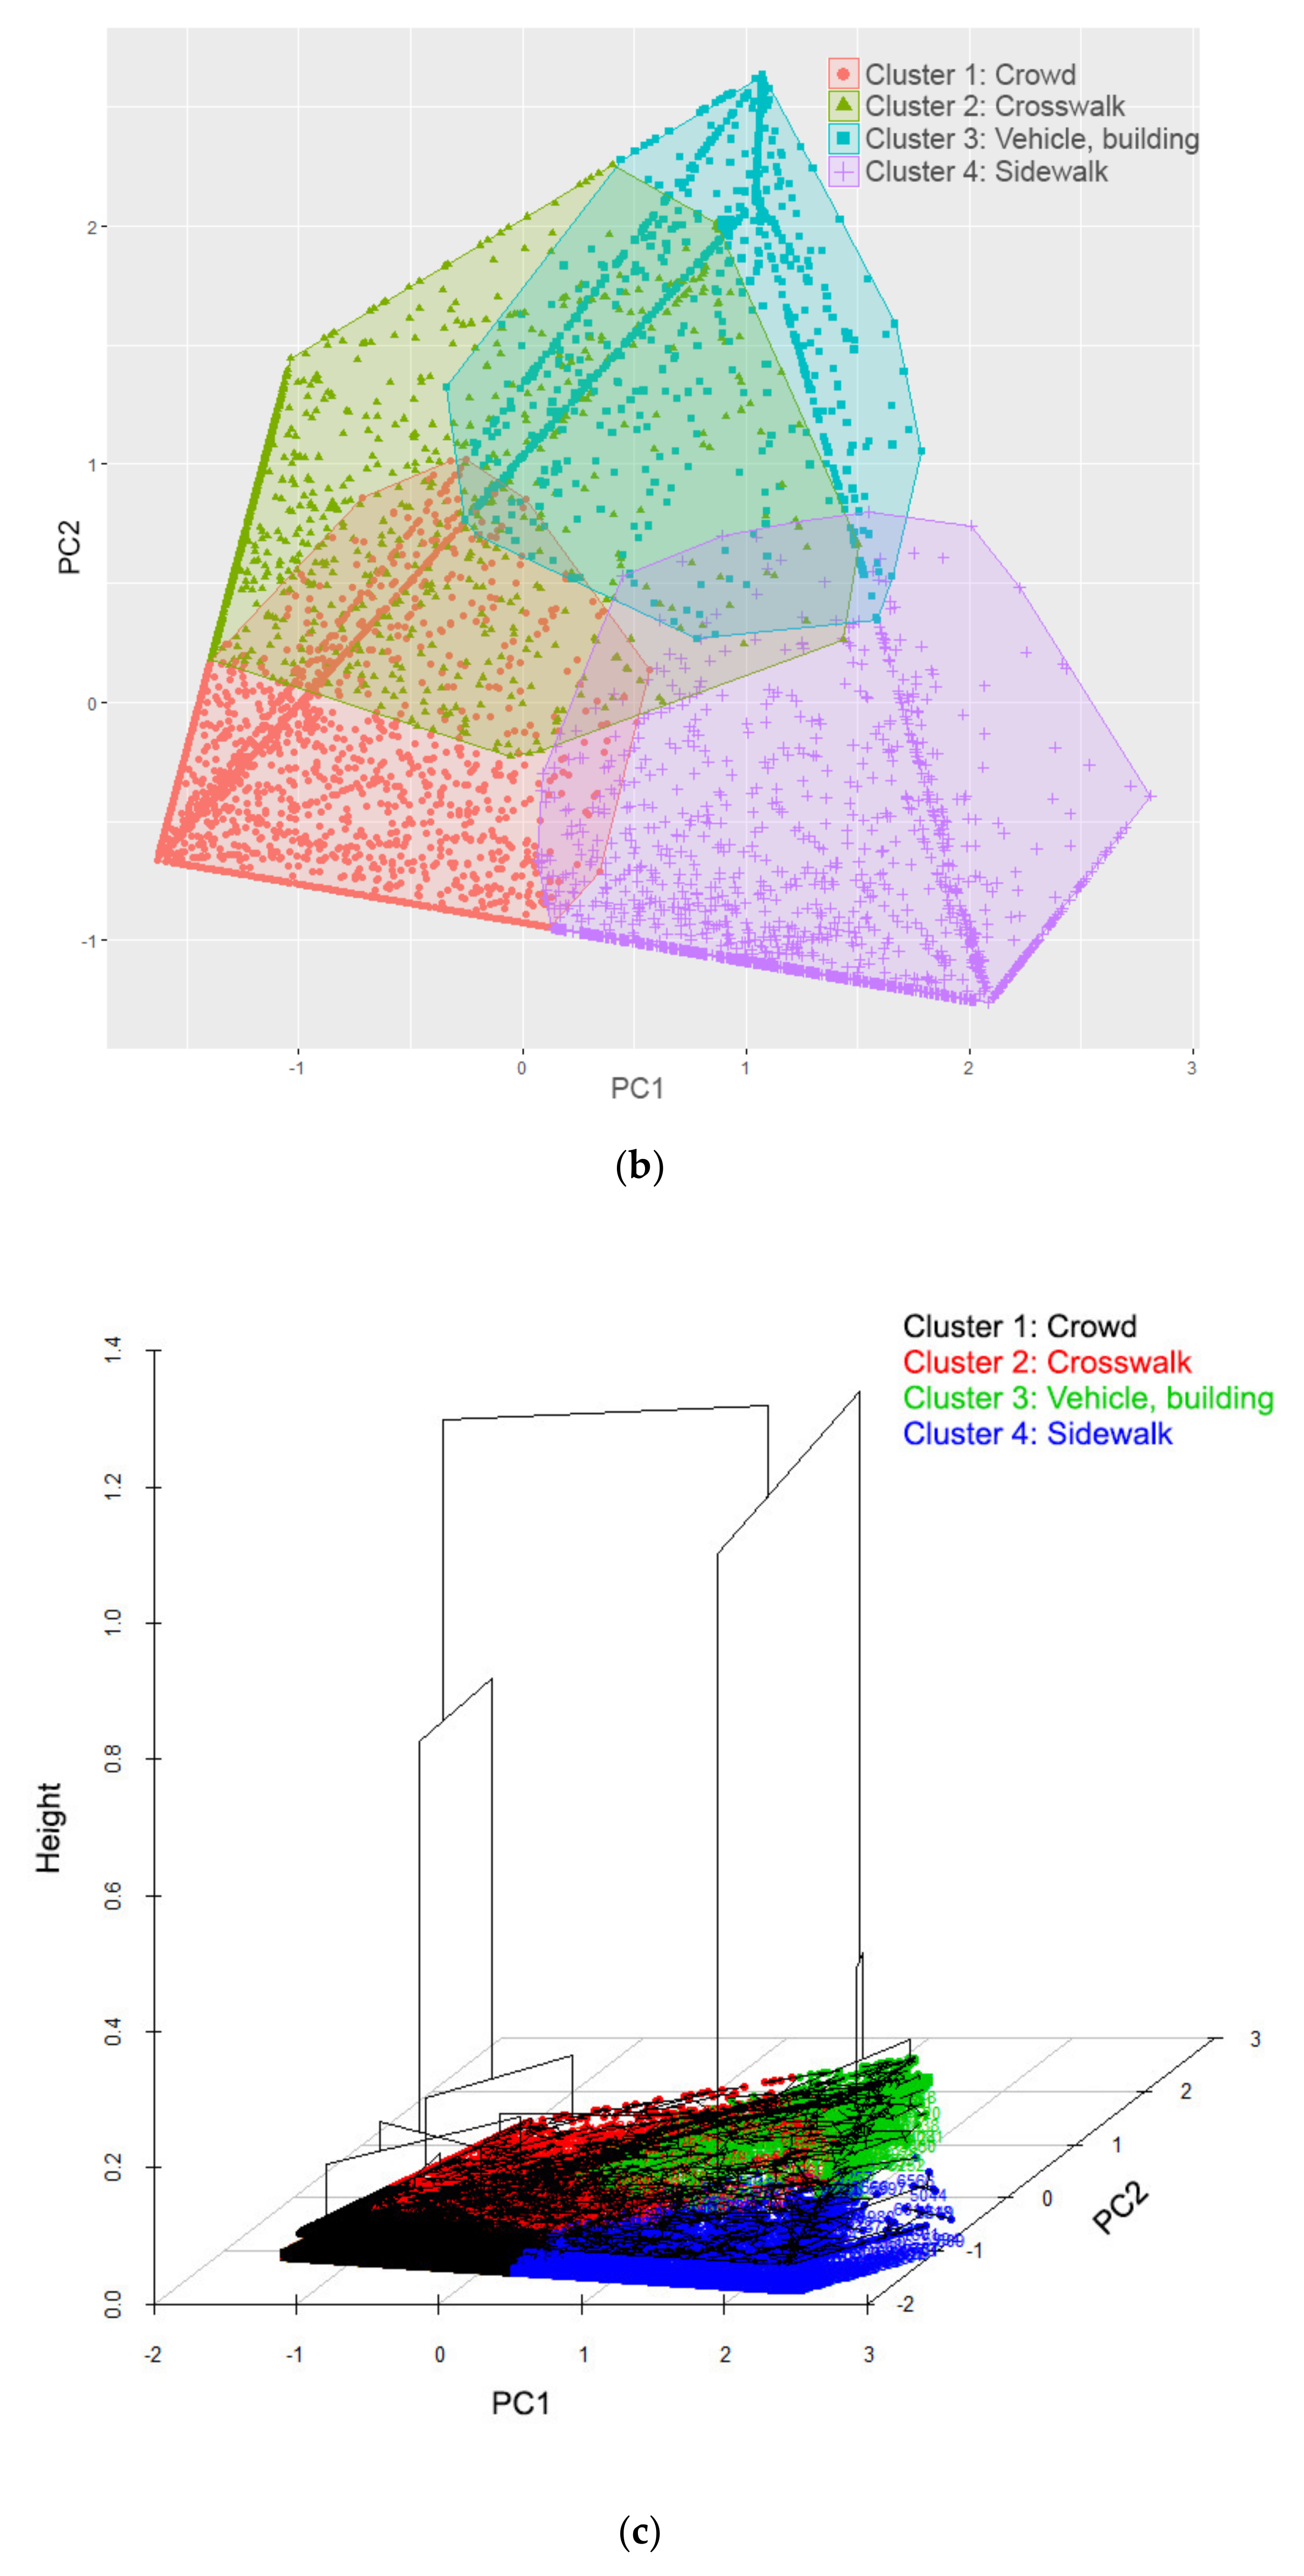
4.2. Pedestrian Clustering by Where They Stood

Unsupervised clusters can help understand the groupings and behaviors of pedestrians. We employed ground features to describe where the 61,788 detected pedestrians stood. The ground features of the pedestrians formed a table (Table 3). Each row had the percentage of the feature pixels defined in Table 3. For example, the first instance was of a pedestrian standing on a sidewalk area (F3), while the second one had a vehicle and a building nearby.
In order to eliminate correlations between the semantic features, the eigen decomposition transformed Table 3 into independent principal components (PCs). Figure 9a shows the accumulated representation of variance increasing along with the increasing number of PCs. The top three PCs represented 78.6% of the total variance. Figure 9b shows the 3D view of the 61,788 pedestrians in the semantic space of the top three PCs. Based on the color of points in Figure 8, it is clear that the densest points are around a crowd of persons, walking on the sidewalk (including guardrail areas), and crossing the roadway.
We applied k-mean clustering to group unknown pedestrians. Figure 10a illustrates the iterative tests of k-mean clustering. An elbow point was found at k = 4, as shown by the green line. By setting k = 4, we had four clusters grouped and associated with the meanings: crowd, crosswalk, vehicle and building, and sidewalk (see Figure 10b), and their mutual hierarchical closeness is depicted in Figure 10c.

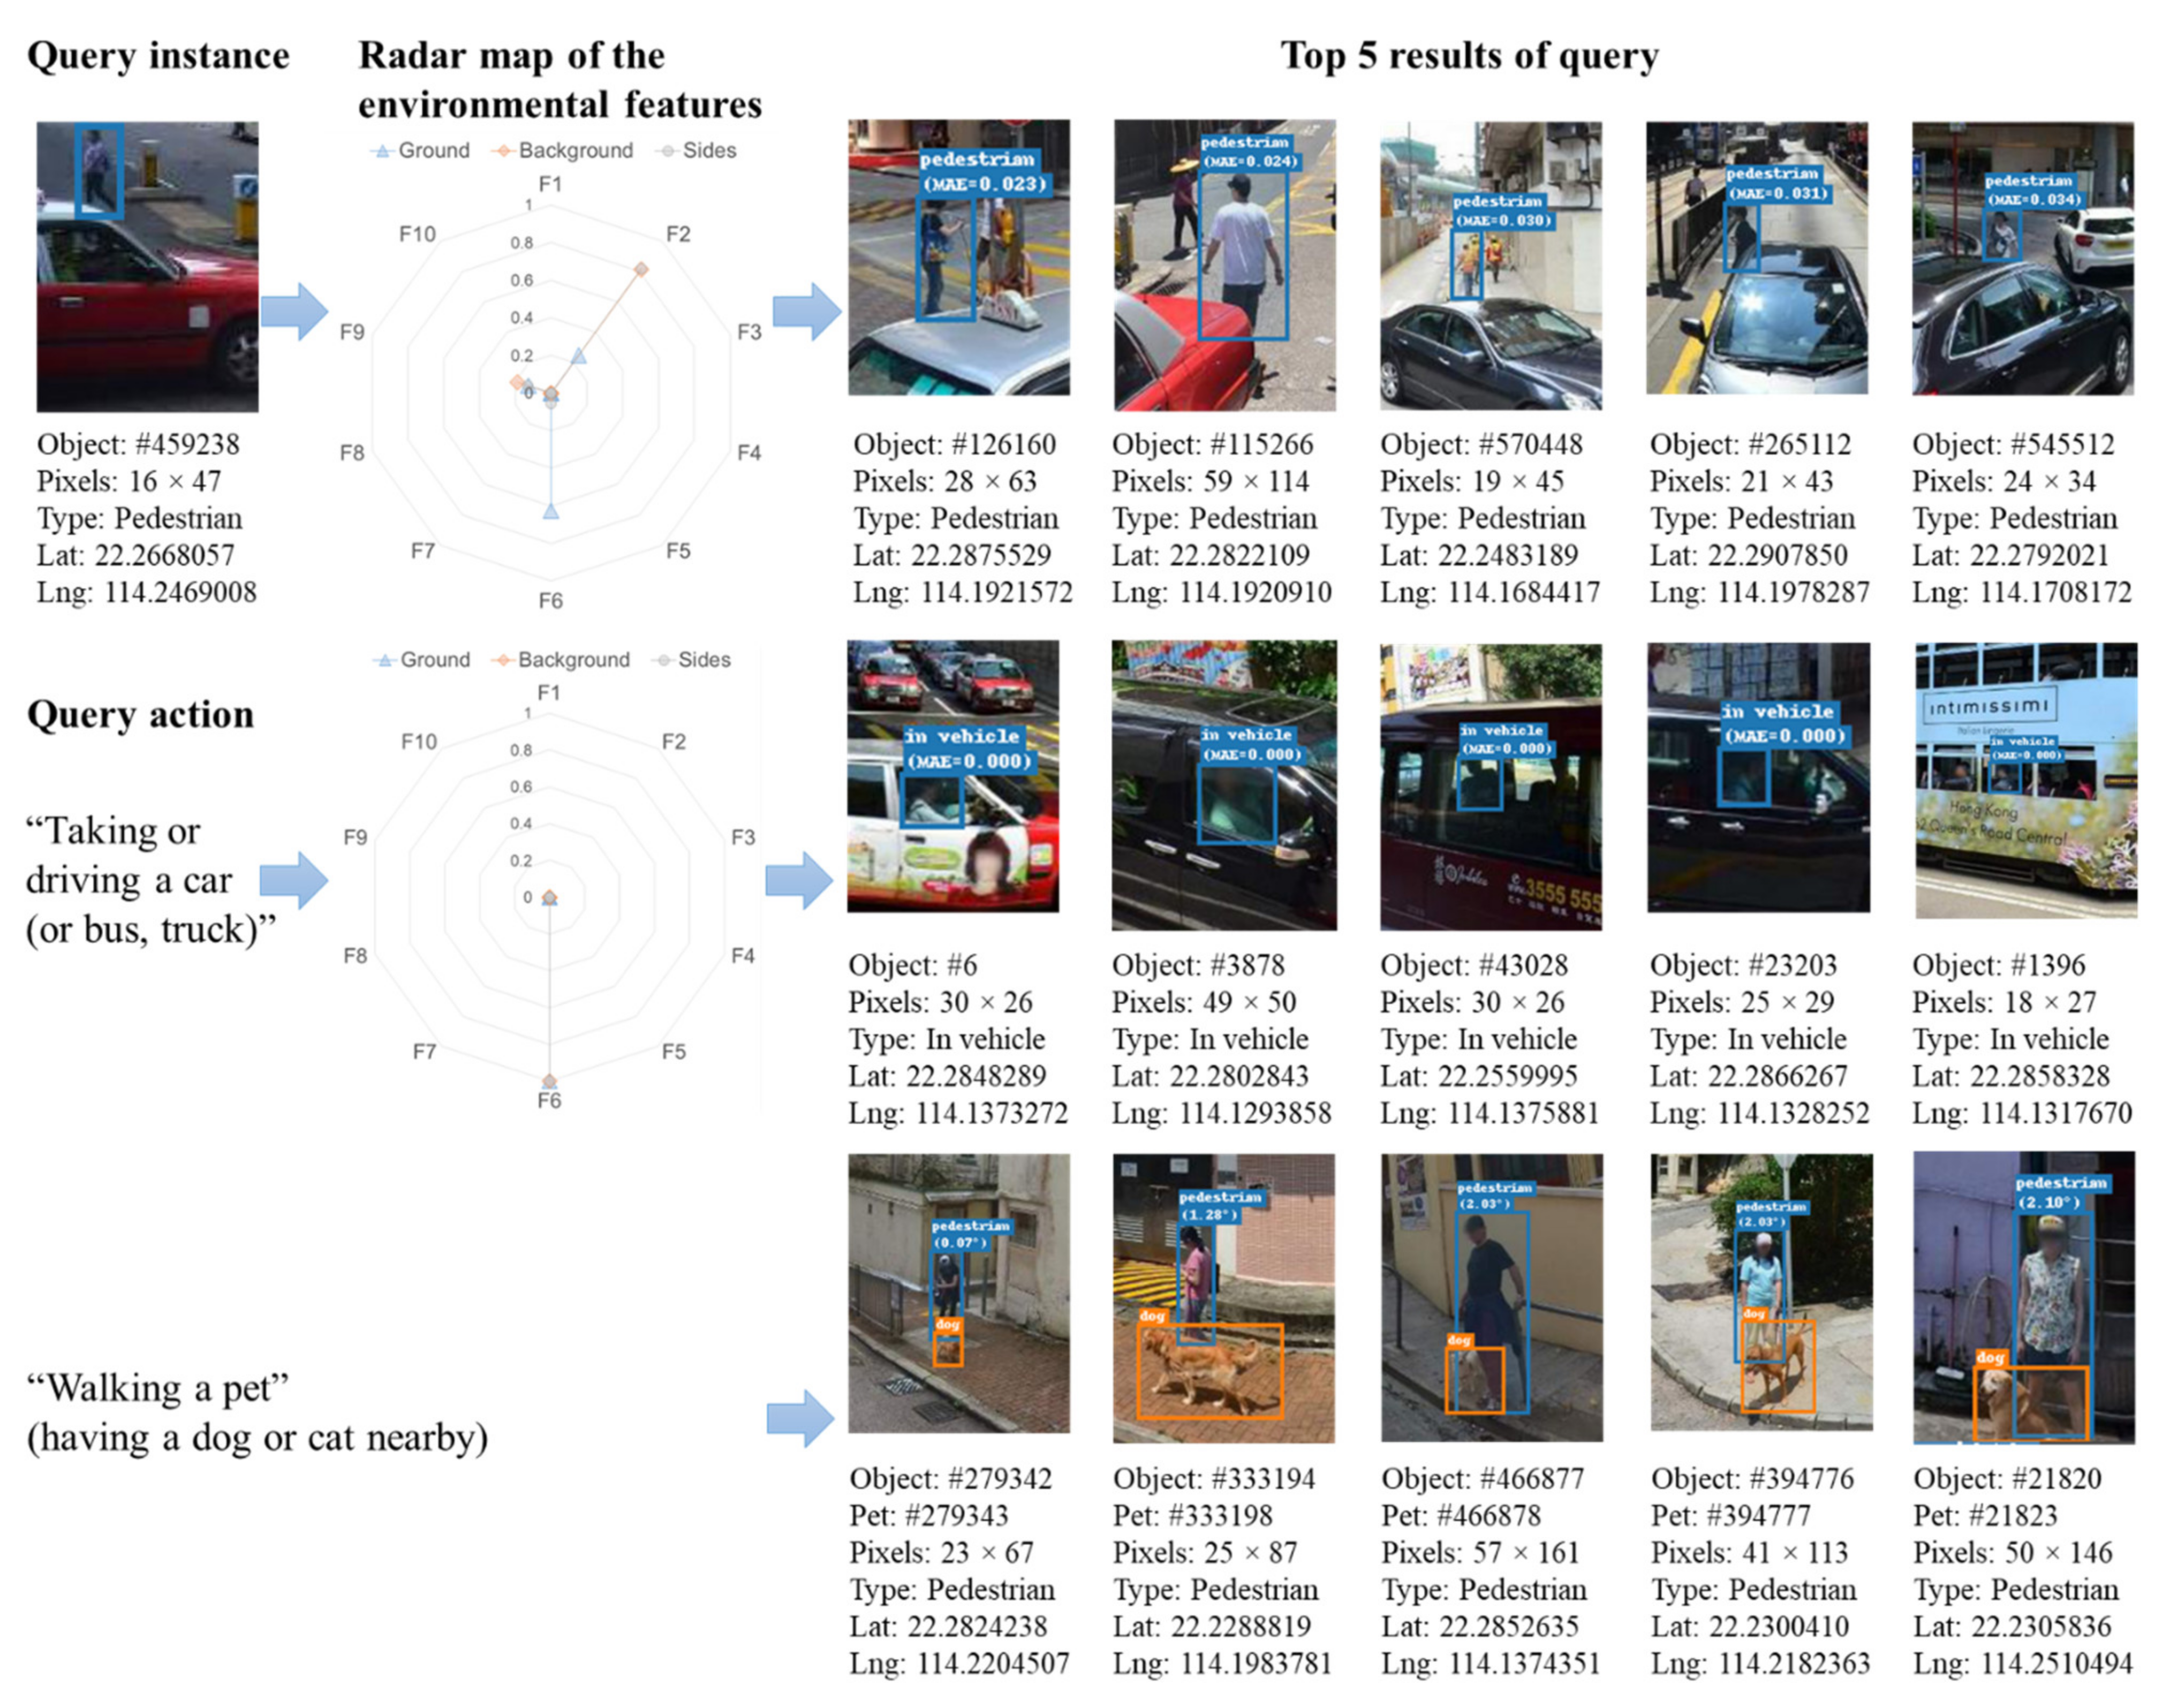
4.3. Pedestrian Query by Instance and Natural Language

As depicted in Figure 11, two types of queries, i.e., instance-based and natural language-based, were tested. In an instance-based query, a pedestrian instance was given to the search engine for finding the most similar persons. Figure 11 shows an example of someone beside a car. The top radar chart in Figure 11 shows the three sets, i.e., ground, background, and sides, of the semantic features. It can be seen that the ground of the instance contained more F6 (vehicle) than F2 (roadway), while the background was filled by F2 (roadway) pixels.
The top five most similar results from the 61,788 pedestrians are shown in Figure 11. The results consist of the object ID, size in pixel, geolocation as latitude and longitude, MAE, and an associated TSV panoramic photo for each returned pedestrian. Figure 11 illustrates that the query results are correct.
Apart from the unstructured instance, natural language query in pre-defined object tags and markings was also enabled. For example, ‘taking or driving a vehicle’ meant all the pixels around a person were vehicles (car, bus, or truck). The second radar chart in Figure 11 visualizes the identical targets of semantic vectors. The top five query results were all correct, with four in cars and one in a bus, while MAE values were all zero.
Sometimes, a pedestrian’s relational object, e.g., his/her pet, do not fall within the ‘bounding box.’ The MAE metric can be replaced by other relatedness metrics, such as angular error between a dog and the nearest (in angle) pedestrian. Then, a query clause ‘walking a pet’ returns a list of pedestrians and their pets. The closeness in the angular directions in the TSV photo indicated a close relationship between pet and walker.

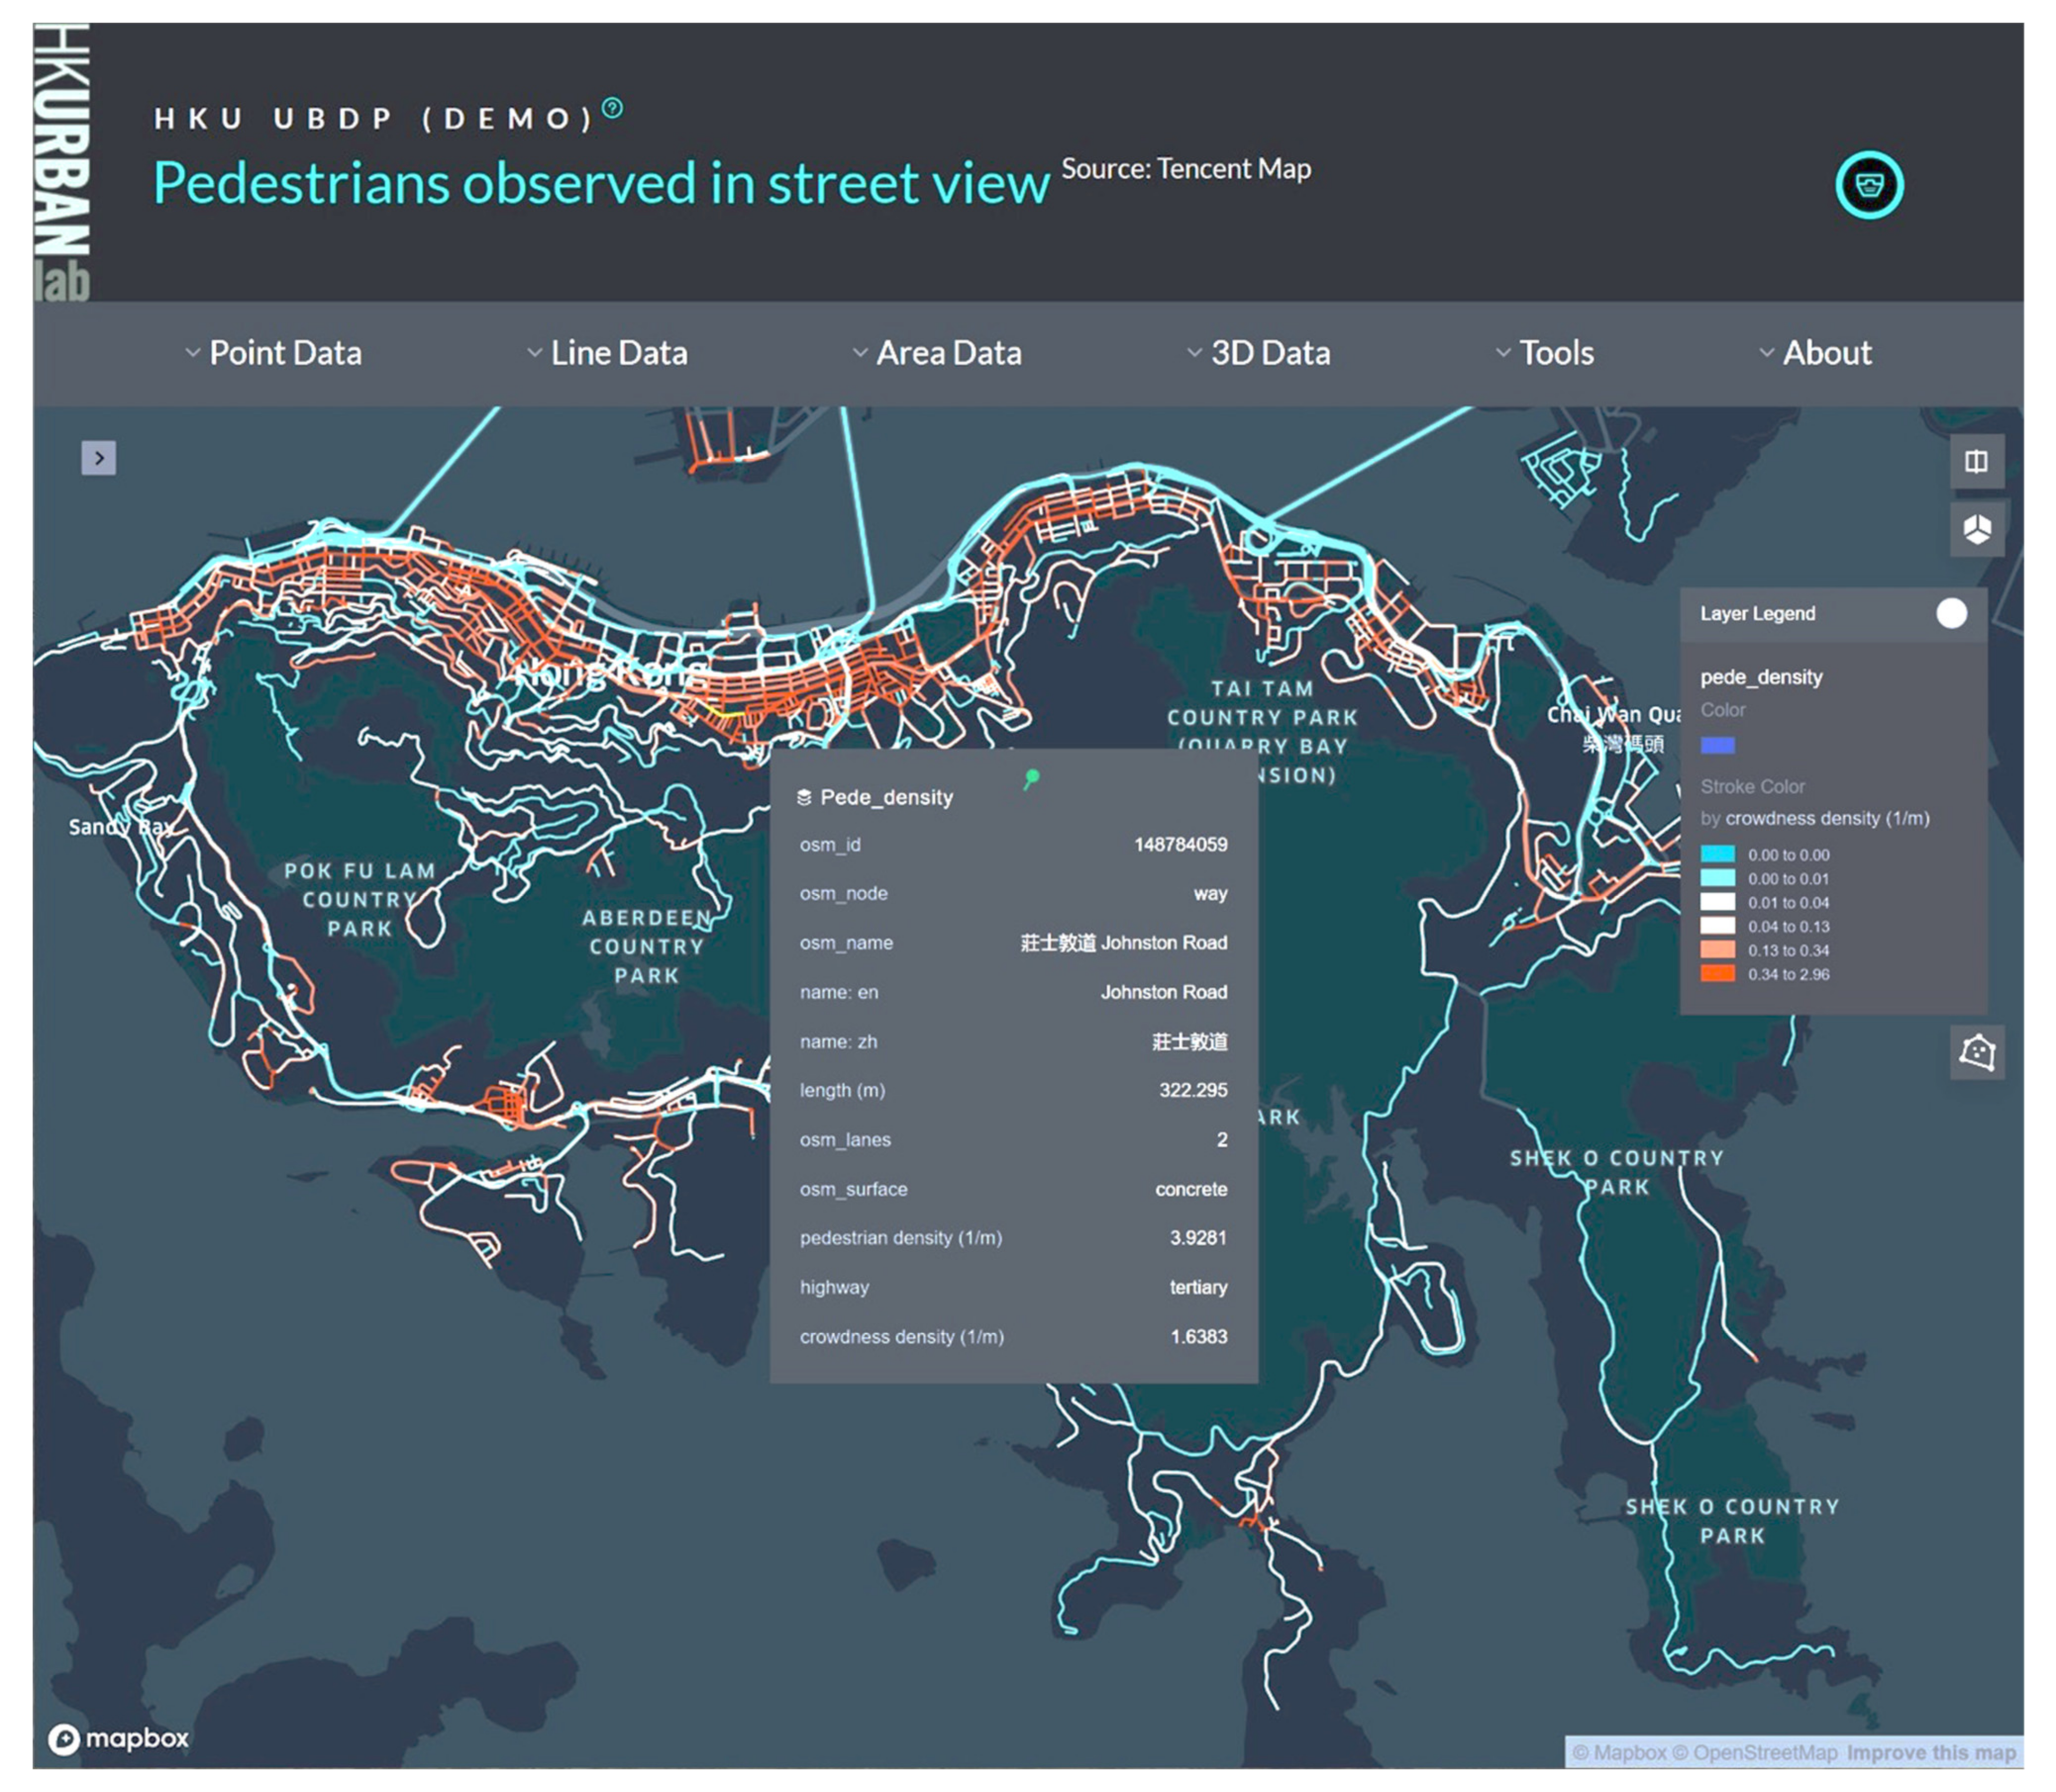
4.4. Semantic Enrichment for OpenStreetMap

The semantics of pedestrians on the streets was also applied to enrich digital maps such as OpenStreetMap. First, the 61,788 pedestrians in Figure 8 were aggregated to the street network of OpenStreetMap. By dividing the number of pedestrians by the length, we defined a property named ‘pedestrian density’ in the unit of m−1:
pedestrian density = number of pedestrians along a street/length of the street
Figure 12 shows the pattern of pedestrian densities on the island. Similarly, a property named ‘crowdedness density’ can be defined as the number of pedestrians having >50% side pixels labeled as ‘pedestrians.’ Then, we added the new properties to the GeoJSON exchange format for enriching OpenStreetMap’s street network.

5. Discussion

The proposed VUCCA approach consists of deep transfer learning, unsupervised clustering, and vector-based analytics. Deep transfer learning can gather, share, and transmit data between civic infrastructures, which lays a foundation to accomplish smart cities’ rosy vision. Furthermore, unsupervised learning and vector-based analytics require the least prior knowledge of complicated urban objects such as pedestrians. This approach provides an efficient and economical system, which makes it possible to refine multiplex eye-level urban features and facilitate the evolution of smarter cities in various aspects, embracing the reduction of workflow costs in automating processes, and the establishment of feedback between citizens and administrations. In this article, pioneering efforts were exerted to automatically detect pedestrians and pedestrian behavior, from 536,759 TSV photos on over 500 km of the road network in Hong Kong Island. Overall, we conclude that through employing big data from a street view photographic database, and using deep learning and unsupervised learning we were able to automatically detect a large number of pedestrian instances over a large geographic range.
The main contributions of our methodology are summarized below:
  • To begin with, pedestrians and other urban objects in unstructured big data of street view photographs are computable, analyzable, and queryable through the VUCCA approach. The vectors of semantic features enable not only unsupervised clustering and unstructured query of pedestrians in photographs, but more importantly structure information useful for applying more comprehensive vector-based concept computing for pedestrians and other key urban objects, e.g., buses, streetscapes, and urban areas. The results of unstructured, instance-based, natural language-based queries, and other semantic vector-based concept computing validated a new approach of urban computing for pedestrians.
  • Secondly, CNN and R-CNN serve as positive contributors to fulfill the semantic segmentation and label uncountable or countable objects. It was successfully adopted to classify several types of features (see Table 1); with greater precision in view classification achievable by adding to the number of input network layers. In addition, VUCCA is inexpensive to reuse transfer deep learning models to publicly available street view photographs. This suggests a productive research agenda in creating high quality deep learning pre-processors for specific smart-city application domains.
  • Furthermore, building computational models from static big data is exhausting, let alone for dynamic data (e.g., moving pedestrians or vehicles), which readily fluctuate in space and time. Accordingly, by leveraging unsupervised clustering algorithms, our research proposes an approach to automatically cluster the detected samples by comparing and processing resemblances through similar targets in nearby distances.
  • Finally, street view data has the capacity to play a small but vital role in smart city informatics. Big-data-driven multi-faceted semantic approaches can help maximize the potential of these otherwise purely visual data sources.
The research has certain limitations:
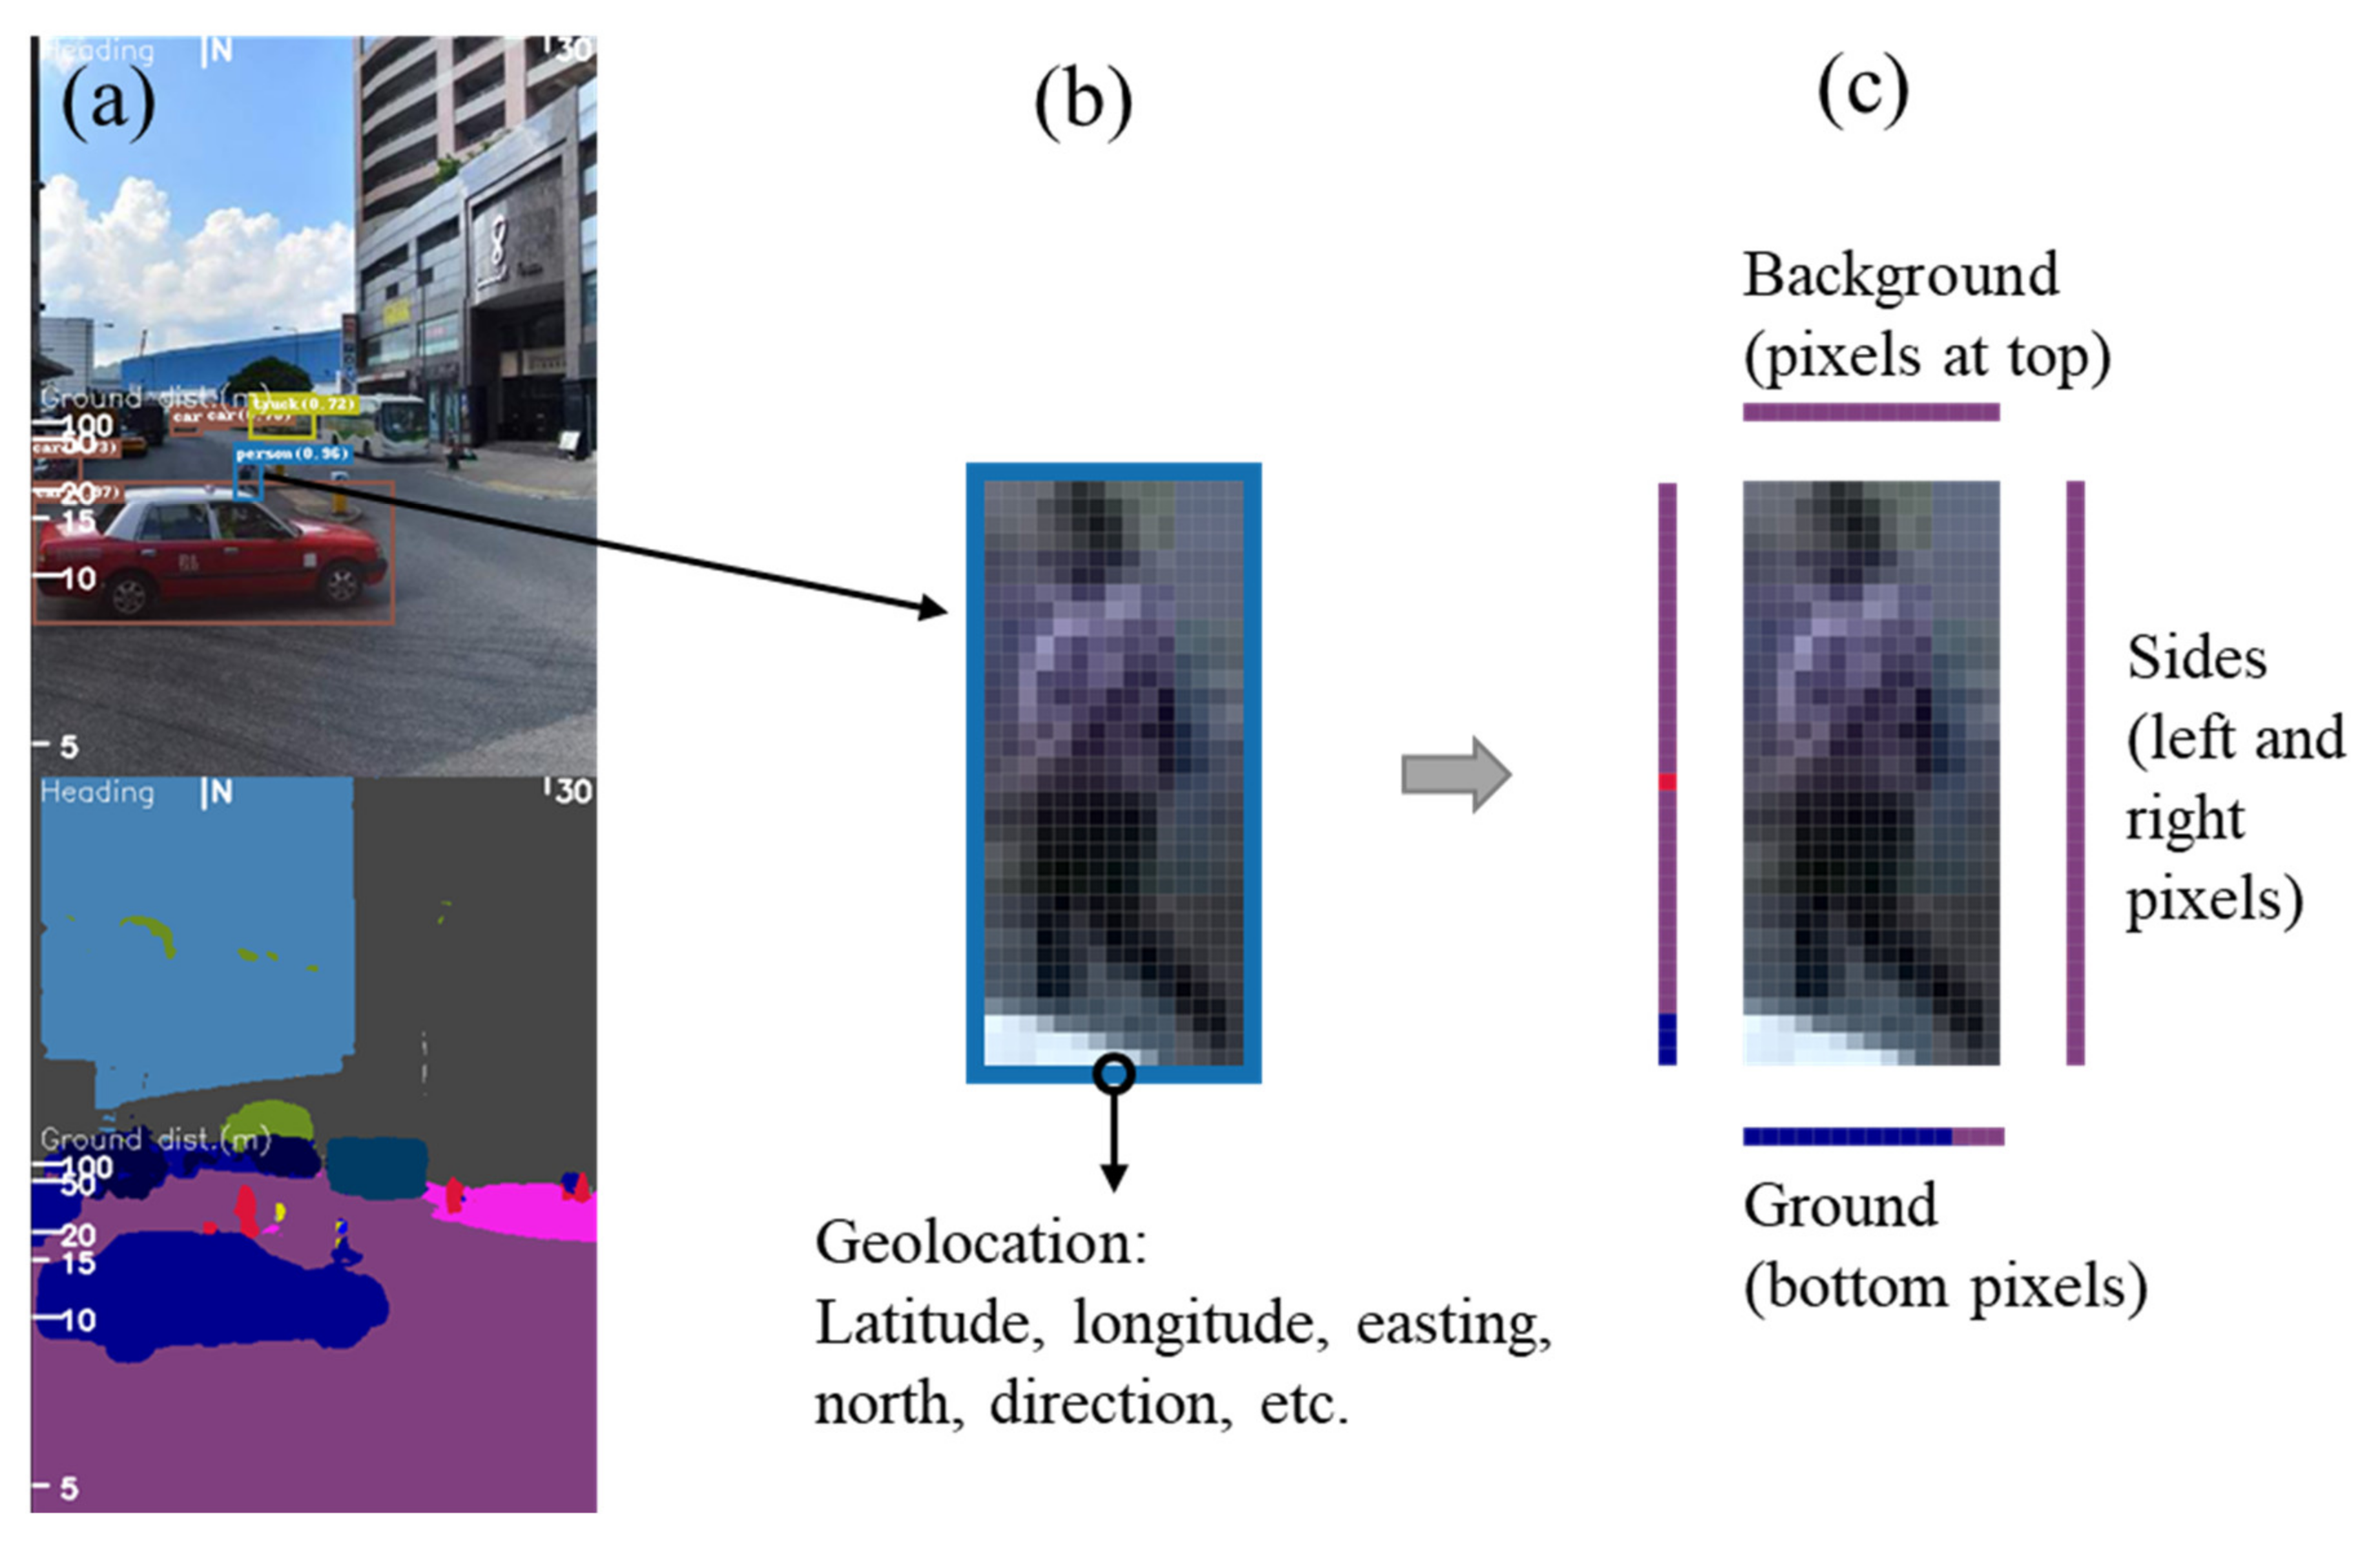
  • First, our query application considers specified semantic features, such as background and sides. However, the derived analytics may suffer from low reliability and detection rate due to blurred and insufficient 2D pixels, e.g., pedestrians in the distance. In addition, searchable semantic features are limited by the predicted classes of the pre-trained deep transfer learning and more dynamic pedestrian analytics within a certain time period will be more accurate in query. Thus, 3D LIDAR data [65,66], photorealistic 3D models [67], high-resolution images, and re-training of the transfer learning models with local data and enriched semantic labels [68] are prioritized among the future research directions.
  • The VUCCA presented in this paper, e.g., clustering and searching, is theoretical. A future direction is to implement value-added application software systems, which utilize processes pedestrians-of-interest in uploaded images. Example results are those with similar behaviors, such as the jogging persons in the morning and higher-risk pedestrians around accident blackspots.
  • Despite spending ten days applying transfer learning to over 500,000 photographs to prepare for analytics of 61,788 pedestrians, more processing time would give better results. It is always beneficial for deep learning models to acquire more abundant training data, which can allow for further training iterations and lead to better classification ability (i.e., precision, recall, and F1 score), particularly when probing the full richness of eye-level urban features.
  • While we have shown that our method has potential for relational queries of urban photographic data, nevertheless, further studies are encouraged to explore latent inconsistency and indeterminacy in different data sets. Our method is clearly limited to cities with coverage of street view imaging services. More variance in street scene might be helpful to find a more robust semantic segmentation approach.

6. Conclusions

Systematically captured street view images have become a new source of urban data. They may be considered big data when processed automatically to sample from the infinite amount of information contained in them. They have the potential to reveal multi-faceted eye-level urban features for cross-sectional and comparative-static pattern analysis. Adding semantics is a crucial step in rendering these patterns understandable for behavioral interpretation and thence for analysis in smart city monitoring, management and planning. The methods for sensing, selecting, cleaning, and filtering the essential conceptual elements for usable urban big data research are still in their infancy and rapidly developing with data science advancements. In this paper, urban big data of TSV and deep learning methods have been adopted as stepping-stones for data extraction from street view imagery and we have explored how to integrate extracted urban conceptual features into meaningful urban analytics such as pedestrian queries and pedestrian behavioral classification. We demonstrate that pedestrian and other relational queries based on unsupervised learning are realistically achievable from street view data bases. A novelty of the work is to test a cost-effective framework for identifying high-order object relations in street view photographs without a priori knowledge of ad hoc external domain information about specific local context.
In a nutshell, the VUCCA for clustering and searching pedestrians in large image datasets with the query being a natural language description is a three-step process: (i) semantic segmentation of uncountable objects with CNN, (ii) semantic segmentation of countable objects with R-CNN, and (iii) semantic feature-based clustering and searching. VUCCA makes full use of big data samples to realize multi-faceted information analysis. In addition, it economizes on feature interpretation and objectification by utilizing detection and relational information derived by automatic clustering. Our test results illustrated that VUCCA provides satisfactory levels of precision in correlational queries. However, we note that tiny or obscure objects in street view pictures are not reliably captured. This suggests that a refinement of the method may be to automatically cut off distant objects. This runs the risk of excluding closer small objects that are confused with distant large objects, but we note that there is structure to this problem that should mean that it is amenable to a data processing solution. For example, a small, fuzzy object could be classified as distant and therefore excluded from the sample, using the geometry of the image, by relational context, of by deep learning from similar objects. On the other hand, approaches could be developed to inferring probability of classification of indistinct distant objects (instead of excluding them), by the same techniques or by pre-simulating the distance-degradation of model objects contained in training sets.
This research therefore makes several contributions, including extracting information by transfer learning from public domain training datasets; utilizing big data samples efficiently; demonstrating an efficient and convenient method of semantically-rich information extraction from urban images; and understanding object attributes in a multi-faceted manner using relational information between detected objects. However, the method also has limitations in terms of handling distance and range within an image, picture qualities, clarity and size of objects, and diverse experimental verification are required in the future.
The VUCCA pedestrian analytics can enhance the effectiveness and efficiency of the process of multi-level clustering of image characteristics to detect objects. VUCCA utilizes semantic vectors to represent and compute multi-faceted urban information for semantically distinct meanings. Classification is a first step in any science and methods such as the one presented here are necessarily the foundation for the advancement of the science of smart cities. Our method creates the possibility of relational query within a smart city’s information infrastructure that is based on intrinsic image structure linked to generic object definitions and also to labeled objects that may as yet not be semantically labeled. There is no reason why such an approach may not eventually support automated retrieval of complex behavioral queries in which some detected elements are not even given specific semantic labels. For example, ‘find examples of aggregated behaviors around accident blackspots’, might retrieve instances of similar body expressions, pedestrians with unusual characteristics, and learn other relational features of ‘aggregated behaviors’ that have not been explicitly labeled in the training process.
We further encourage researchers to extend these insights, including (i) improving the CNN and R-CNN detection of small or unclear sections and incorporating 3D data sets, (ii) strengthening the understanding of semantic vectors under extreme circumstances (e.g., rainy days), (iii) handling comprehensive vector features of street view for fine-grained analytical tasks, (iv) self-learning in adjusting the deep transfer learning models and parameters for variations in contexts (such as different styles of road sign), (v) adding AI-invisible cloak techniques and anti-invisibility algorithms, and (vi) expanding the computational semantic vector-based applications to other smart city research domains and specific query types (e.g., urban planning, landscape design, autonomous vehicles), together with developing models for learning meaningful interpretation from limited training (as in the aggregated behavior example).

Author Contributions

Conceptualization, Fan Xue; data curation, Fan Xue and Lvwen Lin; funding acquisition, Fan Xue and Christopher J. Webster; investigation, Xiao Li; methodology, Fan Xue; project administration, Weisheng Lu and Christopher J. Webster; software: Fan Xue; visualization, Fan Xue; writing—original draft, Fan Xue and Xiao Li; writing—review and editing, Weisheng Lu, Christopher J. Webster and Zhe Chen. All authors have read and agreed to the published version of the manuscript.

Funding

The work presented in this paper was financially supported by The University of Hong Kong (Grant Nos. 102009741, 202011159253).

Institutional Review Board Statement

Not applicable.

Informed Consent Statement

Not applicable.

Data Availability Statement

The data presented in this study are available on request from the corresponding author.

Conflicts of Interest

The authors declare that they have no known competing financial interests or personal relationships that could have appeared to influence the work reported in this paper.

References

  1. Zanella, A.; Bui, N.; Castellani, A.; Vangelista, L.; Zorzi, M. Internet of Things for Smart Cities. IEEE Internet Things J. 2014, 1, 22–32. [Google Scholar] [CrossRef]
  2. Barns, S. Smart cities and urban data platforms: Designing interfaces for smart governance. City Cult. Soc. 2018, 12, 5–12. [Google Scholar] [CrossRef]
  3. Neirotti, P.; Marco, A.D.; Cagliano, A.C.; Mangano, G.; Scorrano, F. Current trends in Smart City initiatives: Some stylised facts. Cities 2014, 38, 25–36. [Google Scholar] [CrossRef] [Green Version]
  4. Xue, F.; Lu, W.; Chen, Z.; Webster, C.J. From LiDAR point cloud towards digital twin city: Clustering city objects based on Gestalt principles. ISPRS J. Photogramm. Remote Sens. 2020, 167, 418–431. [Google Scholar] [CrossRef]
  5. Glaeser, E.L.; Kominers, S.D.; Luca, M.; Naik, N. Big data and big cities: The promises and limitations of improved measures of urban life. Econ. Inq. 2016, 56, 114–137. [Google Scholar] [CrossRef]
  6. McAfee, A.; Brynjolfsson, E. Big data: The management revolution. Harv. Bus. Rev. 2012, 90, 60–68, Retrieved 1 September 2020. Available online: https://hbr.org/2012/10/big-data-the-management-revolution (accessed on 15 August 2021).
  7. Batty, M.; Axhausen, K.W.; Giannotti, F.; Pozdnoukhov, A.; Bazzani, A.; Wachowicz, M.; Portugali, G.O. Smart cities of the future. Eur. Phys. J. Spec. Top. 2014, 1, 481–518. [Google Scholar] [CrossRef] [Green Version]
  8. Dubey, A.; Naik, N.; Parikh, D.; Raskar, R.; Hidalgo, C.A. Deep learning the city: Quantifying urban perception at a global scale. In Computer Vision—ECCV 2016; Springer: Cham, Switzerland, 2016; pp. 196–212. [Google Scholar] [CrossRef] [Green Version]
  9. Zhang, P.; Zhao, Q.; Gao, J.; Lu, W.L. Urban Street Cleanliness Assessment Using Mobile Edge Computing and Deep Learning. IEEE Access 2019, 7, 63550–63563. [Google Scholar] [CrossRef]
  10. Essien, A.; Petrounias, I.; Sampaio, P.; Sampaio, S. Improving Urban Traffic Speed Prediction Using Data Source Fusion and Deep Learning. In Proceedings of the IEEE International Conference on Big Data and Smart Computing, Kyoto, Japan, 27 February–2 March 2019; IEEE: Piscataway, NJ, USA, 2019; pp. 1–8. [Google Scholar] [CrossRef] [Green Version]
  11. Jiang, D.; Zhang, P.; Lv, Z.; Song, H. Energy-efficient multi-constraint routing algorithm with load balancing for smart city applications. IEEE Internet Things J. 2016, 3, 1437–1447. [Google Scholar] [CrossRef]
  12. Chen, C.; Jiao, S.; Zhang, S.; Liu, W.; Wang, L.F. TripImputor: Real-time imputing taxi trip purpose leveraging multi-sourced urban data. IEEE Trans. Intell. Transp. Syst. 2018, 19, 3292–3304. [Google Scholar] [CrossRef]
  13. Xue, F.; Lu, W.; Chen, K. Automatic generation of semantically rich as-built Building Information Models using 2D images: A Derivative-Free Optimization approach. Comput. Aided Civ. Infrastruct. Eng. 2018, 33, 926–942. [Google Scholar] [CrossRef]
  14. Zhou, L.; Pan, S.; Wang, J.; Vasilakos, A.V. Machine learning on big data: Opportunities and challenges. Neurocomputing 2017, 237, 350–361. [Google Scholar] [CrossRef] [Green Version]
  15. Gebru, T.; Krause, J.; Wang, Y.; Chen, D.; Deng, J.; Aiden, E.L.; Li, F.F. Using deep learning and Google Street View to estimate the demographic makeup of neighborhoods across the United States. Proc. Natl. Acad. Sci. USA 2017, 114, 13108–13113. [Google Scholar] [CrossRef] [Green Version]
  16. Gong, F.Y.; Zhang, F.; Li, X.; Ng, E.; Norford, L.K. Mapping sky, tree, and building view factors of street canyons in a high-density urban environment. Build. Environ. 2018, 134, 155–167. [Google Scholar] [CrossRef]
  17. Zhang, F.; Zhou, B.; Liu, L.; Liu, Y.; Fung, H.H.; Lin, H.; Ratti, C. Measuring human perceptions of a large-scale urban region using machine learning. Landsc. Urban Plan. 2018, 180, 148–160. [Google Scholar] [CrossRef]
  18. Wang, R.; Liu, Y.; Lu, Y.; Zhang, J.; Liu, P.; Yao, Y.; Grekousis, G. Perceptions of built environment and health outcomes for older Chinese in Beijing: A big data approach with street view images and deep learning technique. Comput. Environ. Urban Syst. 2019, 78, 101386. [Google Scholar] [CrossRef]
  19. Yang, L.; Ao, Y.; Ke, J.; Lu, Y.; Liang, Y. To walk or not to walk? Examining non-linear effects of streetscape greenery on walking propensity of older adults. J. Transp. Geogr. 2021, 94, 103099. [Google Scholar] [CrossRef]
  20. Lu, Y. The association of urban greenness and walking behavior: Using google street view and deep learning techniques to estimate residents’ exposure to urban greenness. Int. J. Environ. Res. Public Health 2018, 15, 1576. [Google Scholar] [CrossRef] [Green Version]
  21. Helbich, M.; Yao, Y.; Liu, Y.; Zhang, J.; Liu, P.; Wang, R. Using deep learning to examine street view green and blue spaces and their associations with geriatric depression in Beijing, China. Environ. Int. 2019, 126, 107–117. [Google Scholar] [CrossRef]
  22. Chen, J.; Zhou, C.; Li, F. Quantifying the green view indicator for assessing urban greening quality: An analysis based on Internet-crawling street view data. Ecol. Indic. 2020, 113. [Google Scholar] [CrossRef]
  23. Wan, L.; Gao, S.; Wu, C.; Jin, Y.; Mao, M.; Yang, L. Big data and urban system model—Substitutes or complements? A case study of modelling commuting patterns in Beijing. Comput. Environ. Urban Syst. 2018, 68, 64–77. [Google Scholar] [CrossRef]
  24. Pan, Y.; Tian, Y.; Liu, X.; Gu, D.; Hua, G. Urban big data and the development of city intelligence. Engineering 2016, 2, 171–178. [Google Scholar] [CrossRef] [Green Version]
  25. Witten, K.; Kearns, R.; Carroll, P. Urban inclusion as wellbeing: Exploring children’s accounts of confronting diversity on inner city streets. Soc. Sci. Med. 2015, 133, 349–357. [Google Scholar] [CrossRef] [PubMed]
  26. Middel, A.; Lukasczyk, J.; Zakrzewski, S.; Arnold, M.; Maciejewski, R. Urban form and composition of street canyons: A human-centric big data and deep learning approach. Landsc. Urban Plan. 2019, 183, 122–132. [Google Scholar] [CrossRef]
  27. Neilson, A.; Indratmo, D.B.; Tjandra, S. Systematic Review of the Literature on Big Data in the Transportation Domain: Concepts and Applications. Big Data Res. 2019, 17, 35–44. [Google Scholar] [CrossRef]
  28. Richards, D.; Wang, J.W. Fusing street level photographs and satellite remote sensing to map leaf area index. Ecol. Indic. 2020, 115, 106342. [Google Scholar] [CrossRef]
  29. Griew, P.; Hillsdon, M.; Foster, C.; Coombes, E.; Wilkinson, A.J. Developing and testing a street audit tool using Google Street View to measure environmental supportiveness for physical activity. J. Behav. Nutr. Phys. Act. 2013, 10. [Google Scholar] [CrossRef] [Green Version]
  30. Zhai, W.; Peng, Z.R. Damage assessment using Google Street View: Evidence from Hurricane Michael in Mexico Beach, Florida. Appl. Geogr. 2020, 123, 102252. [Google Scholar] [CrossRef]
  31. Nguyen, Q.C.; Khanna, S.; Dwivedi, P.; Huang, D.; Huang, Y.; Tasdizen, T.; Brunisholz, K.D.; Li, F.; Gorman, W.; Nguyen, T.T.; et al. Using Google Street View to examine associations between built environment characteristics and U.S. health outcomes. Prev. Med. Rep. 2019, 14, 100859. [Google Scholar] [CrossRef]
  32. Kang, J.; Körner, M.; Wang, Y.; Taubenböck, H.; Zhu, X.X. Building instance classification using street view images. ISPRS J. Photogramm. Remote Sens. 2018, 145, 44–59. [Google Scholar] [CrossRef]
  33. LeCun, Y.B. Deep learning. Nature 2015, 521, 436–444. [Google Scholar] [CrossRef]
  34. Cireşan, D.C.; Meier, U.; Gambardella, L.M. Deep, big, simple neural nets for handwritten digit recognition. Neural Comput. 2010, 3207–3220. [Google Scholar] [CrossRef] [Green Version]
  35. Pan, S.J.; Yang, Q. A Survey on Transfer Learning. IEEE Trans. Knowl. Data Eng. 2010, 22, 1345–1359. [Google Scholar] [CrossRef]
  36. Wurm, M.; Stark, T.; Zhu, X.X.; Weigand, M.; Taubenböck, H. Semantic segmentation of slums in satellite images using transfer learning on fully convolutional neural networks. ISPRS J. Photogramm. Remote Sens. 2019, 150, 59–69. [Google Scholar] [CrossRef]
  37. Chang, J.; Yu, J.; Han, T.; Chang, H.-j.; Park, E. A method for classifying medical images using transfer learning: A pilot study on histopathology of breast cancer. In Proceedings of the 19th International Conference on e-Health Networking, Applications and Services (Healthcom), Dalian, China, 12–15 October 2017; pp. 1–4. [Google Scholar] [CrossRef]
  38. Cira, C.; Alcarria, R.; Manso-Callejo, M.Á.; Serradilla, F. A deep learning-based solution for large-scale extraction of the secondary road network from high-resolution aerial orthoimagery. Appl. Sci. 2020, 10, 7272. [Google Scholar] [CrossRef]
  39. Kang, Y.; Cho, N.; Yoon, J.; Park, S.; Kim, J. Transfer learning of a deep learning model for exploring tourists’ urban image using geotagged photos. ISPRS Int. J. Geo-Inf. 2021, 10, 137. [Google Scholar] [CrossRef]
  40. Šerić, L.; Pinjušić, T.; Topić, K.; Blažević, T. Lost person search area prediction based on regression and transfer learning models. ISPRS Int. J. Geo-Inf. 2021, 10, 80. [Google Scholar] [CrossRef]
  41. Bowman, S.R.; Angeli, G.; Potts, C.; Manning, C.D. A large annotated corpus for learning natural language inference. arXiv 2015, arXiv:1508.05326v1. Available online: https://arxiv.org/abs/1508.05326 (accessed on 15 August 2021).
  42. Zhong, B.; Xing, X.; Love, P.; Wang, X.; Luo, H. Convolutional neural network: Deep learning-based classification of building quality problems. Adv. Eng. Inform. 2019, 40, 46–57. [Google Scholar] [CrossRef]
  43. Fu, X.; Jia, T.; Zhang, X.; Li, S.; Zhang, Y. Do street-level scene perceptions affect housing prices in Chinese megacities? An analysis using open access datasets and deep learning. PLoS ONE 2019, 5, 14. [Google Scholar] [CrossRef]
  44. Chen, L.; Lu, Y.; Sheng, Q.; Ye, Y.; Wang, R.; Liu, Y. Estimating pedestrian volume using Street View images: A large-scale validation test. Comput. Environ. Urban Syst. 2020, 81. [Google Scholar] [CrossRef]
  45. Zhang, F.; Wu, L.; Zhu, D.; Liu, Y. Social sensing from street-level imagery: A case study in learning spatio-temporal urban mobility patterns. ISPRS J. Photogramm. Remote Sens. 2019, 153, 48–58. [Google Scholar] [CrossRef]
  46. Srivastava, S.; Vargas-Muñoz, J.E.; Tuia, D. Understanding urban landuse from the above and ground perspectives: A deep learning, multimodal solution. Remote Sens. Environ. 2019, 228, 129–143. [Google Scholar] [CrossRef] [Green Version]
  47. Salvador, A.; Bellver, M.; Campos, V.; Baradad, M.; Marques, F.; Torres, J.; Giro-i-Nieto, X. Recurrent Neural Networks for Semantic Instance Segmentation. arXiv 2017, arXiv:1712.00617. [Google Scholar]
  48. Liu, X.; Zhao, H.; Tian, M.; Sheng, L.; Shao, J.; Yi, S.; Yan, J.; Wang, X. HydraPlus-Net: Attentive Deep Features for Pedestrian Analysis. In Proceedings of the IEEE International Conference on Computer Vision (ICCV), Venice, Italy, 22–29 October 2017; IEEE: Piscataway, NJ, USA, 2017. [Google Scholar] [CrossRef] [Green Version]
  49. Li, S.; Xiao, T.; Li, H.; Zhou, B.; Yue, D.; Wang, X. Person Search with Natural Language Description. In Proceedings of the IEEE Conference on Computer Vision and Pattern Recognition (CVPR), Honolulu, HI, USA, 21–26 July 2017; IEEE: Piscataway, NJ, USA, 2017; pp. 1970–1979. [Google Scholar] [CrossRef] [Green Version]
  50. Branson, S.; Wegner, J.D.; Hall, D.; Lang, N.; Schindler, K.; Perona, P. From Google Maps to a fine-grained catalog of street trees. ISPRS J. Photogramm. Remote Sens. 2018, 135, 13–30. [Google Scholar] [CrossRef] [Green Version]
  51. Lin, Y.; Zheng, L.; Zheng, Z.; Wu, Y.; Hu, Z.; Yan, C.; Yang, Y. Improving person re-identification by attribute and identity learning. Pattern Recognit. 2019, 95, 151–161. [Google Scholar] [CrossRef] [Green Version]
  52. Chen, Y.-H.; Chen, W.-Y.; Chen, Y.-T.; Tsai, B.-C.; Wang, Y.-C.F.; Sun, M. No more discrimination: Cross city adaptation of road scene segmenters. In Proceedings of the IEEE International Conference on Computer Vision (ICCV), Venice, Italy, 22–29 October 2017; IEEE: Piscataway, NJ, USA, 2017; pp. 1992–2001. [Google Scholar] [CrossRef] [Green Version]
  53. Cordts, M.; Omran, M.; Ramos, S.; Rehfeld, T.; Enzweiler, M.; Benenson, R.; Franke, U.; Roth, S.; Schiele, B. The cityscapes dataset for semantic urban scene understanding. In Proceedings of the IEEE Conference on Computer Vision and Pattern Recognition (CVPR), Las Vegas, NV, USA, 26 June–1 July 2016; IEEE: Piscataway, NJ, USA, 2016; pp. 3213–3223. [Google Scholar] [CrossRef] [Green Version]
  54. Redmon, J.; Farhadi, A. Yolov3: An incremental improvement. arXiv 2018, arXiv:1804.02767v1. [Google Scholar]
  55. Lin, T.-Y.; Maire, M.; Belongie, S.; Hays, J.; Perona, P.; Ramanan, D.; Dollár, P.; Zitnick, C.L. Microsoft COCO: Common Objects in Context. In European Conference on Computer Vision; Springer: Berlin, Germany, 2014; pp. 740–755. [Google Scholar] [CrossRef]
  56. Wang, R.; Lu, Y.; Zhang, J.; Liu, P.; Yao, Y.; Liu, Y. The relationship between visual enclosure for neighbourhood street walkability and elders’ mental health in China: Using street view images. J. Transp. Health 2019, 13, 90–102. [Google Scholar] [CrossRef]
  57. Bennett, J. OpenStreetMap; Packt Publishing Ltd: Birmingham, UK, 2010. [Google Scholar]
  58. Raifer, M. Overpass API. 2018. Available online: http://overpass-turbo.eu/ (accessed on 15 August 2021).
  59. Hoyer, L.; Kesper, P.; Khoreva, A.; Fischer, V. Short-Term Prediction and Multi-Camera Fusion on Semantic Grids. In Proceedings of the IEEE/CVF International Conference on Computer Vision, Seoul, Korea, 27–28 October 2019; IEEE: Piscataway, NJ, USA, 2019; pp. 813–821. [Google Scholar] [CrossRef] [Green Version]
  60. Zhang, C.; Lin, G.; Liu, F.; Yao, R.; Shen, C. CANet: Class-Agnostic Segmentation Networks with Iterative Refinement and Attentive Few-Shot Learning. In Proceedings of the IEEE/CVF Conference on Computer Vision and Pattern Recognition, Long Beach, CA, USA, 15–20 June 2019; IEEE: Piscataway, NJ, USA, 2019; pp. 5217–5226. [Google Scholar] [CrossRef] [Green Version]
  61. Zhao, R.; Zhan, L.; Yao, M.; Yang, L. A geographically weighted regression model augmented by Geodetector analysis and principal component analysis for the spatial distribution of PM2.5. Sustain. Cities Soc. 2020, 56, 102106. [Google Scholar] [CrossRef]
  62. Li, X.; Liu, X.; Li, C.Z.; Hu, Z.; Shen, G.Q.; Huang, Z. Foundation pit displacement monitoring and prediction using least squares support vector machines based on multi-point measurement. Struct. Health Monit. 2019, 18, 715–724. [Google Scholar] [CrossRef]
  63. Wold, S.; Esbensen, K.; Geladi, P. Principal component analysis. Chemom. Intell. Lab. Syst. 1987, 2, 37–52. [Google Scholar] [CrossRef]
  64. Hartigan, J.A.; Wong, M.A. Algorithm AS 136: A K-Means Clustering Algorithm. J. R. Stat. Soc. Ser. C 1979, 28, 100–108. [Google Scholar] [CrossRef]
  65. Babahajiani, P.; Fan, L.; Kämäräinen, J.K.; Gabbouj, M. Urban 3D segmentation and modelling from street view images and LiDAR point clouds. Mach. Vis. Appl. 2017, 28, 679–694. [Google Scholar] [CrossRef]
  66. Xue, F.; Lu, W.; Webster, C.J.; Chen, K. A derivative-free optimization-based approach for detecting architectural symmetries from 3D point clouds. ISPRS J. Photogramm. Remote Sens. 2019, 148, 32–40. [Google Scholar] [CrossRef]
  67. Wu, Y.; Shang, J.; Xue, F. RegARD: Symmetry-based coarse registration of smartphone’s colorful point clouds with CAD drawings for low-cost Digital Twin Buildings. Remote Sens. 2021, 13, 1882. [Google Scholar] [CrossRef]
  68. Xue, F.; Wu, L.; Lu, W. Semantic enrichment of building and city information models: A ten-year review. Adv. Eng. Inform. 2021, 47, 101245. [Google Scholar] [CrossRef]
Figure 1. Illustrations of semantic segmentation by transferring two trained popular CNN models, where color indicates the class labels as defined in Cordts et al. [53] 2006.
Ijgi 10 00561 g001
Figure 2. Illustrations of object detection by transferring two trained R-CNN models, where the boxes indicate urban objects defined in COCO [55].
Ijgi 10 00561 g002
Figure 3. Data collection process: (1) generate street network from OpenStreetMap; (2) extract coordinates of TSV panorama photos; (3) segment panorama photos into TSV perspective photos.
Ijgi 10 00561 g003
Figure 4. Three steps of the VUCCA approach for pedestrians in street views.
Ijgi 10 00561 g004
Figure 5. Methods of semantic feature extraction based on transfer deep learning in Step 1.
Ijgi 10 00561 g005
Figure 6. Extracting pedestrians, geolocations, and the surrounding semantic features, (a) results of transfer CNN and R-CNN, (b) a pedestrian’s geolocation extracted by the bounding box, (c) the pixels of ground, background, and sides.
Ijgi 10 00561 g006
Figure 7. Results of semantic segmentation and object recognition. (a) Example of semantic segmentation, color indicates class; (b) example of object recognition, color of a bounding box indicates class.
Ijgi 10 00561 g007
Figure 8. Geospatial distribution of 61,788 pedestrians detected in 530,000 TSV photographs.
Ijgi 10 00561 g008
Figure 9. PCA results of the ground feature using eigen-decomposition. (a) Cumulative variance results of PCA; (b) the 3D data view in the top three PCs, where color indicates the most frequent feature and transparency shows the 3D depth.
Ijgi 10 00561 g009
Figure 10. Results of k-means clustering of the pedestrians by the ground features. (a) Iterative tests of k-means clusters, where the elbow point was found at k = 4; (b) four clusters detected and associated with meanings; (c) the hierarchical closeness between the clusters.
Ijgi 10 00561 g010aIjgi 10 00561 g010b
Figure 11. Examples of the pedestrian query of a given instance or a pre-defined action.
Ijgi 10 00561 g011
Figure 12. Visualization of the GeoJSON file consisting of enriched OpenStreetMap nodes, where the warmer colors indicate higher densities of pedestrians on the streets.
Ijgi 10 00561 g012
Table 1. Mapping semantic features from the results of transfer CNN.
IdCategory of FeaturesPixel Labels in the Results of CNN
F1GreeneryVegetation
F2RoadwayRoad
F3SidewalkSidewalk and guardrail
F4ConstructionBuilding and wall
F5Sky and terrainSky and terrain
F6Vehicle (hardtop)Car, bus, truck, and train
F7Vehicle (bike)Motorcycle and bicycle
F8Street furniturePole, traffic light, and traffic sign
F9PedestrianPerson and rider
F10OthersOthers (pets, aircrafts, etc.)
Table 2. Average validation results of the transductive deep transfer learning of Hong Kong TSV photographs.
CategoryObjectPrecisionRecallF1Satisfactory?
UncountableVegetation0.870.990.93Yes
(As pixels)Construction0.970.940.95Yes
Roadway0.950.980.97Yes
CountableVehicle0.950.770.85Yes
Person0.840.870.85Yes
Stop sign0.890.220.35No
Table 3. Excerpt of the feature table of the grounds where the 61,788 pedestrians stood.
IdF1F2F3F4F5F6F7F8F9F10
10010000000
20.0091700.009170.3761500.57798000.027520
3000.6129000000.161290.225810
61,78800.263160000000.736840
Publisher’s Note: MDPI stays neutral with regard to jurisdictional claims in published maps and institutional affiliations.

