Article

Exploring the Spatial–Temporal Analysis of Coastline Changes Using Place Name Information on Hainan Island, China

1
School of Earth Sciences, Yunnan University, Kunming 650500, China
2
Engineering Research Center of Domestic High-Resolution Satellite Remote Sensing Geology for Universities of Yunnan Province, Kunming 650500, China
3
Institute of International Rivers and Eco-Security, Yunnan University, Kunming 650500, China
*
Author to whom correspondence should be addressed.
ISPRS Int. J. Geo-Inf. 2021, 10(9), 609; https://0-doi-org.brum.beds.ac.uk/10.3390/ijgi10090609
Submission received: 5 August 2021 / Revised: 7 September 2021 / Accepted: 13 September 2021 / Published: 15 September 2021

Abstract

:
A coastline is the boundary zone between land and sea, an active zone of human social production activities and an area where the ecology is fragile and easy to change. The traditional method to analyze temporal and spatial changes in the coastline is to extract the coastline through remote sensing, LiDAR, and field sampling and analyze the temporal and spatial changes with statistical data. The coastline extracted by these methods has high spatial and temporal resolution, but it requires remote sensing images and data obtained by other sensors, so it is impossible to extract coastlines from before the emergence of remote sensing technology. This paper improves the coastline generation algorithm. Firstly, a triangulated irregular network is used to generate the preliminary rough coastline, and then, each line segment is optimized with Python language according to the influence range of the place names to further approach the real coastline. The accuracy of the coastline extracted by this method can reach 80% within 500 m, which is of great significance in the mapping and analysis of small- and medium-scale coastlines. This paper analyzes the changes in the coastline of Hainan Island before the founding of China (pre-founding) and in modern times and analyzes the impact of coastal development on coastline change. Through the analysis, it is found that, from before the founding of the People’s Republic of China to the present, the natural coastline of Hainan Island has become shorter, the artificial coastline has become longer, and the coastline generally presents a trend of advancing toward the ocean. This method realizes coastline construction under the condition of missing remote sensing images and puts forward a new way to study historical coastline changes.

Graphical Abstract

1. Introduction

The coastal zone is a unique natural resource in coastal areas that plays an important role in improving the quality of life in coastal areas and enriching the landscape scenery [1]. However, its ecological environment is fragile and vulnerable to destruction [2,3,4]. People need to protect the coastal ecology rather than develop it further [5], which has gradually become a key issue [6]. As one of the important elements of the coastal zone [7], the coastline can be compared across different periods to assess the changes in the coastal zone. Since the founding of the People’s Republic of China, China has made great efforts to develop its economy, especially after the establishment of the Hainan Special Economic Zone in 1988. Shown in 
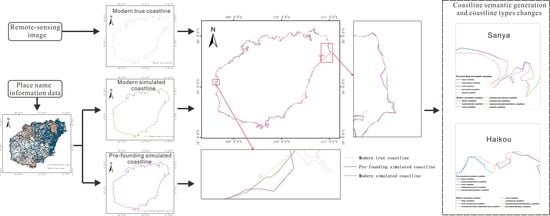
Figure 1, Hainan Island is the main island of Hainan Province, China. Its elevation is high in the middle and low in the periphery [8]. It is located in the tropics at 108°37′–111°05′ E longitude and 18°10′∓20°10′ N latitude, in the southernmost part of China. Hainan has a unique island advantage: on the side is the Pearl River Delta, and there is economic support, and on the outside is South East Asia, which is convenient for developing an outward-oriented economy. There are many types of coast, generally defined according to the composition of the material classification; the current broad definition of a natural coast includes the artificially built natural function of the coast, but the traditional definition of a natural coast is relative to the artificial coast. In the early stage of Hainan’s economic development, there was no awareness regarding coastal zone protection, and a large number of economic behaviors, such as land reclamation and artificial island construction, were carried out, which caused great damage to the coastal zone ecology of Hainan, thus reducing the natural coast and increasing the artificial coast. In this paper, the whole coastline of Hainan is reconstructed, and the two major cities shown in Figure 1 are taken as examples for detailed analysis.
Place names are the proper names given by people to natural or human geographical entities in a specific region according to some reasons or standards [9]. They are the product of the development of human society to a certain extent, a “living fossil” of history, and a true record of the cultural origin, geographical evolution, and administrative change of various nationalities [10]. Most research on place names in history and other disciplines is based on temporal and semantic information, while geography pays more attention to their spatial attributes. Place names can be used to reconstruct certain historical information; for example, Zhong et al. [11] used place name information to reconstruct the historical river network of Hubei Province, and Chen et al. [12] used place name information to analyze the landscape structure of Hubei Province.
There are many studies on coastline extraction that have used various methods, such as (1) extracting the water boundary line at the time of imaging from a remote sensing image and then generating the coastline. For example, Joo-Hyung et al. [13] and Ghosh et al. [14] used the Thematic Mapper (TM) and the Enhanced Thematic Mapper (ETM) to extract water boundary lines according to differences in the reflectivity of ground objects. Zhang et al. [15] used color Canny and morphological chromatic aberration to extract water boundaries from color remote sensing images. Another method is to (2) extract coastlines from LiDAR data, as performed by Stockdonf et al. [16] and also Yu et al. [17], who carried out coastline extraction based on LiDAR point cloud data rasterization. A third method is to (3) conduct a field investigation to obtain the coastline, as in the work of Zhang et al. [18], who used the combination of field investigation data and remote sensing images to extract the coastline. It is also possible to (4) carry out vector registration on a historical topographic map and extract the coastline; for example, Fang [19] used a historical topographic map to extract the historical coastline when studying the changes in the historical coastline of Liaoning, China. The first step in studying the temporal and spatial variations in a coastline is to obtain the trend of the coastline.
It is of great significance to study the changes in coastlines to protect the ecological environment of coastal zones. Xiang et al. [20] established a new model that can be used to evaluate the sustainable utilization of coastlines so as to obtain the output efficiency of artificial coastlines and the interference degree of human activities on natural coastlines. Moussa et al. [21] studied and analyzed the ecological conditions of the coastline of Moorea Island in a long-term study and determined that the factors affecting the changes in the coastline of the island were mainly caused by human beings, and it was necessary to establish a coastline observation station for continuous observation in order to maintain the coastline of the South Pacific island. Liu et al. [22] analyzed the problems with coastline utilization in China since the 1990s and put forward opinions and suggestions for coastline protection and utilization. Thoai et al. [23] analyzed the changes in the Ca Mau Cape coastline through data analysis and questionnaire surveys and concluded that the most important factor affecting the coastline changes was the reduction in forest area, which could be used to formulate sustainable coastal management strategies for the study area.
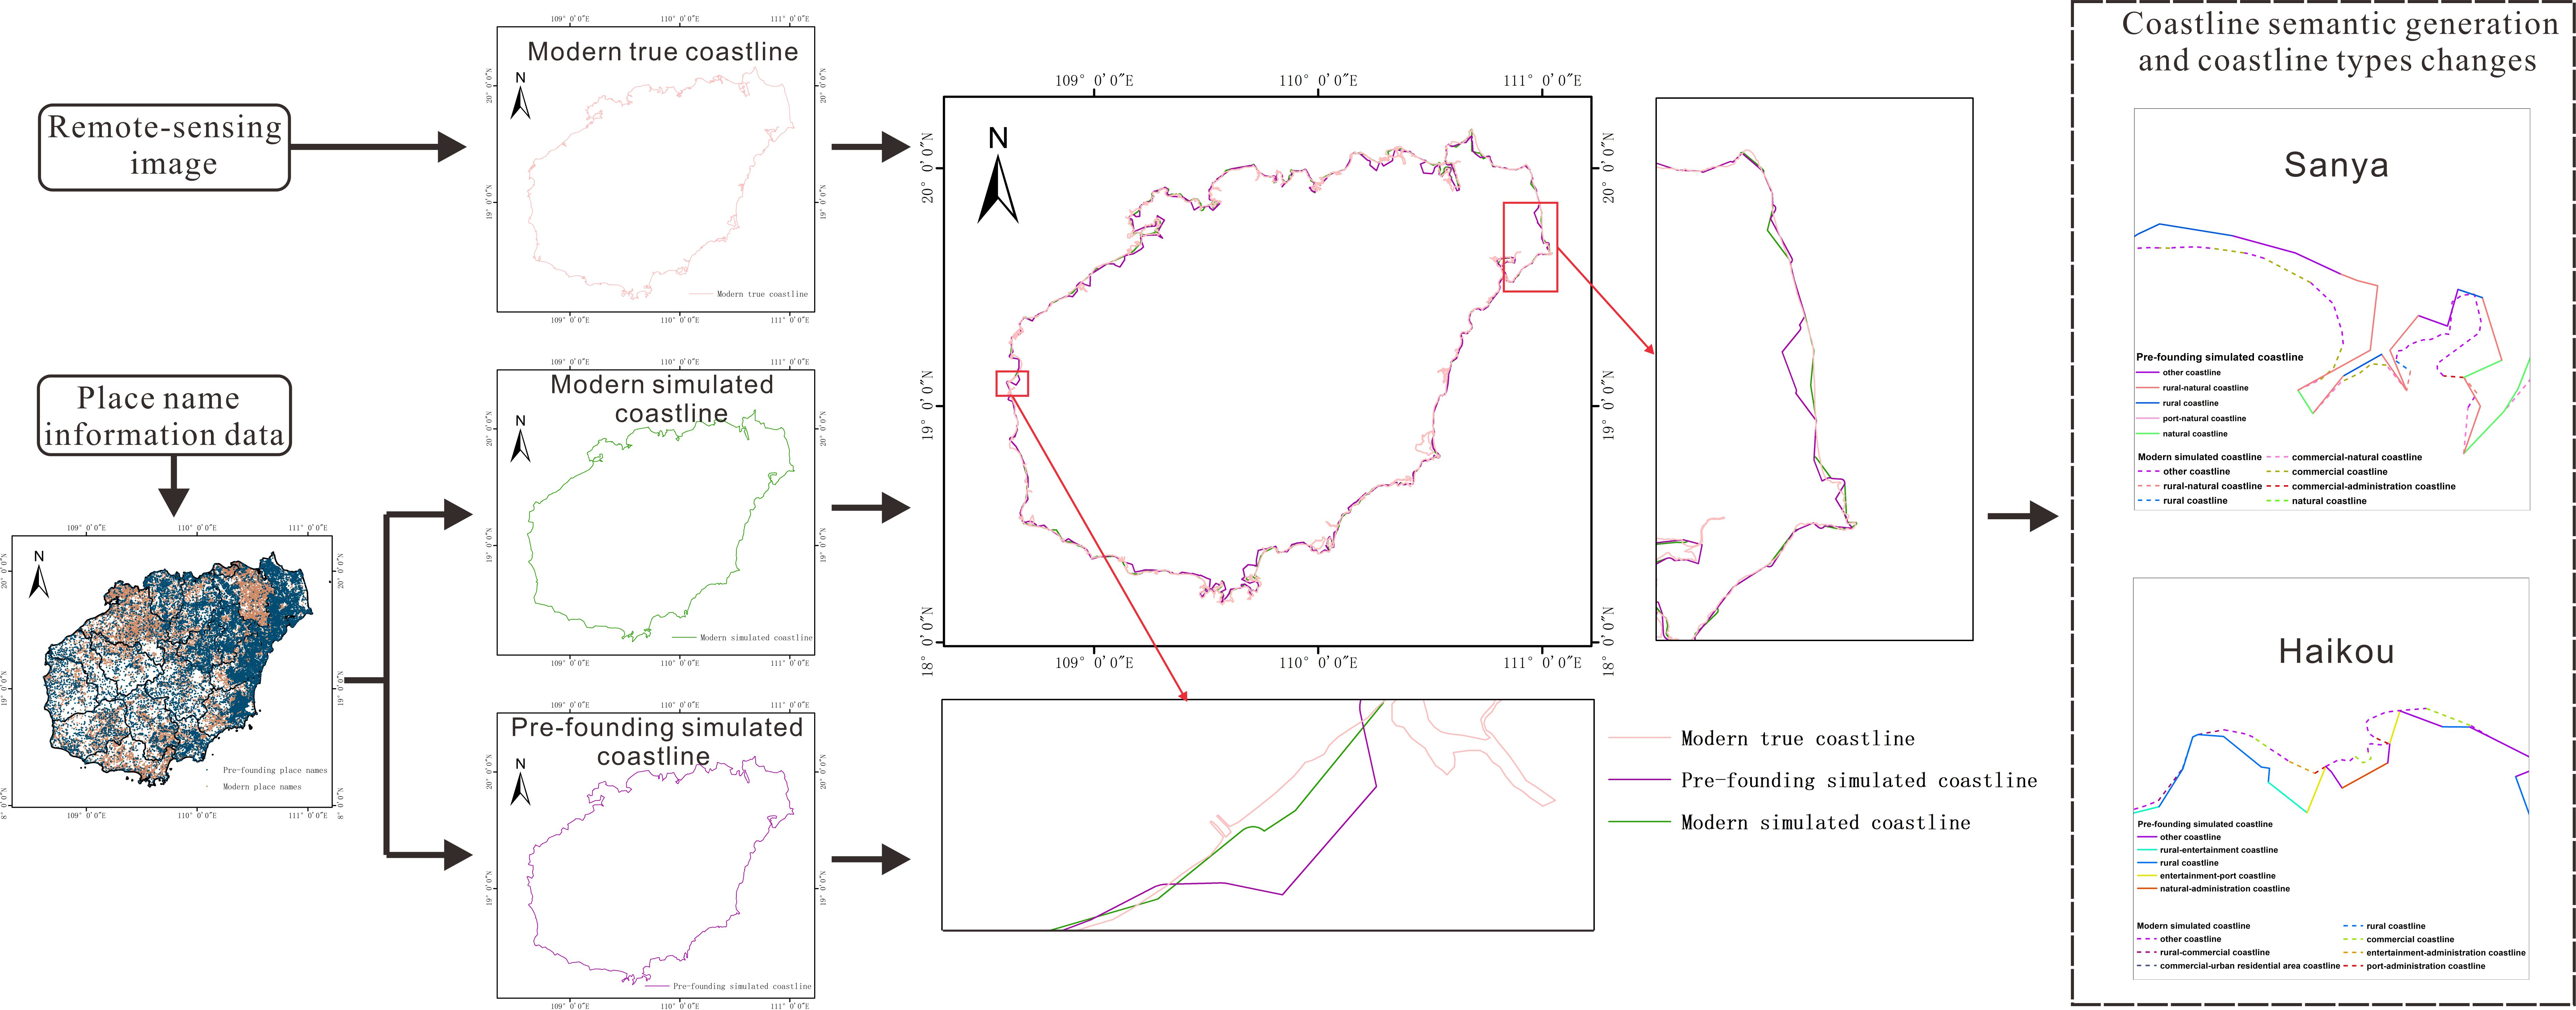
At present, most coastline research data focus on field investigations, remote sensing images, and LiDAR data acquisition [24]. Although the spatiotemporal resolution is high, it cannot meet the needs of historical coastline construction research because it is difficult to obtain coastline data from before the advent of remote sensing technology. In the study of historical coastlines, coastline extraction is mostly carried out from historical topographic maps, and the accuracy of extraction is directly related to the accuracy of the historical topographic maps, but there is the problem that some areas lack historical topographic maps. In this paper, taking the pre-founding place names of Hainan Island as the data source and using a triangulated irregular network (TIN) and section-by-section analysis method, we simulated the general trend of the coastline, established the pre-founding coastline, compared it with the modern coastline, and analyzed the main differences. In this study, the coastline refers to a coastline in the broad sense, which is the range of human activities on land and the boundary of the ocean. This method is an innovative coastline generation method. It uses POI data and its influence range to generate the coastline and can obtain the approximate distribution of the coastline at a certain time by using the information of place names in history. Using this method, coastlines can be reconstructed from historical periods when remote sensing images are not available. This provides an important reference for coastal ecological restoration and protection in Hainan Province and is of great significance for protecting its coastal ecological environment.

2. Study Data and Methods

2.1. Study Data

2.1.1. Hainan Place Name Information Data

These data were derived from the second general survey of place names conducted by the Ministry of Civil Affairs of China between 2014 and 2018. Each place name contains such attributes as longitude, latitude, place type, place origin, place meaning, and place history. Taking the data listed in Table 1 as an example, the information of longitude and latitude represents the geometric central coordinates of the place; place origin, place meaning, and place history represent the semantic information of the place name and refer to the origin of the place name, the meaning of the place name, and the related history of the place name, respectively, from its emergence to the present day; and place type represents the category of the place. Place name information data are data providing spatial information, and the text dataset shown in Table 1 can be converted into point data with the semantic information of place names according to longitude and latitude. In this study, the coastline reconstruction and the spatial–temporal analysis are carried out using the data of place names.

2.1.2. Coastline Data of Hainan Island

The modern coastline data used here adopt the coastline distribution information obtained by Bi et al. [25] in the Hainan Island Coastline Data Set. They took the Landsat TM/OLI images of 30 m resolution obtained by the US Geological Survey in Hainan Island in 1987, 1990, 1995, 2000, 2005, 2010, 2015, and 2017 as the data source, combined with field survey data through visual interpretation; information on the distribution and type of coastline was obtained using the digital vectorization method; and the coastline accuracy was high. In this study, this dataset provided the standard data to test the accuracy of this research method.

2.2. Methodology

As shown in Figure 2, the place names of Hainan Island were divided into modern place names and pre-founding place names according to certain rules. Next, the modern place names were used to simulate the coastline structure through TIN and section-by-section analysis and verify the accuracy. Then, the parameters that met the accuracy conditions were used to simulate the pre-founding coastline. The modern simulated coastline and the pre-founding simulated coastline were superimposed and analyzed. Finally, the place types and the generation time of the place names in the changed areas were counted, and the reasons for the changes were analyzed.

2.2.1. Place Name Data Clustering

The place name data were divided into two groups, namely place names before the founding of China (pre-founding place names) and modern place names. There are more than eighty place names in Hainan Island because the place name information is derived from the place name census data in recent years, and all the existing place names can be defined as modern place names in Hainan Island. Next, there are some obvious place types that did not exist until after the founding of the People’s Republic of China, such as park, port, and hotel, so the place names included in these place types were preliminarily eliminated from modern place names and initially recognized as pre-founding place names. In the remaining modern place names, a semantic analysis was performed on the text information, such as place name history, place name origin, and place name meaning, one by one, and a regular expression matching method was used to extract the time to determine the time when the place names appeared; the place names before 1949 (when China was founded) were selected as the pre-founding place names. The method considers both the type and the semantic information of the place name and determines the time when place names were generated based on the semantic information. This method can greatly improve the accuracy of classifying place name information according to time.

2.2.2. Coastline Retrieval

A TIN is a mesh plane control graph constructed by a series of triangles [26,27], as shown in Figure 3. In this research, Delaunay triangulation was used to construct the TIN, and the gradual interpolation algorithm was adopted [28]. The main algorithm flow is shown in Figure 3 as an example. In the first step, there are 5 points in the point group, and a super triangle containing all data points is defined. There are only super triangles in the initial triangle set. In step 2, point P in the data points is inserted into the triangulation network, and the triangle T where the point is located is found. Taking the first inserted point as an example, as shown in Figure 3b, point 1 is inserted; then, point 1 is point P, and the super triangle is triangle T. The third step is to connect the three vertices of P and T to form three triangles. The fourth step is to update the generated triangle by using the local optimization rule—Lawson’s LOP (local optimization procedure). The fifth step is to repeat the second step to the fourth step until all the points are inserted, and step six is to delete the triangle containing the vertex of the super triangle.
Lawson’s LOP rule means that after inserting a point, the constructed triangulation must meet the maximum and minimum angle criterion of Delaunay triangulation. As shown in Figure 4, when the triangulation is reconstructed at the insertion point, if the triangulation does not meet the maximum–minimum angle criterion, the triangle must be corrected by exchanging diagonals (that is, local optimization).
Maximum–minimum angle criterion means that in a convex quadrilateral composed of two adjacent triangles, after exchanging diagonals, the minimum angles of six internal angles should be maximized [29], as shown in Figure 5.
The whole figure formed by the above method is convex hull, which does not conform to the actual coastline contour. In order to make the results closer to the actual coastline shape, this paper makes improvements on this basis. Firstly, according to the midpoint of two adjacent Voronoi polygons, the maximum distance between two geographical points is determined. Secondly, the TIN generated by the above method is judged, one triangle at a time. If the length of any side of the triangle exceeds the set value, it will be deleted, and the final result will be the remaining triangulation.
Its construction idea is to ensure that the nearest neighboring points form triangles and strive to make each triangle as close as possible to an equilateral triangle [30]. The graph structure constructed by the TIN is a set of adjacent and non-overlapping triangles. Compared with ordinary convex hulls, the edge is more refined. In this study, the TIN was constructed based on the data of place names, and the coastline was preliminarily simulated with the peripheral boundary. Figure 6 shows the TIN result of preliminary construction.
There is a certain gap between the place names and the coastline, so each broken line should be processed again separately according to the attributes of line segments so as to move closer to the real coastline. Each region has its average area of influence, and the boundary of the area of influence is closer to the real coastline. The location of the place name points is the center of mass of the region. According to the average influence area of each name type, the influence area can be retrieved. By using this method, the coastline constructed by TIN can be retrieved and analyzed, which can make it closer to the real coastline.
In this study, the place name point types of two endpoints of each line segment were obtained, and buffers were generated according to the average influence range of the toponymic point types to invert the actual influence area. The buffer distance of each line segment was obtained by Formula (1), and the coastline was simulated by the peripheral buffer boundary. The types of geographical names with a large number and regular distribution, such as rural residential areas and urban residential areas, could generate Thiessen polygons, and the influence range could be obtained according to the average area of each Thiessen polygon. For the types of geographical names with less and irregular distribution, such as parks and mountains, the average influence range could be obtained through data access and visual interpretation. For example, as shown in Figure 7, one side is taken from the coastline contour constructed by the TIN, and its two vertices are the place names used to construct the TIN—one is point 1 and the other is point 2. Point 1 represents rural settlements and point 2 represents enterprise. After calculation, the average influence radius of rural settlements was 737 m (B1), and the average influence radius of rural settlements was 113 m (B2). Therefore, according to Formula (1), the radius of the buffer zone on this side is 425 m. Every other edge generated by TIN uses this algorithm to calculate its corresponding buffer.
B = ( B 1 + B 2 ) / 2
where B is the buffer distance of each line segment, B1 is the buffer distance of point 1, and B2 is the buffer distance of point 2.

2.2.3. Accuracy Verification

In order to verify whether the accuracy of the coastline generated by the algorithm can meet the requirements, a similarity analysis is needed with the real coastline. The real coastline used in this paper is the coastline of Hainan Island in 2017 extracted from the coastline dataset of Hainan Island from 1987 to 2017 [25]. The coastline was obtained by remote sensing interpretation using 30-m-resolution Landsat TM/OLI images.
The principle of hash image similarity analysis [31,32,33] is to scale two images into small size images, keep the whole structure, and remove the details [34]; convert the image into a gray image; calculate the average pixel value of the whole image; and judge each pixel one by one. If it is greater than the average value, it is 1; otherwise, it is 0. Then, the results of two images are compared one by one, and the similarity can be judged. In this paper, the similarity of line elements is judged and improved based on the idea of preserving the whole structure and removing the detail information in the similarity analysis of hash images. The existing real coastline was divided according to the breaking point, a buffer was generated for each line segment, and the buffer was used as the pixel unit to calculate whether the simulated coastline was contained in each buffer; inclusion was represented as 1, while non-inclusion was 0. The similarity was compared as shown in Formula (2).
S i = S a / S u m
where Si is the coastline similarity, Sa is the number of similar units, and Sum is the number of statistical units.

2.2.4. Coastline Semantic Generation

In traditional research, coastlines are divided into artificial coastlines, bedrock coastlines, sandy coastlines, and silt coastlines [35] by combining image data and measured data. In this study, the coastline was automatically classified according to the types of place names. The place name types were classified as shown in Table 2, and the coastline type was determined according to the place name types of the two endpoints of the simulated coastline. For example, if both endpoints are rural type, the coastline is a rural coastline, and if one endpoint is rural type and one endpoint is economic zone type, then the coastline is a rural–economic zone coastline, etc. In the simulated coastline generated by the method described in Section 2.2.2, both ends of each line segment were assigned the place name type used in the construction. A Python program was designed to analyze the generated simulated coastline one by one, and according to the coastline semantic generation principle described in this section, the coastline semantics corresponding to each line constituting the simulated coastline were generated.

2.2.5. Coastline Spatial–Temporal Analysis

An overlay analysis was carried out on the pre-founding simulated coastline and the modern simulated coastline to obtain the coastline change area. Combined with factors such as the change in coastline type and the type of place names, the causes of the change were analyzed.

3. Results

3.1. Place Names Generate Shoreline Availability

In Figure 8, the green curve is the modern simulated coastline, and the red curve is the true coastline. The shape and trend of the modern simulated coastline are basically consistent with the trend of the real coastline. In the figure, the results of Qiongshan City, Dongfang City, and Wanning City are displayed on the top, bottom left, and bottom right, respectively. As shown in Table 3, after quantitative similarity calculation, the similarity could reach 80% within 500 m accuracy, 89.3% within 1000 m accuracy, and 91.7% within 1500 m accuracy, which proves that the proposed method is basically feasible and can be used to simulate the coastline trend.

3.2. Coastline Change Result

3.2.1. Cities’ Change Area

The pre-founding simulated coastline and the modern simulated coastline were superimposed and analyzed. In Figure 9, the lower right corner shows the southern coastline of Sanya City, and the upper right corner shows the northern coastline of Haikou City. It can clearly be seen that the coastline is extending outward in these two areas. Table 4 shows the changes in coastlines of various cities of Hainan Province, according to which Sanya City had the largest coastline change area of about 123.85 km2. Danzhou City and Haikou City also had a large change area, and other cities had different change areas, with Qionghai City having the smallest change area of 1.20 km2.

3.2.2. Coastline Type Change

The coastline types before the founding of the People’s Republic of China and the modern coastline types were each counted by the length of the urban area. Taking Sanya City and Haikou City as examples, Table 5 and Table 6 show the changes in their coastline types, respectively. It can be seen from Table 5 that before the founding of the People’s Republic of China, the main coastlines in Sanya were rural–natural coastlines and natural coastlines, whereas now, Sanya’s coastlines are relatively average with no dominant coastlines, and the top three coastline types are commercial–natural coastline, rural coastline, and commercial coastline. Table 6 shows that the predominant coastline type in Haikou before the founding of the People’s Republic of China was rural coastline, whereas now, the rural–commercial coastline type accounts for a larger proportion than other coastline types.

4. Discussion

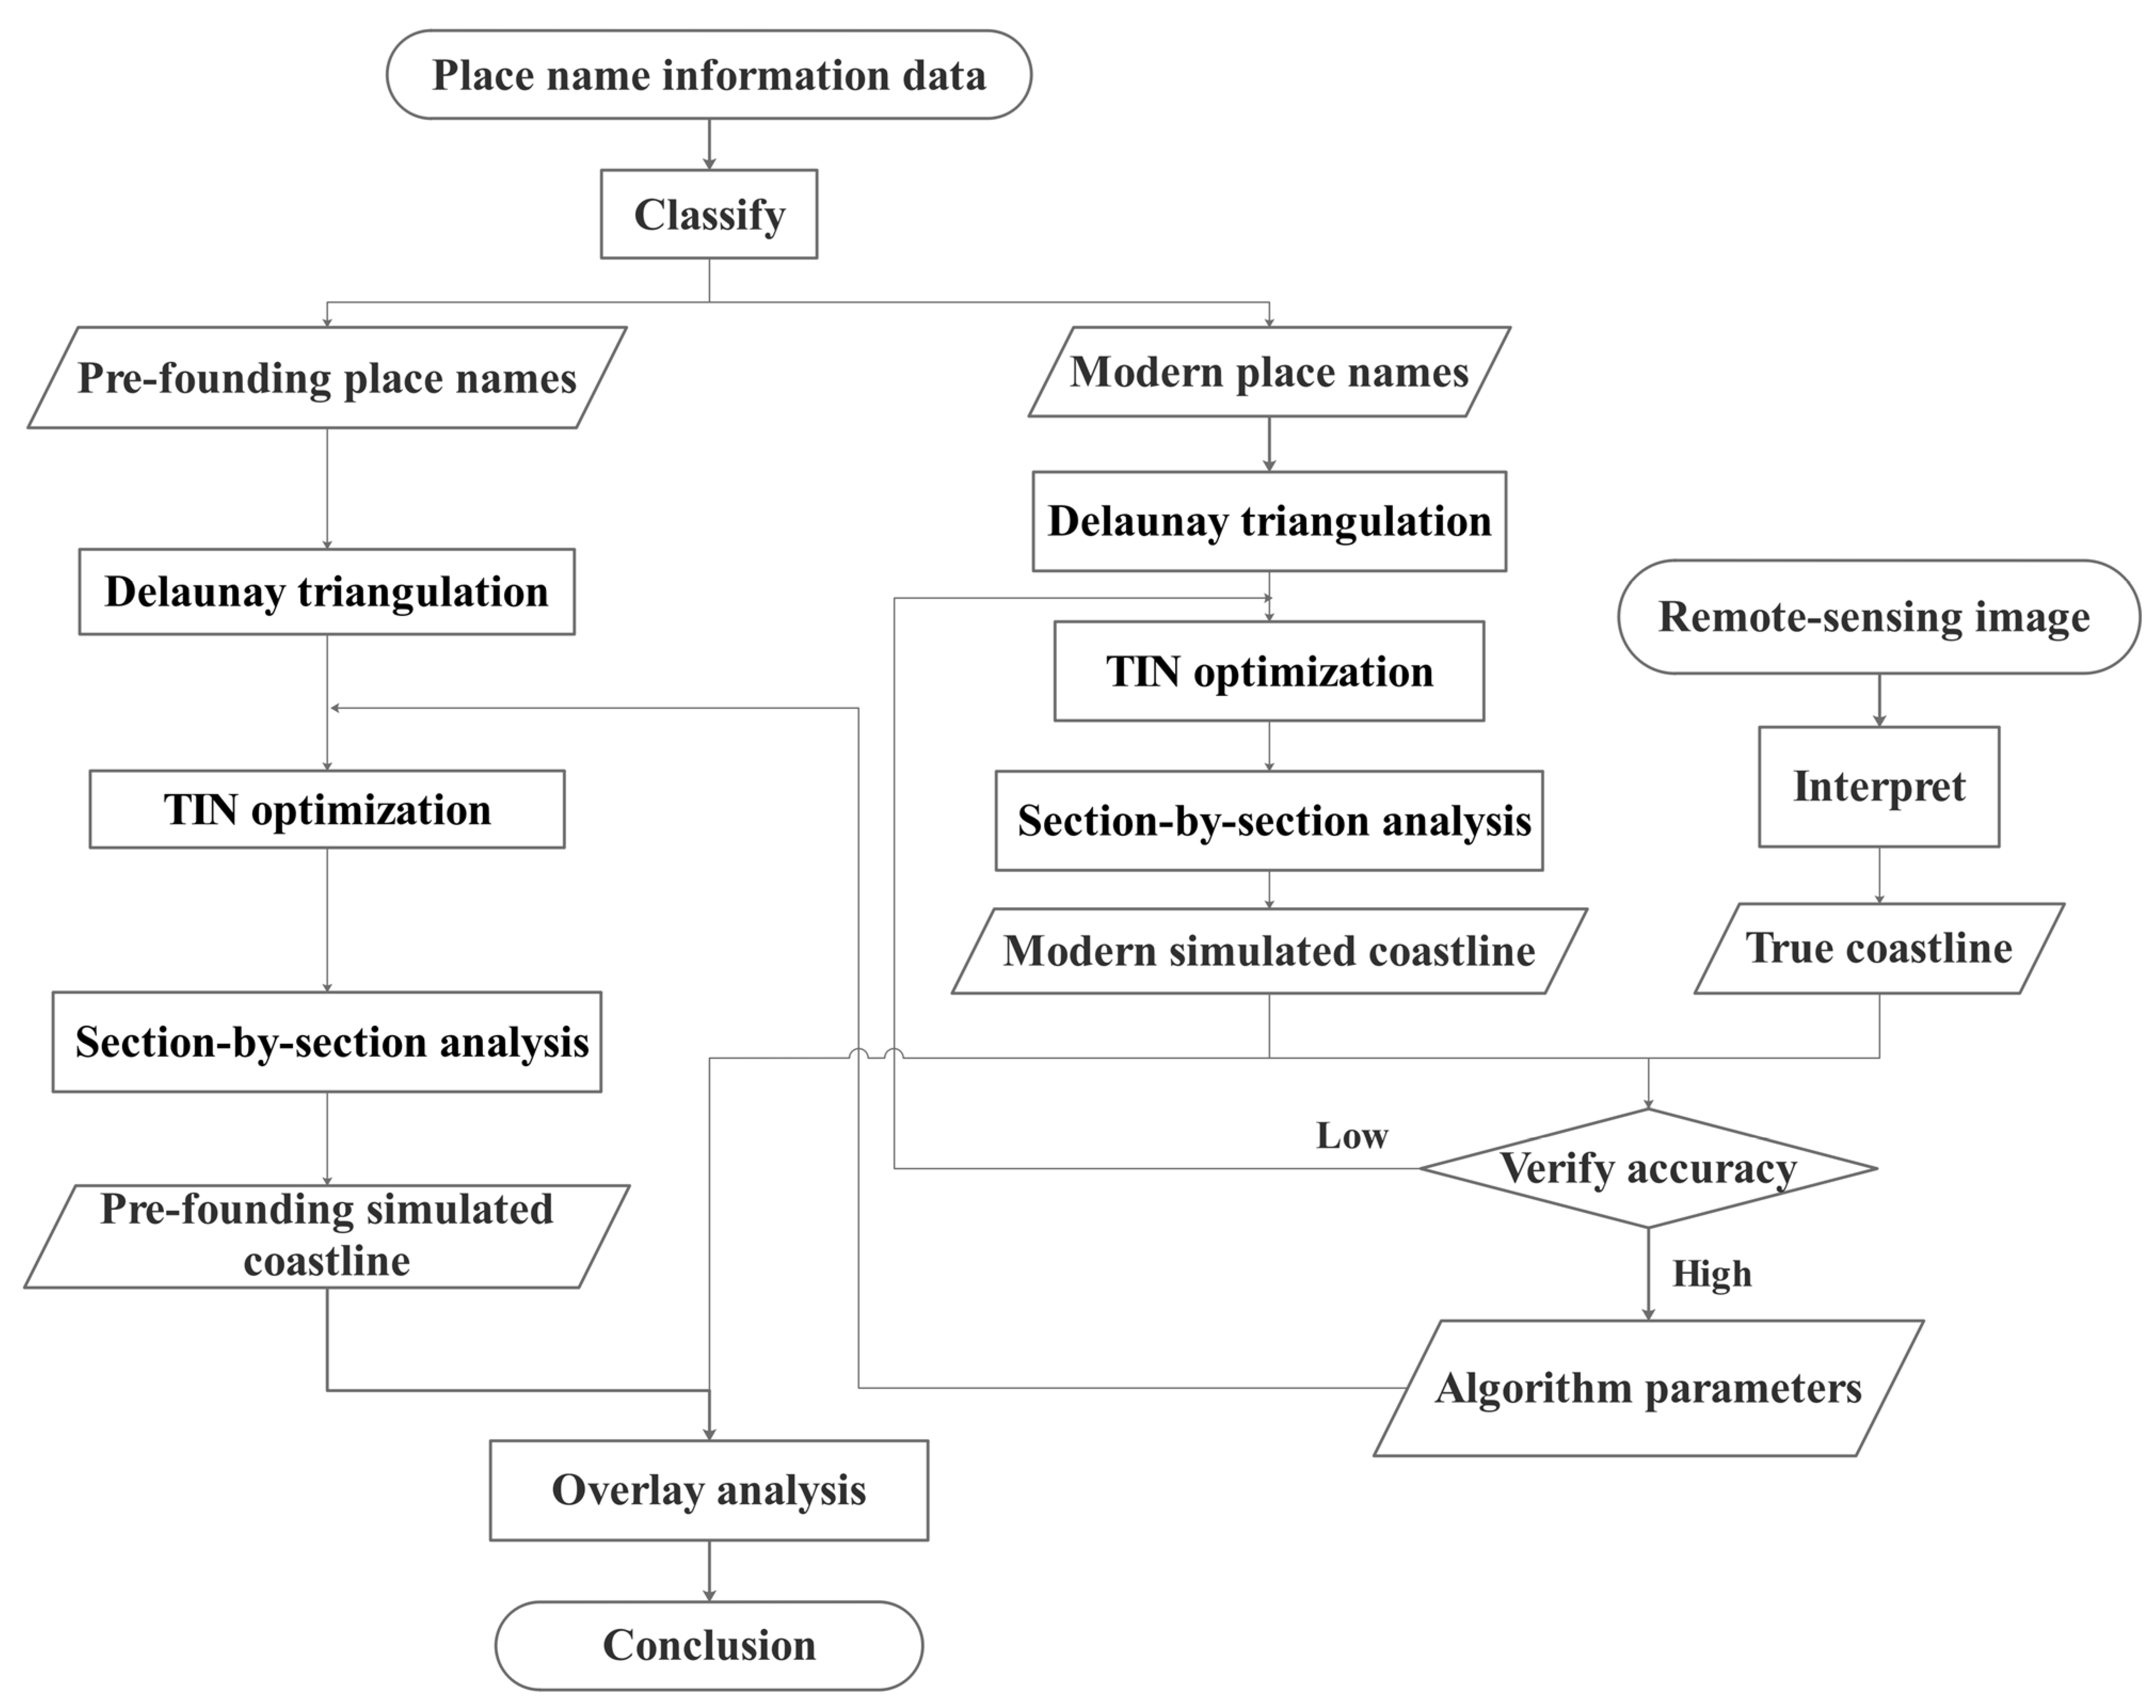
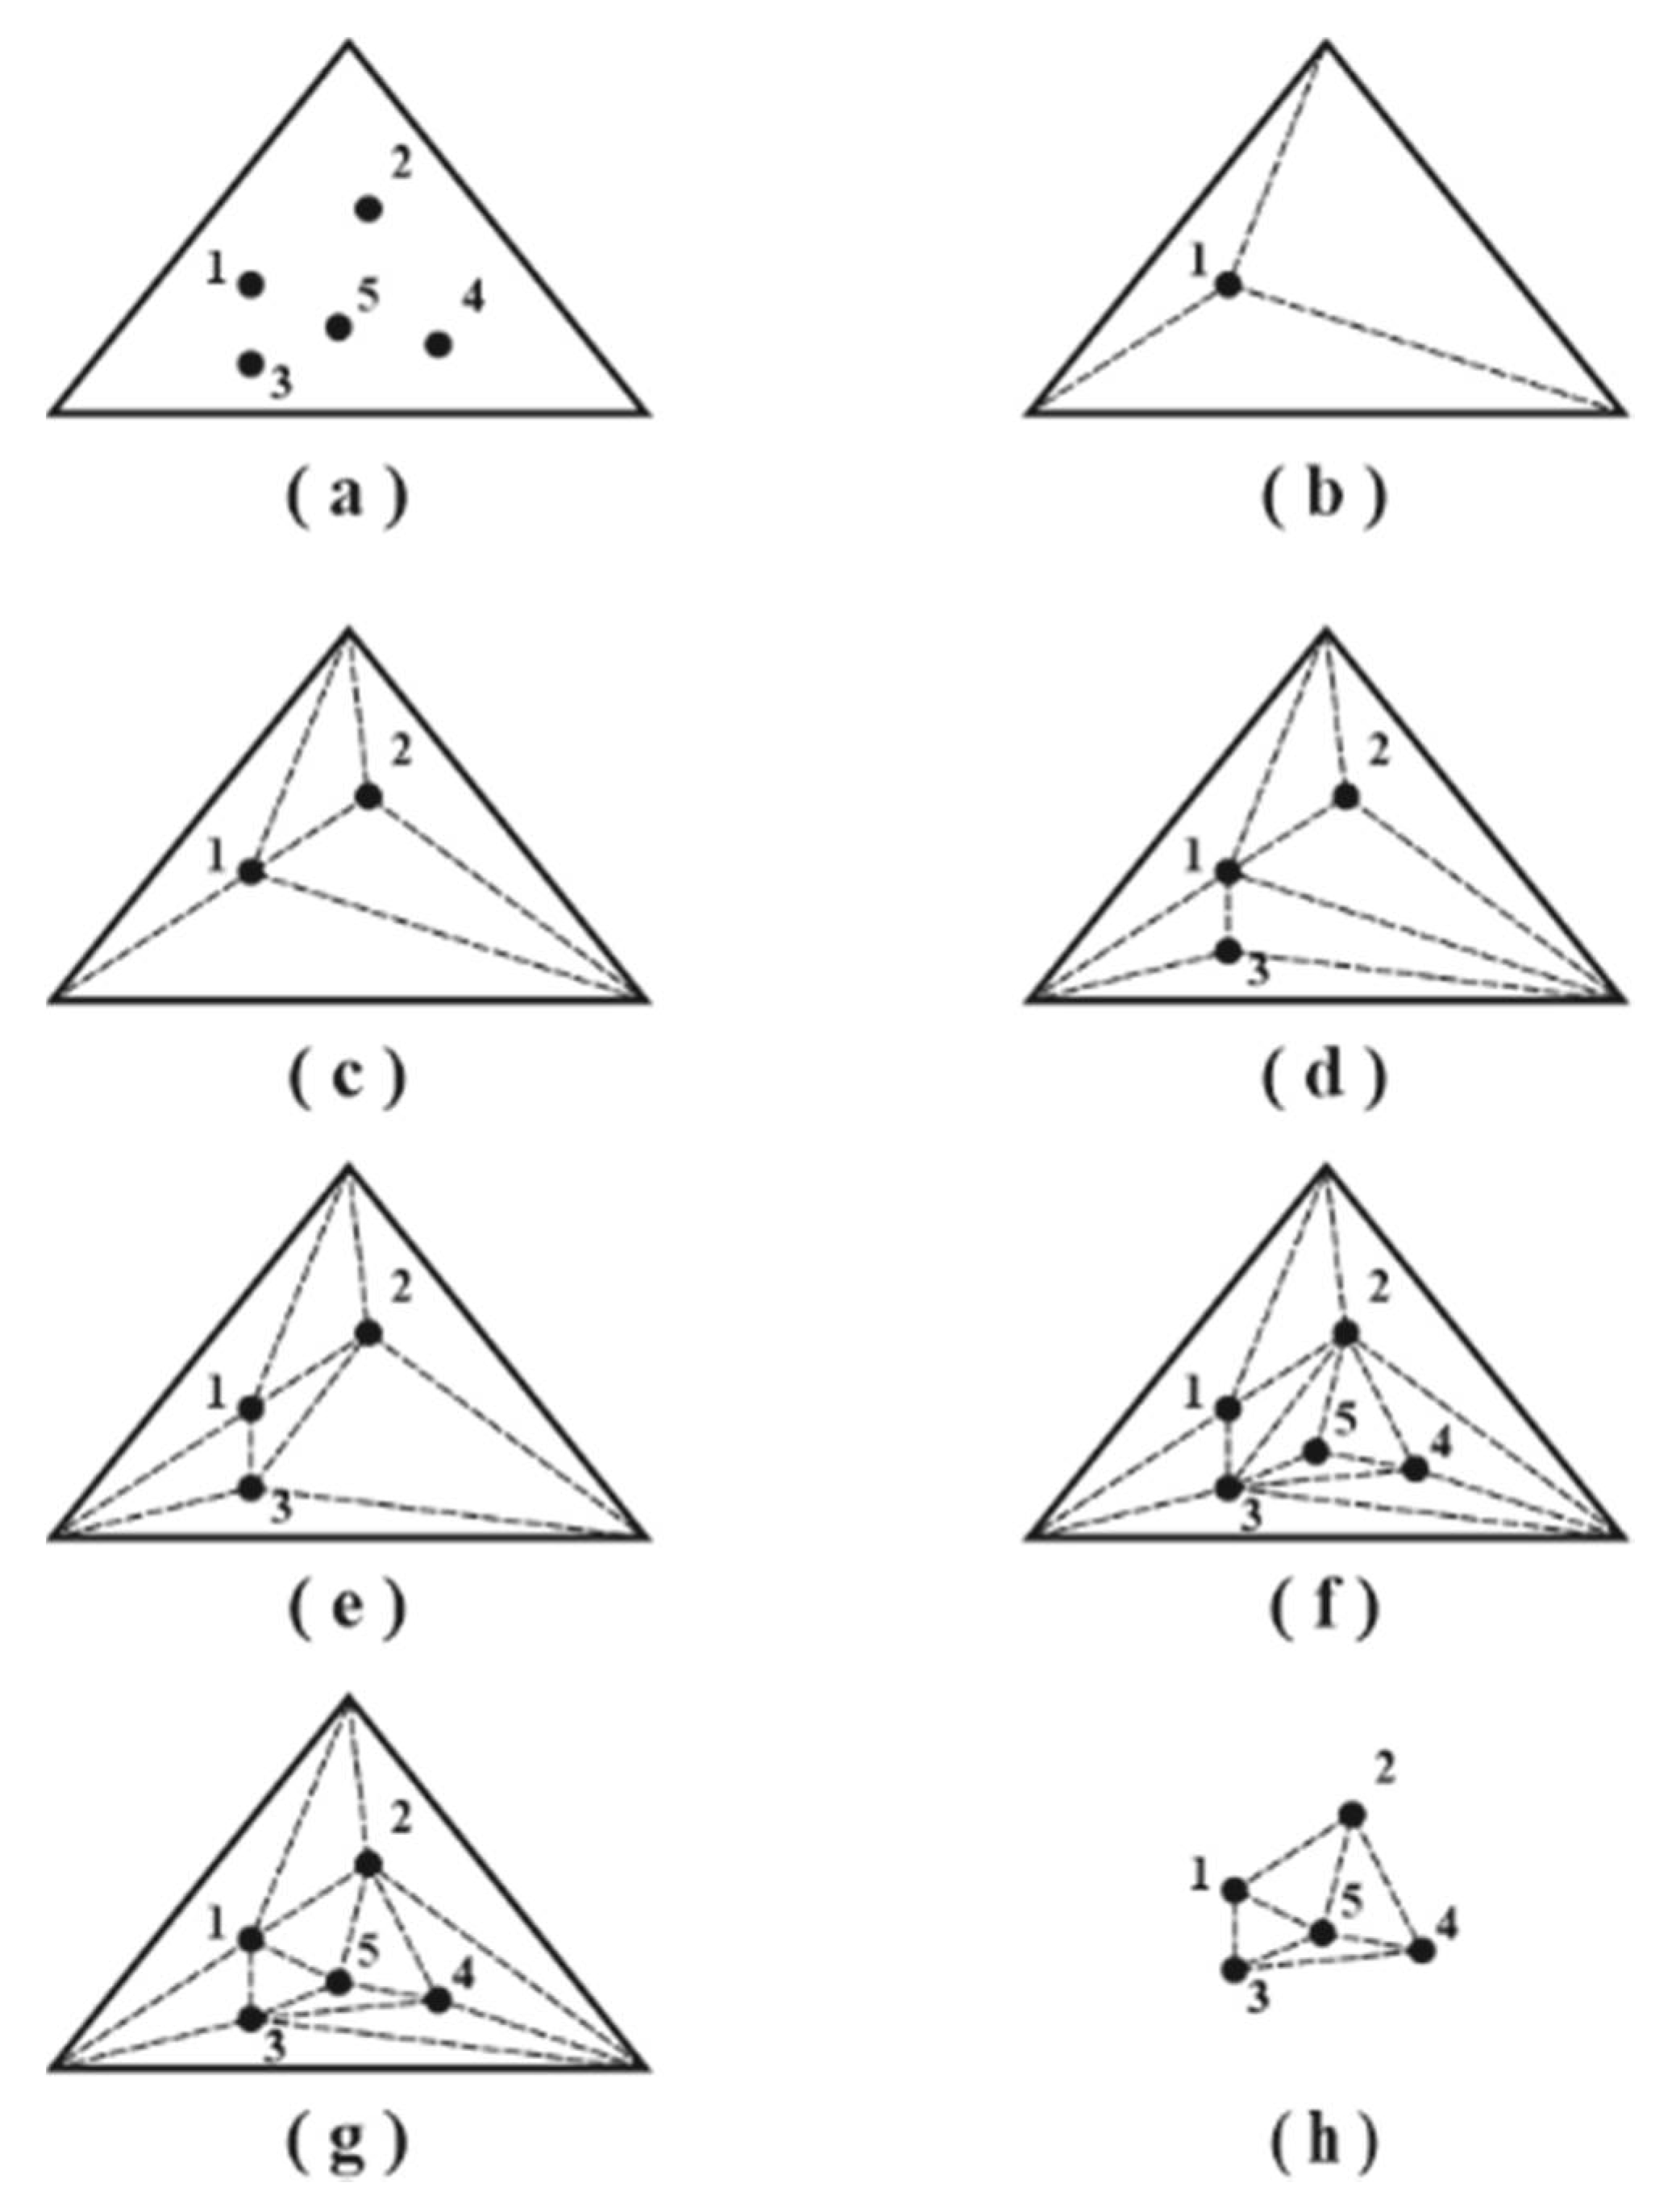
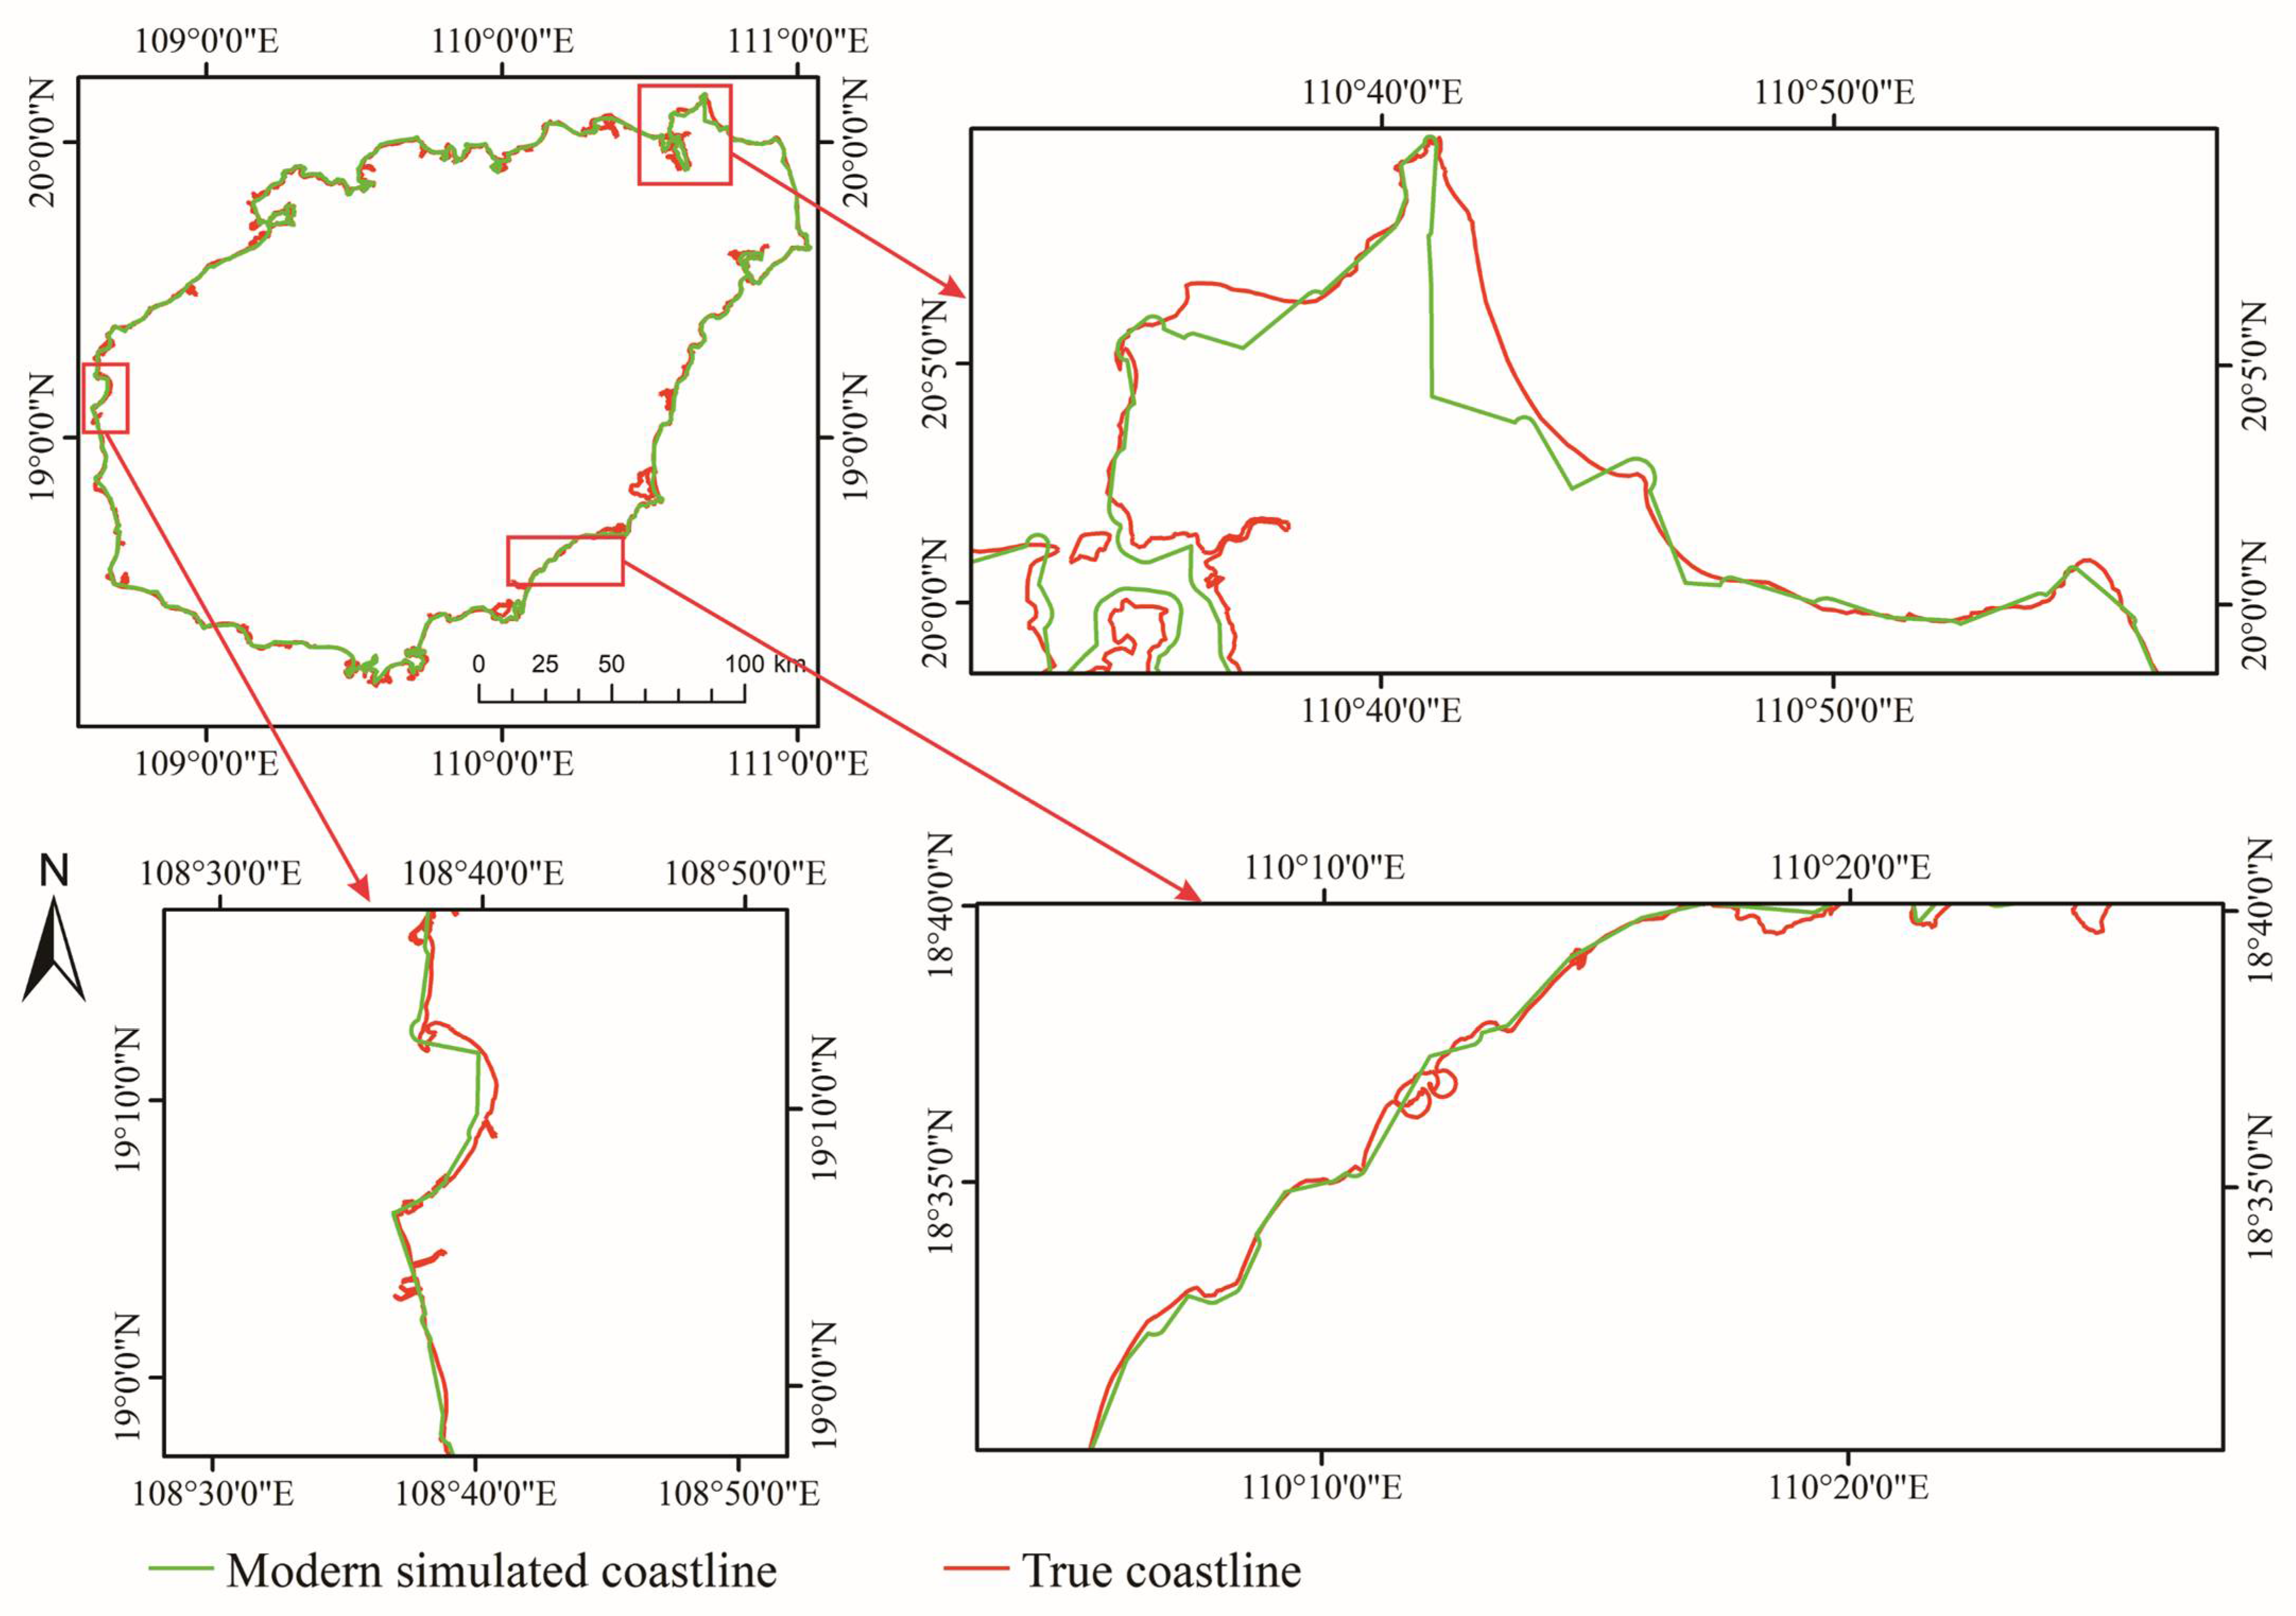
The coastline similarity of the method that uses a TIN for initial construction and then generates buffer zones one by one according to the place name type could reach 80% under 500 m accuracy. This proves that the method is scientific and effective. The degree of fit was very high in areas with relatively gentle coastlines and little change. However, due to the limitation of the TIN, as shown in Figure 10, the fitting degree was low in areas with relatively curved and complex terrain, which still needs to be further improved.
At present, scholars tend to use remote sensing image data, LiDAR data, and field survey data to extract coastlines accurately. This study is different in that that we tried to reconstruct the coastline as much as possible using only the data of place names, because the influence range of each interest point in different regions is different, and the coastline distribution extracted from remote sensing images with different resolutions is also somewhat different. We aimed to extract the coastline with high accuracy and practical significance by using singular data and a simple method. As shown in Figure 11, we achieved good results at the scale of 1:250,000, and it is of great significance to analyze the coastline changes in a medium-scale map with a long time span.
After comparing the pre-founding coastline with the modern coastline, it was found that the coastlines around many cities had undergone great changes and expanded outward to a great extent. We took Sanya and Haikou as examples for analysis.
As shown in Table 7, Sanya Bay area is the main area where Sanya’s coastline has undergone changes. The top four place names in this area are enterprises (320), urban settlements (148), institutions (135), and non-governmental organizations (66). During the period of 1980–2018, 46 place names were added from 1980 to 1989, 106 from 1990 to 1999, 348 from 2000 to 2009, 112 from 2010 to 2018, and 52 from the rest of the period, with the largest increase occurring between 2000 and 2009. According to the local place name table, it was found that the enterprises mainly include restaurants, hotels, medical treatment centers, and banks; the urban settlements are mainly villas and communities; the public institutions are mainly schools and party and government organizations; and the civil organizations are mainly life and entertainment organizations.
As shown in Table 5, among the coastlines in Sanya before the founding of the People’s Republic of China, rural coastlines, natural coastlines, and rural–natural mixed coastlines occupied a dominant position, accounting for 36.4%, 24.1%, and 10.9%, respectively; that is, the coastline was dominated by rural coastlines, and natural coastlines accounted for 71.4% of all the coastlines in Sanya, while the remaining coastlines of ports, transportation, and entertainment accounted for a low and even proportion. Among the modern coastline types in Sanya, there is no dominant coastline type, and the coastline types are evenly distributed. The top ones are commercial–natural coastline, rural coastline, and commercial coastline. In addition, the proportion of coastlines related to urban residential areas and entertainment is relatively high, while the proportion of other coastline types is gradually decreasing, but there is no dramatic change. It can be seen from the changes in geographical names and coastlines in Sanya that the dominating rural coastlines and natural coastlines before the founding of the People’s Republic of China were transformed into economical coastlines with the intervention of human activities.
From the 1980s to the present, vigorously developing tourism and urbanization in Sanya may be the main reasons for the coastline changes in Sanya. The same conclusion was obtained when consulting the literature [36].
As shown in Table 8, the top four types of geographical names in the expansion area of northern Haikou are urban residents (355), enterprises (201), institutions (106), and houses (80). Between 1980 and 2018, 136 place names were added from 1980 to 1989, 240 from 1990 to 1999, 268 from 2000 to 2009, 35 from 2010 to 2018, and 97 from the rest of the period, with the largest increase occurring between 2000 and 2009. It was found that the urban residential areas comprise mainly residential areas and villas; the enterprises are mainly hotels, banks, and shipping companies; the institutions are mainly schools, hospitals, and party and government organizations; and houses are mainly company buildings.
As shown in Table 6, among the coastlines in Haikou before the founding of the People’s Republic of China, rural coastlines, entertainment–port coastlines, natural–administration coastlines, and rural–entertainment coastlines constituted a large proportion, at 42.7%, 16.3%, 14.3%, and 13.7%, respectively, accounting for 87.0% in total, with the highest proportion of rural coastlines, which have obvious advantages over other coastlines, while the rest had a lower proportion. Among the modern coastlines in Sanya, rural–commercial coastlines account for 21.1%, followed by commercial coastlines accounting for 14.0% and rural coastlines accounting for 12.7%. In addition, coastlines related to urban residential areas, ports, and administration also account for a higher proportion, while the proportion of other coastlines is gradually decreasing, but there is no dramatic change. It can be seen from the changes in place names and coastline types in Haikou that rural coastlines occupied a dominant position before the founding of the People’s Republic of China. After the intervention of human activities, the proportion of rural coastlines decreased, while the proportion of commercial coastlines and urban residential coastlines increased.
Port construction, real estate development, and tourism development in Haikou from the 1980s to 2009 may be the main reasons for this change, which is the same conclusion obtained by the consulting literature [37].
Through the comparative analysis of the pre-founding simulated coastline and the modern simulated coastline generated by place names, it can be seen that in the 70 years after the founding of the People’s Republic of China, the whole coastline of Hainan has changed greatly. In order to promote economic development, a large number of natural coastlines have been changed into artificial coastlines, the coastline has been expanded to the sea as a whole, and there has been obvious reclamation behavior, which has had a certain impact on the marine ecology and coastal zone ecology. In response to the call for sustainable development and harmonious coexistence between man and nature, we should stop land reclamation and restore the ecological environment as much as possible.
As shown in Table 9, most scholars use remote sensing images or LiDAR data as data sources when analyzing coastlines in space–time, which requires relatively complex image processing and algorithm design [38,39,40], and the similarity of the method used in this study could reach 80% with an accuracy of 500 m and 91.2% with an accuracy of 1500 m. Compared with other methods, the method proposed in this study is simpler and more efficient with certain accuracy. In other places with similar data and land–sea distribution, this research method can be applied to quickly obtain coastlines.
Mandelbrot in “How Long Is the Coast of Britain? Statistical Self-Similarity and Fractal Dimension” mentioned that geographical curves involve many details, and the coastline is a highly complex geographical curve [41]. Wang and Wu [42] also pointed out that one of the main factors affecting cartographic generalization is map scale. Appropriate scale conditions can ensure the use and purpose of maps. The coastline is meaningful only at a certain scale. In this study, due to the characteristics of the TIN itself, as shown in Figure 10, the restoration of details was not perfect at the large scale, but as shown in Figure 11, the similarity was already very high at the medium scale of 1:25w. The method proposed in this study can be used to study the restoration and change of small- and medium-scale coastlines.

5. Conclusions

In this study, an algorithm innovation is made on the coastline generation method. In the absence of image data, the basic trend of the simulated coastline generated by the TIN and section-by-section analysis is in good agreement with the real coastline, which can satisfy the construction of a historical coastline trend and perform a spatiotemporal analysis of modern coastlines. This method can be used to study historical coastlines. In many historical documents, the division of administrative areas is recorded, but most of the coastline is missing. We can use this method to reconstruct historical coastlines from historical place names. In addition, this method can also be used for similar requirements, such as solving the influence area of a certain area.
In this study, relatively simple processing methods and single data were used to achieve better coastline fitting results at the scale of 1:250,000. It has strong practicability and high efficiency and accuracy when reconstructing and analyzing coastlines over a long time span at medium and small scales. Since the founding of the People’s Republic of China, the coastline of Hainan Island has notably changed. The natural coastline is becoming shorter, the artificial coastline is becoming longer, and most of the coastline is advancing towards the sea. Taking Sanya and Haikou as examples, we found that the tourism development and urbanization in Sanya are the main reasons for its coastline change, while the port construction, real estate development, and tourism development in Haikou are the main reasons for its coastline change. In the case of increasingly serious environmental protection problems, we should pay more attention to the protection of the natural coastline. The most significant contribution of this study is that in the absence of regional remote sensing images, the proposed method can simulate the basic trend of coastline change through place names. Moreover, in areas with remote sensing images, the method proposed in this study can provide a simpler and more effective method to extract the coastline with a certain accuracy. This paper provides a new idea for assessing the trend of historical shorelines and the temporal and spatial variations in the coastline in areas where research data are missing.

Author Contributions

Conceptualization, Fei Zhao and Guize Luan; methodology, Guize Luan; software, Jisheng Xia, Shucheng Tan and Zhifang Zhao; validation, Guize Luan; formal analysis, Zhiyan Peng; investigation, Lu Song; resources, Jisheng Xia; data curation, Guize Luan; writing—original draft preparation, Jisheng Xia and Guize Luan; visualization, Guize Luan; supervision, Jisheng Xia and Fei Zhao; project administration, Fei Zhao; funding acquisition, Jisheng Xia, Fei Zhao, Shucheng Tan and Zhifang Zhao All authors have read and agreed to the published version of the manuscript.

Funding

This research was funded by the National Natural Science Foundation of China (grant numbers 41961064 and 42061038), the Yunnan Department of Science and Technology application of basic research project (grant number 202001BB050030), the Plateau Mountain Ecology and Earth’s Environment Discipline Construction Project (grant number C1762101030017), and the Joint Foundation Project between Yunnan Science and Technology Department and Yunnan University (grant number C176240210019).

Data Availability Statement

The data are available from the corresponding author upon reasonable request.

Conflicts of Interest

The authors declare no conflict of interest.

References

  1. Crossland, C.; Baird, D.; Ducrotoy, J.-P.; Lindeboom, H.; Buddemeier, R.; Dennison, W.C.; Maxwell, B.; Smith, S.V.; Swaney, D. Coastal Fluxes in the Anthropocene. Global Change—The IGBP Series; Springer: Berlin/Heidelberg, Germany, 2005; pp. 1–37. [Google Scholar]
  2. Zhai, T.; Wang, J.; Fang, Y.; Qin, Y.; Huang, L.; Chen, Y. Assessing ecological risks caused by human activities in rapid urbanization coastal areas: Towards an integrated approach to determining key areas of terrestrial-oceanic ecosystems preservation and restoration. Sci. Total Environ. 2019, 708, 135153. [Google Scholar] [CrossRef] [PubMed]
  3. Aswani, S. Perspectives in coastal human ecology (CHE) for marine conservation. Biol. Conserv. 2019, 236, 223–235. [Google Scholar] [CrossRef]
  4. Halpern, B.; Selkoes, K.A.; Micheli, F.; Kappel, C. Evaluating and ranking the vulnerability of global marine ecosystems to anthropogenic threats. Conserv. Biol. J. Soc. Conserv. Biol. 2007, 21, 1301–1315. [Google Scholar] [CrossRef] [PubMed]
  5. Philippart, C.J.M.; Gerkema, T.; Veer, H.W.V.D. North Sea coastal ecology: Future challenges. J. Sea Res. 2017, 127, 227–230. [Google Scholar] [CrossRef] [Green Version]
  6. Campbell, L.; Meletis, Z.A. Agreement on water and a watered-down agreement: The political ecology of contested coastal development in Down East, North Carolina. J. Rural. Stud. 2011, 27, 308–321. [Google Scholar] [CrossRef]
  7. Zhang, L.; Liao, J.; Yuan, X.; Mu, X.; Song, Q.; Bi, J. Remote Sensing Analysis of Coastal Line Change Characteristics in Hainan Island from 1987 to 2017. Trop. Geogr. 2020, 40, 659–674. [Google Scholar]
  8. Sui, Y. Monitoring and Analysis of Spatio-temporal Changes of Coastline in Hainan Island in Recent 30 Years Based on Remote Sensing. Master’s Thesis, Shandong University of Science and Technology, Qingdao, China, 2018. [Google Scholar]
  9. Jett, S. Place Naming, Environment, and Perception among the Canyon de Chelly Navajo of Arizona. Prof. Geogr. 1997, 49, 481–493. [Google Scholar] [CrossRef]
  10. Wang, Y.; Dang, G. GIS-based cultural landscape analysis of place names in rural settlements in Wuwei area. J. Guizhou Norm. Univ. 2020, 38, 55–63, 74. [Google Scholar]
  11. Zhong, A.; Wu, Y.; Nie, K.; Kang, M. Using Local Toponyms to Reconstruct the Historical River Networks in Hubei Province, China. Int. J. Geo-Inf. 2020, 9, 318. [Google Scholar] [CrossRef]
  12. Chen, X.; Hu, T.; Ren, F.; Chen, D.; Li, L. Landscape Analysis of Geographical Names in Hubei Province, China. Entropy 2014, 16, 6313–6337. [Google Scholar] [CrossRef] [Green Version]
  13. Joo-Hyung, R.; Joong-Sun, W.; Kyung, D.M. Waterline extraction from Landsat TM data in a tidal flat: A case study in Gomso Bay, Korea. Remote Sens. Environ. 2002, 83, 442–456. [Google Scholar]
  14. Ghosh, M.; Kumar, L.; Roy, C. Monitoring the coastline change of Hatiya Island in Bangladesh using remote sensing techniques. Isprs J. Photogramm. Remote Sens. 2015, 101, 137–144. [Google Scholar] [CrossRef]
  15. Zhang, C.; Feng, W.; Zhang, J. Coastline Extraction from Remote Sensing Images Based on Color Difference. J. Inst. Surv. Mapp. 2005, 4, 259–262. [Google Scholar]
  16. Stockdonf, H.F.; Sallenger, A.H.; Holman, L.R.A. Estimation of Shoreline Position and Change Using Airborne Topographic Lidar Data. J. Coast. Res. 2002, 18, 502–513. [Google Scholar]
  17. Yu, C.; Xu, J.; Xu, J.; Zheng, Y.; Li, G. A new method for extracting coastline from LiDAR point cloud. Bull. Surv. Mapp. 2015, 10, 66–68. [Google Scholar]
  18. Zhang, X.; Zhuang, Z.; Zhang, X.; Yang, B. Remote sensing extraction and change monitoring of Qinhuangdao coastline. Remote Sens. Technol. Appl. 2014, 29, 625–630. [Google Scholar]
  19. Fang, G. A Study on the Changes of Liaoning Coastline in the Past Century Based on RS and GIS. Master’s Thesis, China University of Geosciences, Beijing, China, 2009. [Google Scholar]
  20. Xiang, S.; Zhang, L.; Lu, S.; Tan, X.; Chen, K.-L.; Zhao, S.; Huang, R.-H. A new model for evaluating sustainable utilization of coastline integrating economic output and ecological impact: A case study of coastal areas in Beibu Gulf, China. J. Clean. Prod. 2020, 271, 122423. [Google Scholar]
  21. Moussa, R.; Fogg, L.; Bertucci, F.; Calandra, M.; Collin, A.; Aubanel, A.; Polti, S.; Benet, A.; Salvat, B.; Galzin, R.; et al. Long-term coastline monitoring on a coral reef island (Moorea, French Polynesia). Ocean. Coast. Manag. 2019, 180, 104928. [Google Scholar] [CrossRef]
  22. Liu, L.; Xu, W.; Yue, Q.; Teng, X.; Hu, H. Problems and countermeasures of coastline protection and utilization in China. Ocean. Coast. Manag. 2018, 153, 124–130. [Google Scholar] [CrossRef]
  23. Thoai, D.T.; Dang, A.N.; Oanh, N. Analysis of coastline change in relation to meteorological conditions and human activities in Ca mau cape, Viet Nam. Ocean. Coast. Manag. 2019, 171, 56–65. [Google Scholar] [CrossRef]
  24. Li, Q.; Lu, Y.; Hu, S.; Hu, Z.; Li, H.; Liu, P.; Shi, T.; Wang, C.; Wang, J.; Wu, G. Summary of Remote Sensing Monitoring of Coastal Geographical Environment. J. Remote Sens. 2016, 20, 1216–1229. [Google Scholar]
  25. Bi, J.; Zhang, L.; Song, Q.; Sui, Y.; Wen, L. Hainan Island Coastline Data Set from 1987 to 2017. Chin. Sci. Data 2019, 4, 6–17. [Google Scholar]
  26. Fowler, R.; Little, J. Automatic extraction of Irregular Network digital terrain models. Comput. Graph. 1979, 13, 199–207. [Google Scholar] [CrossRef]
  27. Ali, T.; Mehrabian, A. A novel computational paradigm for creating a Triangular Irregular Network (TIN) from LiDAR data. Nonlinear Anal. Theory Methods Appl. 2009, 71, e624–e629. [Google Scholar] [CrossRef]
  28. Yan, H.; Wang, M.; Wang, Z. Computational Geometry: Spatial Data Processing Algorithm; Science Press: Beijing, China, 2012. [Google Scholar]
  29. Xu, J. Study on True Three-Dimensional Numerical Simulation of Deep Large Stope. Master’s Thesis, Central South University, Changsha, China, 2013. [Google Scholar]
  30. Xu, D. Construction and Application of Irregular Triangulation Network (TIN). Master’s Thesis, Jiangxi University of Science and Technology, Ganzhou, China, 2010. [Google Scholar]
  31. Torralba, A.; Fergus, R.; Weiss, Y. Small codes and large image databases for recognition. In Proceedings of the IEEE Conference on Computer Vision and Pattern Recognition, Anchorage, AK, USA, 23–28 June 2008; pp. 1–8. [Google Scholar]
  32. Huang, J.; Li, X.; Chen, B.; Yang, D. Comparison of image similarity algorithms based on hash. J. Dali Univ. 2017, 2, 32–37. [Google Scholar]
  33. Deng, L.; Xu, G.; Li, M.; Chen, Z. Fast face recognition based on deep learning and dodohi similarity weighting. Comput. Sci. 2020, 47, 163–168. [Google Scholar]
  34. Oliva, A.; Torralba, A. Modeling the Shape of the Scene: A Holistic Representation of the Spatial Envelope. Int. J. Comput. Vis. 2004, 42, 145–175. [Google Scholar] [CrossRef]
  35. Wu, F.; Su, F.; Ping, B.; Wu, W.; Zhu, L. Spatial-temporal changes of the eastern coast of Liaodong Bay based on multi-source information. Resour. Sci. 2013, 35, 875–884. [Google Scholar]
  36. Li, G.; Wang, R.; Chen, H.; Tang, J.; Li, B. Changes and causes of coastline in southern Hainan Island. Mar. Geol. Front. 2018, 34, 48–54. [Google Scholar]
  37. Bao, M. Remote Sensing Monitoring and Change Analysis of Hainan Island Coastline in Recent 40 Years. Master’s Thesis, Inner Mongolia Normal University, Hohhot, China, 2014. [Google Scholar]
  38. Nourdi, N.F.; Raphael, O.; Grégoire, A.O.; Paul, R.J.; Sakaros, B.; Thomas, S.; Minette, T. Seasonal to decadal scale shoreline changes along the Cameroonian coastline, Bay of Bonny (1986 to 2020). Reg. Stud. Mar. Sci. 2021, 45, 101798. [Google Scholar] [CrossRef]
  39. Lerma, A.N.; Ayache, B.; Ulvoas, B.; Paris, F.; Bernon, N.; Bulteau, T.; Mallet, C. Pluriannual beach-dune evolutions at regional scale: Erosion and recovery sequences analysis along the aquitaine coast based on airborne LiDAR data. Cont. Shelf Res. 2019, 189, 103974. [Google Scholar] [CrossRef]
  40. Ai, B.; Zhang, R.; Zhang, H.; Ma, C.; Gu, F. Dynamic process and artificial mechanism of coastline change in the Pearl River Estuary. Reg. Stud. Mar. Sci. 2019, 30, 100715. [Google Scholar] [CrossRef]
  41. Mandelbrot, B. How Long Is the Coast of Britain? Statistical Self-Similarity and Fractional Dimension. Science 1967, 156, 636–638. [Google Scholar] [CrossRef] [PubMed] [Green Version]
  42. Wang, Q.; Wu, H. Research on Fractal Description and Automatic Synthesis of Map Information; Wuhan Technical University of Surveying and Mapping Press: Wuhan, China, 1998. [Google Scholar]
Figure 1. Elevation of Hainan Island, including the major rivers and two major cities used in this study.
Ijgi 10 00609 g001
Figure 2. Methodology flowchart showing the main data used in the research and the algorithm implementation process.
Ijgi 10 00609 g002
Figure 3. Gradual interpolation algorithm: Pre-construct a super triangle containing all points, sequentially select points from the given point data, and insert them into the super triangle to construct a triangular network according to certain rules until all points are inserted. Finally, delete the pre-constructed super triangle and its connecting lines, and the rest is the finally obtained TIN. (a) Point Group and Super Triangle. (b) Insert the First Point. (c) Insert the Second Point. (d) Insert the Third Point. (e) After Inserting the Third Point, Apply the Triangulation Modified by Lawson LOP Rule. (f) Insert the Fourth and Fifth Points. (g) After Inserting the Fifth Point, Apply the Tri-angulation Modified by Lawson LOP Rule. (h) Triangulation Net after Removing Super Triangle.
Ijgi 10 00609 g003
Figure 4. Lawson’s LOP rule: the diagonal of the quadrilateral is changed to meet the maximum–minimum angle criterion. (a) Initial Triangle. (b) Triangulation Network after Insertion Point D. (c) Modified Triangulation Network.
Ijgi 10 00609 g004
Figure 5. Maximum–minimum angle criterion: the minimum angle of two triangles is maximized by exchanging diagonal lines of quadrilaterals.
Ijgi 10 00609 g005
Figure 6. TIN example: overall TIN shape of Hainan Island and three enlarged examples of areas for display.
Ijgi 10 00609 g006
Figure 7. (a) Preliminary TIN simulation. (b) Production of buffer zone. (c) Result of the section-by-section analysis. Section-by-section analysis: there is a large error in the initial TIN simulation results, so the buffer analysis of each line segment makes it closer to the real coastline.
Ijgi 10 00609 g007
Figure 8. Simulated coastline results: comparison of the simulation results of the modern coastline with the real coastline, and enlargement of three areas used for display.
Ijgi 10 00609 g008
Figure 9. Variable zone example: the change area between the pre-founding simulated coastline and the modern simulated coastline; Sanya and Haikou are enlarged and displayed.
Ijgi 10 00609 g009
Figure 10. Defects of the method: the simulated coastline is poor in detail restoration of complex terrain.
Ijgi 10 00609 g010
Figure 11. Display effect at 1:25w: the simulated coastline shows good results at the scale of 1:25w.
Ijgi 10 00609 g011
Table 1. Example of place name information data.
Standard NameXinxing Community Residents Committee
Place typeCommunity neighborhood committee
Place originXinxing community residents committee is located in Xinxing village
Place meaningThe residents committee of the Xinxing community manages the affairs of the Xinxing community, hence its name
Place historyIt was established in 1950
Longitude108.7
Latitude18.51
Table 2. Classification of the different place names according to the type of place.
ClassificationPlace Type
TransportationRoundabout, intersection, railway station, etc.
RuralVillage committees, rural settlements
PortLighthouse, beacon, harbor, etc.
Urban residential areaNeighborhood committees, houses, urban settlements
CommercialEnterprises, development zones, border trade zones, etc.
NaturalCape, cave, mountain, etc.
EntertainmentScenic spots, parks, temples, etc.
AdministrationInstitutions, non-governmental organization, public institution, etc.
Table 3. Accuracy of the simulated coastline: Similarity of simulated coastline under accuracy of 500, 1000, and 1500 m.
Accuracy (m)Number of Statistical UnitsNumber of Similar UnitsCoastline Similarity
150042038591.7%
100042037589.3%
50042033680%
Table 4. The coastline change area of each city in Hainan Island.
CityChange Area (km2)
Sanya123.85
Danzhou119.97
Haikou82.23
Wenchang54.50
Ledong Li27.17
Dongfang22.15
Lingshui Li20.99
Wanning13.92
Chengmai11.11
Changjiang Li9.23
Lingao6.87
Qionghai1.20
Table 5. Coastline type proportion changes between the pre-founding simulated coastline and the modern simulated coastline in Sanya.
Pre-FoundingProportionModernProportion
1Rural–natural coastline36.5%Commercial–natural coastline9.6%
2Natural coastline24.1%Rural coastline9.6%
3Rural coastline11.0%Commercial coastline9.6%
4Port-natural coastline6.9%Rural–natural coastline8.0%
5Transportation–natural coastline4.7%Natural coastline6.4%
6Rural–port coastline4.0%Commercial–administration coastline6.1%
Table 6. Coastline type proportion changes between the pre-founding simulated coastline and the modern simulated coastline in Haikou.
Pre-FoundingProportionModernProportion
1Rural coastline42.7%Rural–commercial coastline21.1%
2Entertainment–port coastline16.3%Commercial coastline14.0%
3Natural–administration coastline14.3%Rural coastline12.7%
4Rural–entertainment coastline13.7%Commercial–urban residential area coastline10.8%
5Entertainment–administration coastline5.7%Port-administration coastline9.1%
6Port-natural coastline5.5%Entertainment–administration coastline8.7%
Table 7. Place types in the south of Sanya: the top four types of changes in the total number of place names in Sanya in different periods.
Period1980–19891990–19992000–20092010–2018OtherSum
Place Type
Enterprises15501707015320
Urban settlements1224831514148
Public institutions1932501123135
Civil organizations054516066
Sum4610634811252669
Table 8. Place types in the north of Haikou: the top four types of changes in the total number of place names in Haikou in different periods.
Period1980–19891990–19992000–20092010–2018OtherSum
Place Type
Urban settlements471091561132355
Enterprises3262651824201
Institutions122724637106
Houses1142230480
Sum1362402683597742
Table 9. Comparison of coastline extraction methods and data from relevant scholars.
AuthorsResearch AreaResearch PeriodData SourceMethod
Njutapvoui F. Nourdi et al.Bonny Bay, Cameroon1986–2020Landsat 5/7/8
Sentinel-2A/2B
CoastSat toolbox’s automatic extraction
Alexandre Nicolae Lerma et al.Aquitaine Coast2011–2017Airborne LiDARAutomatic detection with GIS treatment
Bin Ai et al.Pearl River Estuary1978–2017Landsat MSS/TM/OLISupport vector machine
Publisher’s Note: MDPI stays neutral with regard to jurisdictional claims in published maps and institutional affiliations.

