
Modeling Health Seeking Behavior Based on Location-Based Service Data: A Case Study of Shenzhen, China


1
School of Resource and Environment Science, Wuhan University, Wuhan 430079, China
2
Shenzhen Urban Planning & Land Resource Research Center, Shenzhen 518040, China
*
Author to whom correspondence should be addressed.
ISPRS Int. J. Geo-Inf. 2022, 11(5), 295; https://0-doi-org.brum.beds.ac.uk/10.3390/ijgi11050295
Submission received: 20 February 2022
/
Revised: 25 April 2022
/
Accepted: 30 April 2022
/
Published: 2 May 2022
Abstract
:Understanding residents’ health seeking behavior is crucial for the planning and utilization of healthcare resources. With the support of emerging location-based service (LBS) data, this study proposes a framework for inferring health seeking trips, measuring observed spatial accessibility to healthcare, and interpreting the determinants of health seeking behavior. Taking Shenzhen, China as a case study, a supply–demand ratio calculation method based on observed data is developed to explore basic patterns of health seeking, while health seeking behavior is described using a spatial analysis framework based on the Huff model. A total of 95,379 health seeking trips were identified, and their analysis revealed obvious differences between observed and potential spatial accessibility. In addition to the traditional distance decay effect and number of doctors, the results showed health seeking behavior to be determined by hospital characteristics such as hospital scale, service quality, and popularity. Furthermore, this study also identified differences in health seeking behavior between subgroups with different ages, incomes, and education levels. The findings highlight the need to incorporate actual health seeking behavior when measuring the spatial accessibility of healthcare and planning healthcare resources. The framework and methods proposed in this study can be applied to other contexts and other types of public facilities.
1. Introduction
An important goal of urban planning is the fair allocation of public facilities [1]. Adequate supply of medical resources has been confirmed to effectively reduce the risk of various diseases [2]; by contrast, unequal distribution of medical resources tends to increase the gaps between socio-economic groups in health conditions and life quality [3]. In recent years, due to the limited activities of residents caused by the COVID-19 epidemic, the importance of a rational allocation of medical resources has been further highlighted. The accessibility of vaccination centers and medical service facilities has become the focus of academic attention [4,5,6].
Understanding residents’ health seeking behavior, e.g., how residents select medical facilities when they are in medical need, is crucial for the planning and governing of healthcare services [7,8,9,10,11]. Health seeking behavior has been studied for decades by scholars in the domains of medicine and public health, and a series of theories and analytical methods have been proposed [12,13,14,15,16,17]. However, studies in this area have mainly focused on the influence of economic and social factors, and little attention has been paid to spatial factors such as patient and hospital locations and the distances between them.
The concept of spatial accessibility was proposed by researchers in the domains of geography and urban planning for the analysis of the interaction between residents and facilities from a spatial perspective. Numerous quantification methods have been proposed, such as the kernel density method, container approach, spatial proximity approach, and spatial interaction approach [18,19,20]; among them, the most widely applied are the two-step floating catchment area (2SFCA) method, gravity-based method, and their improved forms [21]. These comprehensive measures of accessibility are formulated based on the interactions of facilities and population [22,23]. Some methods further assume variable service scopes (i.e., catchment areas) for facilities with different sizes or grades and for regions with different population densities [24,25,26,27], while others emphasize the competition between supply and demand [22,23,28]. In addition, scholars have also put forward accessibility assessment methods considering residents’ travel modes, which generally cover transportation modes such as walking, cycling, driving, and public transportation. Relevant research results show that urban walkability and traffic congestion not only have a significant impact on facility accessibility, but also involve urban sustainable development [29,30,31]. In these methods, it is commonly assumed that residents select facilities according to a gravity law [21,32,33].
Although spatial accessibility decays with distance as a general rule, specific decay patterns should be determined from real observation data [34]. It has long been a challenging task to obtain data on actual health seeking behavior [35,36], but recently, GPS tracking technology has enabled the exploitation of big trajectory data such as mobile location data, taxi trajectory data, and smart card data to efficiently and precisely infer large-sample human mobility behaviors [37,38,39,40]. Such real observational data have seen good use in analyzing the relationship between health seeking behavior and spatial factors, and also in calibrating the distance decay function and service area in spatial accessibility analysis models. In particular, Pan et al. optimized the 2SFCA method for determining the service area of healthcare facilities using cab trajectory data [35], Gao et al. analyzed urban hospital bypass behavior from cab trajectory data [41], Gong et al. improved the decay function of the 2SFCA method using cab data [42], and Liu et al. fitted a distance decay function using smart card data [43].
Despite the advances represented by the abovementioned studies, several key questions have still not been fully answered. Firstly, how does residents’ health seeking behavior differ from the results of classical spatial accessibility models in a real “resident-facility” spatial interaction scenario? Secondly, apart from the distance factor, what factors of supply and demand exert key influences on health seeking behavior? Thirdly, how to construct a quantitative model to effectively describe the visit volume between any given residential area and hospital?
This study intends to contribute to the literature addressing these problems in three aspects. First, it aims to infer health seeking behavior based on location-based service (LBS) data, which has a finer spatial resolution and covers a larger proportion of the population than either taxi or smart card data. In addition, we propose a supply–demand ratio calculation method based on observational data to explore basic patterns of actual health seeking behavior. Second, we propose a series of extended Huff models to describe the health seeking behavior and use observational data for model selection and parameter calibration. Third, this study divides the population into heterogeneous subgroups according to age, income, and education level, an analysis of which can provide enlightening insights regarding the differences in health seeking behavior among subgroups. The proposed methods will be illustrated and validated using the city of Shenzhen, China as a case study. Finally, the discussion will build on the results regarding how to improve our understanding of health seeking behavior.
2. Study Area and Data
2.1. Study Area
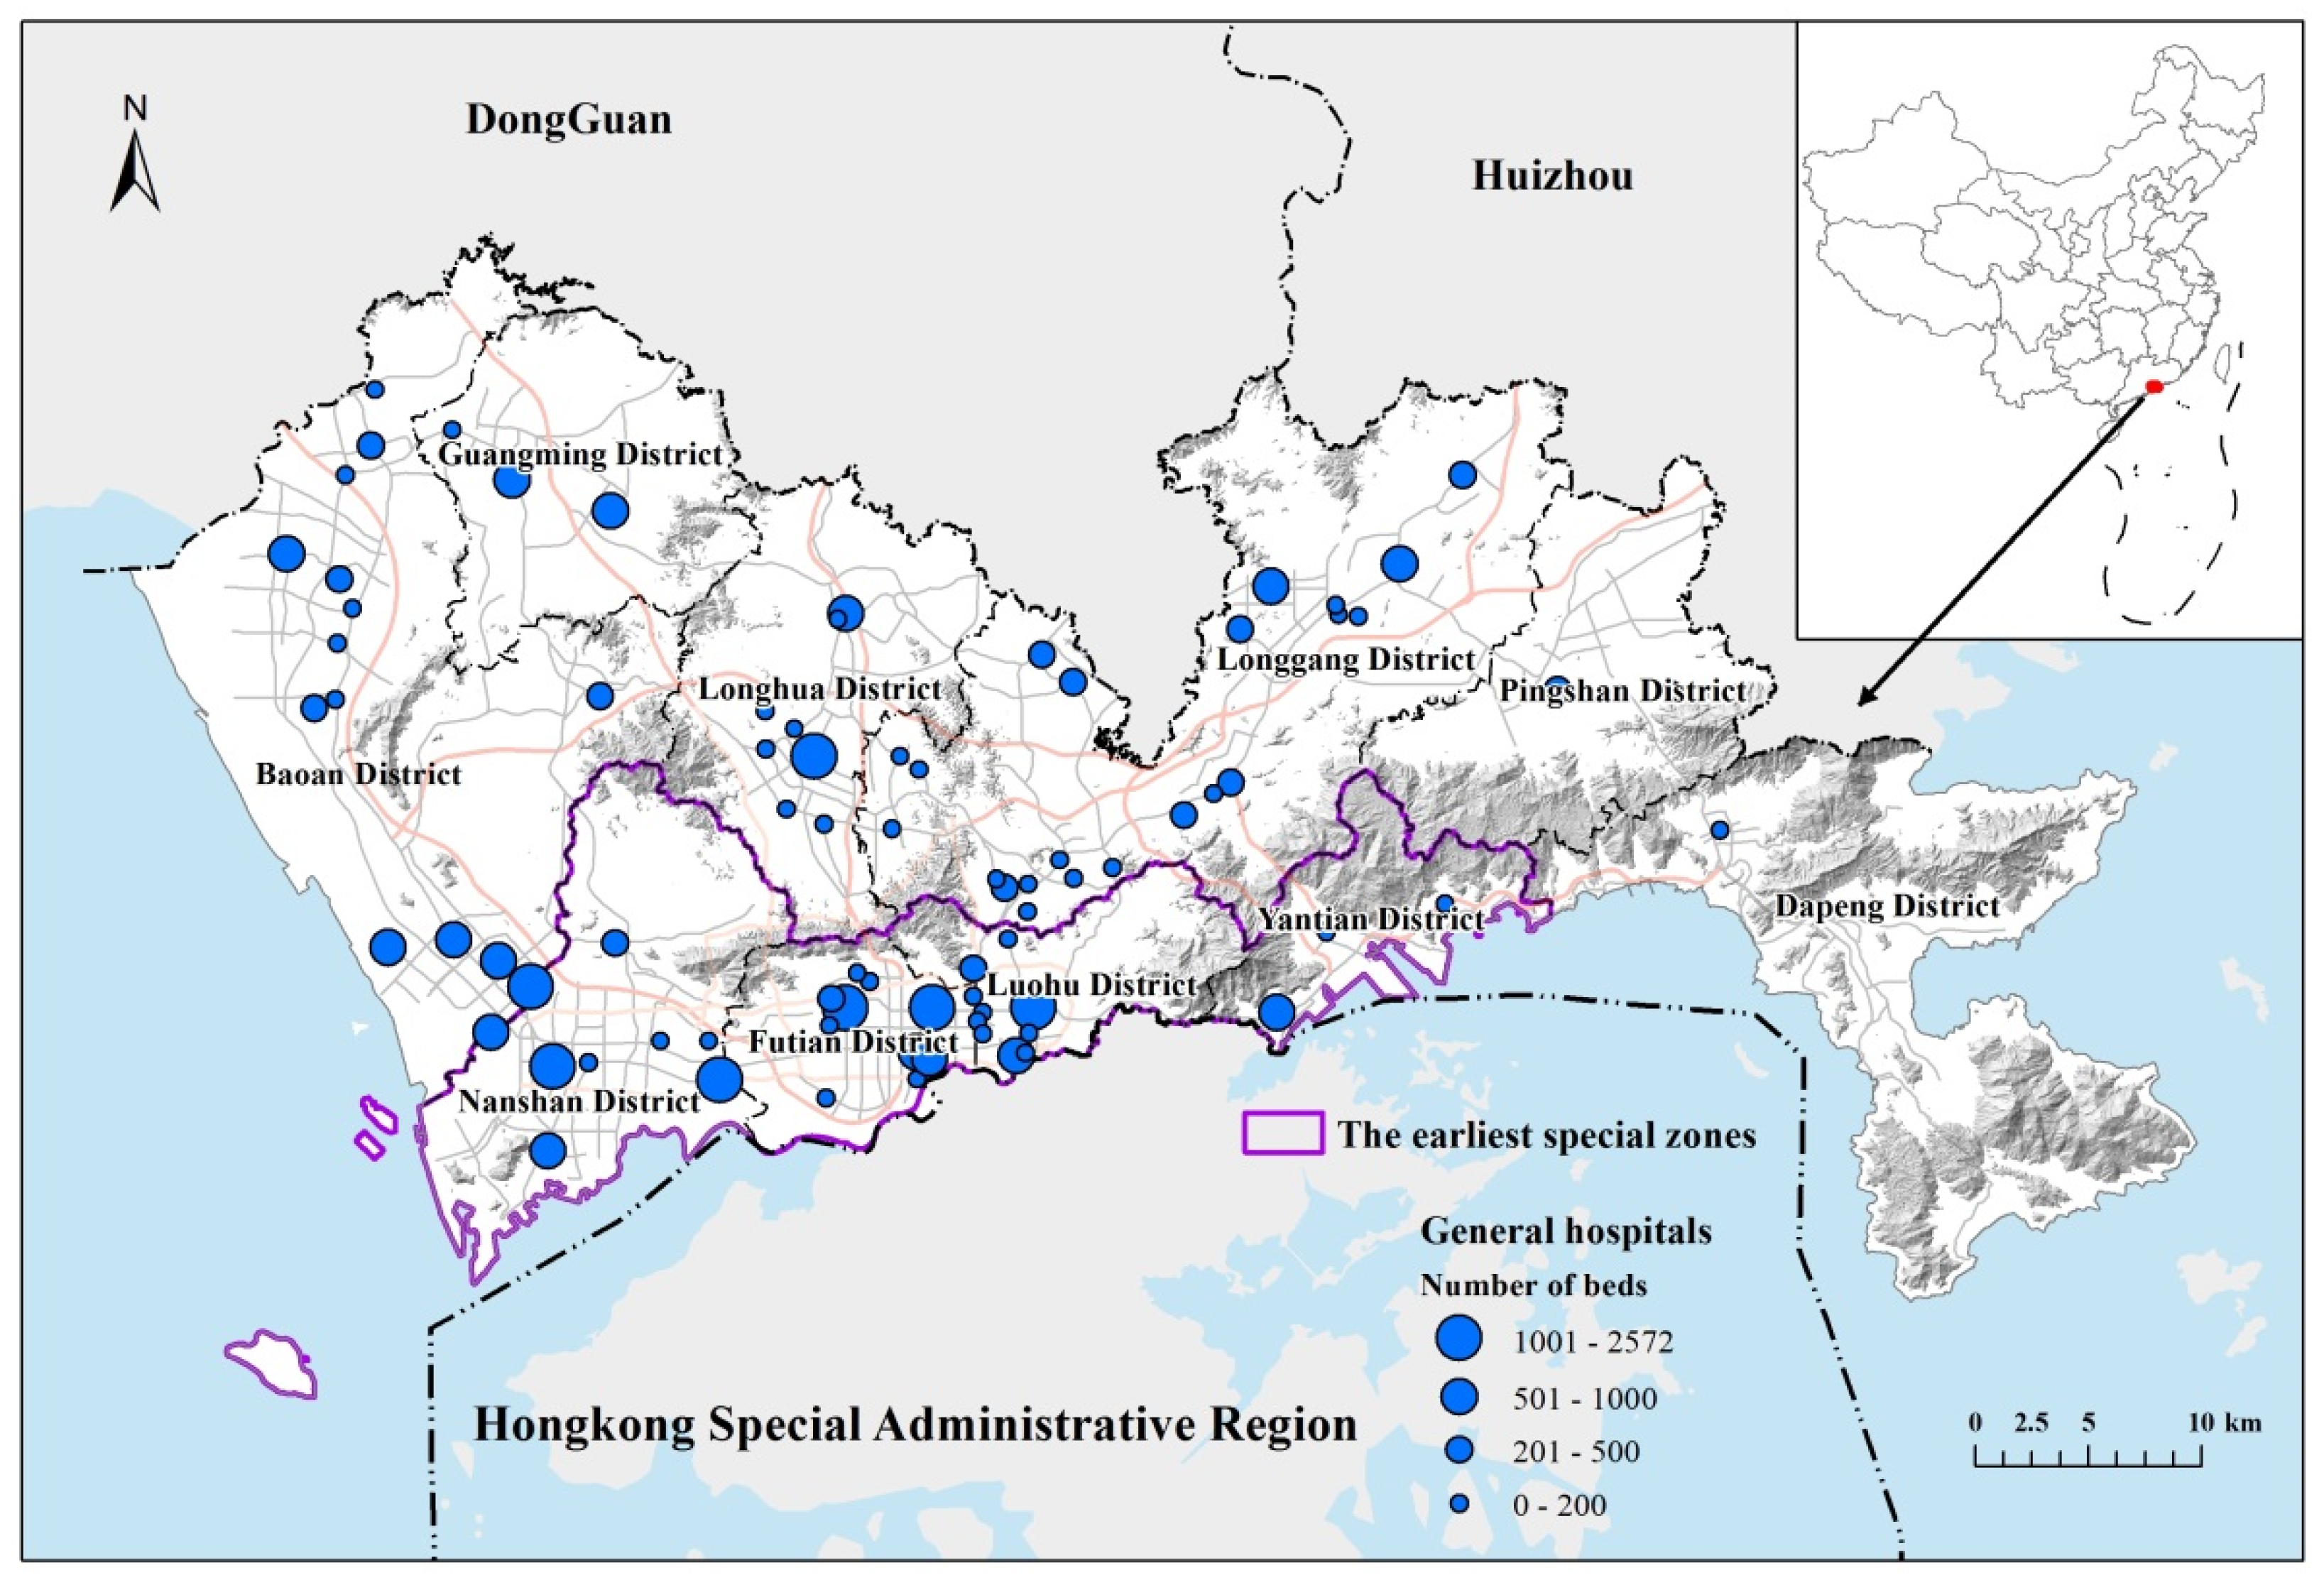
Shenzhen is a mega-city in Southern China, bordering Hong Kong to the south, with a land area of 1997 km2 and a total population of 11.91 million as of the end of 2016 [44]. Shenzhen was one of the first special economic zones to be established in 1980 along with the reform and opening-up of China. The city consists of ten districts, of which Futian, Luohu, Nanshan, and Yantian were the first to be included, and are therefore the most developed. Concerning healthcare, Shenzhen has established a two-level healthcare service system in which the community health service centers (CHSCs) providing primary care are configured at the community level, whereas the general hospitals (GHs) that provide comprehensive diagnoses and treatments, including secondary and tertiary care and hospitalization services, serve residents across the city. Generally, GHs are much larger and have a stronger service capacity than CHSCs (Figure 1).
2.2. Data Collection and Processing
2.2.1. Hospital Data and Characteristics
General hospital data were obtained from the Health Commission of Shenzhen, including information such as the facility name, address, floor area, number of doctors, and number of beds. By 2016, Shenzhen harbored 81 general hospitals, which varied greatly in size. Most hospitals are small in scale, have a very limited service area, and represent a very low proportion of medical samples; such hospitals are not representative when analyzing health seeking behavior at the citywide scale. Accordingly, only large-sized hospitals were included in this study, defined based on the number of health seeking trips. The natural breaks method was applied to determine an appropriate threshold between large- and small-sized hospitals, and consequently, 41 large hospitals were selected for analysis. Trips to the selected hospitals accounted for more than 90% of the total identified trips. Each hospital contained a series of attribute information, such as size, level, etc., which will be detailed in the selection of indicators below.
2.2.2. Analysis Units and Demand Data
Basic spatial units (BSUs), which are the finest units for governance at the grassroots level in Shenzhen, were adopted as the analysis units. These data were obtained from the Centre for Spatial Geographic Information of Shenzhen and consisted of 9319 spatial units in total, with an average area of 0.21 km2. Attributes regarding demographics at the BSU level, such as age and education, were also included. BSUs containing no trips were excluded; such units were located on the edge of the built-up area and sparsely populated. The remaining BSUs were merged or divided as necessary to ensure appropriate sample sizes. Theoretically, analysis accuracy increases as the BSU area decreases; however, if the sample size in a BSU is too small, there will be too much randomness in the observations. Consequently, BSUs with more than 1000 trips were divided into multiple parts based on roads and rivers, whereas those having less than 100 trips were merged with adjacent BSUs. Ultimately, 418 valid BSUs were obtained. The locations of these BSUs were represented as the geometrical centroids of the starting points of their contained trips.
2.2.3. LBS Data for Inferring Health Seeking Trips
LBS data for identifying actual health seeking trips were collected from Tencent Inc., which provides a series of popular social media apps such as WeChat and QQ. Each mobile phone having an installed app that uses the location-based service provided by Tencent Inc. acts as a sensor for its holder’s location. According to Tencent’s 2015 annual results report, the monthly active users of WeChat and QQ on smart terminals reached 697 million and 642 million, respectively, which are equivalent values to the total number of smartphone owners in China that year [45]. This data can trace the real-time location of each user at a very fine spatial resolution (about 30 m by 30 m), and thus is competent for inferring user hospital visits and home locations. This study collected LBS data for three months (June to August) in 2015.
3. Methodology
3.1. Research Framework
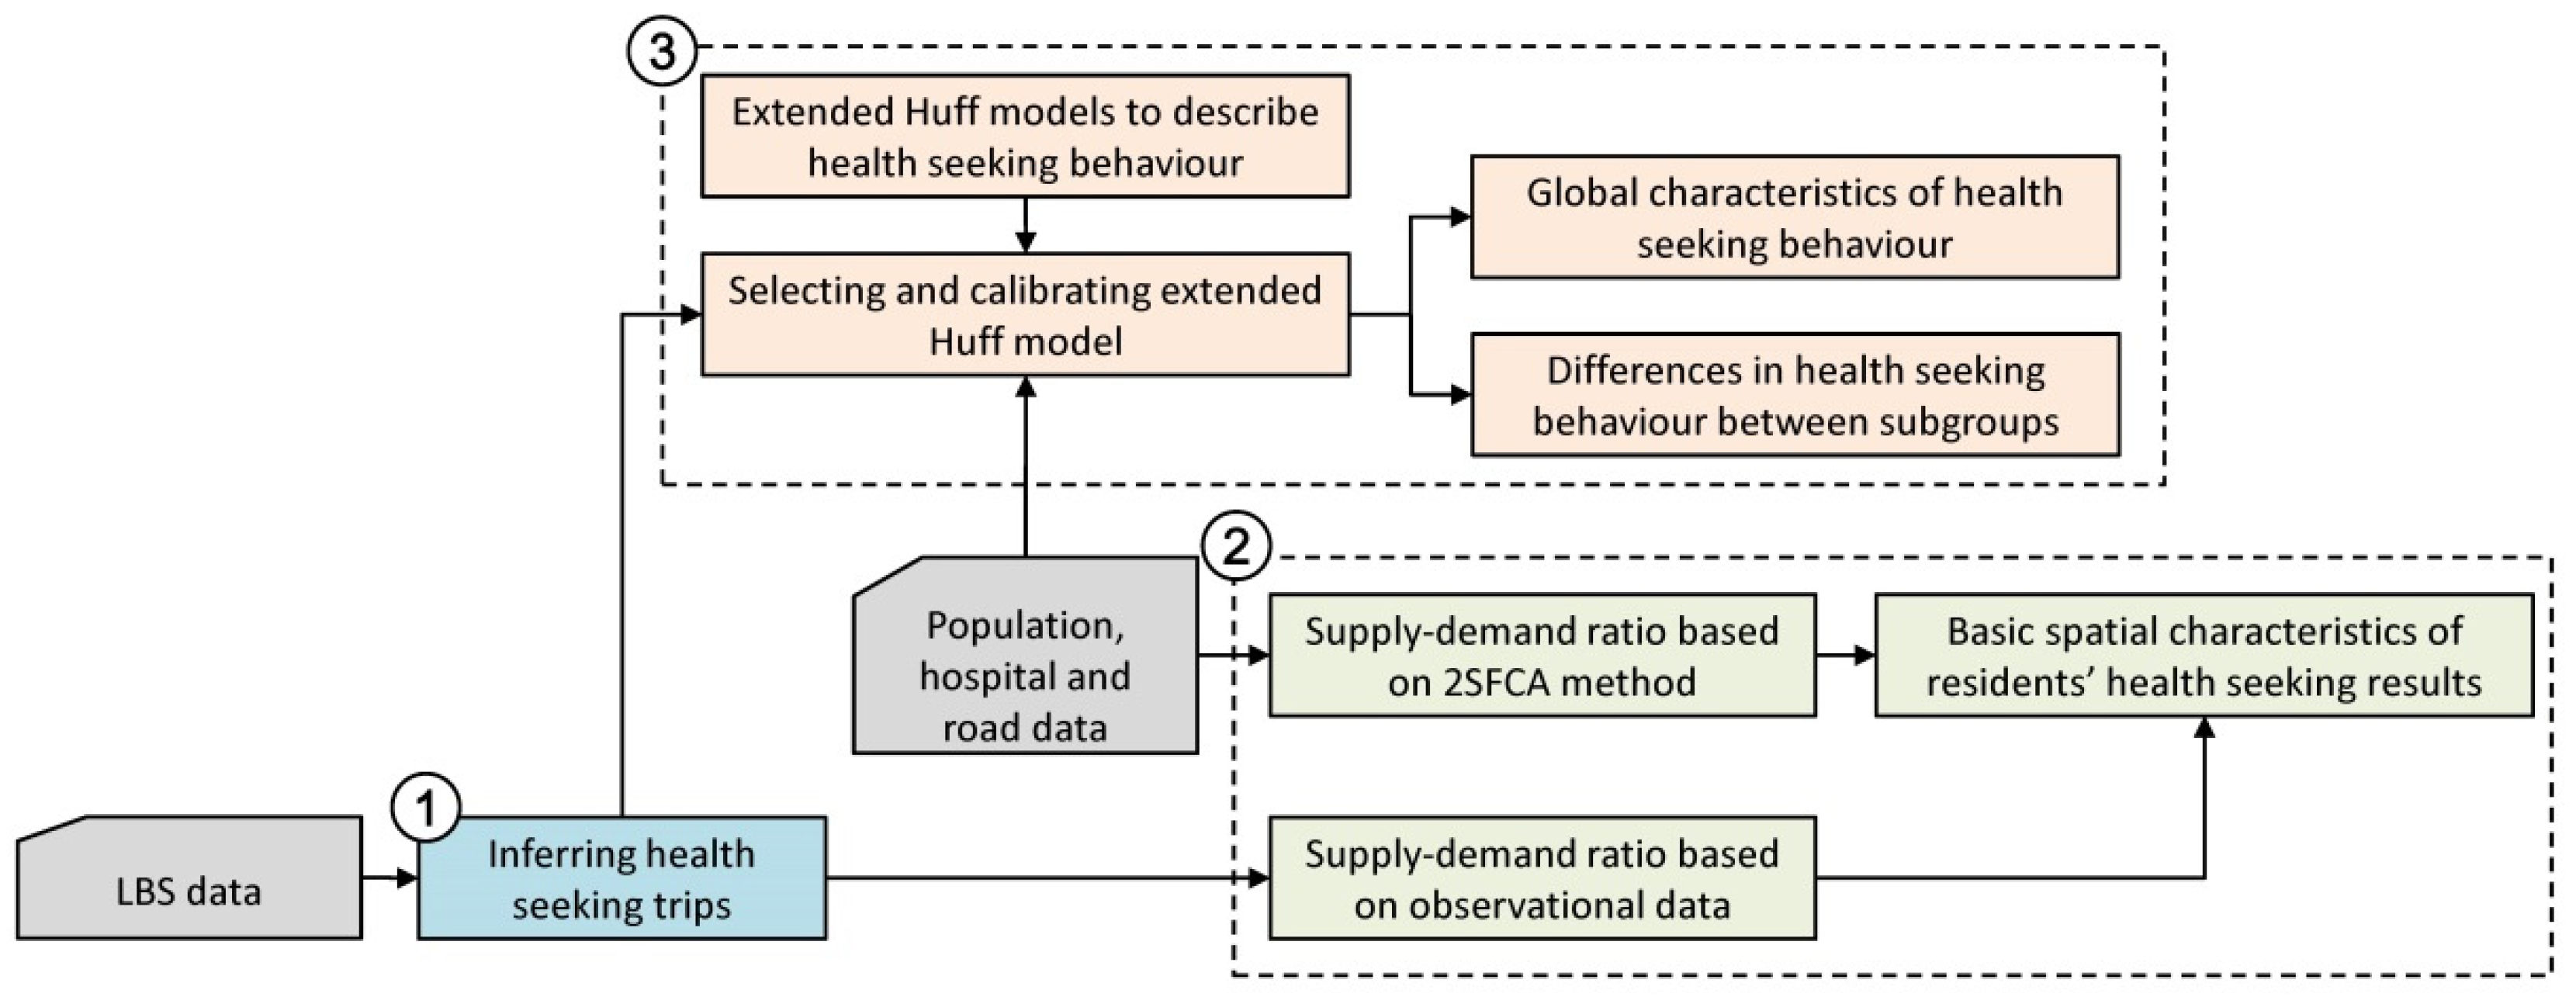
A research framework is first proposed, which contains analyses in three parts (Figure 2).
Firstly, the actual health seeking trips are inferred from LBS data. The method is introduced in Section 3.2.
Secondly, a method for calculating the supply–demand ratio based on observational medical data is proposed, and the basic spatial characteristics of the observed health seeking results are discussed by comparing the results with those of the traditional 2SFCA method.
Thirdly, various forms of extended Huff models are proposed to describe health seeking behavior. Then, these models are selected and parametrically calibrated using observational medical data. Based on the selected model, global and sub-population characteristics of health seeking behavior are discussed in detail.
3.2. Inferring Health Seeking Trips from LBS Data
In this study, residents who had stayed in the hospital for more than one hour were taken as potential medical samples. The repeated visits of a resident in the same hospital were counted as one sample. Therefore, regardless of whether a resident went to the hospital for the first treatment, regular check-up, or hospitalization, it was treated as one sample of health seeking trip. For samples that visit patients in the hospital, if the visit time is less than 1 h, it has been excluded by the stay time indicator. If the visit time exceeds 1 h, it cannot be ruled out. However, there are only 1.4 inpatients out of every 100 outpatients in Shenzhen general hospitals, so the proportion of this part of the sample should be very low. For the sample accompanying children or the elderly (who generally have no smartphones) to the hospital, the medical sample contributed by the accompanying person is equivalent to a sample contributed by the patient himself in this study, which does not affect the sample result. In addition, it is necessary to remove the interference of hospital staff. According to the statistics of Shenzhen Health Commission, the average number of visits to the hospital by Shenzhen residents in 2016 was 6.4 times (about 1.6 times in three months). If the number of visits to the hospital for an observation sample during working hours far exceeds this value, the sample can be considered to be hospital staff. We took 30 working days in three months as the division threshold.
Based on the above analysis, observed health seeking trips can be inferred from LBS data by a three-step procedure:
- Identifying potential users that visited a hospital. If a user was observed to remain within the scope of a hospital for longer than 1 h, he/she was considered a potential visitor of the hospital.
- Identifying the residence locations of potential visitors. For each potential visitor identified in the first step, the corresponding residence was defined as a location at which he/she stayed for longer than 4 h during the nighttime (9 p.m. to 6 a.m. on the next day) for more than 50 days during the three months of the study period. Based on each hospital visitor and the corresponding residence location, a health seeking trip could then be identified.
- Excluding hospital staff. If a visitor went to a hospital for more than 30 times on working days, the visitor was classified as a staff member. Such trips were excluded from the set of identified health seeking trips.
The resulting individual health seeking trips were aggregated into a BSU–hospital trip matrix, which is a key input for calibration of the Huff model. Based on this matrix, the selection probability for each BSU–hospital pair can be estimated as:
where is the number of trips from BSU i to hospital j.
3.3. Measurements of Supply–Demand Ratio Based on Observational Data
The two-step floating catchment area (2SFCA) method is a special form of the classical gravity model, the most widely-used form of which was established and improved by Weilbull (1976) [33]. This model has been applied to measure potential accessibility to diverse types of opportunities such as health services [32], employment [46], parks [47], and evacuation sites [48]. In 2SFCA model, spatial accessibility is quantified using the supply-to-demand ratio indicator, which is calculated as:
where is the accessibility of spatial unit i, is the supply-to-demand ratio of hospital j, is the size of the supply provided by hospital j, is the total population in the spatial grid i, and is a distance decay function that models the interaction between demand and supply. As shown in Equation (2), it is assumed that the interaction between demand and supply can be described by the distance decay function .
In order to observe the basic difference between the healthcare resources obtained by residents in real health seeking situations and the classical model of spatial accessibility, this study proposes an observation-based method for calculating the supply–demand ratio, which replaces the assumptive term with the observed selection probability , i.e., the probability that the population in spatial unit i chooses facility j. The proposed method can likewise be interpreted in a two-step manner. The first step calculates the supply-to-demand ratio based on the observed hospital selection probability, and the second step sums up the supply–demand ratios of all hospitals and obtains the observed accessibility at each spatial unit. The observed supply–demand ratio is calculated as:
where is the probability of hospital j being selected by residents in spatial unit i, which is estimated by Equation (1).
Since the general hospitals in Shenzhen provide unified services to the whole city, there is no need to set a catchment area. In this study, a power function, which is the most commonly used form in related research, was selected as the decay function for potential accessibility analysis.
3.4. The Extended Huff Models for Modeling Health Seeking Behavior
The Huff model was first proposed by D. L. Huff in the 1960s and is a popular model for analysing the service scope of facilities and predicting consumer behavior [49,50]. As this model is suitable for describing the interrelationship between selection probability on the demand side and other factors such as distance and facility scale, it was chosen for describing resident health seeking behavior in this study. The model form is:
where is the probability that consumers at location i select facility j, is the attractiveness of facility j, is the travel distance between i and j, and is the distance decay function.
In general, the definition of the facility attraction and distance decay function can be taken in the form of power function and exponential function form. In the power function form, the facility attractiveness can be expressed as the product of a series of power functions of attractiveness indicators, namely:
where is the h-th attraction variable of facility j, is the sensitivity parameter of the facility attraction to the h-th variable, and H is the total number of facility attractiveness variables. Similarly, the distance decay function based on the power function can be defined as:
where β is the distance impedance coefficient. This formula is also the most commonly used form for describing spatial decay.
In the form of exponential function, facility attractiveness can be expressed as the product of a series of exponential functions of attractiveness indicators, namely:
Similarly, the distance decay function based on the exponential function can be defined as:
Therefore, according to the different forms of facility attraction and distance decay functions, the Huff model can be extended in four forms, and the corresponding linear regression fitting formula can be derived (Table 1).
, , and are the geometric means of , , and respectively, and and are the arithmetic means of and , respectively. In this study, the actual was calculated using Equation (1). Based on the estimated and other observed variables, the linear forms were calibrated using the least squares method to obtain the values of parameters β and .
4. Results
4.1. Patterns of Actual Health Seeking Behavior in Shenzhen
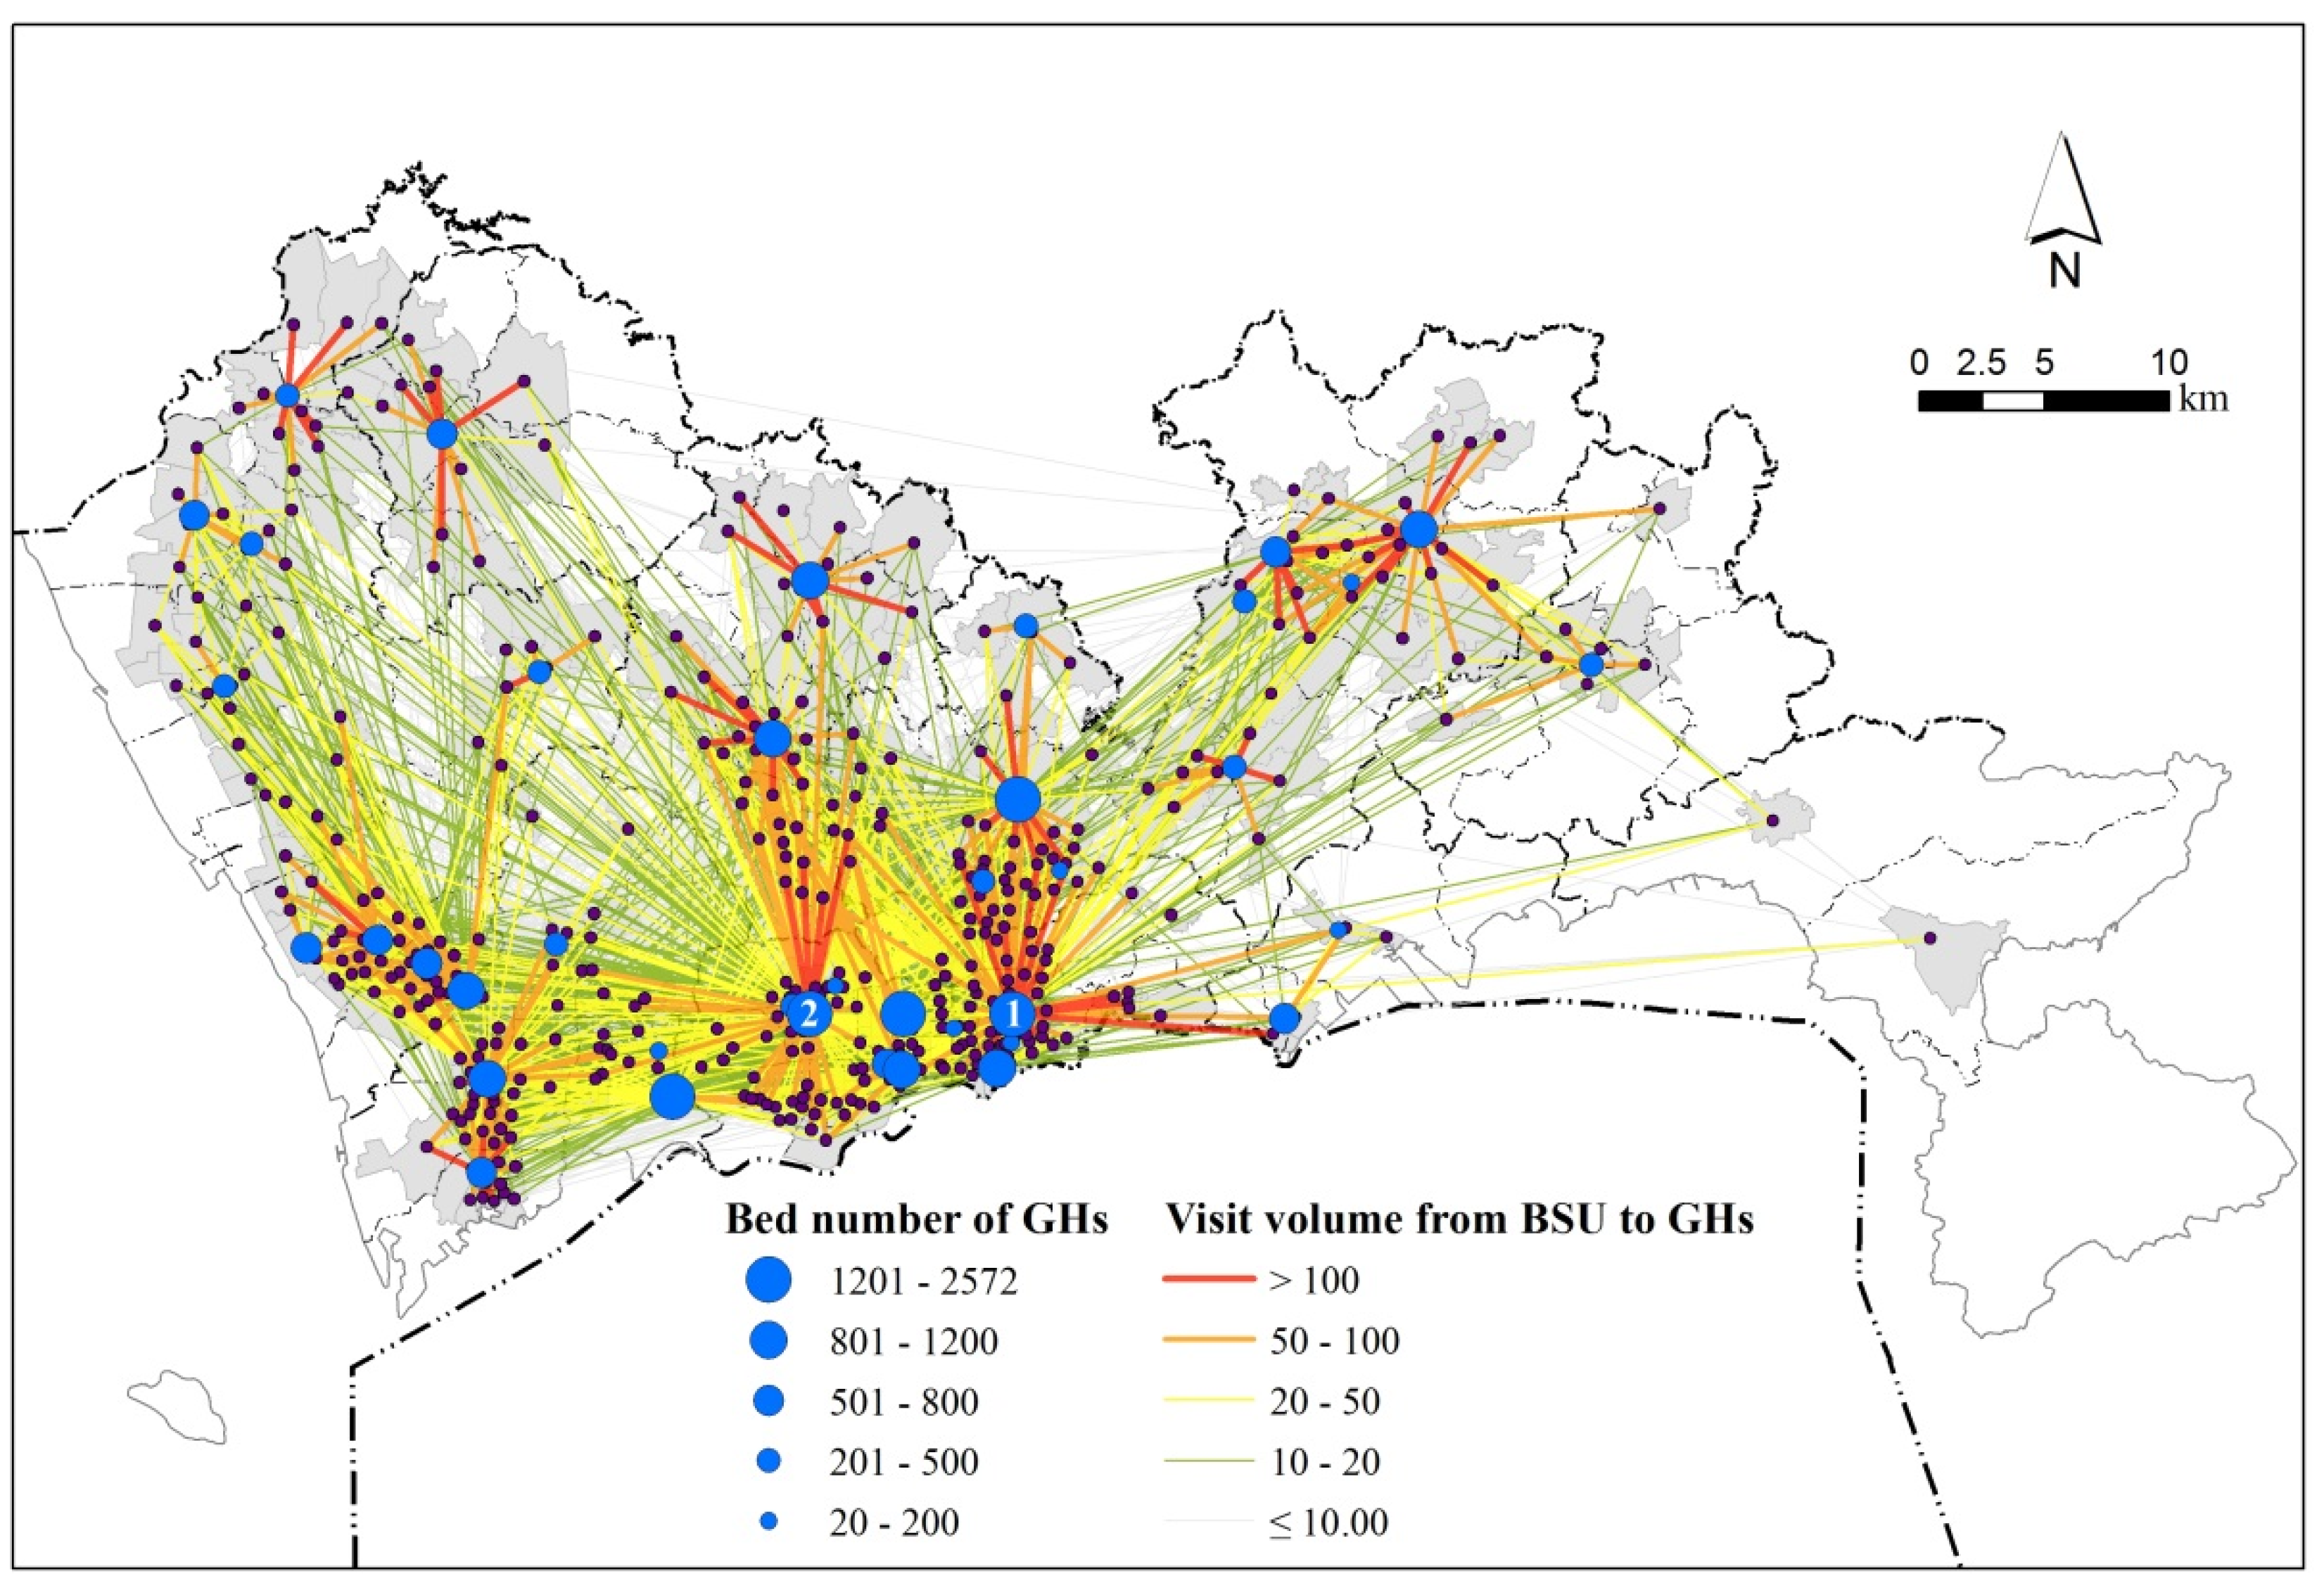
From the LBS data, 95,379 health seeking trips were inferred in total. On average, there were 228 and 2326 health seeking trips observed for each BSU and each hospital, respectively. The distribution of the inferred health seeking trips is shown in Figure 3, which is aggregated at the BSU level. The volume of each line represents the number of health seeking trips from each BSU to a given hospital. It can be observed that there is a localization pattern in the distribution of health seeking behavior in Shenzhen: namely, most health seeking behaviors occur in the area neighboring a hospital. Nevertheless, there is also a considerable proportion of patients seeking health care over long distances. Since relatively high-quality medical resources are mainly concentrated in the central urban area (south of the city), the residents of the central urban area generally choose to seek medical treatment nearby, while residents of the peripheral urban areas show obvious dualistic characteristics, most of them choose the nearby hospital, and the rest choose hospitals in the central urban area. From the perspective of hospitals, Shenzhen People’s Hospital (marked No. 1 in Figure 3) and Peking University Shenzhen Hospital (marked No. 2 in Figure 3) are far more attractive than other hospitals, showing that residents’ medical choices are obviously concentrated.
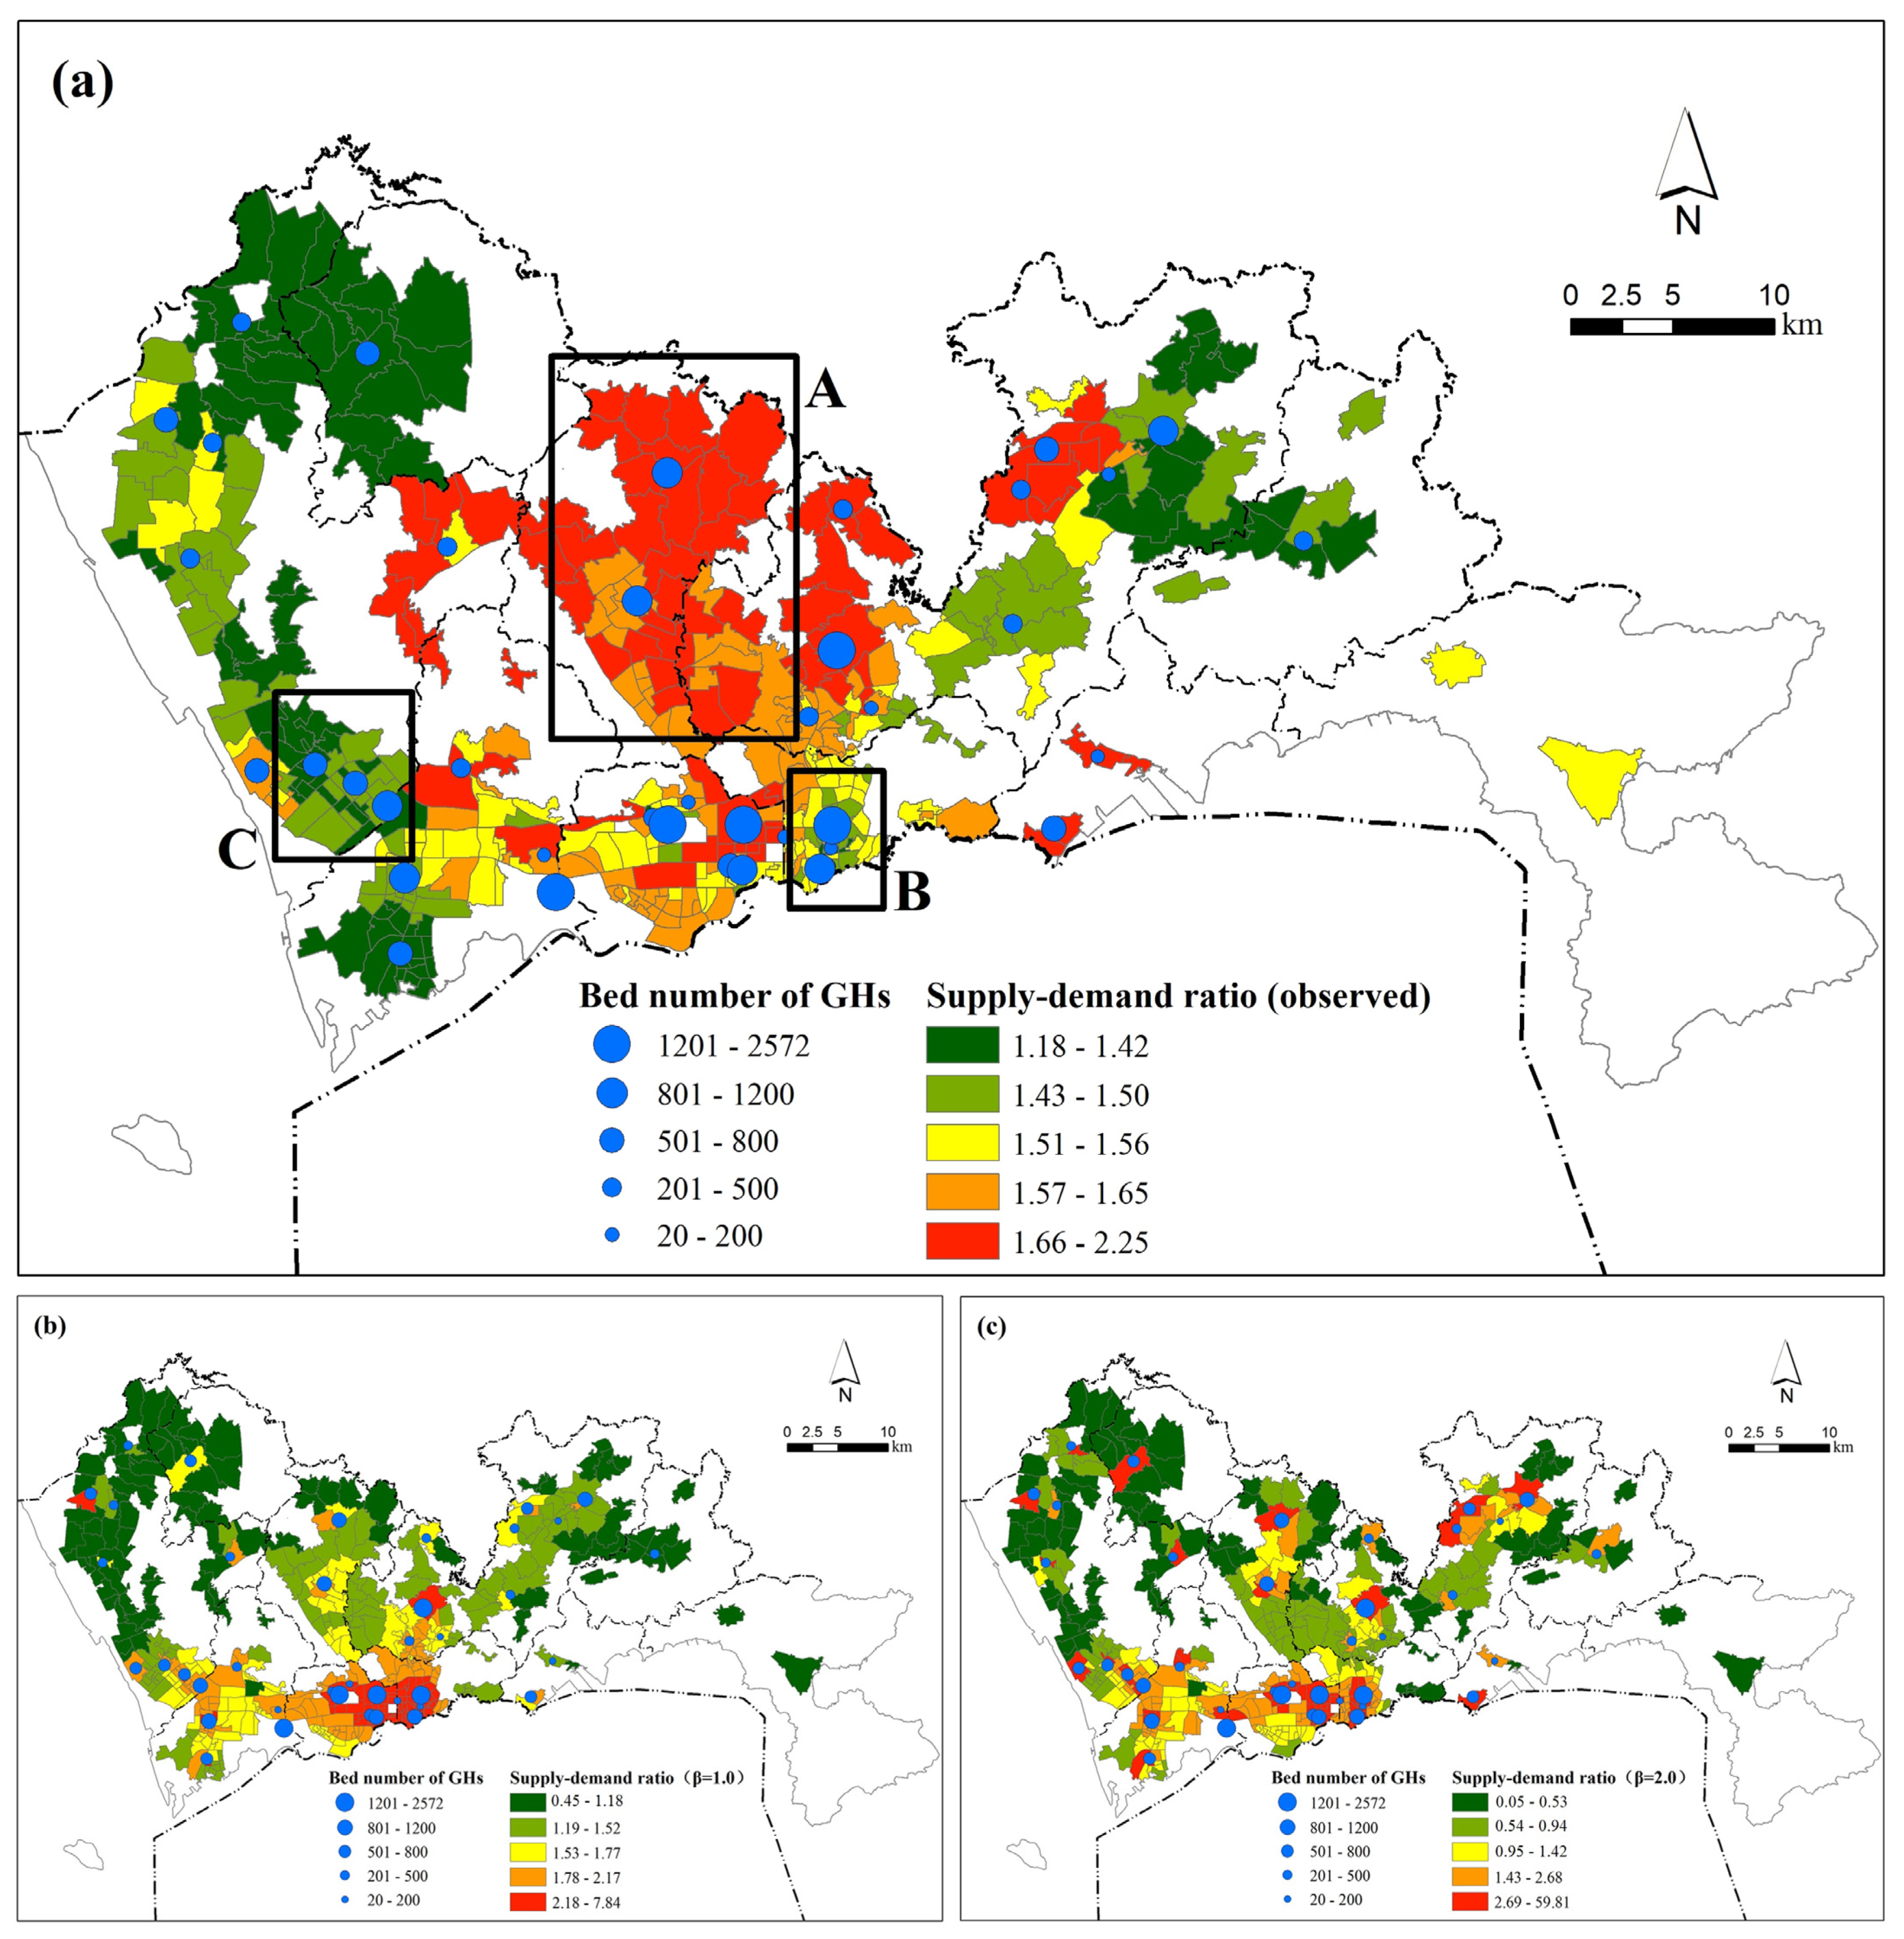
We used Equations (2) and (3) to calculate the supply–demand ratio based on the classical spatial accessibility analysis model and observation data, respectively, and then to conduct a comparative analysis. The classical spatial accessibility analysis model uses the commonly used power decay function, and distances were determined based on the road network. Figure 4 illustrates significant differences in the distribution of supply–demand ratio between observation and classical distance decay assumption. Figure 4a shows the observed supply–demand ratio, while Figure 4b,c depict the supply–demand ratio when the decay coefficient (β) is taken as 1.0 and 2.0, respectively.
As can be seen from Table 2, for the 418 BSUs, the standard deviation of the supply–demand ratio calculated by the classical accessibility model increases rapidly with the increase of the spatial decay coefficient (β), indicating that the enhancement of spatial impedance will lead to a rapid rise in the inequality of health care services. In the usual studies on spatial accessibility, the distance decay coefficient is generally taken as 1.0–2.0 [51]. Therefore, the actual health seeking behavior is quite different from the results of most studies. In contrast, the supply–demand ratio based on observation shows a very “average” trend, with a supply–demand ratio standard deviation of only 0.159, indicating that residents will dynamically adjust their behavior according to the distribution of medical resources, making the pressure on medical services in the peripheral urban areas ease, while the pressure on medical services in the city center increases.
According to the classical spatial accessibility analysis model, the distribution of supply–demand ratio exhibits a radial pattern, significantly decreasing with distance from large-sized hospitals. When the distance impedance coefficient is increased, the imbalance in accessibility becomes more obvious. However, the distribution of the observed supply–demand ratio shows a distinctly different pattern (Figure 4a). Take three typical regions A, B, and C as examples. Area A is located in the north of Futian-Luohu center, with a dense population and relatively few hospitals. However, under the real health seeking scenario, the supply–demand ratio in Area A is generally at the highest level in the city. Through the analysis, it can be seen that a considerable number of residents in area A choose to go to the city center for medical treatment, which makes the local medical resources relatively abundant. In contrast, Area B and Area C have a relatively high level of supply–demand ratio in the analysis results of the classic accessibility analysis model, but due to a large number of residents from other areas coming for medical treatment, the actual supply–demand ratio level in the two areas is relatively low.
In conclusion, under the influence of residents’ health seeking behavior, the difference in supply–demand ratio among regions is greatly reduced compared with the result of the classical model. Residents in peripheral urban areas pay higher commuting costs to share medical resources in the central urban area, resulting in a lower supply–demand ratio in some areas of central urban areas than in surrounding urban areas. The above results show that residents’ health seeking behavior cannot be explained by distance alone. To accurately assess the true spatial accessibility, factors other than distance must be considered.
4.2. Modeling Health Seeking Behavior by the Extended Huff Model
To establish a Huff model describing the probability of medical selection, it is first necessary to select a quantitative index of hospital attractiveness. We quantify the attractiveness in terms of scale, service quality, and popularity. In terms of hospital scale, there are generally three indicators to choose from, such as hospital building area, number of beds, and number of doctors. Since the correlation coefficient between the number of beds and the number of doctors is as high as 0.886, considering the direct participation of doctors in diagnosis and treatment services, we choose the number of doctors (DN) and the building area (BA) of the hospital as the quantitative indicators of the hospital scale. In terms of service quality, the hospital satisfaction survey score (SS) carried out by Shenzhen Health Commission every year is used as an indicator. SS is calculated by collecting the satisfaction scores of hospital patients with the doctor’s diagnosis and treatment results. The higher the score, the better the doctor’s diagnosis and treatment level. In addition, due to the scarcity of land resources, Shenzhen hospitals generally have the problem of excessive construction strength, so the floor area ratio (FA) is selected as the hospital’s environmental quality indicator. For hospital popularity, the visit times to Baidu Encyclopedia entries (VT) and the distance of the hospital to the nearest urban center (DC) are chosen as indicators of network popularity and real popularity, respectively. In summary, a total of six hospital attractiveness indicators were selected. These indicators were brought into the four models in Table 1 along with the distance indicator (DIS), and the R2 values for the four models were 0.648, 0.613, 0.703, and 0.553, respectively. Model 3 has the best description of health seeking behavior, indicating that the distance decay of the probability of medical visit follows the power function, while the relationship between hospital attractiveness and medical visiting is more in line with the exponential function. The model linear regression equation is:
Table 3 gives the global regression results of the extended Huff model. All the variables have high statistical significance. The negative coefficient for DIS indicates that the probability of residents choosing a hospital decreases when their distance from it increases. This standardized coefficient also exhibited the largest absolute value (0.5753), indicating that of the examined factors, distance has the strongest influence. In previous studies, reported distance decay coefficients (β) commonly range from 0.9 to 2.29, compared to which the distance decay effect observed here is relatively weak (only 1.0551). In other words, residents in Shenzhen tend to travel long distances to seek healthcare services, possibly due to the unbalanced configuration of healthcare resources.
The standardized coefficients of BA and DN were 0.0956 and 0.2802, respectively, indicating that hospital size in terms of building area and doctor number alike has a consistent significant and positive influence on hospital attractiveness, with doctor number being a stronger influence than building area. SS and FR were positively and negatively correlated with the probability of healthcare selection, respectively, and the significance of SS was higher, indicating that patients’ satisfaction with hospital services has a direct impact on the selection of hospital, while a high floor area ratio does affect patients’ experience, thus bringing some negative impact on healthcare selection. The absolute value of the standardized coefficient of VT is second only to DIS and DN, while the role of DC is relatively small, indicating that patients learn more about the basic information of hospitals through the Internet and other means, and hospitals that are frequently searched on the Internet have higher popularity.
In general, in terms of the attributes of the hospital itself, the influence of each indicator on residents’ health seeking behavior is, in descending order, DIS, DN, VT, BA, SS, DC, and FA.
4.3. Differences in Health Seeking Behavior between Subgroups
The above model analyzes residents’ general health seeking behavior from the supply side. In order to consider demand-side factors, referring to research in other developing countries [14,52], residents are divided into different groups according to age, income, and education level, and the behavioral differences of different subgroups are analyzed. People belonging to different subgroups tend to concentrate in different communities; for example, low-income people in developing countries usually gather in urban villages. Hence, the observed samples in each BSU can be classified according to socio-economic attributes. In terms of age, the average age of the population within each BSU is used as a population segmentation indicator. In terms of income, since fine-scale income data are not available, this study approximates income level by housing type. In Shenzhen, people living in urban villages (informal housing) account for approximately half of the total population. Such informal housing has relatively low rental prices that are about 30–50% of those of formal housing. A large proportion of the city’s low-income population lives in these areas [53,54,55]. Therefore, the proportion of the population living in non-urban villages within the BSU is selected as the population segmentation indicator. In terms of education level, except for the population of compulsory education and those who have not reached the school age, the proportions of Shenzhen’s population have achieved an undergraduate degree or higher education level, associate degree, high school education, and junior high school and below are 5.83%, 13.99%, 22.24%, and 57.94%, respectively. We selected the proportion of the population with high school education or above in BSU as the population classification index.
The average age of the population, the proportion of the population living in non-urban villages, and the proportion of the population with a high school education or above in the 418 BSUs were counted separately. BSUs with values greater than the upper quartile were classified as the high-value group, and BSUs with values less than the lower quartile were classified as the low-value group. To enhance the difference of contrast, BSU near the median was not included in the comparative analysis. Six subgroup-specific regressions were conducted, one for each age, income or education level. These analyses yielded R2 values between 0.640 and 0.744, and the coefficients are listed in Table 4.
From the regression results, it can be seen that there are significant differences in the health seeking behavior among different subgroups, which is mainly reflected in the sensitivity to DIS, SS, and FR indicators. In terms of age, compared with the older group, the younger group is more sensitive to distance, showing a stronger preference for the nearest hospital. The older group is relatively insensitive to distance, but more sensitive to hospital satisfaction scores, indicating that older residents are more willing to spend higher commuting costs to obtain better medical services, which is also consistent with the health needs of the older group. In terms of income, compared with the high-income group, the low-income group is more sensitive to distance, indicating that they are strongly limited by commuting costs and tend to seek medical treatment nearby. The high-income group is less sensitive to distance, which may be related to the higher rate of private car ownership and less consideration of commuting costs. In addition, high-income people show a strong sensitivity to hospital satisfaction score and floor area ratio, indicating that they pay more attention to hospital service quality and environmental quality. In terms of education, compared with the highly educated group, the low educated group is more sensitive to distance and is completely insensitive to the score of hospital service satisfaction, indicating that they are limited by commuting factors and pay less attention to the quality of hospitals, which may be related to their lack of channels to obtain hospital quality information. The highly educated group is less limited by distance. Among the six groups, they pay most attention to the quality characteristics such as hospital satisfaction score and floor area ratio, indicating that they have high requirements for hospital service quality.
Briefly speaking, high-income and high-education subgroups have higher flexibility in hospital selection due to their better mobility. As a result, they pay more attention to hospital quality. By contrast, low-income and low-education subgroups face greater difficulties in mobility. Consequently, they tend to obtain more healthcare services from closer hospitals but have fewer choices concerning hospital quality. These differences reveal inequity in hospital utilization among subgroups with different income and education levels. The influence of age on health seeking behavior is similar to that of income and education.
5. Discussion
5.1. Differences between Observed Health Seeking Behavior and the Classical Distance Decay Hypothesis
This study proposes a method for measuring the observed supply–demand ratio of hospitals. As illustrated by the case study of Shenzhen, the proposed method is easy to interpret and operate. It is based on the widely-used 2SFCA framework and replaces the hypothetical distance decay function with an observed hospital selection probability matrix. The major difference between the two approaches is that traditional 2SFCA methods model the interaction between demand and supply based on the hypothetical distance decay function, while the proposed method models the interaction based on actual health seeking behavior.
According to the analysis results, the spatial distributions of the supply–demand ratio based on observation and the classical accessibility model are quite different. This indicates that classical accessibility measures might generate biased estimations of hospital accessibility. In this study, the classical supply–demand ratio showed a monocentric pattern across the city, a pattern that is quite common in studies measuring spatial accessibility at the city scale. However, the pattern of the observed supply–demand ratio differed considerably, with some peripheral areas (e.g., Longhua District in Shenzhen) having higher accessibility. The possible explanation is that residents living in those areas might prefer to obtain high-quality healthcare services at hospitals in the central city. As a result, competition for healthcare services in those areas becomes weaker and the actual accessibility enjoyed by local residents is elevated. An important implication is that given the unbalanced distribution of healthcare resources (especially high-quality resources), the observed accessibility may be reconstructed in terms of long-distance health seeking behavior. In this case, resident distance to hospitals is no longer the only determinant of the interaction between demand and supply. Indeed, actual health seeking behavior should be influenced by more variables. These findings highlight the need to incorporate actual health seeking behavior in evaluating the spatial pattern of health services.
5.2. Health Seeking Behavior of Different Subgroups
The global regression of the proposed extended Huff model revealed general characteristics of residents’ health seeking behaviors. For example, the overall probability of visiting a hospital decreases with distance, but increases with hospital size, service quality, and popularity. This study further investigates the differences in health seeking behavior between subgroups with different ages, incomes, and education levels. Generally, high-age, high-income, and high-education subgroups are advantaged in mobility due to higher rates of private car ownership and greater ability to pay. As such, they tend to be less restricted by distance when seeking healthcare services and are able to enjoy better accessibility to hospitals and higher-quality services. In contrast, low-age, low-income, and low-education subgroups are more substantially influenced by distance and tend to prefer closer hospitals. In addition to distance, the quality of health services is also a pivotal determinant of health seeking behavior among these subgroups. Generally, high-age, high-income, and high-education subgroups pay more attention to the service quality of the hospital when they choose a hospital. In some related studies, the spatial characteristics of residents’ medical choices were also discussed [56,57], but these studies mainly focused on the distance decay effect, with little attention being paid to the characteristics of hospitals. In addition, these studies did not propose a model to effectively describe health seeking behavior.
In light of the above, the main contributions of this study comprise two aspects. First, this paper proposes a complete framework for describing health seeking behavior based on the Huff model. The model was calibrated using observed healthcare data, and it performed satisfactorily. Under this framework, given the spatial distributions of population and hospitals, the flow of residents to hospitals within each spatial unit can be effectively predicted, and thus the effectiveness of hospital services can be evaluated. This framework provides an effective tool for optimizing healthcare facilities based on human behavior. Second, the current study provides new evidence regarding the determinants of health seeking behavior and the differences between various subgroups. According to the results of the analysis, when allocating medical resources, the government should give more consideration to the distance limitation effect characteristic of relatively disadvantaged groups and allocate more large and high-quality hospitals to peripheral areas to promote equalization of medical services and reduce overall medical commuting distance.
5.3. Advantages and Limitations of This Work
In terms of data, this study inferred large-sample health seeking trips using LBS data. Compared to the taxi trajectory data and smart card data employed in existing studies, LBS data have finer spatial resolution and are representative of a broader population, and sample bias due to the choice of transportation mode is avoided. In terms of methods, this study puts forward a complete description framework of health seeking behavior, and reveals the basic health seeking characteristics of various kinds of residents in Shenzhen.
There are also some limitations to the current study. First, this study used road network distance as the measure of travel cost. Future studies should strive to improve this measure by estimating travel times using an online map navigation service. Second, with respect to resident characteristics, only age, education, and income levels were considered. Future studies should pay more attention to the influence of other factors such as occupation, travel preference, and so on. Third, future studies can make efforts to compare the health seeking behaviors of residents on different weekdays and during different months of the year.
6. Conclusions
In this study, LBS data with higher population coverage and spatial resolution were used to analyze residents’ health seeking behavior. An observed supply–demand ratio calculation method is proposed to analyze the spatial pattern of hospital services under realistic health seeking scenarios. The result indicates that the traditional spatial accessibility measures might generate biased estimations due to overlooking actual health seeking behavior. In particular, the observed supply–demand ratio reflected less inequality than indicated by traditional accessibility. This finding raises the implication that residents tend to overcome inequality in medical resource allocation through seeking long-distance medical treatment.
By extending huff model, we establish a basic framework to describe the probability of residents’ medical choices. Four extended forms of huff model are proposed, and the models are verified and selected by using the observation data. The global regression revealed that residents’ health seeking behaviors are generally negatively correlated with distance to hospitals, but positively correlated with hospital scale, service quality, and popularity. However, the specific features of health seeking behavior differ among subgroups with different ages, incomes, and education levels. High-age, high-income, and high-education subgroups are less sensitive to distance, but prefer high-quality health services, while low-education and low-income subgroups are more substantially influenced by the distance factor due to constrained mobility and less sensitive to service quality factors.
In brief, this study establishes a complete analytical framework, from inferring health seeking behavior from LBS data to measuring observed accessibility to hospitals and finally modeling determinants of health seeking behavior and the differences between demographic subgroups. This framework can be applied to other contexts and also to other types of public service facilities. The findings highlight the need to take into account actual health seeking behavior when measuring spatial accessibility and planning healthcare services. Overall, this study can help strengthen our understanding of healthcare accessibility, health seeking behavior, and healthcare equality, which are fundamental for planning and policymaking related to healthcare services.
Author Contributions
Conceptualization, Wei Hu; methodology, Wei Hu and Lin Li; validation, Wei Hu and Mo Su; formal analysis, Wei Hu; investigation, Wei Hu; data curation, Wei Hu; writing—original draft preparation, Wei Hu; visualization, Mo Su; supervision, Lin Li; project administration, Lin Li; funding acquisition, Lin Li. All authors have read and agreed to the published version of the manuscript.
Funding
This research was funded by the National Key R&D Program of China, grant number 2017YFB0503701.
Institutional Review Board Statement
Not applicable.
Informed Consent Statement
Not applicable.
Data Availability Statement
Not applicable.
Acknowledgments
The authors would like to thank the editors and the anonymous reviewers for their valuable comments and suggestions.
Conflicts of Interest
The authors declare no conflict of interest.
References
- Dadashpoor, H.; Rostami, F.; Alizadeh, B. Is inequality in the distribution of urban facilities inequitable? Exploring a method for identifying spatial inequity in an Iranian city. Cities 2016, 52, 159–172. [Google Scholar] [CrossRef]
- Wang, H.H.X.; Wang, J.J. Effects of community-based general practitioners-led care for 12,864 patients with hypertension: Study of cardiovascular risk intervention—hypertension (SCRI-HTN) in China. Eur. Heart J. 2012, 33, 762–763. [Google Scholar]
- Cutler, D.M.; Lleras-Muney, A.; Vogl, T. Socioeconomic status and health: Dimensions and mechanisms. In The Oxford Handbook of Health Economics; Oxford University Press: New York, NY, USA, 2011. [Google Scholar]
- Alemdar, K.D.; Kaya, Ö.; Çodur, M.Y.; Campisi, T.; Tesoriere, G. Accessibility of Vaccination Centers in COVID-19 Outbreak Control: A GIS-Based Multi-Criteria Decision Making Approach. ISPRS Int. J. Geo-Inf. 2021, 10, 708. [Google Scholar] [CrossRef]
- Guida, C.; Carpentieri, G. Quality of life in the urban environment and primary health services for the elderly during the COVID-19 pandemic: An application to the city of Milan (Italy). Cities 2021, 110, 103038. [Google Scholar] [CrossRef] [PubMed]
- Ghorbanzadeh, M.; Kim, K.; Ozguven, E.E.; Horner, M.W. Spatial accessibility assessment of COVID-19 patients to healthcare facilities: A case study of Florida. Travel Behav. Soc. 2021, 24, 95–101. [Google Scholar] [CrossRef]
- Bakar, A.A.; Samsudin, S. Determinants of Health Care Seeking Behavior: Does Insurance Ownership Matters? Int. J. Econ. Financ. Issues 2016, 6, 6–11. [Google Scholar]
- Busato, A.; Kunzi, B. Primary care physician supply and other key determinants of health care utilisation: The case of Switzerland. BMC Health Serv. Res. 2008, 8, 8. [Google Scholar] [CrossRef] [Green Version]
- Hansen, P.M.; Peters, D.H.; Edward, A.; Gupta, S.; Arur, A.; Niayesh, H.; Burnham, G. Determinants of primary care service quality in Afghanistan. Int. J. Qual. Health Care 2008, 20, 375–383. [Google Scholar] [CrossRef]
- O’Donnell, O. Access to health care in developing countries: Breaking down demand side barriers. Cad. De Saúde Pública 2007, 23, 2820–2834. [Google Scholar] [CrossRef] [Green Version]
- Wang, F.; Luo, W. Assessing spatial and nonspatial factors for healthcare access: Towards an integrated approach to defining health professional shortage areas. Health Place 2005, 11, 131–146. [Google Scholar] [CrossRef]
- Andersen, R. A behavioral model of families’ use of health services. J. Hum. Resour. 1968, 7, 125. [Google Scholar]
- Grossman, M. On the concept of health capital and the demand for health. J. Polit. Econ. 1972, 80, 223–255. [Google Scholar] [CrossRef] [Green Version]
- Patra, M.; Bandyopadhyay, S. Health seeking behaviour and its determinants in urban areas of developing countries: A primary survey in Kolkata city, India. Int. J. Health Plann. Mgmt. 2020, 35, 1438–1452. [Google Scholar] [CrossRef] [PubMed]
- Podder, D.; Dasgupta, A.; Dobe, M.; Paul, B.; Bandyopadhyay, L.; Pal, A. Health Care-Seeking Behavior in a Scheduled Tribe Community in India: A Mixed-Methods Research Using the Framework of Andersen’s Behavioral Model. Asia-Pac. J. Public. Health 2021, 33, 360–377. [Google Scholar] [CrossRef]
- Saha, A.K.; Daw, G. Attitude of Patients towards Public Healthcare Services in Kolkata Metropolitan Area: An Empirical Approach. J. Health Manag. 2016, 18, 401–409. [Google Scholar] [CrossRef]
- Varkevisser, M.; Vander Geest, S. Why do patients bypass the nearest hospital? Eur. J. Health Econ. 2007, 8, 287–295. [Google Scholar] [CrossRef] [Green Version]
- Yang, D.; Goerge, R.; Mullner, R. Comparing GIS-Based Methods of Measuring Spatial Accessibility to Health Services. J. Med. Syst. 2006, 30, 23–32. [Google Scholar] [CrossRef]
- Zhang, X.; Lu, H.; Holt, J.B. Modeling spatial accessibility to parks: A national study. Int. J. Health Geogr. 2011, 10, 31. [Google Scholar] [CrossRef] [Green Version]
- Wang, S.; Wang, M.; Liu, Y. Access to urban parks: Comparing spatial accessibility measures using three GIS-based approaches. Comput. Environ. Urban Syst. 2021, 90, 101713. [Google Scholar] [CrossRef]
- Wang, F.H. Measurement, Optimization, and Impact of Health Care Accessibility: A Methodological Review. Ann. Assoc. Am. Geogr. 2012, 102, 1104–1112. [Google Scholar] [CrossRef] [Green Version]
- Delamater, P.L. Spatial accessibility in suboptimally configured health care systems: A modified two-step floating catchment area (M2SFCA) metric. Health Place 2013, 24, 30–43. [Google Scholar] [CrossRef] [PubMed]
- Luo, J. Integrating the Huff Model and Floating Catchment Area Methods to Analyze Spatial Access to Healthcare Services. Trans. GIS 2014, 18, 436–448. [Google Scholar] [CrossRef]
- Jamtsho, S.; Corner, R.; Dewan, A. Spatio-Temporal Analysis of Spatial Accessibility to Primary Health Care in Bhutan. ISPRS Int. J. Geo-Inf. 2015, 4, 1584–1604. [Google Scholar] [CrossRef] [Green Version]
- Luo, W.; Whippo, T. Variable catchment sizes for the two-step floating catchment area (2SFCA) method. Health Place 2012, 18, 789–795. [Google Scholar] [CrossRef]
- McGrail, M.R.; Humphreys, J.S. Measuring spatial accessibility to primary health care services: Utilising dynamic catchment sizes. Appl. Geogr. 2014, 54, 182–188. [Google Scholar] [CrossRef]
- Tao, Z.L.; Cheng, Y.; Dai, T.Q. Measuring spatial accessibility to residential care facilities in Beijing. Prog. Geogr. 2014, 33, 616–624. [Google Scholar]
- Wan, N.; Zou, B.; Sternberg, T. A three-step floating catchment area method for analyzing spatial access to health services. Int. J. Geogr. Inf. Sci. 2012, 26, 1073–1089. [Google Scholar] [CrossRef]
- Zhou, X.; Yu, Z.; Yuan, L.; Wang, L.; Wu, C. Measuring Accessibility of Healthcare Facilities for Populations with Multiple Transportation Modes Considering Residential Transportation Mode Choice. ISPRS Int. J. Geo-Inf. 2020, 9, 394. [Google Scholar] [CrossRef]
- Ladu, M.; Milesi, A.; Fancello, G.; Balletto, G.; Borruso, G. Urban enclaves and accessibility. The role of walkability in sustainable urban mobility planning. In Proceedings of the 2022 1st Conference on Future Challenges in Sustainable Urban Planning & Territorial Management, Online, 17–19 January 2022. [Google Scholar]
- Balletto, G.; Ladu, M.; Milesi, A.; Campisi, T.; Borruso, G. Walkability and city users. Critical analysis of opportunities and risks. In Proceedings of the 2022 1st Conference on Future Challenges in Sustainable Urban Planning & Territorial Management, Online, 17–19 January 2022. [Google Scholar]
- Joseph, A.E.; Bantock, P.R. Measuring potential physical accessibility to general practitioners in rural areas: A method and case study. Soc. Sci. Med. 1982, 16, 85–90. [Google Scholar] [CrossRef]
- Weibull, J.W. An Axiomatic Approach to the Measurement of Accessibility. Reg. Sci. Urban Econ. 1976, 6, 357–379. [Google Scholar] [CrossRef]
- Neutens, T. Accessibility, equity and health care: Review and research directions for transport geographers. J. Transp. Geogr. 2015, 43, 14–27. [Google Scholar] [CrossRef]
- Pan, X.; Kwan, M.; Yang, L.; Zhou, S.; Zuo, Z.; Wan, B. Evaluating the Accessibility of Healthcare Facilities Using an Integrated Catchment Area Approach. Int. J. Environ. Res. Public Health 2018, 15, 2051. [Google Scholar] [CrossRef] [PubMed] [Green Version]
- Shortt, N.K.; Moore, A.; Coombes, M.; Wymer, C. Defining regions for locality health care planning: A multidimensional approach. Soc. Sci. Med. 2005, 60, 2715–2727. [Google Scholar] [CrossRef]
- Du, F.; Mao, L.; Wang, J.; Jin, H. Inferring transit-based health seeking patterns from smart card data – A case study in Beijing, China. Health Place 2020, 65, 102405. [Google Scholar] [CrossRef] [PubMed]
- Hou, X.; Gao, S.; Li, Q.; Kang, Y.; Chen, N.; Chen, K.; Rao, J.; Ellenberg, J.S.; Patz, J.A. Intracounty modeling of COVID-19 infection with human mobility: Assessing spatial heterogeneity with business traffic, age, and race. Proc. Natl. Acad. Sci. USA 2021, 118, e2020524118. [Google Scholar] [CrossRef] [PubMed]
- Schläpfer, M.; Dong, L.; O’Keeffe, K.P.; Santi, P.; Szell, M.; Salat, H.; Anklesaria, S.; Vazifeh, M.; Ratti, C.; West, G.B. The universal visitation law of human mobility. Nature 2021, 593, 522–527. [Google Scholar] [CrossRef]
- Zhai, Y.; Wu, H.; Fan, H.; Wang, D. Using mobile signaling data to exam urban park service radius in Shanghai: Methods and limitations. Comput. Environ. Urban Syst. 2018, 71, 27–40. [Google Scholar] [CrossRef]
- Gao, J.; Yang, X.; Tang, L.; Ren, C.; Zhang, X.; Li, Q. Understanding urban hospital bypass behaviour based on big trace data. Cities 2020, 103, 102739. [Google Scholar] [CrossRef]
- Gong, S.; Gao, Y.; Zhang, F.; Mu, L.; Kang, C.; Liu, Y. Evaluating healthcare resource inequality in Beijing, China based on an improved spatial accessibility measurement. Trans. GIS 2021, 25, 1504–1521. [Google Scholar] [CrossRef]
- Liu, X.; Lin, Z.; Huang, J.; Gao, H.; Shi, W. Evaluating the Inequality of Medical Service Accessibility Using Smart Card Data. Int. J. Environ. Res. Public Health 2021, 18, 2711. [Google Scholar] [CrossRef]
- Shenzhen Statistics Bureau. Shenzhen Statistical Yearbook 2017; China Statistics Press: Beijing, China, 2017.
- Tencent Announces 2015 Fourth Quarter and Annual Results. Available online: https://www.tencent.com/en-us/investors/financial-news.html (accessed on 20 January 2022).
- Wang, F. Explaining Intraurban Variations of Commuting by Job Proximity and Workers’ Characteristics. Environ. Plan. B Plan. Des. 2001, 28, 169–182. [Google Scholar] [CrossRef]
- Wu, C.; Ye, X.; Du, Q.; Luo, P. Spatial effects of accessibility to parks on housing prices in Shenzhen, China. Habitat Int. 2017, 63, 45–54. [Google Scholar] [CrossRef]
- Gong, J.; Liu, Y.; Liu, Y.; Huang, P.; Li, J. Evaluating the Evacuation and Rescue Capabilities of Urban Open Space from a Land Use Perspective: A Case Study in Wuhan, China. ISPRS Int. J. Geo-Inf. 2017, 6, 227. [Google Scholar] [CrossRef] [Green Version]
- Huff, D.L. A probability analysis of shopping center trading areas. Land Econ. 1963, 39, 81–90. [Google Scholar] [CrossRef]
- Huff, D.L. Defining and estimating a trade area. J. Mark. 1964, 28, 34. [Google Scholar] [CrossRef]
- Tao, Z.; Cheng, Y.; Zheng, Q.; Li, G. Measuring spatial accessibility to healthcare services with constraint of administrative boundary: A case study of Yanqing District, Beijing, China. Int. J. Equity Health 2018, 17, 7. [Google Scholar] [CrossRef] [Green Version]
- Ogunlesi, T.A.; Olanrewaju, D.M. Socio-demographic Factors and Appropriate Health Care-seeking Behavior for Childhood Illnesses. J. Trop. Pediatrics 2010, 56, 379–385. [Google Scholar] [CrossRef] [Green Version]
- De, T.; Changchun, F.; Jinjie, D. Spatial evolution and cause analysis of urban villages: A case study of Shenzhen Special Economic Zone. Geogr. Res.-Aust. 2011, 30, 437–446. [Google Scholar]
- Feng, C.; Li, T.; Cao, G.; Shen, H. Housing outcomes of family migrants at the place of destination. Geogr. Res. 2017, 36, 633–646. [Google Scholar]
- Tao, L.; Hui, E.C.M.; Wong, F.K.W.; Chen, T. Housing choices of migrant workers in China: Beyond the Hukou perspective. Habitat Int. 2015, 49, 474–483. [Google Scholar] [CrossRef]
- Wang, F.; Wang, C.; Hu, Y.; Weiss, J.; Alford-Teaster, J.; Onega, T. Automated delineation of cancer service areas in northeast region of the United States: A network optimization approach. Spat. Spatio-Temporal Epidemiol. 2020, 33, 100338. [Google Scholar] [CrossRef] [PubMed]
- Jia, P.; Wang, F.; Xierali, I.M.; Faruque, F.S. Differential effects of distance decay on hospital inpatient visits among subpopulations in Florida, USA. Environ. Monit. Assess. 2019, 191, 381. [Google Scholar] [CrossRef] [PubMed] [Green Version]
Figure 1.
Location of Shenzhen and the distribution of general hospitals. Data source: hospitals, Health Commission of Shenzhen; basic geographic information, Shenzhen Municipal Bureau of planning and natural resources.
Figure 1.
Location of Shenzhen and the distribution of general hospitals. Data source: hospitals, Health Commission of Shenzhen; basic geographic information, Shenzhen Municipal Bureau of planning and natural resources.

Figure 2.
Research framework.

Figure 3.
Distribution of actual health seeking trips based on big trajectory data in Shenzhen. Data source: bed number of GHs, Health Commission of Shenzhen; visit volume from BSU to GHs, trips inferred from LBS data of Tencent APPs.
Figure 3.
Distribution of actual health seeking trips based on big trajectory data in Shenzhen. Data source: bed number of GHs, Health Commission of Shenzhen; visit volume from BSU to GHs, trips inferred from LBS data of Tencent APPs.

Figure 4.
Comparison of supply–demand ratio in Shenzhen: (a) observed; (b,c) show the classical accessibility method when the decay coefficient (β) is taken as 1.0 and 2.0, respectively. Data source: bed number of GHs, Health Commission of Shenzhen; supply–demand ratio, calculated by the methods in Section 3.3.


Table 1.
Four extended forms of Huff model and their linear forms.
| Model | Equation | Linear Form |
|---|---|---|
| 1. Pure power function | ||
| 2. Pure exponential function | ||
| 3. Attraction (exponential) + distance decay (power) | ||
| 4. Attraction (power) + distance decay (exponential) |
Table 2.
Comparison of supply–demand ratio statistics of BSUs between observation-based and classical methods.
Table 2.
Comparison of supply–demand ratio statistics of BSUs between observation-based and classical methods.
| Method | β | Average | Standard Deviation | Max | Median | Minimum |
|---|---|---|---|---|---|---|
| Classical accessibility analysis model | 0.5 | 1.630 | 0.276 | 2.661 | 1.642 | 0.900 |
| 1.0 | 1.760 | 0.739 | 7.841 | 1.643 | 0.450 | |
| 1.5 | 1.932 | 1.915 | 25.498 | 1.470 | 0.172 | |
| 2.0 | 2.126 | 4.177 | 59.813 | 1.157 | 0.049 | |
| Observation-based method | - | 1.536 | 0.159 | 2.251 | 1.532 | 1.177 |
Table 3.
The global regression results of the extended Huff model.
| Variables | Description | Coefficients (B) | Standardized Coefficients (Beta) | Sig. |
|---|---|---|---|---|
| DIS | Medical commute distance | −1.0551 | −0.5753 | 0.000 |
| BA | Building area | 0.0186 | 0.0956 | 0.000 |
| DN | Doctor number | 0.1463 | 0.2802 | 0.000 |
| SS | Hospital satisfaction survey score | 0.0340 | 0.0561 | 0.000 |
| FR | Floor area ratio | −0.0118 | −0.0124 | 0.007 |
| VT | Times of visits to Baidu Encyclopedia entries | 0.0068 | 0.1694 | 0.000 |
| DC | Distance of the hospital to the nearest urban center | −0.0123 | −0.0436 | 0.000 |
Table 4.
The coefficients of subgroup-specific Huff models.
| Variables | Age Level | Income Level | Education Level | |||
|---|---|---|---|---|---|---|
| Low | High | Low | High | Low | High | |
| DIS | −1.2270 ** | −0.9175 ** | −1.1739 ** | −0.8974 ** | −1.2852 ** | −0.9594 ** |
| BA | 0.0173 ** | 0.0195 ** | 0.0136 ** | 0.0193 ** | 0.0225 ** | 0.0167 ** |
| DN | 0.1389 ** | 0.1371 ** | 0.1564 ** | 0.1446 ** | 0.1427 ** | 0.1375 ** |
| SS | 0.0165 ** | 0.0580 ** | 0.0195 ** | 0.0597 ** | 0.0049 | 0.0612 ** |
| FR | 0.0381 ** | −0.0408 ** | 0.0168 * | −0.0491 ** | 0.0289 ** | −0.0511 ** |
| VT | 0.0072 ** | 0.0080 ** | 0.0069 ** | 0.0078 ** | 0.0065 ** | 0.0085 ** |
| DC | −0.0251 ** | −0.0119 ** | −0.0139 ** | −0.0090 ** | −0.0160 ** | −0.0183 ** |
* indicates p < 0.05; ** indicates p < 0.01. The R2 for the four subgroup-specific Huff models were 0.670, 0.738, 0.686, 0.737, 0.640, and 0.744, respectively.
Publisher’s Note: MDPI stays neutral with regard to jurisdictional claims in published maps and institutional affiliations. |
© 2022 by the authors. Licensee MDPI, Basel, Switzerland. This article is an open access article distributed under the terms and conditions of the Creative Commons Attribution (CC BY) license (https://creativecommons.org/licenses/by/4.0/).
Share and Cite
MDPI and ACS Style
Hu, W.; Li, L.; Su, M. Modeling Health Seeking Behavior Based on Location-Based Service Data: A Case Study of Shenzhen, China. ISPRS Int. J. Geo-Inf. 2022, 11, 295. https://0-doi-org.brum.beds.ac.uk/10.3390/ijgi11050295
AMA Style
Hu W, Li L, Su M. Modeling Health Seeking Behavior Based on Location-Based Service Data: A Case Study of Shenzhen, China. ISPRS International Journal of Geo-Information. 2022; 11(5):295. https://0-doi-org.brum.beds.ac.uk/10.3390/ijgi11050295
Chicago/Turabian StyleHu, Wei, Lin Li, and Mo Su. 2022. "Modeling Health Seeking Behavior Based on Location-Based Service Data: A Case Study of Shenzhen, China" ISPRS International Journal of Geo-Information 11, no. 5: 295. https://0-doi-org.brum.beds.ac.uk/10.3390/ijgi11050295
Note that from the first issue of 2016, this journal uses article numbers instead of page numbers. See further details here.