Article

Quantifying Urban Expansion from the Perspective of Geographic Data: A Case Study of Guangzhou, China

School of Geography and Remote Sensing, Guangzhou University, Guangzhou 510006, China
*
Author to whom correspondence should be addressed.
ISPRS Int. J. Geo-Inf. 2022, 11(5), 303; https://0-doi-org.brum.beds.ac.uk/10.3390/ijgi11050303
Submission received: 3 March 2022 / Revised: 30 April 2022 / Accepted: 30 April 2022 / Published: 10 May 2022

Abstract

:
Understanding and quantifying urban expansion is critical to urban management and urban planning. The accurate delineation of built-up areas (BUAs) is the foundation for quantifying urban expansion. To quantify urban expansion simply and efficiently, we proposed a method for delineating BUAs using geographic data, taking Guangzhou as the study area. First, Guangzhou’s natural cities (NCs) in 2014 and 2020 were derived from the point of interest (POI) data. Second, multiple grid maps were combined with NCs to delineate BUAs. Third, the optimal grid map for delineating BUA was determined based on the real BUA data and applying accuracy evaluation indexes. Finally, by comparing the 2014 and 2020 BUAs delineated by the optimal grid maps, we quantified the urban expansion occurring in Guangzhou. The results demonstrated the following. (1) The accuracy score of the BUAs delineated by the 200 m × 200 m grid map reaches a maximum. (2) The BUAs in the central urban area of Guangzhou had a smaller area of expansion, while the northern and southern areas of Guangzhou experienced considerable urban expansion. (3) The BUA expansion was smaller in all spatial orientations in the developed district, while the BUA expansion was larger in all spatial orientations in the developing district. This study provides a new method for delineating BUAs and a new perspective for mapping the spatial distribution of urban BUAs, which helps to better understand and quantify urban expansion.

1. Introduction

With the development of urbanization, the populations and economies of cities have increased significantly. According to the United Nations Development Program (UNDP) research report, China’s urbanization level will reach 70% in 2030, and the urban population will exceed 1 billion. China is experiencing the largest urbanization rates in history. However, in the process of rapid urbanization, many natural ecological coverage areas (e.g., vegetation, water, and cultivated land areas) have been replaced by buildings [1]. Human activities are changing the urban landscape, which is reflected in the level of urban expansion [2,3]. Many serious challenges arise in urban areas, such as urban heat islands [4,5], air pollution [6], and biodiversity loss [7,8]. In addition, the expansion of urban areas that occurs during urbanization has significant impacts on human beings, including the security of the built environment [9], the walkability assessment [10], urban form and density [11], and the accessibility of green space [12]. Therefore, understanding and quantifying urban expansion is particularly important and is critical to urban management and the healthy development of urbanization.
The accurate delineation of built-up areas (BUAs) is required to understand and quantify urban expansion [13]. The definition of BUAs differs in the literature [14,15]. In most studies, the BUA is defined as land surfaces mainly covered by building structures; this is also the physical definition of BUAs. The main components of BUAs are impervious surfaces; by contrast, urban lakes, parks, and some large open spaces are not considered BUAs [16]. Accurate information on BUAs has a wide range of applications in many fields, such as in studies of energy consumption [17], the ecological environment [18], population estimate, and urban sustainable development studies [19]. Therefore, both policymakers and research scholars are eager to effectively identify and monitor BUAs and the dynamic of BUAs [20].
In recent decades, remote sensing data have been widely used in the delineation of BUAs. In general, the technical methods for delineating BUAs based on remote sensing data can be grouped into two categories. The first is the object-based classification method, which extracts BUAs from the input remote sensing images [21]. The second category segments the remote sensing images using indicators to obtain the BUAs [22]. Other studies have combined object-based segmentation methods and indicators to extract BUAs from remote sensing images [23]. In addition, several global datasets related to urban areas have been produced [24].
Although these methods have made great contributions to delineating BUAs, there are still several problems in extracting BUAs from remote sensing data. First, delineating BUAs from remote sensing images is a time-consuming and labor-intensive process [25]. Second, the quality of the remote sensing images strongly impacts the BUA delineation. In some cloudy and rainy areas, the cloud coverage level of remote sensing images is so high that they cannot be used [26]. Third, satellite sensors may experience deviations or failures after prolonged use [27]. Even with the same satellite sensor, differences in remote sensing images are produced during different periods, which lead to deviations in the BUA delineation. Therefore, an alternative method for delineating BUAs is urgently needed.
Natural cities (NCs) can provide us with a new opportunity to delineate BUAs. The derivation of NCs is a bottom-up approach used to study geographic events [28]. The NC is based on fractal geometry, a complex structure and mathematical set that can be reflected at multiple scales [29]. The NC involves geographical events that are concentrated in space, such as patches formed by the aggregated location information of social media users [30]. Therefore, the NC can provide a new perspective for geospatial data analysis and help understand the forming and processing of geographic events [31]. Geographic data (e.g., night light images and points of interest (POIs)), which can be obtained from multiple websites (e.g., OpenStreetMap and electronic map websites) [32], can be used to derive NCs and thus delineate BUAs [33].
The purposes of this study were (1) to develop a method to delineate BUAs using geospatial data; (2) to validate the accuracy of the BUAs delineated using the proposed method; and (3) to explore the application of the delineated BUAs in quantifying urban expansion. This study provides a new method for the delineation of BUAs and a new perspective for mapping the spatial distribution of BUAs. These advances help to better understand and quantify urban expansion.

2. Materials and Methods
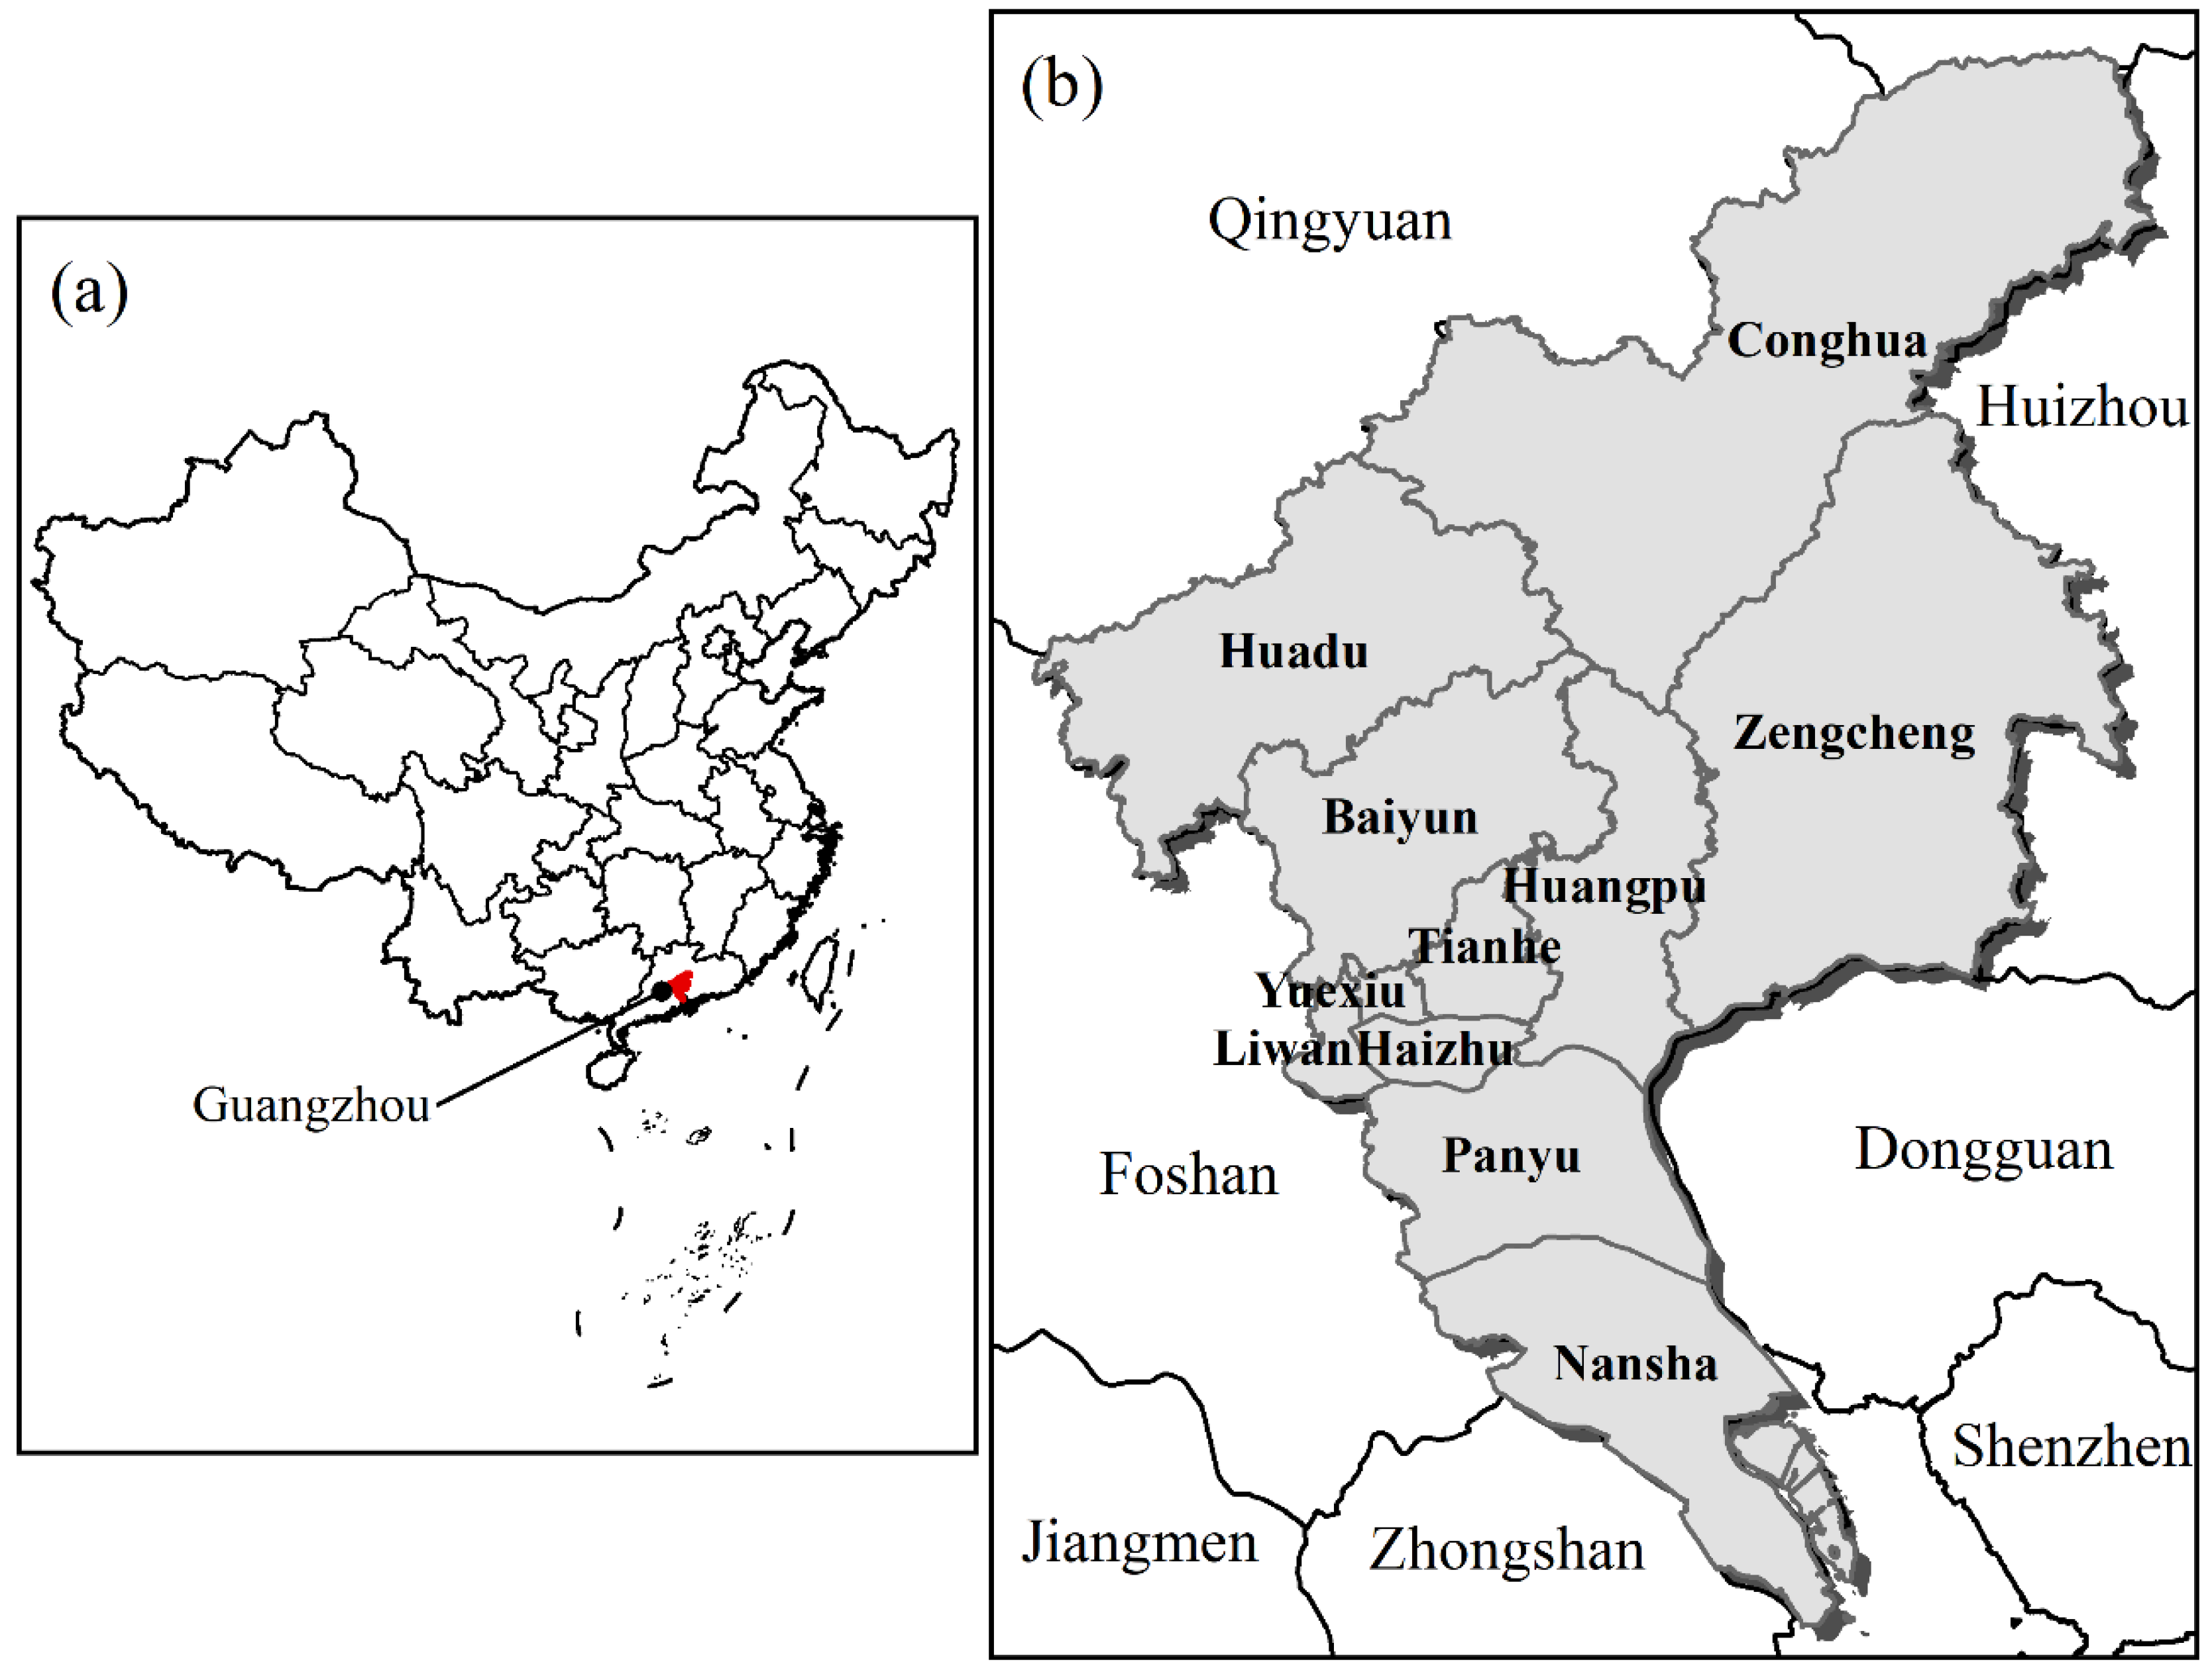
2.1. Study Areas

Guangzhou comprises 11 districts and is located between 112°57′ E–114°03′ E and 22°26′ N–23°56′ N in the middle of the Guangdong-Hong Kong-Macao Greater Bay area. As one of the four first-tier cities in China, Guangzhou has experienced rapid urbanization over the past 40 years, with substantial urban expansion, rapid economic development, and rapid population growth. Figure 1 shows the location of Guangzhou and its districts.
Because Guangzhou has received extensive attention in China, it was one of the first cities to provide POI data. In addition, to understand the changes taking place in this important city, the official department collects and updates real BUA data of Guangzhou every few years. Therefore, multi-year POI data from Guangzhou is available. The available real data of BUAs in Guangzhou could be used to assess the accuracy of BUAs delineated in this study. Therefore, Guangzhou was identified as a suitable area for delineating BUAs with geographic data, making it an appropriate research area for quantifying urban expansion.

2.2. Data Sources and Preprocessing

The geographic data we used to derive the NC in this study is POI data. POI data has been widely used to identify urban functional areas and the study of urban spatial structure [34,35]. POI data are geographic data and open data [25]. Each POI (vector data) has a unique geographical location (coordinate information) that represents the location of a series of information [36]. For example, each building has at least one POI. The POI data used in this study were obtained from China’s largest electronic map website (https://www.baidu.com/) by using the Application Programming Interface (API) (accessed on 1 January 2020). These POIs include 18 types (e.g., commercial facilities, public facilities, transportation facilities) and are updated almost daily by manual tagging to be used for the navigation of people and vehicles. In addition, the accuracy of these POIs is ensured by manual random inspection. Therefore, the POIs obtained from the electronic map website have high accuracy and are reasonable to use in this study. The number of POI data in Guangzhou in 2014 and 2020 is 832,580 and 1,221,017, respectively.
The real BUA data from Guangzhou in 2014 and 2020 were used in this study to assess the accuracy of BUAs delineated using geographic data. This real BUA data was provided by the Land and Resources Technology Center of Guangdong Province, which is a subsidiary of the Natural Resources Department of Guangdong Province (http://nr.gd.gov.cn/) (accessed on 1 January 2020). These real BUA data were obtained from field surveys and manually drawn from high-resolution remote sensing images. Therefore, the accuracy of this real BUA data is extremely high, making it feasible to assess the accuracy of BUAs delineated in this study.

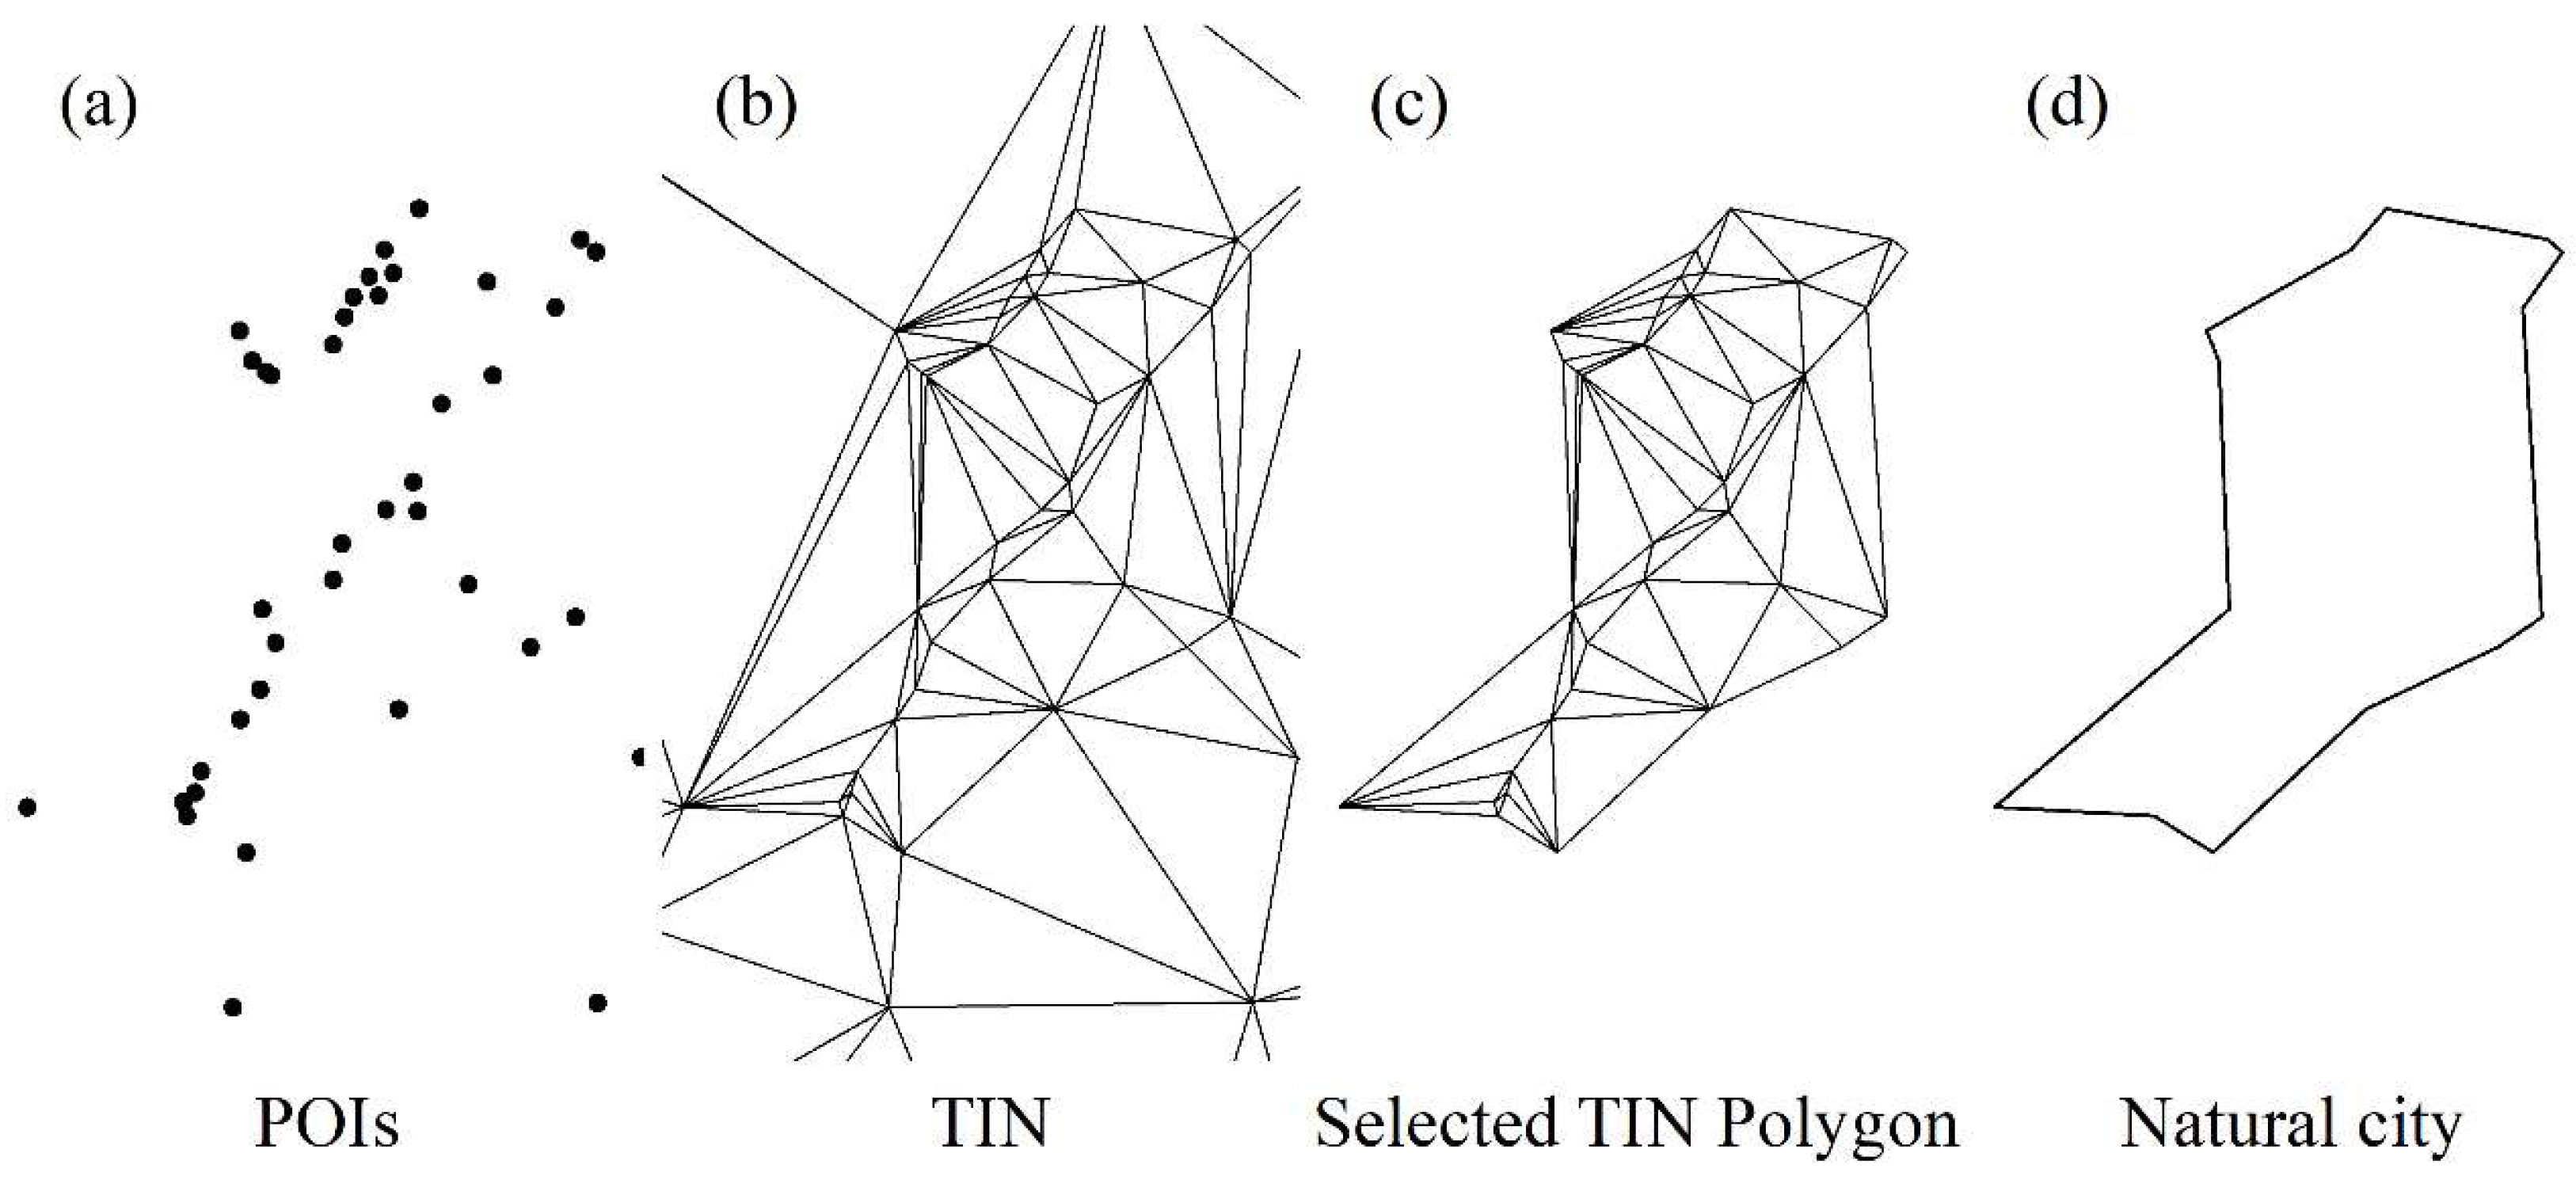
2.3. Deriving NCs from Geographic Data

The derivation of NCs is the basis for delineating BUAs. On the one hand, the data used to derive NCs should follow a certain distribution condition [30]. On the other hand, the basis of deriving NCs is a segmentation method [30]. More specifically, when the value of a variable X follows the heavy-tailed distribution (the statistical distribution of the right deviation), a segmentation method based on the head/tail division rule can divide these values into two parts [28]. The first part is called the head, and the value belonging to the head is larger than the average, but the proportion of the number is low. The other part is called the tail, and the value belonging to the tail is smaller than the average, but the proportion of the number is high. In other words, the number of low values is far greater than the number of high values. In previous studies, pixel values of nighttime images, the density of street nodes, and the density of social media location data have been confirmed as datasets that follow a heavy-tailed distribution [37,38].
Deriving NC from POIs requires four steps (Figure 2): (1) create a triangulated irregular network (TIN) based on POIs; (2) transform the TIN into TIN polygons and calculate the average area of all TIN polygons; (3) divide all TIN polygons into two parts based on the head/tail division rule and select the part of TIN polygons belonging to the head (the area is smaller than the average area); and (4) dissolve the selected TIN polygons and aggregate them into one polygon (i.e., an NC).

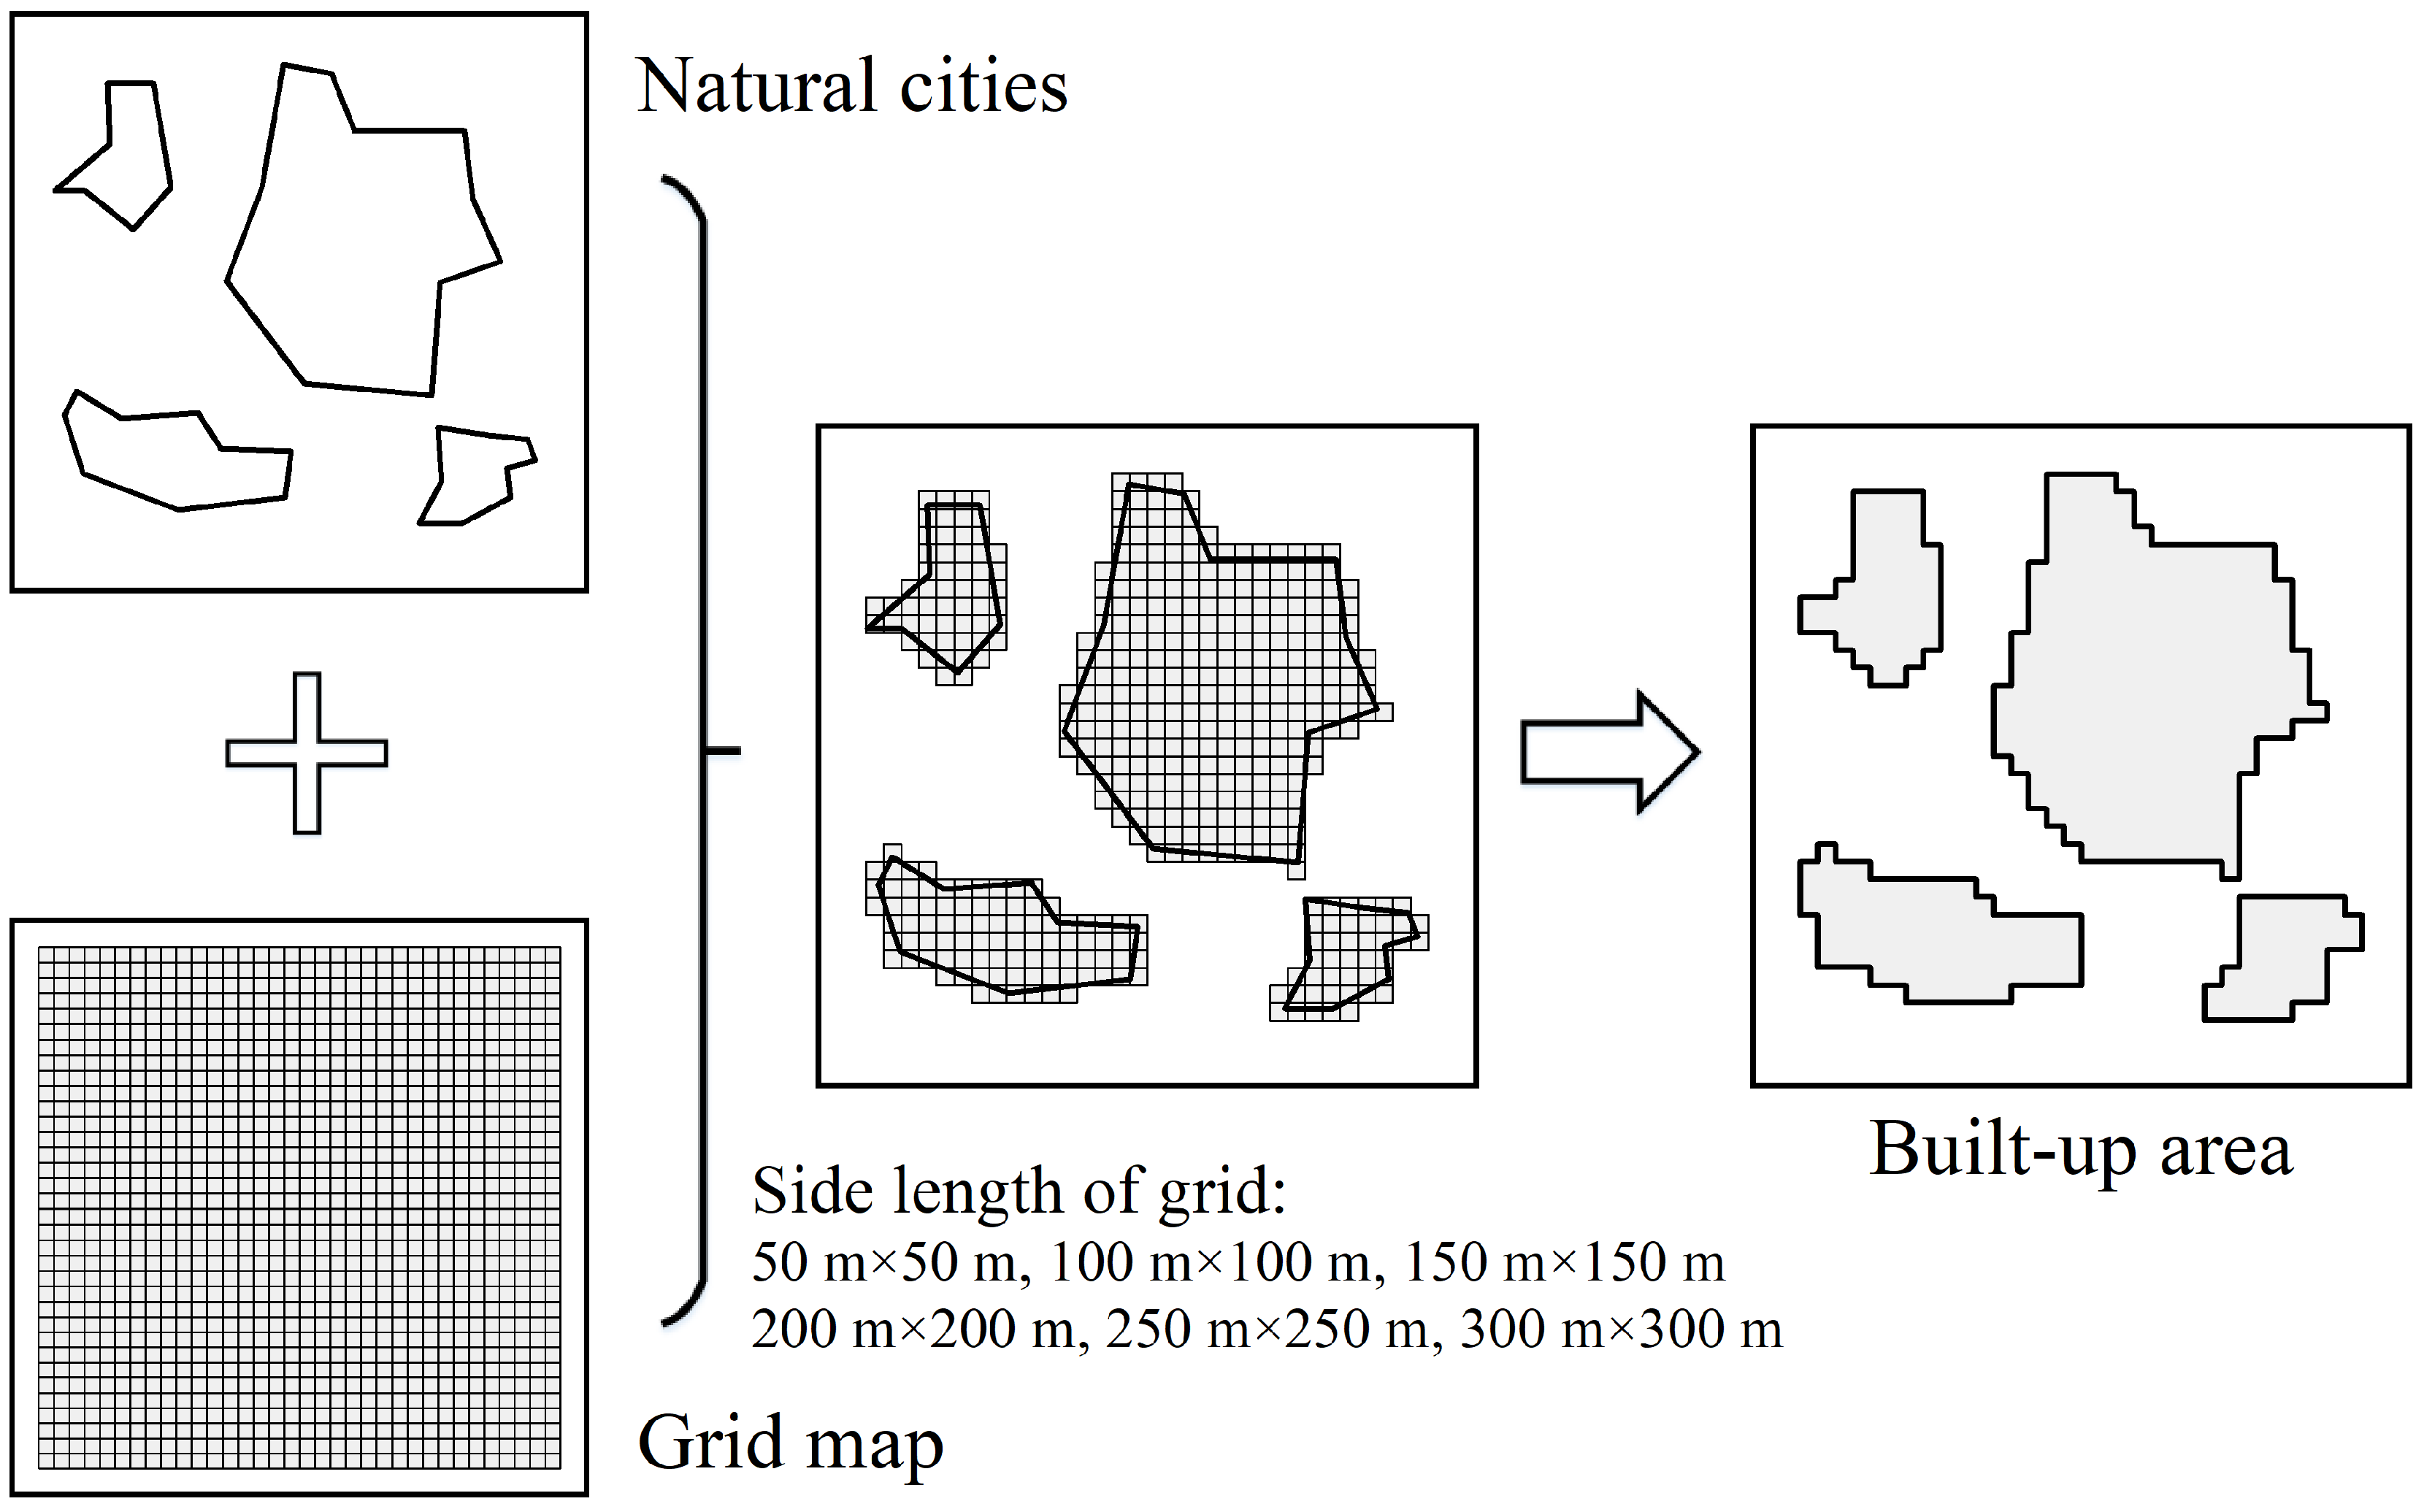
2.4. Delineation of BUAs

We superimposed the grid map on the NC derived from POIs to delineate the BUA. According to the previously mentioned definition, BUAs are areas that are mainly covered by buildings. An NC reflects the concentration of POIs, so the distribution of an NC is not a substitute for the distribution of a BUA. Therefore, the total area of a NC within a city is always smaller than the area of its BUA. For example, in an extreme case, a building has only one POI, and the NC derived from this POI and its surrounding POIs can only cover a portion of this building. In this case, part of the BUA located at the periphery of the NC cannot be delineated. In other words, the NC of a city belongs to the BUA, but the BUA of a city is not composed only of this NC. Therefore, to delineate the BUA as accurately as possible, BUAs around NCs need to be delineated by additional methods.
We extracted the area around NCs by superimposing the grid map onto the NC to accurately delineate the BUA. More specifically, the delineation of BUA is done by superimposing NC and the grid map and then extracting the grid that intersects with NC. Using this method, the area around the NC can be effectively extracted. However, the results of using different grid maps to delineate BUAs will considerably differ (the larger the side length of the grid, the greater the area around the NC that is extracted). Therefore, to determine the optimal grid used to delineate BUAs, grid maps composed of different side length grids (i.e., 50 m × 50 m, 100 m × 100 m, 150 m × 150 m, 200 m × 200 m, 250 m × 250 m and 300 m × 300 m) were used in this study. The procedures for delineating BUAs based on different grid maps are displayed in Figure 3.
Four accuracy evaluation indexes were used to determine the optimal side length of the grid used to delineate the BUAs to obtain the highest accuracy spatial distribution. The four accuracy evaluation indexes used in this study were the user’s accuracy (UA), producer’s accuracy (PA), overall accuracy (OA), and kappa coefficient (K).

3. Results

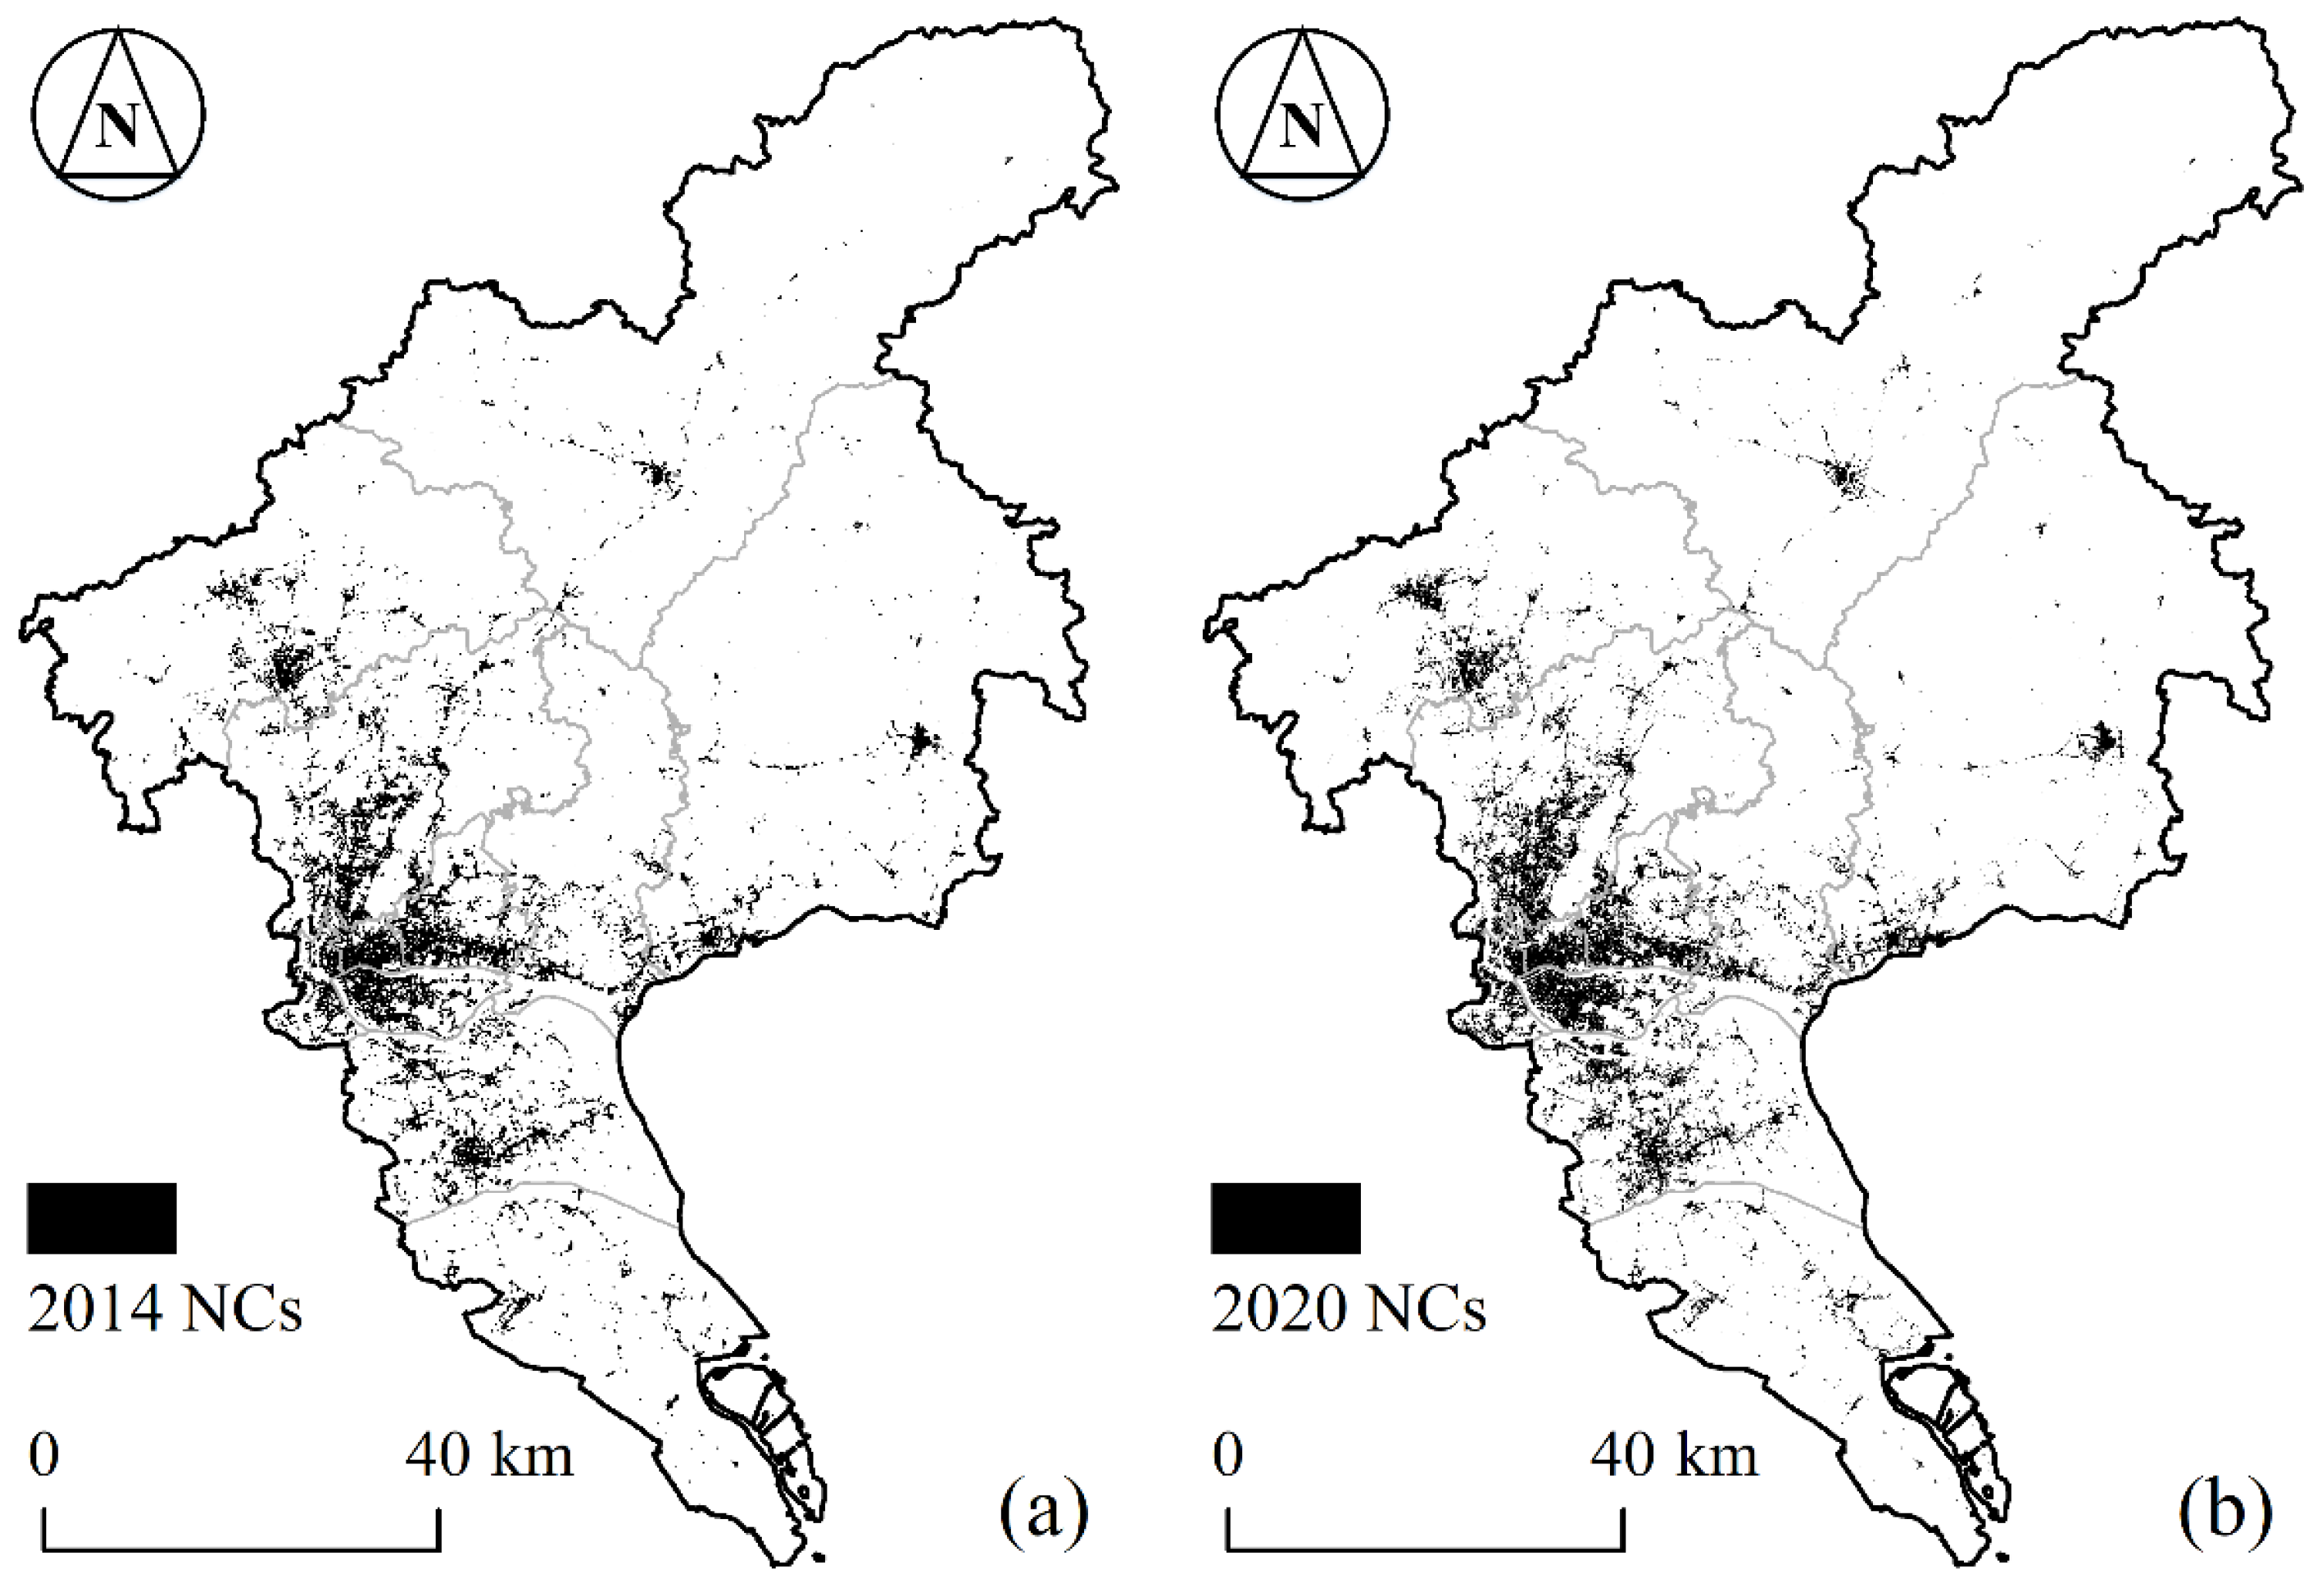
3.1. Derivation of NCs and Delineation of BUAs

The NCs of Guangzhou in 2014 and 2020 were derived from the POI (Figure 4a,b). The density of NCs was highest in the central urban area of Guangzhou. Moreover, there was at least one NC gathering area in each district of Guangzhou. For the whole city, the central region had the largest concentration of NCs, while the southern and northern regions had smaller NCs.
We extracted the area around each NC (which should be delineated as the BUA) by superimposing the grid map onto the NC, thus achieving a more accurate delineation of the BUA. We used multiple grid maps (with different grid sizes) to delineate the BUAs in Guangzhou and obtained the spatial distribution of multiple BUAs in 2014 and 2020 (Figure 5 and Figure 6).
The NC is the foundation of the BUA, so the spatial distribution of the delineated BUA is similar to the spatial distribution of the NC. BUAs delineated from different grid maps were concentrated in the central part of Guangzhou. The BUAs in the southern and northern parts of Guangzhou were small. In addition, the larger the side length of the grid, the larger the area extracted from the area around the NC. In other words, the larger the side length of the grid that forms the grid map is, the larger the BUA delineated. Guangzhou’s 2014 BUAs delineated by grids with side lengths of 50 m, 100 m, 150 m, 200 m, 250 m, and 300 m were 388.18 km2, 564.56 km2, 726.79 km2, 850.72 km2, 978.75 km2, and 1088.44 km2, respectively. Guangzhou’s 2020 BUAs delineated by grids with side lengths of 50 m, 100 m, 150 m, 200 m, 250 m, and 300 m were 402.38 km2, 612.75 km2, 789.17 km2, 945.96 km2, 1091.13 km2, and 1223.11 km2, respectively.

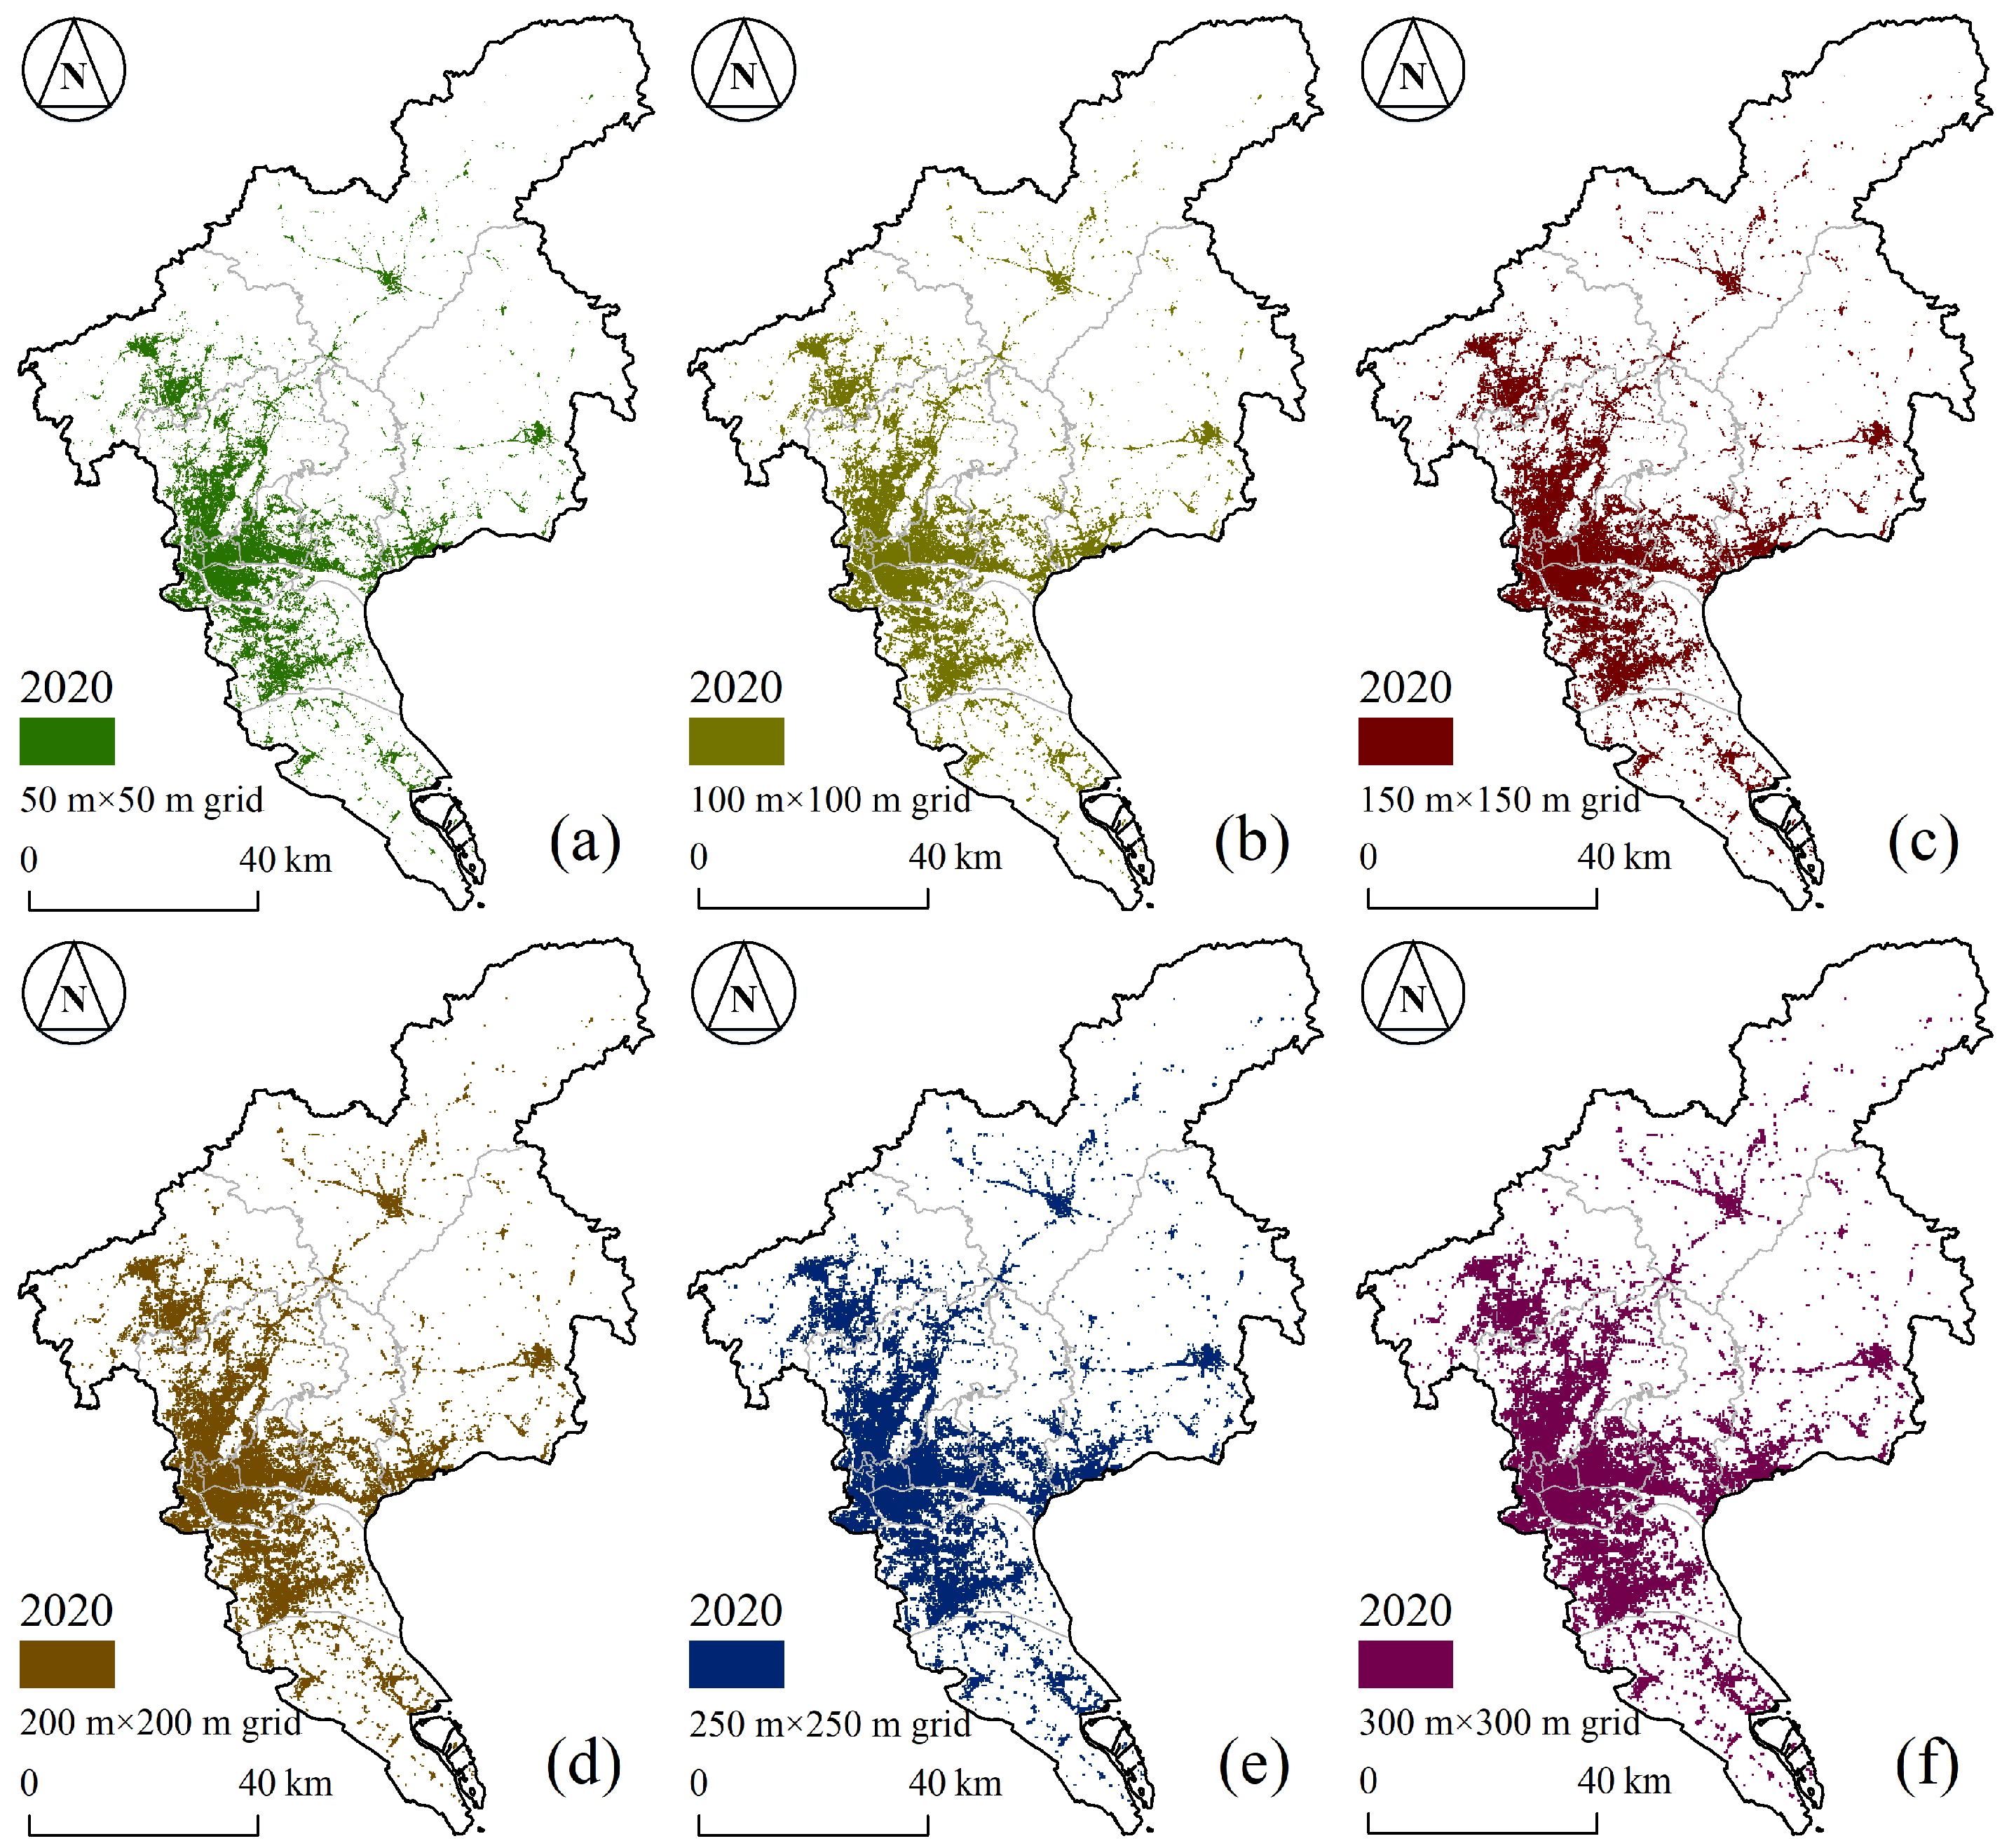
3.2. Optimal Grids for Delineating BUAs

To evaluate the accuracy of BUAs delineated using the proposed method and determine the optimal grid that can maximize the accuracy of BUAs in Guangzhou, we compared the differences between delineated and real BUAs and applied four accuracy evaluation indexes.
The real BUAs of Guangzhou in 2014 and 2020 were 918.32 km2 and 1013.01 km2, respectively. For the 2014 and 2020 BUAs delineated using multiple grid maps, only the BUAs delineated by the 200 m × 200 m grid map (2014 BUAs: 850.72 km2 and 2020 BUAs: 945.96 km2) and the 250 m × 250 m grid map (2014 BUAs: 978.75 km2 and 2020 BUAs: 1091.13 km2) approximated the real BUAs. We used the accuracy evaluation indexes to further evaluate the accuracy of the 2014 and 2020 BUAs delineated by the 200 m × 200 m grid map and the 250 m × 250 m grid map. Based on the real BUAs of Guangzhou in 2014 and 2020, we randomly selected 1120 samples that consisted of 580 BUAs and 540 non-BUAs. The types of the 1120 samples (i.e., BUA or non-BUA) in the two grid map sizes were then determined to assess the accuracy scores (Table 1).
The OA values were greater than 90% for the 2014 and 2020 BUAs delineated using the 200 m × 200 m grid map and the 250 m × 250 m grid map. For the delineated 2014 BUAs, the BUA delineated by the 200 m × 200 m grid map had a higher accuracy, with OA and K (OA: 95.27% and K: 0.9053) greater than those of the BUA delineated by the 250 m × 250 m grid map (OA: 91.43% and K: 0.8279). For the delineated 2020 BUAs, the BUA delineated by the 200 m × 200 m grid map was also more accurate than the BUA delineated by the 250 m × 250 m grid map.
In general, the method proposed in this study effectively delineated the BUAs, and the results were highly accurate. The accuracy scores of the BUAs delineated by the 200 m × 200 m grid map were higher. In other words, the side length of the optimal grid that gave the highest BUA accuracy in Guangzhou was found to be 200 m.

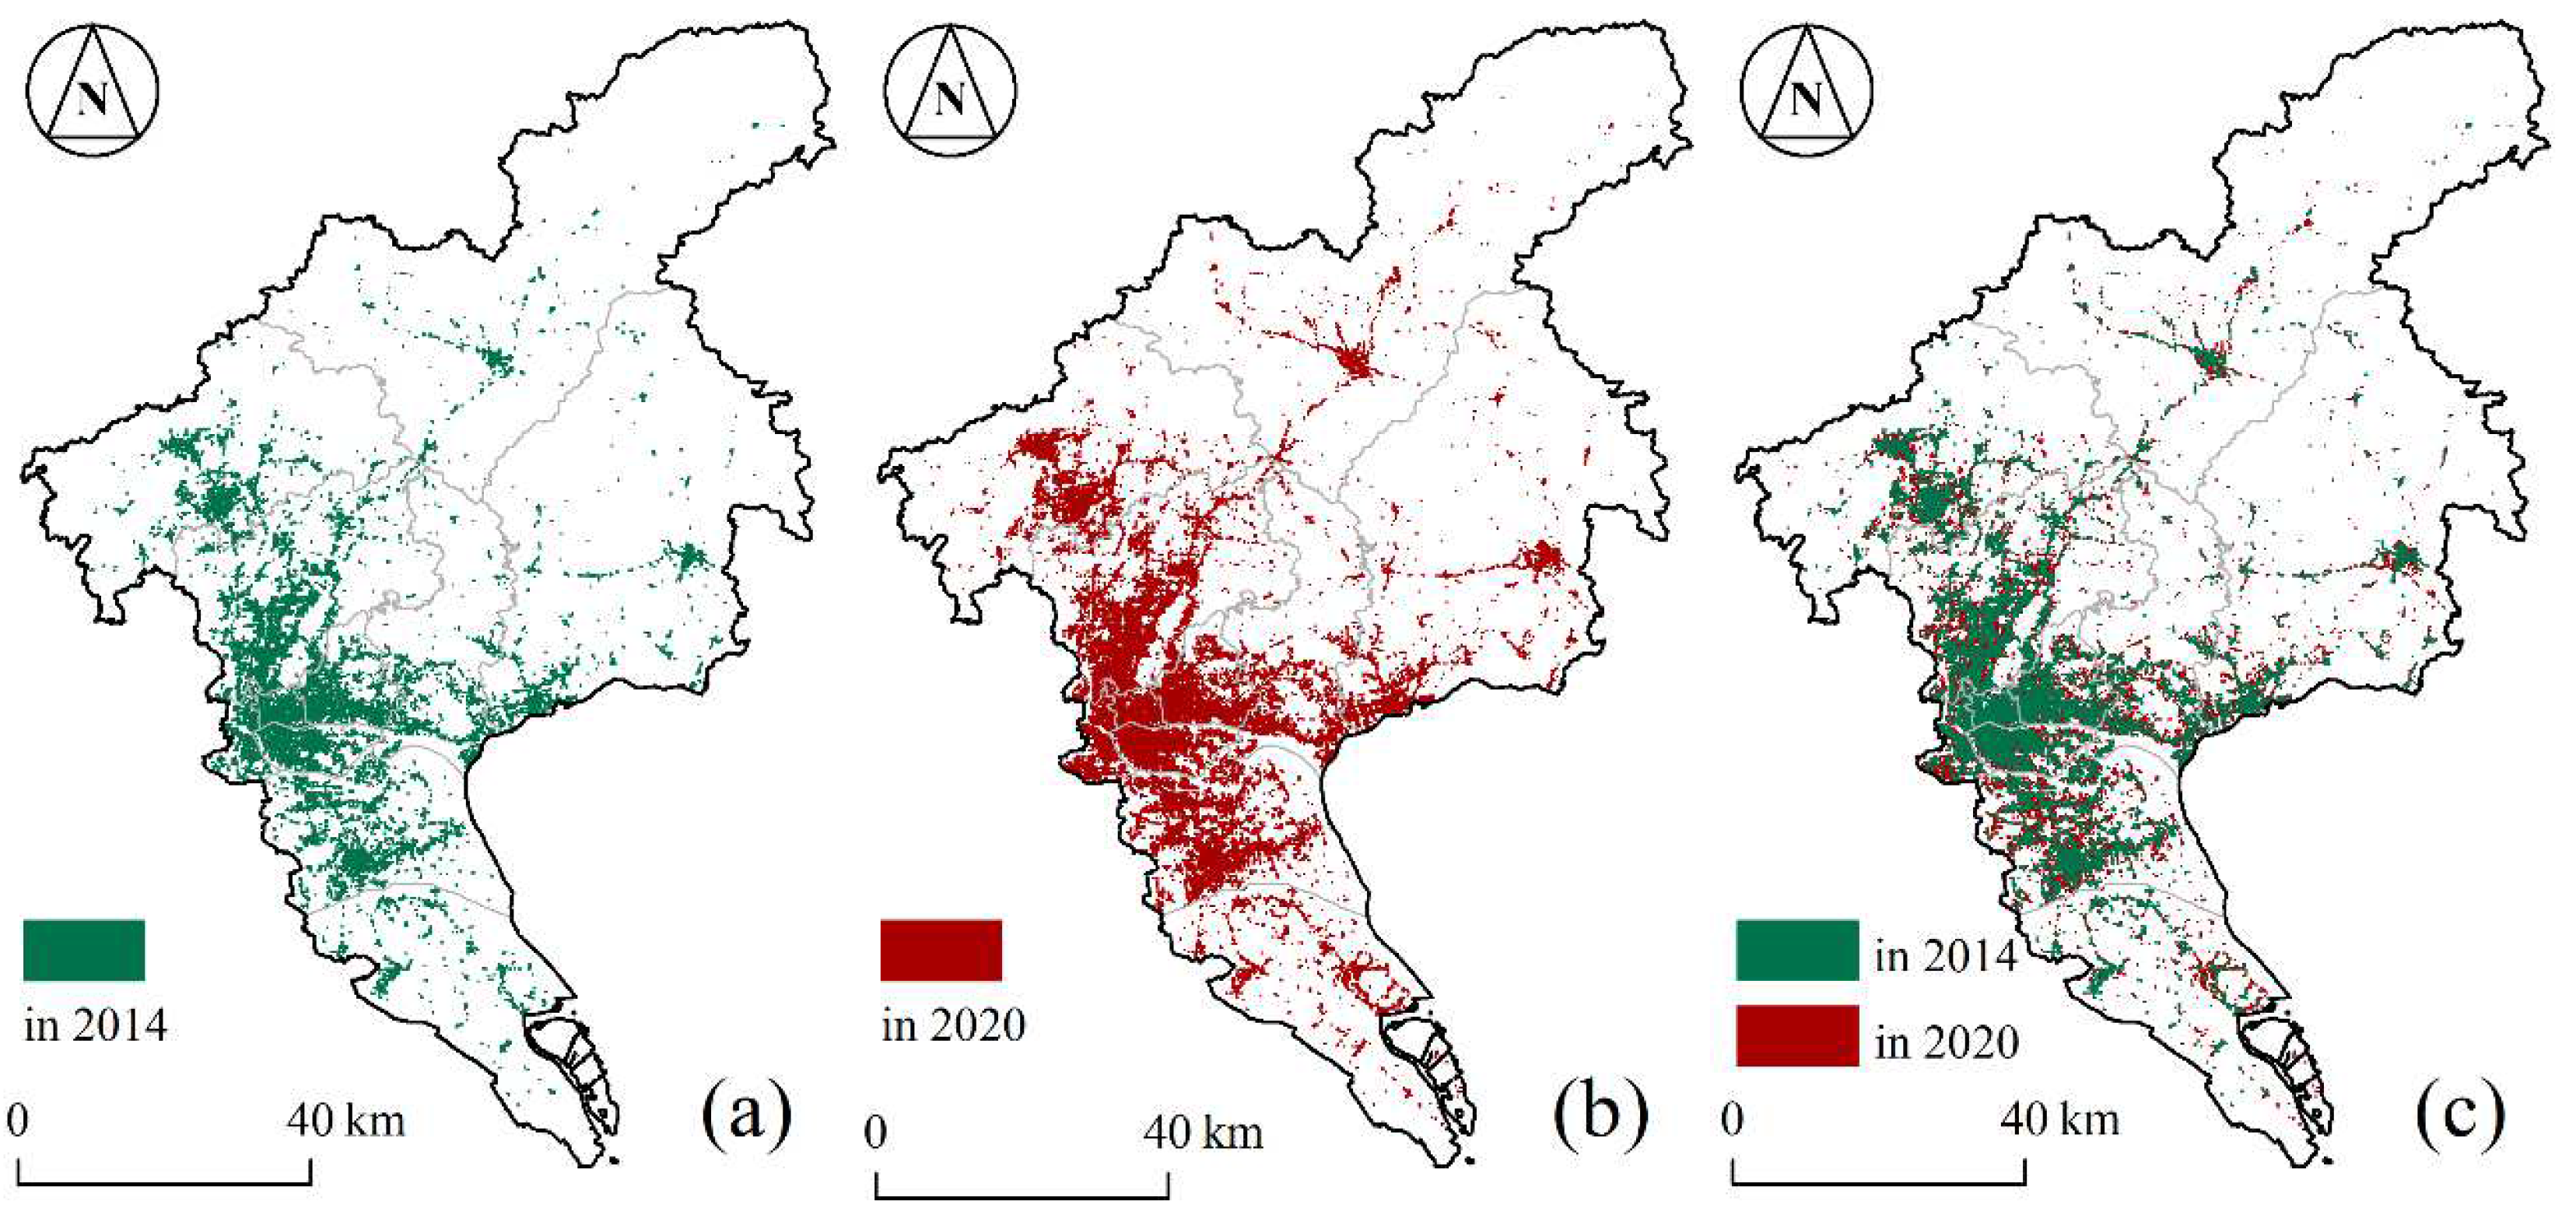
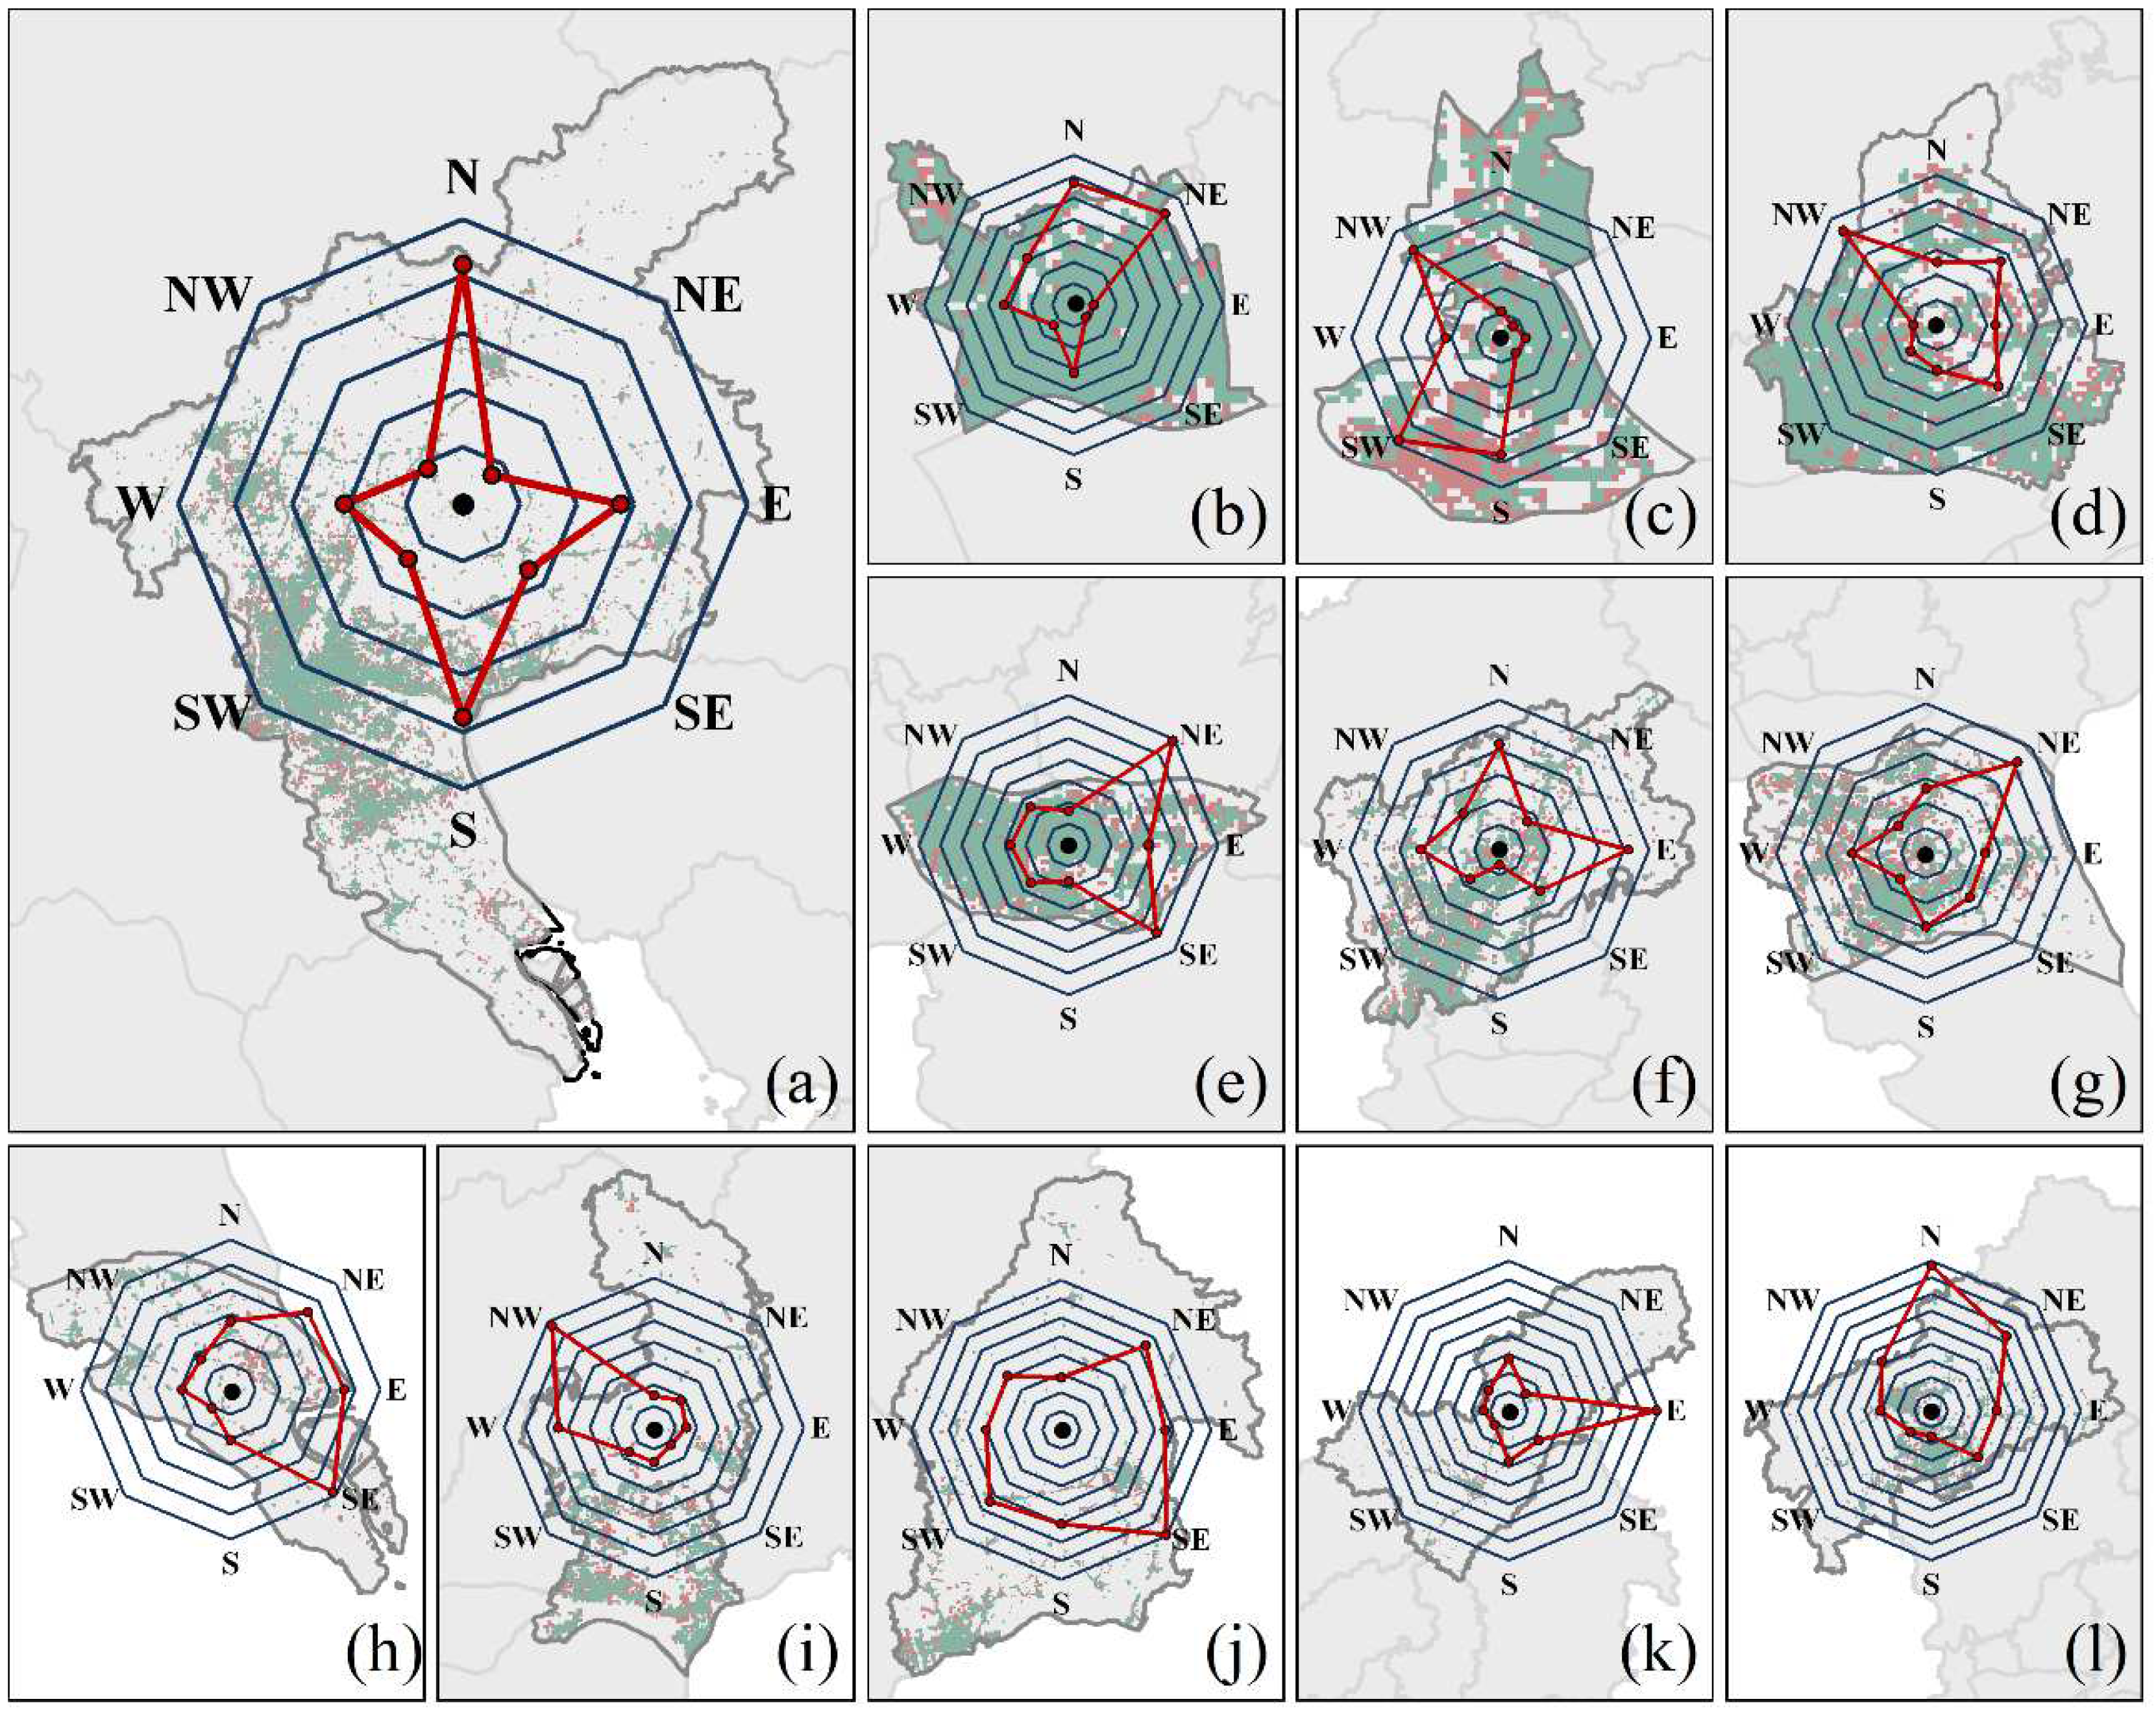
3.3. Quantification of Urban Expansion

Based on the determination that the BUAs delineated by the 200 m × 200 m grid map had a higher accuracy, by comparing the 2014 and 2020 BUAs in Guangzhou, we can better understand the process of urban expansion and quantify this urban expansion. We visualized the spatial distribution of the 2014 and 2020 BUAs delineated by the 200 m × 200 m grid map (Figure 7). We then counted the 2014 and 2020 BUAs in Guangzhou and its 11 districts and calculated the expansion area and expansion rate of BUAs (Table 2).
In the past six years, the urban expansion in Guangzhou has exhibited marked spatial heterogeneity. The BUA in the central urban area of Guangzhou has increased, and the central area of other districts has experienced a rapid urban expansion process. In 2014, clustered BUAs appeared in Guangzhou’s southern and northern regions. Moreover, from 2014 to 2020, these clustered BUAs experienced a significant expansion process. From 2014 to 2020, the BUA of Guangzhou increased from 850.72 km2 to 945.96 km2, with an expansion area of 95.24 km2 and an expansion rate of 11.20%. The BUAs in the central urban area of Guangzhou showed a smaller area of expansion, while the BUAs to the north and south of Guangzhou experienced significant urban expansion. The BUA of four districts (Baiyun, Panyu, Nansha, and Huadu) expanded by more than 10 km2 from 2014 to 2020. Six districts (Panyu, Nansha, Huangpu, Zengcheng, Conghua, and Huadu) had a BUA expansion rate of more than 10%.
To further understand urban expansion and explore the spatial patterns of urban expansion, we divided Guangzhou and its subdivisions into eight parts corresponding to eight spatial directions, based on the geometric centroid of each region. Then, we assessed the area of BUA expansion from 2014 to 2020 in Guangzhou and its 11 districts in eight spatial orientations (Table 3) and visualized the BUA expansion rates in eight spatial orientations (Figure 8).
Within the spatial orientation of areas with a smaller 2014 BUA, the BUA expansion rate from 2014 to 2020 was greater. For example, among the eight spatial orientations in Guangzhou, the BUA expansion rate in the north (the spatial orientation with the smallest 2014 BUA) was significantly higher than the rates in the remaining spatial orientations. Within the 11 districts of Guangzhou, there was considerable heterogeneity in the spatial orientations of the BUA expansion. The BUA expansion was smaller in all spatial orientations in the developed district (e.g., Yuexiu, Tianhe, and Huangpu). By contrast, the BUA expansion was larger in all spatial orientations within the developing district (e.g., Panyu, Nansha, and Huadu).

4. Discussion

4.1. Advantages of Using Geographic Data

The use of geographic data to delineate BUAs has at least two advantages over the extraction of BUAs from remote sensing data. The use of geographic data to delineate BUAs enables an understanding of urban expansion over short periods. The POI data is updated daily, and the daily POI data can be used to delineate BUAs. Using this POI data, 365 BUAs in Guangzhou were delineated for 2020. However, only 21 of the 2020 Landsat 8 remote sensing images covered Guangzhou. Moreover, of these 21 remote sensing images, only 3 had a cloud cover <10% and could be used effectively. Therefore, only three 2020 Landsat 8 remote sensing images were used to delineate the BUAs of Guangzhou (the BUAs were extracted from the remote sensing data by manual depiction), while all daily POI data were used. We used these three remote sensing images and the POI data on the first day of each month to delineate the BUAs of Guangzhou (Table 4). The use of POI data allows for the delineation of BUAs over a wider period, thus providing a more detailed understanding of urban expansion.
An advantage of using POI data to delineate BUAs is that it avoids the influence of geography. In some cloudy and rainy areas, the cloud coverage level of remote sensing images is so high that the images cannot be used. For example, among the 21 Landsat 8 remote sensing images that cover Guangzhou, only 3 had less than 10% cloud coverage, 7 had between 10% and 30% cloud coverage, and the remaining 11 had more than 30% cloud coverage. Furthermore, all three of the images with less than 10% cloud cover were collected in the fall or winter. This means that the BUAs of Guangzhou in spring and summer could not be effectively extracted from the remote sensing data. The use of POI data to delineate BUAs is unaffected by geography, such as cloud cover; therefore, POI data can effectively delineate BUAs in all seasons.

4.2. Recommendations for Future Studies

In this study, to quantify urban expansion, we proposed a method of delineating BUAs with geospatial data and demonstrated its positive results. Nevertheless, this study has some limitations that must be acknowledged.
First, the urban BUAs were delineated, but BUA subtypes were not considered. The delineation of different types of BUAs contributes to a more detailed understanding of the city. For example, clarifying the BUA subtypes can help understand the impact of different BUAs on the urban thermal environment. Here, we found that POI data can be used to delineate BUAs and realized the potential of POI data to identify BUA subtypes (where each POI has a type attribute). Therefore, in future research, we will further study the type attributes of POIs and explore a method for delineating BUA subtypes based on the type of POI data.
Second, we could not determine the optimal grid map for delineating BUAs in different regions. This study determined that the BUAs of Guangzhou delineated by the 200 m × 200 m grid map were more accurate. However, we could not determine the applicability of the 200 m × 200 m grid map in delineating BUAs in other areas. Therefore, we will further explore the optimal grid map for delineating BUAs in different regions by conducting additional regional studies in future research. Based on the results of these regional studies, we will explore a quantitative method to determine the optimal grid map for delineating BUAs in different regions, thus achieving an effective application of the proposed method for delineating BUAs.
The grid map we used to delineate the BUAs is composed of grids of the same size, which may have led to errors in the results. Therefore, in future research, we will consider introducing deep learning to determine the optimal grid map for delineating BUAs. This grid map will consist of grids of different sizes. For example, this could be achieved by identifying the attributes of NCs in an area and then determining the size of the grid to be used in that area.

5. Conclusions

In this study, a method for using geospatial data to delineate BUAs was proposed and used to quantify urban expansion. In the process of delineating BUAs, POI data were first used to derive NCs, and the grid map was then used to obtain a map of the BUAs with a satisfactory accuracy score. This study provides a new perspective for mapping the spatial distribution of BUAs and can help us better understand and quantify urban expansion.
The proposed method can effectively delineate BUAs, and the results are highly accurate. In addition, the accuracy scores of the BUAs delineated by the 200 m × 200 m grid map were higher. By comparing the 2014 and 2020 BUAs in Guangzhou, we can better understand the process of urban expansion and quantify this expansion. In the past six years, the urban expansion of Guangzhou has exhibited marked spatial heterogeneity. From 2014 to 2020, the BUA of Guangzhou increased from 850.72 km2 to 945.96 km2, with an expansion area of 95.24 km2 and an expansion rate of 11.20%. The BUAs in the central urban area of Guangzhou underwent a smaller area of expansion, while those to the north and south of Guangzhou experienced significant urban expansion. Within the 11 districts of Guangzhou, there was considerable heterogeneity in the spatial orientation of the BUA expansion. The BUA expansion was smaller in all spatial orientations in the developed district, while the BUA expansion was larger in all spatial orientations in the developing district.

Author Contributions

Conceptualization, Qingyao Huang and Yihua Liu; methodology, Qingyao Huang; investigation, Qingyao Huang; resources, Chengjing Chen; data curation, Chengjing Chen; writing—original draft preparation, Qingyao Huang; writing—review and editing, Qingyao Huang and Yihua Liu; funding acquisition, Yihua Liu. All authors have read and agreed to the published version of the manuscript.

Funding

This research was funded by the National Natural Science Foundation of China (Grant No. 41771096), the Special Project of Philosophy and Social Science Planning in Guangdong Province (Grant No. GD20SQ03), and the Postgraduate Innovation Ability Training Program of Guangzhou University (Grant No. 2021GDJC-M20).

Institutional Review Board Statement

Not applicable.

Informed Consent Statement

Not applicable.

Data Availability Statement

Data are available on request from the corresponding author.

Conflicts of Interest

The authors declare no conflict of interest.

References

  1. Yang, Z.; Chen, Y.; Qian, Q.; Wu, Z.; Zheng, Z. The coupling relationship between construction land expansion and high-temperature area expansion in China’s three major urban agglomerations. Int. J. Remote Sens. 2019, 40, 6680–6699. [Google Scholar] [CrossRef]
  2. Wang, Z. Evolving landscape-urbanization relationships in contemporary China. Landsc. Urban Plan. 2018, 171, 30–41. [Google Scholar] [CrossRef]
  3. Frenkel, A.; Ashkenazi, M. Measuring urban sprawl: How can we deal with it? Environ. Plan. B Plan. Des. 2008, 35, 56–79. [Google Scholar] [CrossRef] [Green Version]
  4. Yang, Z.; Chen, Y.; Guo, G.; Zheng, Z.; Wu, Z. Characteristics of land surface temperature clusters: Case study of the central urban area of Guangzhou. Sustain. Cities Soc. 2021, 73, 103140. [Google Scholar] [CrossRef]
  5. Aslam, B.; Maqsoom, A.; Khalid, N.; Ullah, F.; Sepasgozar, S. Urban overheating assessment through prediction of surface temperatures: A case study of Karachi, Pakistan. ISPRS Int. J. Geo-Inf. 2021, 10, 539. [Google Scholar] [CrossRef]
  6. Hasenfratz, D.; Saukh, O.; Walser, C.; Hueglin, C.; Fierz, M.; Arn, T.; Beutel, J.; Thiele, L. Deriving high-resolution urban air pollution maps using mobile sensor nodes. Pervasive Mob. Comput. 2015, 16, 268–285. [Google Scholar] [CrossRef]
  7. Malhi, R.K.M.; Anand, A.; Srivastava, P.K.; Sandhya Kiran, G.; Petropoulos, G.P.; Chalkias, C. An integrated spatiotemporal pattern analysis model to assess and predict the degradation of protected forest areas. ISPRS Int. J. Geo-Inf. 2020, 9, 530. [Google Scholar] [CrossRef]
  8. Huang, J.; Wang, Y.; Zhang, L. Identifying spatial priority of ecological restoration dependent on landscape quality trends in metropolitan areas. Land 2022, 11, 27. [Google Scholar] [CrossRef]
  9. Shach-Pinsly, D. Measuring security in the built environment: Evaluating urban vulnerability in a human-scale urban form. Landsc. Urban Plan. 2019, 191, 103412. [Google Scholar] [CrossRef]
  10. Zhang, J.; Tan, P.Y.; Zeng, H.; Zhang, Y. Walkability assessment in a rapidly urbanizing city and its relationship with residential estate value. Sustainability 2019, 11, 7. [Google Scholar] [CrossRef] [Green Version]
  11. Larsen, L.; Yeshitela, K.; Mulatu, T.; Seifu, S.; Desta, H. The impact of rapid urbanization and public housing development on urban form and density in Addis Ababa, Ethiopia. Land 2019, 8, 66. [Google Scholar] [CrossRef] [Green Version]
  12. Wright Wendel, H.E.; Zarger, R.K.; Mihelcic, J.R. Accessibility and usability: Green space preferences, perceptions, and barriers in a rapidly urbanizing city in Latin America. Landsc. Urban Plan. 2012, 107, 272–282. [Google Scholar] [CrossRef]
  13. Zhou, G.; Zhang, J.; Li, C.; Liu, Y. Spatial Pattern of Functional Urban Land Conversion and Expansion under Rapid Urbanization: A Case Study of Changchun, China. Land 2022, 11, 119. [Google Scholar] [CrossRef]
  14. Surya, B.; Salim, A.; Hernita, H.; Suriani, S.; Menne, F.; Rasyidi, E.S. Land use change, urban agglomeration, and urban sprawl: A sustainable development perspective of makassar city, indonesia. Land 2021, 10, 556. [Google Scholar] [CrossRef]
  15. Yang, Z.; Chen, Y.; Guo, G.; Zheng, Z.; Wu, Z. Using nighttime light data to identify the structure of polycentric cities and evaluate urban centers. Sci. Total Environ. 2021, 780, 146586. [Google Scholar] [CrossRef]
  16. Liu, C.; Huang, X.; Zhu, Z.; Chen, H.; Tang, X.; Gong, J. Automatic extraction of built-up area from ZY3 multi-view satellite imagery: Analysis of 45 global cities. Remote Sens. Environ. 2019, 226, 51–73. [Google Scholar] [CrossRef]
  17. Venkatarama Reddy, B.V.; Jagadish, K.S. Embodied energy of common and alternative building materials and technologies. Energy Build. 2003, 35, 129–137. [Google Scholar] [CrossRef]
  18. Peng, J.; Xie, P.; Liu, Y.; Ma, J. Urban thermal environment dynamics and associated landscape pattern factors: A case study in the Beijing metropolitan region. Remote Sens. Environ. 2016, 173, 145–155. [Google Scholar] [CrossRef]
  19. Yang, Z.; Chen, Y.; Zheng, Z.; Huang, Q.; Wu, Z. Application of building geometry indexes to assess the correlation between buildings and air temperature. Build. Environ. 2020, 167, 106477. [Google Scholar] [CrossRef]
  20. Bhatti, S.S.; Tripathi, N.K. Built-up area extraction using Landsat 8 OLI imagery. GIScience Remote Sens. 2014, 51, 445–467. [Google Scholar] [CrossRef] [Green Version]
  21. Yang, Y.; Liu, Y.; Li, Y.; Du, G. Quantifying spatio-temporal patterns of urban expansion in Beijing during 1985–2013 with rural-urban development transformation. Land Use Policy 2018, 74, 220–230. [Google Scholar] [CrossRef]
  22. He, Q.; Zeng, C.; Xie, P.; Tan, S.; Wu, J. Comparison of urban growth patterns and changes between three urban agglomerations in China and three metropolises in the USA from 1995 to 2015. Sustain. Cities Soc. 2019, 50, 101649. [Google Scholar] [CrossRef]
  23. Xiang, D.; Tang, T.; Hu, C.; Fan, Q.; Su, Y. Built-up area extraction from polsar imagery with model-based decomposition and polarimetric coherence. Remote Sens. 2016, 8, 685. [Google Scholar] [CrossRef] [Green Version]
  24. Chen, J.; Chen, J.; Liao, A.; Cao, X.; Chen, L.; Chen, X.; He, C.; Han, G.; Peng, S.; Lu, M.; et al. Global land cover mapping at 30 m resolution: A POK-based operational approach. ISPRS J. Photogramm. Remote Sens. 2015, 103, 7–27. [Google Scholar] [CrossRef] [Green Version]
  25. Yang, Z.; Chen, Y.; Wu, Z.; Qian, Q.; Zheng, Z. Spatial heterogeneity of the thermal environment based on the urban expansion of natural cities using open data in Guangzhou, China. Ecol. Indic. 2019, 104, 524–534. [Google Scholar] [CrossRef]
  26. Velastegui-Montoya, A.; de Lima, A.; Adami, M. Space-Time Dynamics of Land Use in the Municipality of Goianésia Do Pará, Brazil. ISPRS Int. J. Geo-Inf. 2022, 11, 146. [Google Scholar] [CrossRef]
  27. Ke, Y.; Im, J.; Lee, J.; Gong, H.; Ryu, Y. Characteristics of Landsat 8 OLI-derived NDVI by comparison with multiple satellite sensors and in-situ observations. Remote Sens. Environ. 2015, 164, 298–313. [Google Scholar] [CrossRef]
  28. Long, Y.; Zhai, W.; Shen, Y.; Ye, X. Understanding uneven urban expansion with natural cities using open data. Landsc. Urban Plan. 2018, 177, 281–293. [Google Scholar] [CrossRef] [Green Version]
  29. Jiang, B.; Ma, D. How Complex Is a Fractal? Head/tail Breaks and Fractional Hierarchy. J. Geovisualization Spat. Anal. 2018, 2, 6. [Google Scholar] [CrossRef] [Green Version]
  30. Jiang, B.; Miao, Y. The Evolution of Natural Cities from the Perspective of Location-Based Social Media. Prof. Geogr. 2015, 67, 295–306. [Google Scholar] [CrossRef] [Green Version]
  31. Long, Y. Redefining Chinese city system with emerging new data. Appl. Geogr. 2016, 75, 36–48. [Google Scholar] [CrossRef]
  32. Hu, T.; Yang, J.; Li, X.; Gong, P. Mapping urban land use by using landsat images and open social data. Remote Sens. 2016, 8, 151. [Google Scholar] [CrossRef]
  33. Yang, Z.; Chen, Y.; Wu, Z. How urban expansion affects the thermal environment? A study of the impact of natural cities on the thermal field value and footprint of thermal environment. Ecol. Indic. 2021, 126, 107632. [Google Scholar] [CrossRef]
  34. Wang, Z.; Ma, D.; Sun, D.; Zhang, J. Identification and analysis of urban functional area in Hangzhou based on OSM and POI data. PLoS ONE 2021, 16, e0251988. [Google Scholar] [CrossRef] [PubMed]
  35. Zhou, N. Research on urban spatial structure based on the dual constraints of geographic environment and POI big data. J. King Saud Univ.-Sci. 2022, 34, 101887. [Google Scholar] [CrossRef]
  36. Lou, G.; Chen, Q.; He, K.; Zhou, Y.; Shi, Z. Using Nighttime Light Data and POI Big Data to Detect the Urban Centers of Hangzhou. Remote Sens. 2019, 11, 1821. [Google Scholar] [CrossRef] [Green Version]
  37. Jiang, B. Wholeness as a hierarchical graph to capture the nature of space. Int. J. Geogr. Inf. Sci. 2015, 29, 1632–1648. [Google Scholar] [CrossRef] [Green Version]
  38. Jiang, B.; Yin, J. Ht-Index for Quantifying the Fractal or Scaling Structure of Geographic Features. Ann. Assoc. Am. Geogr. 2014, 104, 530–540. [Google Scholar] [CrossRef]
Figure 1. Location of the study area showing: (a) the location of Guangzhou in China; (b) the district of Guangzhou.
Ijgi 11 00303 g001
Figure 2. Procedures for deriving NCs from POIs: (a) POI data; (b) creat TIN; (c) select TIN polygon; (d) natural city.
Ijgi 11 00303 g002
Figure 3. Procedures for delineating BUAs based on different grid maps.
Ijgi 11 00303 g003
Figure 4. Spatial distribution of NCs in Guangzhou. (a) 2014 NCs; (b) 2020NCs.
Ijgi 11 00303 g004
Figure 5. Spatial distribution of 2014 BUAs in Guangzhou delineated from different grid maps: (a) 50 m × 50 m; (b) 100 m × 100 m; (c) 150 m × 150 m; (d) 200 m × 200 m; (e) 250 m × 250 m; (f) 300 m × 300 m.
Ijgi 11 00303 g005
Figure 6. Spatial distribution of Guangzhou 2020 BUAs delineated from different grid maps: (a) 50 m × 50 m; (b) 100 m × 100 m; (c) 150 m × 150 m; (d) 200 m × 200 m; (e) 250 m × 250 m; (f) 300 m × 300 m.
Ijgi 11 00303 g006
Figure 7. Spatial distribution of BUAs in Guangzhou. (a) in 2014; (b) in 2020; (c) from 2014 to 2020.
Ijgi 11 00303 g007
Figure 8. BUA expansion rates in multiple spatial orientations, 2014 to 2020: (a) Guangzhou; (b) Yuexiu; (c) Liwan; (d) Tianhe; (e) Haizhu; (f) Baiyun; (g) Panyu; (h) Nansha; (i) Huangpu; (j) Zengcheng; (k) Conghua; (l) Huadu.
Ijgi 11 00303 g008
Table 1. Accuracy evaluation of BUAs in Guangzhou delineated by different grid maps.
YearGrid BUANon-BUATotalUser’s Accuracy
2014200 m × 200 m
grid
BUA5451856396.80%
Non- BUA3552255793.72%
Total580540
Producer’s Accuracy93.97%96.67%
Overall Accuracy95.27% Kappa0.9053
250 m × 250 m
grid
BUA5526862089.03%
Non- BUA2847250094.40%
Total580540
Producer’s Accuracy95.17%87.41%
Overall Accuracy91.43% Kappa0.8279
2020200 m × 200 m
grid
BUA5522157396.34%
Non- BUA2851954794.88%
Total580540
Producer’s Accuracy95.17%96.11%
Overall Accuracy95.63% Kappa0.9124
250 m × 250 m
grid
BUA5566161790.11%
Non- BUA2447950395.22%
Total580540
Producer’s Accuracy95.86%88.70%
Overall Accuracy92.41% Kappa0.8477
Table 2. BUA expansion in Guangzhou and its 11 districts from 2014 to 2020.
Area2014 BUA (km2)2020 BUA (km2)Expansion (km2) Expansion Rate
Yuexiu29.4230.150.732.50%
Liwan38.2841.993.719.70%
Tianhe79.2182.783.574.51%
Haizhu60.0363.943.916.51%
Baiyun174.91190.2015.298.74%
Panyu152.72170.4917.7711.64%
Nansha42.2054.5212.3229.20%
Huangpu72.6480.617.9710.98%
Zengcheng79.1788.239.0611.45%
Conghua33.9438.884.9414.57%
Huadu88.89102.0513.1614.81%
Guangzhou850.72945.9695.2411.20%
Table 3. Area of BUA expansion in multiple spatial orientations, 2014 to 2020.
AreaBUA Expansion from 2014 to 2020 (km2)
NorthNortheastEastSoutheastSouthSouthwestWestNorthwest
Yuexiu0.090.170.040.050.070.060.120.15
Liwan0.270.020.040.081.381.460.040.42
Tianhe0.350.290.320.990.380.560.270.42
Haizhu0.090.570.810.520.130.371.080.34
Baiyun1.361.661.890.860.035.792.720.98
Panyu2.001.601.631.281.832.394.652.38
Nansha1.752.692.341.670.180.091.412.16
Huangpu0.210.250.320.443.942.500.280.03
Zengcheng0.200.200.072.601.264.570.150.01
Conghua0.020.340.270.061.472.380.380.02
Huadu0.890.932.192.811.971.501.581.30
Guangzhou5.040.052.952.8143.0924.9615.710.60
Table 4. Area of BUAs delineated on multiple dates using POI data and remote sensing data.
DataNO.DateArea (km2)
POI data11 January 2020945.96
21 February 2020946.58
31 March 2020947.85
41 April 2020948.67
51 May 2020949.99
61 June 2020951.14
71 July 2020951.86
81 August 2020953.00
91 September 2020954.57
101 October 2020955.88
111 November 2020957.19
121 December 2020958.10
Remote sensing data118 February 2020980.74
22 December 2020987.15
318 December 2020987.92
Publisher’s Note: MDPI stays neutral with regard to jurisdictional claims in published maps and institutional affiliations.

