
Few-Shot Building Footprint Shape Classification with Relation Network
by
 , , , and
Yaohui Hu
1 ,
,
Chun Liu
1,2,3,* ,
,
Zheng Li
1,2,
Junkui Xu
3,4,
Zhigang Han
3,4 and
Jianzhong Guo
3,4 1
School of Computer and Information Engineering, Henan University, Kaifeng 475000, China
2
Henan Key Laboratory of Big Data Analysis and Processing, Henan University, Kaifeng 475000, China
3
Henan Industrial Technology Academy of Spatio-Temporal Big Data, Henan University, Zhengzhou 450046, China
4
College of Geography and Environmental Science, Henan University, Kaifeng 475000, China
*
Author to whom correspondence should be addressed.
ISPRS Int. J. Geo-Inf. 2022, 11(5), 311; https://0-doi-org.brum.beds.ac.uk/10.3390/ijgi11050311
Submission received: 12 March 2022
/
Revised: 6 May 2022
/
Accepted: 6 May 2022
/
Published: 14 May 2022
Abstract
:Buildings are important entity objects of cities, and the classification of building shapes plays an indispensable role in the cognition and planning of the urban structure. In recent years, some deep learning methods have been proposed for recognizing the shapes of building footprints in modern electronic maps. Furthermore, their performance depends on enough labeled samples for each class of building footprints. However, it is impractical to label enough samples for each type of building footprint shapes. Therefore, the deep learning methods using few labeled samples are more preferable to recognize and classify the building footprint shapes. In this paper, we propose a relation network based method for the recognization of building footprint shapes with few labeled samples. Relation network, composed of embedding module and relation module, is a metric based few-shot method which aims to learn a generalized metric function and predict the types of the new samples according to their relation with the prototypes of these few labeled samples. To better extract the shape features of the building footprints in the form of vector polygons, we have taken the TriangleConv embedding module to act as the embedding module of the relation network. We validate the effectiveness of our method based on a building footprint dataset with 10 typical shapes and compare it with three classical few-shot learning methods in accuracy. The results show that our method performs better for the classification of building footprint shapes with few labeled samples. For example, the accuracy reached 89.40% for the 2-way 5-shot classification task where there are only two classes of samples in the task and five labeled samples for each class.
1. Introduction
The recognization of urban structure is important for cartographic generalization and urban modeling [1]. As a key component of the city, buildings often determine the structure and the form of the city [2]. Therefore, it is significant for studying the building characteristics, which has well promoted the development of multi-scale representations and been applied in urban planning, landscape analyses, and other fields [3].
When exploring the characteristics of entity objects in the field of GIS, one focus is the spatial attributes, such as location, shape, and relativity. Among these spatial attributes, shape is probably the most important attribute that objects can be perceived [4]. To some extent, shape can reflect the relationship between entity and history. For the buildings in the city, the shape of building in a certain period can reflect the cultural characteristics of the corresponding period [5]. Therefore, through the recognization and classification of building shapes, we can better recognize and plan the urban structure.
In modern electronic maps, entity objects like building footprints are often stored as vector data, and their shapes are defined as patterns formed by polygons. Many methods have been proposed by researchers from different perspectives to recognize the shape of vector objects. Traditional methods are based on geometric and statistical metrics, such as the curvature [6], the compactness [7], and the triangular centroid distances (TCDs) [8]. More recently, Fu et al. [9] proposed a moment-based method to measure shape similarity, while Fan et al. [10] proposed a method based on multiscale features and grid context descriptors to solve the shape recognition problem. These methods are intuitive but tend to ignore the fact that shapes are complex and cognitively relevant [11]. In order to extract deeper shape features of vector objects, researchers recently have proposed some methods based on deep learning, such as graph convolutional neural network [12], graph convolutional autoencoder [11], and deep point convolutional network [13].
In the past few years, deep learning methods, particularly supervised deep learning methods, have achieved excellent results in several fields such as computer vision [14,15,16] and geoscience [17,18,19,20]. These methods often require a large number of labeled samples for training the neural network models. However, for some tasks in practice, it is costly or impossible to obtain enough labeled samples. This severely limits the scalability and applicability of these methods [21].
Few-shot learning proposes a series of solutions to the above problem encountered by traditional deep learning methods. Its purpose is to let machine learning models recognize a new object like humans which can learn a new object with few samples [22,23]. Currently, the research of few-shot learning is carried out from several different perspectives, such as metric-based learning methods [21,24,25] and parameter optimization-based methods [26,27,28]. Most few-shot learning methods draw on the meta-learning strategy whose purpose is to train a model with a large number of tasks and generalize it to a new task. It usually constructs a lot of meta tasks with an available dataset and divides the whole learning process into two phases: meta training and meta testing. In meta training, the model is generalized under different classes by different meta tasks so that it can recognize and classify new classes of the new task in meta testing [29,30,31].
In maps, there is a wide variety of building footprints whose shapes are diverse. It would be costly or even impossible to label a large number of samples for each building footprint shape. For example, in the study by Yan et al. [11], only ten kinds of building footprint shapes were labeled based on the similarity between building footprints and alphabets. Moreover, for some building footprints, for example, the newly emerging building footprints, it is impracticable to obtain lots of samples which have the same shapes. Therefore, it is valuable for the few-shot methods which can achieve recognization and classification of building footprint shapes when there are only few labeled samples available.
In this paper, we propose a relation network based few-shot method for the classification of building footprint shapes. Relation network, composed of the embedding module and the relation module, is a metric based few-shot method which aims to learn a generalized relation metric function and predict the types of the new samples according to their relation with the prototypes of these few labeled samples [21]. It uses the embedding module to obtain the features of the samples and computes the relations between the features and the prototypes of these few labeled samples by relation module. Considering that the building footprints are in the form of vector polygons, we take the TriangleConv convolutional module proposed in our previous work [13] as the embedding module of relation network to better extract the shape features of building footprints. Our experiments demonstrate that the proposed method is better than the classical few-shot learning methods in solving the problem of recognizing and classifying building footprint shapes with few labeled samples.
The remainder of this paper is organized as follows. Section 2 presents in more detail the work related to the recognization and classification of shapes of vector polygons like building footprints and the work related to few-shot learning. Section 3 gives the problem statement of this paper and describes the details of the proposed relation network based method. Section 4 reports the experimental data, data pre-processing operations, and the analysis of the experimental results. In Section 5, we conclude our work.
2. Relate Work
2.1. Building Footprint Shapes Recognization in Maps
In maps, building footprints are important geographical objects, which are widely distributed in large and medium-sized maps [32,33]. Furthermore, the shape is an indispensable geometric property of geographical objects, which effectively facilitates the recognization of these objects [34,35]. In the past decades, the study on the shape of vector geographic objects such as building footprints in maps can be divided into two phases: one based on geometric and statistical metrics, and the other based on deep learning.
Methods based on geometric and statistical metrics are easy to understand, and most of them focus on the region or boundary of the objects [11]. Region-based methods select metrics usually in terms of the object as a whole. For example, Li et al. proposed a method to compute shape compactness based on the moment of inertia [7], and Basaraner and Cetinkaya presented Equivalent Rectangular index and Roughness index to help describe the shape [36]. The boundary methods fit shapes to some descriptors to better investigate the shapes. For example, Belongie et al. presented shape contexts to measure similarity between shapes [37]. Alajlan et al. [38] proposed a shape retrieval method using triangle-area representation, and Yang et al. [8] proposed triangular centroid distances to solve the partial shape matching problem.
While methods based on geometric and statistical metrics often fail to capture deeper shape features, deep learning methods have proven their ability to extract the deep feature information of objects. Since geographic vector objects are non-Euclidean, the usual deep learning methods applied to Euclidean data such as images are not well suited to geographic vector objects [11]. In recent years, with the rise of the concept of graph convolution, Yan et al. used graph Fourier transform and the convolution theorem to extract the shape features of building groups [12] and used the graph neural network of the spectral domain to construct a graph convolutional autoencoder (GCAE) model to extract the shape features of the building footprints [11]. In our previous work [13], a deep point convolutional network has also been proposed for building footprint shape recognization by using a TriangleConv operator during convolution. Although these methods can extract the shape features of vector objects, the results of these methods are supported by a large number of training samples, and the performance of these methods will be severely limited when there are only few labeled samples available.
2.2. Few-Shot Learning
After years of development, supervised deep learning methods that use a large amount of labeled data as support for a particular application have gained widespread attention due to their excellent performance [39,40,41]. However, these methods are severely limited in their effectiveness when solving tasks with few labeled samples [22].
Few-shot learning is a kind of machine learning problem that can acquire prior knowledge from a large number of supervised samples and then use the knowledge to generalize to new tasks which contain only few supervised samples [22,23]. Earlier work on few-shot learning was typically implemented based on complex iterative inference strategies [42,43]. With the popularity of deep learning, few-shot learning methods based on deep learning have gradually increased. Most methods use meta-learning (learning to learn) strategy [21,25,28], where prior knowledge gained from specific tasks is used to guide the learning of new tasks so that the network can quickly fit the new tasks.
Depending on the way to solve the problem, few-shot learning methods can be classified into four classes: data augmentation-based methods, metric-based methods, optimization-based methods, and semantic-based methods. The key to data augmentation methods is to generate more samples based on few labeled samples to provide richer prior knowledge for the model. This technique is commonly used in the field of image processing, and common data augmentation techniques include scaling, rotation, etc. [44,45]. Optimization-based methods introduce optimizers such as memory augmented networks and long short-term memory into the training to help the model achieve excellent results on new tasks [26,27]. Metric-based methods use methods such as convolutional neural networks to transform the data into the corresponding embedding representation and then use some metric methods to achieve comparison and clustering of the embedding representation [21,24,25]. Semantic-based methods are more often applied to solve zero-shot learning, which is a special case of few-shot learning. Semantic-based methods add additional semantic information to the data, and the information can help the model to acquire more prior knowledge and thus perform new tasks better [46,47]. This paper follows the relation network which is a kind of metric based method [21] to achieve few-shot building footprint shape recognization. Furthermore, considering the characteristics of the vector building footprints, we use the TriangleConv module to replace the 2D convolutional module in our method to better obtain the embedding representation of building footprint shapes.
3. Methodology
In this section, we state the problem of the few-shot building footprint shape classification in maps, present the network and the training strategy of the proposed method, and describe how to apply the proposed method in practice.
3.1. Problem Statement
Existing deep learning methods for the recognization and classification of building footprint shapes often require a large number of supervised training samples. However, there is a large variety of building footprint shapes, and it is costly to mark a large number of training samples for each building footprint shape. In this case, the few-shot building footprint shape classification problem is about whether we can recognize the specific shapes of lots of unlabeled building footprints with only a small number of labeled samples. Following the few-shot learning, the set of few labeled samples is called the support set , and the set of unlabeled building footprints is called the query set . If the support set contains C classes and each class contains K labeled samples, such few-shot problem is called C-way K-shot problem.
To predict the shapes of these building footprints in by using these labeled samples in , the intuitive method is to label the building footprints in according to their similarity with the samples in . In this way, the key is the metric that estimates the similarity between the samples in and . Besides these simple metrics such as the Cosine similarity and the Euclidean distance, it is preferable to learn a more suitable metric from labeled samples with deep learning techniques. Given the small number of labeled samples in the support set, obviously, it is difficult to learn a metric for that purpose. In light of that, current few-shot learning methods usually resort to available datasets which have lots of labeled samples that often belong to the different classes compared with the samples in and aim to learn a generalized metric which can be further fine-tuned using the samples in and . Such datasets are often called the base dataset . In comparison, the dataset in the current task, i.e., the dataset consisting of the support set and the query set , is called the novel dataset . The base dataset provides the metric with some transferable prior knowledge and allows it to be sufficiently generalizable. In general, the classes in and have little or no intersection.
3.2. The Model
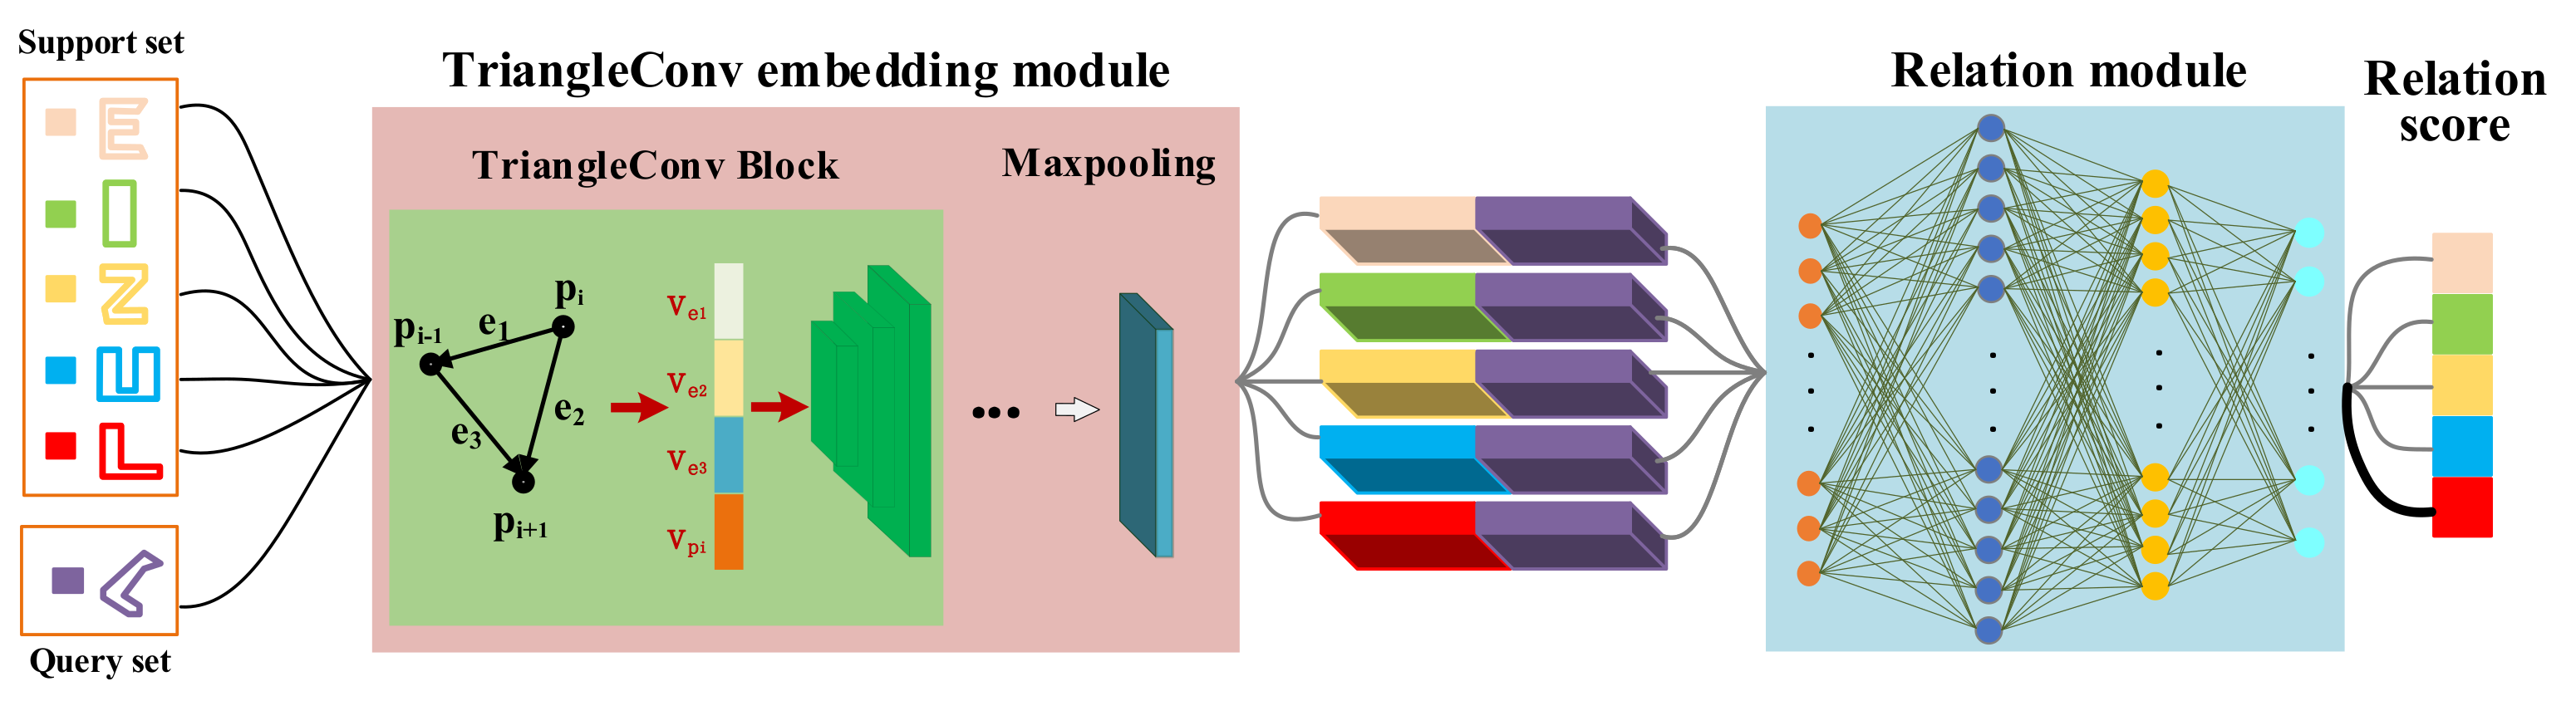
To address the few-shot building footprint shape classification problem, this paper proposes a relation network based method by following the metric-based method. As can be seen in Figure 1, the relation network model used in this paper consists of two modules: embedding module and relation module. The two modules are two different networks. The embedding module is to embed the input samples and obtain their deep features. The relation module learns a relation metric that measures the similarity between the feature of samples in the query set and the prototypes of each class of samples in the support set. Based on our previous work on building footprint shape classification, we adopt the TriangleConv embedding module to act as the embedding module of the relation network to map the input building footprints into the shape features.
The inputs to our relation network model are the preprocessed vector building footprint data in the form of closed polygons without any internal holes. That is, each building footprint input to the network is essentially an ordered set of vertices of polygon , each vertex in the set can be represented as , and all the building footprints input have the same number of vertices. With the TriangleConv embedding module in our method, the features of the samples of each class in the support set are generated and the prototypes of each class are obtained. For the C-way K-shot problem, there are C classes in the support set and each class has K samples. After obtaining the embedding feature of the j-th sample of class c, the prototype of class c is calculated as follows:
For the unlabeled sample in the query set , once its embedding feature is obtained through the TriangleConv embedding module, the embedding feature is concatenated together with the prototype of class c and input to the relation module to compute the relation score between the sample and class c. Thus, the output of the proposed method is the relation scores which indicate the possibility that the samples in the query set belong to the classes in the support set. The label of the sample in is predicted by the class with the highest relation score.
3.2.1. TriangleConv Embedding Module
For the choice of embedding module, most existing few-shot learning methods use multiple 2D convolutional blocks to form the embedding module [21,25,29]. Considering that the building footprints are often represented in the form of non-Euclidean vector data which do not have a regular structure, we adopt the TriangleConv module presented in our previous work [13] to embed the building footprints and extract their shape features.
The TriangleConv module uses a new convolution block named TriangleConv to perform convolution on the vertices of the vector building footprints. In deep learning, the convolution operation can be viewed as an aggregation of the features of a point and its neighbor points in the receptive field. Accordingly, the TriangleConv operator was to aggregate the features of a vertex and its two adjacency vertexes to generate the new features of the vertex. Thus, the local shape features around the vertices can be learned by applying the TriangleConv block.
As shown in Figure 1, and are the two vertices adjacent to in the triangle region corresponding to . With the coordinates of these vertexes, the TriangleConv block first generates four kinds of feature information ,, and . is the coordinate value of . , and correspond to the difference between the coordinates of and , and , and , respectively. After concatenating them together, the multilayer perceptron(MLP) is used to map the features into higher dimensional space. There are two TriangleConv blocks within the TriangleConv embedding module. They map the features of each vertex to higher dimensional representations. Finally, the max-pooling is used to aggregate the feature information of each vertex to generate the shape feature of the input building footprints.
3.2.2. Relation Module
The entire relation module can be expressed as Formula (2). After obtaining the prototypes of each class in and the embedding features of each sample in , the relational module will produce a total of results in the case that there are C way and N samples in . Each result represents the relation score indicating the similarity between the c-th prototype and the embedding feature of j-th sample . The value is between 0 and 1. The larger the value, the higher the similarity between the prototype and . The j-th building footprint will be labeled as the shape of the class with the highest relation score.
The relation module consists of two 1D convolutional blocks and two fully connected layers. Each 1D convolutional block contains a 1D-Conv, a 1D BatchNorm, a LeakyReLU activation function, and a MaxPool1d. The two fully-connected layers are 8 and 1 dimensions, respectively. The Sigmoid function is used as the activation function in the output layer. Furthermore, the mean square error (MSE) loss defined in the Formula (3) is taken as the loss function where is the real data, is the fitted data, and .
3.3. Training Strategy
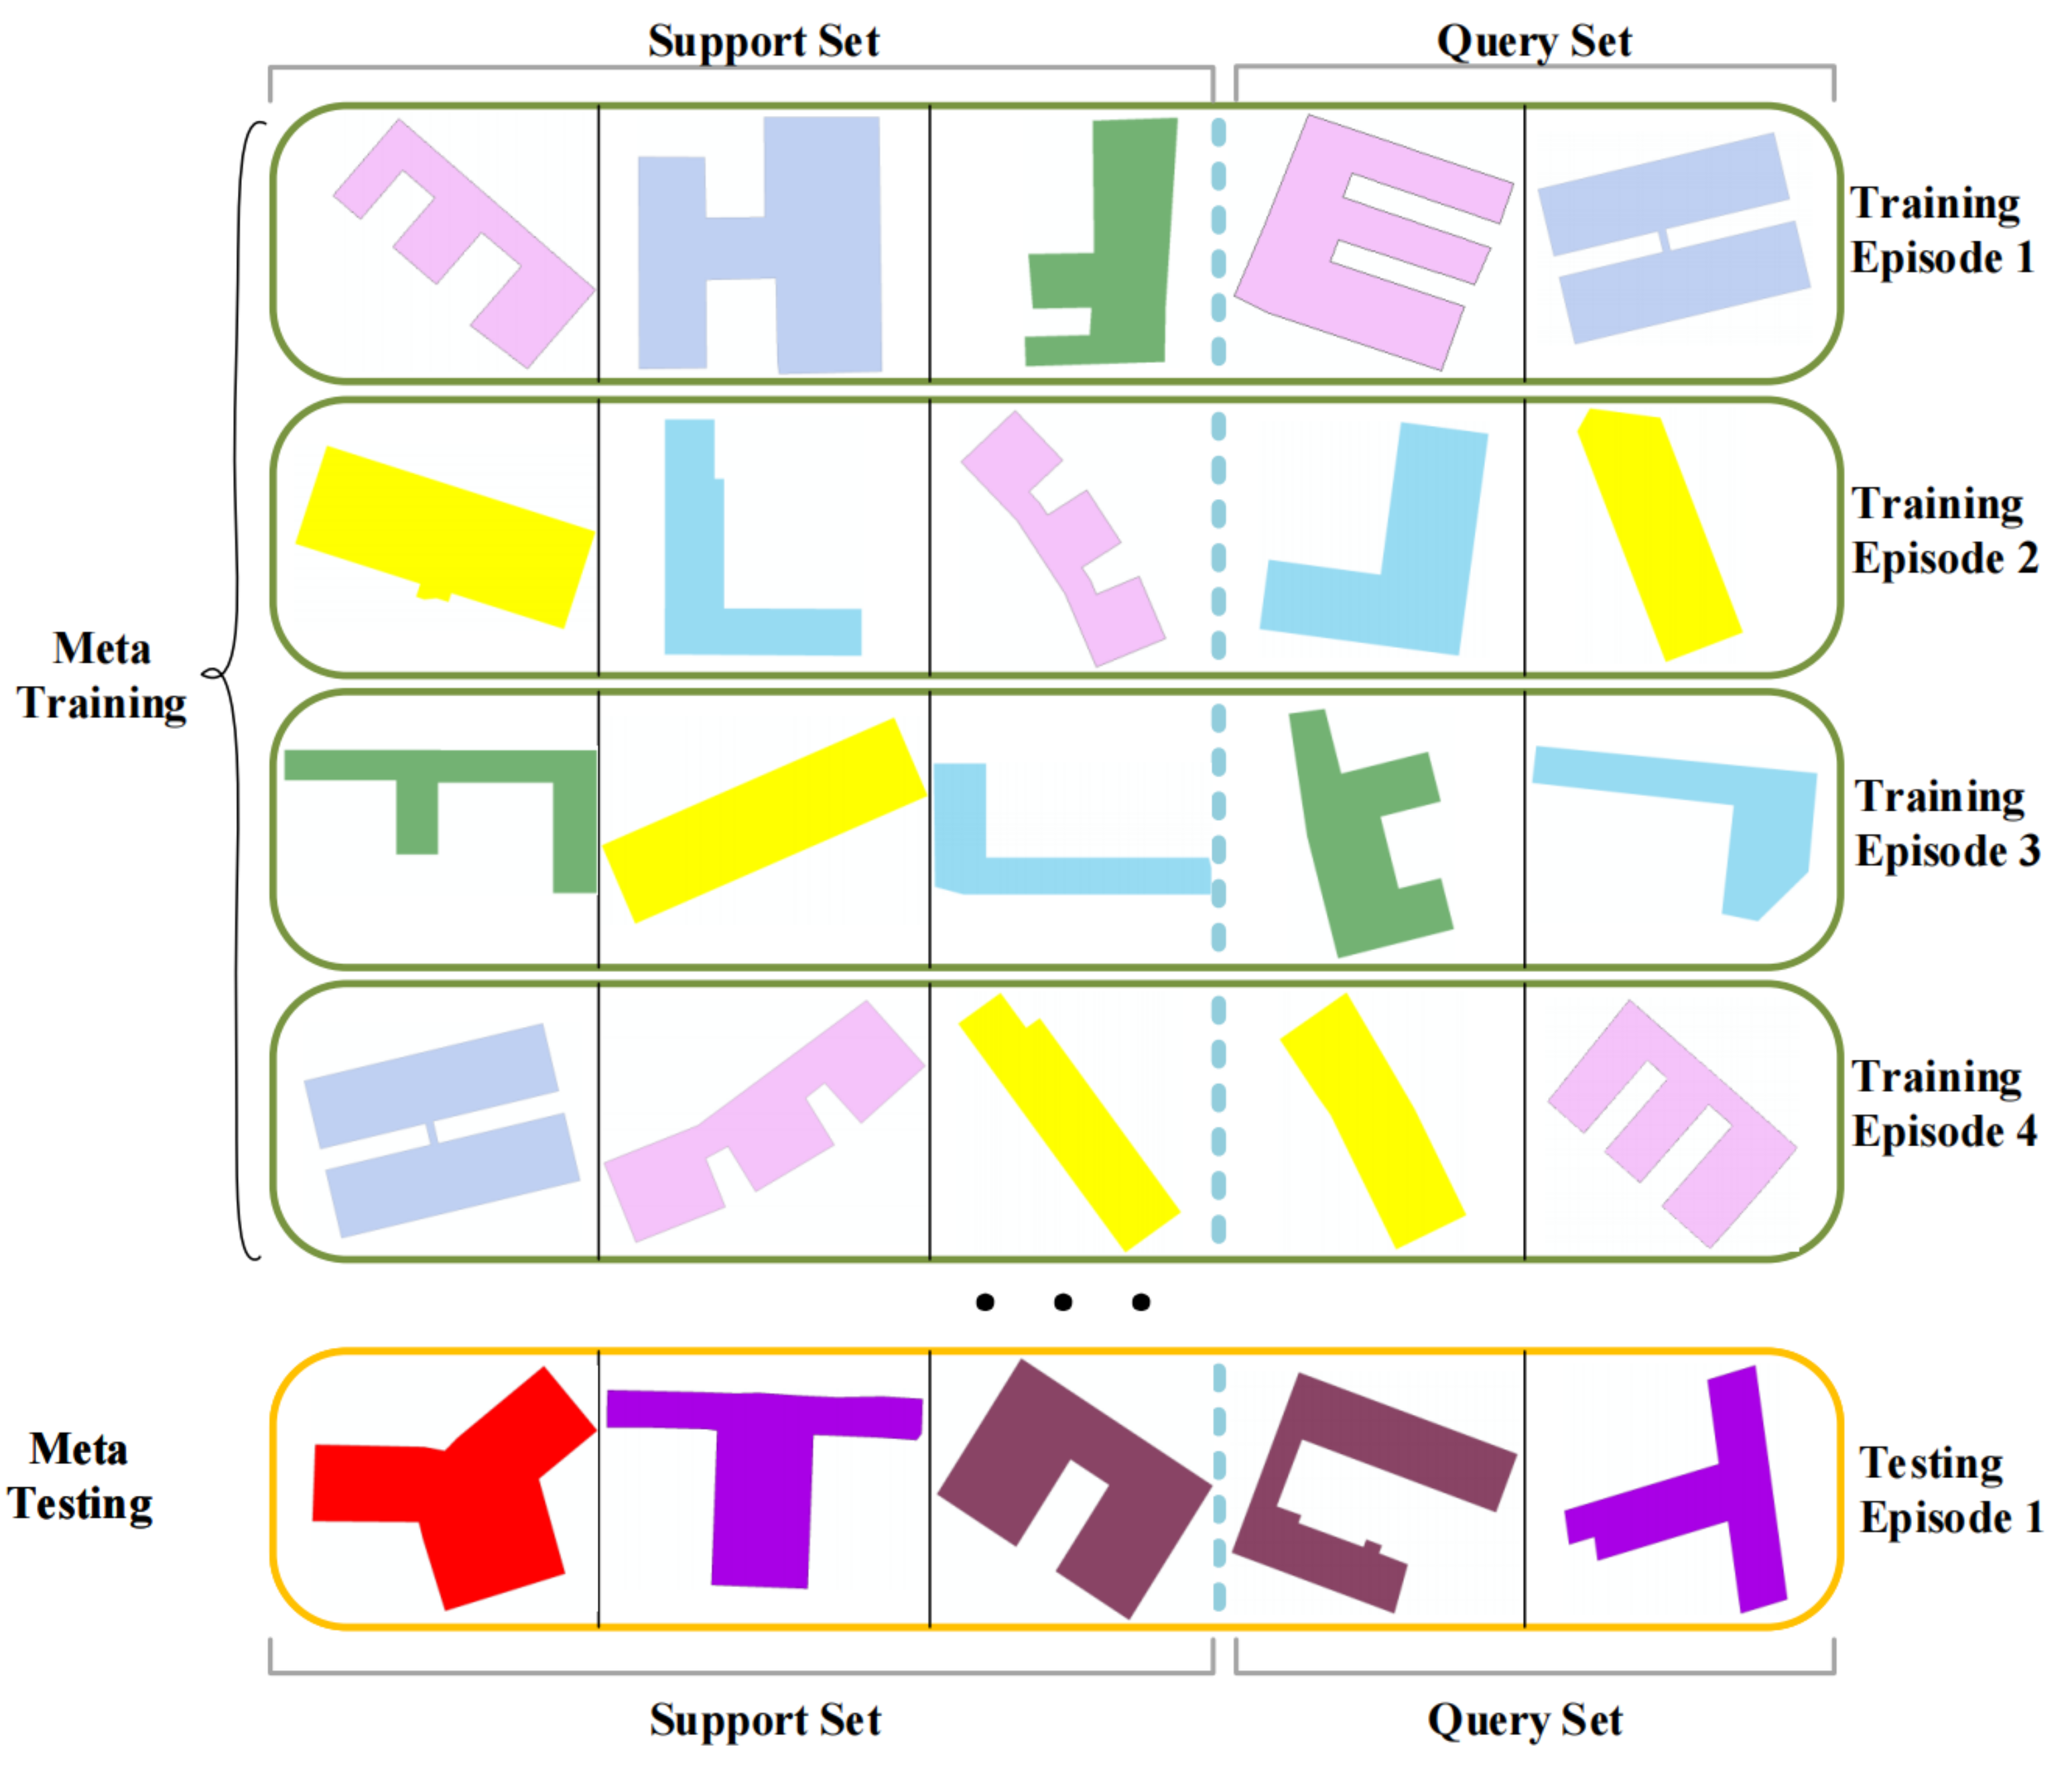
To train the model for the building footprint shape classification, we adopt the episode based meta-learning training strategy which is used in many classical few-shot learning methods [21,25]. An example is illustrated in Figure 2.
Different from traditional deep learning which trains models by iterating over supervised samples, the meta-learning strategy typically uses the tasks as training examples. After the model has been trained to adapt well to a large number of different tasks, it can also adapt well when processing new tasks. For this purpose, the meta-learning training strategy adopts the episode based training process which consists of a lot of episodes. In each episode, there is a task consisting of a support set and a query set. The model is trained by using the support set and validated and updated by using the query set. Particularly, the entire episode based training process is separated into two phases: the meta-training phase and the meta-testing phase. In the meta-training phase, a lot of training tasks are constructed by using the base dataset to train the model. In the meta-testing phase, the classification performance of the trained model for new tasks constructed from novel dataset is evaluated. To ensure the generalization ability of the model to be trained, both the training tasks and the new tasks are sampled based on the same distribution from the datasets. That is, both the support set and the query set of the training task have the same number of classes and each class has the same number of samples as that in the new task.
As shown in Figure 2, each green box in meta training and each orange box in meta testing all represent an episode. In each episode, we randomly draw a fixed size of building footprint data from the dataset to form the task for the episode. In detail, taking the meta-training task as an example, we randomly select C classes of building footprint data from the meta-training dataset, each class contains samples, where building footprint samples form the support set and the remaining samples form the query set. After obtaining the relation scores indicating the probability that each sample in the query set belongs to the classes in the support set, we select the class with the highest relation score as the label of the sample and use Formula (3) to calculate the loss function and update the model.
3.4. The Classification of Building Footprint Shapes under Few-Shot Setting
When applying our method trained for the classification of the shapes of a set of unlabeled building foorprints which was not be seen in training phase, it is required that there should be more than C classes and more than K building footprint samples per class. Among them, at least K building footprint samples per class should be labeled. Such set of building footprint samples forms the novel dataset which we have described in the problem statement.
Given the novel dataset , a set of tasks can be constructed by sampling C classes and building footprint samples per class from the dataset where the K samples per class are the labeled samples. Like that in the meta-testing phase shown in Figure 2, the samples of a task are input into the trained model in one episode. First, the shape features of these building footprint samples are extracted by the embedding module. Then, the prototypes of each class of the task are obtained by averaging the features of these labeled samples of each class. After that, the features of each unlabeled sample are concatenated with these prototypes, and the concatenations are input into the relation module to obtain the relation scores indicating the probabilities that the unlabeled samples belong to the shape classes. Finally, the shape class of each unlabeled sample is predicted as that with the highest relation score. The prediction accuracy can be calculated for each task, and the average accuracy can be taken as the result when there are more than one task constructed from the dataset .
4. Experiments
In this section, we describe the experiments that we have taken to validate the proposed method. We first describe the dataset, the data pre-processing operations, and the parameter settings used in our experiments. Then we provided details and the results of the evaluations.
4.1. Dataset and Preprocessing
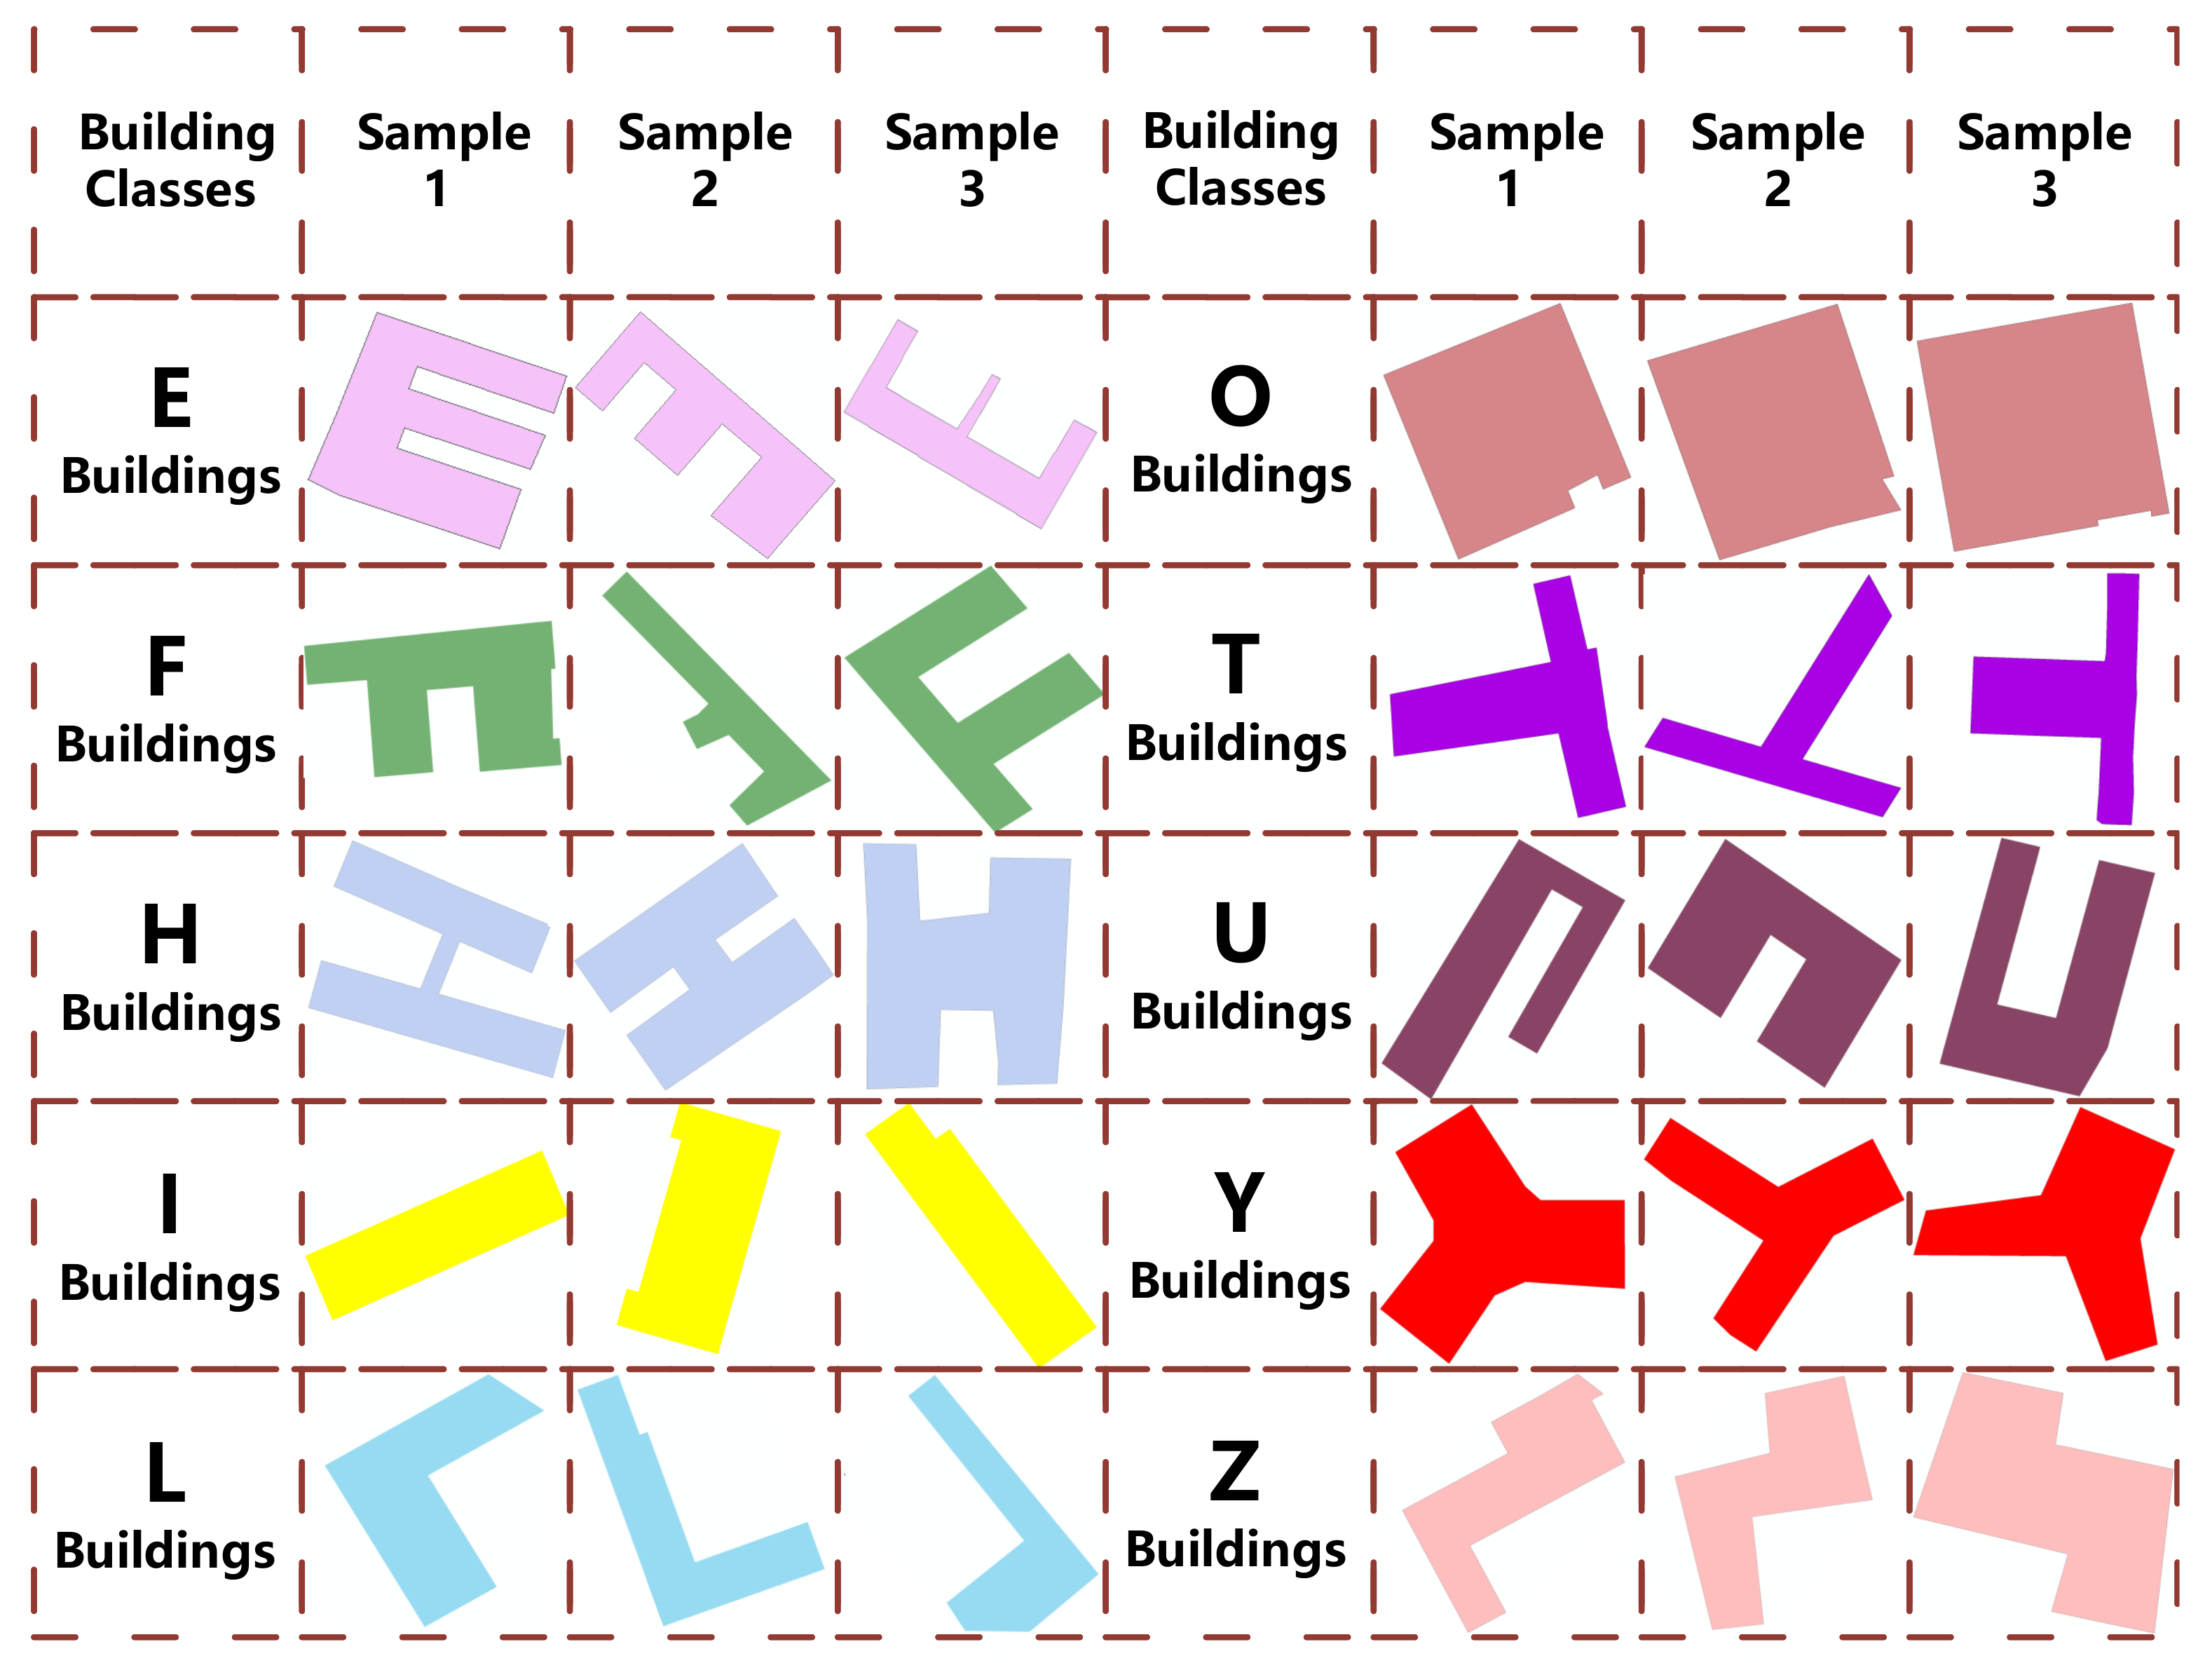
We constructed our experimental dataset using the data in [11]. The data were collected from OpenStreetMap. There are 10 classes of building footprints in the dataset, and each class contains 501 building footprints. To ensure that the data are broadly representative, they are selected from areas with different geographical characteristics, such as urban, rural, etc. Since the building footprint shapes are generally similar to the English alphabet and using letter shapes to label building footprints enhances recognition [3], the building footprints are labeled as 10 typical English alphabets, such as U-Shape, H-Shape, and F-Shape. The labels for all data were manually tagged by three people with map knowledge, and for disputed data, the shapes were determined jointly by three people. The shapes of the building footprints in the dataset are essentially closed polygons, and there are no holes in the interior of the polygons. Some raw data samples of 10 building footprint shapes are shown in Figure 3.
Similar to the few-shot learning methods in image processing, we need to preprocess the individual building footprint data to ensure that all data fed into the relation network have the same number of vertices and are normalized. So some preprocessing methods used in [11] are adopted for our work. We use the Douglas–Peucker method [48] with a conservative and empirical threshold of 0.1 m to simplify the original data, then perform the spaced interpolation on the simplified data to unify the number of vertexes of different vector objects. Furthermore, we use the Z-score method to normalize the data.
4.2. Experimental Settings
The programming language used for the experiments is Python in version 3.6, and our relation network is implemented by using the deep learning framework Pytorch [49], version 1.6.0. The main hardware used for the experiments is 64G RAM, Intel Core I9-9900K, and NVIDIA GeForce RTX 2080Ti with CUDA version 10.2.
Given the limited classes of our datasets and the general setup of few-shot learning experiments, we conducted 9 sets of evaluation experiments. They are the 2-way 1-shot experiment, the 2-way 3-shot experiment, the 2-way 5-shot experiment, the 3-way 1-shot experiment, the 3-way-3 shot experiment, the 3-way 5-shot experiment, the 4-way 1-shot experiment, the 4-way 3-shot experiment, the 4-way 5-shot experiment, respectively. For query data, we have 19 query samples in the 1-shot experiment, 17 query samples in the 3-shot experiment, and 15 query samples in the 5-shot experiment. In other words, for the 3-way 5-shot, there are 3 ∗ 5 + 3 ∗ 15 = 60 building footprints in the task of one episode.
In a similar way as that in [21], we set the number of test episodes to 300 and averaged the results of these 300 episodes to calculate the performance of the relation network in one trail. We randomly selected 5 classes of building footprints as the base dataset and the remaining 5 classes of building footprints as the novel dataset in each trial. The base dataset is used for training in the meta-training phase and the novel dataset is used for testing in the meta-testing phase. When randomly selecting 5 classes from 10 classes of data, there are , i.e., 252 kinds of selection. In our experiments, we have randomly selected the data 60 times and the final result is the average of the results of 60 trials.
We chose Accuracy as the evaluation metric for each trial, which is defined as Formulas (4) and (5). In Formula (5), is the ith test sample, is the prediction class corresponding to , and is the true class of . It can be seen that Accuracy measures the proportion of all correctly classified samples to the total number of samples.
4.3. Results and Analysis of Different Embedding and Metric Modules
Our proposed relation network based method is a metric-based few-shot learning method which is a combination of an embedding module and a similarity metric module. In this subsection, we evaluate the different choices of the embedding and metric modules. For the embedding module, we choose the 2D convolutional module commonly used in traditional few-shot learning [24,25,27] and the TriangleConv module used in our method. For the metric module, we chose the Cosine similarity and the relation module used in our method. It should be noted that when using the 2D convolutional module as the embedding module, the relation module will consist of 2D convolutional blocks to match the embedding module, and when using the TriangleConv module, the relation module should consist of 1D convolutional blocks. The parameters of the experimental setup remain the same between the experiments. The results for the combination of different embedding modules with different metric modules are shown in Table 1.
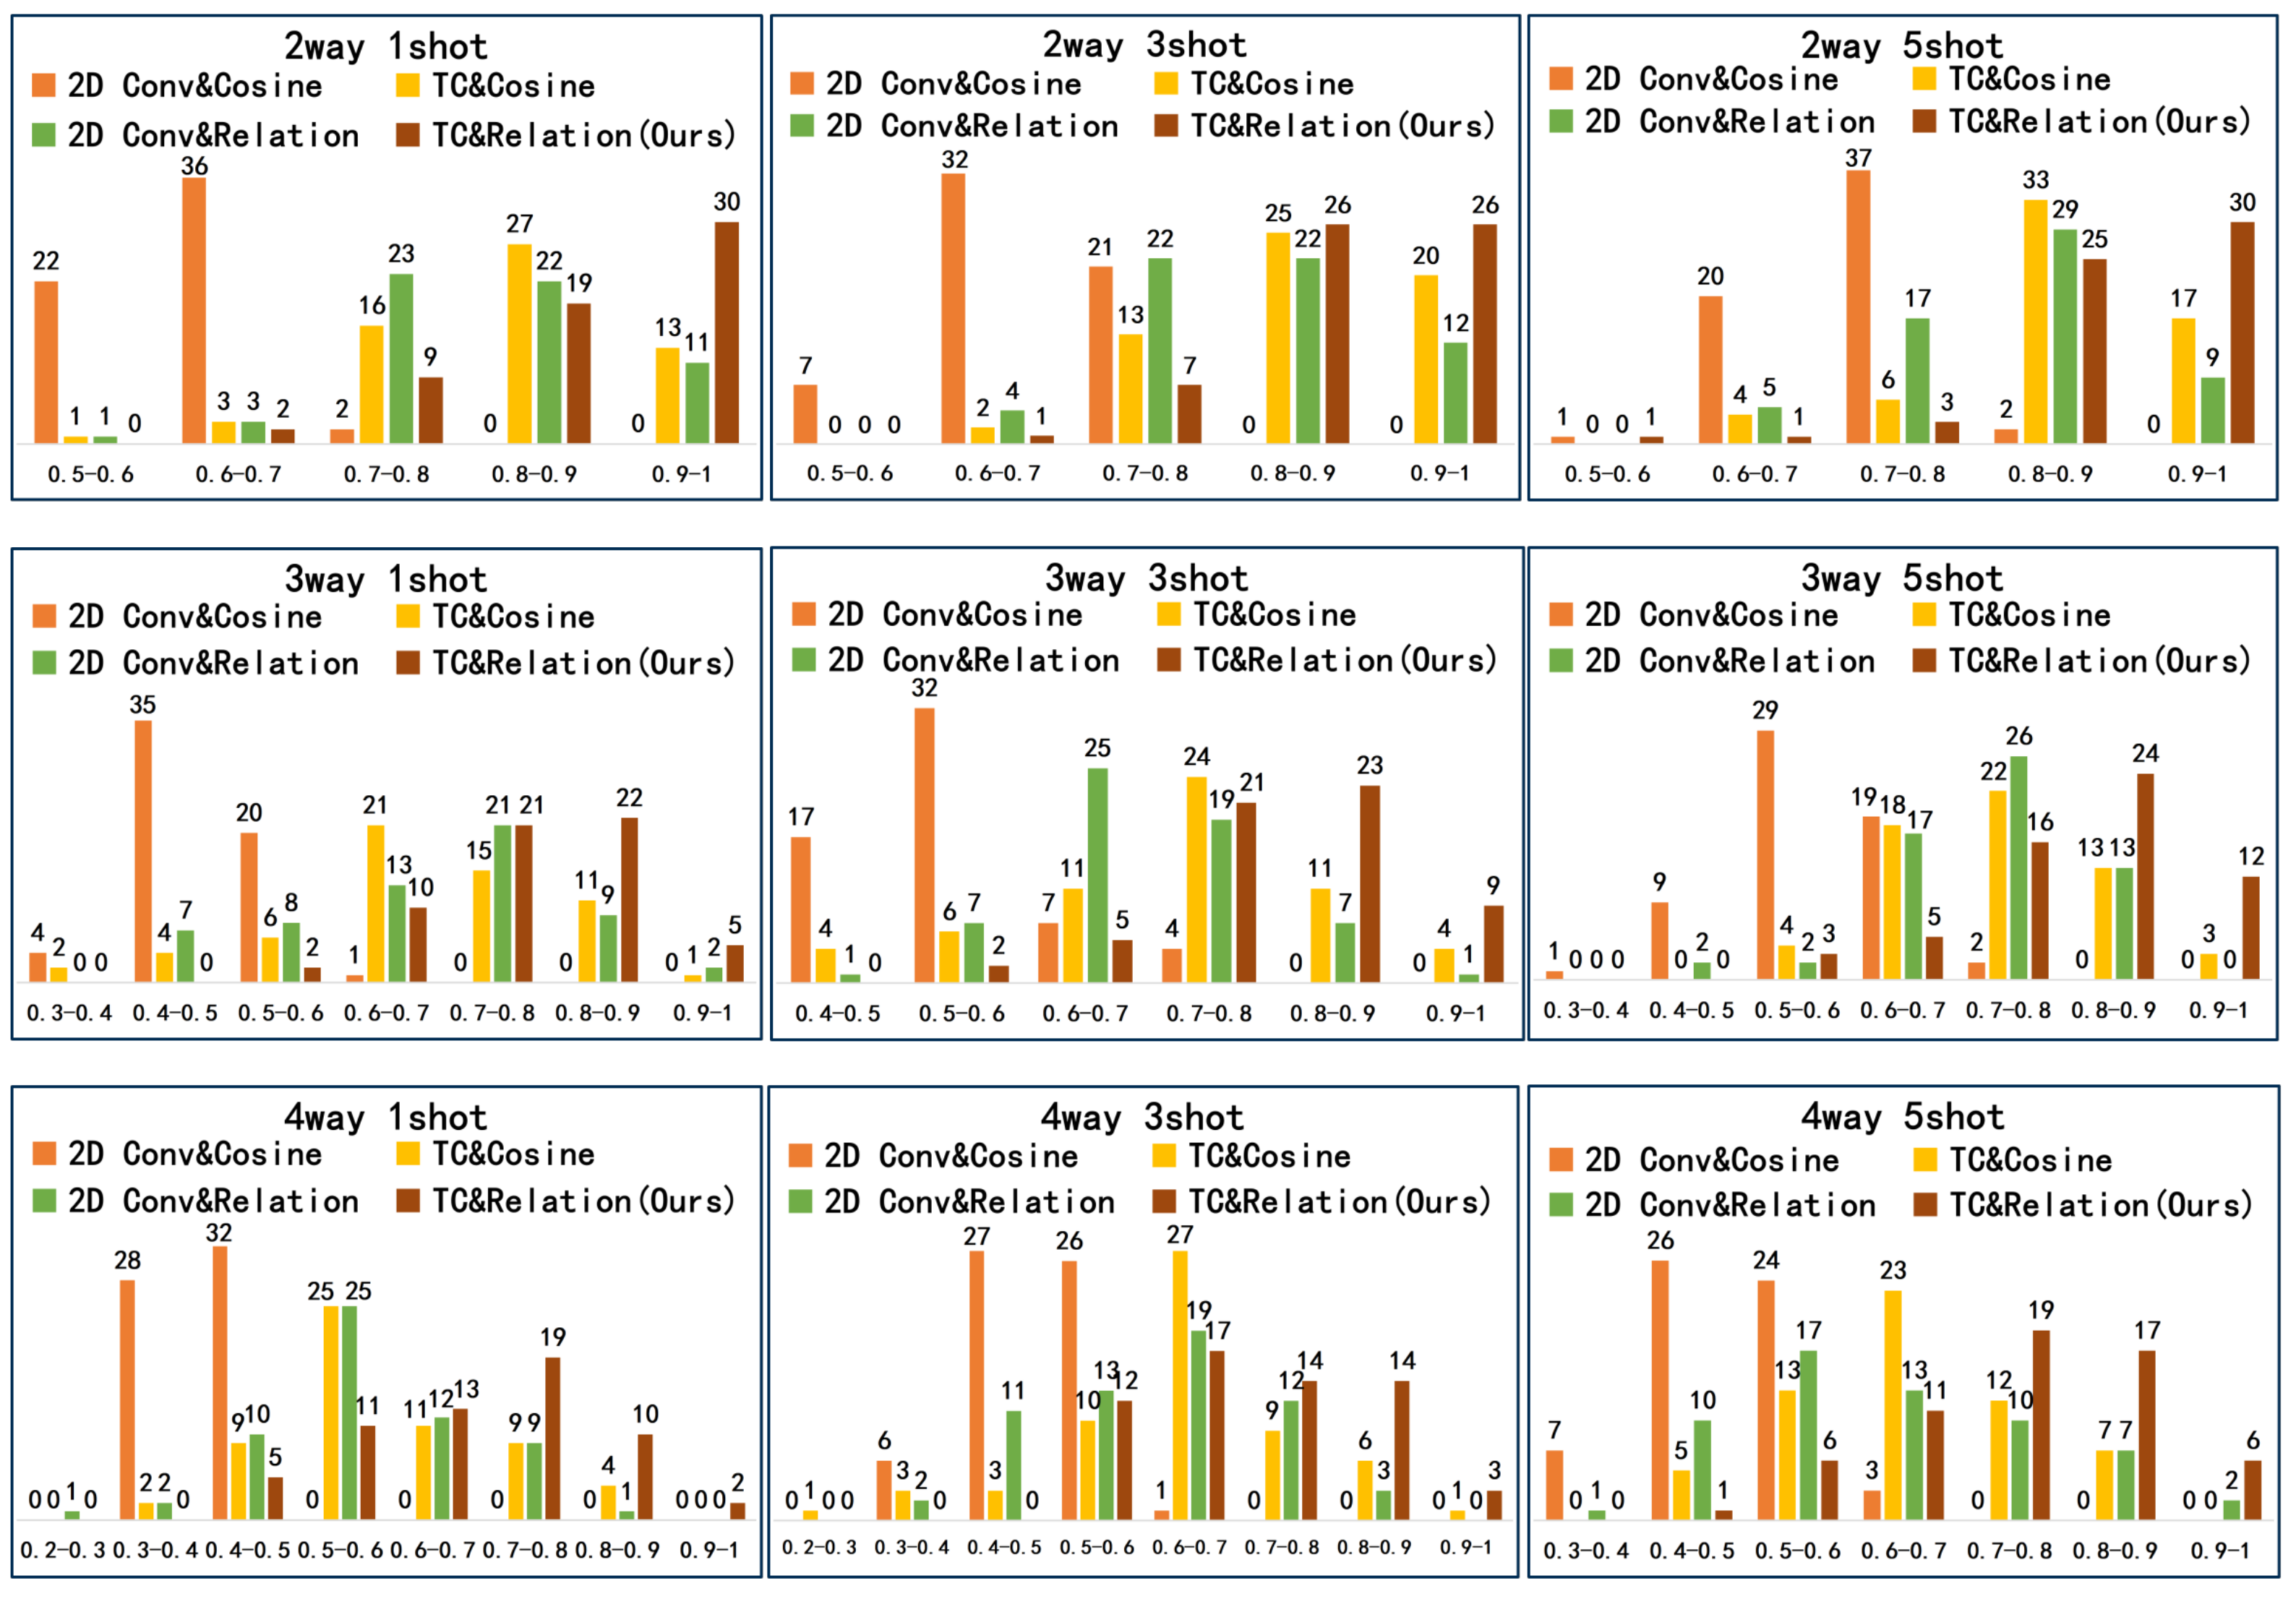
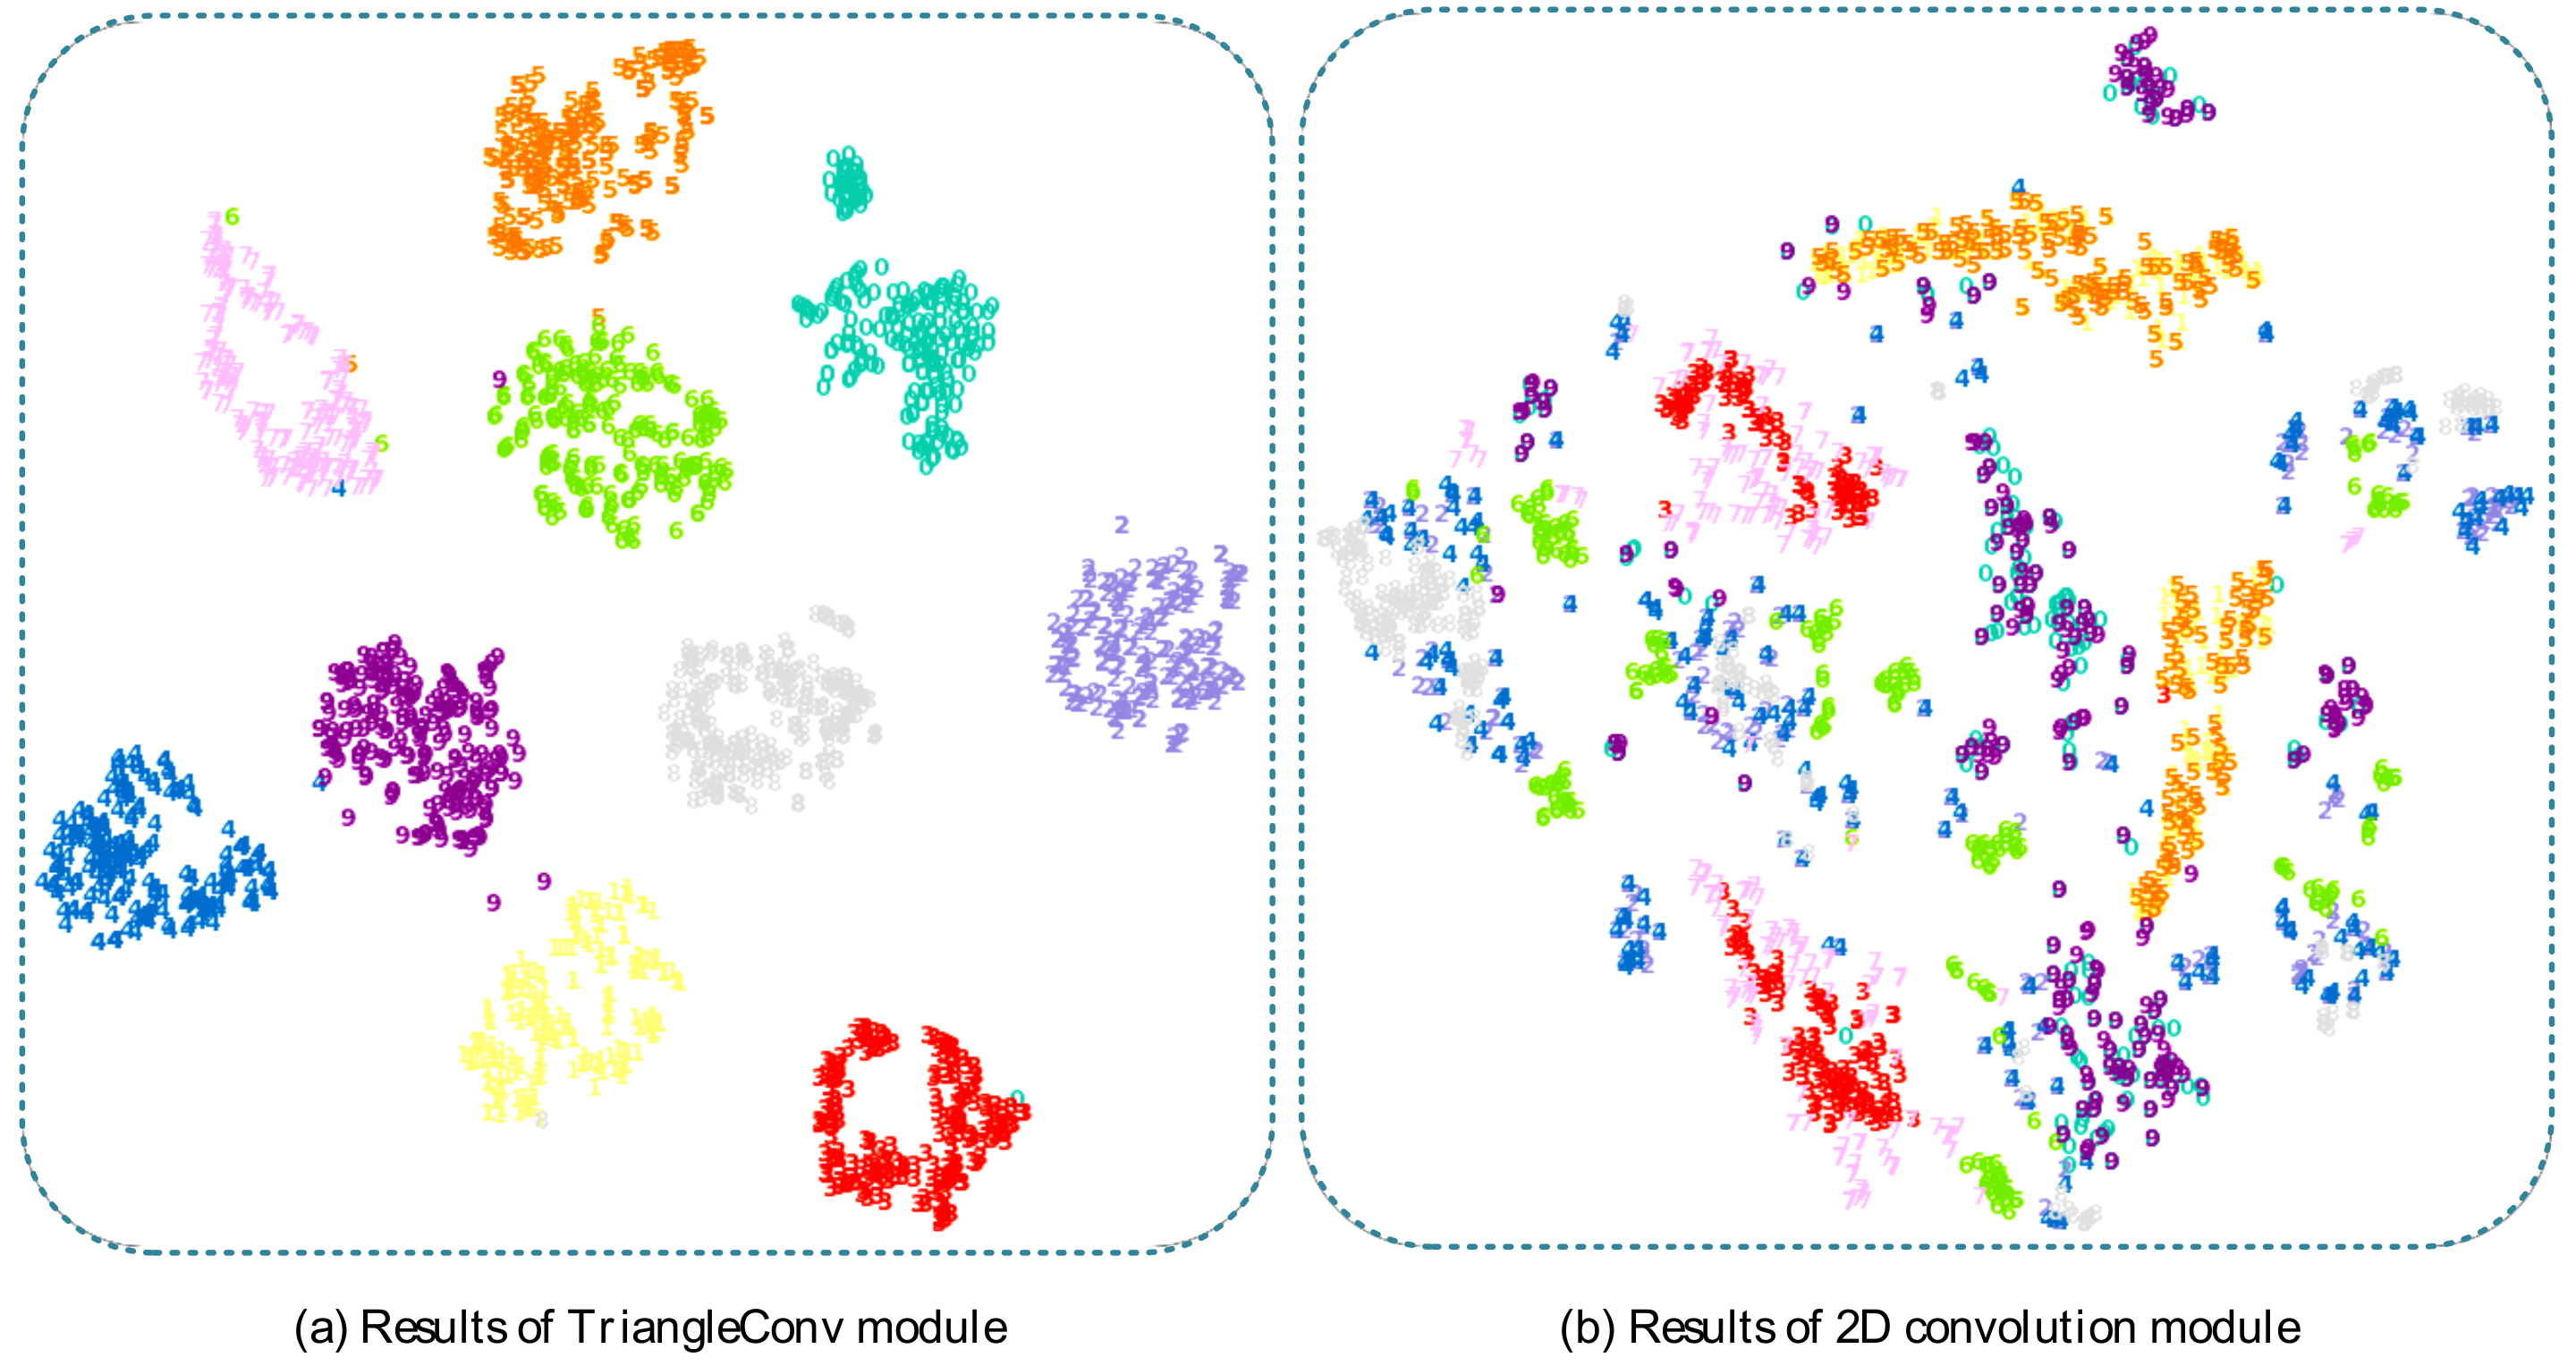
The experimental results in this section demonstrate that both the TriangleConv embedding module and the relation module played positive roles in solving the few-shot learning problem of recognization and classification of vector building footprint shapes under our experimental conditions. From Table 1, comparing the results of experiments (1) and (2) and experiments (3) and (4), we can find that the results of the methods using the TriangleConv module are better than the results of the methods using the 2D convolutional module. In Figure 4, the results of the method using the TriangleConv module are mostly distributed in the interval 0.6–1, while the results of the method using 2D convolutional blocks are mostly distributed in the interval 0.3–0.7. This is probably because the TriangleConv module is better at extracting features of building footprint shapes than the 2D convolutional module. Figure 5 shows the visualization of the feature embeddings, which is obtained using the T-SNE method [50]. It is also clear that the clustering effect of the embeddings obtained by the TriangleConv module is better. Comparing the results of experiments (1) and (3) and experiments (2) and (4), the results show that the method using relation module is superior to the method using Cosine similarity, and this is similarly borne out in Figure 4. This may be that the relation module can learn to obtain a metric more adapted to solve the problem of this paper.
4.4. The Comparison with Related Few-Shot Learning Methods
To further validate the performance of our proposed method, we selected three classical methods of few-shot learning for comparison: convolutional siamese net(CSN) [24], model-agnostic meta-learning(MAML) [27], and prototypical network(PN) [25]. The CSN is a deep neural network that determines the similarity of two samples. It constructs different pairs of samples by combining them, and uses the same deep neural network to extract the features of the two input samples, then calculates the similarity between the features and updates the deep neural network parameters. The prediction of the results is based on the similarity between the samples and the classes to which they belong. The MAML trains a set of initialization parameters, which can be quickly adapted to a new task with only few data by applying one or more steps of gradient adjustment. The core idea is to find the initial parameters of the model that allows the model to learn quickly and obtain a better result on few training data for a new task. The PN maps the samples in each class to their embedding features and calculates their mean as the prototype of the class. With the Euclidean distance as the distance metric, the network is trained with the assumption that the samples of one class are close to the prototype of this class and far away from the prototypes of other classes.
We used the Pytorch-based implementation of these baselines from Github to complete our experiments. In our experiments, all building footprint data input to each model was preprocessed using the methods in Section 4.1, and the number of vertices of building footprints was unified to 16. The learning rate for all methods was set to 0.001. The averaged results of all methods over 60 trials are given in Table 2. Due to that the CSN is usually used for 1 shot tasks, the discussion of CSN in this paper is limited to 1 shot. The results of all baselines are also the average of the results of 60 trials.
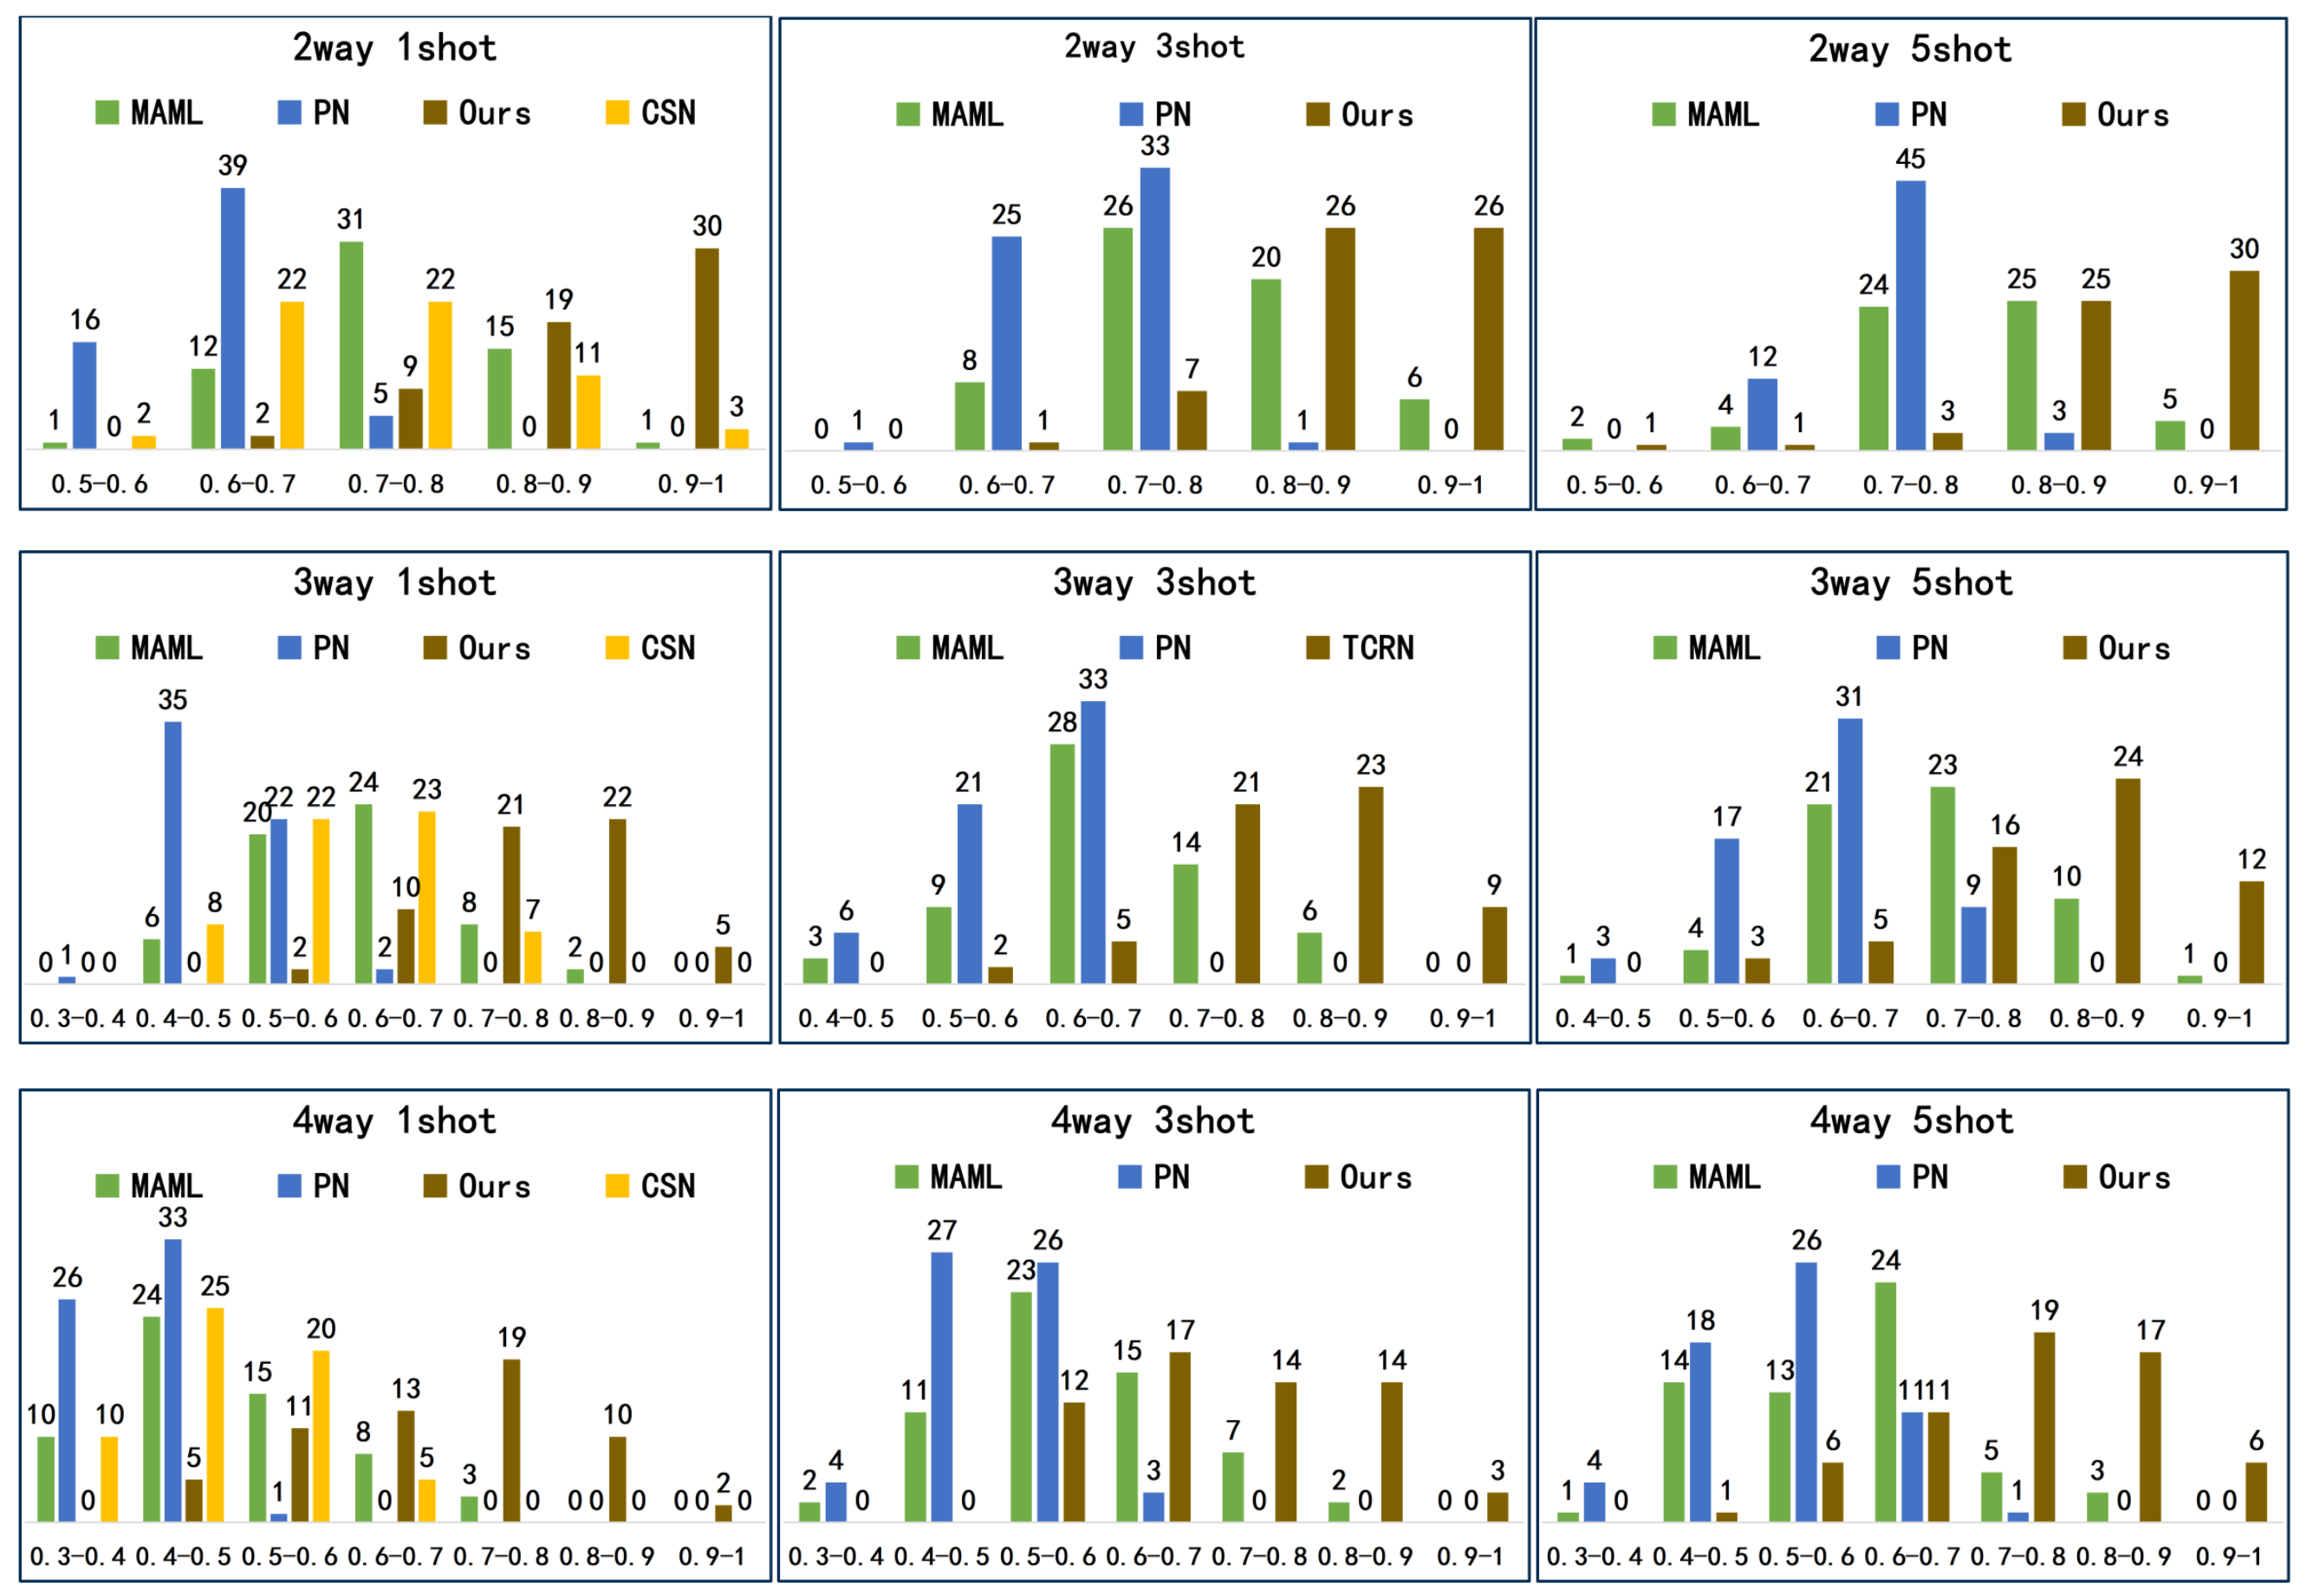
In Table 2, as the number of classes increases, the accuracies of all methods decrease, and Figure 6 fits this trend. This is because in a multi-classification task, the more classes that need to be classified, the more difficult the classification task becomes. In the meanwhile, the performance of each method gradually improves as the number of samples per class increases. This is because more samples provide more feature information for these methods to learn. Among all methods, our method achieves competitive results in solving the task of few-shot building footprint shape classification in maps. For example, the accuracy reached 81.00% for the 3 way 5 shot classification task where there are three classes of samples in the support set and 5 labeled samples for each class. Our method outperforms the baselines by at least 9.58% in 9 sets of experiments. This may be because that the three baseline methods all use 2D convolutional module to extract features from samples. In contrast, our method uses the TriangleConv embedding module to extract the shape features of the samples, and its ability to extract vector building footprint shapes is superior to that of the 2D convolutional module, which was verified in Section 4.3. Better embedding module can provide more effective feature embedding for relation module, which allows relation module to learn to obtain better similarity metrics. In addition, both CSN and PN use Euclidean distance, whereas our method uses the relation module which is better able to measure the similarity between the data in support set and the data in query set. The results in this section indicate that our method is a better choice to resolve the few-shot problem of recognizing and classifying building footprint shapes when comparing with these baselines.
4.5. The Limitations
Although the experimental results have shown the feasibility and effectiveness of the proposed method, there are still some limitations.
First, the proposed method aims to classify the shapes of the vector building footprints. Thus, it is required that the input data of the proposed method are the ordered sets of vertices of polygons. Particularly, due to the TriangleConv convolution manner we have used to extract the shape features of vector building footprints, the vector building footprints to be classified should be in the form of closed polygons without internal holes. Therefore, for some geographic data in the form of lines or polygons with holes inside, our method may not be applicable.
Second, richer data may make the model more generalizable. Although the data used in this paper come from different geographic regions, the classes of shapes in the dataset were fewer, which may limit the performance of the model.
Third, the relation scores produced by the proposed method indicate the possibility that one unlabeled sample belongs to the classes in the support set. However, these scores are calculated based on the prototypes of the classes in the support set, and we have directly averaged the feature embeddings of the samples of each class in the support set as the prototype of the class. The prototypes obtained in this way may not be the real one of the classes. There may be deviation, particularly when there are singular samples in the support set.
5. Conclusions
This paper proposed a relation network based method for recognizing and classifying the building footprint shapes with few labeled samples. Its basic idea is to train a neural network model with lots of different classes of labeled building footprint samples and generalize it to recognize new classes of building footprint samples. The neural network model of the proposed method is composed of an embedding module and a relation module. The embedding module uses the TriangleConv block to extract the shape features of the building footprints which are in the form of closed vector polygon. The relation module computes the relations between the shape features of the building footprints and the prototypes of each class. The classes of the samples are predicted according to the relations. To ensure the generalization of the model, the episode based meta-learning training strategy has been used to train the neural network model. Based on the data and experimental environment used in this paper, our method has achieved an accuracy of 89.40% in the 2-way 5-shot task. The experimental results have shown that our method can achieve competitive performance in solving the problem of recognization and classification of building footprint shapes with few supervised samples when comparing with related few-shot learning methods.
In practice, when applying the model trained in this paper for the classification of a set of unlabeled new building footprint samples, few samples should be manually labeled in advance. Then the tasks in the form of C-way K-shot that the model has been trained should be constructed from these samples. By inputting these tasks into the model, the classification of the shapes of these building footprint samples will be achieved.
In future work, we will continue to explore the classification of building footprint shapes with few supervised samples, and try to improve its performance and applicability. The datasets we have used are closed polygons without holes inside. We will improve the embedding operation of the vector building footprints and enable it to deal with more types of building footprints. Moreover, we have only used the vector information of the building footprints in current work. Actually, additional information such as semantic information of the building footprints may also helfpful for enhancing the performance of shape classification. Further, what we have addressed in this paper is the few-shot building footprint shape classification problem which still requires some building footprints to be labeled for each shape class. Then, it is also promising to address the zero-shot building footprint shape classificaiton problem where there are none building footprints labeled for each shape class.
Author Contributions
Conceptualization, Chun Liu, Yaohui Hu and Junkui Xu; methodology, Chun Liu and Yaohui Hu; software, Chun Liu and Yaohui Hu; validation, Yaohui Hu and Zheng Li; investigation, Zheng Li; resources, Chun Liu and Zhigang Han; data curation, Yaohui Hu; writing—original draft preparation, Yaohui Hu and Chun Liu; writing—review and editing, Jianzhong Guo and Junkui Xu; supervision, Jianzhong Guo and Zhigang Han; project administration, Chun Liu; funding acquisition, Zhigang Han. All authors have read and agreed to the published version of the manuscript.
Funding
This research was funded by the National Natural Science Foundation of China (no.41871316).
Institutional Review Board Statement
Not applicable for studies not involving humans and or animals.
Informed Consent Statement
Not applicable for studies not involving humans or animals.
Data Availability Statement
The source codes and dataset are available for downloading at the link: https://github.com/Huyaohui122/TriangleConv_RelationNetwork, accessed on 11 March 2022.
Acknowledgments
The authors would like to thank the editor, associate editor, and anonymous reviewers for processing our manuscript.
Conflicts of Interest
The authors declare no conflict of interest.
References
- Steiniger, S.; Lange, T.; Burghardt, D.; Weibel, R. An Approach for the Classification of Urban Building Structures Based on Discriminant Analysis Techniques. Trans. GIS 2008, 12, 31–59. [Google Scholar] [CrossRef]
- Wurm, M.; Schmitt, A.; Taubenböck, H. Building Types’ Classification Using Shape-Based Features and Linear Discriminant Functions. IEEE J. Sel. Top. Appl. Earth Obs. Remote Sens. 2016, 9, 1901–1912. [Google Scholar] [CrossRef]
- Yan, X.; Ai, T.; Zhang, X. Template Matching and Simplification Method for Building Features Based on Shape Cognition. ISPRS Int. J. Geo-Inf. 2017, 6, 250. [Google Scholar] [CrossRef] [Green Version]
- Cambridge, S.E.P. Vision Science: Photons to Phenomenology. Am. J. Psychol. 2000, 113, 3. [Google Scholar]
- Ai, T.; Cheng, X.; Liu, P.; Yang, M. A shape analysis and template matching of building features by the Fourier transform method. Comput. Environ. Urban Syst. 2013, 41, 219–233. [Google Scholar] [CrossRef]
- Mokhtarian, F.; Mackworth, A. A theory of multiscale, curvature-based shape representation for planar curves. IEEE Trans. Pattern Anal. Mach. Intell. 1992, 14, 789–805. [Google Scholar] [CrossRef]
- Li, W.; Goodchild, M.F.; Church, R. An efficient measure of compactness for two-dimensional shapes and its application in regionalization problems. Int. J. Geogr. Inf. Sci. 2013, 27, 1227–1250. [Google Scholar] [CrossRef] [Green Version]
- Yang, C.; Wei, H.; Yu, Q. A novel method for 2D nonrigid partial shape matching. Neurocomputing 2018, 275, 1160–1176. [Google Scholar] [CrossRef]
- Fu, Z.; Fan, L.; Yu, Z.; Zhou, K. A Moment-Based Shape Similarity Measurement for Areal Entities in Geographical Vector Data. ISPRS Int. J. Geo-Inf. 2018, 7, 208. [Google Scholar] [CrossRef] [Green Version]
- Fan, H.; Zhao, Z.; Li, W. Towards Measuring Shape Similarity of Polygons Based on Multiscale Features and Grid Context Descriptors. ISPRS Int. J. Geo-Inf. 2021, 10, 279. [Google Scholar] [CrossRef]
- Yan, X.; Ai, T.; Yang, M.; Tong, X. Graph convolutional autoencoder model for the shape coding and cognition of buildings in maps. Int. J. Geogr. Inf. Sci. 2021, 35, 490–512. [Google Scholar] [CrossRef]
- Yan, X.; Ai, T.; Yang, M.; Yin, H. A graph convolutional neural network for classification of building patterns using spatial vector data. ISPRS J. Photogramm. Remote Sens. 2019, 150, 259–273. [Google Scholar] [CrossRef]
- Liu, C.; Hu, Y.; Li, Z.; Xu, J.; Han, Z.; Guo, J. TriangleConv: A Deep Point Convolutional Network for Recognizing Building Shapes in Map Space. ISPRS Int. J. Geo-Inf. 2021, 10, 687. [Google Scholar] [CrossRef]
- Dosovitskiy, A.; Beyer, L.; Kolesnikov, A.; Weissenborn, D.; Zhai, X.; Unterthiner, T.; Dehghani, M.; Minderer, M.; Heigold, G.; Gelly, S.; et al. An Image is Worth 16 × 16 Words: Transformers for Image Recognition at Scale. arXiv 2021, arXiv:cs.CV/2010.11929. [Google Scholar]
- Tolstikhin, I.; Houlsby, N.; Kolesnikov, A.; Beyer, L.; Zhai, X.; Unterthiner, T.; Yung, J.; Steiner, A.; Keysers, D.; Uszkoreit, J.; et al. MLP-Mixer: An all-MLP Architecture for Vision. arXiv 2021, arXiv:cs.CV/2105.01601. [Google Scholar]
- Liu, Z.; Hu, H.; Lin, Y.; Yao, Z.; Xie, Z.; Wei, Y.; Ning, J.; Cao, Y.; Zhang, Z.; Dong, L.; et al. Swin Transformer V2: Scaling Up Capacity and Resolution. arXiv 2021, arXiv:2111.09883. [Google Scholar] [CrossRef]
- DeVries, P.M.; Viégas, F.; Wattenberg, M.; Meade, B.J. Deep learning of aftershock patterns following large earthquakes. Nature 2018, 560, 632–634. [Google Scholar] [CrossRef]
- Feng, Y.; Thiemann, F.; Sester, M. Learning Cartographic Building Generalization with Deep Convolutional Neural Networks. ISPRS Int. J. Geo-Inf. 2019, 8, 258. [Google Scholar] [CrossRef] [Green Version]
- Touya, G.; Zhang, X.; Lokhat, I. Is deep learning the new agent for map generalization? Int. J. Cartogr. 2019, 5, 142–157. [Google Scholar] [CrossRef] [Green Version]
- Zhu, D.; Cheng, X.; Zhang, F.; Yao, X.; Gao, Y.; Liu, Y. Spatial interpolation using conditional generative adversarial neural networks. Int. J. Geogr. Inf. Sci. 2020, 34, 735–758. [Google Scholar] [CrossRef]
- Sung, F.; Yang, Y.; Zhang, L.; Xiang, T.; Torr, P.H.; Hospedales, T.M. Learning to Compare: Relation Network for Few-Shot Learning. In Proceedings of the IEEE Conference on Computer Vision and Pattern Recognition (CVPR), Salt Lake City, UT, USA, 18–22 June 2018. [Google Scholar]
- Bendre, N.; Marín, H.T.; Najafirad, P. Learning from Few Samples: A Survey. arXiv 2020, arXiv:cs.CV/2007.15484. [Google Scholar]
- Wang, Y.; Yao, Q.; Kwok, J.T.; Ni, L.M. Generalizing from a Few Examples: A Survey on Few-Shot Learning. ACM Comput. Surv. 2020, 53, 1–34. [Google Scholar] [CrossRef]
- Koch, G.; Zemel, R.; Salakhutdinov, R. Siamese neural networks for one-shot image recognition. In Proceedings of the 32nd International Conference on Machine Learning (ICML), Lille, France, 6–11 July 2015. [Google Scholar]
- Snell, J.; Swersky, K.; Zemel, R.S. Prototypical Networks for Few-shot Learning. arXiv 2017, arXiv:cs.LG/1703.05175. [Google Scholar]
- Ravi, S.; Larochelle, H. Optimization as a model for few-shot learning. In Proceedings of the 5th International Conference on Learning Representations (ICLR), Toulon, France, 24–26 April 2017. [Google Scholar]
- Finn, C.; Abbeel, P.; Levine, S. Model-Agnostic Meta-Learning for Fast Adaptation of Deep Networks. In Proceedings of the 34th International Conference on Machine Learning, Sydney, Australia, 6–11 August 2017. [Google Scholar]
- Zhou, F.; Wu, B.; Li, Z. Deep Meta-Learning: Learning to Learn in the Concept Space. arXiv 2018, arXiv:cs.LG/1802.03596. [Google Scholar]
- Vinyals, O.; Blundell, C.; Lillicrap, T.; Wierstra, D. Matching Networks for One Shot Learning. In Advances in Neural Information Processing Systems; Lee, D., Sugiyama, M., Luxburg, U., Guyon, I., Garnett, R., Eds.; Curran Associates, Inc.: Nice, France, 2016; Volume 29. [Google Scholar]
- Zhang, C.; Cai, Y.; Lin, G.; Shen, C. DeepEMD: Few-Shot Image Classification With Differentiable Earth Mover’s Distance and Structured Classifiers. In Proceedings of the IEEE/CVF Conference on Computer Vision and Pattern Recognition (CVPR), Seattle, WA, USA, 13–19 June 2020. [Google Scholar]
- Ma, X.; Ji, S.; Wang, J.; Geng, J.; Wang, H. Hyperspectral Image Classification Based on Two-Phase Relation Learning Network. IEEE Trans. Geosci. Remote Sens. 2019, 57, 10398–10409. [Google Scholar] [CrossRef]
- Du, S.; Zhang, F.; Zhang, X. Semantic classification of urban buildings combining VHR image and GIS data: An improved random forest approach. ISPRS J. Photogramm. Remote Sens. 2015, 105, 107–119. [Google Scholar] [CrossRef]
- Zhou, X.; Chen, Z.; Zhang, X.; Ai, T. Change Detection for Building Footprints with Different Levels of Detail Using Combined Shape and Pattern Analysis. ISPRS Int. J. Geo-Inf. 2018, 7, 406. [Google Scholar] [CrossRef] [Green Version]
- Maceachren, A.M. Compactness of Geographic Shape: Comparison and Evaluation of Measures. Geogr. Ann. Ser. B Hum. Geogr. 1985, 67, 53–67. [Google Scholar] [CrossRef]
- Wentz, E.A. Shape analysis in GIS. In Proceedings of the Auto-Carto, Seattle, WA, USA, 7–10 April 1997; Volume 13, pp. 7–10. [Google Scholar]
- Basaraner, M.; Cetinkaya, S. Performance of shape indices and classification schemes for characterising perceptual shape complexity of building footprints in GIS. Int. J. Geogr. Inf. Sci. 2017, 31, 1952–1977. [Google Scholar] [CrossRef]
- Belongie, S.; Malik, J.; Puzicha, J. Shape matching and object recognition using shape contexts. IEEE Trans. Pattern Anal. Mach. Intell. 2002, 24, 509–522. [Google Scholar] [CrossRef] [Green Version]
- Alajlan, N.; El Rube, I.; Kamel, M.S.; Freeman, G. Shape retrieval using triangle-area representation and dynamic space warping. Pattern Recognit. 2007, 40, 1911–1920. [Google Scholar] [CrossRef]
- He, K.; Zhang, X.; Ren, S.; Sun, J. Deep Residual Learning for Image Recognition. In Proceedings of the IEEE Conference on Computer Vision and Pattern Recognition (CVPR), Las Vegas, NV, USA, 27–30 June 2016. [Google Scholar]
- Szegedy, C.; Ioffe, S.; Vanhoucke, V.; Alemi, A.A. Inception-v4, Inception-ResNet and the Impact of Residual Connections on Learning. In Proceedings of the Thirty-First AAAI Conference on Artificial Intelligence, AAAI’17, San Francisco, CA, USA, 4–9 February 2017; AAAI Press: Palo Alto, CA, USA, 2017; pp. 4278–4284. [Google Scholar]
- Silver, D.; Schrittwieser, J.; Simonyan, K.; Antonoglou, I.; Huang, A.; Guez, A.; Hubert, T.; Baker, L.; Lai, M.; Bolton, A.; et al. Mastering the game of go without human knowledge. Nature 2017, 550, 354–359. [Google Scholar] [CrossRef]
- Fei-Fei, L.; Fergus, R.; Perona, P. One-shot learning of object categories. IEEE Trans. Pattern Anal. Mach. Intell. 2006, 28, 594–611. [Google Scholar] [CrossRef] [PubMed] [Green Version]
- Lake, B.; Salakhutdinov, R.; Gross, J.; Tenenbaum, J. One shot learning of simple visual concepts. In Proceedings of the Annual Meeting of the Cognitive Science Society(CogSci), Boston, MA, USA, 20–23 July 2011. [Google Scholar]
- Zhang, H.; Zhang, J.; Koniusz, P. Few-Shot Learning via Saliency-Guided Hallucination of Samples. In Proceedings of the IEEE/CVF Conference on Computer Vision and Pattern Recognition (CVPR), Long Beach, CA, USA, 15–20 June 2019. [Google Scholar]
- Chen, Z.; Fu, Y.; Wang, Y.X.; Ma, L.; Liu, W.; Hebert, M. Image Deformation Meta-Networks for One-Shot Learning. In Proceedings of the IEEE/CVF Conference on Computer Vision and Pattern Recognition (CVPR), Long Beach, CA, USA, 15–20 June 2019. [Google Scholar]
- Schonfeld, E.; Ebrahimi, S.; Sinha, S.; Darrell, T.; Akata, Z. Generalized Zero- and Few-Shot Learning via Aligned Variational Autoencoders. In Proceedings of the IEEE/CVF Conference on Computer Vision and Pattern Recognition (CVPR), Long Beach, CA, USA, 15–20 June 2019. [Google Scholar]
- Schwartz, E.; Karlinsky, L.; Feris, R.; Giryes, R.; Bronstein, A.M. Baby steps towards few-shot learning with multiple semantics. arXiv 2020, arXiv:cs.CV/1906.01905. [Google Scholar]
- Douglas, D.H.; Peucker, T.K. Algorithms for the reduction of the number of points required to represent a digitized line or its caricature. Cartogr. Int. J. Geogr. Inf. Geovisualization 1973, 10, 112–122. [Google Scholar] [CrossRef] [Green Version]
- Paszke, A.; Gross, S.; Massa, F.; Lerer, A.; Bradbury, J.; Chanan, G.; Killeen, T.; Lin, Z.; Gimelshein, N.; Antiga, L.; et al. PyTorch: An Imperative Style, High-Performance Deep Learning Library. arXiv 2019, arXiv:cs.LG/1912.01703. [Google Scholar]
- Van der Maaten, L.; Hinton, G. Visualizing data using t-SNE. J. Mach. Learn. Res. 2008, 9, 2579–2605. [Google Scholar]
Figure 1.
The framework of our relation network model which is mainly composed of the TriangleConv embedding module and the relation module.
Figure 1.
The framework of our relation network model which is mainly composed of the TriangleConv embedding module and the relation module.

Figure 2.
An example of meta-learning episode based training strategy. There are 3 way 1 shot samples in one task which has been used in our work.
Figure 2.
An example of meta-learning episode based training strategy. There are 3 way 1 shot samples in one task which has been used in our work.

Figure 3.
Raw data examples of 10 different classes of building footprints in the experiment.

Figure 4.
Statistical histograms of the results of 60 trials for 4 networks which are constructed using different embedding and metric modules. In the figure, 2D-Conv represents the 2D convolutional module and TC represents the TriangleConv module. Each subplot shows the distribution of the results of 60 trials for each model in different value intervals. The horizontal coordinates in the subplot are value intervals.

Figure 5.
The clustering results by feeding the preprocessed data from 10 classes with 200 samples in each class into the 2D convolutional embedding module and the TriangleConv embedding module to obtain the embedding representation and clustering them with T-SNE method (PCA is used as the initialization method and random_state is set to 2020).

Figure 6.
Statistical histograms of the results of 60 trials of our method and baselines in 9 sets of experiments. Each subplot shows the distribution of the results of 60 experiments for each model in different value intervals. The horizontal coordinates in the subplot are value intervals.
Figure 6.
Statistical histograms of the results of 60 trials of our method and baselines in 9 sets of experiments. Each subplot shows the distribution of the results of 60 experiments for each model in different value intervals. The horizontal coordinates in the subplot are value intervals.


Table 1.
The results of the methods using different embedding and metric modules (The 2D conv is the 2D convolutional module and the TC is the TriangleConv module).
Table 1.
The results of the methods using different embedding and metric modules (The 2D conv is the 2D convolutional module and the TC is the TriangleConv module).
| (1) 2D conv and Cosine | (2) TC and Cosine | (3) 2D conv and Relation | (4) TC and Relation (Ours) | |
|---|---|---|---|---|
| 2Way 1Shot | 0.6204 | 0.8291 | 0.8104 | 0.8747 |
| 2Way 3Shot | 0.6757 | 0.8429 | 0.8239 | 0.8843 |
| 2Way 5Shot | 0.7100 | 0.8521 | 0.8256 | 0.8940 |
| 3Way 1Shot | 0.4812 | 0.6807 | 0.6886 | 0.7800 |
| 3Way 3Shot | 0.5481 | 0.7215 | 0.6943 | 0.8052 |
| 3Way 5Shot | 0.5677 | 0.7380 | 0.7259 | 0.8100 |
| 4Way 1Shot | 0.4062 | 0.5952 | 0.5714 | 0.6862 |
| 4Way 3Shot | 0.4875 | 0.6425 | 0.6075 | 0.7081 |
| 4Way 5Shot | 0.4862 | 0.6523 | 0.6346 | 0.7330 |
Table 2.
The classification results when comparing our method with three classical few-shot learning methods.
Table 2.
The classification results when comparing our method with three classical few-shot learning methods.
| Convolutional Siamese Net | Model-Agnostic Meta-Learning | Prototypical Network | Ours | |
|---|---|---|---|---|
| 2Way 1Shot | 0.7341 | 0.7574 | 0.6354 | 0.8747 |
| 2Way 3Shot | —— | 0.7885 | 0.7051 | 0.8843 |
| 2Way 5Shot | —— | 0.7928 | 0.7457 | 0.8940 |
| 3Way 1Shot | 0.5970 | 0.6122 | 0.4846 | 0.7800 |
| 3Way 3Shot | —— | 0.6653 | 0.5933 | 0.8052 |
| 3Way 5Shot | —— | 0.7126 | 0.6243 | 0.8100 |
| 4Way 1Shot | 0.4841 | 0.5013 | 0.4145 | 0.6862 |
| 4Way 3Shot | —— | 0.5864 | 0.4934 | 0.7081 |
| 4Way 5Shot | —— | 0.5961 | 0.5232 | 0.7330 |
Publisher’s Note: MDPI stays neutral with regard to jurisdictional claims in published maps and institutional affiliations. |
© 2022 by the authors. Licensee MDPI, Basel, Switzerland. This article is an open access article distributed under the terms and conditions of the Creative Commons Attribution (CC BY) license (https://creativecommons.org/licenses/by/4.0/).
Share and Cite
MDPI and ACS Style
Hu, Y.; Liu, C.; Li, Z.; Xu, J.; Han, Z.; Guo, J. Few-Shot Building Footprint Shape Classification with Relation Network. ISPRS Int. J. Geo-Inf. 2022, 11, 311. https://0-doi-org.brum.beds.ac.uk/10.3390/ijgi11050311
AMA Style
Hu Y, Liu C, Li Z, Xu J, Han Z, Guo J. Few-Shot Building Footprint Shape Classification with Relation Network. ISPRS International Journal of Geo-Information. 2022; 11(5):311. https://0-doi-org.brum.beds.ac.uk/10.3390/ijgi11050311
Chicago/Turabian StyleHu, Yaohui, Chun Liu, Zheng Li, Junkui Xu, Zhigang Han, and Jianzhong Guo. 2022. "Few-Shot Building Footprint Shape Classification with Relation Network" ISPRS International Journal of Geo-Information 11, no. 5: 311. https://0-doi-org.brum.beds.ac.uk/10.3390/ijgi11050311
Note that from the first issue of 2016, this journal uses article numbers instead of page numbers. See further details here.