
The Impact of Built Environment Factors on Elderly People’s Mobility Characteristics by Metro System Considering Spatial Heterogeneity

Abstract
:1. Introduction
2. Literature Review
2.1. Built Environment and Elderly Travel Behavior Associations
2.2. Effect of Station Characteristics on the Travel Behavior of the Elderly
2.3. Research Gap and Contribution
3. Research Design
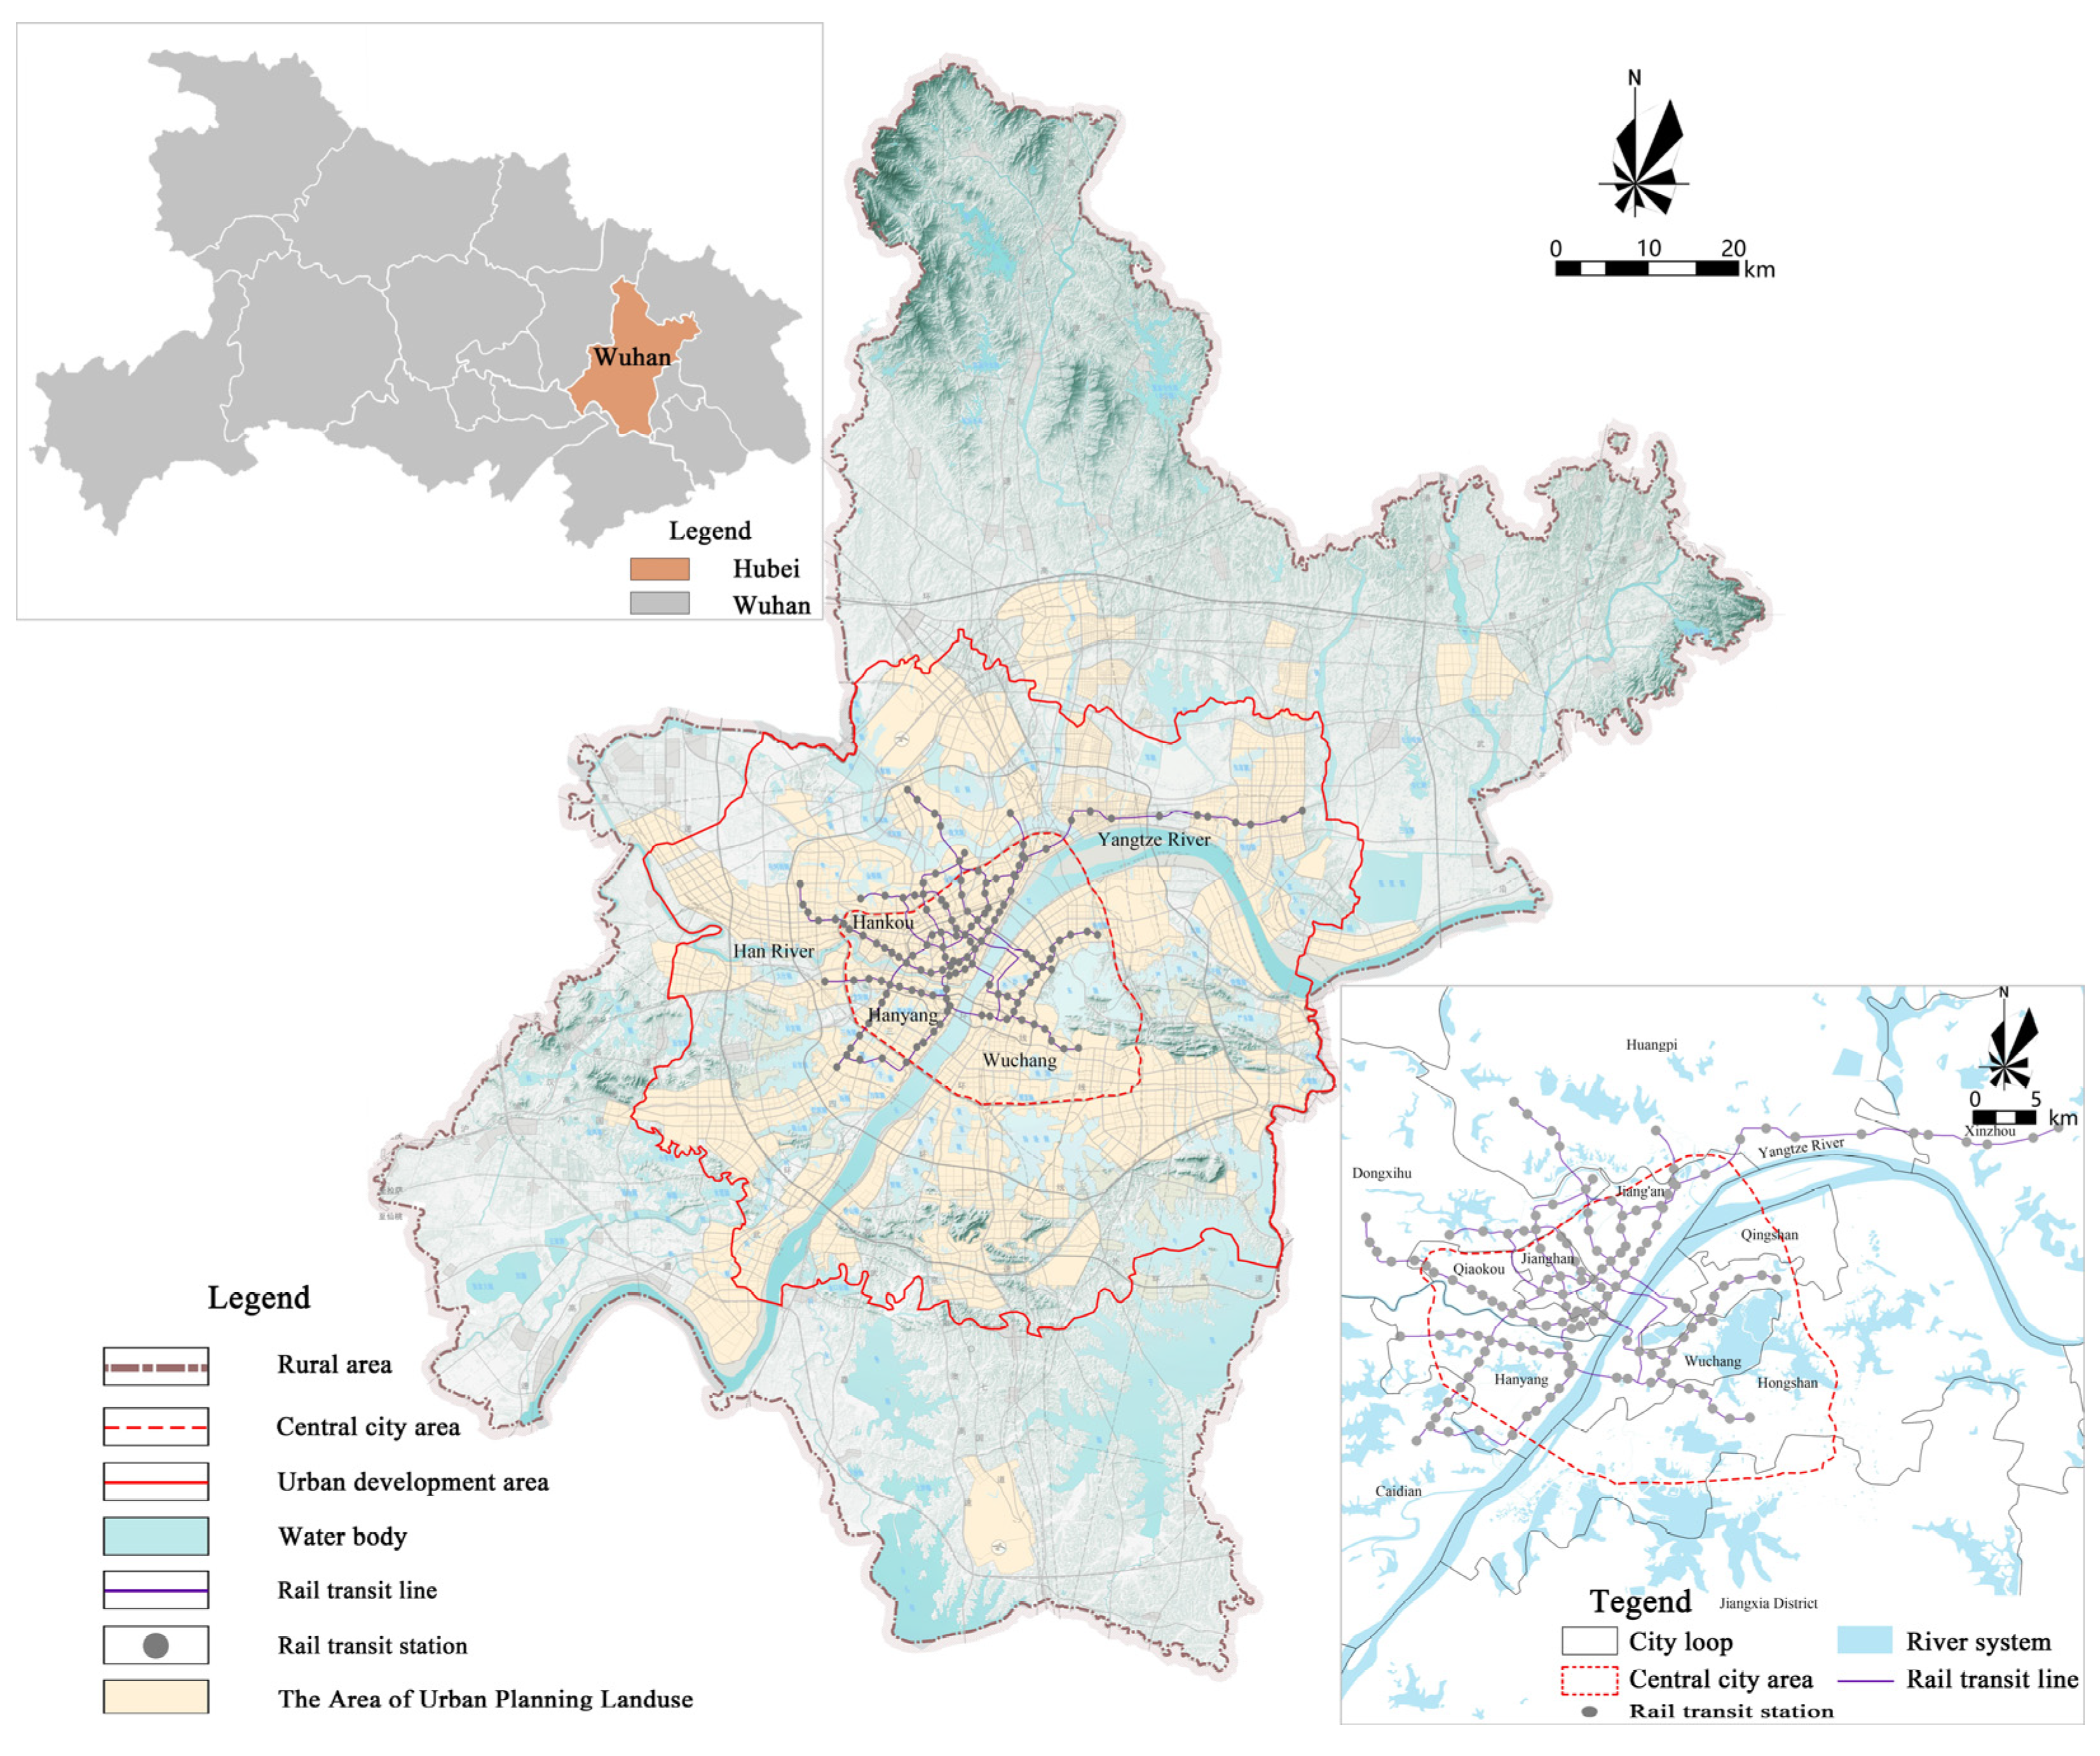
3.1. Study Area
3.2. Methodology
3.3. Data Sources and Description
4. Results
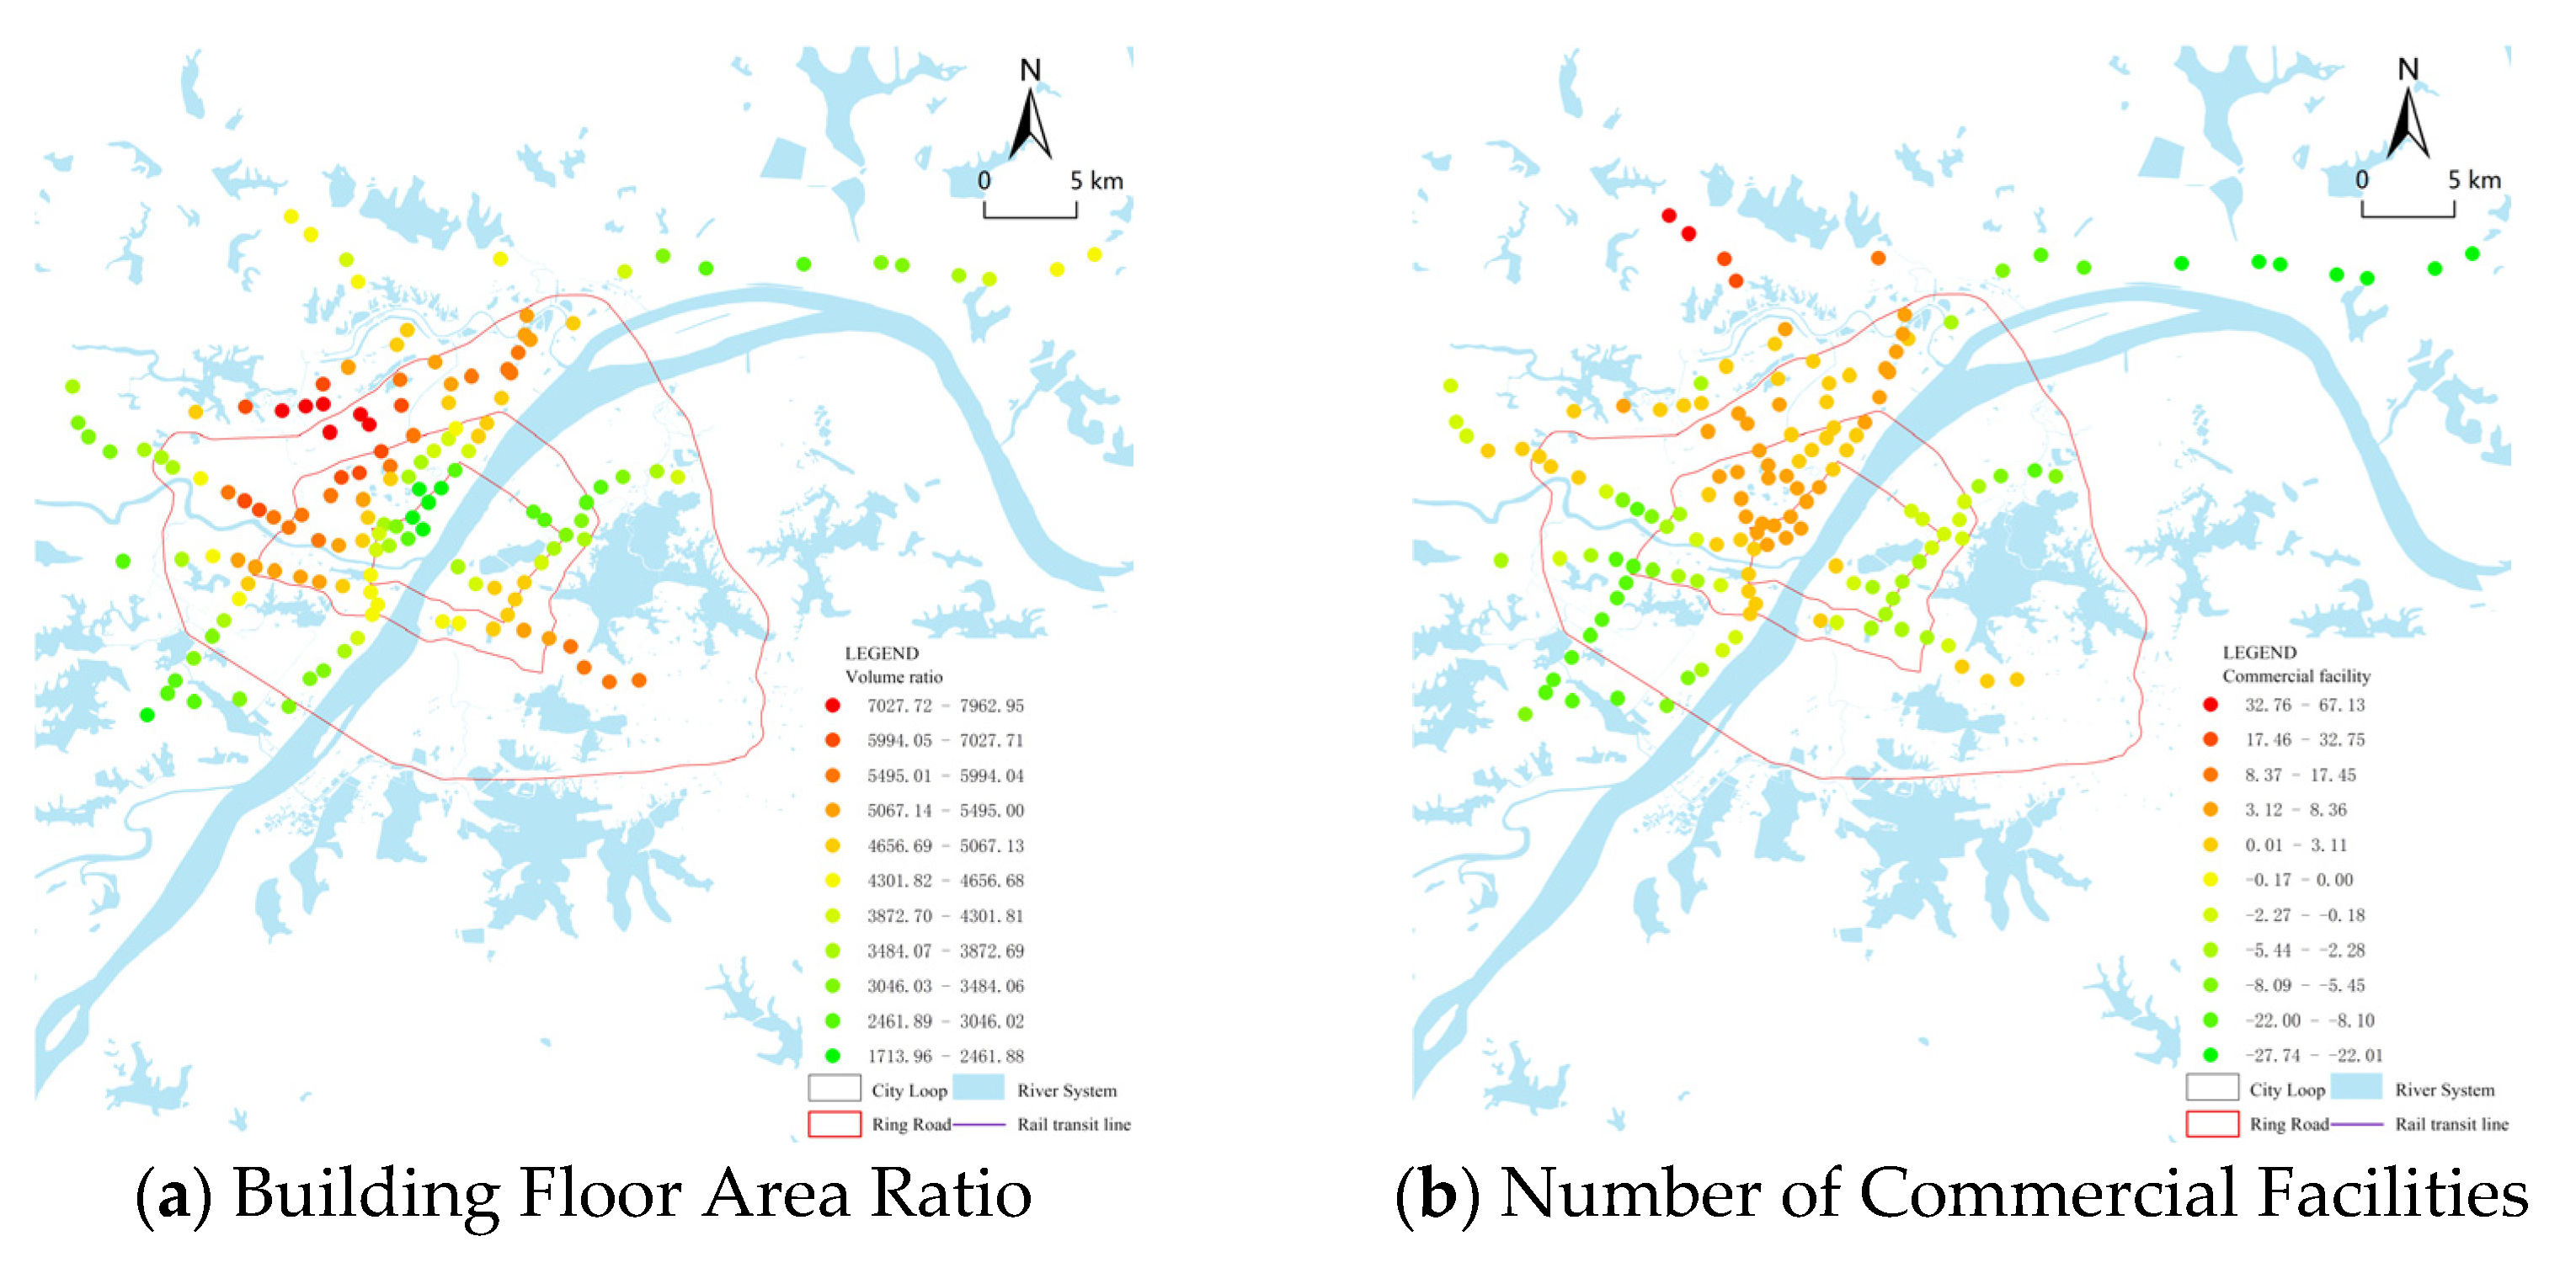
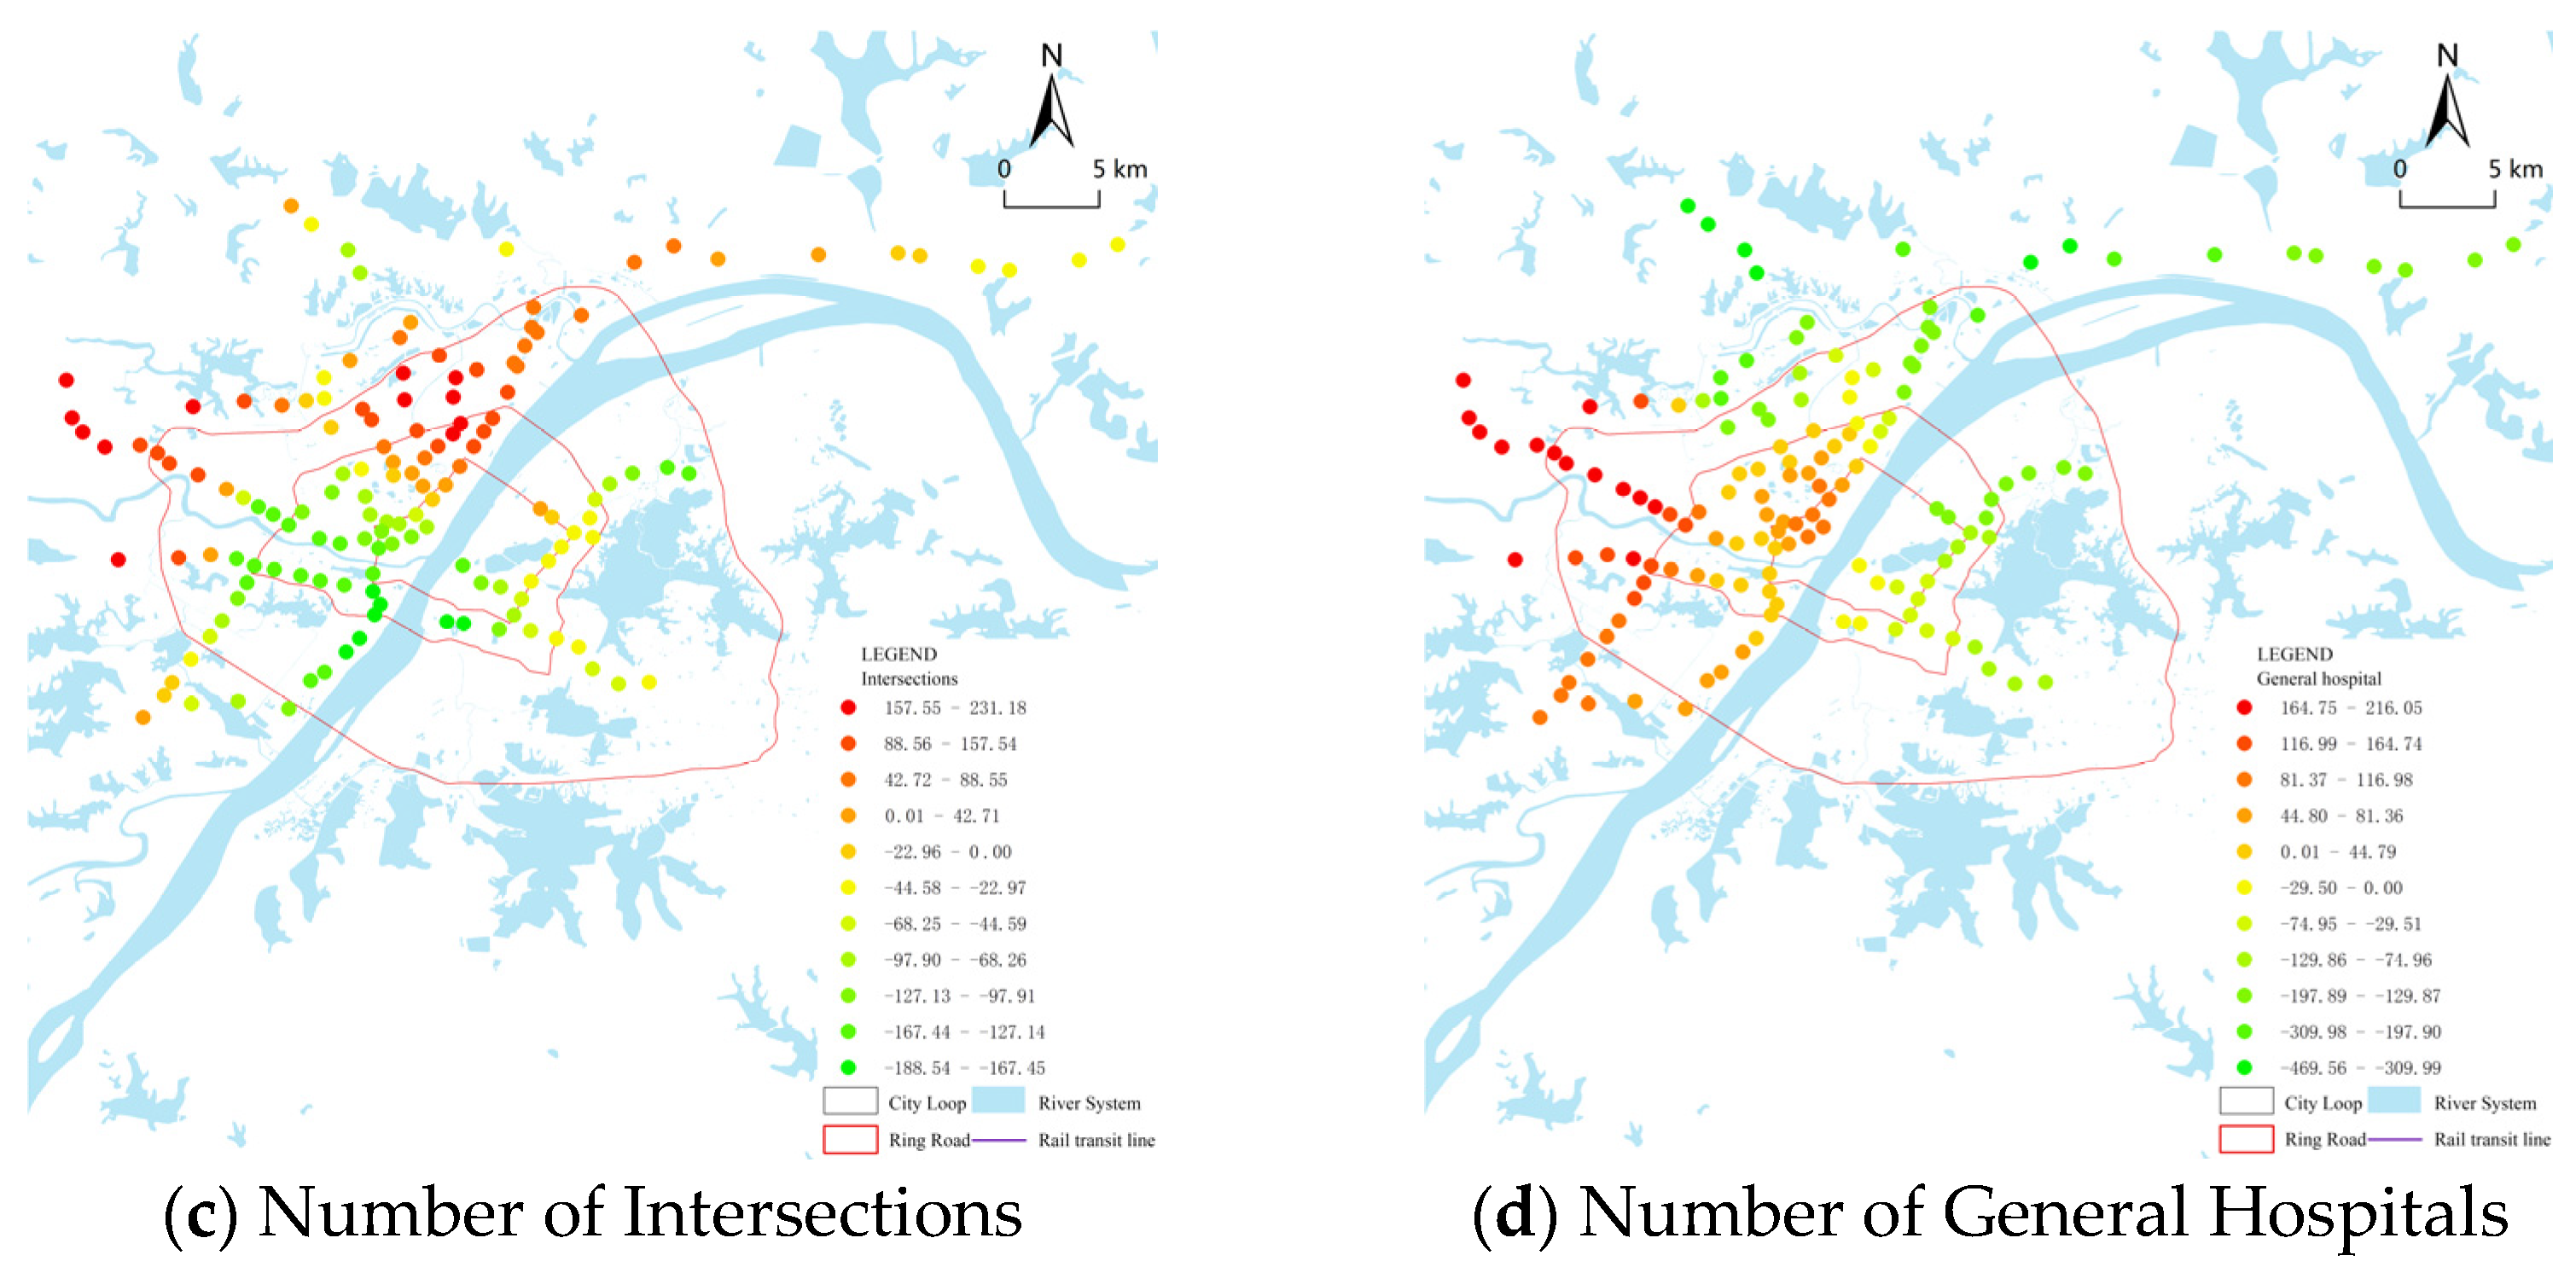
4.1. GWR-Based Analysis of the Factors Influencing the Metro Ridership of the Elderly
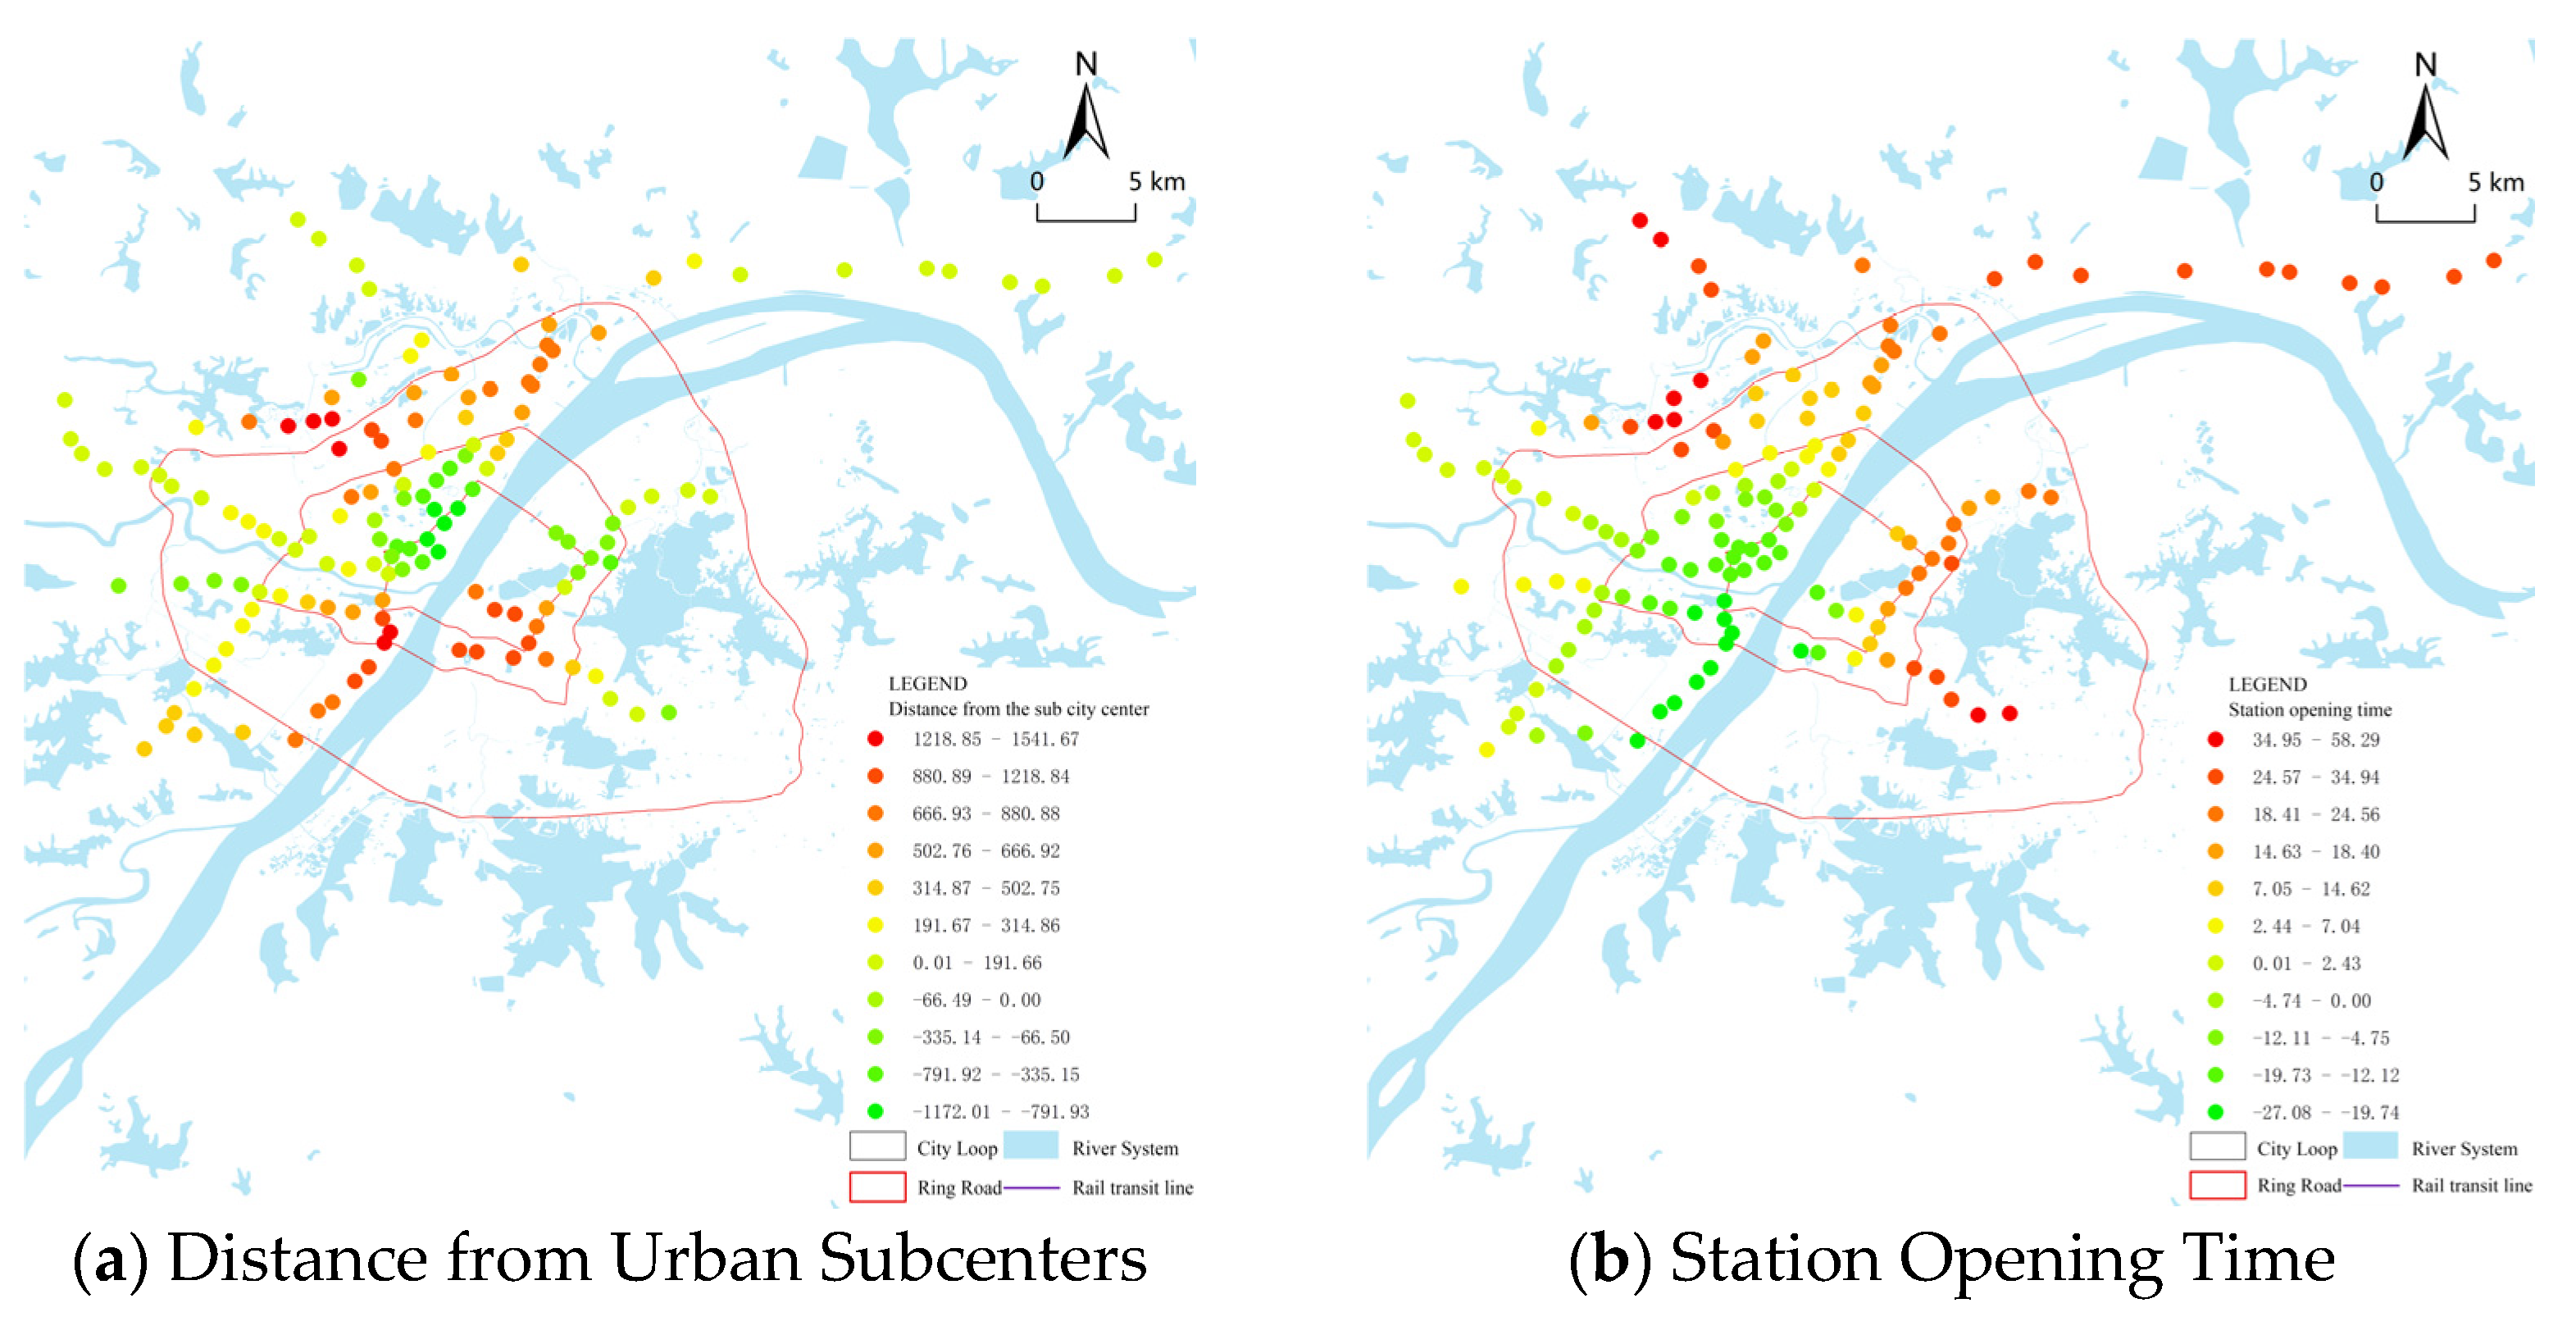
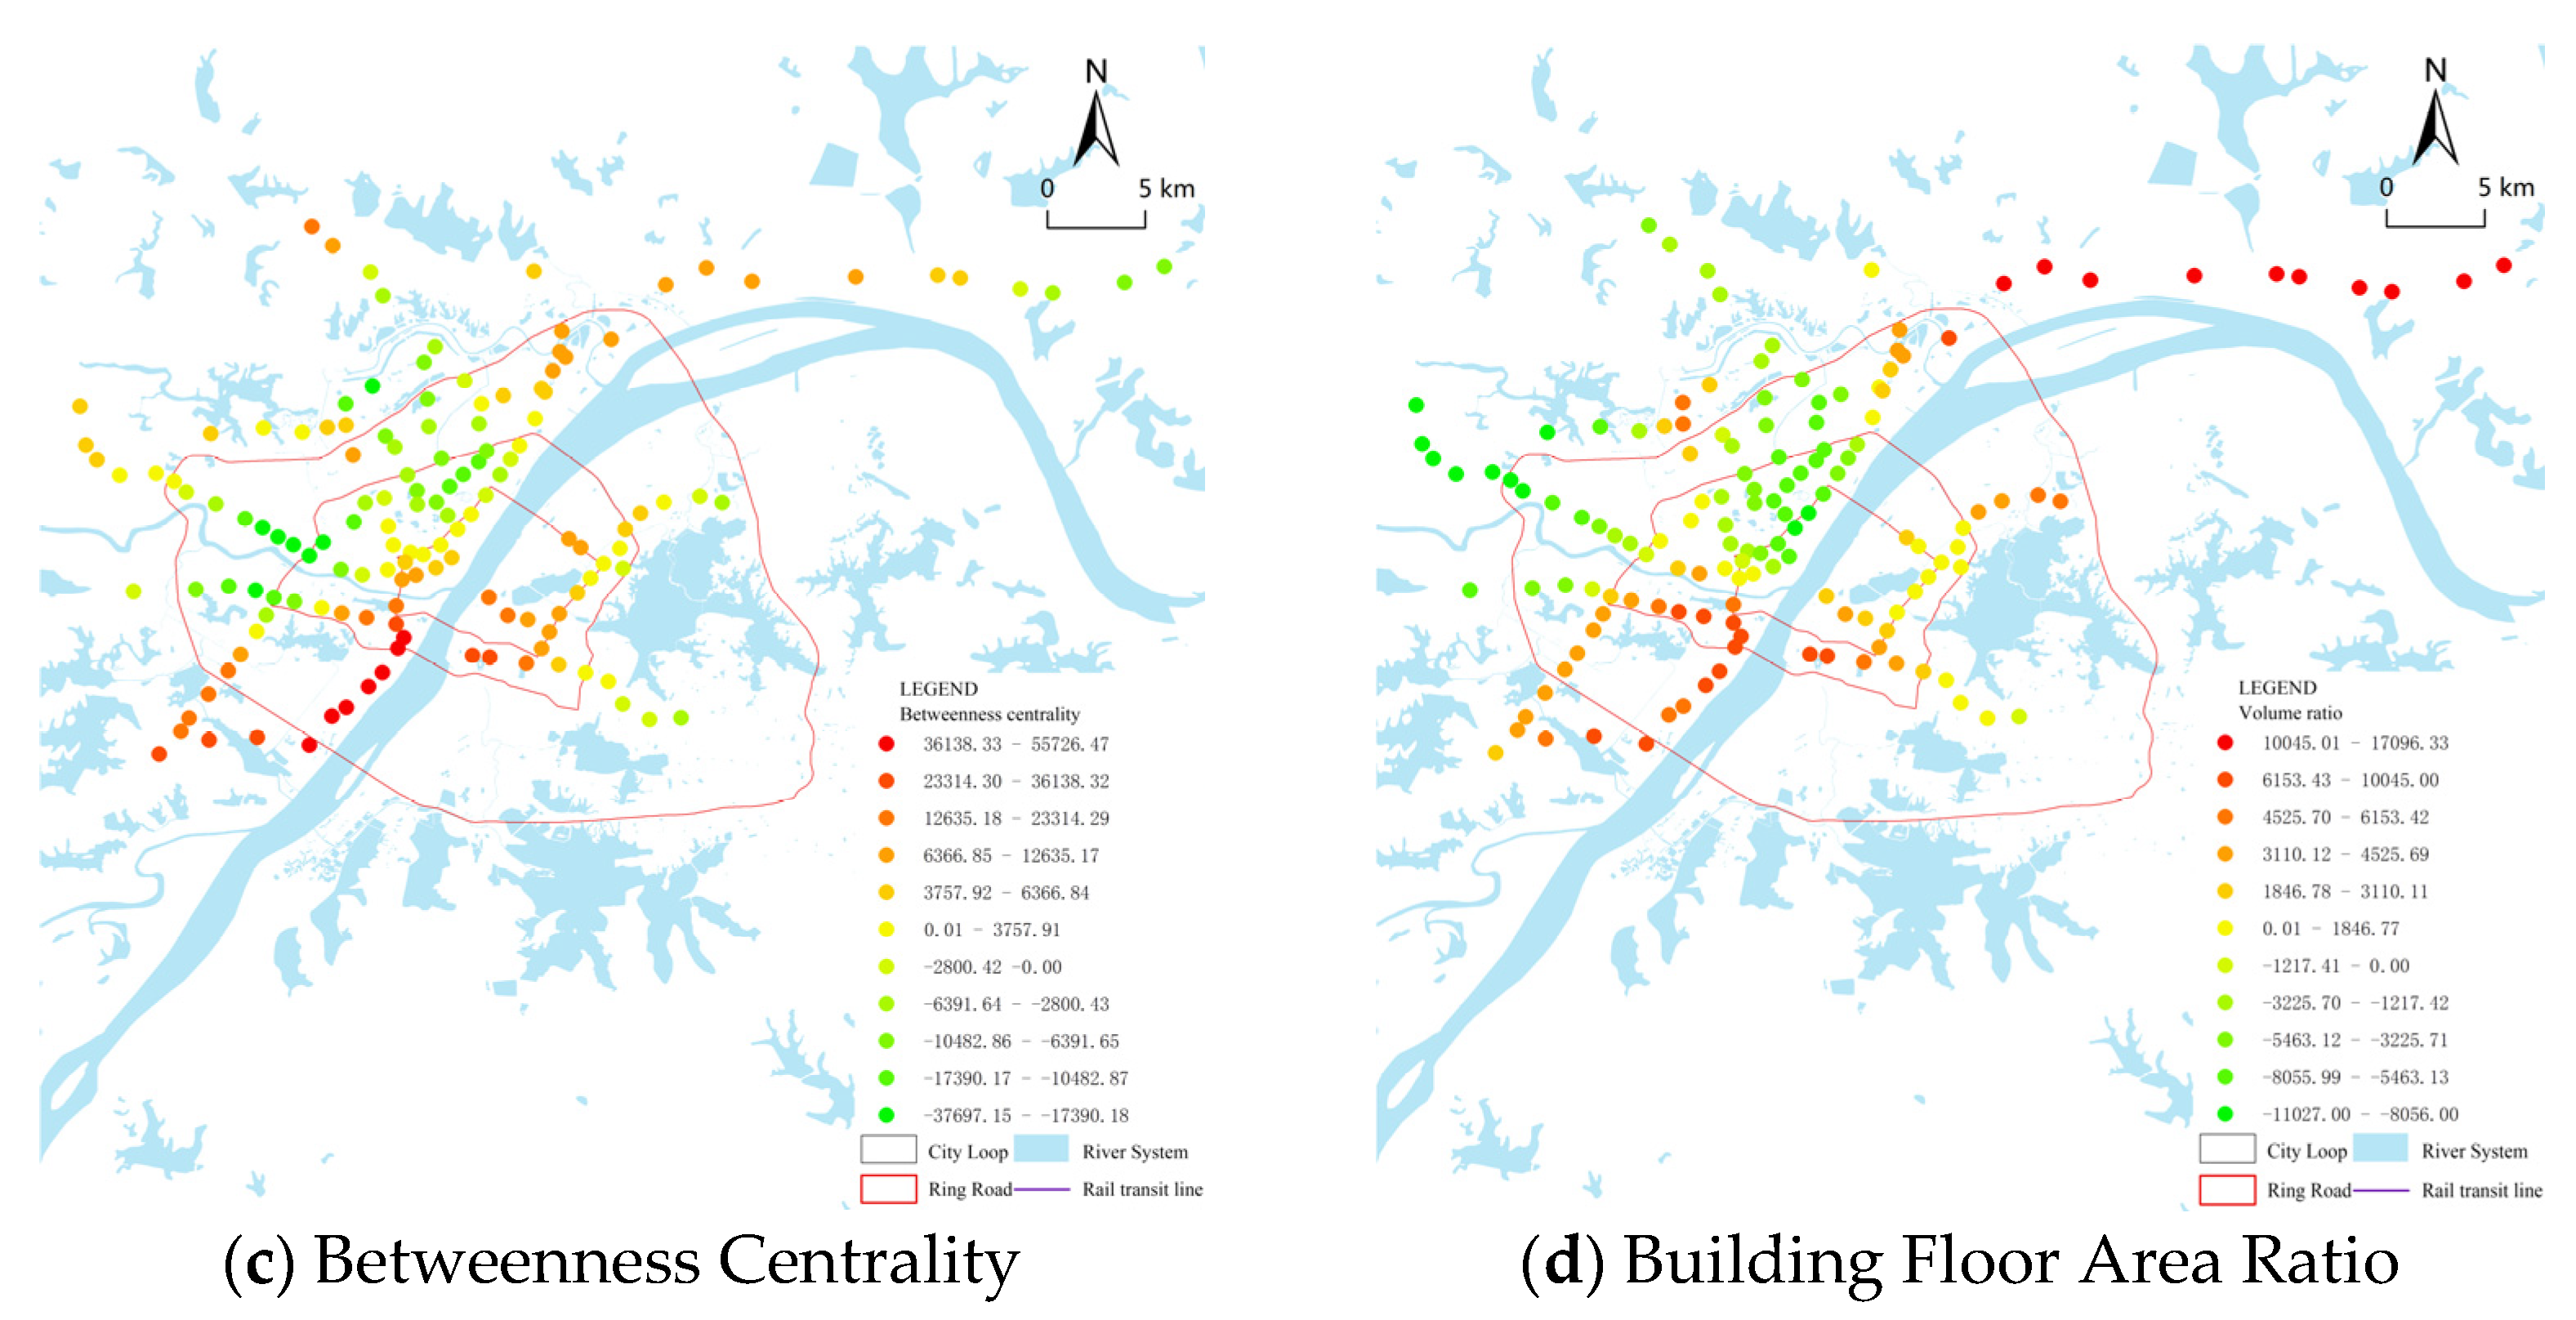
4.2. GWR-Based Analysis of the Factors Influencing the Metro Travel Distance of the Elderly
5. Conclusions
Author Contributions
Funding
Institutional Review Board Statement
Informed Consent Statement
Data Availability Statement
Conflicts of Interest
References
- Nations, U.; Economic, D.; Affairs, S.; Division, P. World Population Prospects 2019 Highlights; United Nations: New York, NY, USA, 2019. [Google Scholar]
- Cao, X.; Mokhtarian, P.L.; Handy, S.L. Neighborhood Design and the Accessibility of the Elderly: An Empirical Analysis in Northern California. Int. J. Sustain. Transp. 2010, 4, 347–371. [Google Scholar] [CrossRef]
- Cheng, L.; Chen, X.; Yang, S.; Cao, Z.; de Vos, J.; Witlox, F. Active Travel for Active Ageing in China: The Role of Built Environment. J. Transp. Geogr. 2019, 76, 142–152. [Google Scholar] [CrossRef]
- Yang, L. Modeling the Mobility Choices of Older People in a Transit-Oriented City: Policy Insights. Habitat Int. 2018, 76, 10–18. [Google Scholar] [CrossRef]
- Spinney, J.E.L.; Scott, D.M.; Newbold, K.B. Transport Mobility Benefits and Quality of Life: A Time-Use Perspective of Elderly Canadians. Transp. Policy 2009, 16, 1–11. [Google Scholar] [CrossRef]
- Wong, R.C.P.; Szeto, W.Y.; Yang, L.; Li, Y.C.; Wong, S.C. Public Transport Policy Measures for Improving Elderly Mobility. Transp. Policy 2018, 63, 73–79. [Google Scholar] [CrossRef] [Green Version]
- Banister, D.; Bowling, A. Quality of Life for the Elderly: The Transport Dimension. Transp. Policy 2004, 11, 105–115. [Google Scholar] [CrossRef]
- Shao, F.; Sui, Y.; Yu, X.; Sun, R. Spatio-Temporal Travel Patterns of Elderly People—A Comparative Study Based on Buses Usage in Qingdao, China. J. Transp. Geogr. 2019, 76, 178–190. [Google Scholar] [CrossRef]
- Ding, C.; Cao, X.; Liu, C. How Does the Station-Area Built Environment Influence Metrorail Ridership? Using Gradient Boosting Decision Trees to Identify Non-Linear Thresholds. J. Transp. Geogr. 2019, 77, 70–78. [Google Scholar] [CrossRef]
- Gan, Z.; Yang, M.; Feng, T.; Timmermans, H.J.P. Examining the Relationship between Built Environment and Metro Ridership at Station-to-Station Level. Transp. Res. Part D Transp. Environ. 2020, 82, 102332. [Google Scholar] [CrossRef]
- An, D.; Tong, X.; Liu, K.; Chan, E.H.W. Understanding the Impact of Built Environment on Metro Ridership Using Open Source in Shanghai. Cities 2019, 93, 177–187. [Google Scholar] [CrossRef]
- Ewing, R.; Cervero, R. Travel and the Built Environment. J. Am. Plan. Assoc. 2010, 76, 265–294. [Google Scholar] [CrossRef]
- Shao, Q.; Zhang, W.; Cao, X.; Yang, J.; Yin, J. Threshold and Moderating Effects of Land Use on Metro Ridership in Shenzhen: Implications for TOD Planning. J. Transp. Geogr. 2020, 89, 102878. [Google Scholar] [CrossRef]
- Zhao, P. The Impact of the Built Environment on Individual Workers’ Commuting Behavior in Beijing. Int. J. Sustain. Transp. 2013, 7, 389–415. [Google Scholar] [CrossRef]
- Kemperman, A.; Timmerman, H. Influences of Built Environment on Walking and Cycling by Latent Segments of Aging Population. Transp. Res. Rec. 2009, 2134, 1–9. [Google Scholar] [CrossRef]
- Kuby, M.; Barranda, A.; Upchurch, C. Factors Influencing Light-Rail Station Boardings in the United States. Transp. Res. Part A Policy Pract. 2004, 38, 223–247. [Google Scholar] [CrossRef]
- Böcker, L.; van Amen, P.; Helbich, M. Elderly Travel Frequencies and Transport Mode Choices in Greater Rotterdam, The Netherlands. Transportation 2017, 44, 831–852. [Google Scholar] [CrossRef] [Green Version]
- Bezirgani, A.; Lachapelle, U. Online Grocery Shopping for the Elderly in Quebec, Canada: The Role of Mobility Impediments and Past Online Shopping Experience. Travel Behav. Soc. 2021, 25, 133–143. [Google Scholar] [CrossRef]
- Feng, J.; Dijst, M.; Wissink, B.; Prillwitz, J. Elderly Co-Residence and the Household Responsibilities Hypothesis: Evidence from Nanjing, China. Urban Geogr. 2015, 36, 757–776. [Google Scholar] [CrossRef]
- Hu, X.; Wang, J.; Wang, L. Understanding the Travel Behavior of Elderly People in the Developing Country: A Case Study of Changchun, China. Procedia Soc. Behav. Sci. 2013, 96, 873–880. [Google Scholar] [CrossRef] [Green Version]
- Moniruzzaman, M.; Páez, A. An Investigation of the Attributes of Walkable Environments from the Perspective of Seniors in Montreal. J. Transp. Geogr. 2016, 51, 85–96. [Google Scholar] [CrossRef]
- Sun, B.; Ermagun, A.; Dan, B. Built Environmental Impacts on Commuting Mode Choice and Distance: Evidence from Shanghai. Transp. Res. Part D Transp. Environ. 2017, 52, 441–453. [Google Scholar] [CrossRef]
- Zhang, M. The Role of Land Use in Travel Mode Choice: Evidence from Boston and Hong Kong. J. Am. Plan. Assoc. 2004, 70, 344–360. [Google Scholar] [CrossRef]
- Borst, H.C.; de Vries, S.I.; Graham, J.M.A.; van Dongen, J.E.F.; Bakker, I.; Miedema, H.M.E. Influence of Environmental Street Characteristics on Walking Route Choice of Elderly People. J. Environ. Psychol. 2009, 29, 477–484. [Google Scholar] [CrossRef]
- El-Geneidy, A.; Grimsrud, M.; Wasfi, R.; Tétreault, P.; Surprenant-Legault, J. New Evidence on Walking Distances to Transit Stops: Identifying Redundancies and Gaps Using Variable Service Areas. Transportation 2014, 41, 193–210. [Google Scholar] [CrossRef]
- Moniruzzaman, M.; Paez, A.; Scott, D.; Morency, C. Trip Generation of Seniors and the Geography of Walking in Montreal. Environ. Plan. A Econ. Space 2015, 47, 957–976. [Google Scholar] [CrossRef]
- Jun, M.J.; Choi, K.; Jeong, J.E.; Kwon, K.H.; Kim, H.J. Land Use Characteristics of Subway Catchment Areas and Their Influence on Subway Ridership in Seoul. J. Transp. Geogr. 2015, 48, 30–40. [Google Scholar] [CrossRef]
- Cheng, L.; Caset, F.; de Vos, J.; Derudder, B.; Witlox, F. Investigating Walking Accessibility to Recreational Amenities for Elderly People in Nanjing, China. Transp. Res. Part D Transp. Environ. 2019, 76, 85–99. [Google Scholar] [CrossRef]
- Chudyk, A.M.; Winters, M.; Moniruzzaman, M.; Ashe, M.C.; Gould, J.S.; McKay, H. Destinations Matter: The Association between Where Older Adults Live and Their Travel Behavior. J. Transp. Health 2015, 2, 50–57. [Google Scholar] [CrossRef] [Green Version]
- Loukaitou-Sideris, A.; Levy-Storms, L.; Chen, L.; Brozen, M. Parks for an Aging Population: Needs and Preferences of Low-Income Seniors in Los Angeles. J. Am. Plan. Assoc. 2016, 82, 236–251. [Google Scholar] [CrossRef]
- Van den Berg, A.E.; Maas, J.; Verheij, R.A.; Groenewegen, P.P. Green Space as a Buffer between Stressful Life Events and Health. Soc. Sci. Med. 2010, 70, 1203–1210. [Google Scholar] [CrossRef] [Green Version]
- Lin, T.; Xia, J.; Robinson, T.P.; Goulias, K.G.; Church, R.L.; Olaru, D.; Tapin, J.; Han, R. Spatial Analysis of Access to and Accessibility Surrounding Train Stations: A Case Study of Accessibility for the Elderly in Perth, Western Australia. J. Transp. Geogr. 2014, 39, 111–120. [Google Scholar] [CrossRef] [Green Version]
- Truong, L.T.; Somenahalli, S.V.C. Exploring Frequency of Public Transport Use among Older Adults: A Study in Adelaide, Australia. Travel Behav. Soc. 2015, 2, 148–155. [Google Scholar] [CrossRef]
- Wong, R.C.P.; Szeto, W.Y.; Yang, L.; Li, Y.C.; Wong, S.C. Elderly Users’ Level of Satisfaction with Public Transport Services in a High-Density and Transit-Oriented City. J. Transp. Health 2017, 7, 209–217. [Google Scholar] [CrossRef] [Green Version]
- Sung, H.; Choi, K.; Lee, S.; Cheon, S.H. Exploring the Impacts of Land Use by Service Coverage and Station-Level Accessibility on Rail Transit Ridership. J. Transp. Geogr. 2014, 36, 134–140. [Google Scholar] [CrossRef]
- Hallgrimsdottir, B.; Svensson, H.; Ståhl, A. Long Term Effects of an Intervention in the Outdoor Environment-a Comparison of Older People’s Perception in Two Residential Areas, in One of Which Accessibility Improvements Were Introduced. J. Transp. Geogr. 2015, 42, 90–97. [Google Scholar] [CrossRef]
- Hess, D.B. Access to Public Transit and Its Influence on Ridership for Older Adults in Two U.S. Cities; University at Buffalo: New York, NY, USA, 2009; Volume 2. [Google Scholar]
- Sun, G.; Lau, C.Y. Go-along with Older People to Public Transport in High-Density Cities: Understanding the Concerns and Walking Barriers through Their Lens. J. Transp. Health 2021, 21, 101072. [Google Scholar] [CrossRef]
- Guo, J.Y.; Chen, C. The Built Environment and Travel Behavior: Making the Connection. Transportation 2007, 34, 529–533. [Google Scholar] [CrossRef]
- Broome, K.; Worrall, L.; Fleming, J.; Boldy, D. Evaluation of Flexible Route Bus Transport for Older People. Transp. Policy 2012, 21, 85–91. [Google Scholar] [CrossRef]
- Zhang, Y.; Yao, E.; Zhang, R.; Xu, H. Analysis of Elderly People’s Travel Behaviours during the Morning Peak Hours in the Context of the Free Bus Programme in Beijing, China. J. Transp. Geogr. 2019, 76, 191–199. [Google Scholar] [CrossRef]
- Bivina, G.R.; Gupta, A.; Parida, M. Walk Accessibility to Metro Stations: An Analysis Based on Meso- or Micro-Scale Built Environment Factors. Sustain. Cities Soc. 2020, 55, 102047. [Google Scholar] [CrossRef]
- Gao, Y.; Zhao, J.; Han, L. Exploring the Spatial Heterogeneity of Urban Heat Island Effect and Its Relationship to Block Morphology with the Geographically Weighted Regression Model. Sustain. Cities Soc. 2022, 76, 103431. [Google Scholar] [CrossRef]
- Collia, D.V.; Sharp, J.; Giesbrecht, L. The 2001 National Household Travel Survey: A Look into the Travel Patterns of Older Americans. J. Saf. Res. 2003, 34, 461–470. [Google Scholar] [CrossRef] [PubMed]
- Szeto, W.Y.; Yang, L.; Wong, R.C.P.; Li, Y.C.; Wong, S.C. Spatio-Temporal Travel Characteristics of the Elderly in an Ageing Society. Travel Behav. Soc. 2017, 9, 10–20. [Google Scholar] [CrossRef] [Green Version]
- Sohn, K.; Shim, H. Factors Generating Boardings at Metro Stations in the Seoul Metropolitan Area. Cities 2010, 27, 358–368. [Google Scholar] [CrossRef]
- Su, S.; Zhao, C.; Zhou, H.; Li, B.; Kang, M. Unraveling the Relative Contribution of TOD Structural Factors to Metro Ridership: A Novel Localized Modeling Approach with Implications on Spatial Planning. J. Transp. Geogr. 2022, 100, 103308. [Google Scholar] [CrossRef]
- Huang, X.; Cao, X.J.; Cao, X.; Yin, J. How Does the Propensity of Living near Rail Transit Moderate the Influence of Rail Transit on Transit Trip Frequency in Xi’an? J. Transp. Geogr. 2016, 54, 194–204. [Google Scholar] [CrossRef] [Green Version]
- Ewing, R.; Hamidi, S.; Gallivan, F.; Nelson, A.; Grace, J. Combined Effects of Compact Development, Transportation Investments, and Road User Pricing on Vehicle Miles Traveled in Urbanized Areas. Transp. Res. Rec. 2013, 2397, 117–124. [Google Scholar] [CrossRef]
- Durning, M.; Townsend, C. Direct Ridership Model of Rail Rapid Transit Systems in Canada. Transp. Res. Rec. 2015, 2537, 96–102. [Google Scholar] [CrossRef]
- Gan, Z.; Yang, M.; Feng, T.; Timmermans, H. Understanding Urban Mobility Patterns from a Spatiotemporal Perspective: Daily Ridership Profiles of Metro Stations. Transportation 2020, 47, 315–336. [Google Scholar] [CrossRef]
- Liu, Q.; Liu, Y.; Zhang, C.; An, Z.; Zhao, P. Elderly Mobility during the COVID-19 Pandemic: A Qualitative Exploration in Kunming, China. J. Transp. Geogr. 2021, 96, 103176. [Google Scholar] [CrossRef]
- Peng, J.; Cui, C.; Qi, J.; Ruan, Z.; Dai, Q.; Yang, H. The Evolvement of Rail Transit Network Structure and Impact on Travel Characteristics: A Case Study of Wuhan. ISPRS Int. J. Geo-Inf. 2021, 10, 789. [Google Scholar] [CrossRef]
- Park, K.; Chamberlain, B.; Song, Z.; Nasr Esfahani, H.; Sheen, J.; Larsen, T.; Long Novack, V.; Licon, C.; Christensen, K. A Double Jeopardy: COVID-19 Impacts on the Travel Behavior and Community Living of People with Disabilities. Transp. Res. Part A Policy Pract. 2022, 156, 24–35. [Google Scholar] [CrossRef] [PubMed]
- Ding, C.; Cao, X.; Yu, B.; Ju, Y. Non-Linear Associations between Zonal Built Environment Attributes and Transit Commuting Mode Choice Accounting for Spatial Heterogeneity. Transp. Res. Part A Policy Pract. 2021, 148, 22–35. [Google Scholar] [CrossRef]
- Yan, X.; Zhou, J.; Sheng, F.; Niu, Q. Influences of Built Environment at Residential and Work Locations on Commuting Distance: Evidence from Wuhan, China. ISPRS Int. J. Geo-Inf. 2022, 11, 124. [Google Scholar] [CrossRef]
- Cervero, R. Built Environments and Mode Choice: Toward a Normative Framework. Transp. Res. Part D Transp. Environ. 2002, 7, 265–284. [Google Scholar] [CrossRef]
- Newbold, K.B.; Scott, D.M.; Spinney, J.E.L.; Kanaroglou, P.; Páez, A. Travel Behavior within Canada’s Older Population: A Cohort Analysis. J. Transp. Geogr. 2005, 13, 340–351. [Google Scholar] [CrossRef]


| Category | Variable | Variable Description | Average Value | Standard Deviation |
|---|---|---|---|---|
| Density | Elderly population density | The ratio of resident elderly population to station area (persons/km2) was calculated by Kriging Interpolation | 681.86 | 287.38 |
| Building Floor area ratio | The Building Floor area ratio of the area around the metro station was calculated from the building vector data of Wuhan | 0.87 | 0.65 | |
| Diversity | Degree of land use mixture | The degree of land use mixture within the catchment area of the URT station. , where is the number of land use types in the area around site and is the proportion of the area of the th type of land use in the area. A larger landuse value indicates a higher land use mixture, while a smaller one indicates a lower land use mixture | 0.72 | 0.12 |
| Design | Number of intersections | Number of intersections in the station area of the metro station, representing the road complexity | 26.58 | 17.48 |
| Destination | Number of general hospitals | Number of general hospitals in the station area of the metro station | 27.11 | 27.02 |
| Number of parks | Number of parks in the station area of the metro station | 1.09 | 1.71 | |
| Number of commercial facilities | Number of commercial facilities in the station area of the metro station | 203.02 | 275.37 | |
| Distance | Distance from the city center | Euclidean distance between the URT station and the city center (km) | 10.64 | 6.20 |
| Distance from the sub city center | Euclidean distance between the URT station and the nearest sub city center (km) | 6.30 | 5.55 | |
| Number of bus stops | Number of bus stops in the station area of the metro station | 5.96 | 5.03 | |
| Station area road length | Length of road within the station area of the metro station | 11.57 | 3.69 | |
| Metro station features | Betweenness centrality | The betweenness centrality: , where is the number of shortest paths between station node s and node t and is the number of shortest paths that pass through node u | 0.41 | 0.09 |
| Terminal | Dummy variables, where 1 means the station is the terminal and 0 means the station is not | —— | —— | |
| Transfer station | Dummy variables, where 1 means the station is a transfer station and 0 means the station is not | —— | —— | |
| Exit quantity | Number of exits of the URT station | 5.08 | 3.49 | |
| Station opening time | The length of time after the metro station is put into use (months) | 71.85 | 59.81 | |
| Barrier-free facilities and indication system | Include: whether there is a ramp; whether the ramp is available; whether the barrier-free straight stairs are available; whether there is a barrier-free indication system, etc. 1 means yes; 0 means no | 0.79 | 0.41 |
| Transfer Station | Median | Z | p | Significance |
|---|---|---|---|---|
| Yes | 101.09 | 3.670 | <0.001 | *** |
| No | 66.08 |
| Variable | Non-Standardized Coefficient | Standard Coefficient | T-Value | p-Value | Significance | |
|---|---|---|---|---|---|---|
| B | Standard Error | |||||
| Intercept | 104,322.487 | 23,679.750 | 4.406 | <0.001 | ||
| Building Floor area ratio | 154,444.831 | 32,207.068 | 0.613 | 4.795 | <0.001 | *** |
| Number of commercial facilities | 380.141 | 75.534 | 0.644 | 5.033 | <0.001 | *** |
| Number of road intersections | −2997.383 | 989.389 | −0.322 | −3.030 | 0.003 | ** |
| Number of general hospitals | −2363.382 | 846.822 | −0.393 | −2.791 | 0.006 | ** |
| Model | Residual Sum of Squares | Coefficient of Determination | Adjusted Coefficient of Determination | AICc |
|---|---|---|---|---|
| OLS | 1,153,472,615.0217 | 0.4663 | 0.4467 | 2674.8514 |
| GWR | 714,913,944.7844 | 0.6692 | 0.5670 | 2662.9593 |
| Terminal | Median | Z | p | Significance |
|---|---|---|---|---|
| Yes | 110.60 | 3.118 | 0.002 | ** |
| No | 68.54 |
| Transfer Station | Median | Z | p | Significance |
|---|---|---|---|---|
| Yes | 49.59 | −2.717 | 0.007 | ** |
| No | 75.52 |
| Variable | Non-Standardized Coefficient | Standard Coefficient | T-Value | p-Value | Significance | |
|---|---|---|---|---|---|---|
| B | Standard Error | |||||
| Intercept | 21,194.236 | 2467.437 | 8.590 | <0.001 | *** | |
| Distance from the sub city center | 986.065 | 79.158 | 0.728 | 12.457 | <0.001 | *** |
| Station opening time | −30.541 | 4.768 | −0.243 | −6.406 | <0.001 | *** |
| Betweenness centrality | −39,664.354 | 5673.015 | −0.477 | −6.992 | <0.001 | *** |
| Building Floor area ratio | 4816.496 | 729.319 | 0.414 | 6.604 | <0.001 | *** |
| Model | Residual Sum of Squares | Coefficient of Determination | Adjusted Coefficient of Determination | AICc |
|---|---|---|---|---|
| OLS | 4,663,807,413.5320 | 0.0832 | 0.0495 | 2873.2332 |
| GWR | 1,477,237,421.1811 | 0.7096 | 0.6050 | 2773.4024 |
Publisher’s Note: MDPI stays neutral with regard to jurisdictional claims in published maps and institutional affiliations. |
© 2022 by the authors. Licensee MDPI, Basel, Switzerland. This article is an open access article distributed under the terms and conditions of the Creative Commons Attribution (CC BY) license (https://creativecommons.org/licenses/by/4.0/).
Share and Cite
Yang, H.; Ruan, Z.; Li, W.; Zhu, H.; Zhao, J.; Peng, J. The Impact of Built Environment Factors on Elderly People’s Mobility Characteristics by Metro System Considering Spatial Heterogeneity. ISPRS Int. J. Geo-Inf. 2022, 11, 315. https://0-doi-org.brum.beds.ac.uk/10.3390/ijgi11050315
Yang H, Ruan Z, Li W, Zhu H, Zhao J, Peng J. The Impact of Built Environment Factors on Elderly People’s Mobility Characteristics by Metro System Considering Spatial Heterogeneity. ISPRS International Journal of Geo-Information. 2022; 11(5):315. https://0-doi-org.brum.beds.ac.uk/10.3390/ijgi11050315
Chicago/Turabian StyleYang, Hong, Zehan Ruan, Wenshu Li, Huanjie Zhu, Jie Zhao, and Jiandong Peng. 2022. "The Impact of Built Environment Factors on Elderly People’s Mobility Characteristics by Metro System Considering Spatial Heterogeneity" ISPRS International Journal of Geo-Information 11, no. 5: 315. https://0-doi-org.brum.beds.ac.uk/10.3390/ijgi11050315