
An Improved Ant Colony Algorithm for Urban Bus Network Optimization Based on Existing Bus Routes

 ,
,
Abstract
:1. Introduction
2. Data
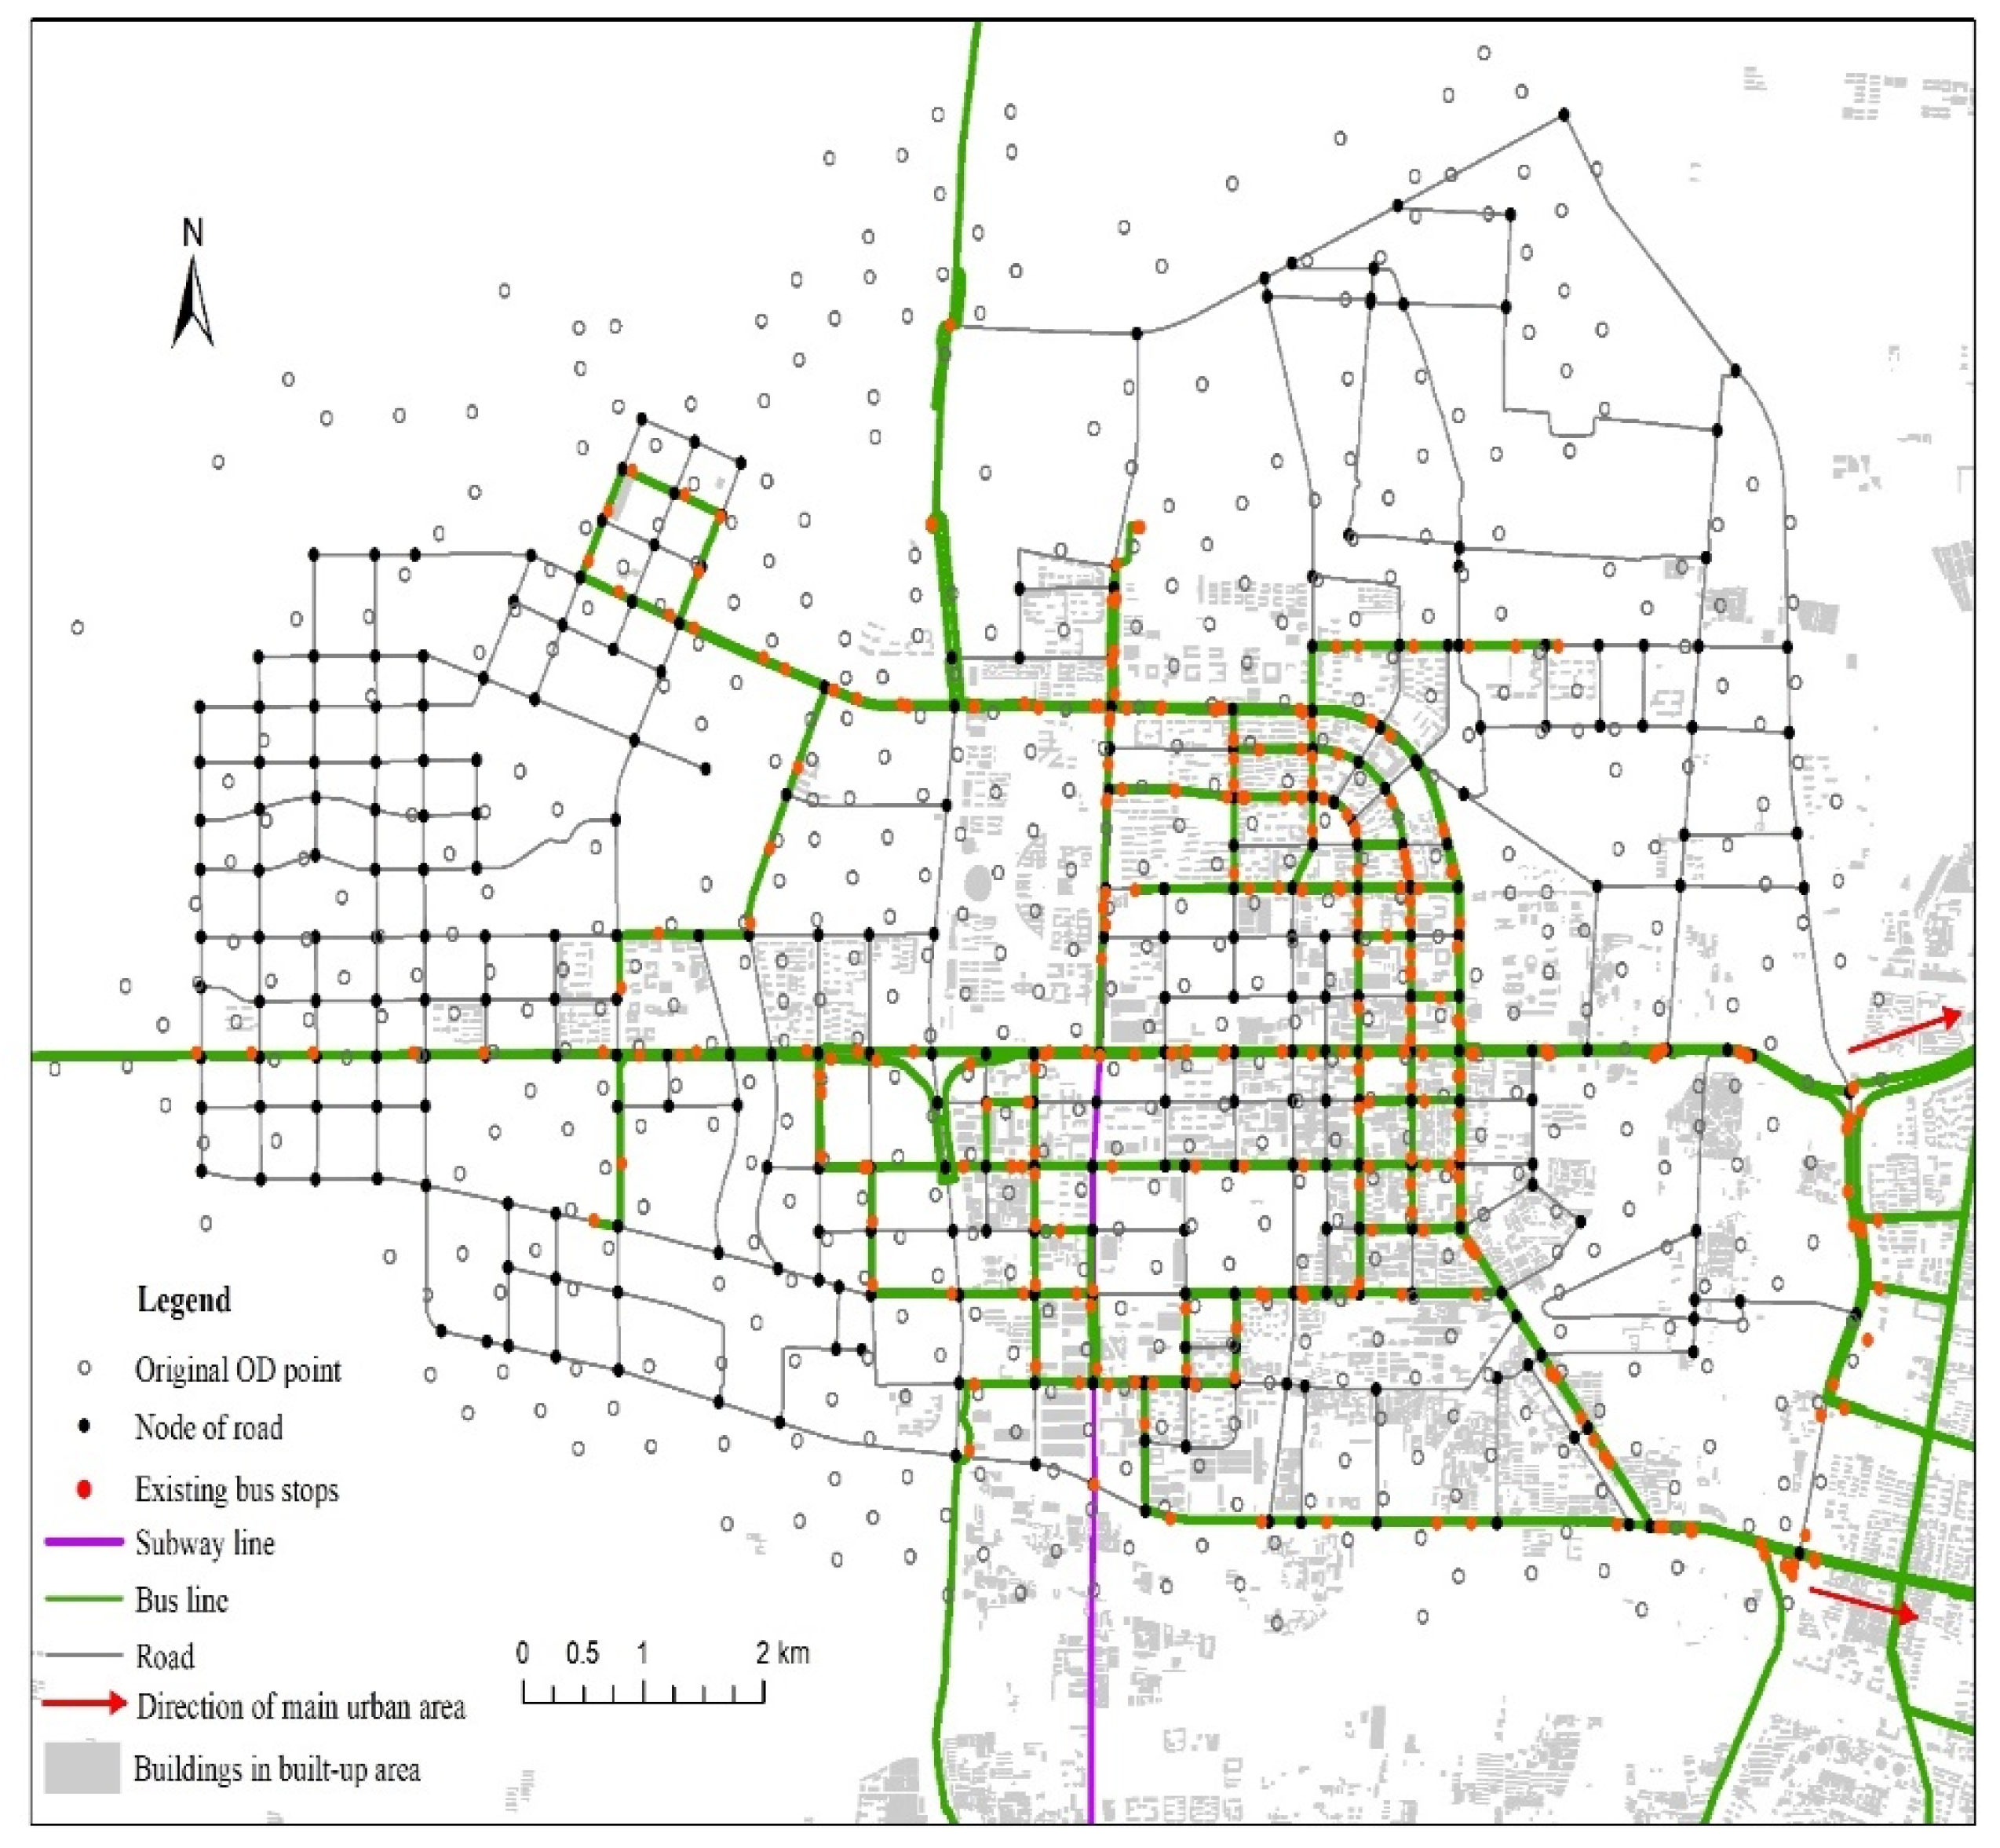
2.1. Study Area
2.2. Data Acquisition
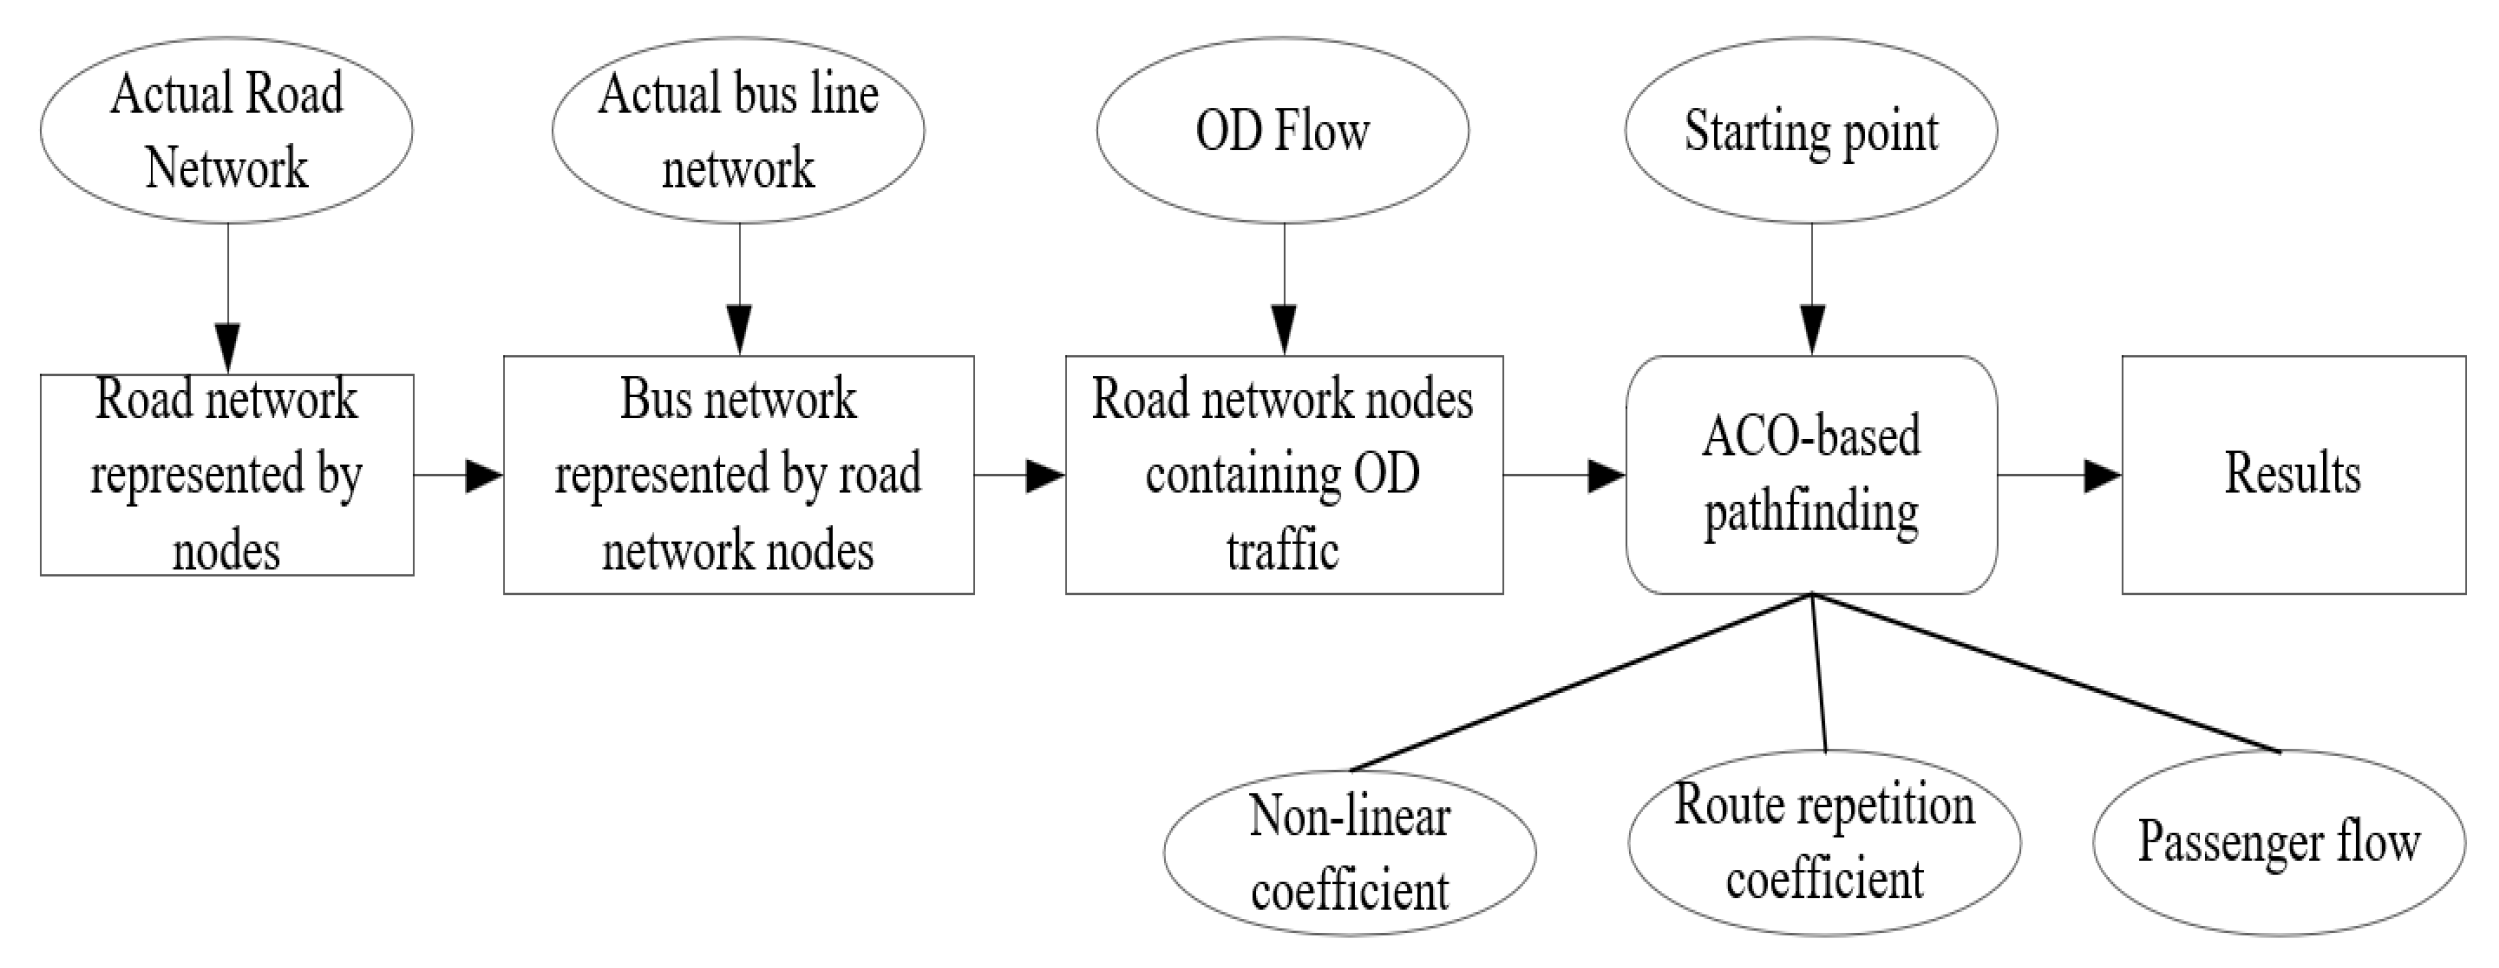
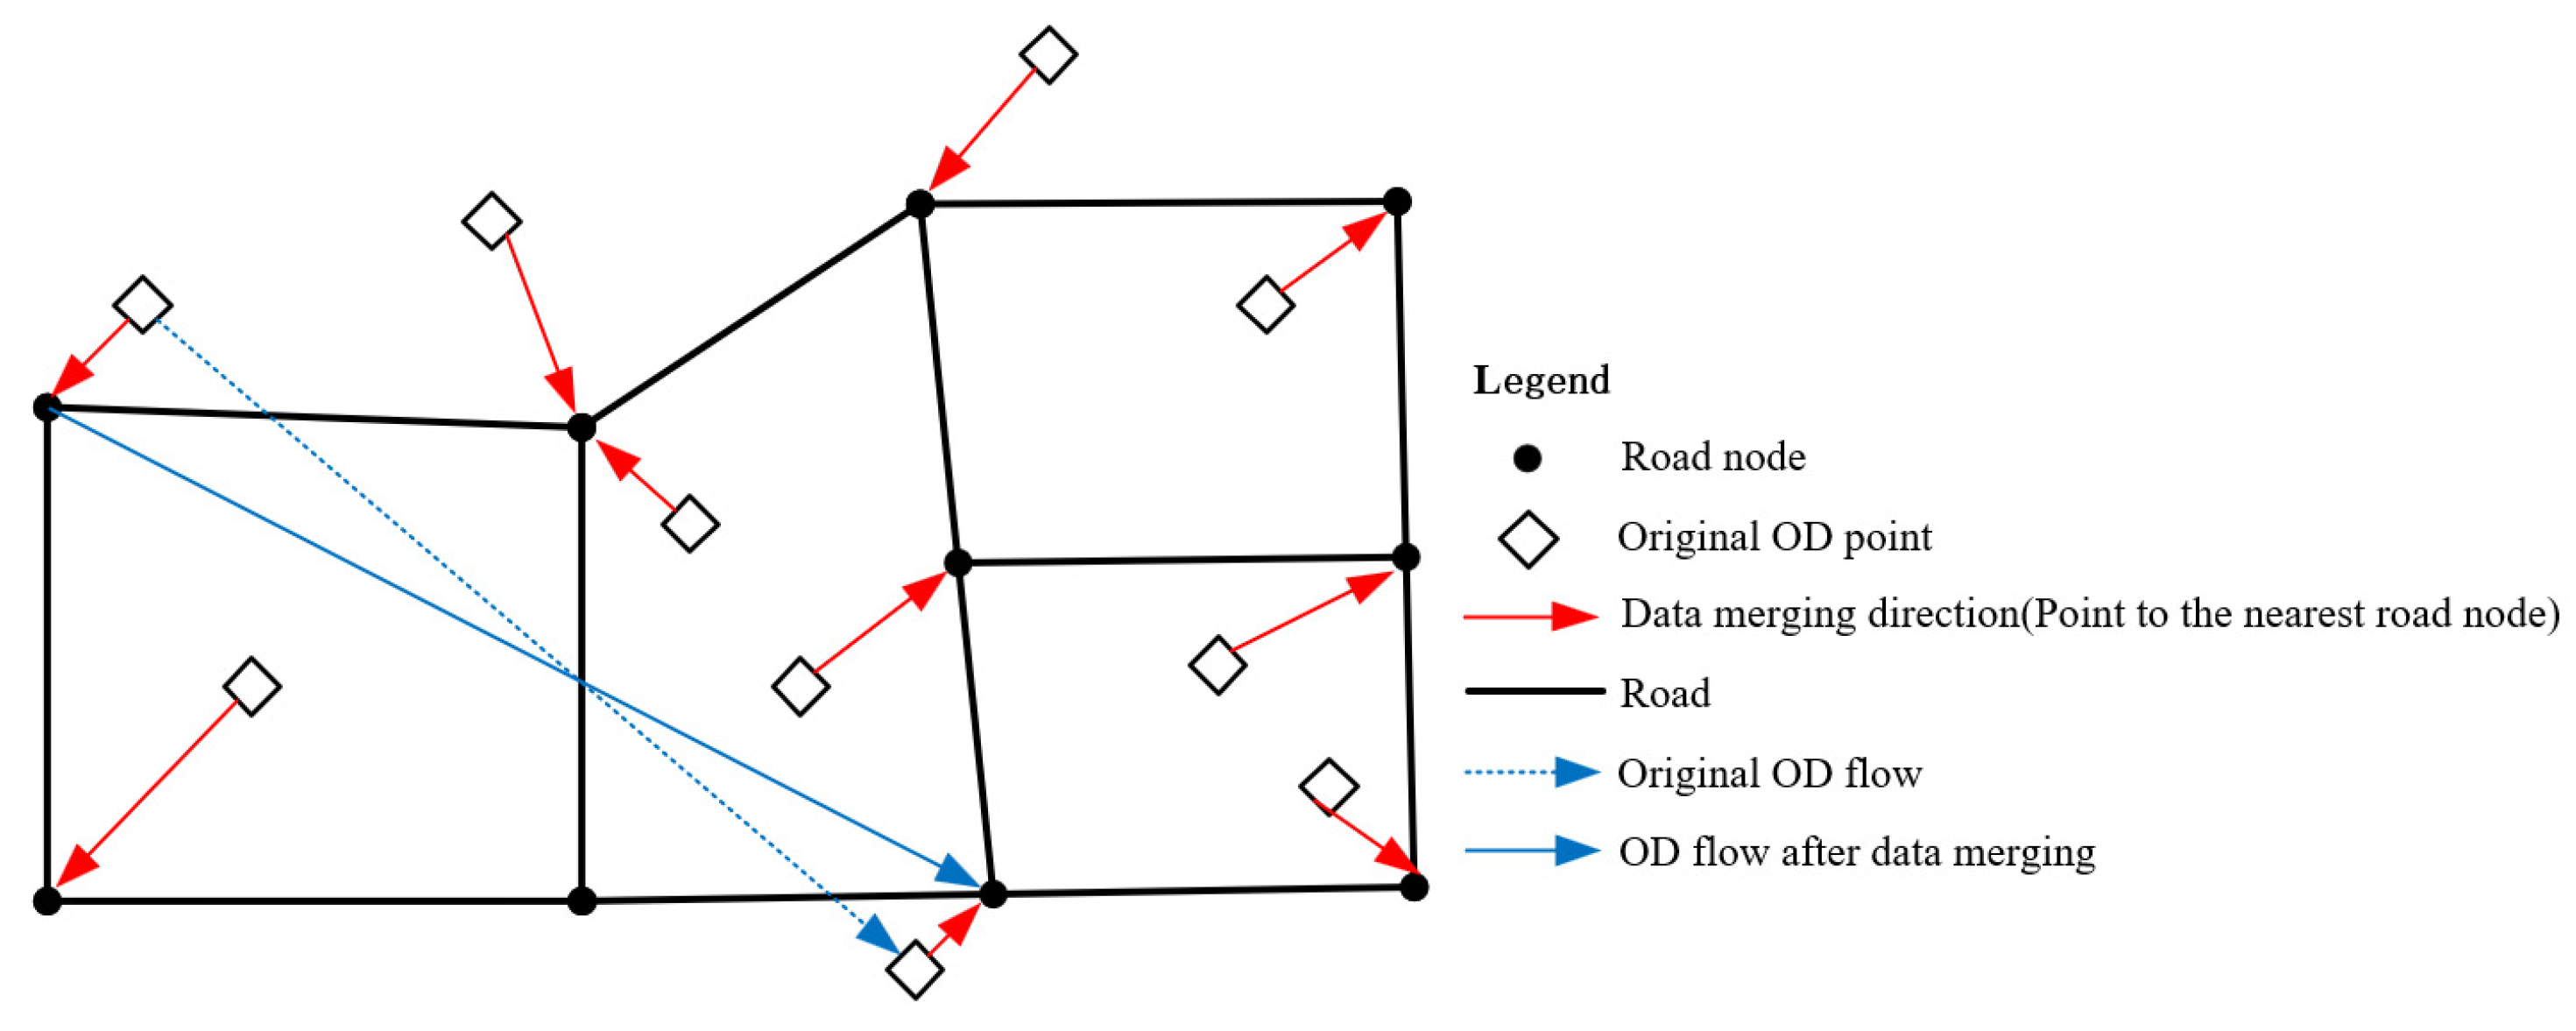
2.3. Data Fusion
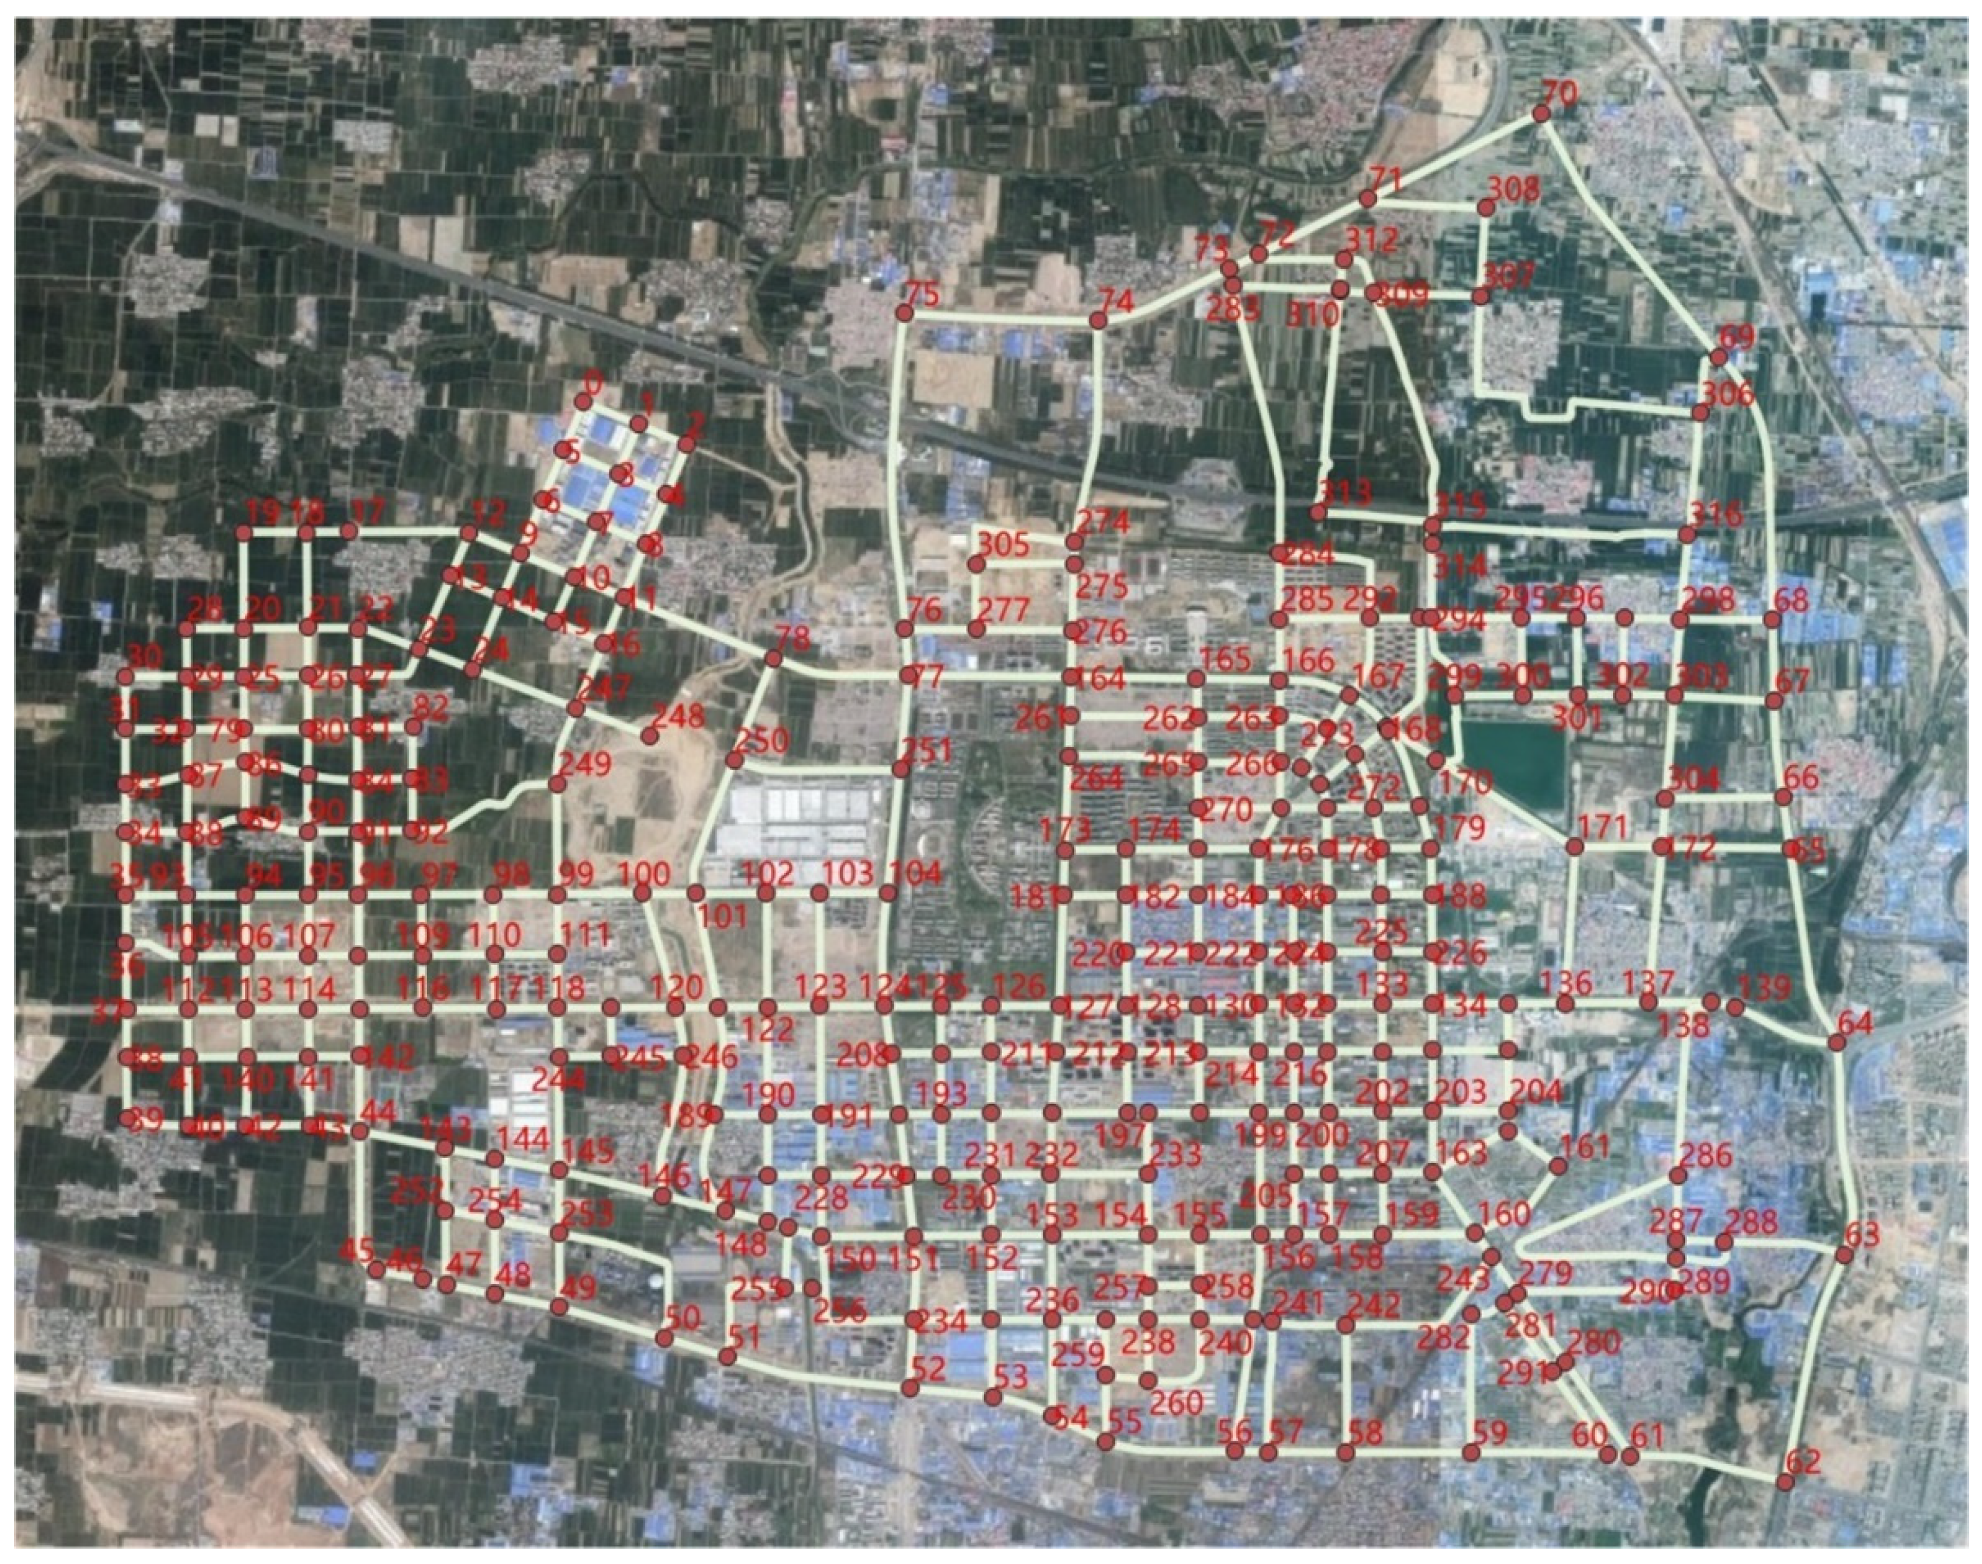
- Road node expression:
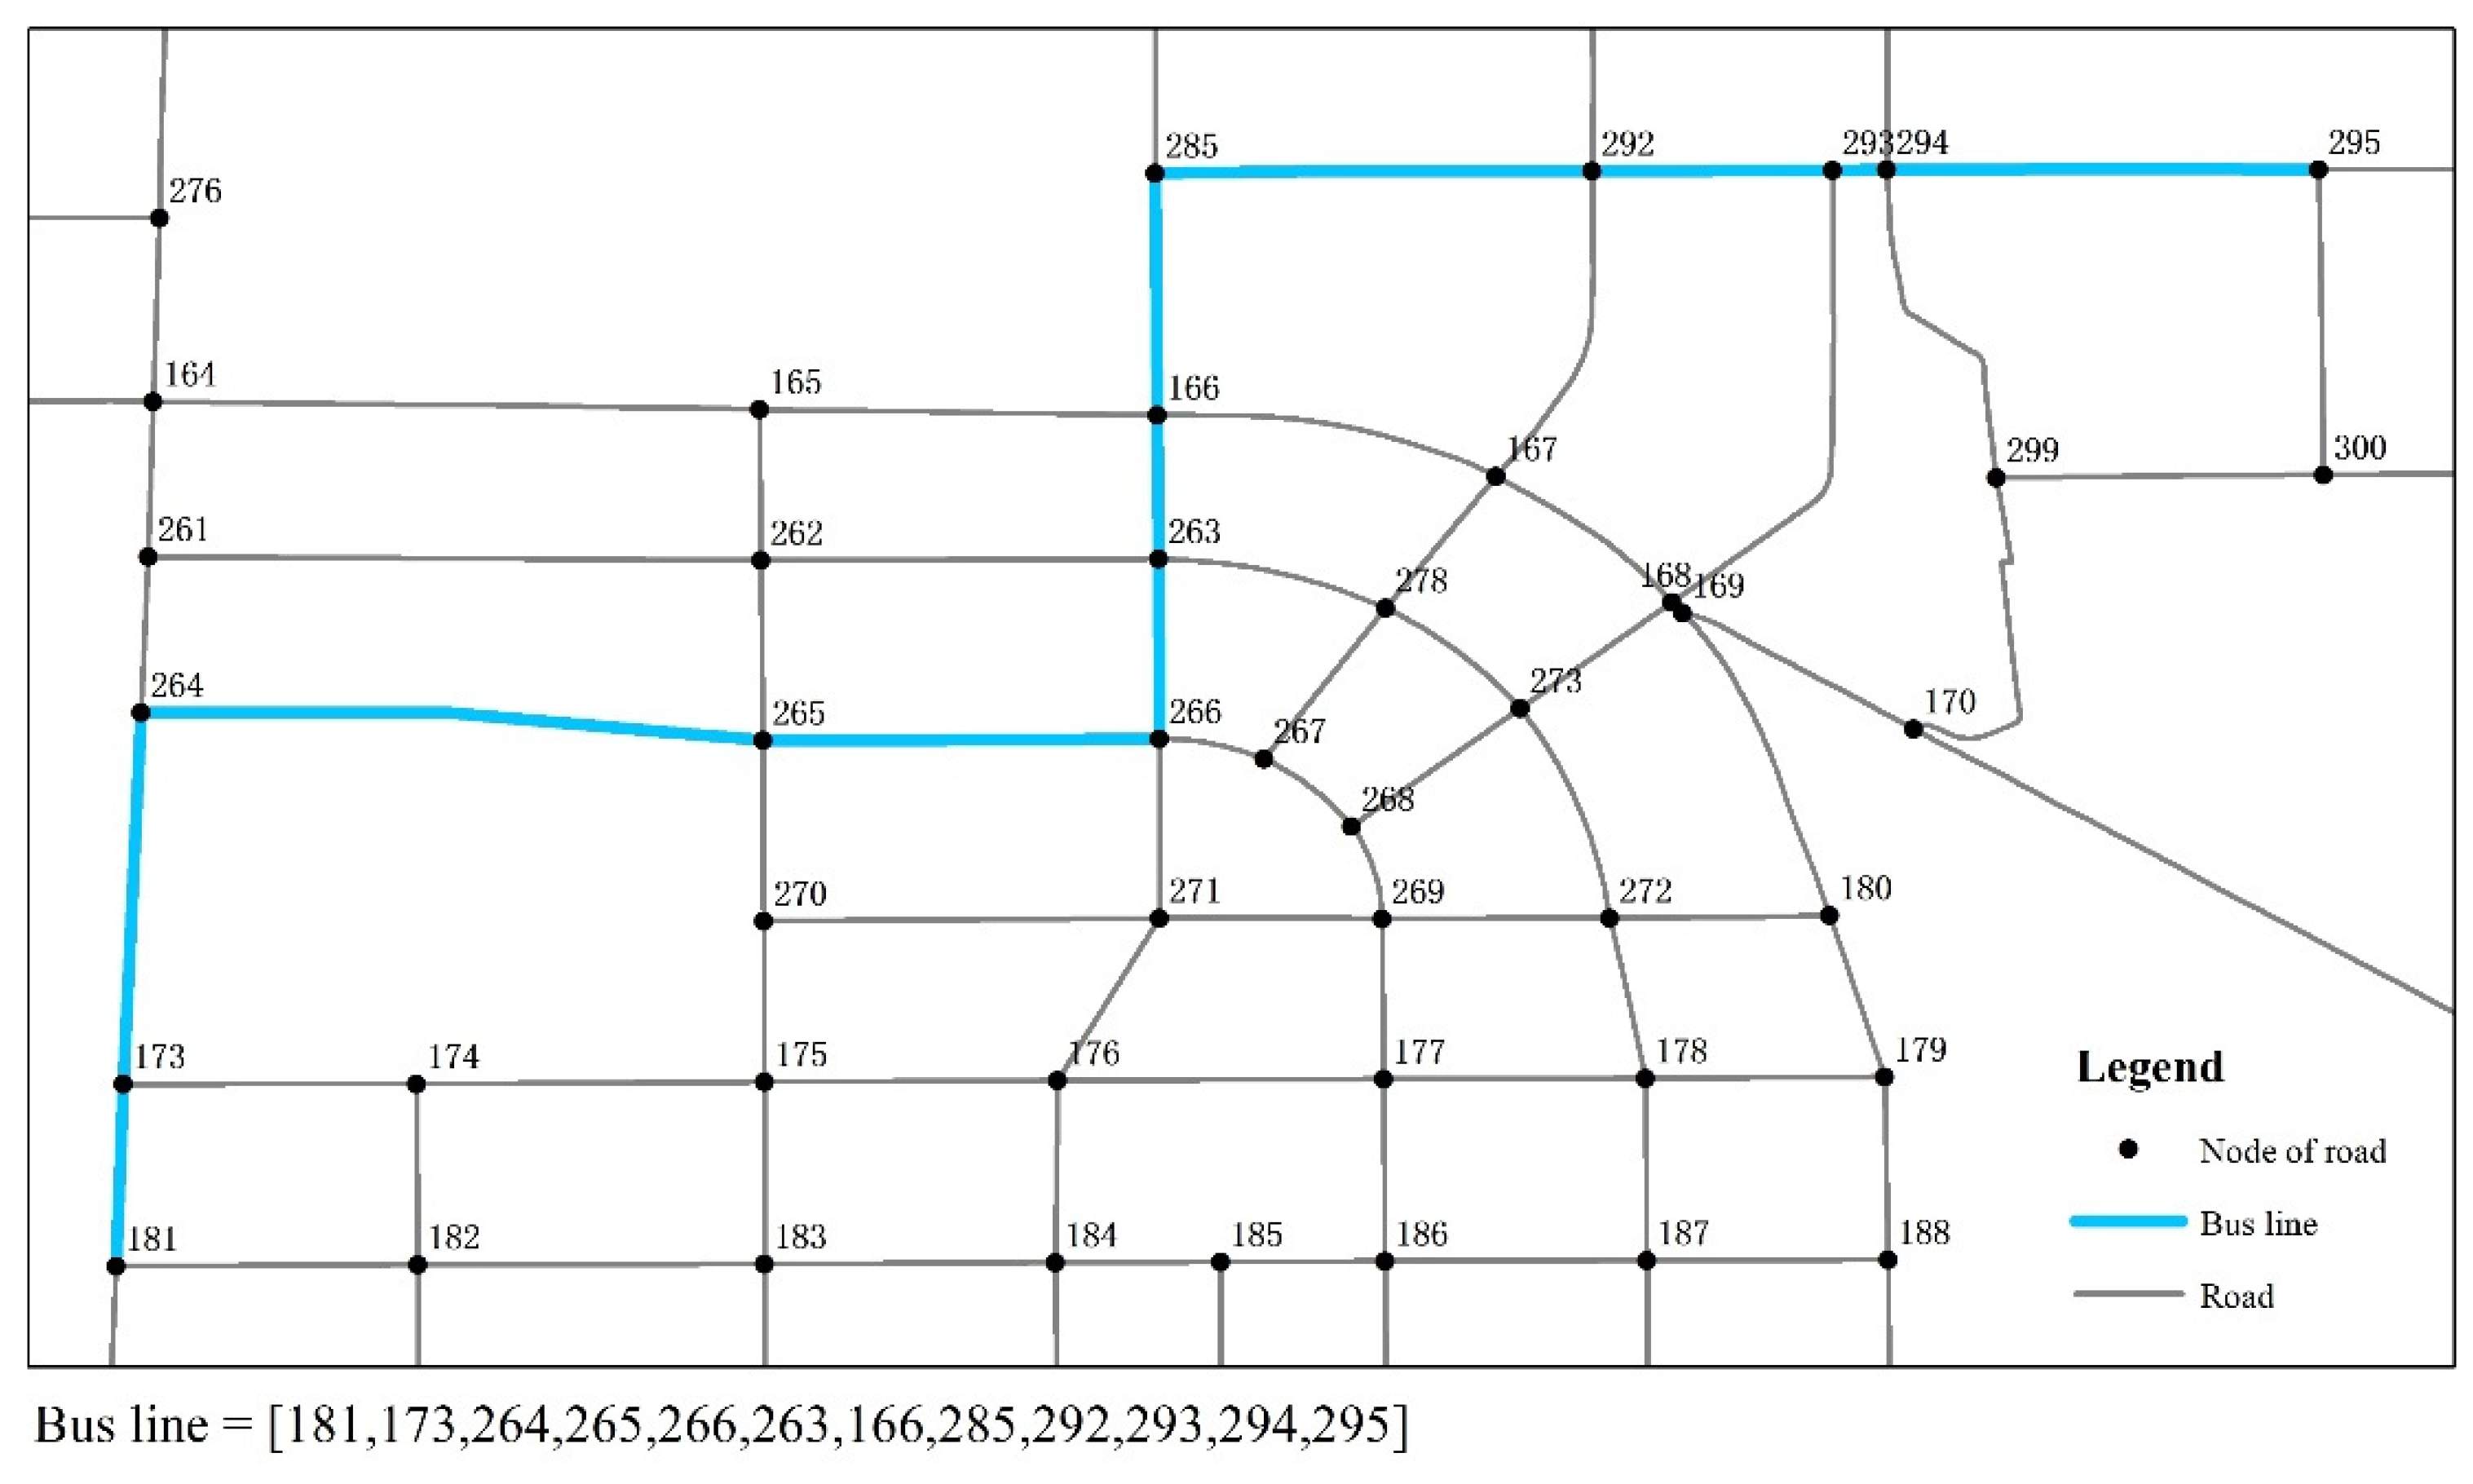
- Node expression of public transport routes:
- Spatial unification of OD data with road nodes and line nodes:
3. Algorithm
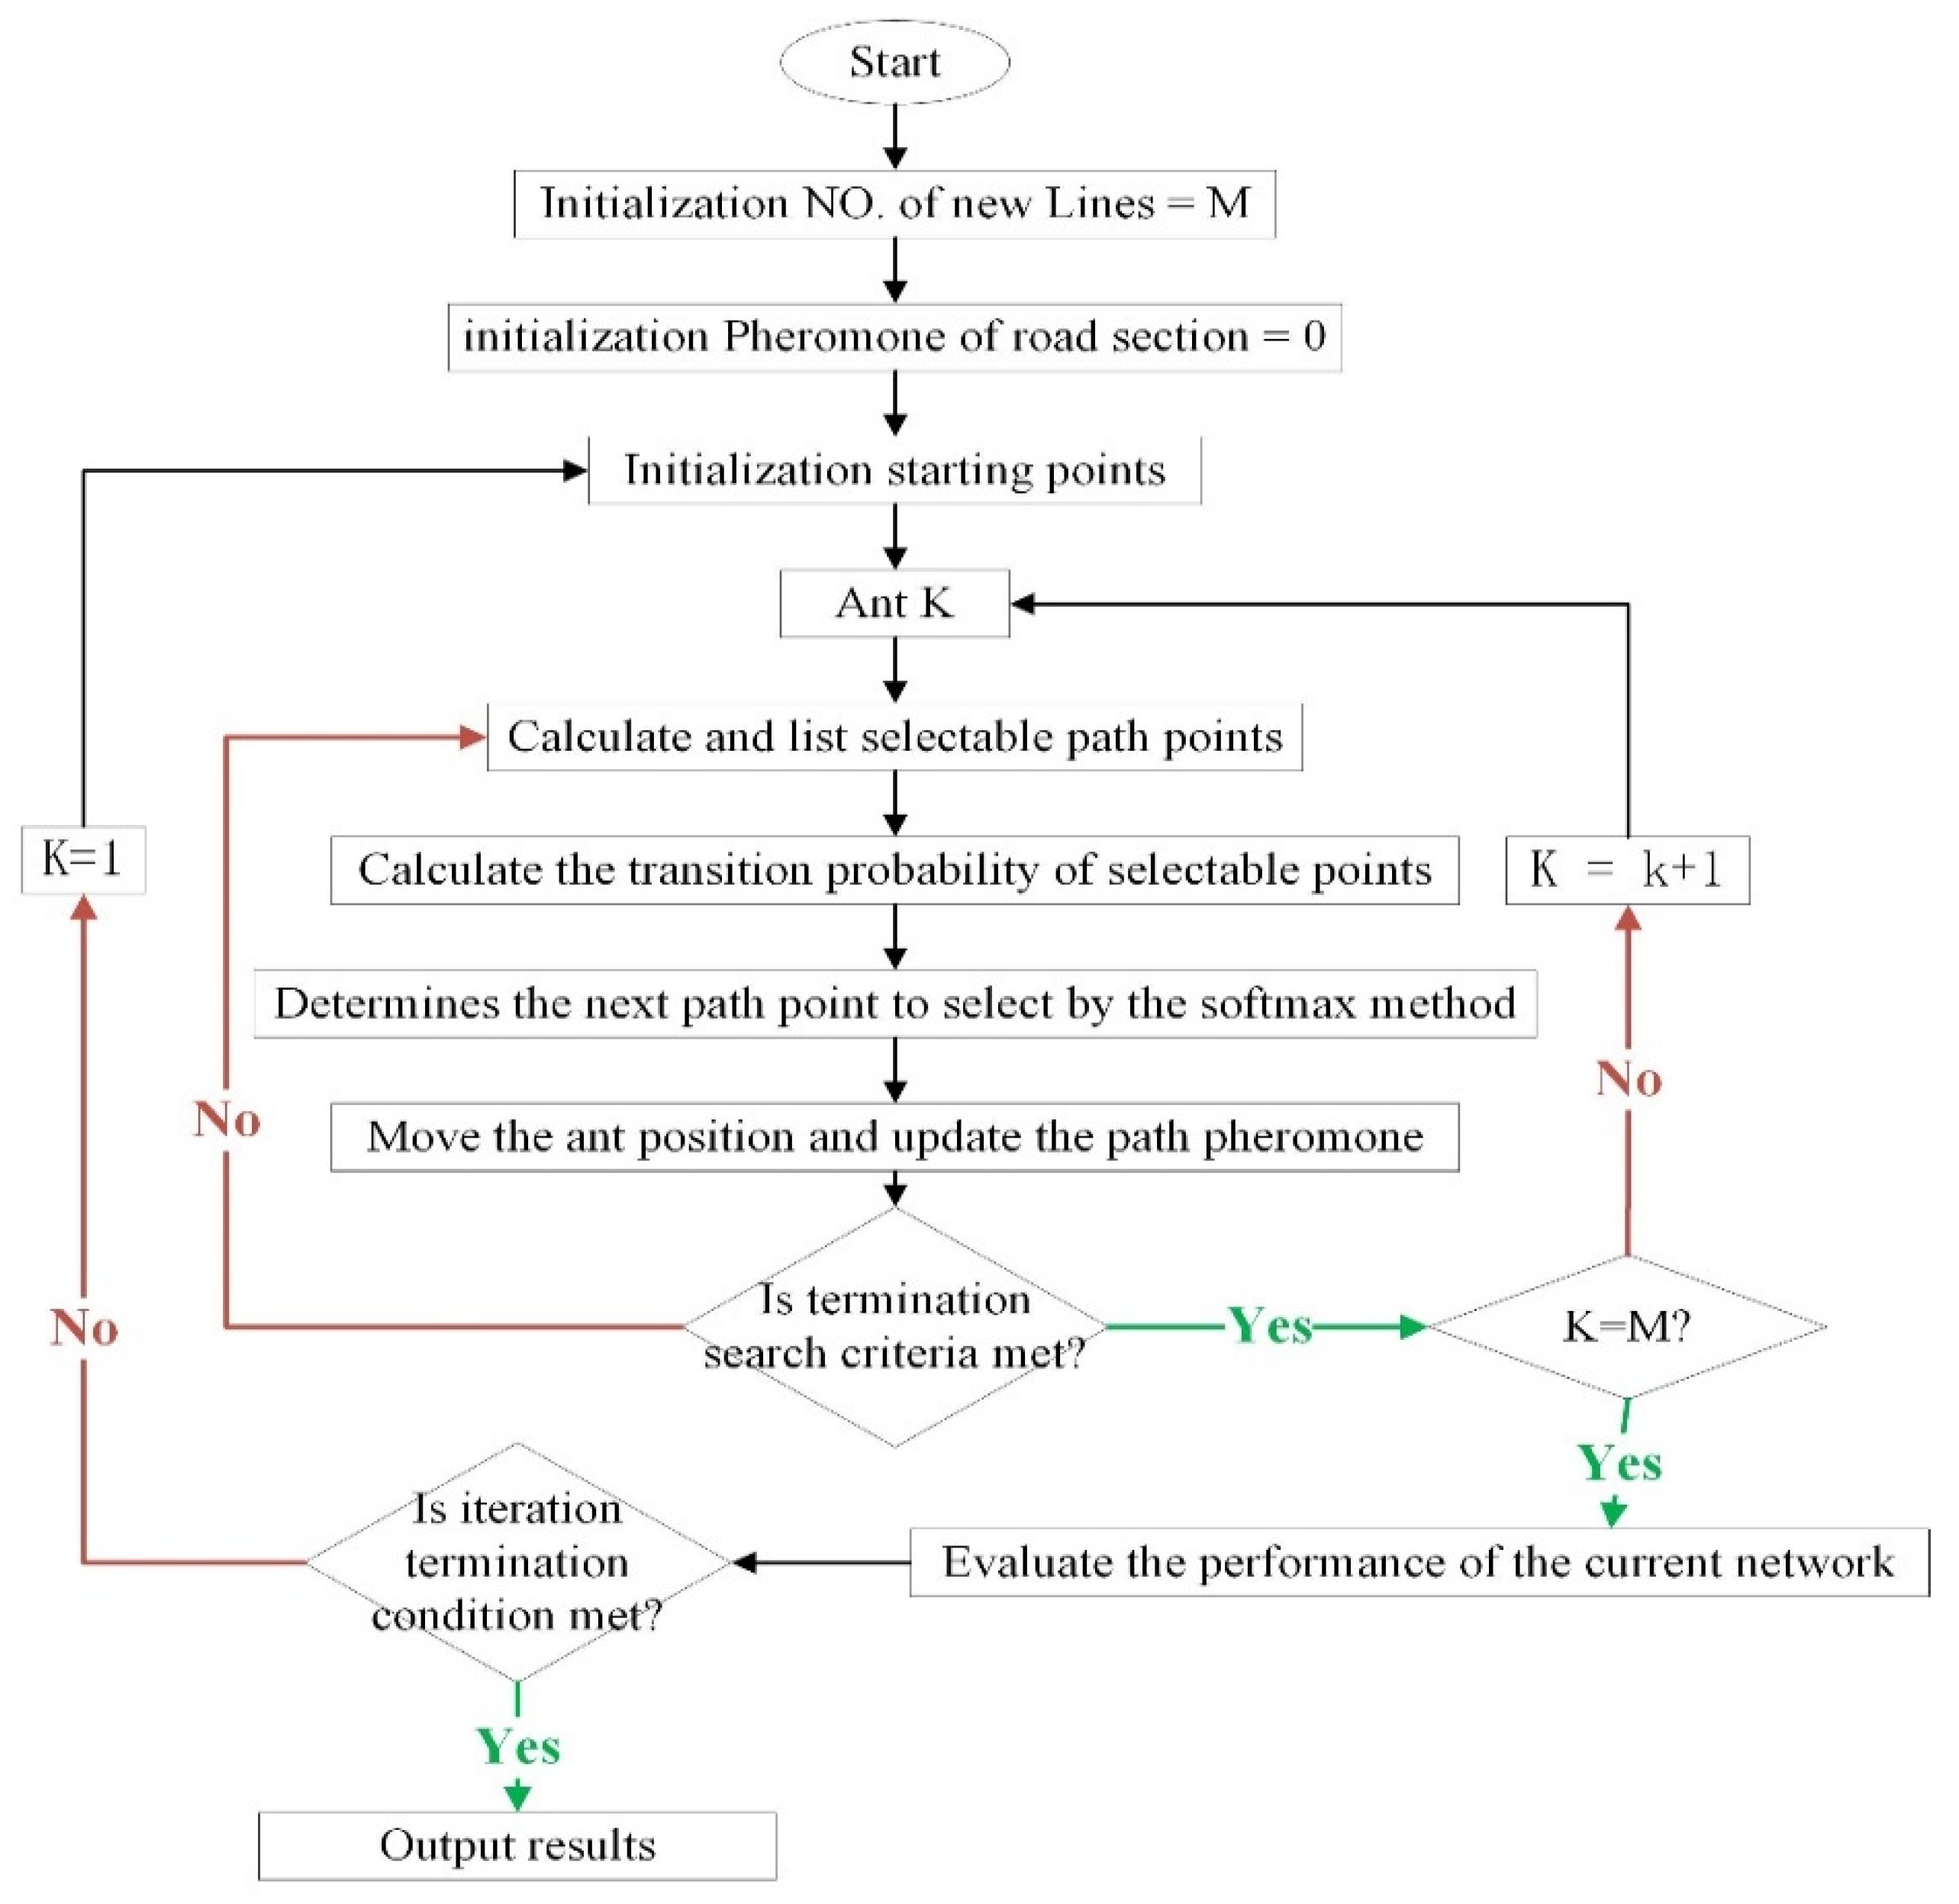
3.1. Algorithm Procedure
3.2. Transition Probability Calculation of Path Selection
- (1)
- Since is the passenger flow heuristic factor, the purpose is to make the ants tend toward choosing the route with higher passenger flow. In order to maintain the consistency of order of magnitude in the calculation of each influence factor, is the result after the extreme difference normalization calculation of OD traffic.
- (2)
- is the non-linear coefficient heuristic factor of the bus route that denotes the non-linear coefficient from the starting point o of the route planning to node j, and it is calculated as follows:According to Formula (6), except for the case of overlapping starting and ending points (circular lines), the calculation result of the non-linear coefficient of the line will not be theoretically less than 1. According to the standard [27], its value should not be greater than 1.4. In order to make the ants more inclined to choose the route with a smaller non-linear coefficient, the inverse of is taken as the non-linear coefficient heuristic factor in the calculation.
- (3)
- is the existing route weight heuristic factor, which makes the ants more inclined to choose the nodes in the current road network through which no bus routes pass, and it is calculated as follows:
3.3. Pheromone Update Strategy
3.4. Current Network Performance Evaluation
4. Results
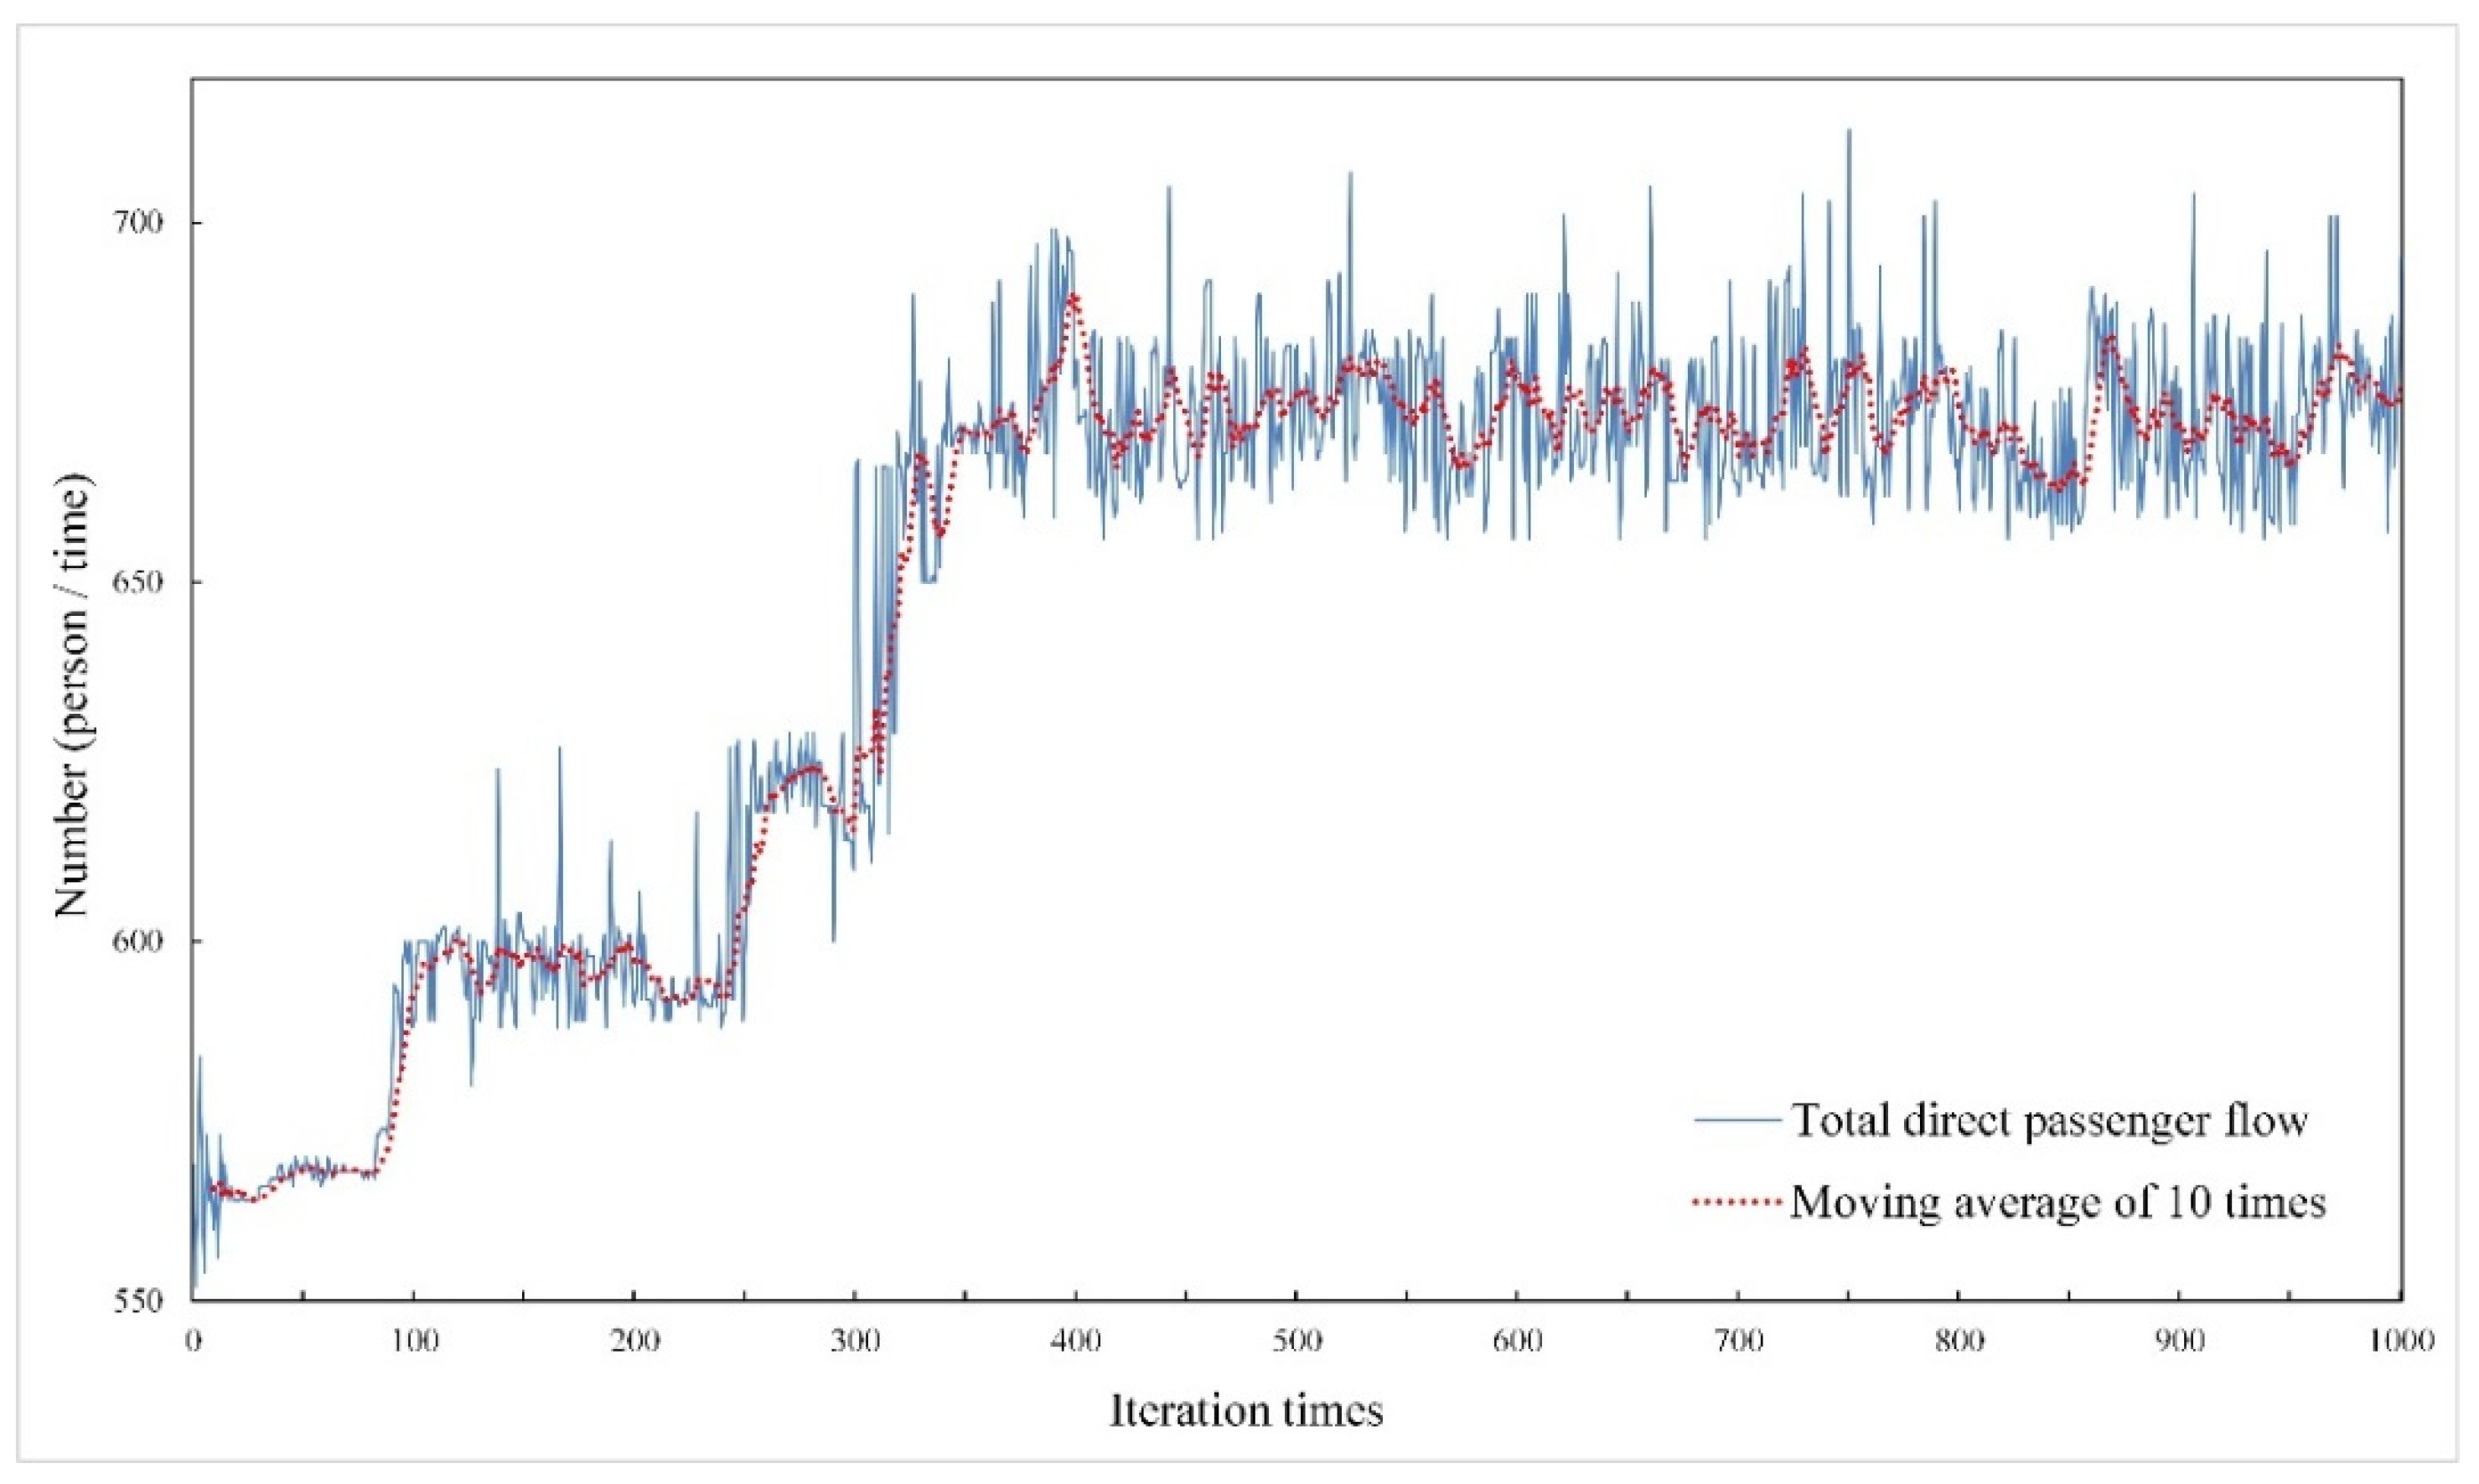
4.1. Convergence Analysis
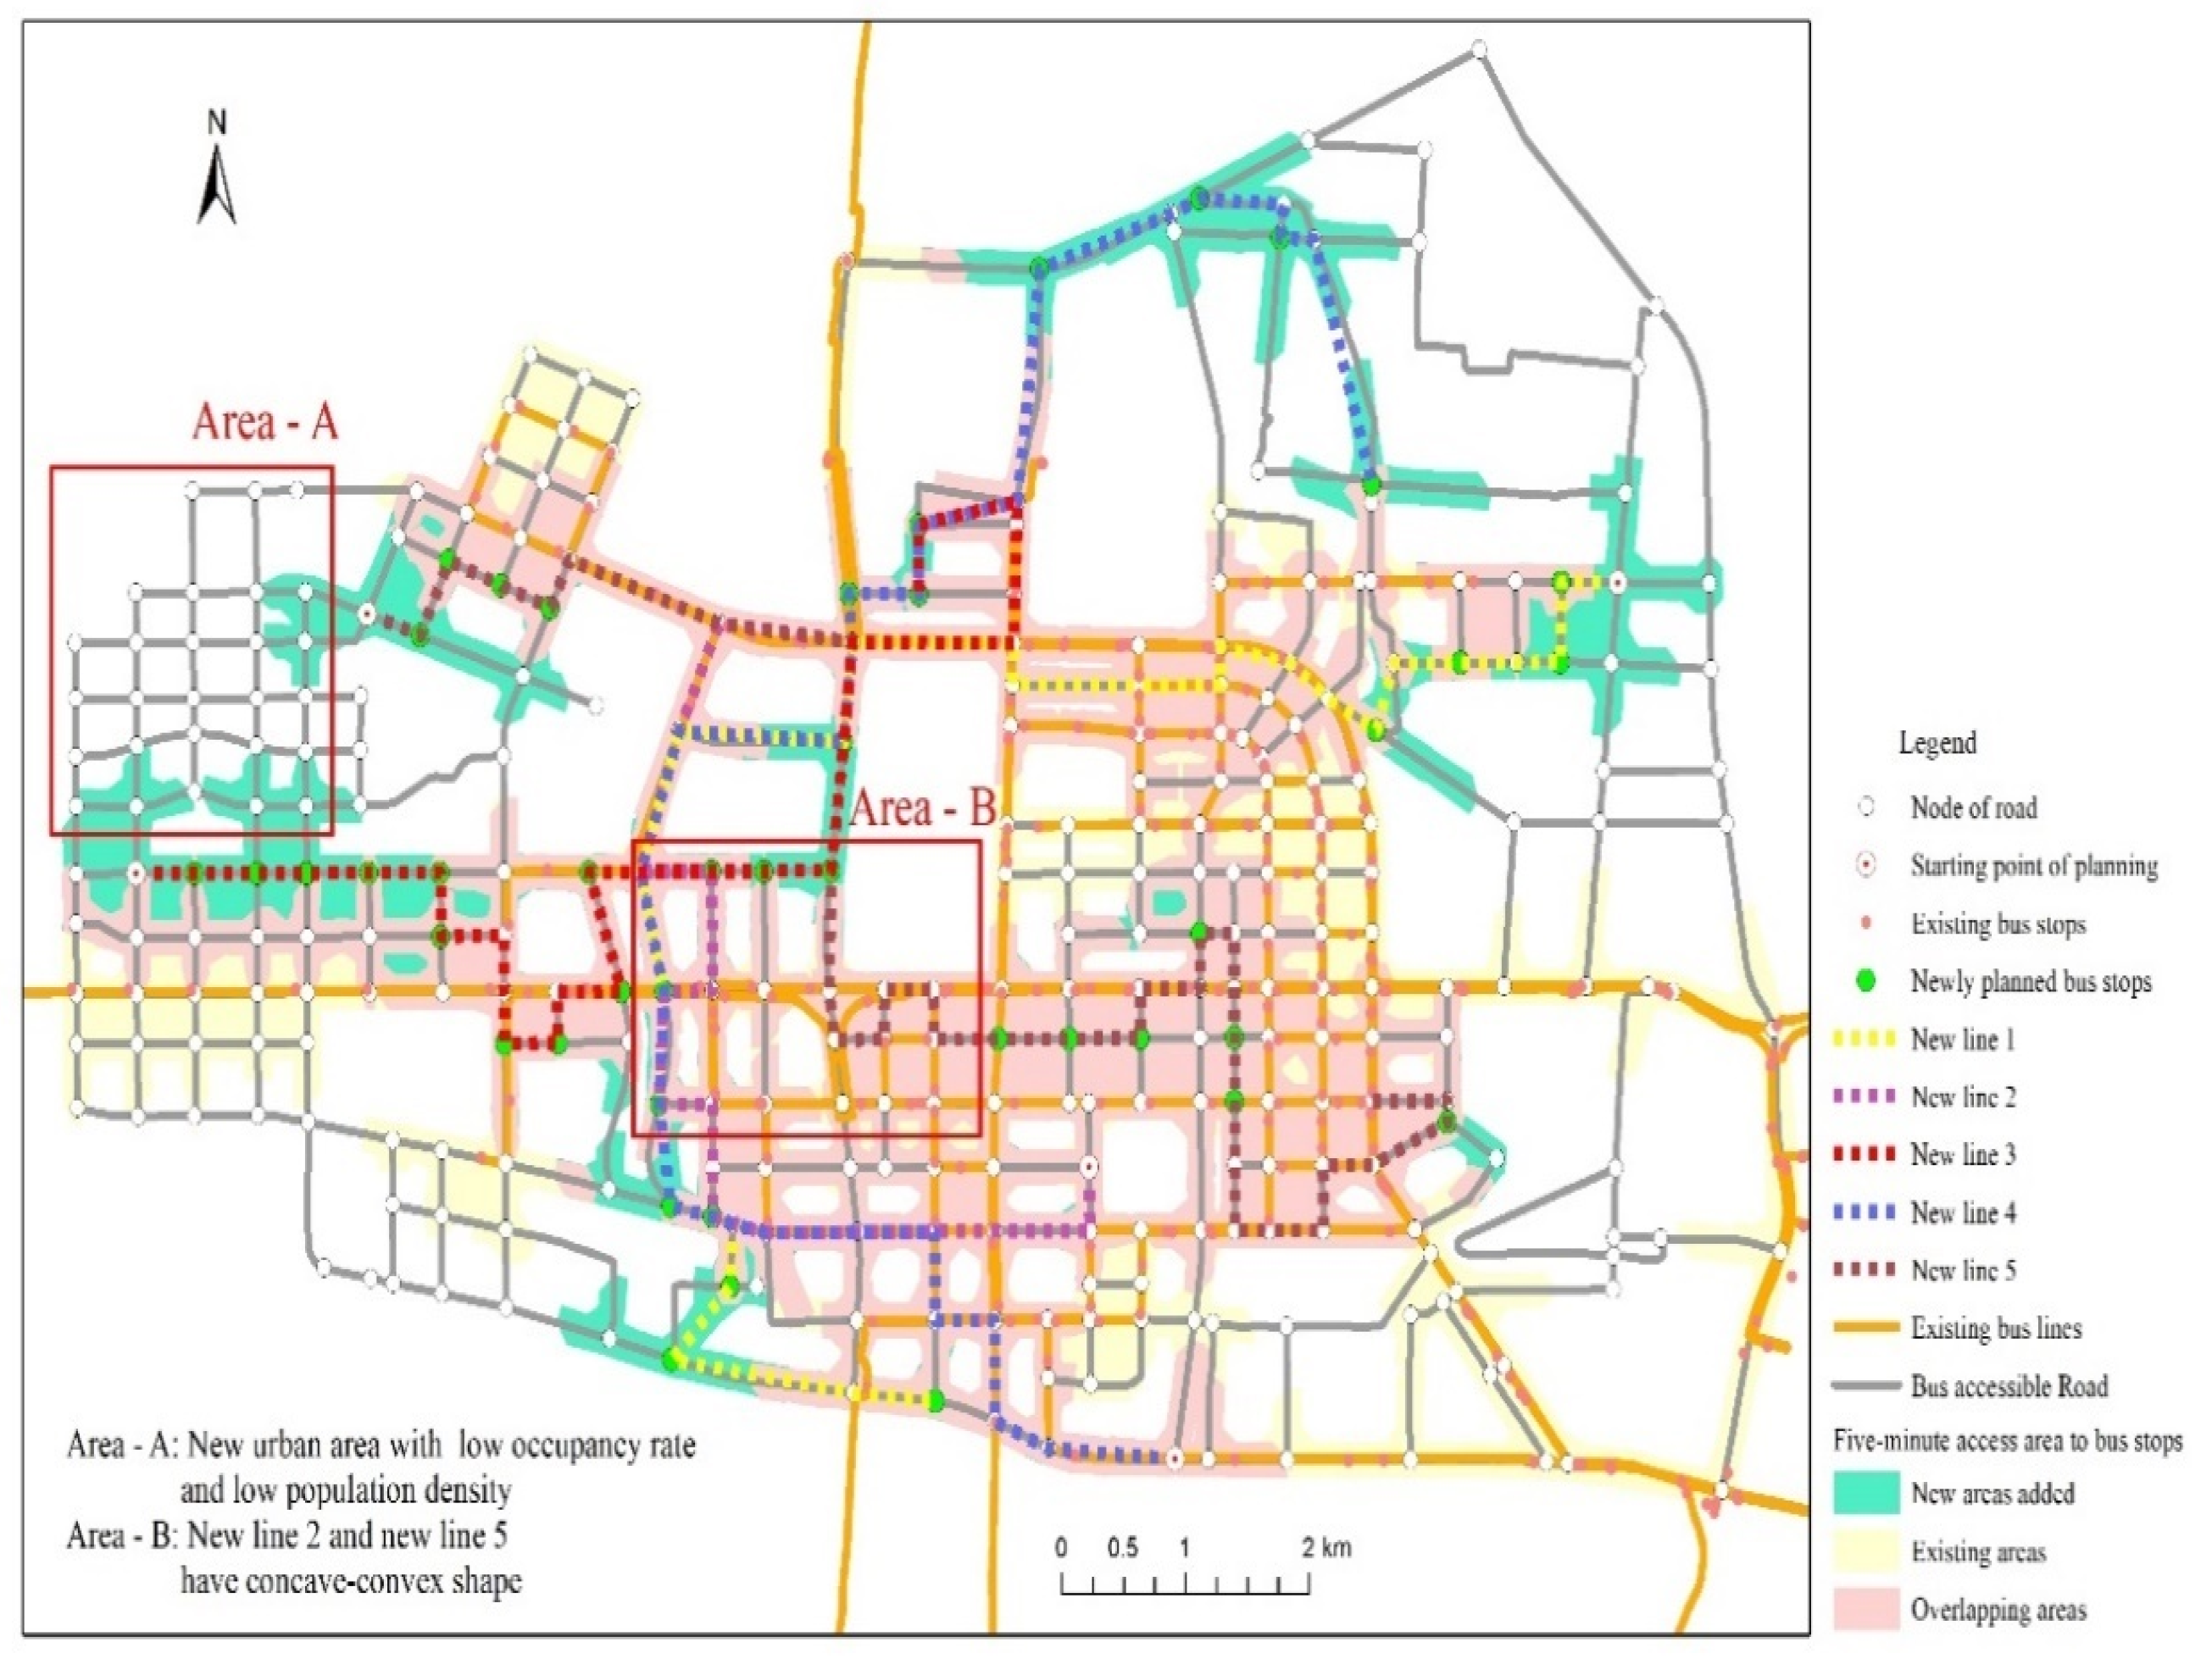
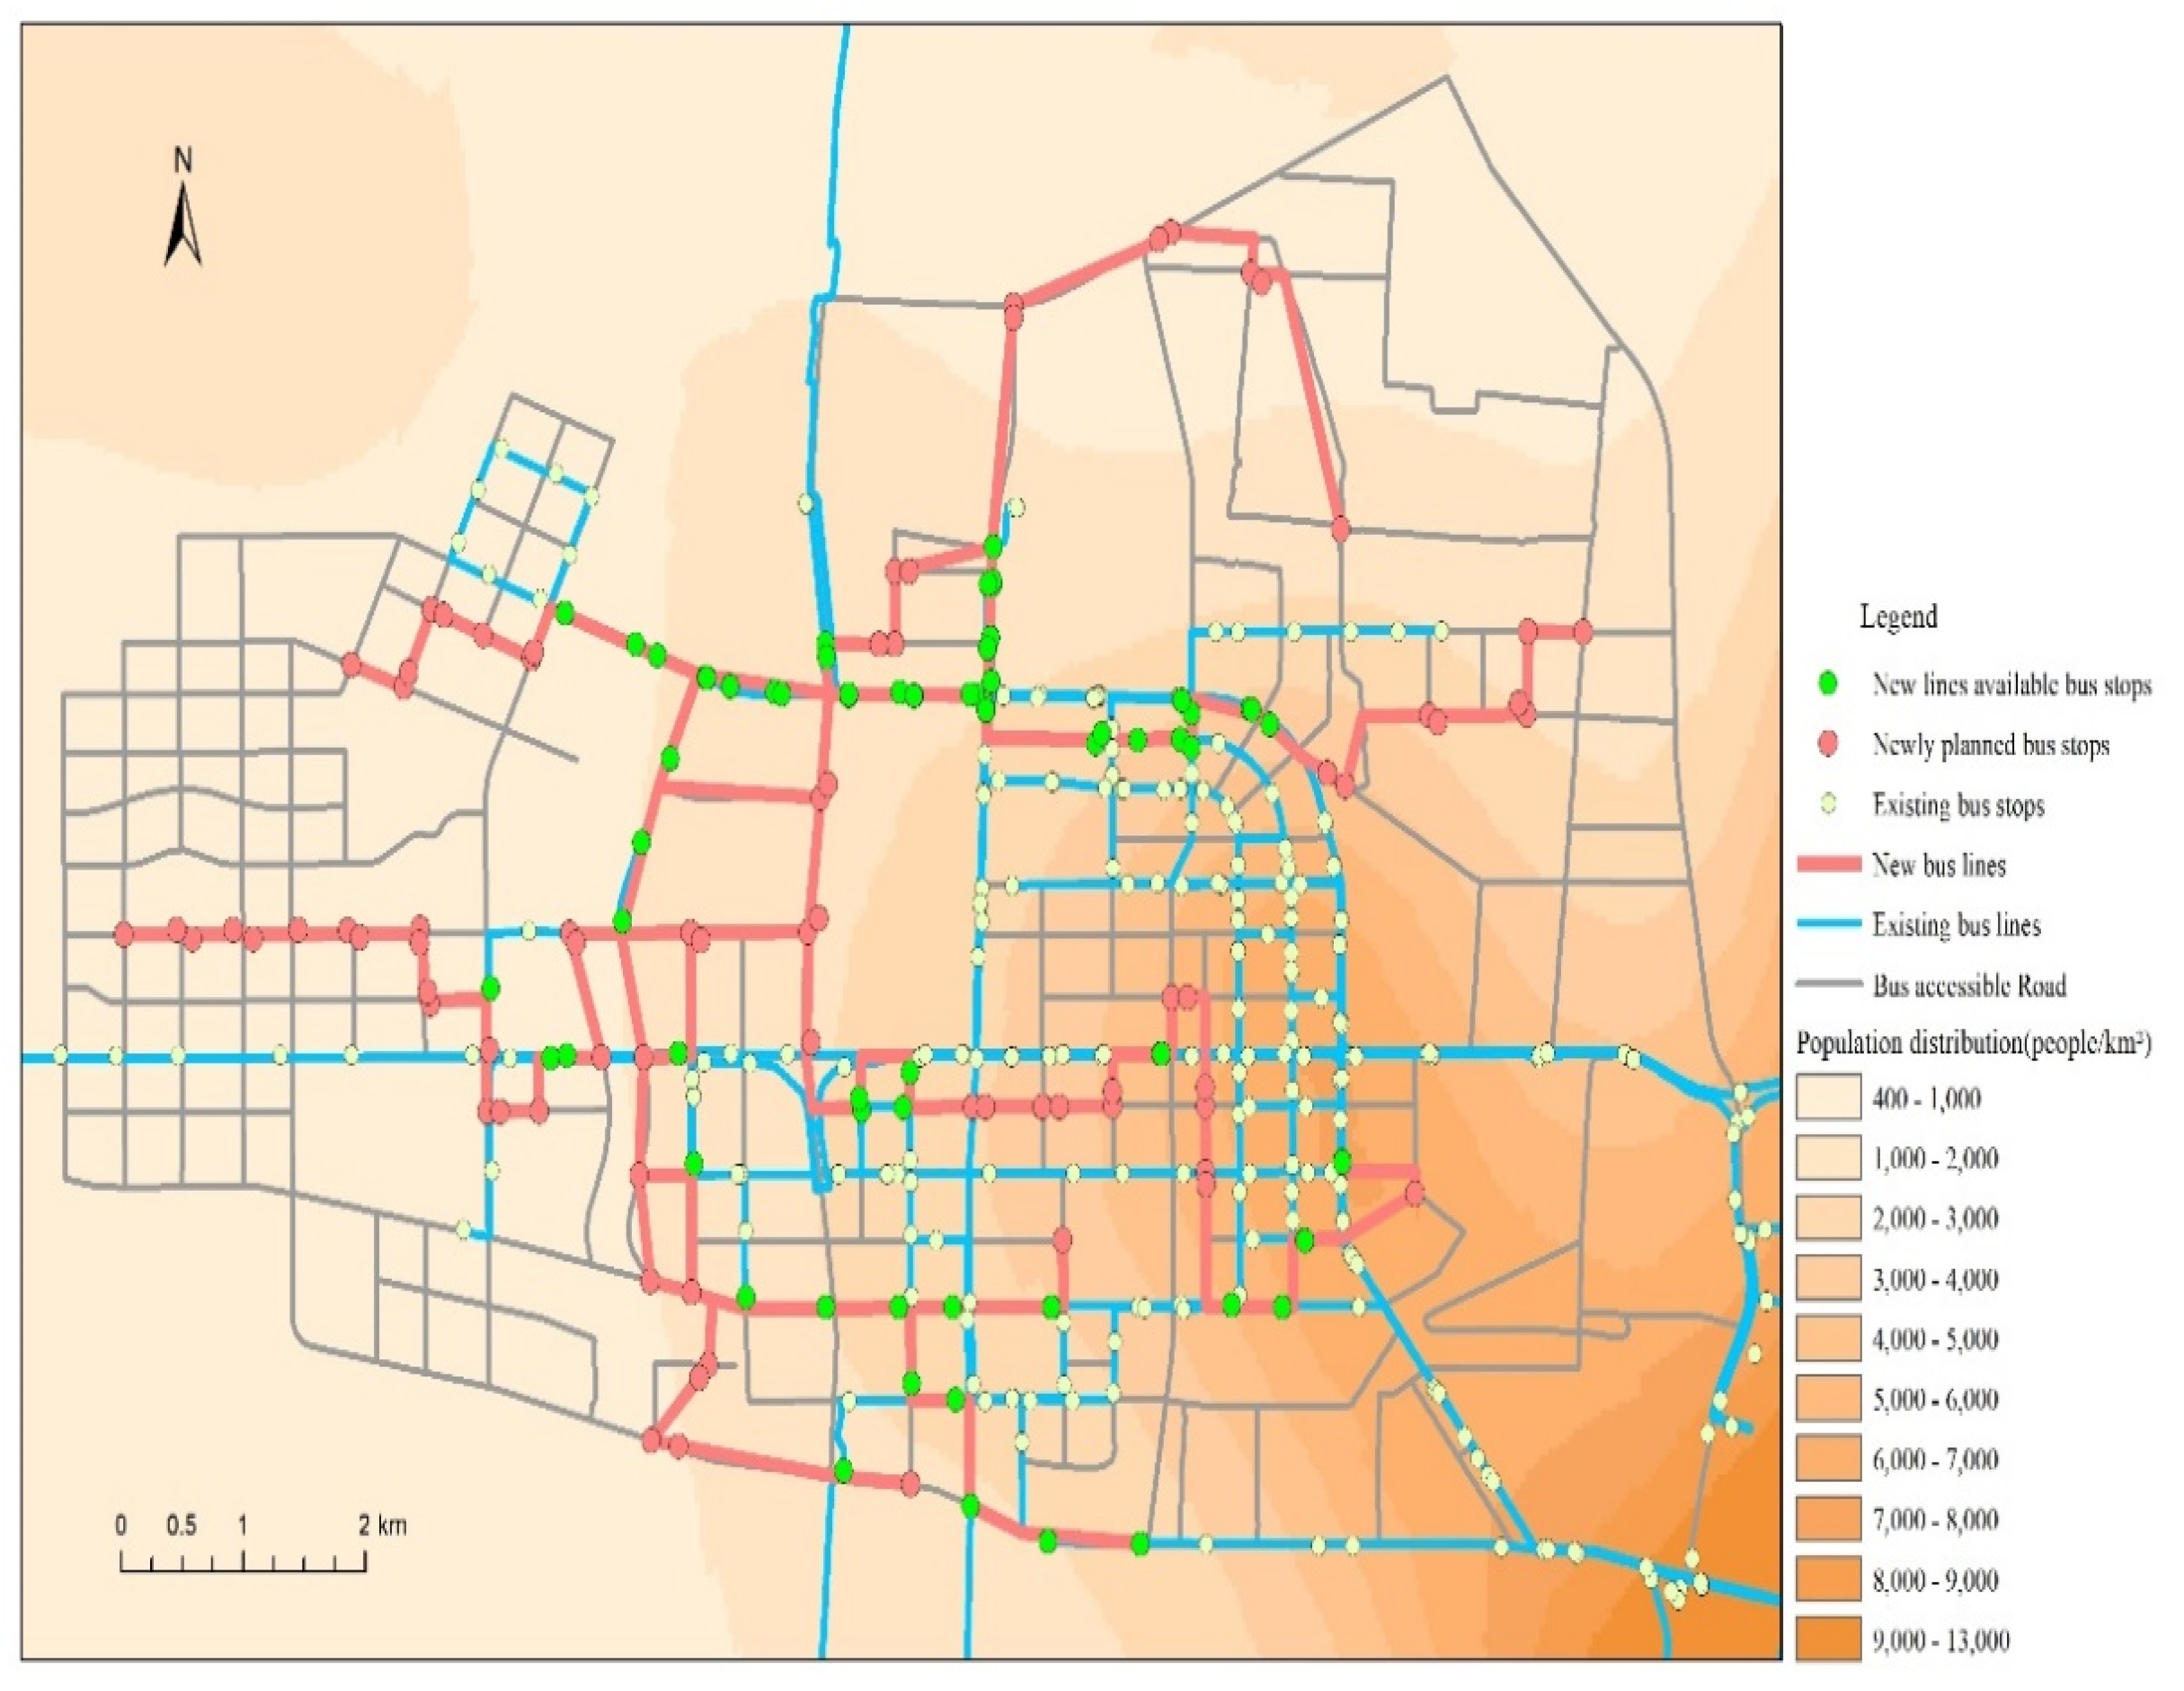
4.2. Spatial Distribution of Line Network After Planning
4.3. Comparison
5. Discussion and Conclusions
5.1. Discussion
5.2. Conclusions
Author Contributions
Funding
Data Availability Statement
Conflicts of Interest
References
- Mulley, C.; Ho, C. Evaluating the impact of bus network planning changes in Sydney, Australia. Transp. Policy 2013, 30, 13–25. [Google Scholar] [CrossRef]
- Xu, G.; Shi, F.; Luo, X.; Qin, J. Method of public transit network planning based on strategy equilibrium transit assignment. J. Transp. Syst. Eng. Inf. Technol. 2015, 15, 140–145. [Google Scholar]
- Arbex, R.O.; Cunha, C. Efficient transit network design and frequencies setting multi-objective optimization by alternating objective genetic algorithm. Transport. Res. B-Meth. 2015, 81, 355–376. [Google Scholar] [CrossRef]
- Huang, D.; Gu, Y.; Wang, S.; Liu, Z.; Zhang, W. A two-phase optimization model for the demand-responsive customized bus network design. Transp. Res. Part C Emerg. Technol. 2020, 111, 1–21. [Google Scholar] [CrossRef]
- Torkinejad, M.; Mahdavi, I.; Mahdaviamiri, N.; Esfahani, M.S. A mathematical model for designing optimal urban gas networks, an ant colony algorithm and a case study. Int. J. Prod. Res. 2017, 28, 441–460. [Google Scholar]
- Ghatee, M.; Hashemi, S.M. Generalized minimal cost flow problem in fuzzy nature: An application in bus network planning problem. Appl. Math. Model 2008, 32, 2490–2508. [Google Scholar] [CrossRef]
- Schöbel, A. Line planning in public transportation: Models and methods. OR Spectr. 2012, 34, 491–510. [Google Scholar] [CrossRef] [Green Version]
- Dorigo, M. Optimization, Learning and Natural Algorithms; Politecnico di Milano, Dipartimento di Elettronica: Milano, Italy, 1992. [Google Scholar]
- Dorigo, M.; Maniezzo; Colorni, A. Ant system: Optimization by a colony of cooperating agents. IEEE Trans. Syst. Man Cybern. Part B Cybern. 1996, 26, 29–41. [Google Scholar] [CrossRef] [PubMed] [Green Version]
- Dorigo, M.; Stützle, T. Ant Colony Optimization; MIT Press: Cambridge, MA, USA, 2004. [Google Scholar]
- Blum, C.; Dorigo, M. The hyper-cube framework for ant colony optimization. IEEE Trans. Syst. 2004, 34, 1161–1172. [Google Scholar] [CrossRef] [PubMed]
- Soares, J.; Sousa, T.; Vale, Z.A.; Morais, H.; Faria, P. Ant colony search algorithm for the optimal power flow problem. In Proceedings of the 2011 IEEE Power and Energy Society General Meeting, Detroit, MI, USA, 24–28 July 2011; pp. 1–8. [Google Scholar]
- Masoumi, Z.; Genderen, J.V.; Niaraki, A.S. An improved ant colony optimization based algorithm for user-centric multi-objective path planning for ubiquitous environments. Geocarto Int. 2019, 36, 137–154. [Google Scholar] [CrossRef]
- Poorzahedy, H.; Safari, F. An ant system application to the bus network design problem: An algorithm and a case study. Public Transp. 2011, 3, 165–187. [Google Scholar] [CrossRef]
- Martynova, Y.A.; Martynov, Y.A.; Mustafina, D.B.; Asmolovskiy, V. Ant colony algorithm for rational transit network design of urban passenger transport. In Proceedings of the 2014 International Conference on Mechanical Engineering, Automation and Control Systems (MEACS), Tomsk, Russia, 16–18 October 2014. [Google Scholar]
- Hu, W.; Wang, C.; Zuo, X. An ant colony optimization based approach to adjust public transportation network. In Proceedings of the 2019 IEEE Congress on Evolutionary Computation (CEC), Wellington, New Zealand, 10–13 June 2019. [Google Scholar]
- Giovanni, C.; Giuseppe, I.; Michela, L.P.; Pluchino, A.; Ignaccolo, M. Bridging the gap between weak-demand areas and public transport using an ant-colony simulation-based optimization. Transp. Res. Proc. 2020, 45, 234–241. [Google Scholar]
- Zuo, Y.; Fu, X.; Liu, Z.; Huang, D. Short-term forecasts on individual accessibility in bus system based on neural network model. J. Transp. Geogr. 2021, 93, 1–9. [Google Scholar] [CrossRef]
- Cordón, O.; Herrera, F.; Stützle, T. A review on the ant colony optimization metaheuristic: Basis, models and new trends. North Am. J. Sports Phys. Ther. Najspt 2002, 1, 62–72. [Google Scholar]
- Dorigo, M. The ant system: An autocatalytic optimizing process. In Proceedings of the First European Conference on Artificial Life, Paris, France, 11–13 December 1991. [Google Scholar]
- Stützle, T.; Hoos, H.H. MAX-MIN ant system. Future Gener. Comput. Syst. 2000, 16, 889–914. [Google Scholar] [CrossRef]
- Blum, C. Ant colony optimization: Introduction and recent trends. Phys. Life Rev. 2005, 2, 353–373. [Google Scholar] [CrossRef] [Green Version]
- Gambardella, L.M.; Dorigo, M. An ant colony system hybridized with a new local search for the sequential ordering problem. Informs J. Comput. 2000, 12, 237–255. [Google Scholar] [CrossRef] [Green Version]
- Wu, K. Study on route optimization of bus network path based on improved ant colony algorithm. Microcomput. Appl. 2021, 37, 134–136. [Google Scholar]
- Dorigo, M.; Birattari, M.; Blum, C.; Clerc, M.; Stützle, T.; Winfield, A.F.T. Ant Colony Optimization and Swarm Intelligence: 6th International Conference, ANTS 2008, Lecture Notes in Computer Science; Springer: Berlin/Heidelberg, Germany, 2008; p. 5217. [Google Scholar]
- Jang, E.; Gu, S.; Poole, B. Categorical reparameterization with gumbel-softmax. arXiv 2016. [Google Scholar]
- Ministry of Housing and Urban-Rural Development of the People’s Republic of China. Standard for Urban Comprehensive Transport System Planning, GB/T51328-2018; State Council the People’s Republic of China: Beijing, China, 2018. [Google Scholar]
- Dorigo, M.; Stützle, T. Ant Colony Optimization: Overview and Recent Advances; Springer US: New York, NY, USA, 2010. [Google Scholar]
- Bondarenko, M.; Kerr, D.; Sorichetta, A.; Tatem, A.J. Census/Projection-Disaggregated Gridded Population Datasets for 189 Countries in 2020 Using Built-Settlement Growth Model (BSGM) Outputs; WorldPop, University of Southampton: Southampton, UK, 2020. [Google Scholar] [CrossRef]


| Evaluation Items | Before Optimization | After Optimization | Changes |
|---|---|---|---|
| Number of bus lines | 20 | 25 | 25%↑ |
| Total length of bus lines (km) | 153.7 | 222.3 | 44.63%↑ |
| Length of roads which bus passes (km) | 77.0 | 115.8 | 50.39%↑ |
| Proportion of bus lines to road network (%) | 11.9 | 17.9 | 5%↑ |
| Proportion of overlapping lengths (%) | 1.996 | 1.920 | 3.81%↓ |
| Number of direct passenger traffic | 589 | 713 | 21.05%↑ |
| Number of bus stops | 376 | 450 | 19.68%↑ |
| 5 min service area (km²) | 30.10 | 36.48 | 21.20%↑ |
Publisher’s Note: MDPI stays neutral with regard to jurisdictional claims in published maps and institutional affiliations. |
© 2022 by the authors. Licensee MDPI, Basel, Switzerland. This article is an open access article distributed under the terms and conditions of the Creative Commons Attribution (CC BY) license (https://creativecommons.org/licenses/by/4.0/).
Share and Cite
Wei, Y.; Jiang, N.; Li, Z.; Zheng, D.; Chen, M.; Zhang, M. An Improved Ant Colony Algorithm for Urban Bus Network Optimization Based on Existing Bus Routes. ISPRS Int. J. Geo-Inf. 2022, 11, 317. https://0-doi-org.brum.beds.ac.uk/10.3390/ijgi11050317
Wei Y, Jiang N, Li Z, Zheng D, Chen M, Zhang M. An Improved Ant Colony Algorithm for Urban Bus Network Optimization Based on Existing Bus Routes. ISPRS International Journal of Geo-Information. 2022; 11(5):317. https://0-doi-org.brum.beds.ac.uk/10.3390/ijgi11050317
Chicago/Turabian StyleWei, Yuanyuan, Nan Jiang, Ziwei Li, Dongdong Zheng, Minjie Chen, and Miaomiao Zhang. 2022. "An Improved Ant Colony Algorithm for Urban Bus Network Optimization Based on Existing Bus Routes" ISPRS International Journal of Geo-Information 11, no. 5: 317. https://0-doi-org.brum.beds.ac.uk/10.3390/ijgi11050317