Article

Research on Three-Dimensional Electronic Navigation Chart Hybrid Spatial Index Structure Based on Quadtree and R-Tree

1
School of Marine Science and Technology, Tianjin University, Tianjin 300072, China
2
School of Precision Instrument and Opto-Electronics Engineering, Tianjin University, Tianjin 300072, China
*
Author to whom correspondence should be addressed.
ISPRS Int. J. Geo-Inf. 2022, 11(5), 319; https://0-doi-org.brum.beds.ac.uk/10.3390/ijgi11050319
Submission received: 20 March 2022 / Revised: 11 May 2022 / Accepted: 19 May 2022 / Published: 23 May 2022

Abstract

:
The three-dimensional (3D) visualization of the electronic navigation chart (ENC) can reflect the marine environment and various marine features truly, accurately, and directly, to reduce misoperation during chart use and improve the convenience of using the chart. Due to a large amount of ENC data, complex data structure, and uneven distribution in 3D space, the construction and real-time rendering of 3D ENCs depend on the retrieval speed of 3D spatial data. Improving the spatial retrieval efficiency of 3D ENC data is helpful for the rapid rendering of a 3D scene. In this paper, based on the S-100 universal hydrological data model (S-100) and the 3D characteristics to classify the ENC features and create the 3D ENC data set, a hybrid spatial index structure is proposed based on quadtree and R-tree and ENC features data structure, using the smallest minimum bounding box (SMBB) and classification retrieval methods to optimize the spatial index structure. All the ENC features are rendered in a 3D marine scene. By analyzing the overlap of ENC features and testing the efficiency of spatial index structure, the results show that this method can effectively reduce the overlap rate of index nodes and improve the efficiency of data retrieval, realize the effective management of 3D ENC data, and improve the drawing speed of 3D ENCs.

1. Introduction

As a piece of essential information in navigation, ENCs provide a necessary guarantee for the safety of ships. In recent years, many stranding accidents around the world are related to ENCs [1], especially depth accuracy [2,3]. According to a survey of ship collisions by the European Maritime Safety Agency [4], from a total of 1801 accident event analyses between 2014 and 2019, 54% were attributed to the “human action” category and 28% to “system/equipment failures”. Of these, 13% were due to grounding, as shown in Figure 1. Therefore, reducing the misoperation of ENCs is helpful to restrain the occurrence of ship collision accidents. In essence, ENCs are abstractions and generalizations of the real world, including water depth, topography, ports, buildings, etc. In the process of using a two-dimensional electronic navigation chart (2D ENC), users need to translate abstract symbols, positions, and directions into the imaginary 3D world to understand, which brings some difficulties for users to understand [5]. The 3D ENC is more intuitive and a specific expression of abstract symbols. It can not only truly reflect the marine phenomena in the real world, but also show the nautical features generated in maritime activities, which is easy for users to understand and reduce the misoperation of ENCs [6,7]. In the past, due to the limitation of computing and storage capacity, the electronic navigation chart display system (ECDIS) can only display 2D data in a plane, and the amount of data displayed is limited. It is difficult to effectively manage the data of a large range and complex structure. With the development of 3D visualization technology, multi-source and 3D ocean data can be displayed in ECDIS [8] and can be combined with Geographic Information System (GIS) [9], web, and other technologies [10]. Therefore, 3D ENCs should be a comprehensive display system integrating traditional ENCs with marine hydrology, meteorological environment, and other multi-source data.
The research on 3D ENCs depends on the development of 3D visualization technology, and it also meets the requirements of authenticity, accuracy, and interactivity in 3D visualization technology research. Authenticity is the requirement that ENCs can truly reflect all kinds of information about the marine environment in the real world. The traditional ENC abstracts all kinds of marine environmental information into 2D vector symbols and displays them using computer graphics. Although it can correctly represent ocean phenomena, it is not the ocean environment in the real world, which also causes difficulties for users in the process of learning and using. The authenticity of the marine geographic information system can be enhanced by improving the cartographic symbols of 3D ENCs [11]. Accuracy requires that the precision of data displayed on ENCs can meet the requirements of navigation. Due to the huge amount of data in ENCs, especially the water depth data, it usually needs to go through the water depth compression algorithm before being applied to compilation and production, but it still causes the problem of data accuracy reduction. The accuracy of 3D ENCs can be enhanced by improving the data management method [12]. Interactivity is the requirement of ENCs to have fast data query and convenient interactions, such as setting the safety depth contour, displaying the depth of the water, planning routes, etc., and be able to stack other data products and services, although the traditional two-dimensional ENC based on the layer of retrieval can achieve partial data query function, but for features of the interactions. The research and application of S-100 can solve the problems of interoperation among features [13,14]. The 3D visualization technology can solve the problems of authenticity, accuracy, and interactivity of 2D ENCs, and one of the difficulties in realizing 3D visualization of ENCs is to create an appropriate spatial data index structure according to the data structure and spatial distribution of ENC features and improve the efficiency of spatial data management.
Spatial indexing methods can be divided into two categories, single and hybrid. Common single-index structures include binary space partitioning (BSP), K-dimensional tree, bounding volume hierarchies (BVHs), quadtree, octree, and R-tree etc. BSP and K-dimensional tree are more suitable for narrow space scenes, the BVHs enclosing sphere is often used for visual vertebral body pruning, a quadtree is suitable for describing geometric data, and an octree is a natural extension of the quadtree used to describe three-dimensional spatial data. They are suitable for large-scale outdoor scenarios. However, octree cannot dynamically adjust the tree structure according to the actual object layout, resulting in poor query performance [15,16,17]. Dynamic adjustment can be achieved with lidar point cloud management software, but it has sparsity. Jamel et al. used a variant of the quadtree structure to solve the indexing problem of dynamic attributes [18]. Ma et al. proposed a visualization model HiVision based on R-tree, which can be used to display and drive large-scale spatial vector data [19]. Zhang et al. proposed a cued quadtree structure to process water location data [20].
At present, no single index structure is considered universally applicable to any data, because different data have different data structures and spatial characteristics. It is more necessary to combine different index structures through the analysis of the characteristics of actual data to create a mixed index structure. Gong et al. proposed a laser point cloud data management method integrating octree and 3D R-tree in 2012, but only solved the management problem of large-scale 3D laser point cloud data [21]. The LOD-OR-tree spatial index structure proposed by Zheng et al. in 3D GIS uses an octree index to limit the space represented by R-tree and reduce the overhead created by R-tree insertion and deletion operations [22]. Wang et al. proposed a GTM-oriented hybrid spatial index structure, 3DOR*-tree, which makes full use of the advantages of fast spatial partition of octree and efficient spatial query of 3D R*-tree, but only supports a single type of data structure [23].
The 3D ENC data has its unique characteristics, including various types of ocean data, including a large range of spatial vector data and high-density grid data. When choosing spatial index structures, the data structure and spatial characteristics of various marine data must be considered comprehensively. Therefore, aiming at the problems of complex data structure and low spatial retrieval efficiency of 3D ENCs, this paper analyzes the 3D characteristics of ENC features, creates a 3D ENC data set and spatial index structure of ENC features based on quadtree and R-tree, designs the data structure of index nodes and ENC features, and optimizes the spatial index structure and minimum bounding box (MBB). The purpose is to effectively reduce the query time of ENC features and improve the efficiency of 3D model drawing of ENC features for real-time processing of ENC data.
The organizational structure of this article is shown in Figure 2. Section 2 introduces the process of creating a 3D ENC data set. Section 3 introduces the design and optimization of the spatial index structure. Section 4 tests the efficiency of spatial index structure and provides the visualization effect of 3D ENCs. Finally, conclusions and prospects are provided in Section 5.

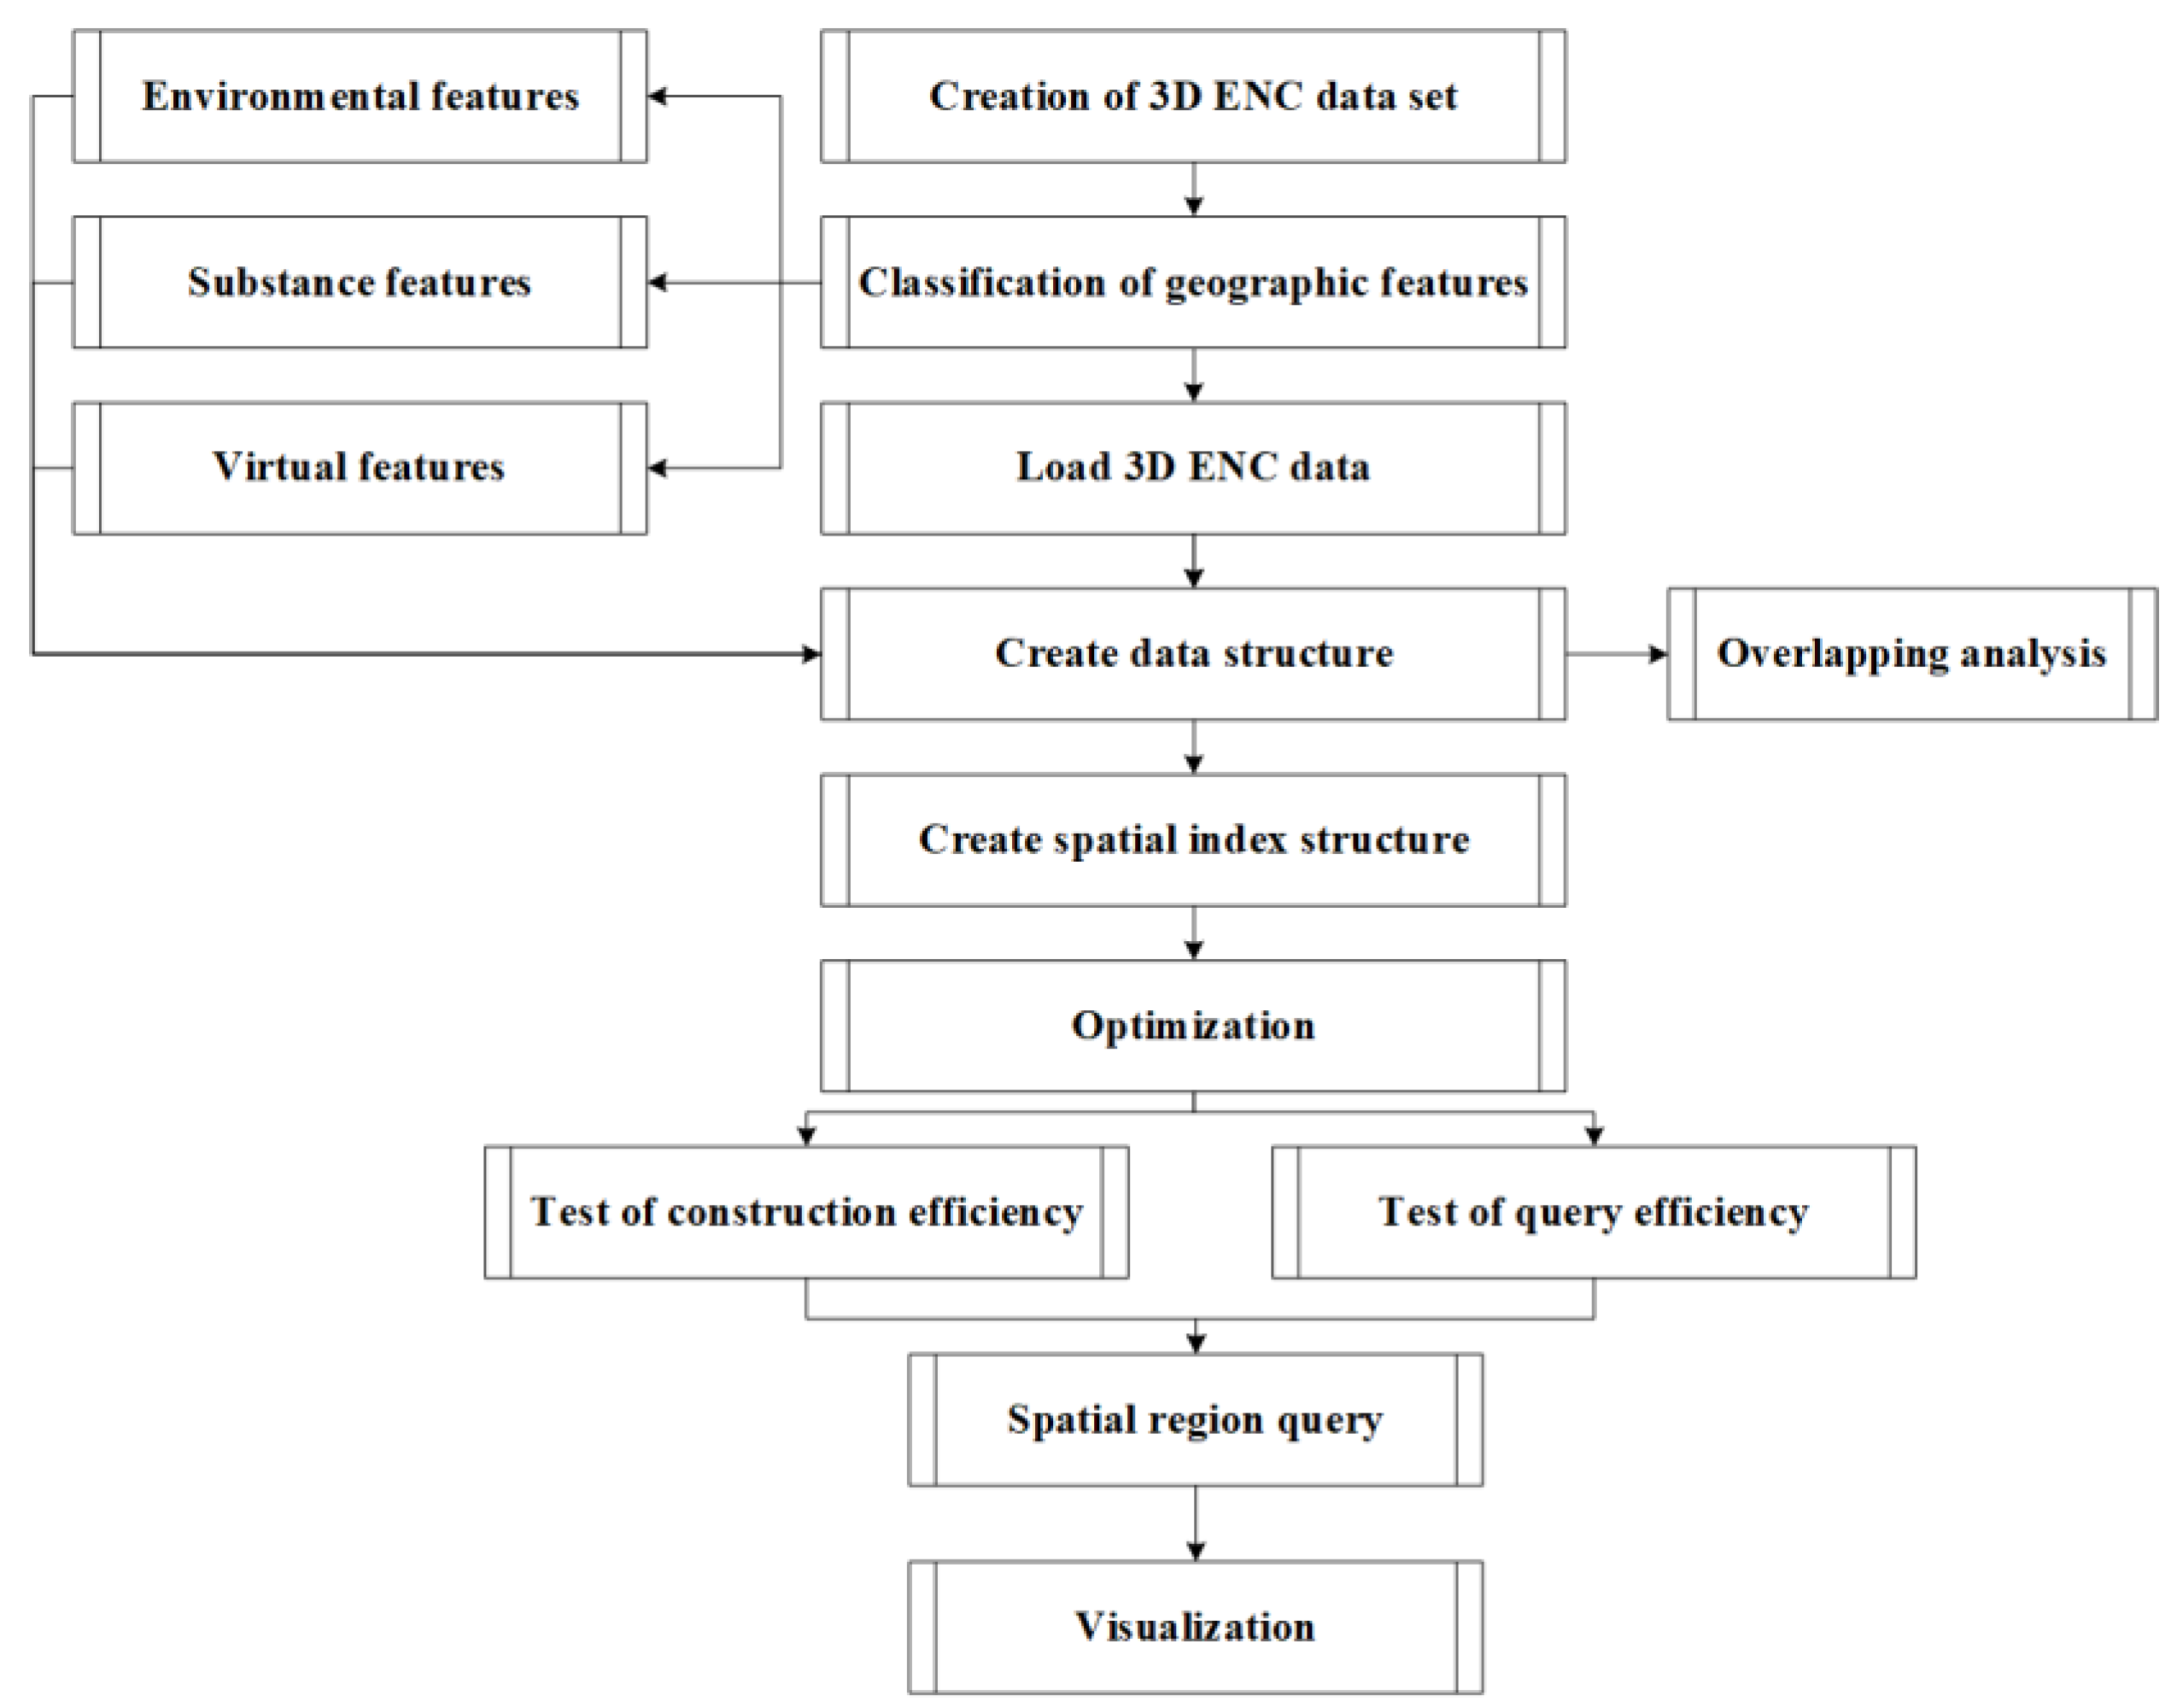
2. Creation of the 3D ENC Data Set

2.1. Classification of Geographic Features Based on S-101

Since the release of the S-100 by International Hydrographic Organization (IHO) in January 2010 [24], researchers have regarded it as the development direction of maritime informatization in the future. It is committed to applying S-100 to the processing of the information generated by various marine activities, to ensure the safety of ships. Based on the S-100, the international maritime sector participated in the development of a range of products and services. IHO has developed S-10X series of products and services to standardize the production and coding of ENCs and guide the development direction of ENCs in the future. After that, a Worldwide Electronic Navigational Charts Database (WEND) was developed to avoid the problem of enlarging and overlapping charts caused by the difference in mapping capacity of different countries [25].
S-101 provides the classification and coding of all kinds of marine information required for navigation purposes [26]. Based on S-57, some features are updated to adapt to the rapid development of navigation technology, including 172 geographic features, 9 metadata features, 1 cartographic feature, and 5 information types. IHO classification and update of ENC features are more accurate at describing ocean phenomena, both metadata features and geographic features are the abstraction of the real world. By abstracting the attributes, features, and topological relations of the features, they are finally displayed in the ECDIS.
S-101 classifies geographic features in ENCs in a more detailed way, dividing them into 18 broad categories and 172 subcategories. All geographic features are navigation-related features. To facilitate the 3D visualization of geographic features and the creation of data index structure, this paper divides them into environmental features, substance features, and virtual features according to their 3D characteristics, and gives the specific division of all geographic features, as shown in Table 1. In the table, features represented by italic font are environmental features, features represented by bold font are substance features, and features represented by underlined font are virtual features.
Environmental features describe the real marine environment, such as sounding, tidal stream, current, seabed area, etc. Such features are physical phenomena that exist in reality and are related to the ocean surface, seabed, and shoreline. Substance features are actual navigational systems, such as port facilities, buoy lateral, light, etc. Such features are used for ship navigation and sailing safely and are realistic 3D substances. Virtual features are artificial features, such as navigation lines, virtual Automatic Identification System (AIS) aid for navigation, anchorage area, etc., which do not exist in reality but are essential features for safe navigation.
The division of features is the process of realizing a computer’s perception of the real world. Each kind of feature is a description of human and geographic information. In this paper, ENC features are divided into these three categories mainly for two reasons. The first is that the division is based on real ocean scenes, which is conducive to 3D visualization of the marine environment; the second is to improve the query efficiency of the spatial index of 3D ENC features, which will be elaborated in Section 4 of Chapter 3.

2.2. The 3D ENC Data Sets of Geographic Features

At present, the application of the S-100 standard is still in the research and experiment phase, and a stable ENC data set suitable for 3D visualization has not been formed. Therefore, according to the actual characteristics and attributes of the features in the ENC, the 3D ENC data set was constructed based on the 2D data, as shown in Figure 3. Green means that the feature belongs to an environmental feature, yellow means that the feature belongs to a substance feature, and magenta means that the feature belongs to a virtual feature.

2.2.1. Environmental Features

The environmental features shown in the chart are a narrow sense of the marine environment, mainly the geographical environment of the ocean, including the surface, the seabed, and the land. For example, for seabed topography, 2D data can be converted into 3D data with elevation by extracting depth values of water depth points in the chart and values related to depth attributes, such as coastline, and isobath as elevation data. Similarly, for land features such as ports, dams, bridges, etc., elevation data can be established by using attribute values if there are shape attributes; if not, elevation data can be simulated according to actual proportions.

2.2.2. Substance Features

Substance features are mainly objects that exist objectively and exist in land, sea, underwater, and seabed in the real world. The objects on land are mainly buildings, docks and lighthouses, etc., and the objects on the sea are mainly buoys, lighthouses and lights, etc. Such features extract height values according to their attributes. For underwater objects and submarine objects, mainly underwater obstacles, shipwrecks, rocks, submarine pipelines, cables, etc., they are converted into 3D elevation data according to the depth attributes of the features.

2.2.3. Virtual Features

Virtual features are mainly artificial features, which are represented by point, curve, and surface features in 2D ENCs. The point features mainly include virtual AIS Aid to navigational and distance markers. Curve features mainly include all kinds of navigation lines, radar lines, etc. Such features represent a region. For example, different types of waterway areas are represented according to different maritime navigation rules and water depths. The waterway lines on both sides form a whole region, while in the 3D scene, they represent a spatial region. Surface features mainly include anchorage, berth, warning area, fishery area, etc. Such features also represent a spatial area in a 3D environment, which is closely related to the water depth of the location. According to the display effect, the virtual features virtualize a fixed height value as the 3D elevation data value of the features.

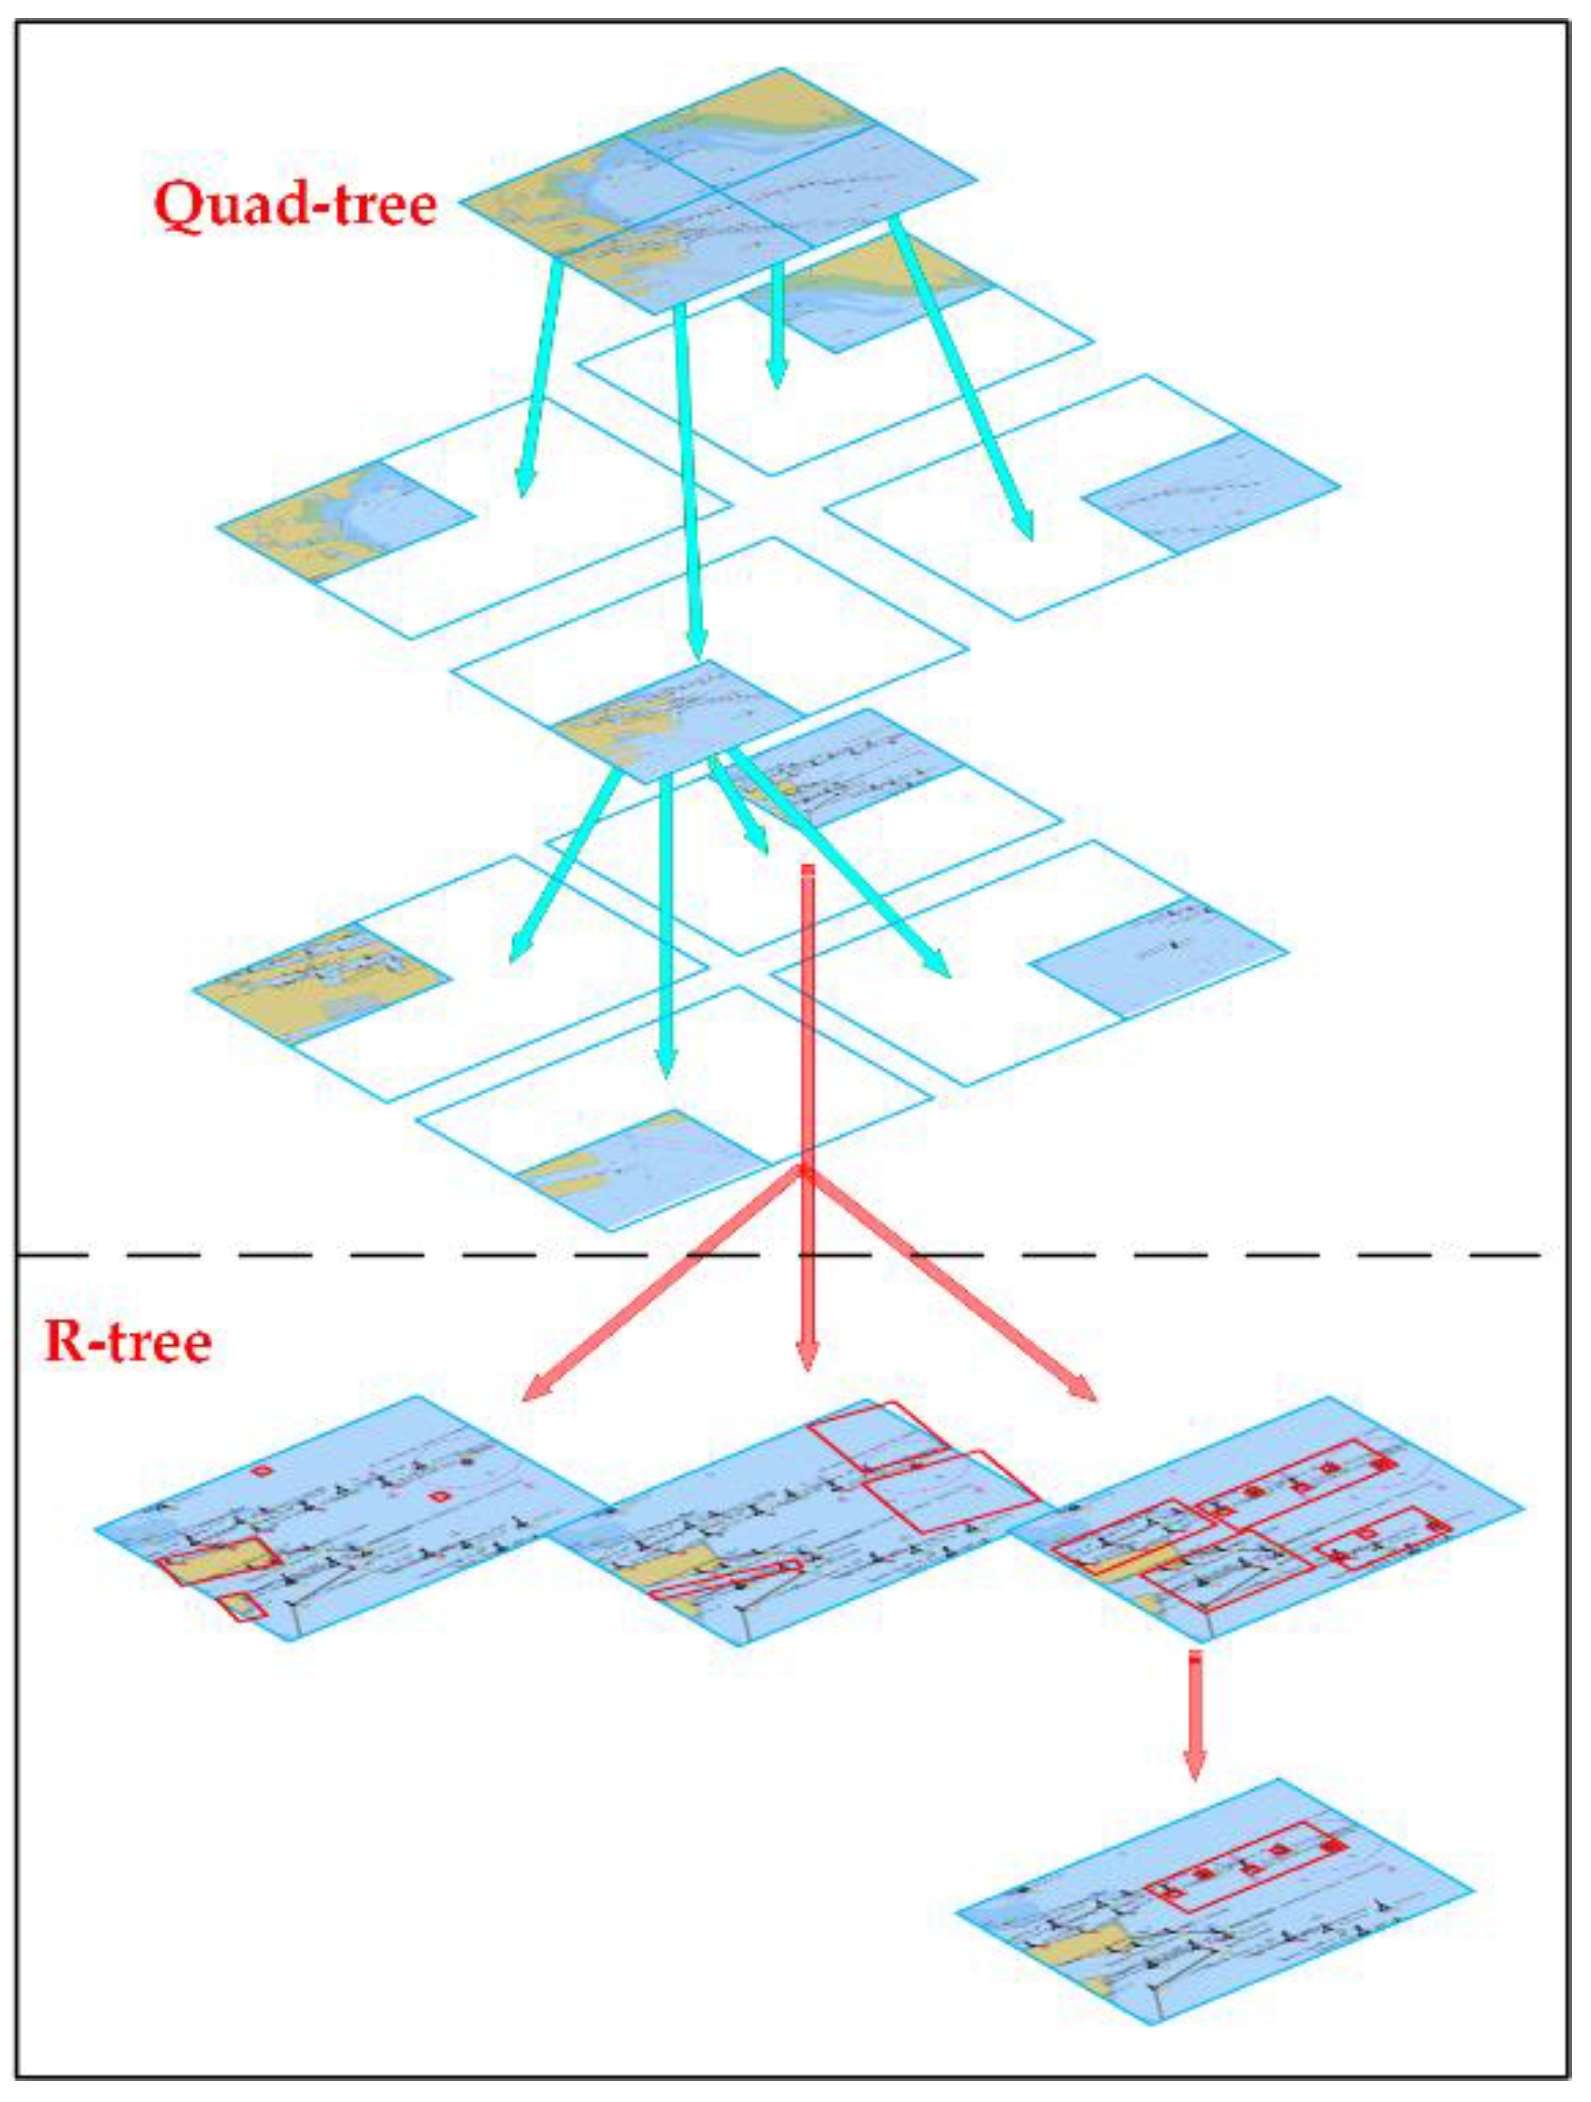
3. Spatial Index Structure

To realize real-time rendering of 3D ENCs and improve scene rendering efficiency, this paper designs an efficient hybrid spatial index structure based on the 3D ENC data set. The real marine environment is a complex 3D environment field with multiple features of sea, land, and air. Various features data in ENCs are formed through ocean mapping. Among these features, only sounding is a pointset feature, which is suitable for preservation in the form of a regular grid, while other features are relatively sparse in local ocean scenes, and if a regular grid is also used for preservation, a lot of storage waste will be caused. Therefore, grid indexes are not applicable. The ENC data is large-scale 3D spatial data. BSP and K-D trees are based on the spatial segmentation of binary trees, which are more suitable for the scene with narrow space, while quadtree, octree, and R-tree are more suitable for the spatial data of large ranges. The root node of the quadtree index structure divides the whole space into four subspaces, each subspace by the same kind of thinking is divided into four subspaces, in all dimensions simultaneously, it has the characteristics of a simple structure and high spatial segmentation efficiency, but the structure of the sparse data tree is unbalanced; insert and delete efficiency is not high. R-tree is a balanced tree with leaf nodes in the same layer, and leaf nodes contain pointers to actual data, which is suitable for spatial areas with irregular and sparse data distribution. The combination of the two structures can avoid the drawback of too deep index structure caused by using one index structure alone. In addition, although octree compared with quadtree is more often used in the retrieval of 3D spatial data, considering that the ENC features are different from the general 3D spatial features, most of the features are concentrated on the surface of the sea, and a few are distributed on land and the seafloor, using octree will increase the complexity of the algorithm, which is not conducive to improving the retrieval efficiency. Therefore, a 3D ENC features index structure combining quadtree and R-tree structure, called 3DENCQR-tree, was designed to realize real-time loading and drawing of feature models in 3D scenes.
The method mainly includes three steps. First, the data structure and index node structure of ENC features are designed based on the data structure of quadtree and R-tree. Second, according to the segmentation threshold value of the quadtree, the features are divided and the quadtree is created. According to the 3D characteristics of the ENC features, three R-trees are constructed in the leaf nodes of the quadtree to achieve the spatial division of the three types of features, and then 3DENCQR-tree is constructed. Third, based on 3DENCQR-tree to achieve ENC features data query, the query process mainly includes quadtree subquery, ENC features classification subquery, and R-tree subquery.

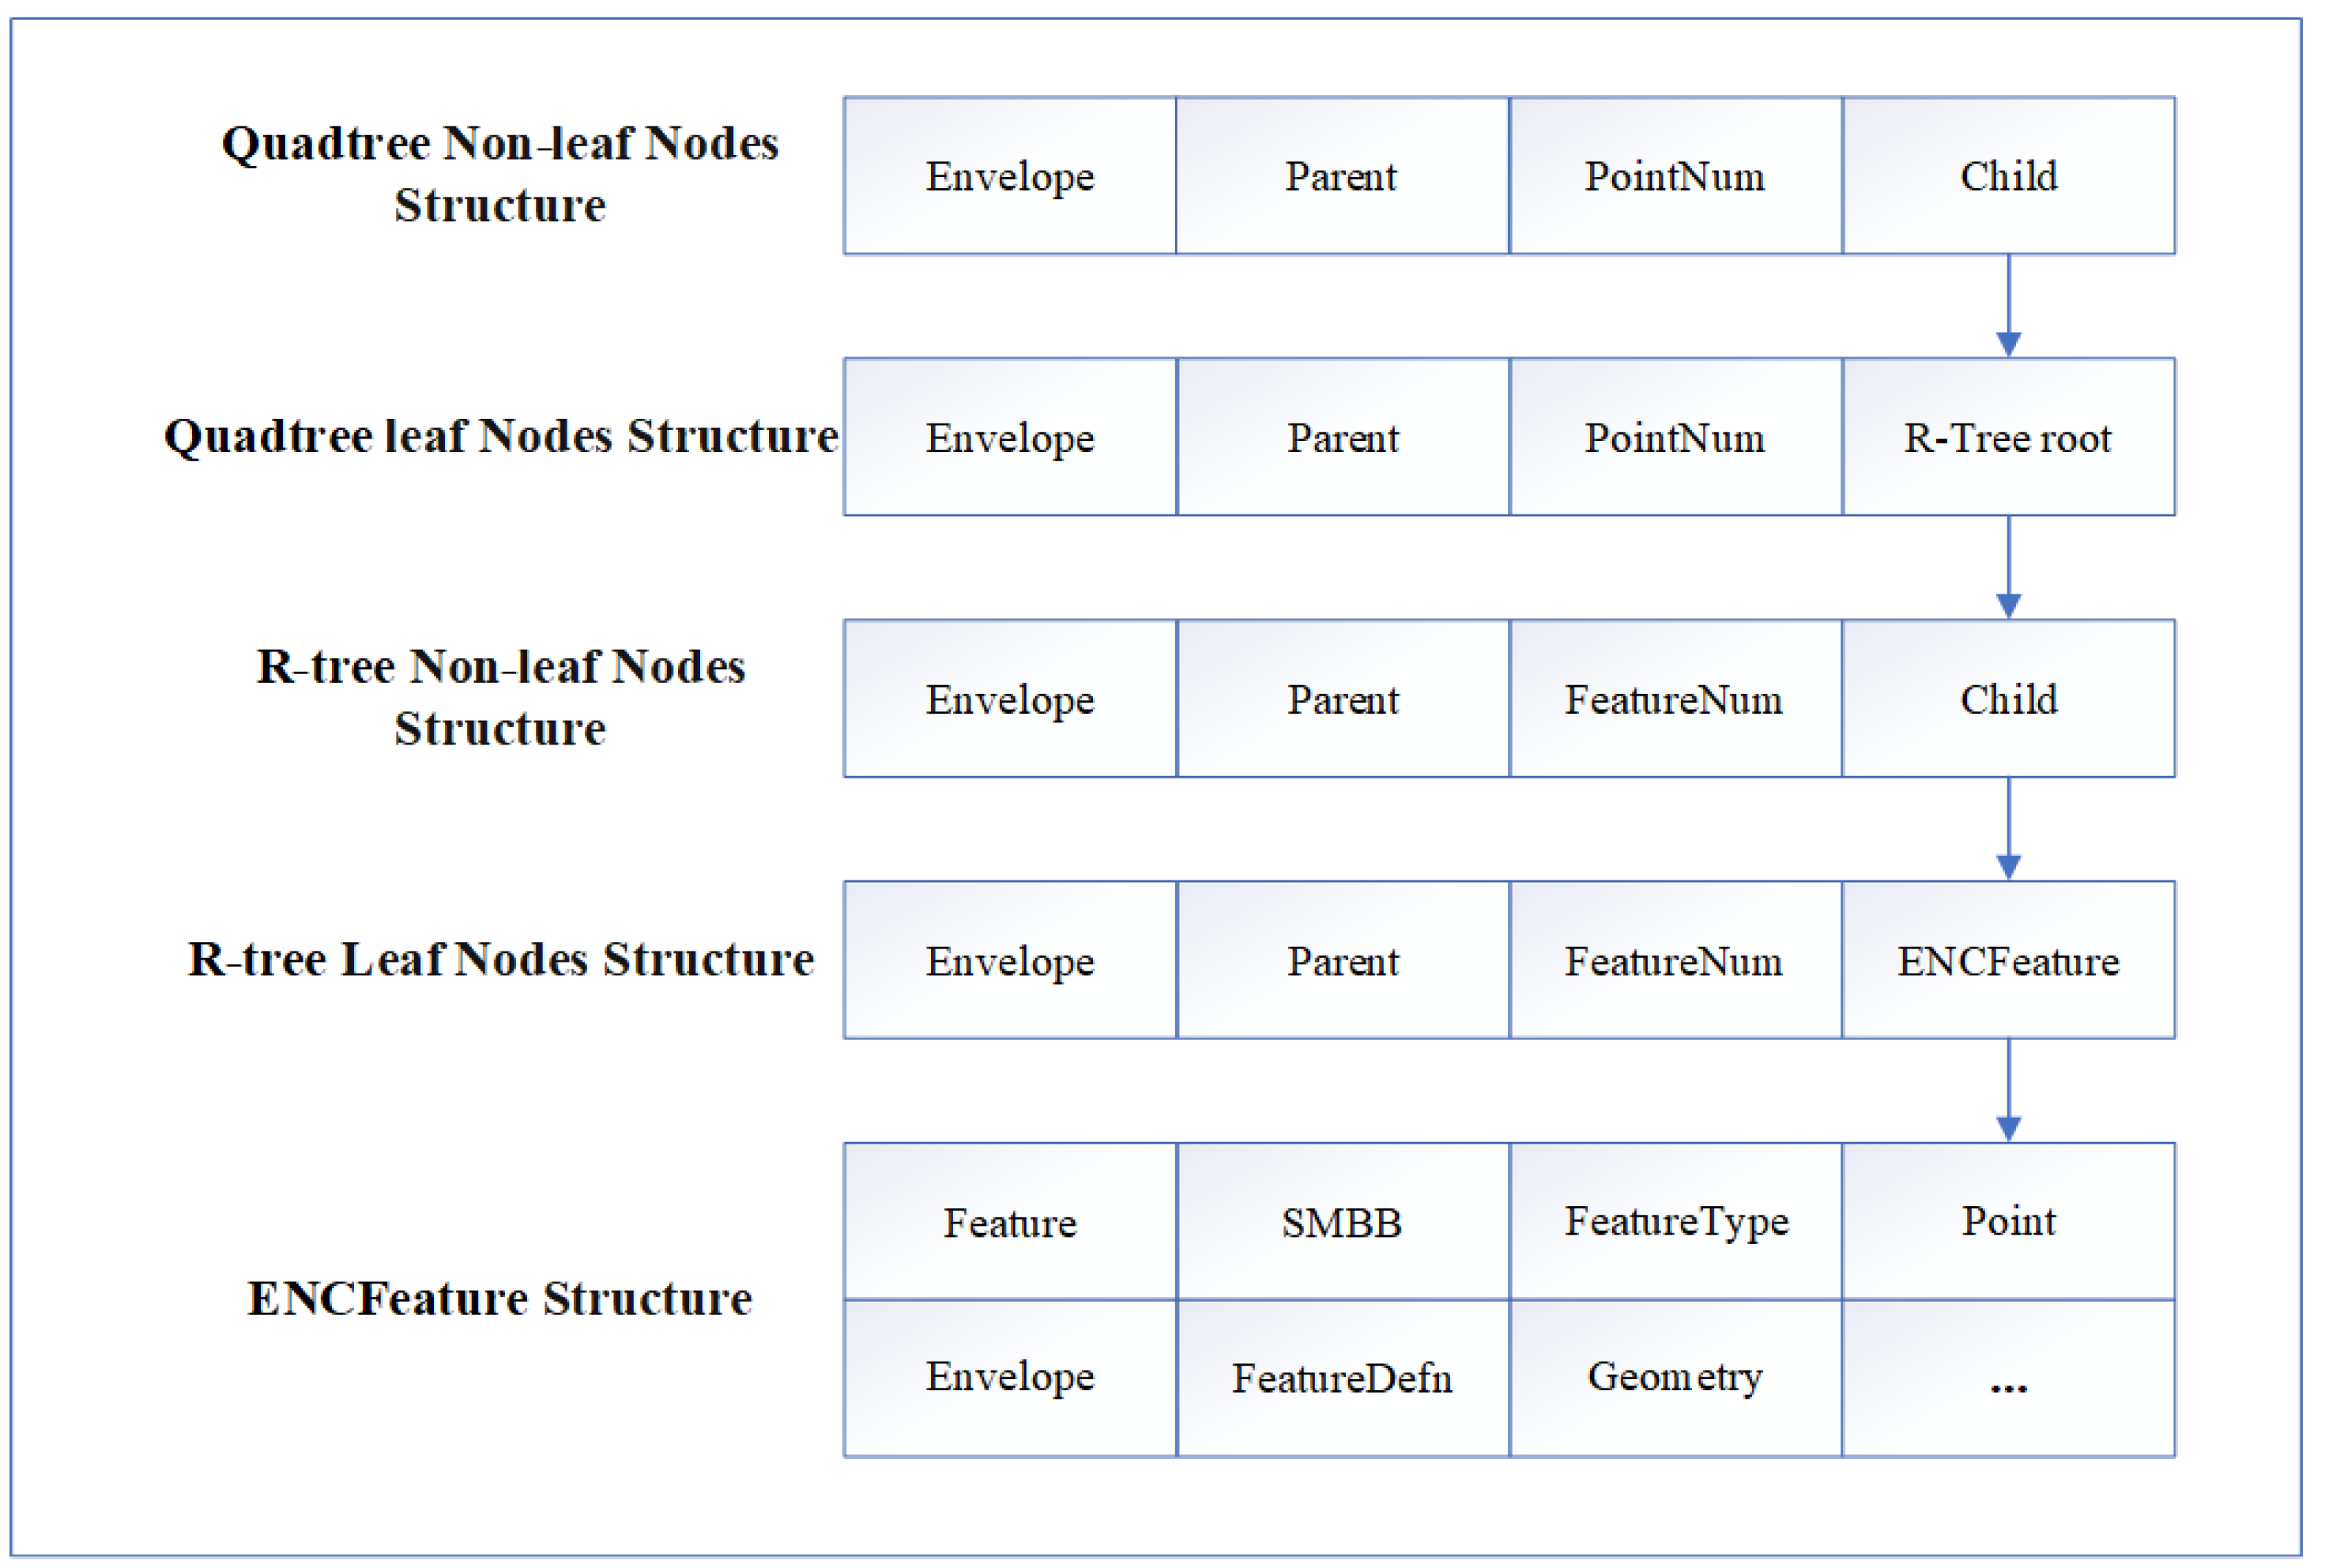
3.1. Data Structures of 3D ENC Features

A reasonable data structure can improve the efficiency of 3DENCQR-tree index structure construction and query, so this paper first designed the data structure of 3D ENC features. This data structure can be divided into five parts: quadtree non-leaf node structure, quadtree leaf node structure, R-tree non-leaf node structure, R-tree leaf node structure, and ENC features structure, as shown in Figure 4. The quadtree non-leaf nodes include an envelope of nodes, point numbers, pointers of parent nodes and child nodes. The quadtree leaf nodes include an envelope of nodes, point numbers, a pointer of the parent node, and root node of R-tree. R-tree non-leaf nodes include an envelope of nodes, feature numbers, pointers of the parent node and child node. R-tree leaf node includes an envelope of nodes, feature numbers, a pointer of the parent node and ENC features information. The structure of ENC features includes an envelope of features, smallest minimum bounding box (SMBB), feature types, feature information, feature geometry information, feature attribute information, and so on. The envelope is the minimum bounding box (MBB) of features, which means a rectangular bounding box containing geometric features that are aligned with the axes, while the SMBB is arbitrary.

3.2. Spatial Index Structures of 3D ENC Features

Unlike the common 3D landscape of land, the ENC features may be concentrated in some areas, while others may have only a small amount of data. In the land region near Tianjin Port, the features are mainly buildings and port facilities, and the data density in this region is relatively low. In the ocean region, there are fewer features in the open sea and non-waterway region, while there are more features near the port and waterway, and the data density in this region is relatively high. Because of the uneven distribution of ENC features, using a single index structure will have the problem of an index structure that is too deep, but using the index method combining quadtree and R-tree can achieve a more efficient data index. The spatial index structures of 3D ENC features are shown in Figure 5.
The steps of constructing the 3DENCQR-tree index structure are described as follows.
  • Read the information of all ENC features, calculate the envelope and SMBB of ENC features, and save the position information of all points in the features. Since ENC features usually have no height information in space, this paper sets a height value for the features point according to the attribute and draws the proportion of the features to form a 3D space feature.
  • Create a quadtree and insert ENC features E in sequence. If the points number of the node is less than the threshold QK, continue to insert. If the threshold QK is exceeded, the quadtree node is evenly divided into four sub-nodes, and the ENC features of the node are reallocated to the corresponding sub-nodes.
  • R-trees were constructed on the quadtree leaf nodes that completed spatial division. According to the types of ENC features, environmental features, substance features, and virtual features were inserted into the three R-trees, one by one.
  • In the process of inserting ENC features E into the R-tree node L, if the node L does not reach the threshold of leaf node features number RK, then features E is inserted. Otherwise, nodes are split to get two child nodes that contain all the features in features E and node L, and then adjust from the leaf node to the root node.
  • Step 4 is performed recursively until all ENC features are inserted into the R-tree to complete the construction of the 3DENCQR-tree index structure.

3.3. Spatial Query of 3D ENC Features

The query method of 3DENCQR-tree is mainly a spatial area query, and the query process is described as follows.
  • Set the query area SA.
  • Query from the quadtree root node and calculate the spatial relationship between each node QN in the quadtree and SA of. If QN is included by SA, all leaf nodes of the QN are returned as query results and stop the spatial query process of the QN. If QN and SA are separated, there is no query result and the spatial query process of the QN stops. If other relationships are formed, the query operation is iterated in the child nodes of QN until the leaf node of the quadtree is reached, and then step 3 is performed.
  • Starting from all the returned leaf nodes of the quadtree, query the root nodes of the three R-trees, respectively, and calculate the spatial relationship between each node RN of the R-tree and SA. If RN is included by SA, all leaf nodes of this RN are returned as query results and the spatial query process of this RN is stopped. If RN and SA are separated, there is no query result and the spatial query process of this RN stops. If other relationships are formed, the query operation is iterated in the child nodes of RN until the leaf node of R-tree is reached, and step 4 is performed.
  • Visit all returned leaf nodes of R-tree and iteratively calculate the relationship between each ENC feature and SA. Then, the ENC features contained in or intersected with SA are added to the query result until all features are calculated.

3.4. Optimization Method

Although the depth of the R-tree can be controlled artificially and is more flexible, its query performance depends on the degree of coverage and overlap. When there is a large amount of data in a certain area and its shape is complex, it is easy to cause a large amount of overlapping MBB of R-tree and affect the query efficiency. Such problems are more likely to occur for the ENC features, because in the sea areas with complicated conditions or near the ports and routes, the distribution of features is relatively dense, and it is easy to overlap. For example, in Tianjin Port, there are not only virtual features such as traffic lane parts, anchorage areas, and restricted area navigational, but also substance features such as light and buoys, as well as environmental features such as sounding and seabed areas existing in the whole ENC. As shown in Figure 6, the blue line represents the ENC features, the red area represents the envelope of the features, and the green area represents the overlapping area of the features. When all ENC features are displayed, there will be multiple overlapping displays of ENC features. In this case, using R-tree to index ENC features directly will inevitably reduce the query efficiency.
To solve this problem, first of all, for some large area curves and surface features, the SMBB are used to replace the MBB, to reduce the area of the outer bounding box of features. As shown in Figure 7, the yellow area represents the SMBB of the features. Compared with Figure 6a,b, the overlap area of the features is eliminated or reduced.
The calculation of the SMBB uses the rotary clamping algorithm, and the algorithm is implemented as follows.
  • Obtain the envelope of ENC features, MaxX, MinX, MaxY, and MinY, construct four tangents according to the range boundary, and determine two “clamping” sets.
  • If one or two lines coincide with an edge, calculate the area of the rectangle determined by the four lines and save it as the current minimum. Otherwise, the current minimum is defined as infinity.
  • Rotate the lines clockwise until one of them coincides with one of the sides of the polygon.
  • Calculate the area of the new rectangle and compare it to the current minimum. Updates if it is less than the current minimum and save the rectangle information that determines the minimum.
  • Repeat steps 3 and 4 until the line has been rotated at an angle greater than 90 degrees.
  • Print the minimum area of the enclosing rectangle and save the rectangle information.
Secondly, ENC features are divided into three categories, environmental features, substance features, and virtual features. The reason for such consideration is that, on the one hand, the features in the same category usually overlap less. For example, for environmental features, the land features and sea surface features do not overlap, nor do sea surface features and seabed overlap in space. For substance features, the two actual buoys do not overlap. For the virtual features, although there will be a crossover between some fairways, they will not overlap with anchorage area and restricted area navigational, as shown in Figure 8a. On the other hand, there are more overlaps among these three features. As shown in Figure 8b, the red area represents the isobath in the environmental features, the green area represents the lighthouse in the substance features, and the yellow area represents the navigation restriction area in the virtual features. There is a lot of overlap between different types of features.

4. Results and Discussion

In this paper, 42 ENCs in the northern sea area of China were selected as the experimental data to construct a 3D ENC data set, divided according to the number of the ENC features, and four groups of experimental data were constructed. The number of ENC features in these four groups was 3390, 20,183, 69,256 and 102,506. The information of the ENC is shown in Table 2.

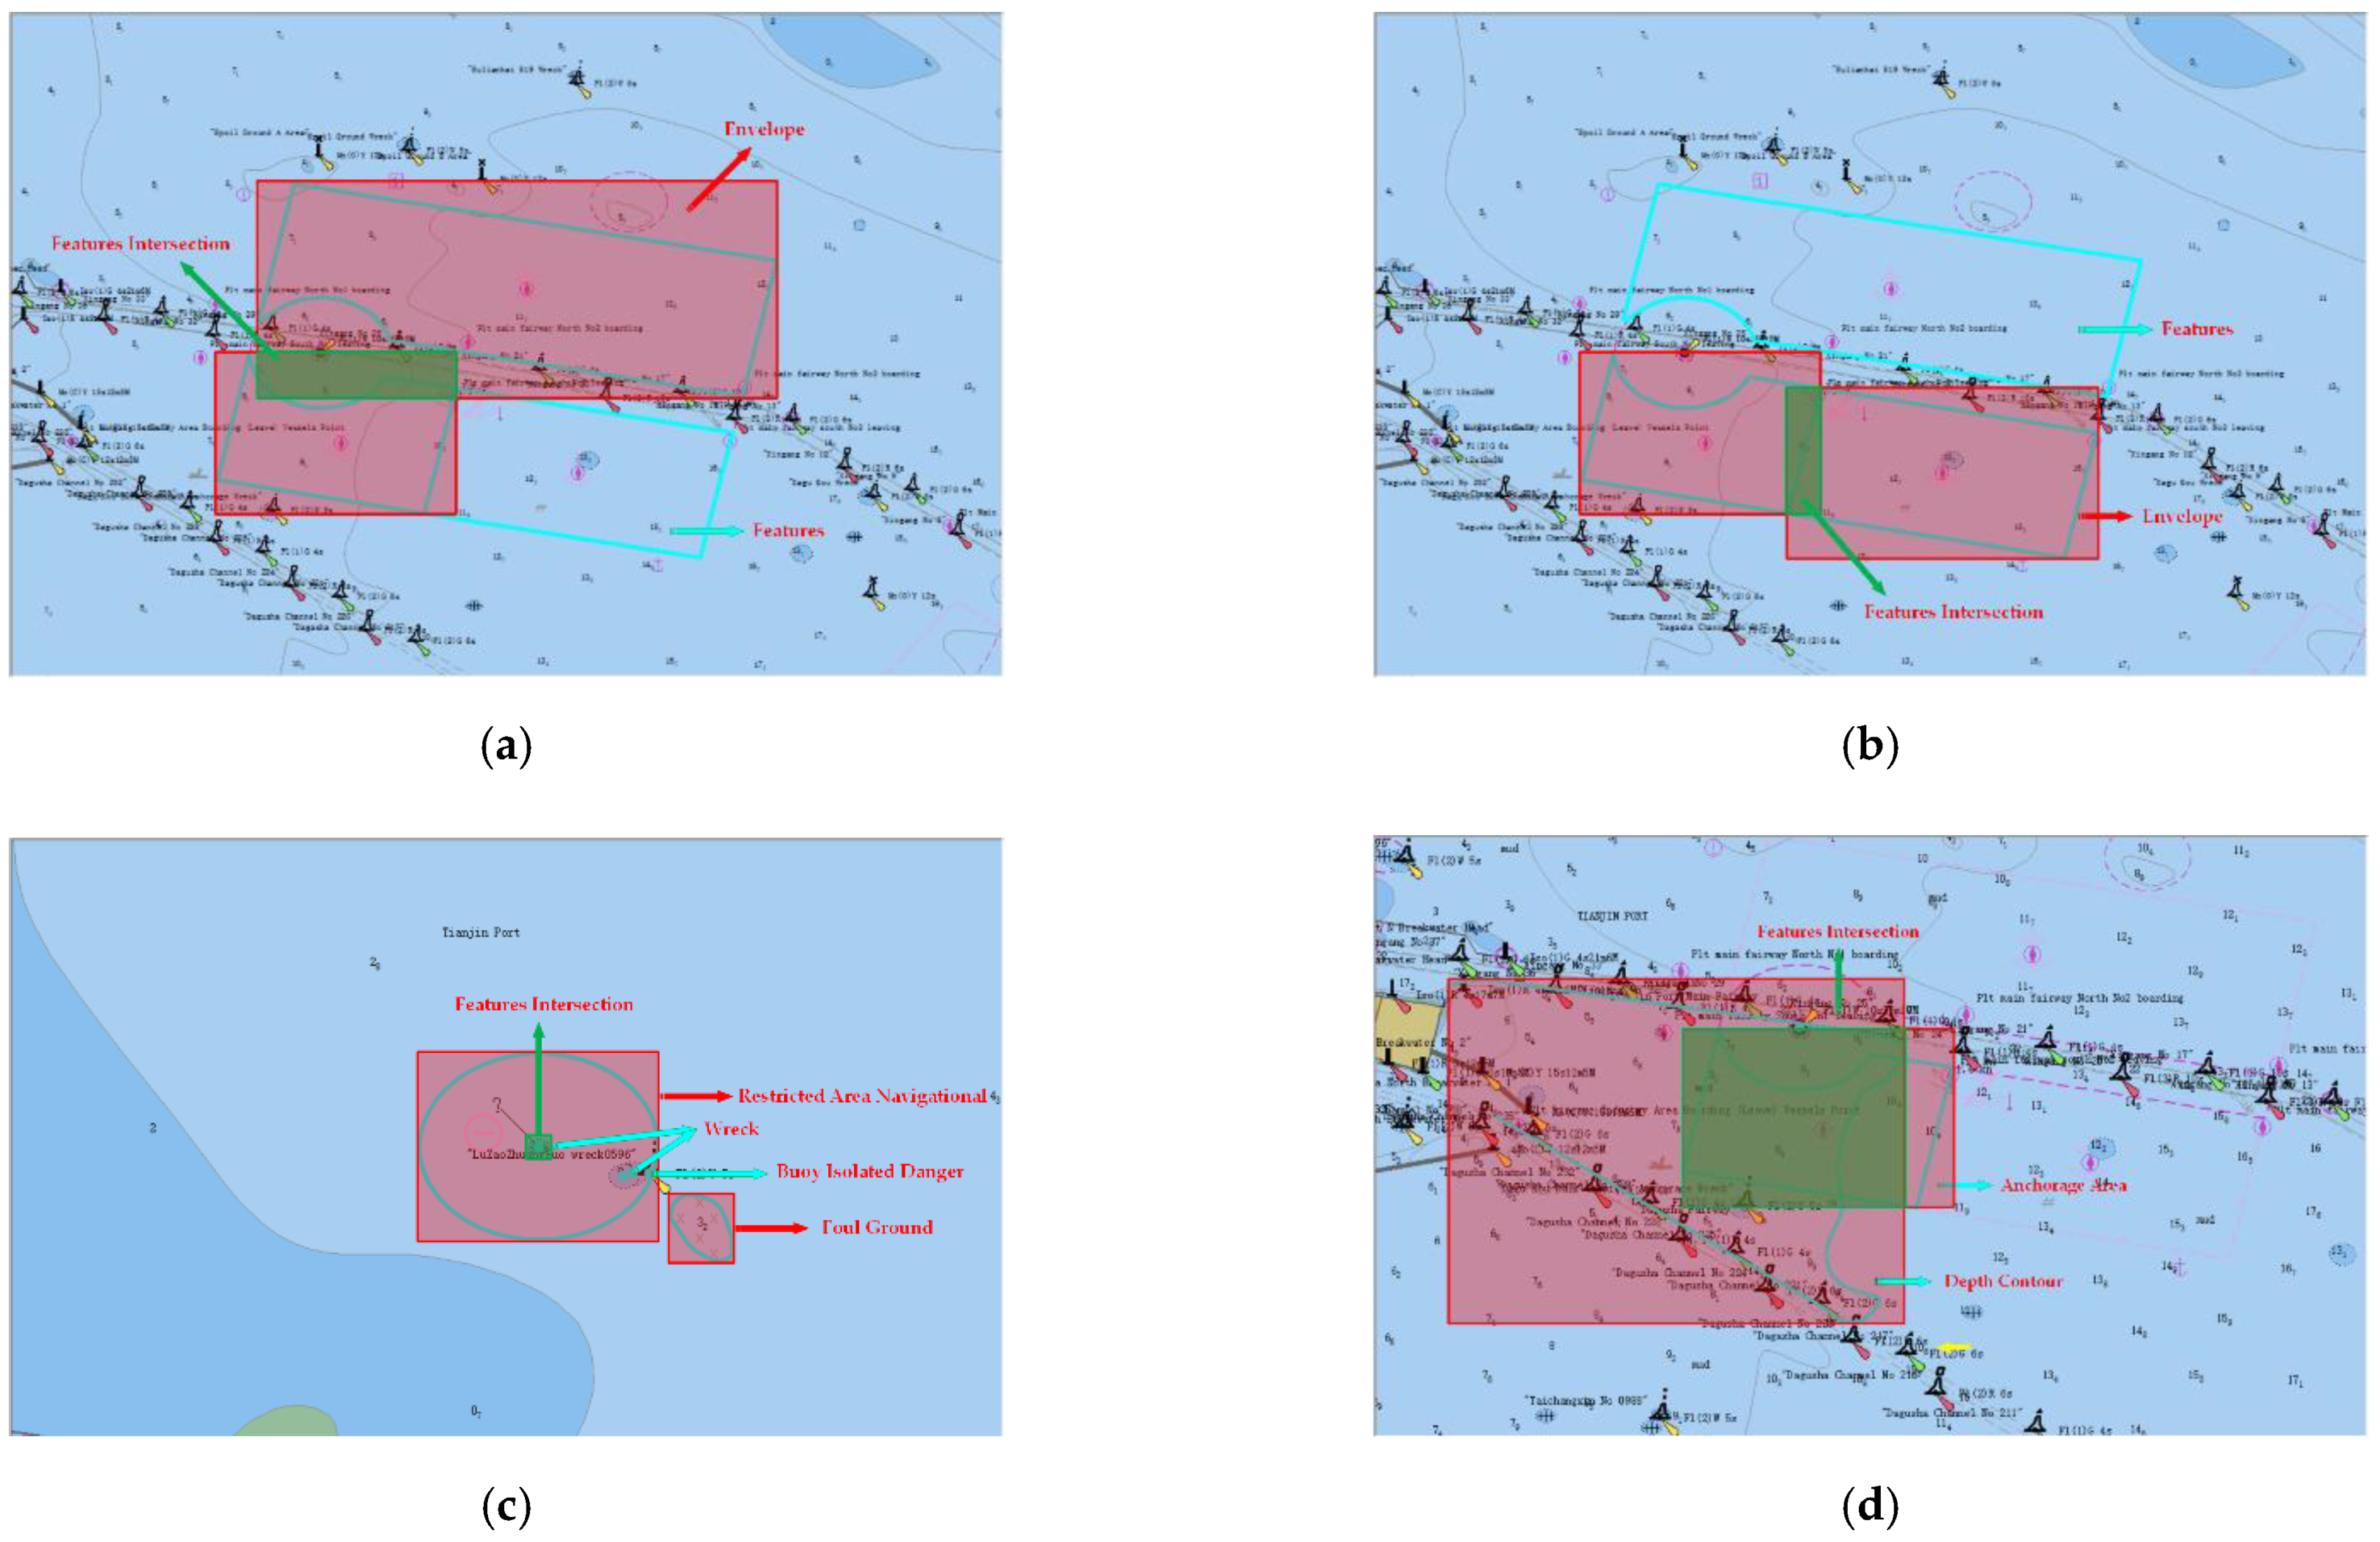
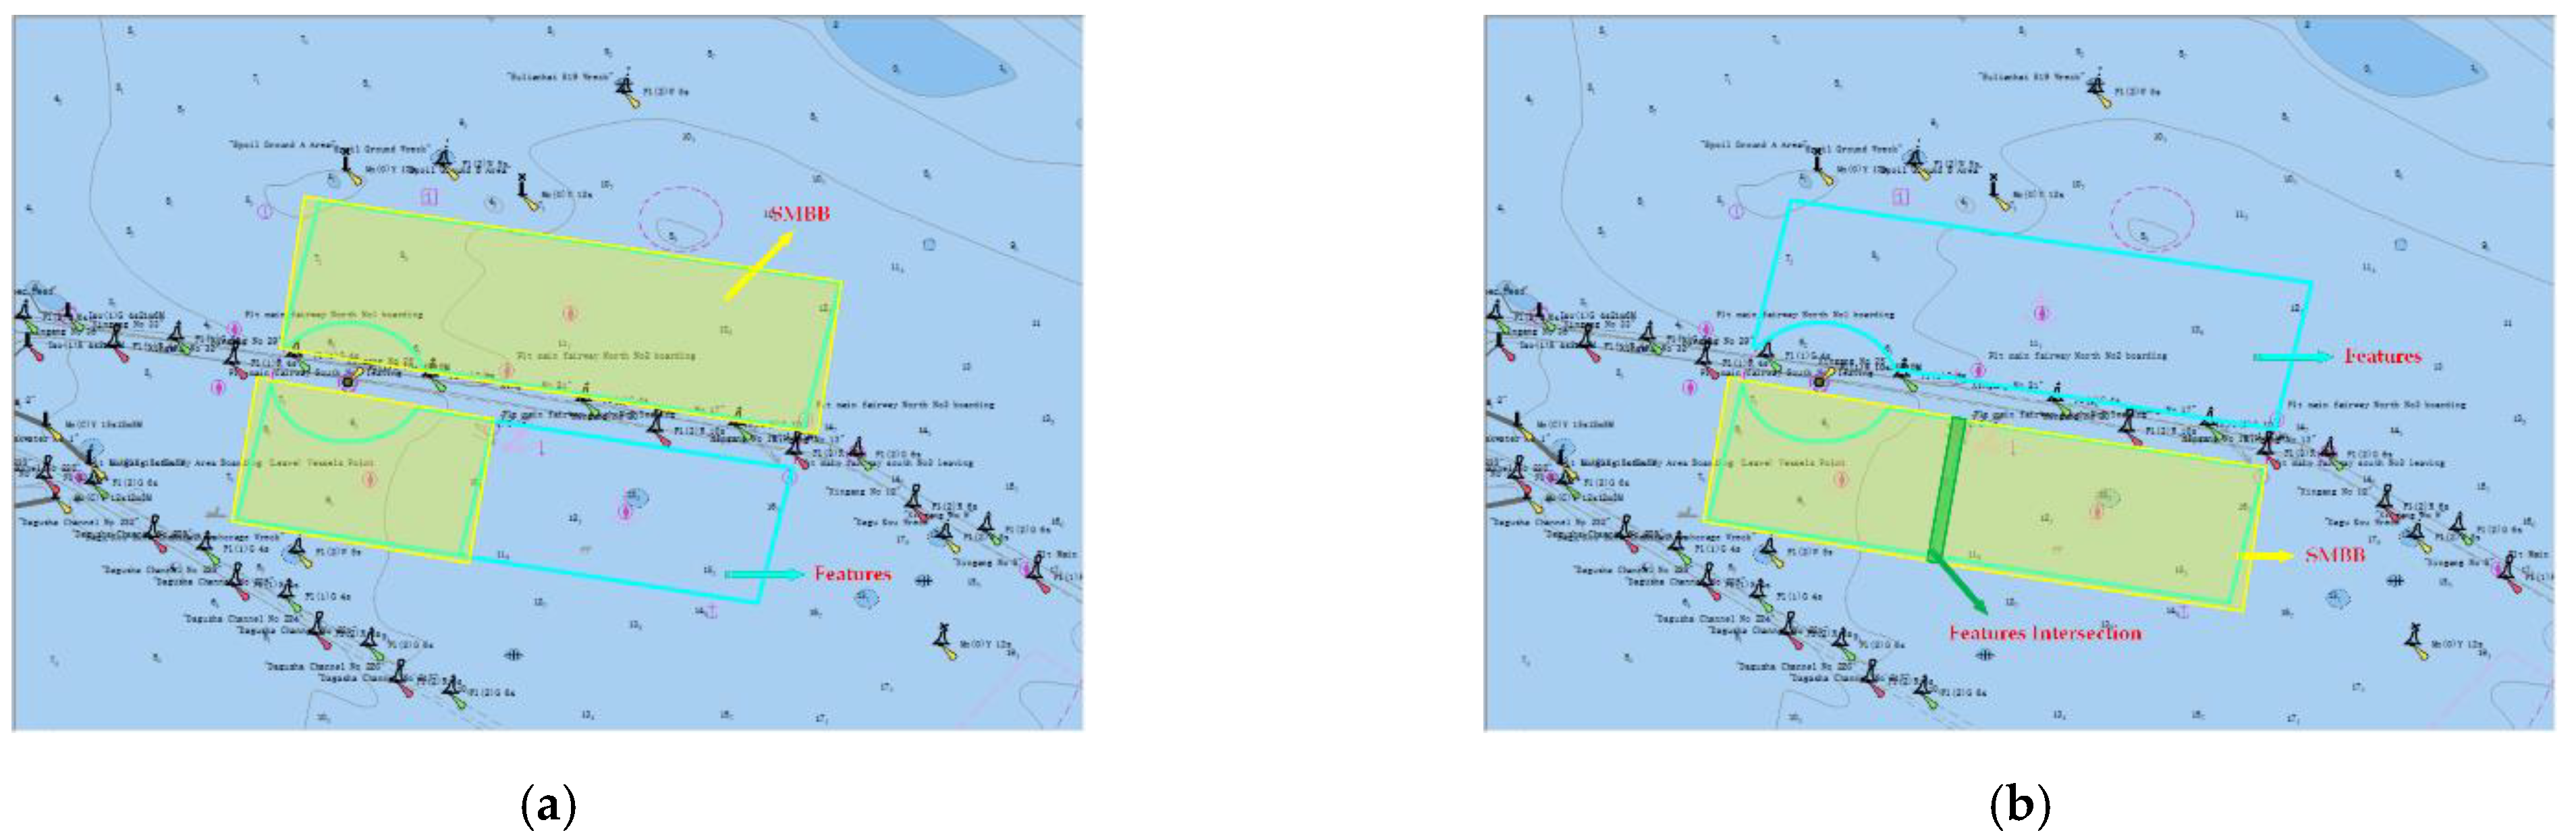
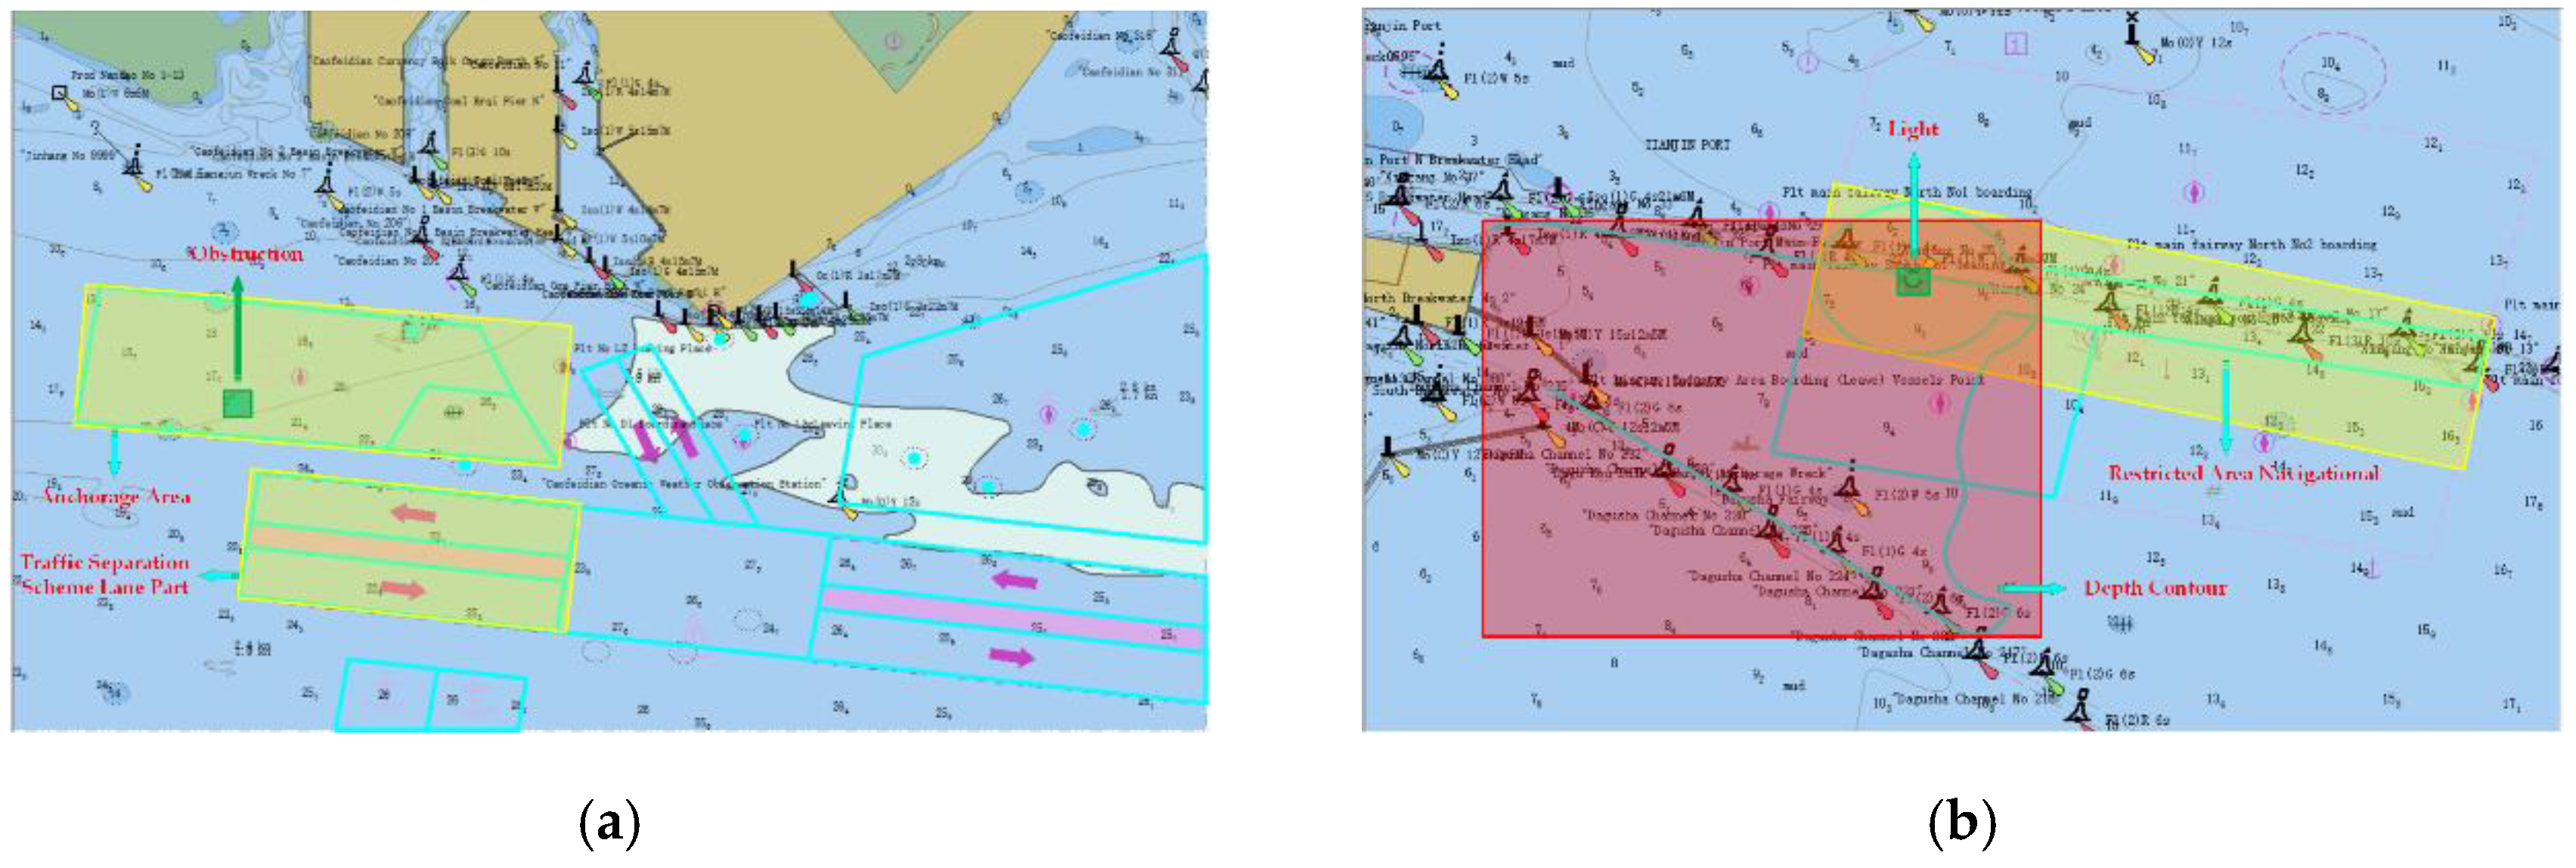
4.1. Overlapping Analysis of ENC Features

In this paper, the overlap rate of ENC features was tested and analyzed. The electronic navigation chart CN323101.000 was used, which is the ENC of the Tianjin Port area, with a total of 3107 features, including 1736 environmental features, 628 substance features, and 743 virtual features. The test results are shown in Table 3. In this paper, 1526 curve features and surface features were selected as experimental data. The reason why point features were not selected is that the overlap probability of point features is small, and even if they are overlapped, the overlap area is small and can be ignored. The average area of the MBB of these features is 30,472 km2. After optimization, the average area becomes 23,387 km2, reduced by 23,251%, indicating that the area of the MBB of the ENC features can be significantly reduced by using the SMBB. After that, the overlap area between every two features was calculated. Before optimization, the average overlap area of features was 19,002 km2, in which the overlap area of the same type of features was 15,790 km2, and that of different types of features was 24,364 km2, indicating that after the classification of ENC features, the overlap area between each feature is significantly reduced. After optimization, the average area of overlapping features is 12,509 km2, reduced by 34.170%, in which the overlap area of the same type of features is 9731 km2, reduced by 38,372%, and the overlap area between different types of features is 17,173 km2, reduced by 29,515%, which shows that, firstly, the overlap area of features is significantly reduced, and the MBB of some features no longer overlap. Secondly, the overlap area of the same type of features is significantly reduced compared to that of different features, and the area of the same type of features is also significantly reduced compared to before optimization.

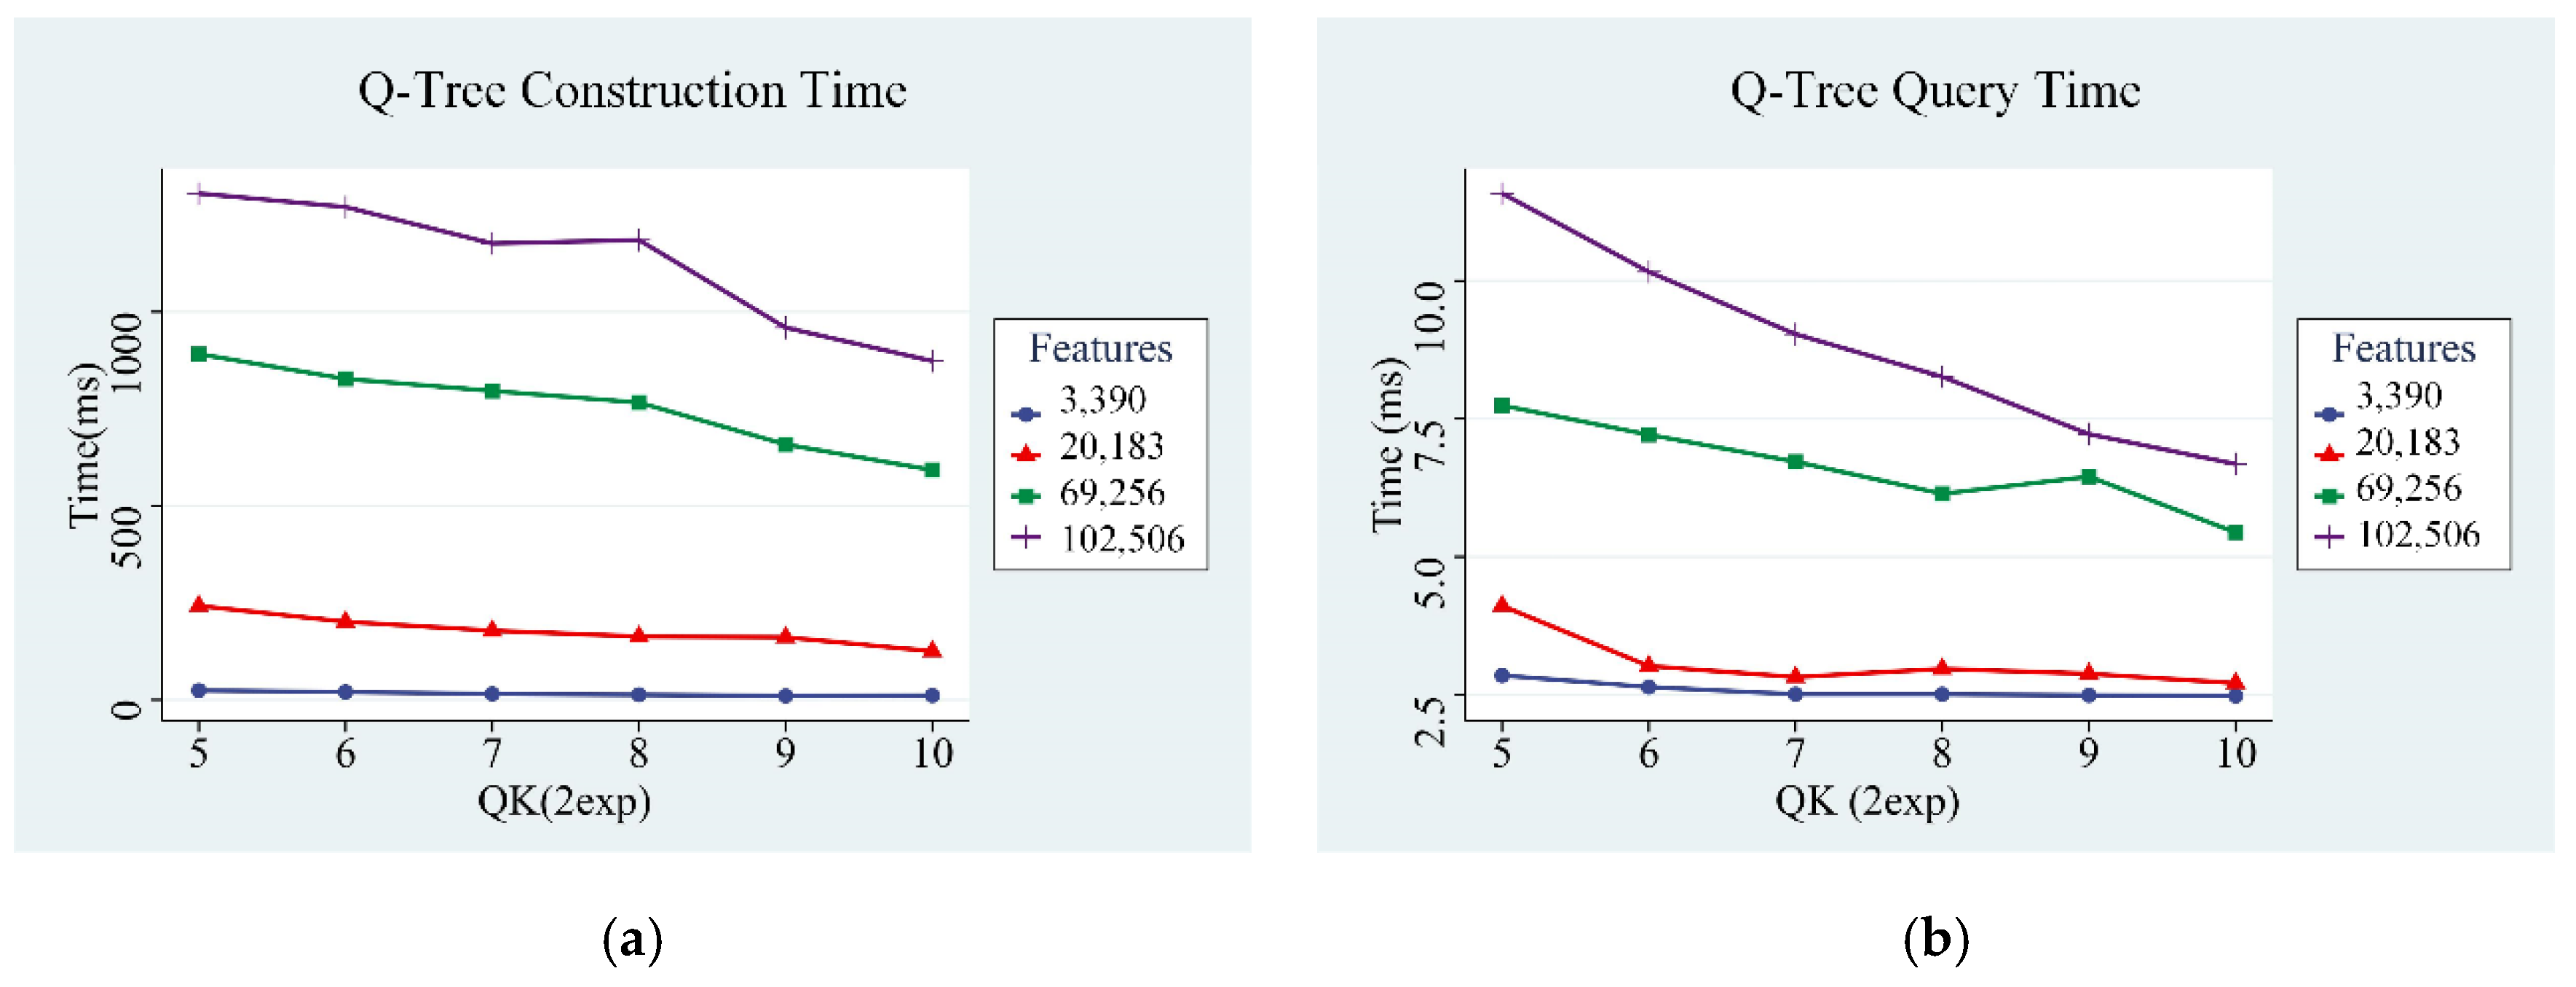
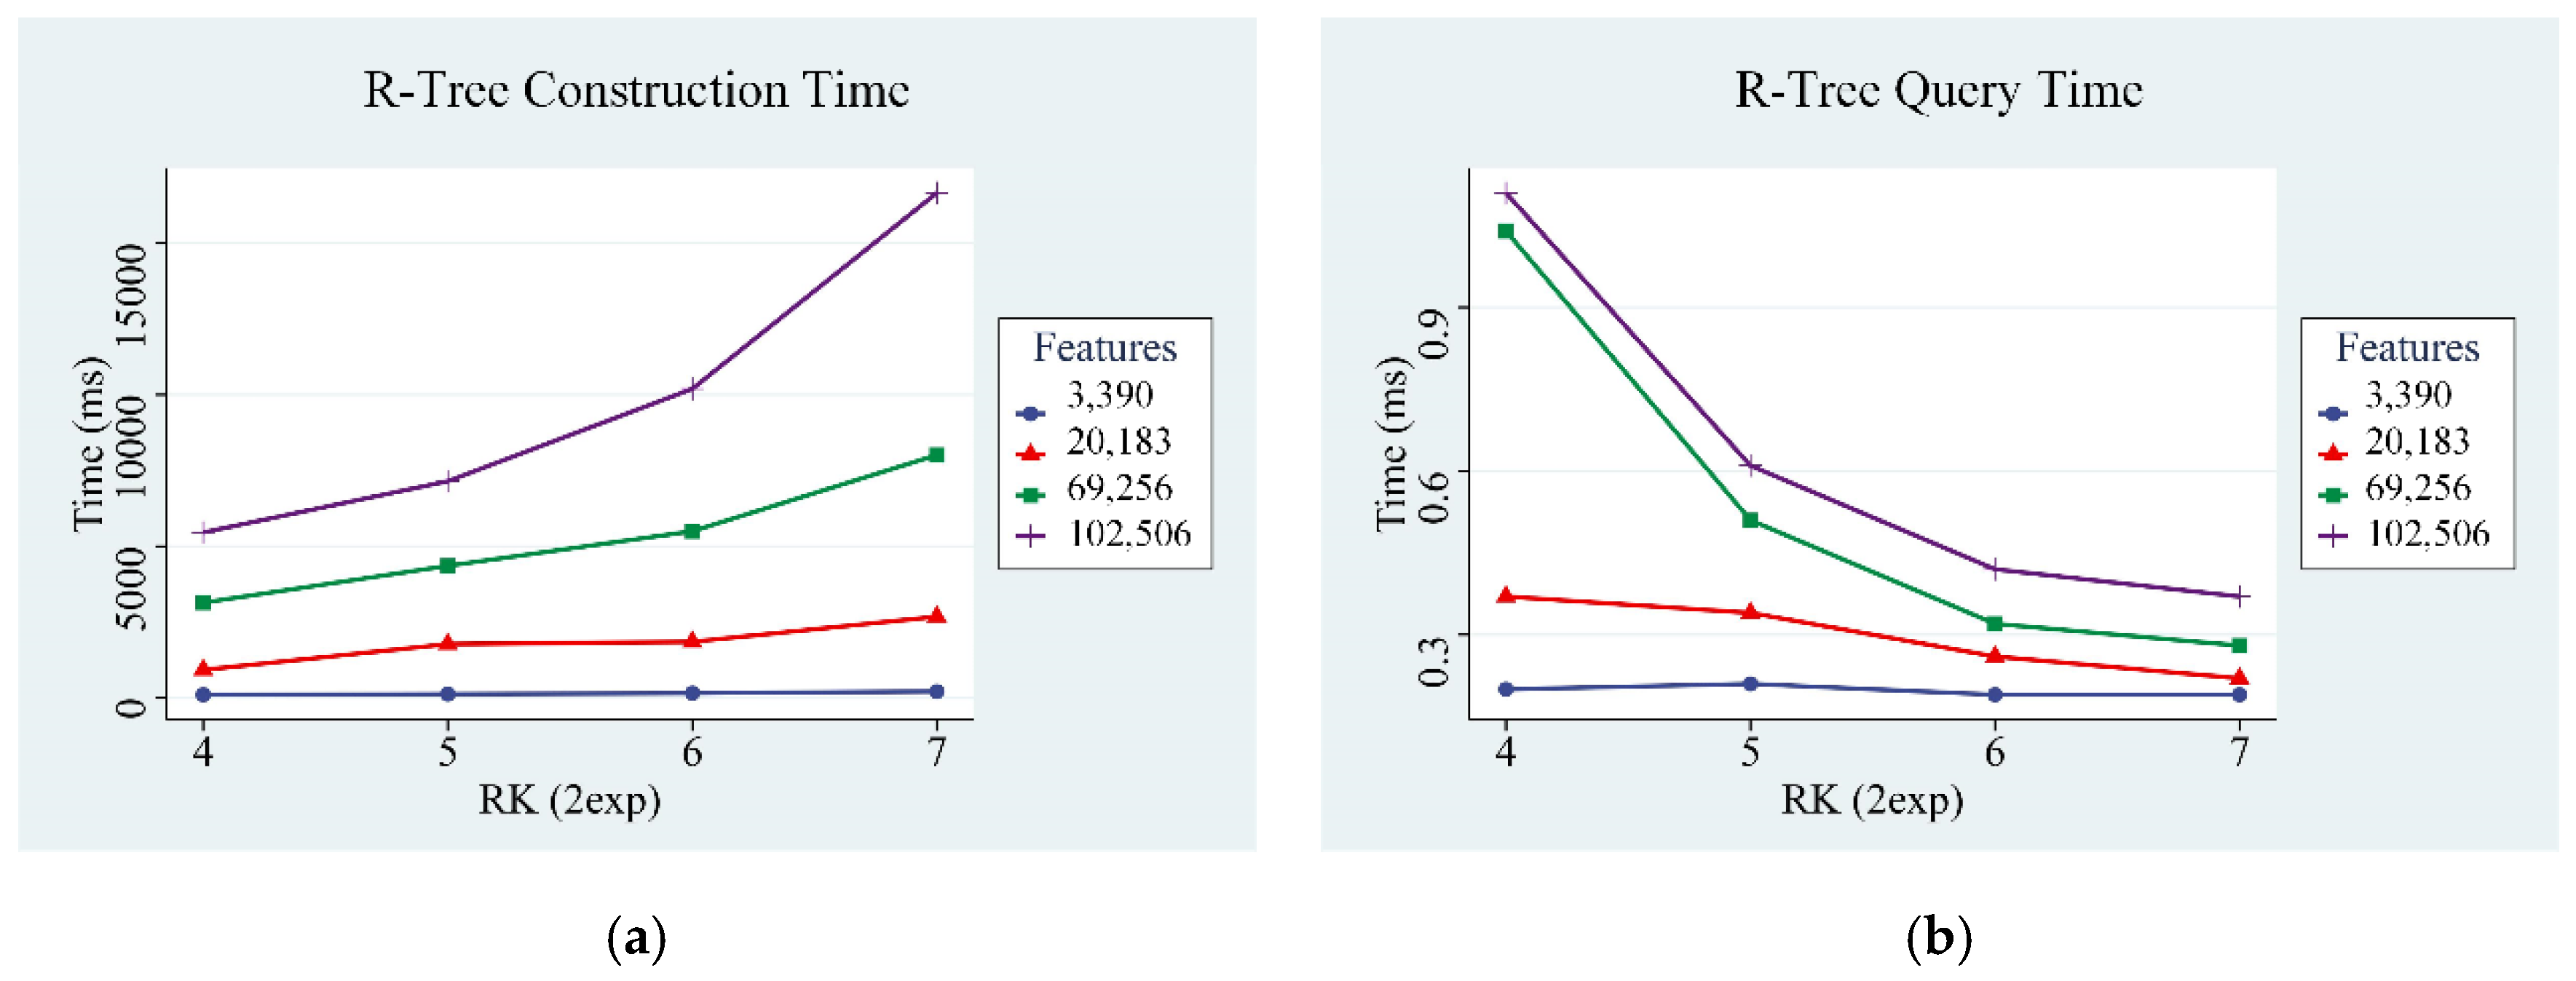
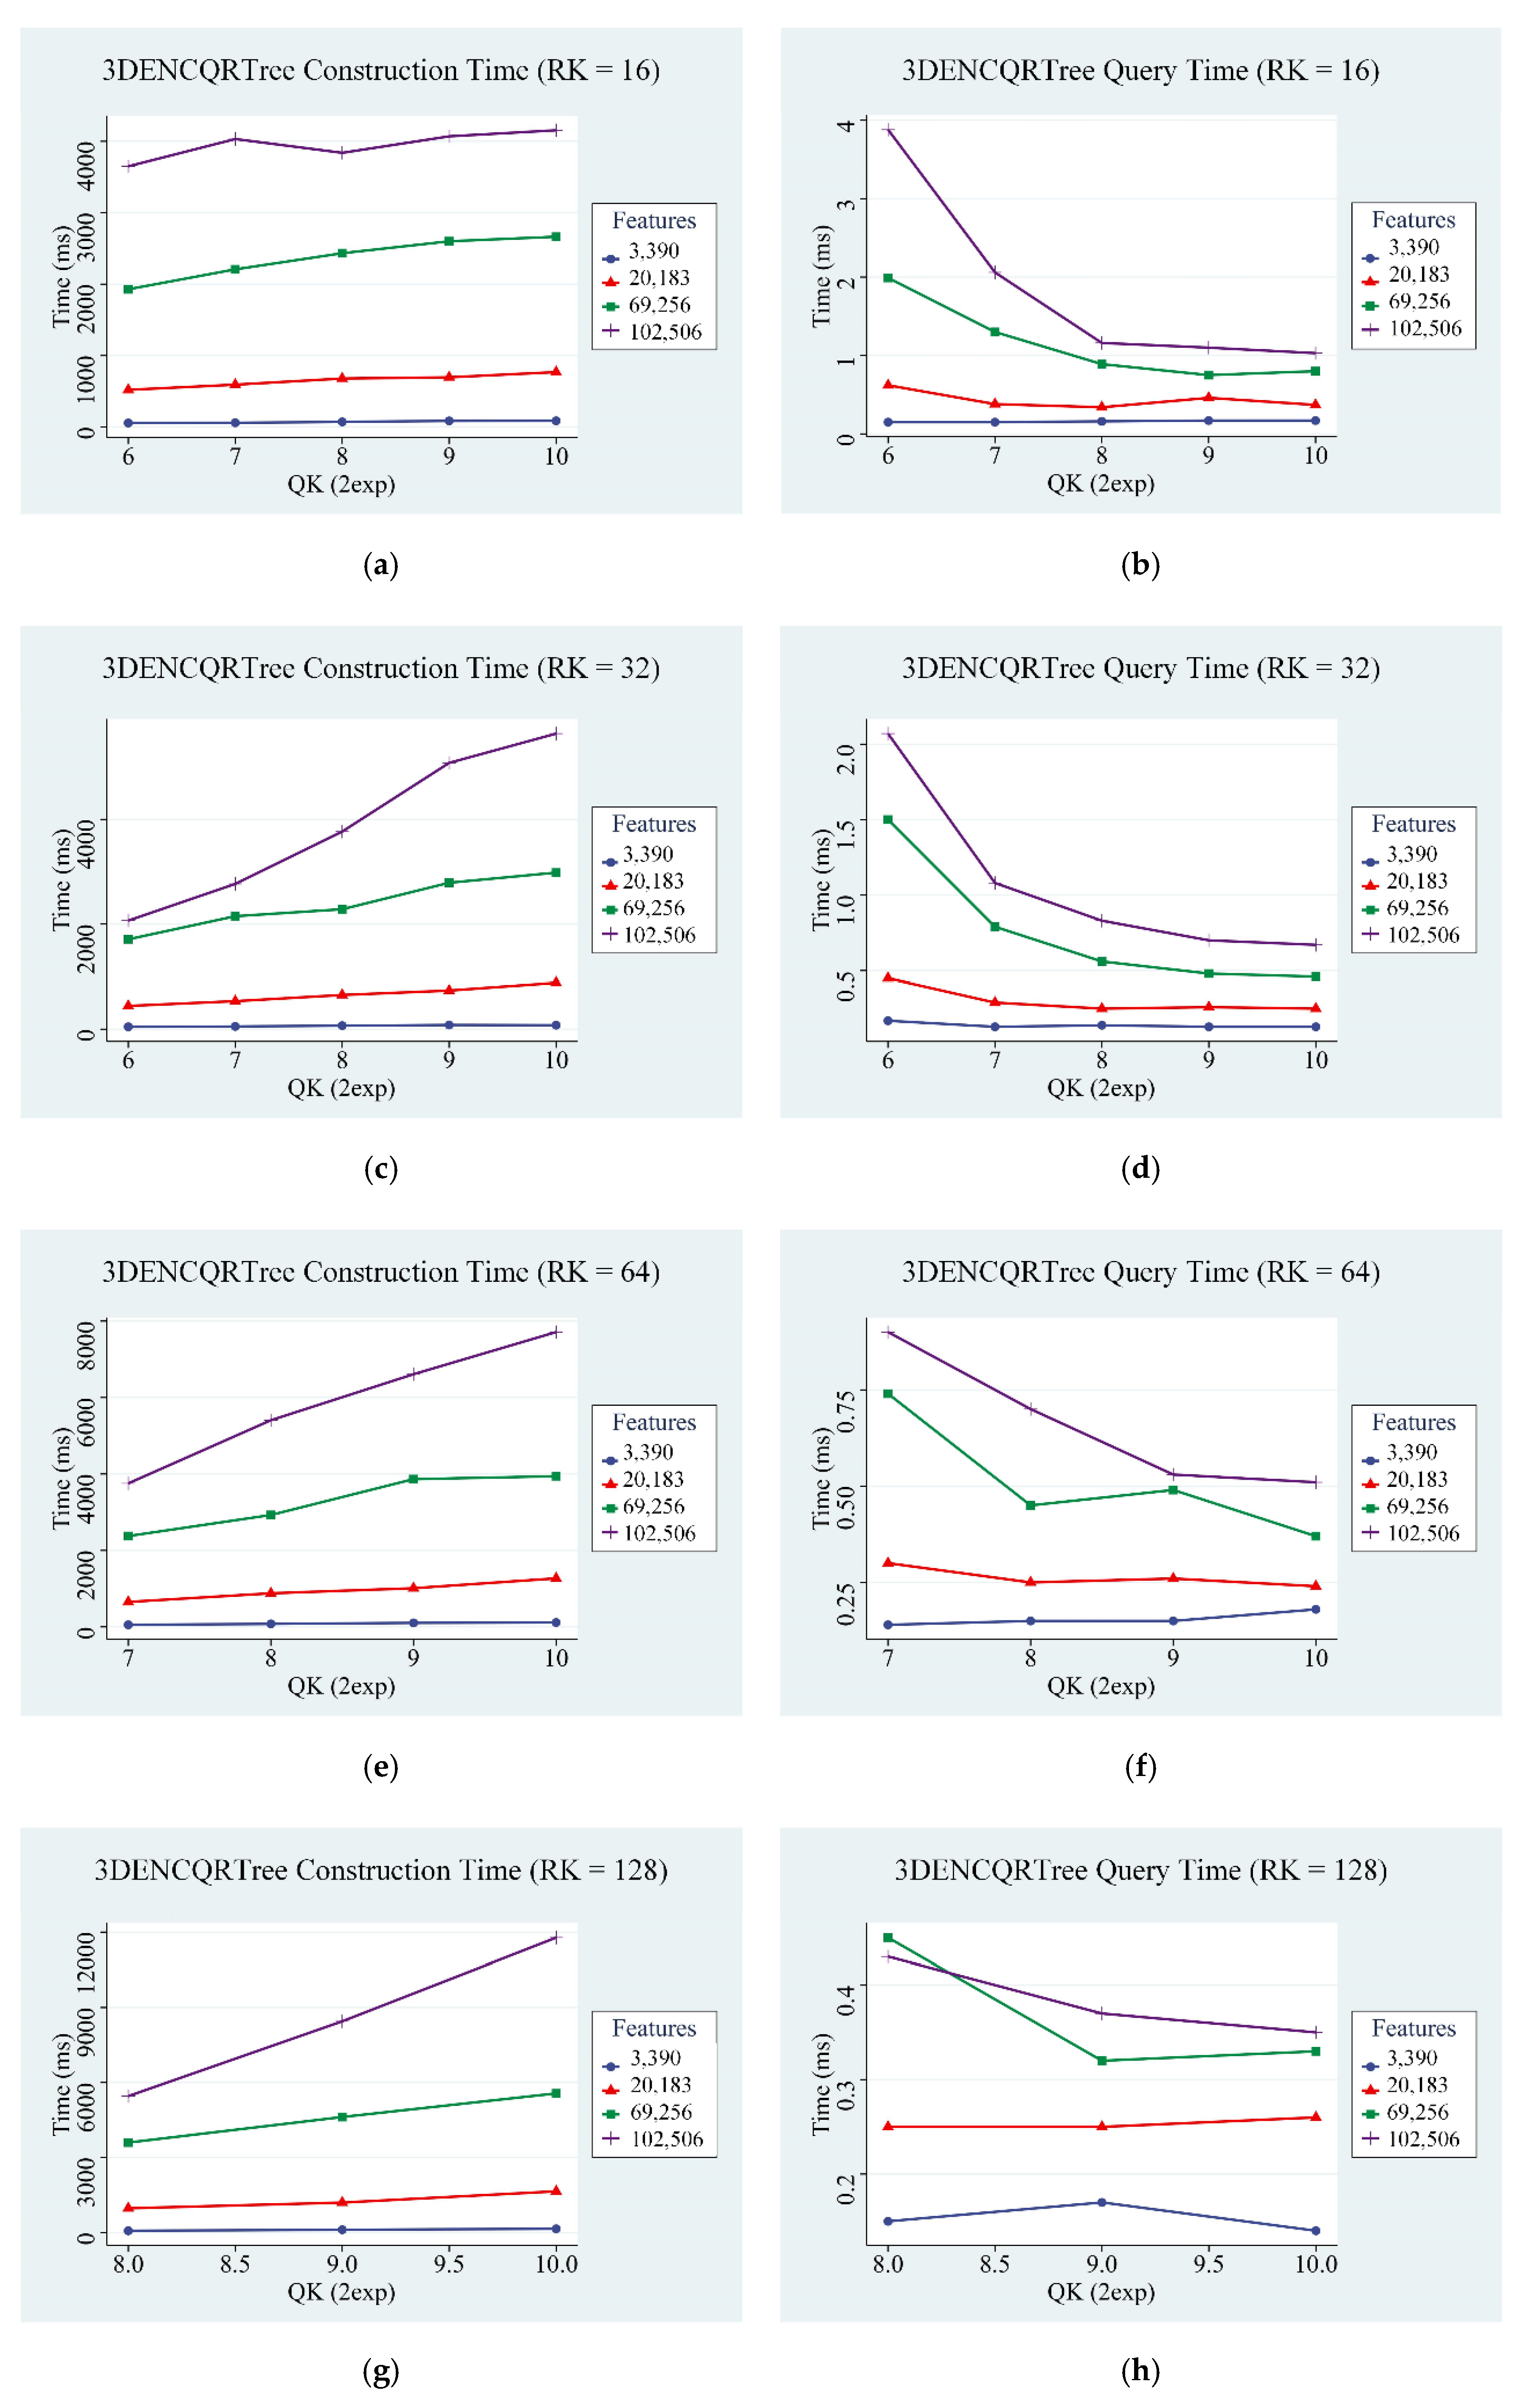
4.2. Test Results of Spatial Index Structure

To evaluate the efficiency of the 3DENCQR-tree proposed in this paper for real-time rendering of 3D scenes, the construction time and query time of quadtree, R-tree, and 3DencQR-tree were compared and analyzed. The latitude and longitude of the query range were set to 0.4°.
In the hybrid index structure, the segmentation threshold QK of quadtree and RK of R-tree has a great influence on the construction and query time. To find the most appropriate segmentation threshold, it was necessary to analyze the relationship between the construction and query time of the quadtree and R-tree and the segmentation threshold. Figure 9 shows that when the segmentation threshold of quadtree increases, the construction time decreases, while the query time shows no obvious correlation with the threshold. The possible reason is that the query time has some relationship with the spatial distribution of features. Figure 10 shows that the construction time of the R-tree increases with the increase in threshold RK, and the query time decreases with the increase in RK. Then, we tested the 3DENCQR-tree construction and query time of four different datasets. Figure 11 shows the relationship between the construction and query time of 3DENCQR-Tree and QK at different RKs. Figure 11a,c,e,g shows the relationships between the construction of 3DENCQR-tree and different QK thresholds in RK = 16, RK = 32, RK = 64, and RK = 128; Figure 11b,d,f,h shows the relationships between the query of 3DENCQR-tree and different QK thresholds in RK = 16, RK = 32, RK = 64, and RK = 128. The results show that when QK = 256, RK = 32, 3DENCQR-tree has a lower creation and query time, and the index performance is the best.
Figure 12a shows that the construction time of the quadtree is the smallest, the construction time of 3DENCQR-tree is slightly longer than that of the quadtree, and the construction time of the R-tree is the longest. This indicates that when the amount of data is large, the amount of R-tree segmentation and adjustment increases, making the depth of the R-tree too large. By classifying the ENC features, 3DENCQR-tree can avoid the problem of the index structure being too deep without greatly increasing the construction time. Figure 12b shows that the query time of quadtree is the longest, followed by R-tree, and 3DENCQR-tree is the shortest. This indicates that the query method using the SMBB can greatly reduce the repetition rate of the query of features; thus, improving the retrieval efficiency of features. Therefore, combining the construction and query efficiency of the 3DENCQR-tree hybrid index structure, it can be shown that the hybrid index structure can effectively manage ENC data and improve the drawing efficiency of 3D ENC.

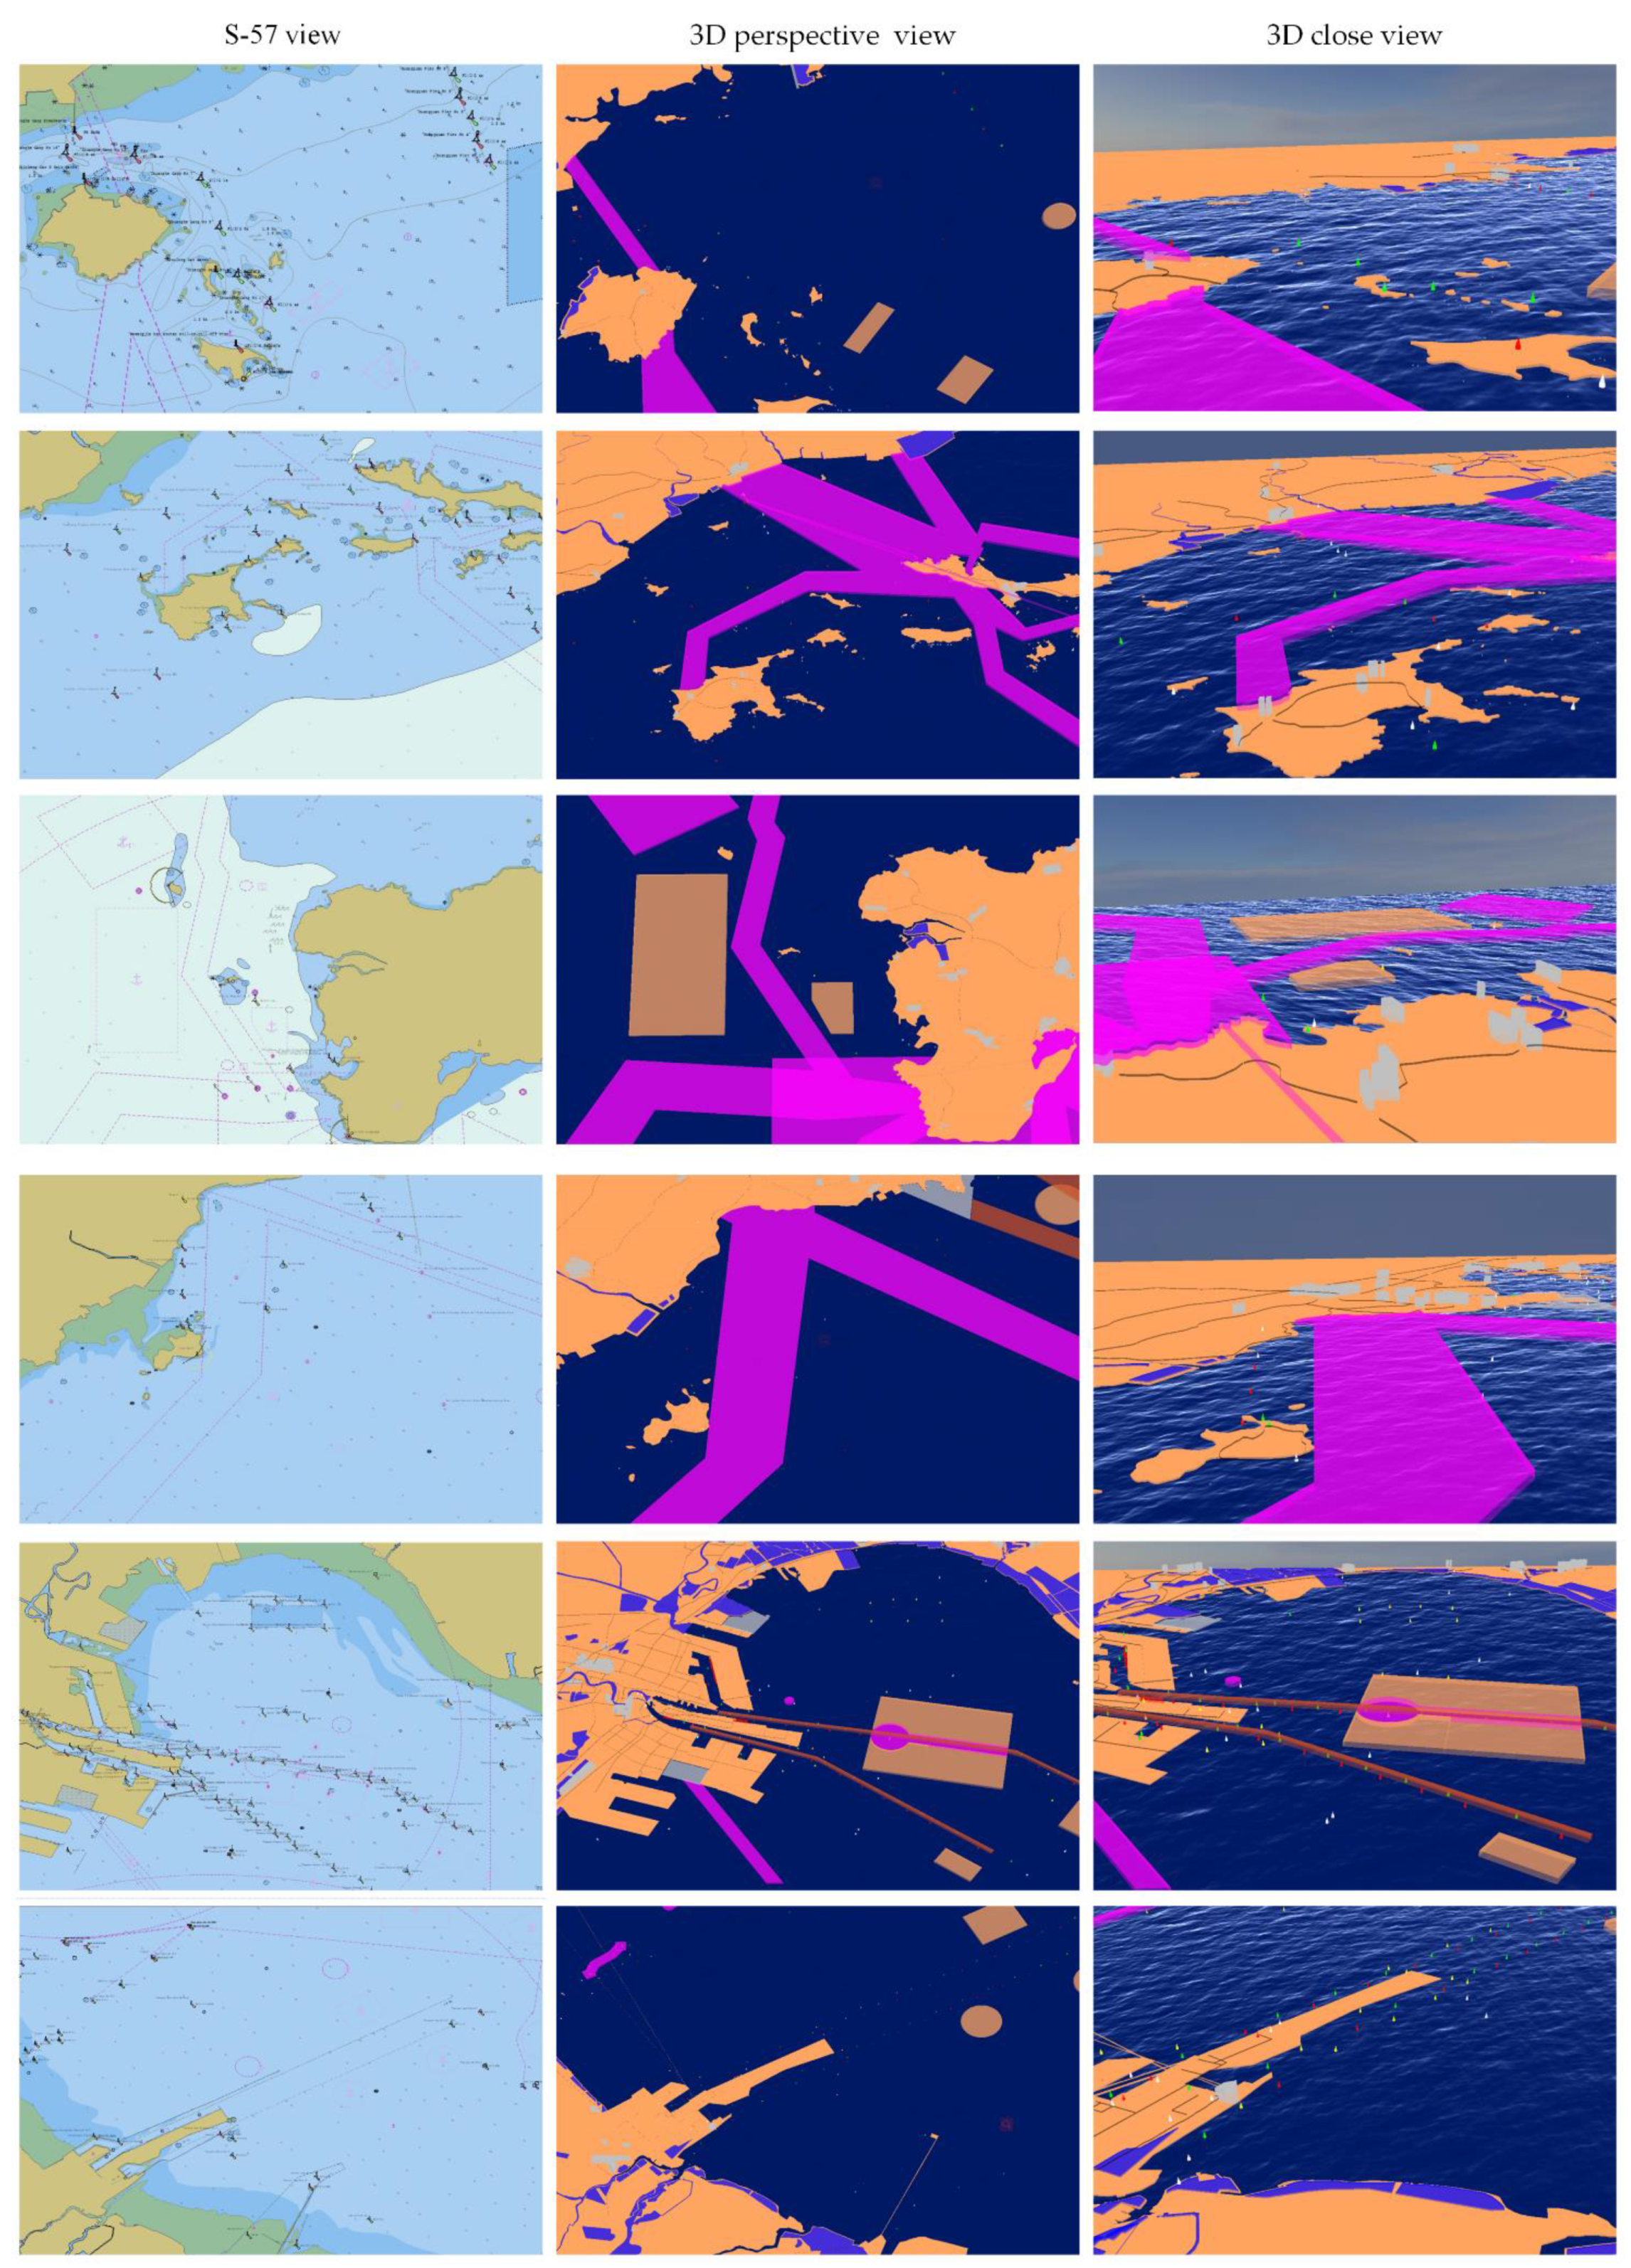
4.3. Visualization of the 3D ENC

In this paper, ENC features were drawn in a 3D scene in geometric form, and the sea surface was drawn by the Fast Fourier Transform (FFT) method [27]. By using the 3dENCQR-tree index structure for regional query, the frame rate of rendering is stable at more than 60 frames, realizing the demand for real-time rendering of 3D scenes. The 3D visualization effect is shown in Figure 13. The ENC features legend is shown in Table 4. The first column of the figure is the S-57 view, and the last two columns are the 3D perspective view and the 3D close view of the corresponding location. You can roam freely in the 3D view, intuitively observe the whole scene through the perspective view, and see more details of the features in the close view.

5. Conclusions

The 3D ENC can reduce misoperation and improve the convenience of use of the chart by reflecting the marine environment and various marine features truly, accurately, and directly. It is the direction of future development of ENCs. For multi-source heterogeneous marine environment data, it is very important to use an efficient spatial index structure for effective management of 3D ENC data, because the construction and query efficiency of spatial index structure directly affects the efficiency of 3D visualization. To achieve the ENC features in 3D scene real-time rendering, in this paper, based on the S-101 standard and the 3D characteristics to classify the ENC features and create the 3D ENC data set, a hybrid spatial index structure was proposed based on quadtree and R-tree and ENC feature data structure. This gave full play to the rapid quadtree space partition and R-tree efficiently, the advantages of spatial query, and, finally, the spatial index structure was optimized. By analyzing the overlapping of ENC features, it was verified that the classification of ENC features can improve the query efficiency of the hybrid index structure. Through the analysis of index structure construction and query time, the high efficiency of the 3DENCQR-tree query was verified. The results showed that this spatial index structure has the ability of rapid construction and query, can effectively index 3D ENC data and improve the rendering efficiency of the 3D chart.

Author Contributions

The manuscript was written by Yunong Zhang.; all authors discussed the original idea; conceptualization, Anmin Zhang and Yunong Zhang; methodology, Yunong Zhang; software, Yunong Zhang; validation, Yi Liang; formal analysis, Miao Gao; investigation, Miao Gao; resources, Anmin Zhang; data curation, Anmin Zhang; writing—original draft preparation, Yunong Zhang; writing—review and editing, Yunong Zhang and M.G; visualization, Yunong Zhang; supervision, Anmin Zhang; project administration, Anmin Zhang; funding acquisition, Anmin Zhang. All authors have read and agreed to the published version of the manuscript.

Funding

This research was funded by National Key Research and Development Program of China, grant number 2018YFC1407400 and Key Program of Marine Economy Development Special Foundation of Department of Natural Resources of Guangdong Province (GDNRC [2022]19).

Conflicts of Interest

The authors declare no conflict of interest.

Abbreviations

2D ENCTwo-Dimensional Electronic Navigational Chart
3D ENCThree-Dimensional Electronic Navigational Chart
AISAutomatic Identification System
BSPBinary Space Partitioning
BVHBounding Volume Hierarchies
ECDISElectronic Chart Display and Information System
ENCElectronic Navigational Charts
FFTFast Fourier Transform
GISGeographic Information System
IHOInternational Hydrographic Organization
MBBMinimum Bounding Box
S-100The S-100 Universal Hydrological Data Model
S-101The S-101 Universal Hydrological Data Model
S-57The S-57 Universal Hydrological Data Model
SMBBSmallest Minimum Bounding Box
WENDWorldwide Electronic Navigational Charts Database

References

  1. Turna, İ.; Öztürk, O.B. A causative analysis on ECDIS-related grounding accidents. Ships Offshore Struct. 2020, 15, 792–803. [Google Scholar] [CrossRef]
  2. Weintrit, A. Accuracy of bathymetric data in electronic navigational charts. Sci. J. Marit. Univ. Szczec. Zesz. Nauk. Akad. Mor. W Szczec. 2018, 55, 60–69. [Google Scholar]
  3. Acomi, N. Impact of Chart Data Accuracy on the Safety of Navigation. TransNav 2020, 14, 411–415. [Google Scholar] [CrossRef]
  4. European Maritime Safety Agency. Annual Overview of Marine Casualties and Incidents; European Maritime Safety Agency: Lisbon, Portugal, 2020. [Google Scholar]
  5. Goralski, R.; Ray, C.; Gold, C. Applications and Benefits for the Development of Cartographic 3D Visualization Systems in support of Maritime Safety. TransNav-Int. J. Mar. Navig. Saf. Sea Transp. 2011, 5, 423–431. [Google Scholar]
  6. Weintrit, A. Clarification, Systematization and General Classification of Electronic Chart Systems and Electronic Navigational Charts Used in Marine Navigation. Part 1—Electronic Chart Systems. TransNav-Int. J. Mar. Navig. Saf. Sea Transp. 2018, 12, 471–482. [Google Scholar] [CrossRef] [Green Version]
  7. Weintrit, A. Clarification Systematization and General Classification of Electronic Chart Systems and Electronic Navigational Charts Used in Marine Navigation. Part 2 Electronic Navigational Charts. TransNav-Int. J. Mar. Navig. Saf. Sea Transp. 2018, 12, 769–780. [Google Scholar] [CrossRef] [Green Version]
  8. Arsenault, R.; Smith, L.T.; Ware, C.; Mayer, L.A.; Plumlee, M.D. Fusing information in a 3D Chart-of-the-Future display. In Proceedings of the U.S. Hydro 2003 Conference, Biloxi, MS, USA, 24–27 March 2003. [Google Scholar]
  9. Goralski, R.; Gold, C. Marine GIS: Progress in 3D Visualization for Dynamic GIS; Springer: Berlin/Heidelberg, Germany, 2008; pp. 401–416. [Google Scholar]
  10. Liu, T.; Zhao, D.; Pan, M. Generating 3D Depiction for a Future ECDIS Based on Digital Earth. J. Navig. 2014, 67, 1049–1068. [Google Scholar] [CrossRef]
  11. Gold, C.; Chau, M.; Dzieszko, M.; Goralski, R. 3D Geographic Visualization: The Marine GIS; Springer: Berlin/Heidelberg, Germany, 2005; pp. 17–28. [Google Scholar]
  12. Grishentcev, A.; Elsukov, A. Design and analysis of algorithm for smooth stiching of electronic navigation charts. In Proceedings of the 2018 IEEE International Conference on Electrical Engineering and Photonics (EExPolytech), St. Petersburg, Russia, 22–23 October 2018. [Google Scholar]
  13. Park, D.; Park, S. E-Navigation-supporting data management system for variant S-100-based data. Multimed. Tools Appl. 2015, 74, 6573–6588. [Google Scholar] [CrossRef]
  14. Park, D.; Park, S. Syntactic-level integration and display of multiple domains’ S-100-based data for e-navigation. Clust. Comput. 2017, 20, 721–730. [Google Scholar] [CrossRef]
  15. Lin, H.; Huang, P.; Hsu, K. A new indexing method with high storage utilization and retrieval efficiency for large spatial databases. Inf. Softw. Technol. 2007, 49, 817–826. [Google Scholar] [CrossRef]
  16. Zhu, Q.; Gong, J.; Zhang, Y. An efficient 3D R-tree spatial index method for virtual geographic environments. ISPRS J. Photogramm. Remote Sens. 2007, 62, 217–224. [Google Scholar] [CrossRef]
  17. Wang, W.; Xuan, Z.; Sun, L.; Jiang, Z.; Shang, J. BRLO-Tree: A Data Structure Used for 3D GIS Dynamic Scene Rendering. Cybern. Inf. Technol. 2015, 15, 124–137. [Google Scholar] [CrossRef] [Green Version]
  18. Tayeb, J. A Quadtree-Based Dynamic Attribute Indexing Method. Comput. J. 1998, 41, 185–200. [Google Scholar] [CrossRef]
  19. Ma, M.; Wu, Y.; Ouyang, X.; Chen, L.; Li, J.; Jing, N. HiVision: Rapid visualization of large-scale spatial vector data. Comput. Geosci. 2021, 147, 104665. [Google Scholar] [CrossRef]
  20. Zhang, Z.J. Research on Index Method of Waterborne Big Data with Location Information. Ph.D. Thesis, Dalian Maritime University, Dalian, China, 2015; p. 156. [Google Scholar]
  21. Gong, J.; Shengnan, K.E.; Qing, Z.H.U. An Efficient Management Method for Point Cloud Data Based on Octree and 3D R-tree. Acta Geod. Et Cartogr. Sin. 2012, 9, 597–604. [Google Scholar]
  22. Kun, Z.G.; Guo, L.X.; Hui, Y. Research on Spatial Index Structure of LOD-OR Tree in 3D GIS. Bull. Surv. Mapp. 2005, 5, 27–29. [Google Scholar]
  23. Wang, Y.; Lv, H.; Ma, Y. Geological tetrahedral model-oriented hybrid spatial indexing structure based on Octree and 3D R*-tree. Arab. J. Geosci. 2020, 13, 1–11. [Google Scholar] [CrossRef]
  24. International Hydrographic Organization. Universal Hydrographic Data Model Special, Publication S-100, Edition 4.0.0. Available online: https://iho.int/en/s-100-universal-hydrographic-data-model (accessed on 31 December 2018).
  25. Kastrisios, C.; Pilikou, M. Nautical cartography competences and their effect to the realisation of a worldwide Electronic Navigational Charts database, the performance of ECDIS and the fulfilment of IMO chart carriage requirements. Mar. Policy 2017, 75, 29–37. [Google Scholar] [CrossRef]
  26. International Hydrographic Organization. IHO Electronic Navigational Chart Product Specification, Publication S-101, Edition 1.0.0. Available online: https://iho.int/en/standards-and-specifications (accessed on 21 December 2018).
  27. Johanson, C. Real-Time Water Rendering. Master’s Thesis, Lund University, Lund, Sweden, 2004. [Google Scholar]
Figure 1. Distribution of accident events for the period 2014–2019.
Ijgi 11 00319 g001
Figure 2. Organizational structure of this article.
Ijgi 11 00319 g002
Figure 3. The 3D ENC data sets.
Ijgi 11 00319 g003
Figure 4. Data structures of 3D ENC features and spatial indexing structure.
Ijgi 11 00319 g004
Figure 5. Spatial index structures of 3D ENC features.
Ijgi 11 00319 g005
Figure 6. Intersection of features. (a) The envelope of the same type features; (b) The features intersection of the same type; (c) The envelope of the different type features; (d) The features intersection of different types.
Ijgi 11 00319 g006
Figure 7. Intersection of features. (a) The features SMBB; (b) The intersection of features SMBB.
Ijgi 11 00319 g007
Figure 8. Intersection of features. (a) Features of the same types do not overlap; (b) Different types of features overlap.
Ijgi 11 00319 g008
Figure 9. The construction time and query time of quadtree. (a) The construction time of Quadtree; (b) The query time of Quadtree.
Ijgi 11 00319 g009
Figure 10. The construction time and query time of R-tree. (a) The construction time of R-tree; (b) The query time of R-tree.
Ijgi 11 00319 g010
Figure 11. Relationships between construction and query time of 3DENCQR-tree and different thresholds. (a,c,e,g) Relationships between the construction of 3DENCQR-tree and different QK thresholds in RK = 16, RK = 32, RK = 64 and RK = 128; (b,d,f,h) Relationships between the query of 3DENCQR-tree and different QK thresholds in RK = 16, RK = 32, RK = 64 and RK = 128.
Ijgi 11 00319 g011
Figure 12. The construction time and query time of three spatial index structures. (a) The construction time of three spatial index structure; (b) The query time of three spatial index structure.
Ijgi 11 00319 g012
Figure 13. Visualization of the 3D ENC.
Ijgi 11 00319 g013
Table 1. Classification of geographic features.
Geographic FeaturesContent
Environmental FeaturesSubstance FeaturesVirtual Features
Magnetic DataMagnetic Variation, Local Magnetic Anomaly
Natural FeaturesCoastline, Land Area, Island group, Land elevation, River, River, Rapids, Waterfall, Lake, Land region, Vegetation, Ice area, Sloping Ground, Slope Topline, Tideway
Cultural FeaturesBuilt-up area, Building, Airport/Airfield, Runway, Bridge, Span Fixed, Span Opening, Conveyor, Cable Overhead, Pipeline Overhead, Pylon/Bridge Support, Fence/wall, Railway, Road, Tunnel
LandmarksLandmark, Silo/tank, Wind Turbine, Fortified Structure,Production/Storage Area
PortsCheckpoint, Hulks,Piles, Dyke, Shoreline Construction, Causeway, Canal,Distance Mark, Gate, Dam, Crane,Berth, Mooring/Warping Facility, Dry Dock, Floating Dock, Pontoon,Dock Area, Gridiron, Lock Basin, Mooring Trot
Topographic TermsSea Area/Named Water Area
Tides, CurrentsTidal Stream–Flood/Ebb, Current–Non-Gravitational, Water Turbulence, Tidal Stream Panel Data
DepthsSounding, Dredged Area, Swept Area, Depth Contour, Depth Area, Depth–No Bottom Found, Unsurveyed Area
Nature of the SeabedSeabed Area, Weed/Kelp, Sandwaves, Spring
Rocks, Wrecks, Foul Ground, ObstructionsUnderwater/Awash Rock, Wreck, Obstruction,Foul Ground, Discolored Water,Fishing Facility, Marine Farm/Culture
Offshore InstallationsOffshore Platform, Cable Submarine,Cable Area, Pipeline Submarine/On Land,Submarine Pipeline Area, Offshore Production Area
Tracks and RoutesNavigation Line, Recommended Track, Range System, Fairway, Fairway System, Recommended Route Centerline, Two-Way Route Part, Two-Way Route, Recommended Traffic Lane Part, Deep Water Route Centerline, Deep Water Route Part, Deep Water Route, Inshore Traffic Zone, Precautionary Area, Traffic Separation Scheme Lane Part, Traffic Separation Zone, Traffic Separation Line, Traffic Separation Scheme Boundary, Traffic Separation Scheme Crossing, Traffic Separation Scheme Roundabout, Traffic Separation Scheme, Archipelagic Sea Lane Area, Archipelagic Sea Lane Axis, Archipelagic Sea Lane, Ferry Route, Radar Line, Radar Range,Radar Station
Areas, LimitsAnchorage Area, Anchor Berth, Seaplane Landing Area, Dumping Ground, Military Practice Area, Administration Area, Cargo Transshipment Area, Caution Area, Information Area, Contiguous Zone, Continental Shelf Area, Custom Zone, Exclusive Economic Zone, Fishery Zone, Fishing Ground, Free Port Area, Harbor Area (Administrative), Log Pond, Oil Barrier, Straight Territorial Sea Baseline, Territorial Sea Area, Submarine Transit Lane, Pilotage District, Collision Regulations Limit
Restricted AreasRestricted Area Navigational, Restricted Area Regulatory
LightsLight All Around, Light Sectored, Light Fog Detector, Light Air Obstruction
Buoys, BeaconsBuoy Lateral, Buoy Cardinal, Buoy Isolated Danger, Buoy Safe Water, Buoy Special Purpose/General, Buoy Emergency Wreck Marking, Buoy Installation, Beacon Lateral, Beacon Cardinal, Beacon Isolated Danger, Beacon Safe Water, Beacon Special Purpose/General,Daymark,Light Float, Light Vessel, Retroreflector, Radar Reflector, Fog Signal
Radar, RadioPhysical AIS Aid to Navigation,Virtual AIS Aid to Navigation, Radio Station, Radar Transponder Beacon
ServicesPilot Boarding Place, Vessel Traffic Service Area,Coastguard Station, Signal Station Warning, Signal Station Traffic, Rescue Station, Harbor Facility, Small Craft Facility
Table 2. The information of the ENC.
ENC Data (.000)Byte (KB)Environmental FeaturesSubstance FeaturesVirtual FeaturesNumber of FeaturesNumber of Points
CN32310110661736628743310770,723
CN3210011759155138413303265181,937
CN3220014901203235140157828,704
CN324101144317835073582648209,746
CN3330014741230401194182554,212
CN3340011450185961011983667114,760
Table 3. Results of overlapping analysis of ENC features.
Mean AreaBefore Optimization (km2)Optimization (km2)Ratio of Decreased Area
Envelope30.47223.38723.251%
Features Intersection19.00212.50934.170%
Environmental Features Intersection18.36913.25527.840%
Substance Features Intersection0.1290.01290.698%
Virtual Features Intersection14.7678.09045.216%
Environmental Features Intersect with Substance Features1.0130.57143.633%
Environmental Features Intersect with Virtual Features31.68722.38829.346%
Substance Features Intersect with Virtual Features1.6150.99138.638%
Intersect with Features of the Same Type15.7909.73138.372%
Intersect with Features of Different Types24.36417.17329.515%
Table 4. ENC features legend.
FeaturesLegend FeaturesLegend
1Land Area Ijgi 11 00319 i0017Sea Area Ijgi 11 00319 i002
2Built-Up Area Ijgi 11 00319 i0038Unsurveyed Area Ijgi 11 00319 i004
3Caution Area Ijgi 11 00319 i0059Lake Ijgi 11 00319 i006
4Restricted Area Ijgi 11 00319 i00710Anchorage Area Ijgi 11 00319 i008
5Road Ijgi 11 00319 i00911Lights Ijgi 11 00319 i010
6Fairway Ijgi 11 00319 i01112Buoys, Beacons Ijgi 11 00319 i012
Publisher’s Note: MDPI stays neutral with regard to jurisdictional claims in published maps and institutional affiliations.

