Article

GeoMemories—A Platform for Visualizing Historical, Environmental and Geospatial Changes in the Italian Landscape

1
The Institute of Informatics and Telematics, CNR (National Research Council), Via GiuseppeMoruzzi, Pisa 1-56124, Italy
2
Department of Information Technology , Uppsala University, Lägerhyddsvägen 2-751 05,Uppsala, Sweden
*
Author to whom correspondence should be addressed.
ISPRS Int. J. Geo-Inf. 2013, 2(2), 432-455; https://0-doi-org.brum.beds.ac.uk/10.3390/ijgi2020432
Submission received: 20 March 2013 / Revised: 25 April 2013 / Accepted: 27 April 2013 / Published: 21 May 2013
(This article belongs to the Special Issue Geospatial Monitoring and Modelling of Environmental Change)

Abstract

:
The GeoMemories project aims at publishing on the Web and digitally preserving historical aerial photographs that are currently stored in physical form within the archives of the Aerofototeca Nazionale in Rome. We describe a system, available at http://www.geomemories.org, that lets users visualize the evolution of the Italian landscape throughout the last century. The Web portal allows comparison of recent satellite imagery with several layers of historical maps, obtained from the aerial photos through a complex workflow that merges them together. We present several case studies carried out in collaboration with geologists, historians and archaeologists, that illustrate the great potential of our system in different research fields. Experiments and advances in image processing technologies are envisaged as a key factor in solving the inherent issue of vast amounts of manual work, from georeferencing to mosaicking to analysis.

1. Introduction

Historical photographs offer a way to look at things as they were in the past, comparing them to the present using modern photos. Since the birth of modern aviation, aerial photos have been a rich source for understanding geospatial changes and historical development (For an introduction, and also an extensive discussion on aerial archaeology, see [1,2,3,4]).
The Aerofototeca Nazionale (AFN) of Istituto Centrale per il Catalogo e la Documentazione (http://www.iccd.beniculturali.it/) of the Italian Ministry of Cultural Heritage in Rome maintains an extensive set of such aerial photographs, which constitutes an important memory archive of the Italian territory since the end of the 19th century. This vast archive, with millions of photos, provides a picture of Italy as it was before its transformation during post-war reconstruction [5], the economic boom [6], and also after the changes due to natural disasters such as severe earthquakes and floods [7]. Since most of the photos it contains—and also most of the indexes for their retrieval—still exist only on paper and are highly perishable, only a few experts have access to the archive, due to the laborious efforts and expertise needed to interpret the physical indexes.
In 2010, the AFN and the Institute of Informatics and Telematics (http://www.iit.cnr.it/) of CNR (Consiglio Nazionale delle Ricerche) in Pisa signed an agreement to make this archive accessible via the Internet. Thanks to funding from the Italian Internet Domains Registry, the GeoMemories project was launched with the following goals:
  • to digitally preserve and publish on the Web the historical aerial photos of the AFN archive, stressing their importance as records of the past;
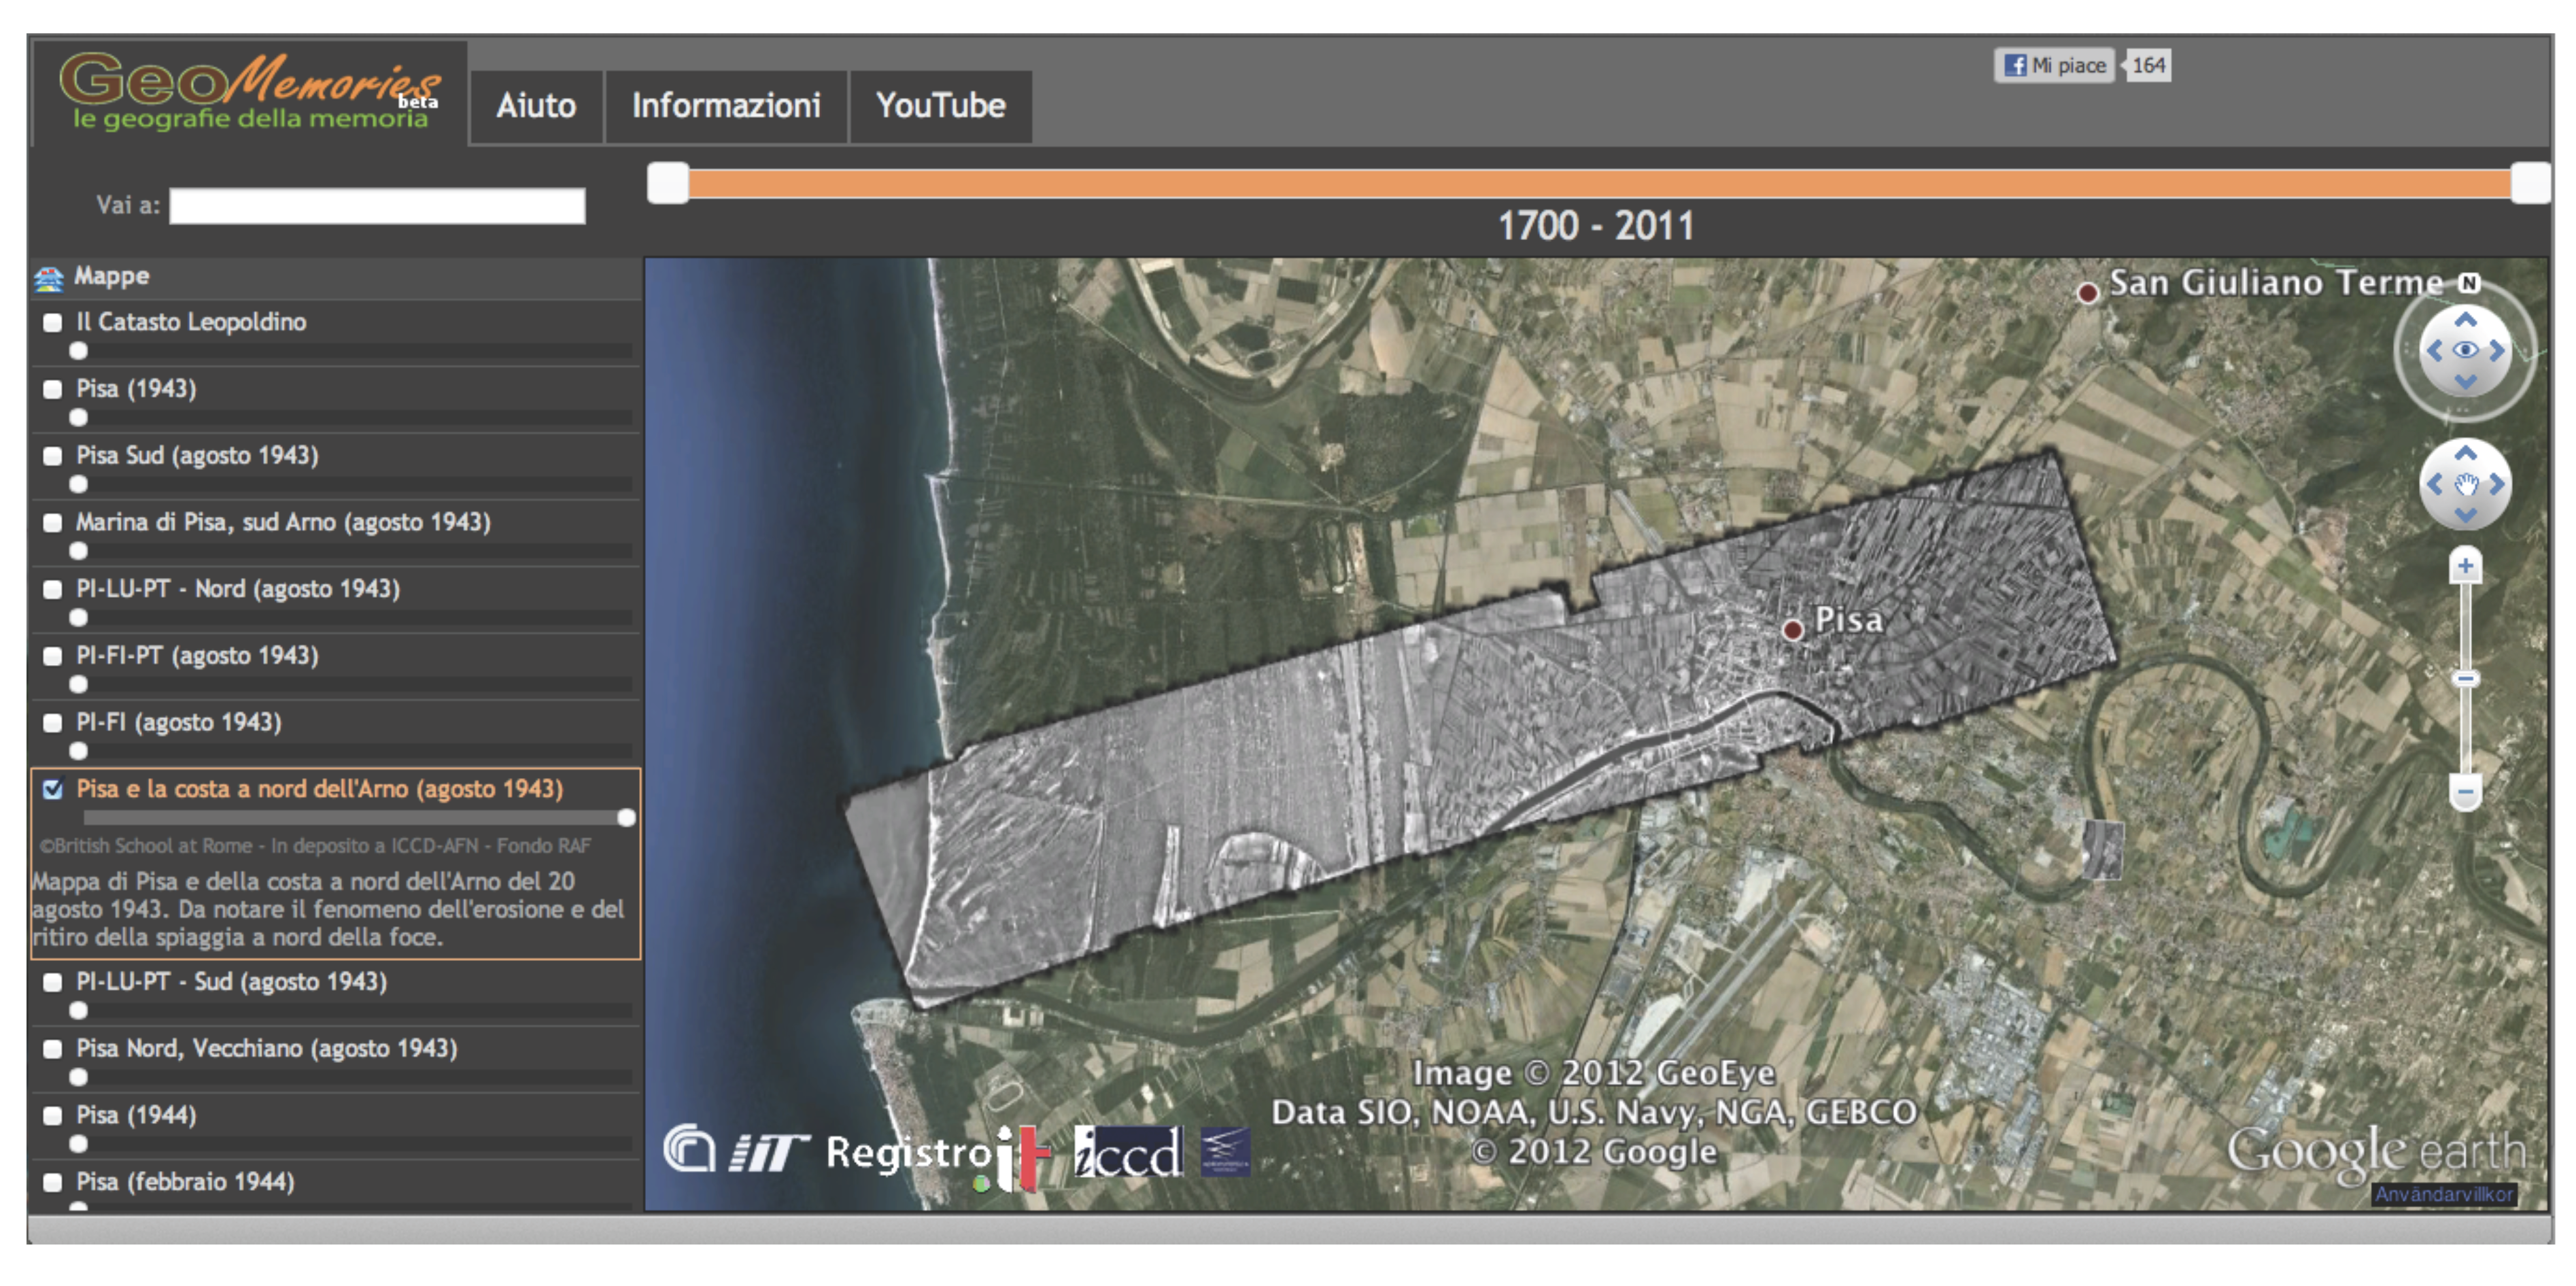
  • to implement a Web application that offers a way to “travel back in time”, visualizing the evolution of Italian landscape by comparing recent satellite imagery with maps obtained by merging the aerial photos together;
  • to collaborate with scientists (e.g., geologists, historians, archaeologists, etc.) who want to show the results of their studies to the public, and/or work with data from the AFN archive;
  • to advance the automatization of the heavy tasks (georeferencing, mosaicking, etc.) involved in all projects of this kind, by developing specifically tailored image-processing algorithms.
This paper presents our methodology, a software architecture with a prototype system implementation, as well as the results we obtained and published in two years of work. The latest version of the system is freely accessible at http://www.geomemories.org/.
The paper proceeds as follows. Background information is provided in Section 2, with details regarding Italian cartography and concepts of image processing. Related works are also presented in that Section. The AFN archive and the historical photographs are then described in detail (Section 3). Two sections present the GeoMemories system, starting by the underlying methodology and architecture (Section 4.1), and then switching to a technical focus (Section 4.2), in which implementation details are given. Section 5 describes the use of the application prototype and some case studies, with many visual examples. Conclusions are given in Section 6, followed by a discussion about work in progress and future work.

2. Background

Several reference systems and projections need to be taken into account when working with geographical data about Italian territory, due to the various updates in Italian cartography over the last century:
  • ROMA40/Gauss–Boaga East (EPSG:3004) and ROMA40/Gauss–Boaga West (EPSG:3003) became the standard for most national and regional cartography since their establishment in 1940 by the Istituto Geografico Militare (IGM);
  • ED50/UTM 32N (EPSG:23032) and ED50/UTM 33N (EPSG:23033) were adopted in 1950 following an European recommendation;
  • WGS84/UTM 32N (EPSG:32632) and WGS84/UTM 33N (EPSG:32633) are the current recommendations due to the need to globally harmonize the datum in order to support the Global Positioning System (GPS).
Another relevant projection in the context of our project is the one used by Google satellite imagery (an unorthodox spherical Mercator projection, see [8]).
The GeoMemories project envisages the use of some image-processing and computer-vision [9] techniques to improve our workflow by reducing manual effort. Feature-extraction and matching algorithms have the purpose of obtaining information from images, in order to use such information to perform a specific task. For example, they can identify relevant points that can be used for the georeferencing process or to find a match between an image and the reference map.
A common task in which feature extraction is useful is image stitching, in which different shots of the same subject are merged into a bigger image. Techniques belonging to this field are useful for automating the creation of mosaics of aerial photographs. Some commonly used algorithms are SIFT (Scale-Invariant Feature Transform), for extracting distinctive invariant features from images that can be used to perform reliable matching between different views of an object or scene [10], and RANSAC (RANdom Sample Consensus), an iterative algorithm that can be used to remove false SIFT matches [11,12,13]. The idea behind SIFT is to automatically find points that somehow stand out in the image. Such points are found by the detector regardless of scale and orientation. The algorithm matches all dominant points in one image to all dominant points in another image. A dominant point in one image causes a high response from the detector, and has a greater probability of causing a high response also in the other image. A matching step compares the pixels surrounding the dominant points in both images, in order to decide whether the points have a similar neighborhood or not. This usually involves some extra work in order to handle differences in rotation and scale between the images. The more similar the neighborhoods, the higher the response in the matching. This is used to determine tentative corresponding points. Even the best matchers make mistakes, so not all tentative matches are true matches (inliers). False matches (outliers) need to be removed by RANSAC, i.e., the red crosses in Figure 1 are to be removed, while the green ones are inliers.
RANSAC is one of the most frequently used algorithms for separating inliers from outliers. The algorithm starts by randomly selecting the minimal number of points required to determine the projective transformation between the images (a homography) [14,15]. The set of correspondences is scored using this transformation, so that the number of inliers that falls below a certain predefined tolerance E is
computed. This means that when transformed, those points are close enough to its corresponding match and are thus regarded as inliers, while the rest are considered outliers. This process is repeated until the probability of finding a better transformation is lower than some predefined threshold.
Figure 1. Two photos with feature points shown as crosses. The green ones are found to be corresponding points (matching points) by the algorithm. The red ones are false matches and are not used for stitching (©MiBAC-ICCD, Aerofototeca Nazionale, fondo RAF).
Ijgi 02 00432 g001
Other relevant image-processing techniques are the ones used to perform change detection tasks. By automatically analyzing differences between photos of the same location taken at different moments in time, such methods can provide a quantitative measure and a visual representation of the changes in landscape (see Figure 2).
Figure 2. An example of the result obtained by running an automatic change detection algorithm on the first two images, representing the outskirts of Pisa in 1954 and 1968. Urban expansion over 14 years is highlighted in red in the picture on the far right (©MiBAC-ICCD, Aerofototeca Nazionale).
Ijgi 02 00432 g002
Finally, image classification algorithms are capable of automatically associating an image with a category belonging to a predefined set of categories. For example, they can identify whether an aerial photo shows a coastal line, some farmland, or a city. All the described techniques are currently being investigated and experimented with in GeoMemories.
Studying the changes in landscape through analysis of historical aerial photos is clearly not a novelty: recent works on the topic are found in literature [16], also covering the Italian territory [17,18]. These works are based on photos from flight campaigns held in 1930 (SARA—Societ Autonoma Rilevamenti Aerofotogrammetrici), from 1943–1945 (IGM-Istituto Geografico Militare, and RAF-Royal Air Force), and from 1954–1955 (GAI-Gruppo Aereo Italiano), combined with recent imagery. Given their focus on obtaining novel scientific results in the analysis of landscape, a public presentational infrastructure is not considered in such works.
Instead, making cartographical archives freely accessible to citizens and experts of the territory is the main goal of initiatives such as the geoportals of each Italian administrative region—e.g., those of the Regione Veneto (http://mapserver.iuav.it/website/foto aeree/) or Regione Sardegna (http://www. sardegnageoportale.it/)—and the national portal by IGM (http://www.igmi.org/voli/). Such applications clearly follow a growing trend of administrations and national archives to open their data to the public.
Furthermore, to let users freely and intuitively navigate maps is the key to successful services and applications such as Google Maps (http://maps.google.com) and Google Earth (http://www.google.com/ earth/index.html), Bing Maps (http://www.bing.com/maps/) or MapQuest (http://www.mapquest.com/). Even navigation in time is not a new feature, and is found in Web applications about cultural heritage such as Historypin (A global community collaborating around history http://www.historypin.com/), or historical atlases such as Conflict History (Browse the timeline of war and conflict across the globe http://www.conflicthistory.com/). Map representations are also becoming increasingly used for Web storytelling, e.g., Story maps by ESRI (http://storymaps.esri.com/home/). However, historical maps covering significant amounts of territory are still rare in these systems. Since version 5.0, Google Earth includes a timeline to display historical imagery. This new feature has some important limitations, in particular, most of the Google images are from satellites and are relatively recent. Italy, for example, has significant coverage only from 2003. The only samples of actual historical images (1943) concern some large cities (Rome, Florence, Naples, Turin, Trieste and Venice) and the image resolution is very low.
The GeoMemories vision came from the combination of the aforementioned approaches and topics: the rigorous study of landscape change, the field of aerial photointerpretation, open data and cultural heritage initiatives and intuitive and far-reaching Web applications.

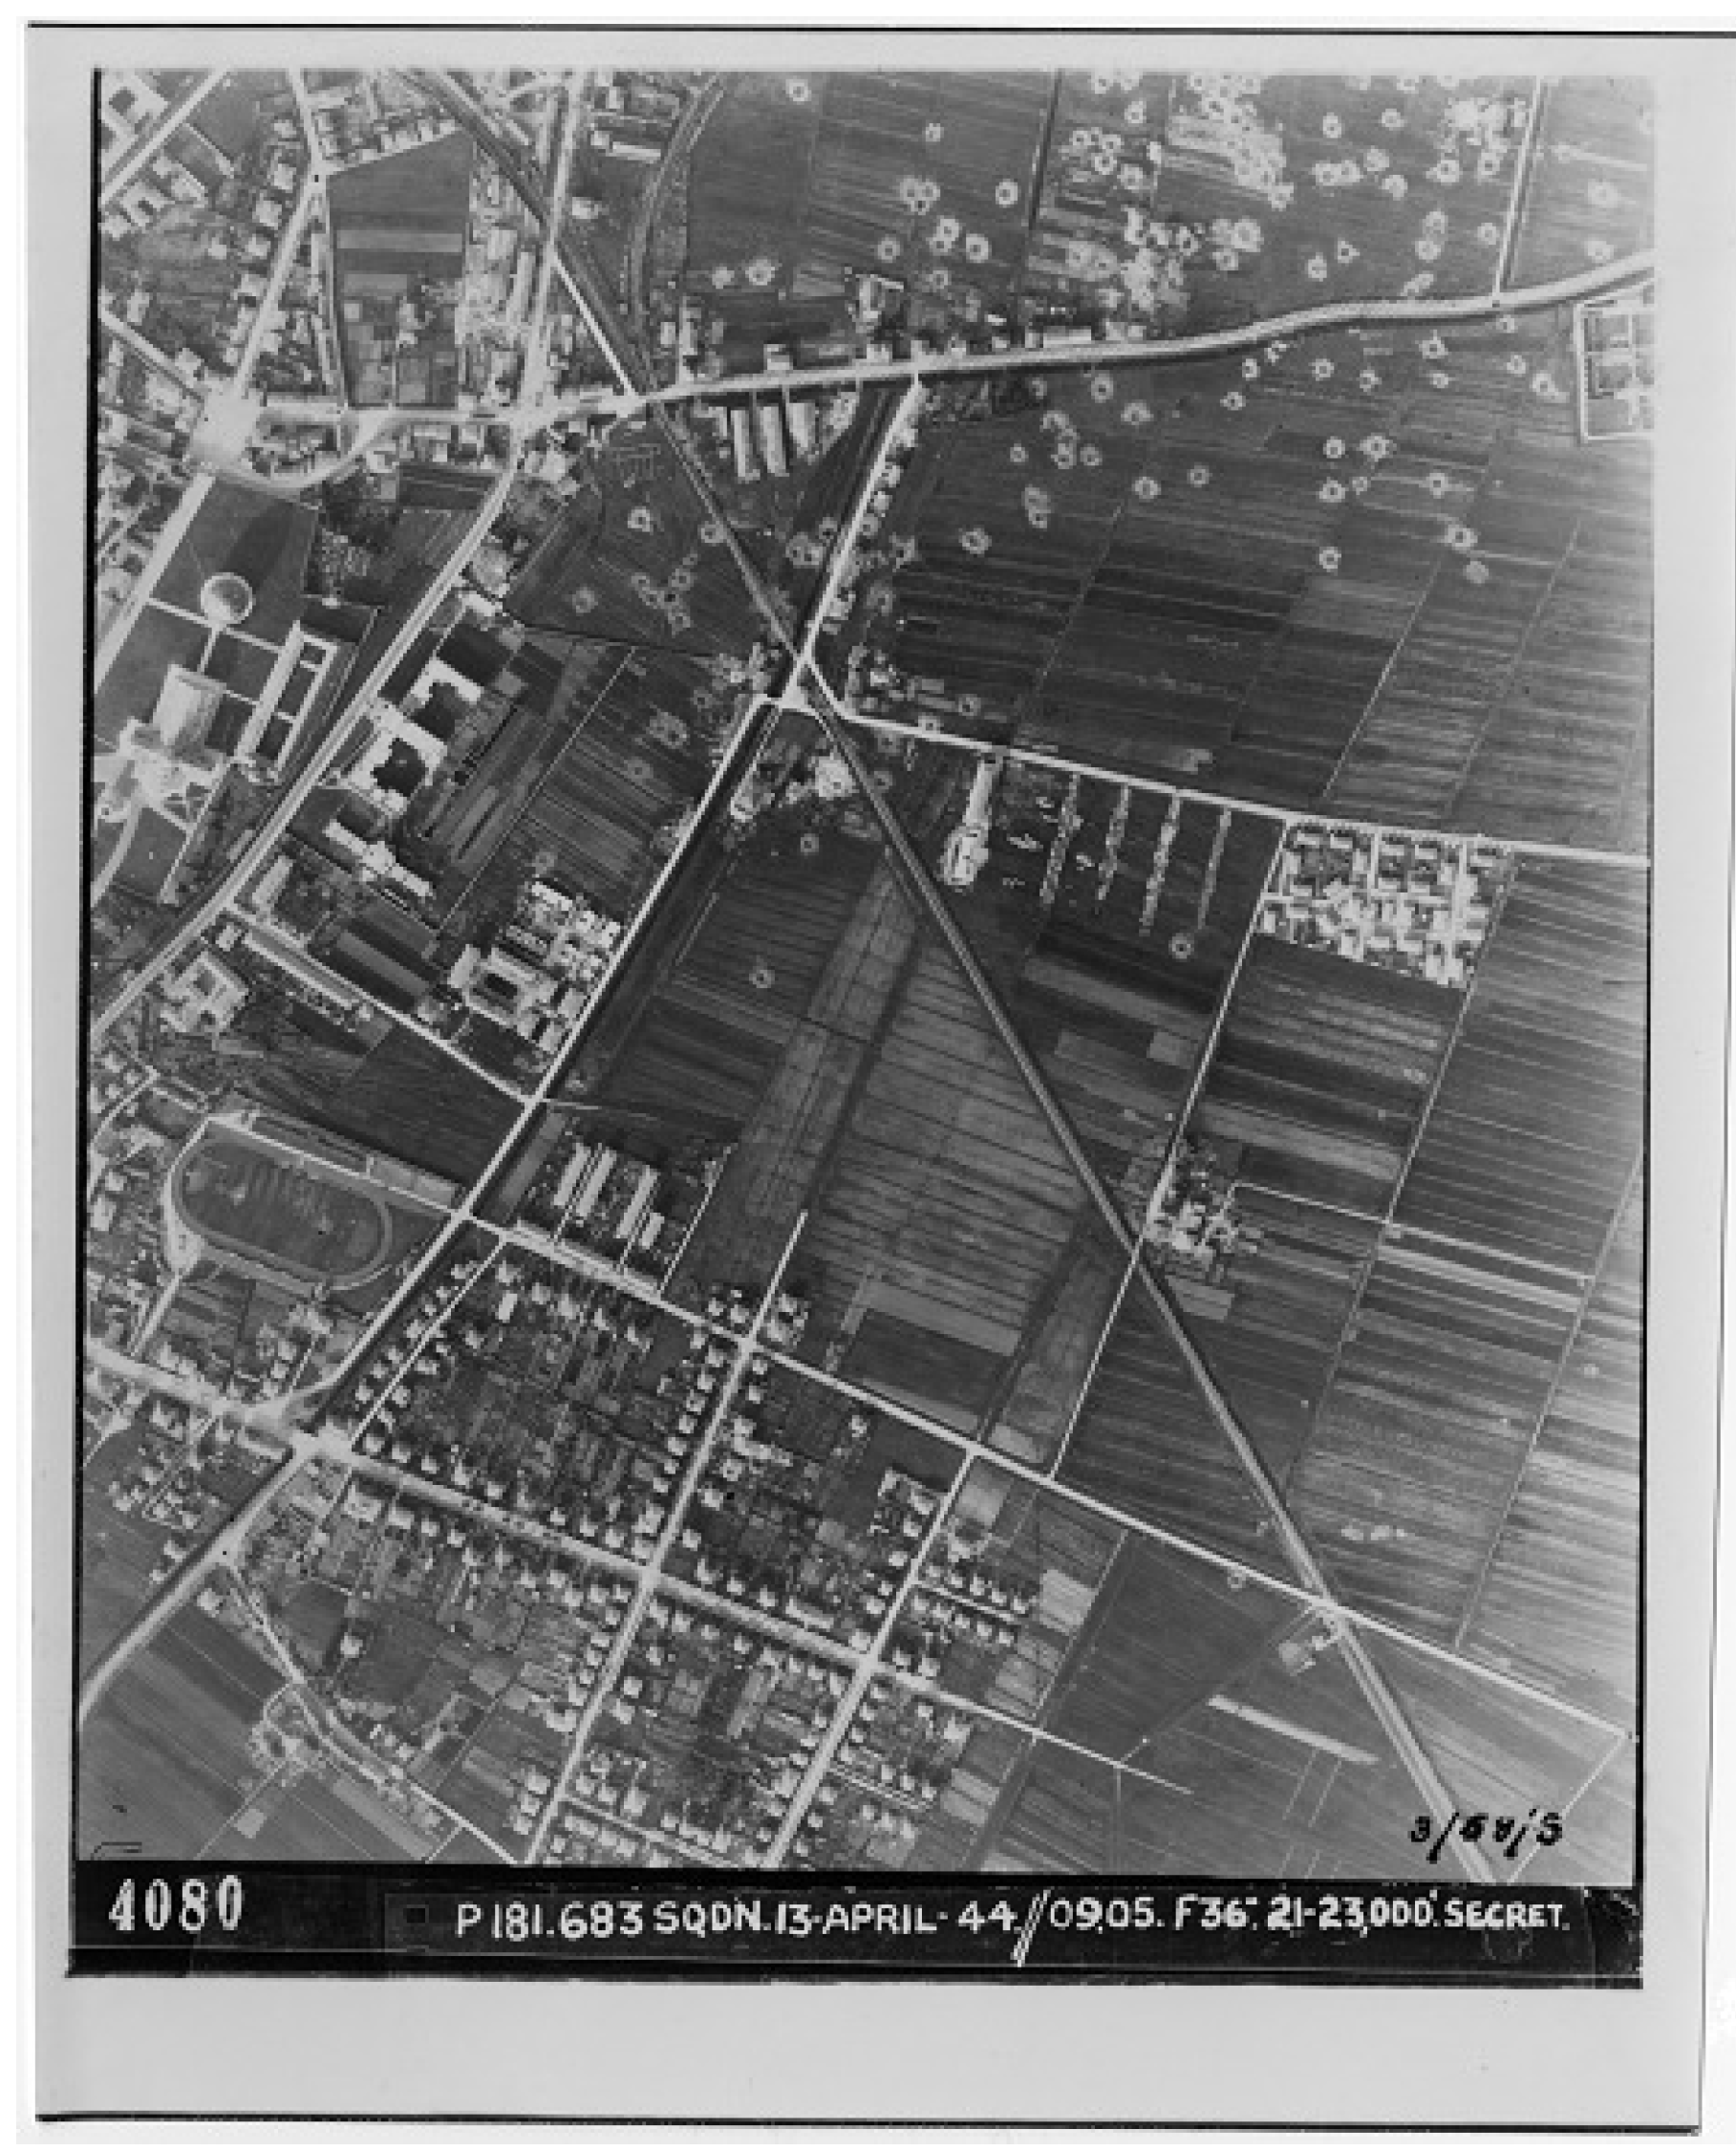
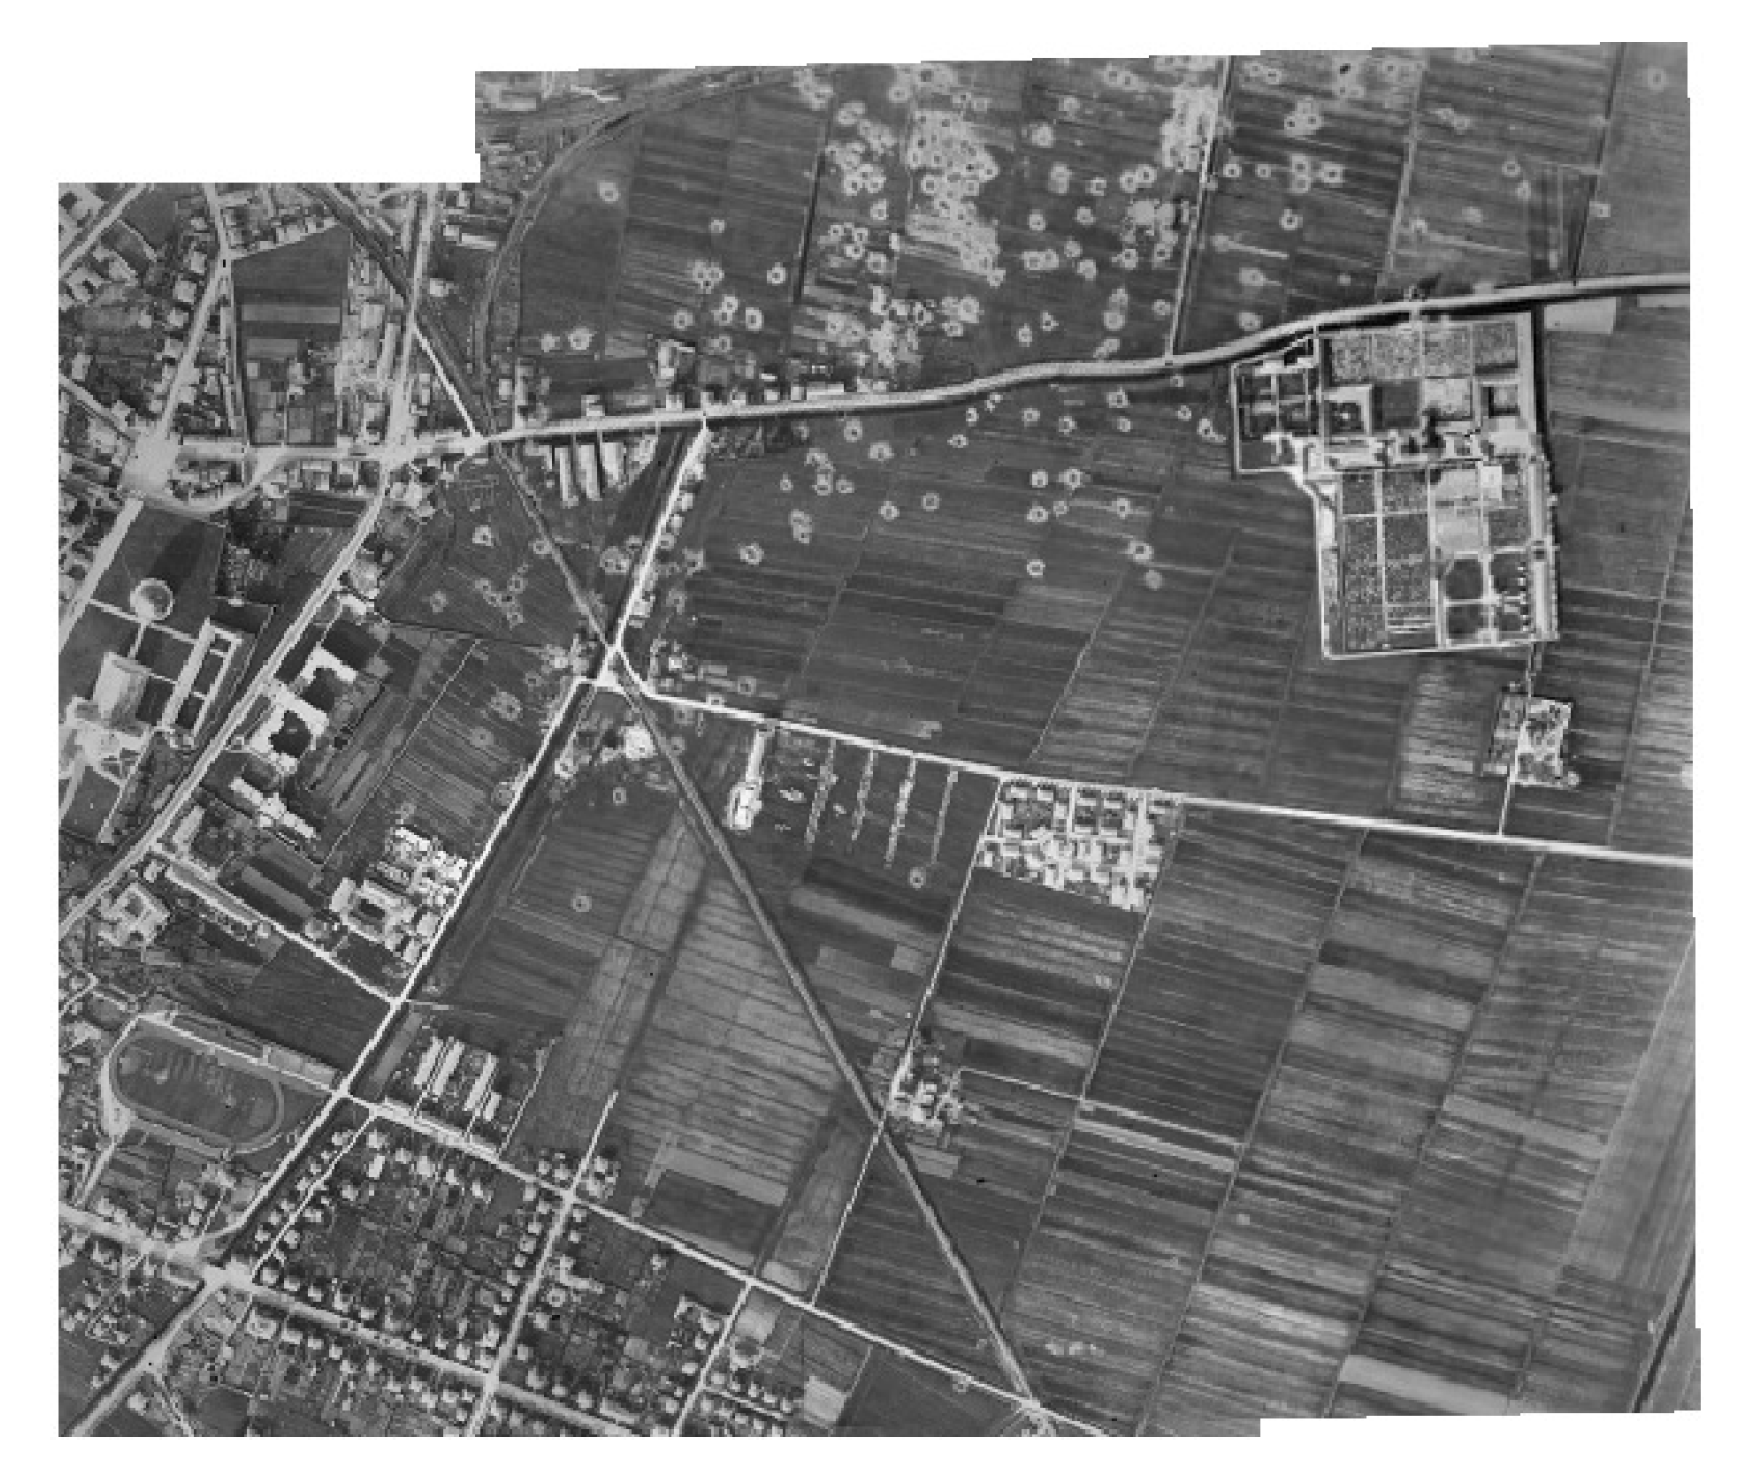
3. The Historical Photographs

The archive at AeroFototeca Nazionale holds more than two million physical photographs organized in 29 different collections. This enormous amount of positives, films and slides is only partially indexed, mostly in physical books. This makes it very difficult to tell which portion of the landscape is portrayed, unless the photo at hand is already listed in the AFN electronic index. In the index, each record provides an estimate of the region covered by the photo, which is derived from a coarse-grained georeferencing of the image done by AFN photointerpreters. Unfortunately, the electronic index only contains about 130,000 records, of which only 5,275 (about 4%) correspond to photos that are already available as digital images. Each collection has its own peculiarities, but we mostly focused our study on the RAF (British Royal Air Force) collection, which covers about 74% of the entire electronic archive. Another relevant collection is VB (Volo Base-1954-55), about the 13% of the archive.
RAF photographs constitute a relevant case study for a spatio-temporal analysis. A preliminary survey carried out on the AFN electronic index showed that the collection covers a significant amount of Italian territory (Figure 3), spanning a time frame between 1943 and 1945, when Italy was occupied by German and Allied forces during World War II.
Figure 3. The RAF collection coverage of Italian territory is shown on the left. The yellow area is computed as the union of the regions covered by each photo. Only records that are in the electronic index have been reported in this map. The estimate of the coverage will improve as soon as new physical photos are digitized and georeferenced. On the right, the areas covered by our system at this time.
Ijgi 02 00432 g003
The vast majority of RAF photographs are vertical photos, i.e., taken vertically from airplanes, while a few of them are oblique, i.e., taken at an angle. The scale of the images is usually between 1:6,000 and 1:50,000, while the main formats of the positives are 24 × 24 and 18 × 24 cm. The vertical photos were taken from RAF airplanes during different passes, with the goal of obtaining a map of the territory. This procedure is very similar to the modern mapping procedure, except that RAF flights were not necessarily oriented towards cardinal points, did not maintain a constant altitude, and sometimes deviated from their course (for example to dodge anti-aircraft bullets). All those problems make orthorectification and georeferencing very complex.
Most of the positives present a strip in which the date, the original number of the frame, the focal length of the camera and the average altitude maintained during the flight are reported. Some photographs, however, deteriorated over time and their data strip is no longer readable. For a large number of positives, the orientation or even the area portrayed or the date are unknown. A problem common to almost all the images is uneven illumination, due to the quality of the cameras used or to flares coming from bright reflective objects on the ground. An example of a RAF vertical photo is shown in Figure 4, where the aforementioned information about the flight is visible.
Figure 4. A digitized RAF photo, with information about the flight at the bottom: It was taken at 9:05 AM on 13 April 1944, from an altitude of 21–23,000 feet, with a camera having a focal length of 36 inches. The negative has the progressive number 4080. The famous leaning tower of Pisa and the Duomo are visible on the left (©MiBAC-ICCD, Aerofototeca Nazionale, fondo RAF).
Ijgi 02 00432 g004

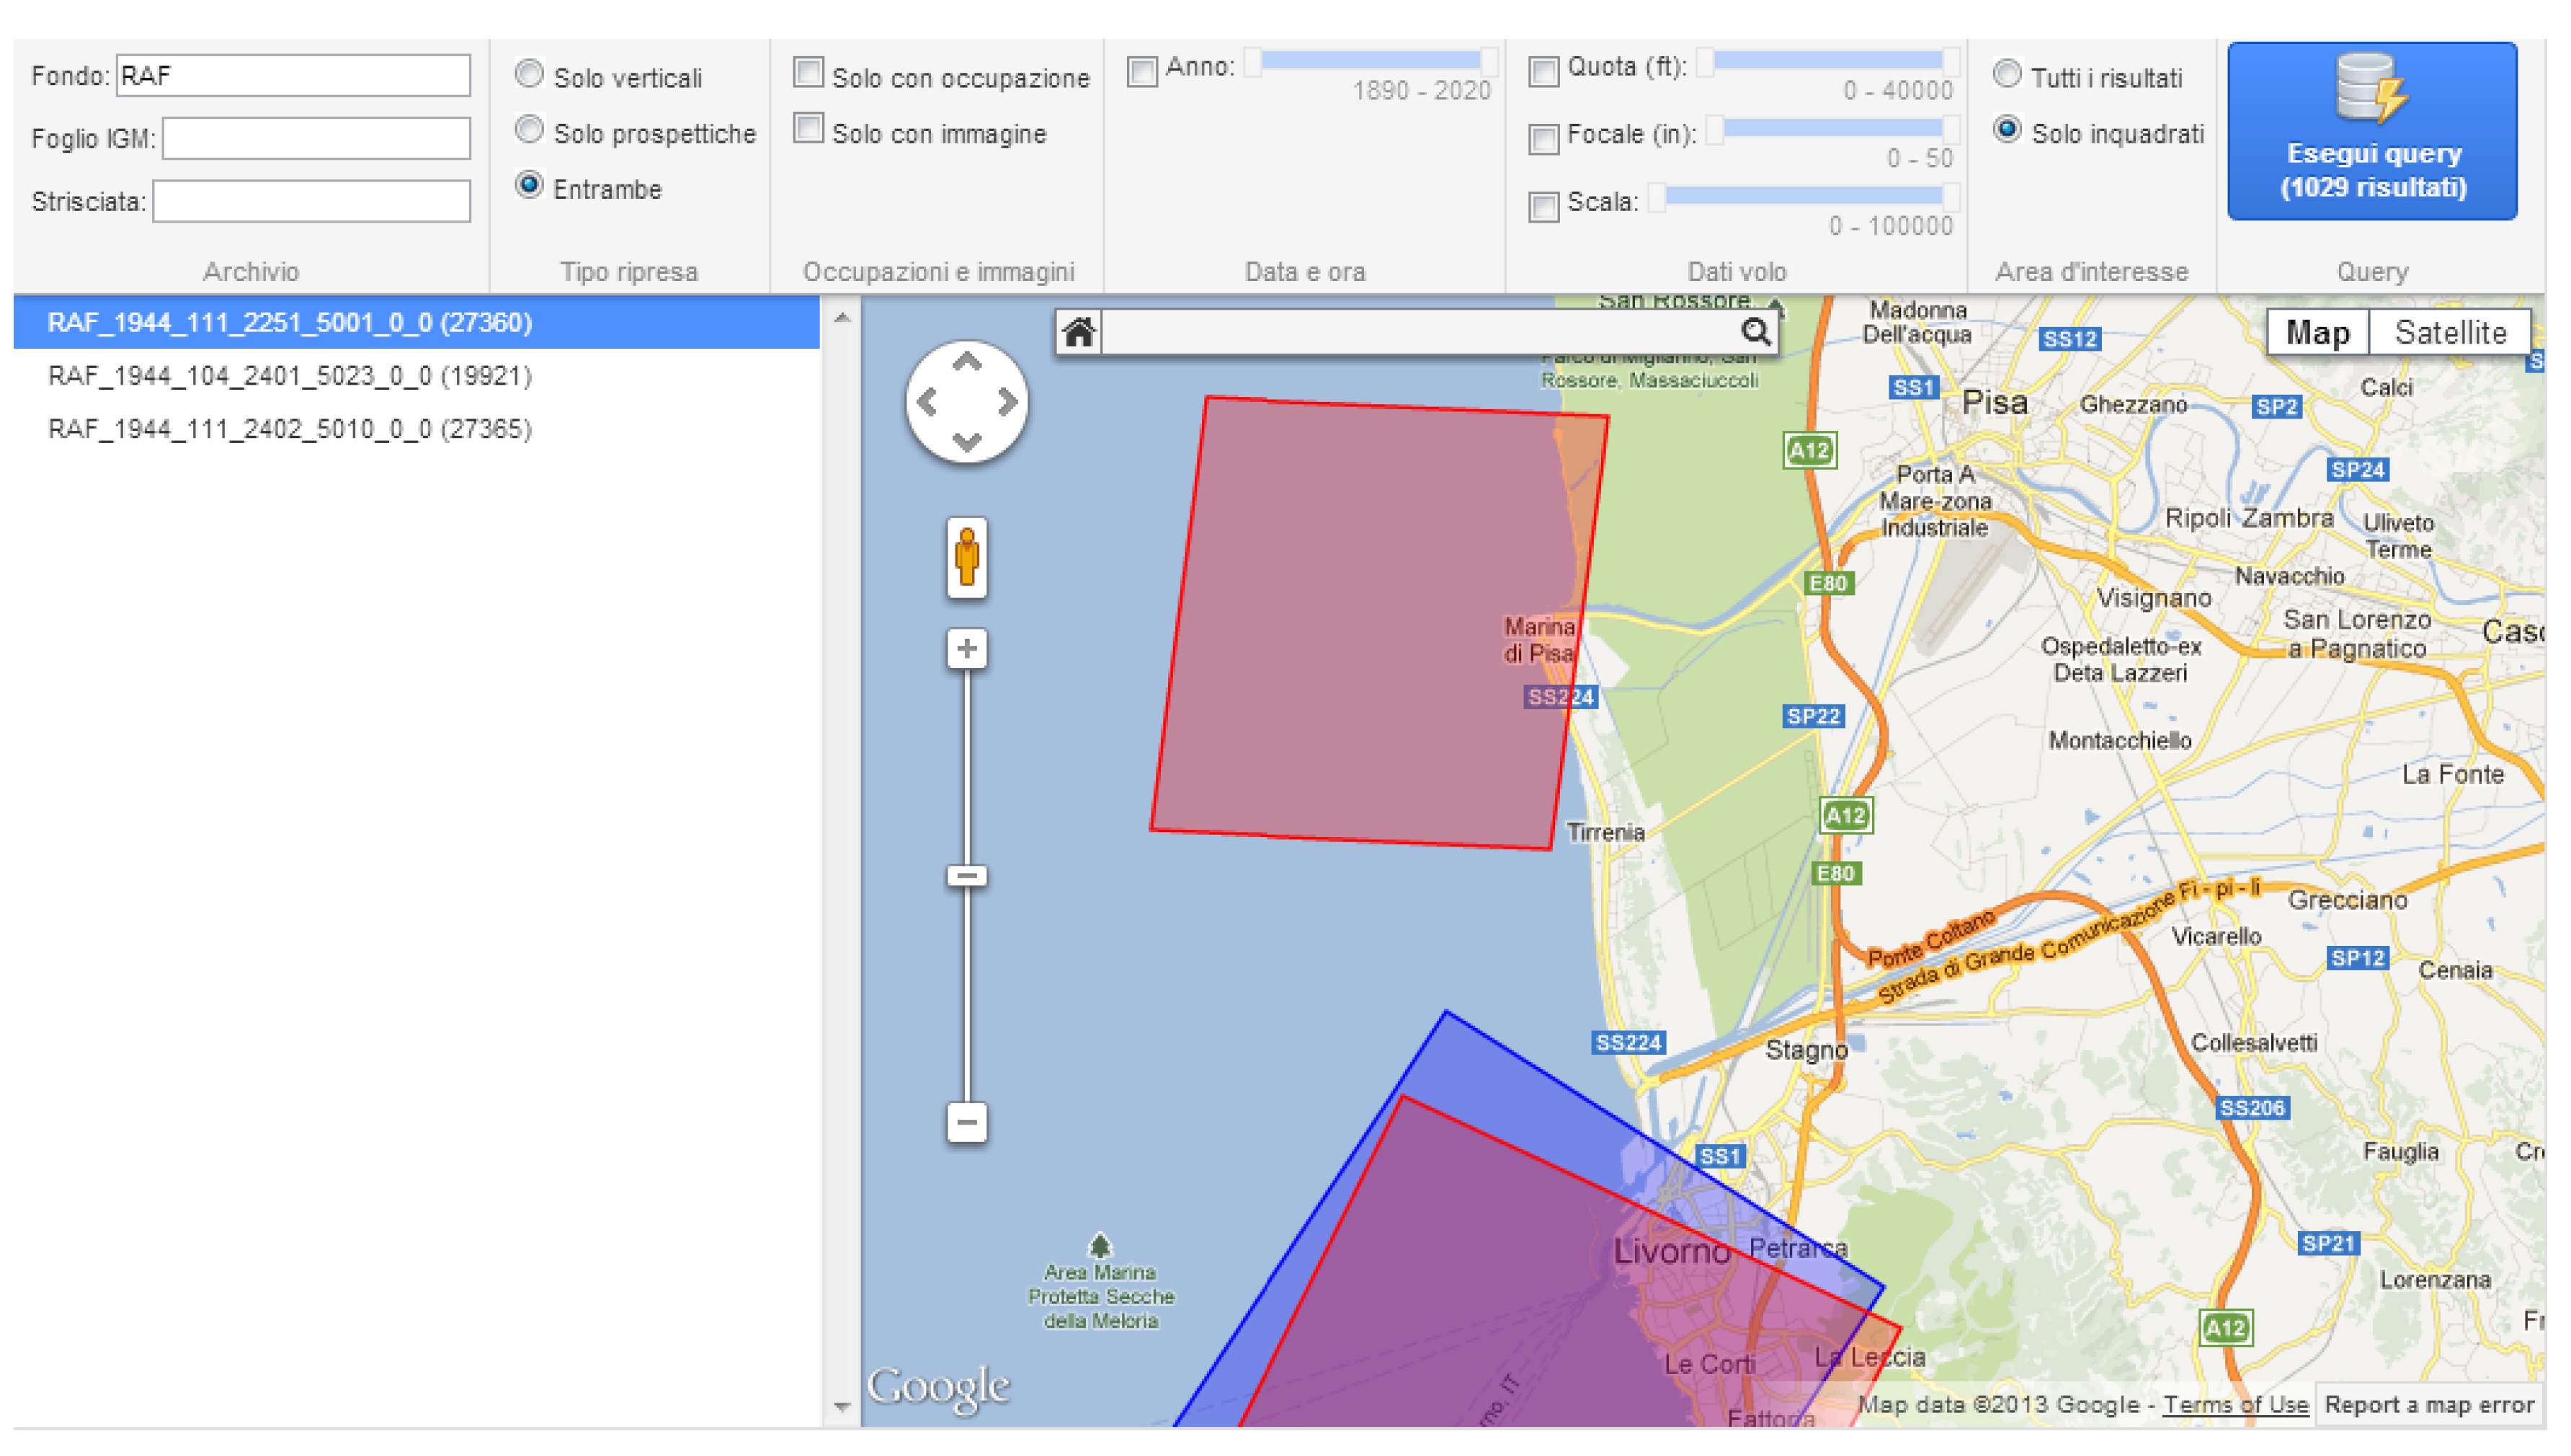
4. The GeoMemories System

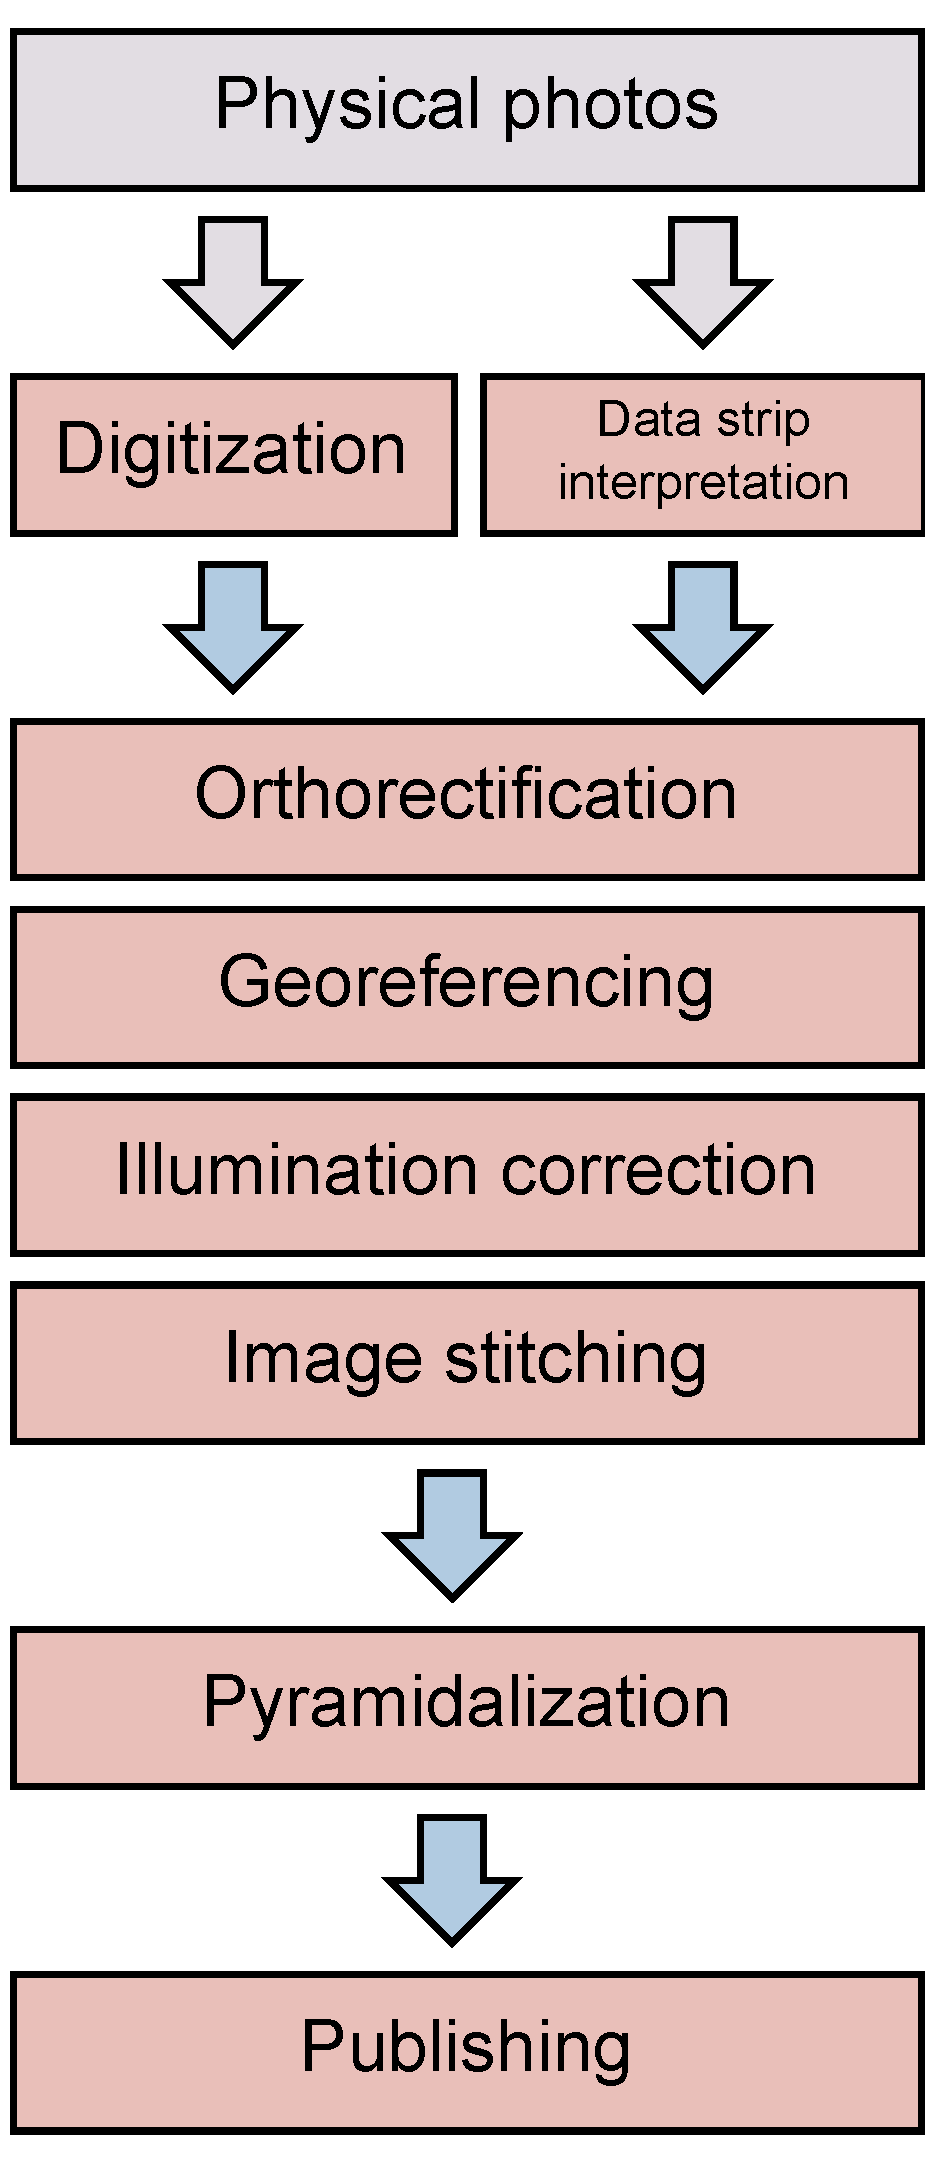
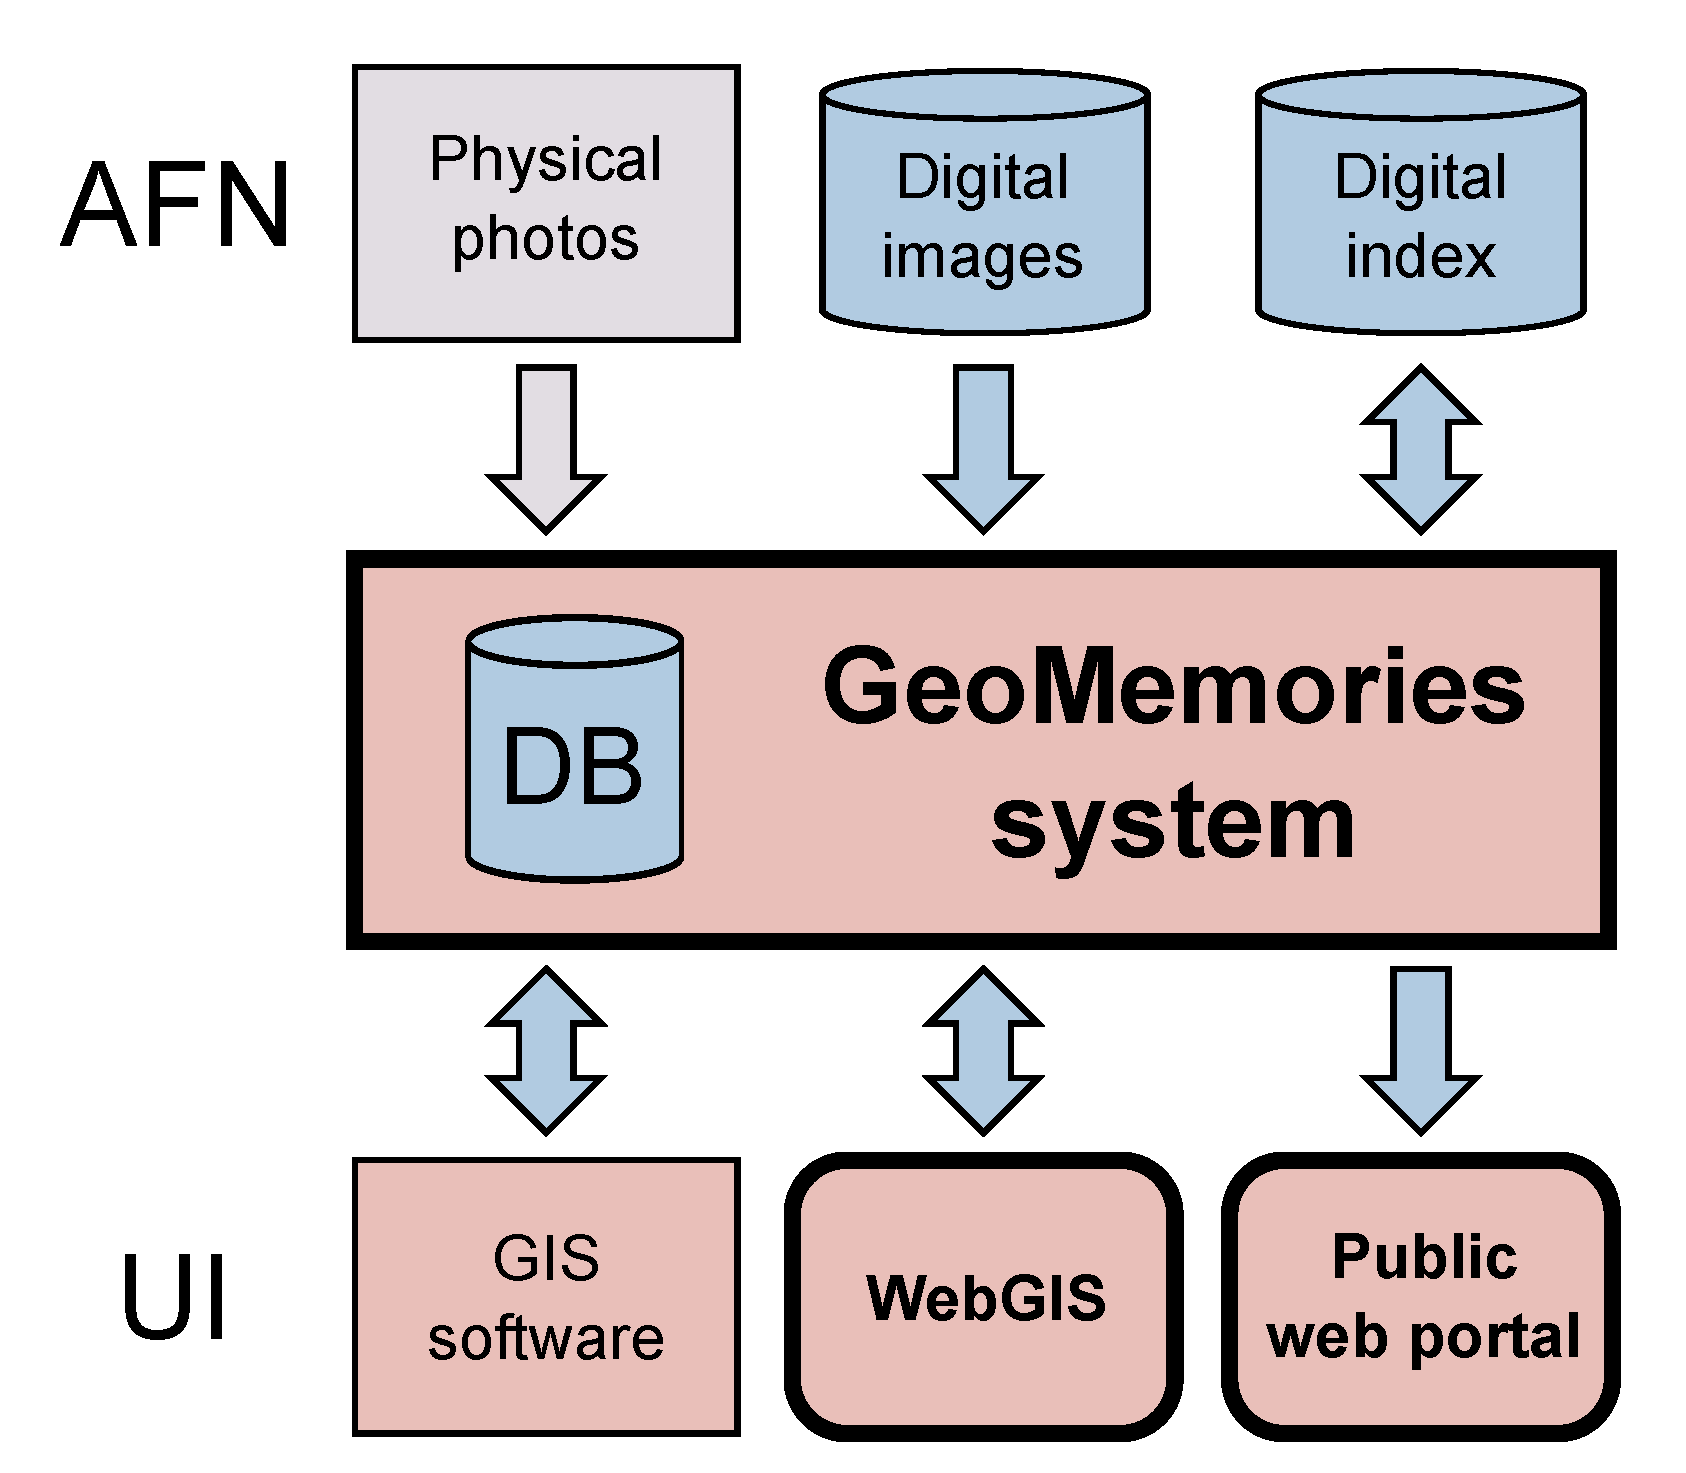
4.1. Methodology and Architecture

Aerial photos are generally available in sets, where each set is composed of photos taken during one or more passes. These photos are overlapped in order to completely cover all the territory spanned by the airplane. To obtain maps like those available in Google Earth or other GIS applications, we need to digitalize the photos and stitch the images together. This is accomplished by means of stitching algorithms, mentioned in Section 2. The result is an overall image, called mosaic, which is georeferenced by binding a set of image points to their corresponding points in a reference map, in our case the maps of Google Earth. This operation allows the positioning of the mosaic in the appropriate place, so that it is possible to see how an area has changed at different times. The size of the mosaic image is generally too big to be handled efficiently. Thus the image is pyramidalized: it is divided into smaller tiles at different resolutions so that a limited set of small tiles are loaded each time. The whole procedure is shown in Figure 5.
Figure 5. This picture summarizes the entire working process (manual, automatic and semi-automatic steps) from original photos to Web publication. The four blocks in the middle are steps that can be merged or performed in a different order, depending on the actual procedure.
Ijgi 02 00432 g005
In order to reach a vast audience of both experts and end-users, we chose to design and implement a Web-oriented architecture. The photos and electronic index of the AeroFototeca Nazionale constitute the input of the GeoMemories system. The system offers interfaces to GIS software, a WebGIS UI designed and implemented specifically for the project, and the GeoMemories public web portal (see Figure 6).
As a first step, the digital index from AFN was imported into a newly designed database, in which geospatial data is handled with state-of-the-art technology and standard formats. An export functionality is provided, to keep backwards compatibility with existing tools. A WebGIS application (see Figure 7) has been implemented to query and manage this new database. A dedicated interface is also provided to handle new artifacts created within the GeoMemories system, such as georeferenced images, mosaics and map descriptions (see below).
While the digital databases of AFN provided a good starting point for the project, the vast majority of the photos remained to be digitized. We therefore conducted an analysis to define which resolution was the best trade-off between quality and disk size, while keeping in mind our digital preservation objective. First, a very detailed photo showing a portion of the center of a town, thus with a high informative content, was chosen. The image was acquired at 2,400 dpi, then resampled in software to 1,200, 600, 300 and 150 dpi. From each of the resulting images, an interpolation process was used to generate a new image at 2,400 dpi. Next, these interpolated images were compared visually and numerically to the original, 2,400-dpi image. The comparison indicated that most of the informative content is preserved when using a resolution greater than 1,200 dpi. A visual analysis showed that the loss of resolution between 600 dpi and 1,200 dpi does not correspond to a real loss of information, since the main differences in the image were related to imperfections caused by dust or scratches. We decided to acquire the photos at 600 dpi, to avoid storing unnecessary information within the database: A typical 24 × 24 cm photo acquired at 2,400 dpi would have weighted about 490 MB, whereas the same photo digitized at 600 dpi weights 31 MB. A newly digitized photo was then analyzed by experts of the archive, in order to extract metadata from the data strip (see Section 3), and to roughly determine the location portrayed. This step should also provide North-oriented digital images, to simplify the fine-grained georeferencing work that comes next. This manual analysis represents a critical point of the workflow. Some photos could prove to be very difficult to work with.
Figure 6. The GeoMemories architecture. Data from AFN archives is processed and stored in an internal database, then the results are made accessible by different User Interface modules. Thick lines denote modules developed within the context of the project.
Ijgi 02 00432 g006
Figure 7. A screenshot of the interface of the custom WebGIS system developed for querying the GeoMemories archive.
Ijgi 02 00432 g007
The temporal coordinates of the shot, interpreted from the data strip, are modeled taking uncertainty into consideration. Because of this, some photos are stored in the GeoMemories database associated with a time frame rather than with a single instant. Such metadata is either manually entered in the data entry interface of the WebGIS or used to inform the subsequent steps of the workflow.
In order to create good-looking maps of the landscape, covering more than the region portrayed in a single photograph, groups of adjacent photos are georeferenced and stitched together to create the so-called mosaics. Each digitized photo is cropped so that the borders containing information about the flight are removed and just the photo of the ground remains. The original images are, of course, also preserved in the database without alterations. Furthermore, the illumination is corrected [19] to eliminate any differences in exposure. Without this correction, there would be abrupt changes in light intensity visible in the transition from one photo to another in the stitched images [15]. Hence, it is important that the individual photos have a similar overall intensity in order to be able to perform a good blending [20] between photos that are overlapping.
The photo shown in Figure 4 presents an example of uneven illumination: the photo is darker in the middle and brighter towards the edges.
Due to the angle between the airplane and the ground, the images contain perspective distortions, which are removed by orthorectification [21]. This usually includes georeferencing [22], where key points are matched to a modern map so that corresponding points are established. In order to achieve the intended blending effect of the fader control in the public web portal (see Section 5), a photographic correspondence to a modern satellite image is sought. Because of their availability and popularity, Google imagery was chosen as a cartographic base.
We adopted a photogrammetric approach, using images with a longitudinal overlapping (stereographic pairs). For each pair of images A and B, at least four ground control points (image to reference map matches) and six tie points (image A to image B matches) were manually found by a photointerpretation expert. We obtained a Root Mean Square Error (RMSE) for ground control points below 2. By defining a few check points (i.e., points that are not used for computing the triangulation), we obtained a maximum planimetric error below 6 meters in x and y, and a maximum elevation error of about 9 m.
Orthographic corrections were performed by using a DTM with 20 m step, supplied by the Istituto Superiore per la Protezione e la Ricerca Ambientale (ISPRA). Resulting georeference data is stored in the GeoMemories database using WGS84/UTM 32N and WGS84/UTM 33N, the latest recommendations for Italian cartography (see Section 2). As a result of this step, the corrected images could be stitched together [23,24] to form a map covering the whole area of each individual flight.
Along with the manual approach, the system provides a parallel series of procedures aimed at experimenting in the automatization of heavy tasks such as georeferencing and mosaicking the images. These procedures include finding key points (feature points [25]) using some feature detector (SIFT, SURF [26], etc.) in the images, and finding the true matching points using RANSAC or similar methods [27,28], which remove any false matches. All these algorithms are commonly used in the field of computer vision (see Section 2). SIFT was chosen as it is robust, invariant to uniform scaling and rotation and, to some extent, to illumination changes.
Feature points can be extracted from a photo by using some corner detectors such as the Harris detector [25] or blob detectors such as Difference of Gaussians (DOG), which is used by SIFT or the determinant of the Hessian Matrix used by SURF. Because of its random nature, the result from RANSAC may differ in each run, which means that some inliers might not be found. This is something we are currently working with and we aim to change RANSAC so that it always finds the optimal set, i.e., all inliers in every run. Figure 1 shows how tie points are found in two images (on the left is the same photo in Figure 4, with corrected illumination) that have an overlapping area. The green crosses are points that are found to be matching, i.e., corresponding, while the red crosses are feature points that did not match.
Transformations between images [14] are computed from the true corresponding points so that images can be aligned and blended together using the bundle-adjustment [29,30] approach to form the final orthographic map. An example of two photos (the ones in Figure 1) being stitched together is shown in Figure 8.
Other methods exist for image alignment, such as phase correlation [31,32]; however, for georeferencing, it is necessary to obtain some key points and it is often practical to use the feature points obtained, for instance, by SIFT or SURF. Additional key points can also be inserted by the user to assure that the final map is as correct as possible.
Mosaics resulting from our processing, with a byte size too high to be directly served to a Web client, then undergo a step of pyramidalization: the single high-resolution mosaic is converted into many small images (tiles), and each one is sent to the browser only if necessary, i.e., only if it falls into the viewport of the application. In order to support an overview of the map (i.e., low zoom levels), tiles are partitioned in groups of four (2 × 2), then each group is merged and converted into an image with less resolution. When the map is seen from “high above,” instead of loading all the original tiles, fewer tiles with a suitable resolution are loaded.
Figure 8. Two photos are stitched together using the transformation computed from the corresponding points (green crosses in Figure 1) in the overlapping area. (©MiBAC-ICCD, Aerofototeca Nazionale, fondo RAF).
Ijgi 02 00432 g008
Pyramidalized mosaics are then manually loaded into a specific part of the database from which the Web portal loads the list of available features. This last step is the one in which a hypertextual description
is added that can also feature videos, additional photos and clickable links leading to interesting spots of historical maps. In order to support the large ecosystem of GIS software, we decided to adopt a geospatial database and a framework exposing commonly used GIS libraries and tools. Detailed information about tools and software is provided in the following section.

4.2. Technical Focus

The GeoMemories system comprises many different software programs with purposes ranging from reference systems management to web UI rendering. Server-side code is held together by extensive use of the Python programming language (http://www.python.org), which offers a large amount of bindings for GIS-related libraries. We chose to leverage the GeoDjango web framework (http://geodjango.org/), which addresses both the problems of working with geographical data and interacting with a browser client. The framework has proven to be a good choice, giving our Python code the ability to issue geospatial queries to the spatial database PostGIS (http://postgis.net/), and offering the possibility of handling standard data formats such as GeoTIFF and KML and converting between different coordinate systems. Python scripts were used to import the data coming from the AFN legacy database that was created using Microsoft Access, and to load miscellaneous data such as the coordinates of IGM areas (see Section 2), which have been translated from ROMA40/Gauss–Boaga using the Traspunto (http:// www.mondogis.com/traspunto.html) software. The scaffolding interface of GeoDjango was customized to serve as the data entry user interface, and the framework was also used to build a web API, providing JSON (http://www.json.org/) and KML data to the clients.
Both the WebGIS and the GeoMemories public portal we developed make extensive use of the AJAX technology to load data from the server asynchronously, i.e., without reloading the whole page. User interface components were created by leveraging jQuery (http://jquery.com/) and jQuery UI (http://jqueryui.com/) technologies. The map of the GeoMemories public portal was implemented using the Google Earth Plugin and API (https://developers.google.com/earth/), which offers a ready-to-use functionality for controlling the blending of an overlaid image with the underlying satellite map. This feature could be re-implemented with a reasonable effort using more up-to-date technologies such as the Google Maps API (see Section 6). The WebGIS map, which did not need this blending capability, was implemented using the Google Maps API instead.
The image-processing code we are developing is written in Matlab® so far. The RANSAC code was developed using the algorithms provided by Peter Kovesi on his homepage [33]. At the moment, we are porting this code to Python and we aim to make it publicly available soon. The georeferencing, reprojection, and mosaicking software that has been used is a combination of custom-made code written in Java, mainly adopted when working with medium-sized mosaics, and of commercial suites like ERDAS IMAGINE and LPS, that help us when dealing with expansive groups of tens of photos. The pyramidalization of the mosaic imagery, which turns a big image in a file system hierarchy of JPGs, PNGs and KMLs, was made with Maptiler (http://www.maptiler.org/), aided by some custom-made scripts to handle image transparency in various corner cases we encountered.

5. Application Prototype and Case Studies

The current version of the GeoMemories application is shown in Figure 9. When the application starts, a globe is shown, and the navigation works the same way as in Google Earth. However, in addition, users can select the time frame they are interested in by moving the big slider on top of the map. By doing so, the list of available maps for the specified time frame (visible on the left) is updated. Users can select which maps they want to be overlaid on the Google Earth map and blend them by using a slider. In the figure, only one map is shown, which is composed of photos taken from one flight made in August 1943 by the British RAF over Pisa in Italy. The user can select several maps that will be overlaid, and the blending can be controlled separately for each one.
The description of the selected content that is shown on the left part of the interface can also contain images, videos and links. A special type of link, shown in green, is used to center and zoom the map on the described detail. By reading the text and clicking these links, users can follow a tour that leads them to discover interesting spots on historical maps.
Figure 9. The GeoMemories application. Note the Google Earth navigation tools on the right, the slider to select a time frame on top, and the historical map selector on the left. One historical map is chosen, which is composed of several photos taken by RAF during a flight in August 1943 over the city of Pisa in Italy. (©MiBAC-ICCD, Aerofototeca Nazionale, fondo RAF. ©2010 Google).
Ijgi 02 00432 g009
The changes in the territory occurring over time can be visualized by fading the old photo in or out with the modern photo as a background. A closeup in Figure 10 shows the historical map selector, where a map from 1944 was chosen and partially blended. In the upper corner on the right, it is possible to see how the farmland is transforming into the modern urban landscape of the city of Pisa.
Figure 10. A closeup of the application showing how one map from 1944 was chosen and additional information about that map (in Italian) pops up. The slider can be used to blend the overlaid map with the Google Earth map. The green links can be clicked to navigate to the described portion of the map. (©MiBAC-ICCD, Aerofototeca Nazionale, fondo RAF. ©2010 Google).
Ijgi 02 00432 g010
The two maps being blended are shown in Figure 11, where the modern buildings of Via Angelo Battelli and Via di Pratale are visible. On the left is the old farmlands overlaid, where Via di Pratale crosses from left to right at the top. One can see that it really was what its names implies, namely a field, which in Italian is prato.
Figure 11. A closeup of the two maps that are blended together in Figure 10. New buildings now cover the old farmlands. (©MiBAC-ICCD, Aerofototeca Nazionale, fondo RAF. ©2010 Google).
Ijgi 02 00432 g011
The following part of this section presents a series of case studies that shows the ability of GeoMemories to display the changes in territory by image comparison. It also showcases examples of collaboration with experts in the field of historical photointerpretation, exploiting the potential of the GeoMemories system.

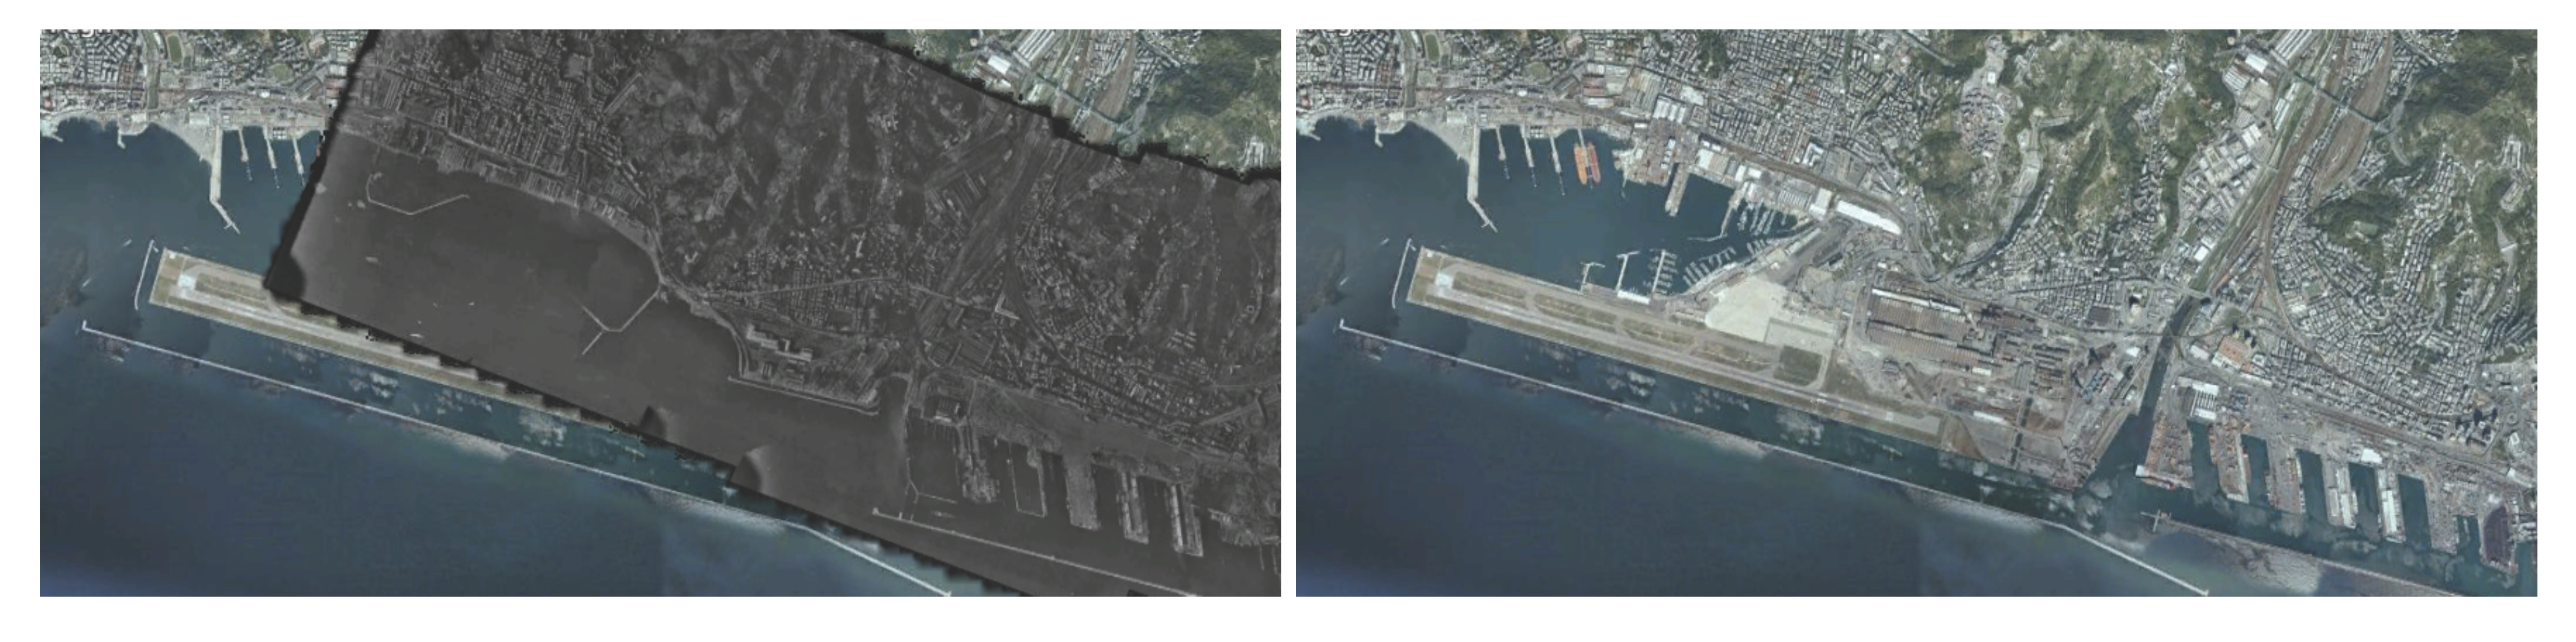
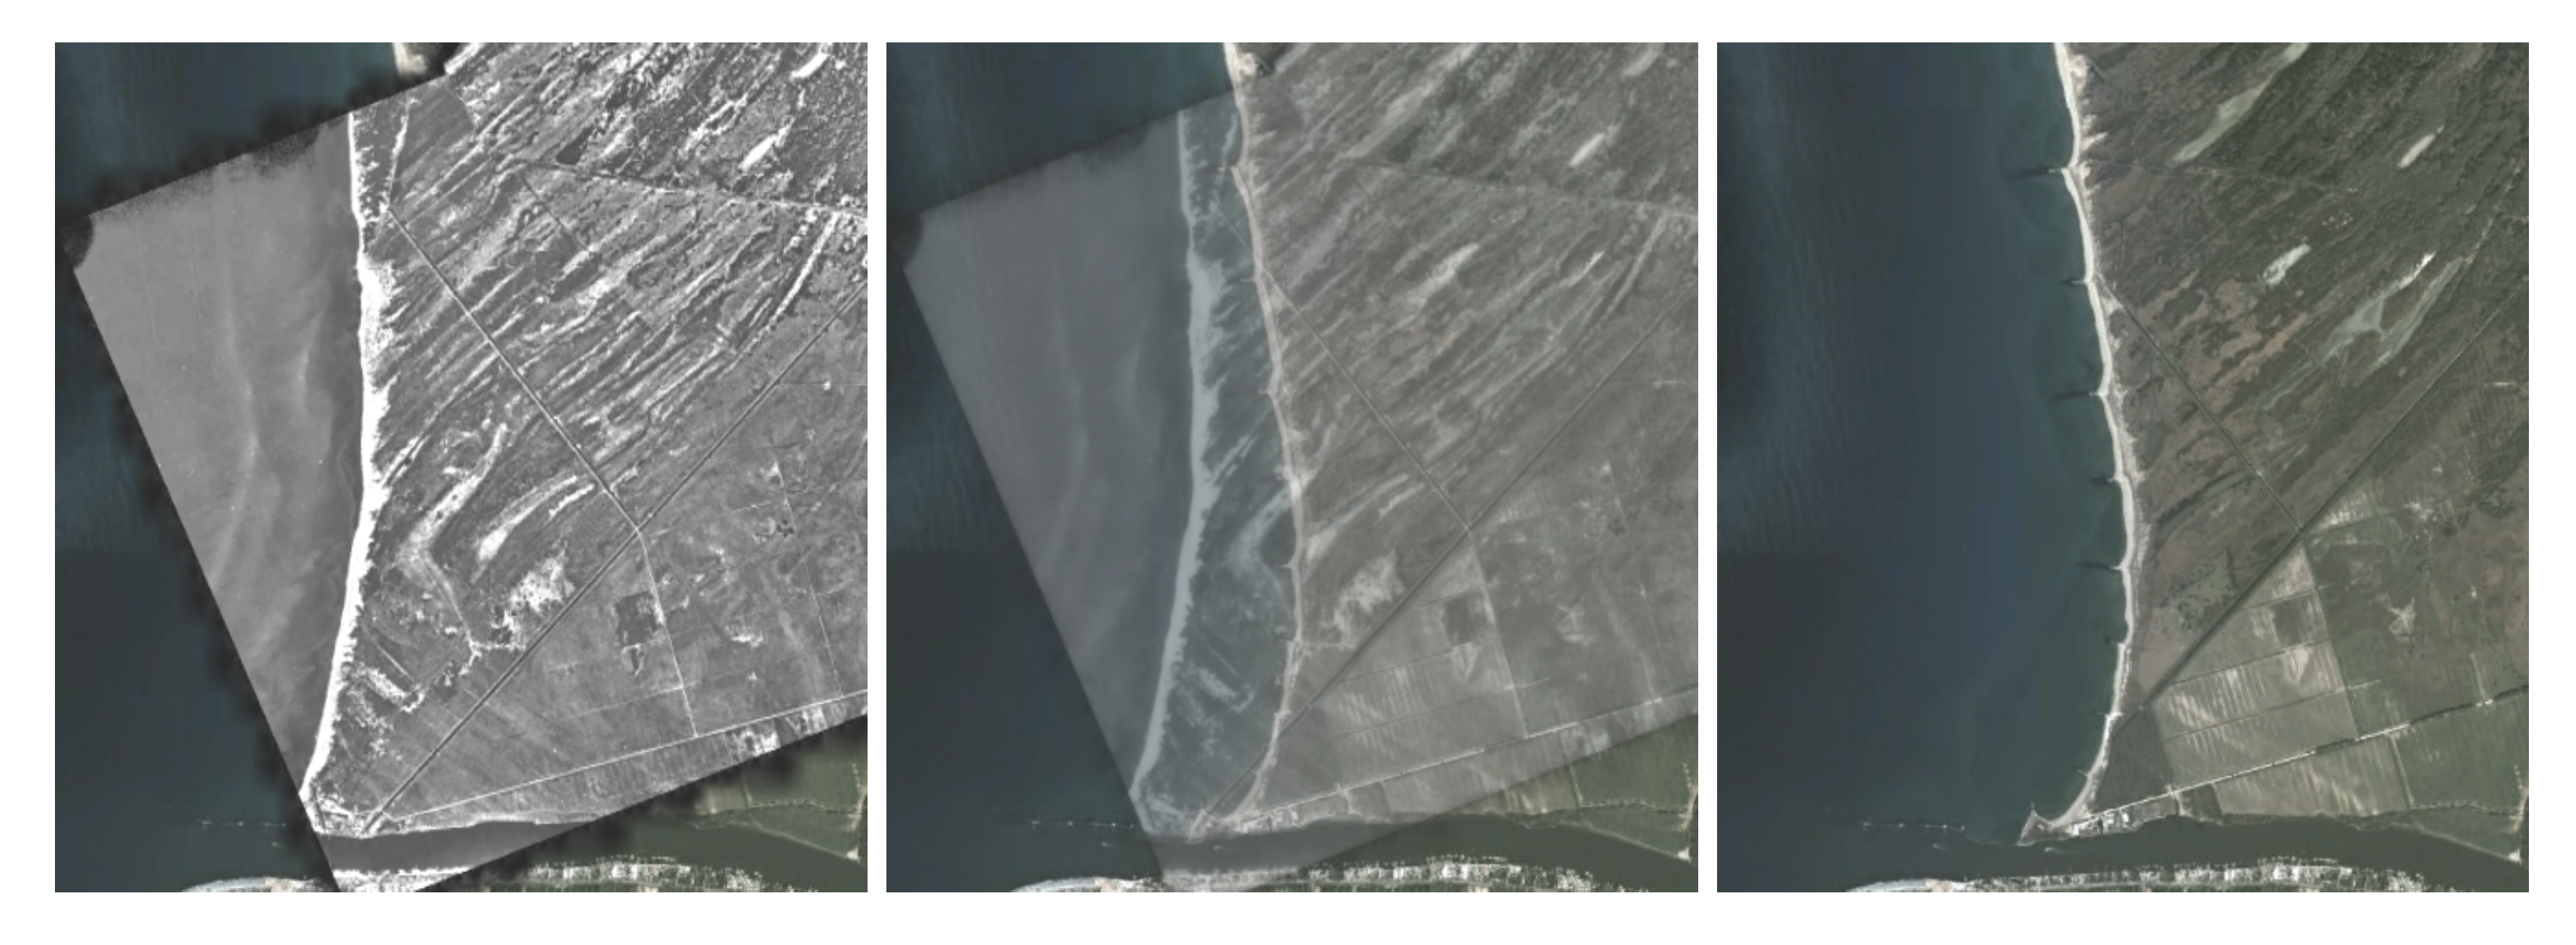
5.1. Coastal Line Case Study

On the right in Figure 12 there is a snapshot of the application showing the Google Earth satellite map of the mouth of the river Arno outside Pisa in Italy. In the middle, the map and a 1943 photograph of the same area are blended together. It is easy to see that a notable part of the coastal land has disappeared and the beach line has moved, even up to more than 400 m. The image on the left shows the photo of 1943 overlaid without blending.
In Figure 13 on the left is a snapshot showing a cadastral map that was published in 1765, officially issued by Pietro Leopoldo the Grand Duke of Tuscany. In the middle is an aerial photo from 1962 and on the left these two are blended together with the photos in Figure 12 (Google Earth and RAF photo of 1943). This blending makes it possible to study how the shore line has changed and moved over time and space: about 1.85 square kilometers of shore has disappeared since 1765, about 1 square kilometer since 1943, and about 0.31 since 1962.
Figure 12. Snapshots from the application showing the mouth of the river Arno close to Pisa. Left: A historical photo from 1943. Middle: The blending process in action. Right: Google Earth photo (2012). One can notice how the beach has been overtaken by the sea on the north side of the river (©MiBAC-ICCD, Aerofototeca Nazionale, fondo RAF. ©2010 Google).
Ijgi 02 00432 g012
Figure 13. Snapshots of the mouth of the river Arno, near Pisa. Left: A cadastral map from 1765. Middle: Aerial photo from 1962. Right: An overlay of the cadastral map, the historical photos from 1943 and 1962 and the Google Earth modern satellite photo. The user can visually perceive in a single image the changes in the coastal line throughout two and a half centuries (©MiBAC-ICCD, Aerofototeca Nazionale, fondo RAF. ©2010 Google).
Ijgi 02 00432 g013

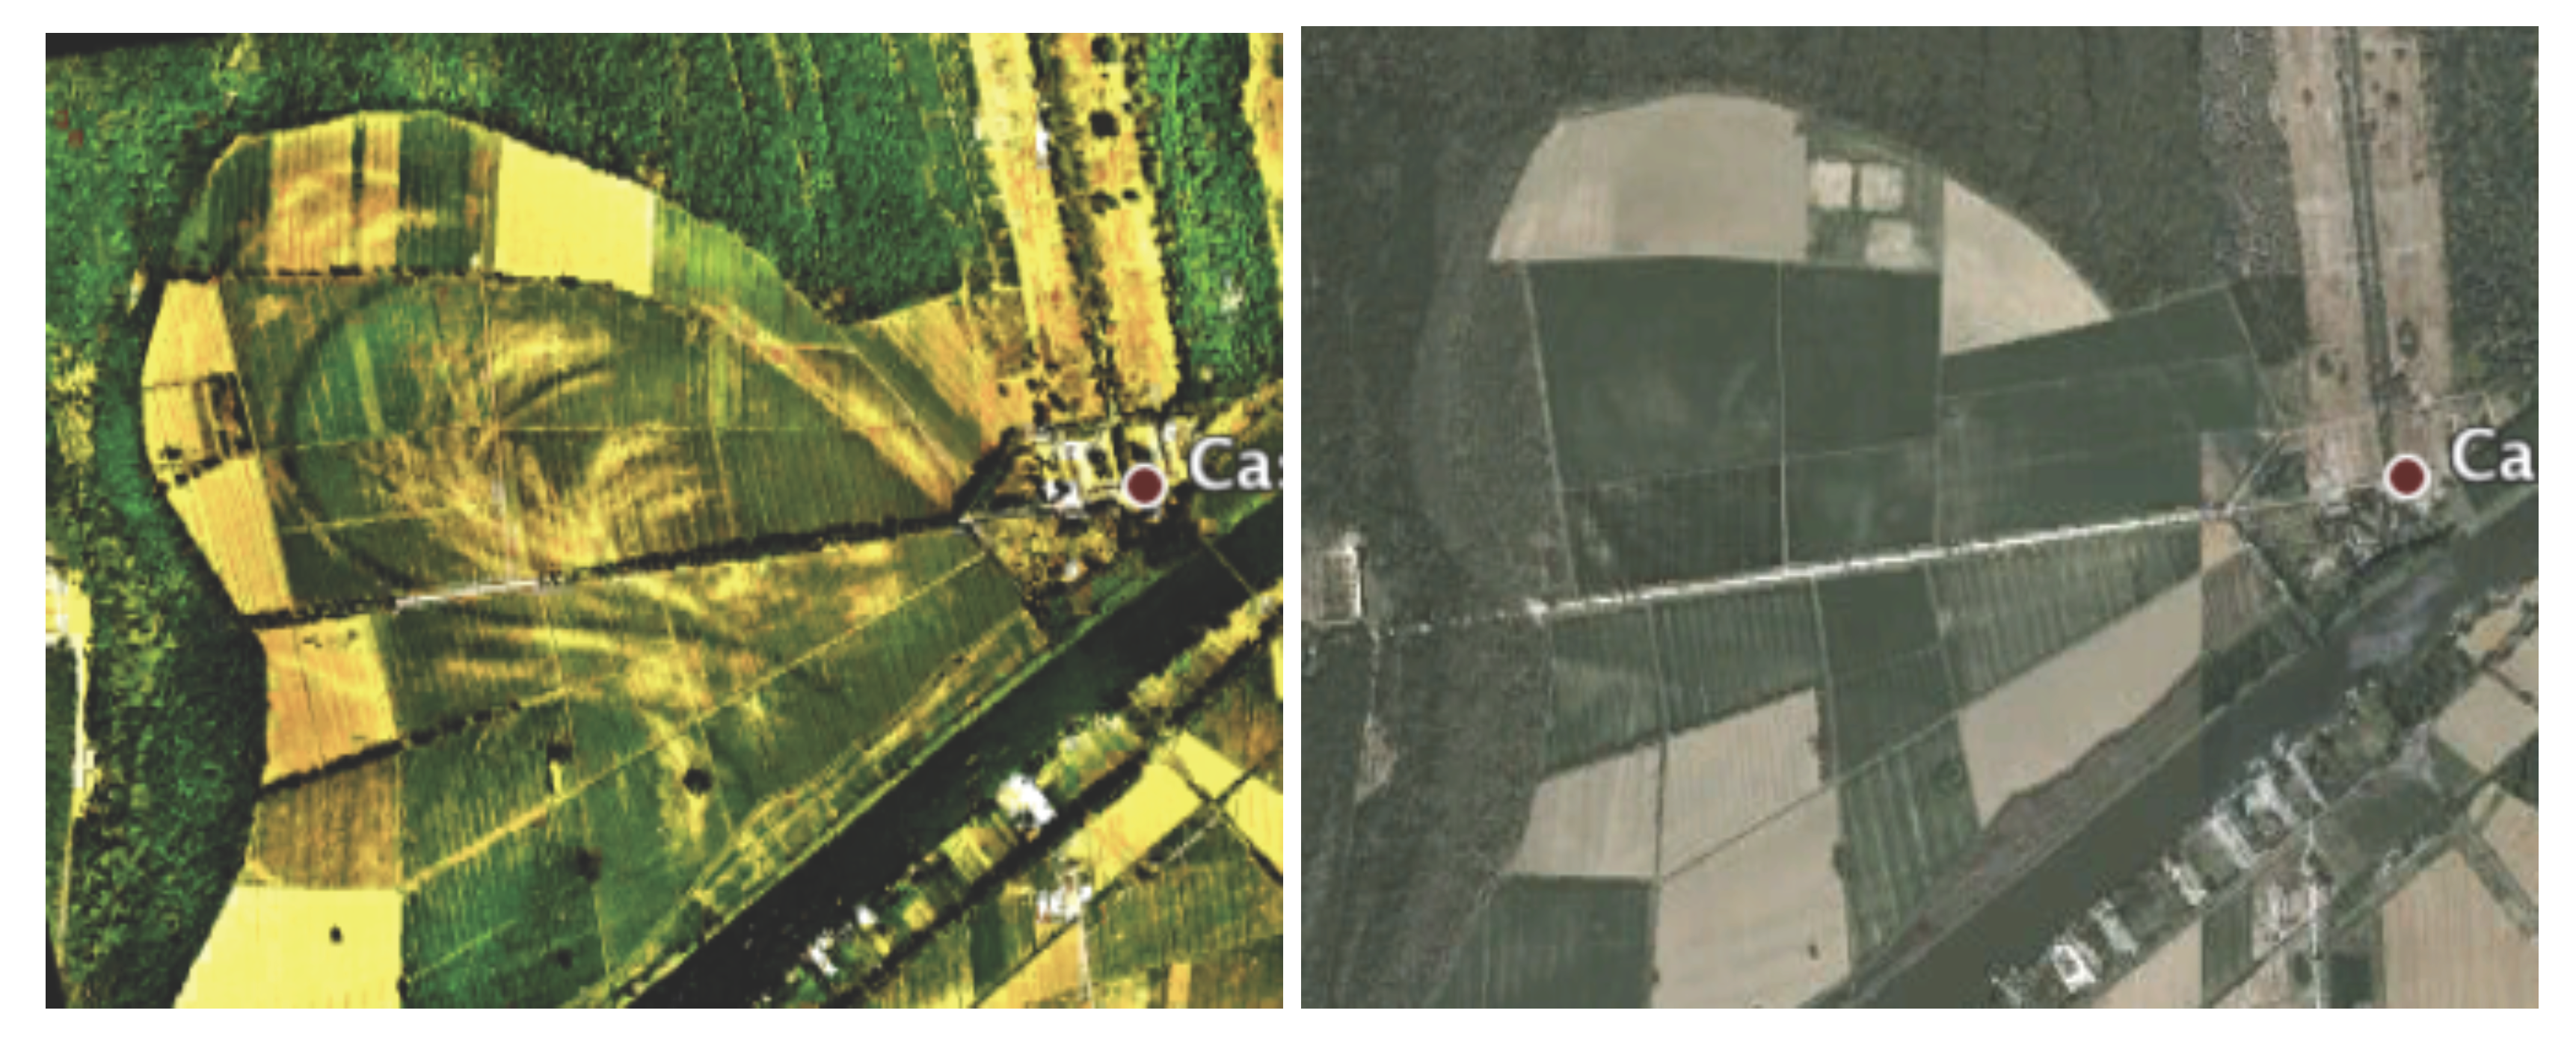
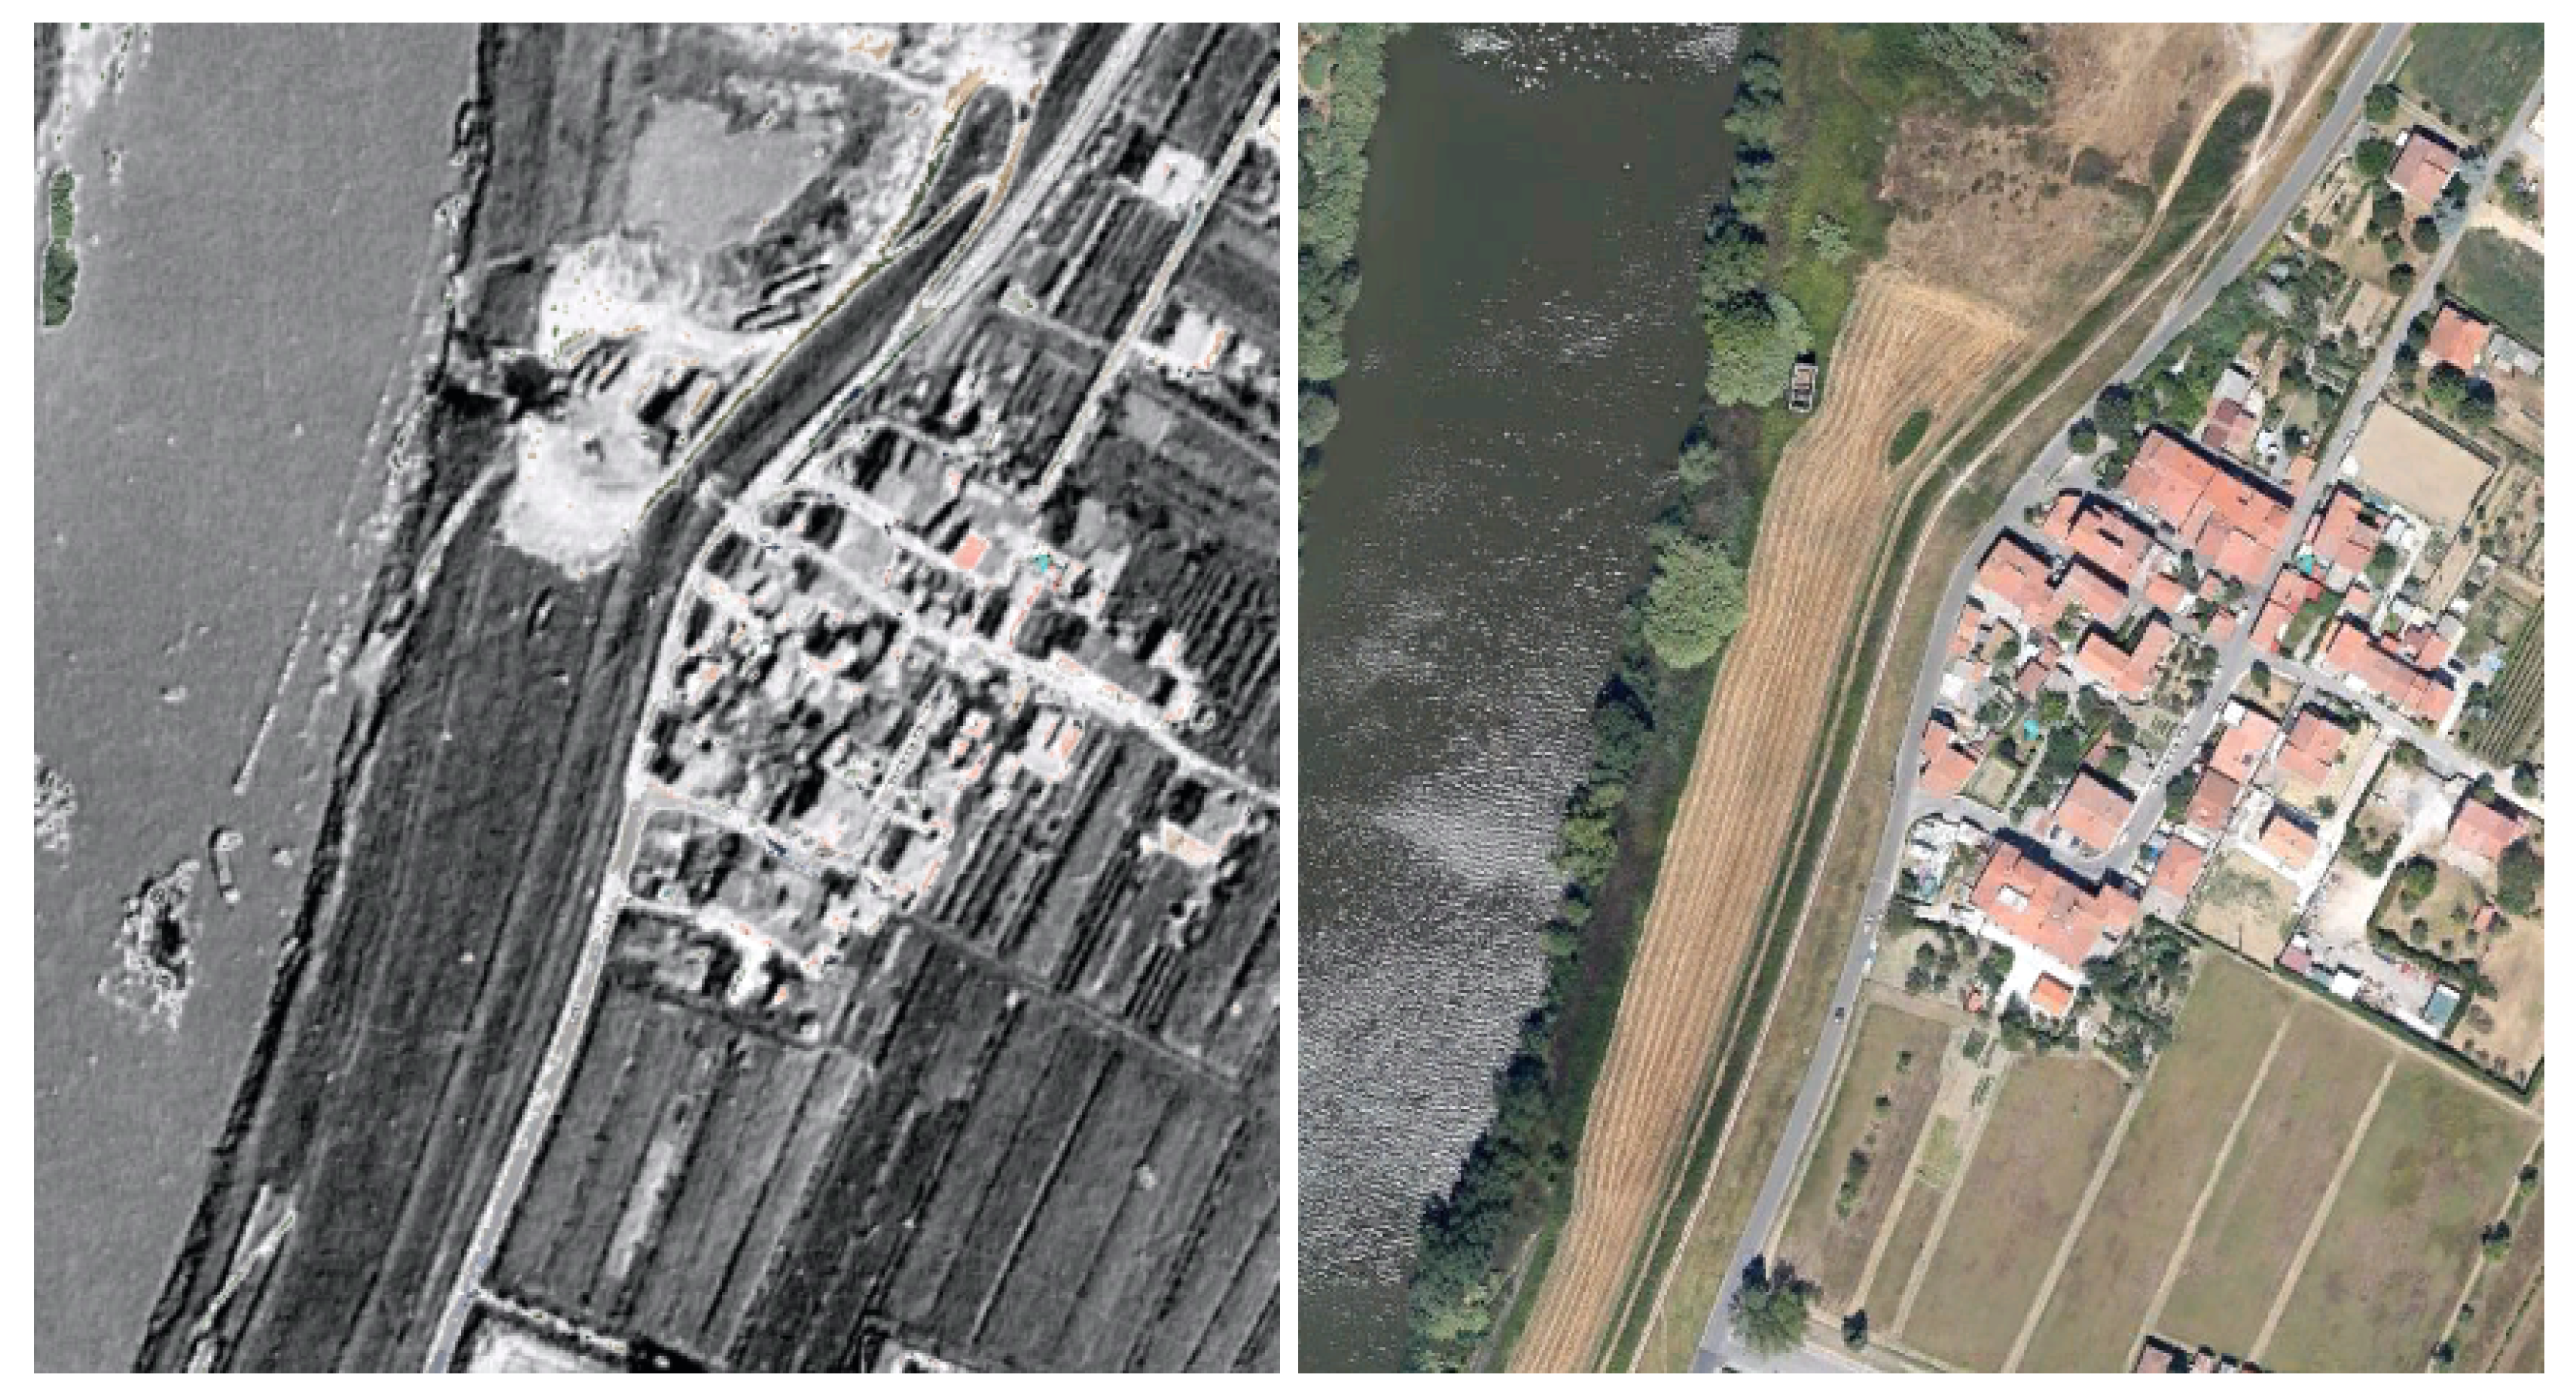
5.2. River Course Case Study

In ancient times, Pisa stood at the confluence of two rivers, the Arno and the Auser (now called Serchio and flowing further north than before). Photointerpretation studies carried out by Marcello Cosci (Marcello Cosci Aerial Photography Documentation Centre, http://www.marcellocosci.it/drupal/centro) reveal the ancient meanders of those paleo-river beds in and around the town. In our application, a vector layer is shown (Figure 14), which is derived from the images obtained by applying enhancing techniques to Landsat, Soyuz and Spot satellite imagery, as well as aerial imagery such as those by RAF. The highlighted chromatic changes, due to differences in the concentration of vegetation, reveal underground areas having a higher relative humidity. Such areas correspond to the ancient courses of the two rivers [34].
Figure 14. The result of a study on paleo-river beds in the region around Pisa carried out by Marcello Cosci. Different colors correspond to different kinds of analyses on different photo sources. Red, light blue, blue: Landsat, Soyuz and Spot satellite imagery; Purple, orange: RAF and Regione Toscana aerial imagery; Yellow: multispectral imagery (©Marcello Cosci Aerial Photography Documentation Centre. ©2010 Google).
Ijgi 02 00432 g014
Figure 15. The river Arno has been straightened out by human intervention over the centuries to make traffic run more easily. The previous course can be distinguished in the photo on the left, elaborated by Marcello Cosci. On the right is a modern satellite photo (©Marcello Cosci Aerial Photography Documentation Centre. ©2010 Google).
Ijgi 02 00432 g015
The river Arno has changed its course many times over the centuries, and especially since the 15th century, many attempts have been made to straighten it to make the traffic easier. In Figure 15, a photo elaborated by Marcello Cosci can be compared to the Google Earth satellite photo, and the previous course of the river can be distinguished.

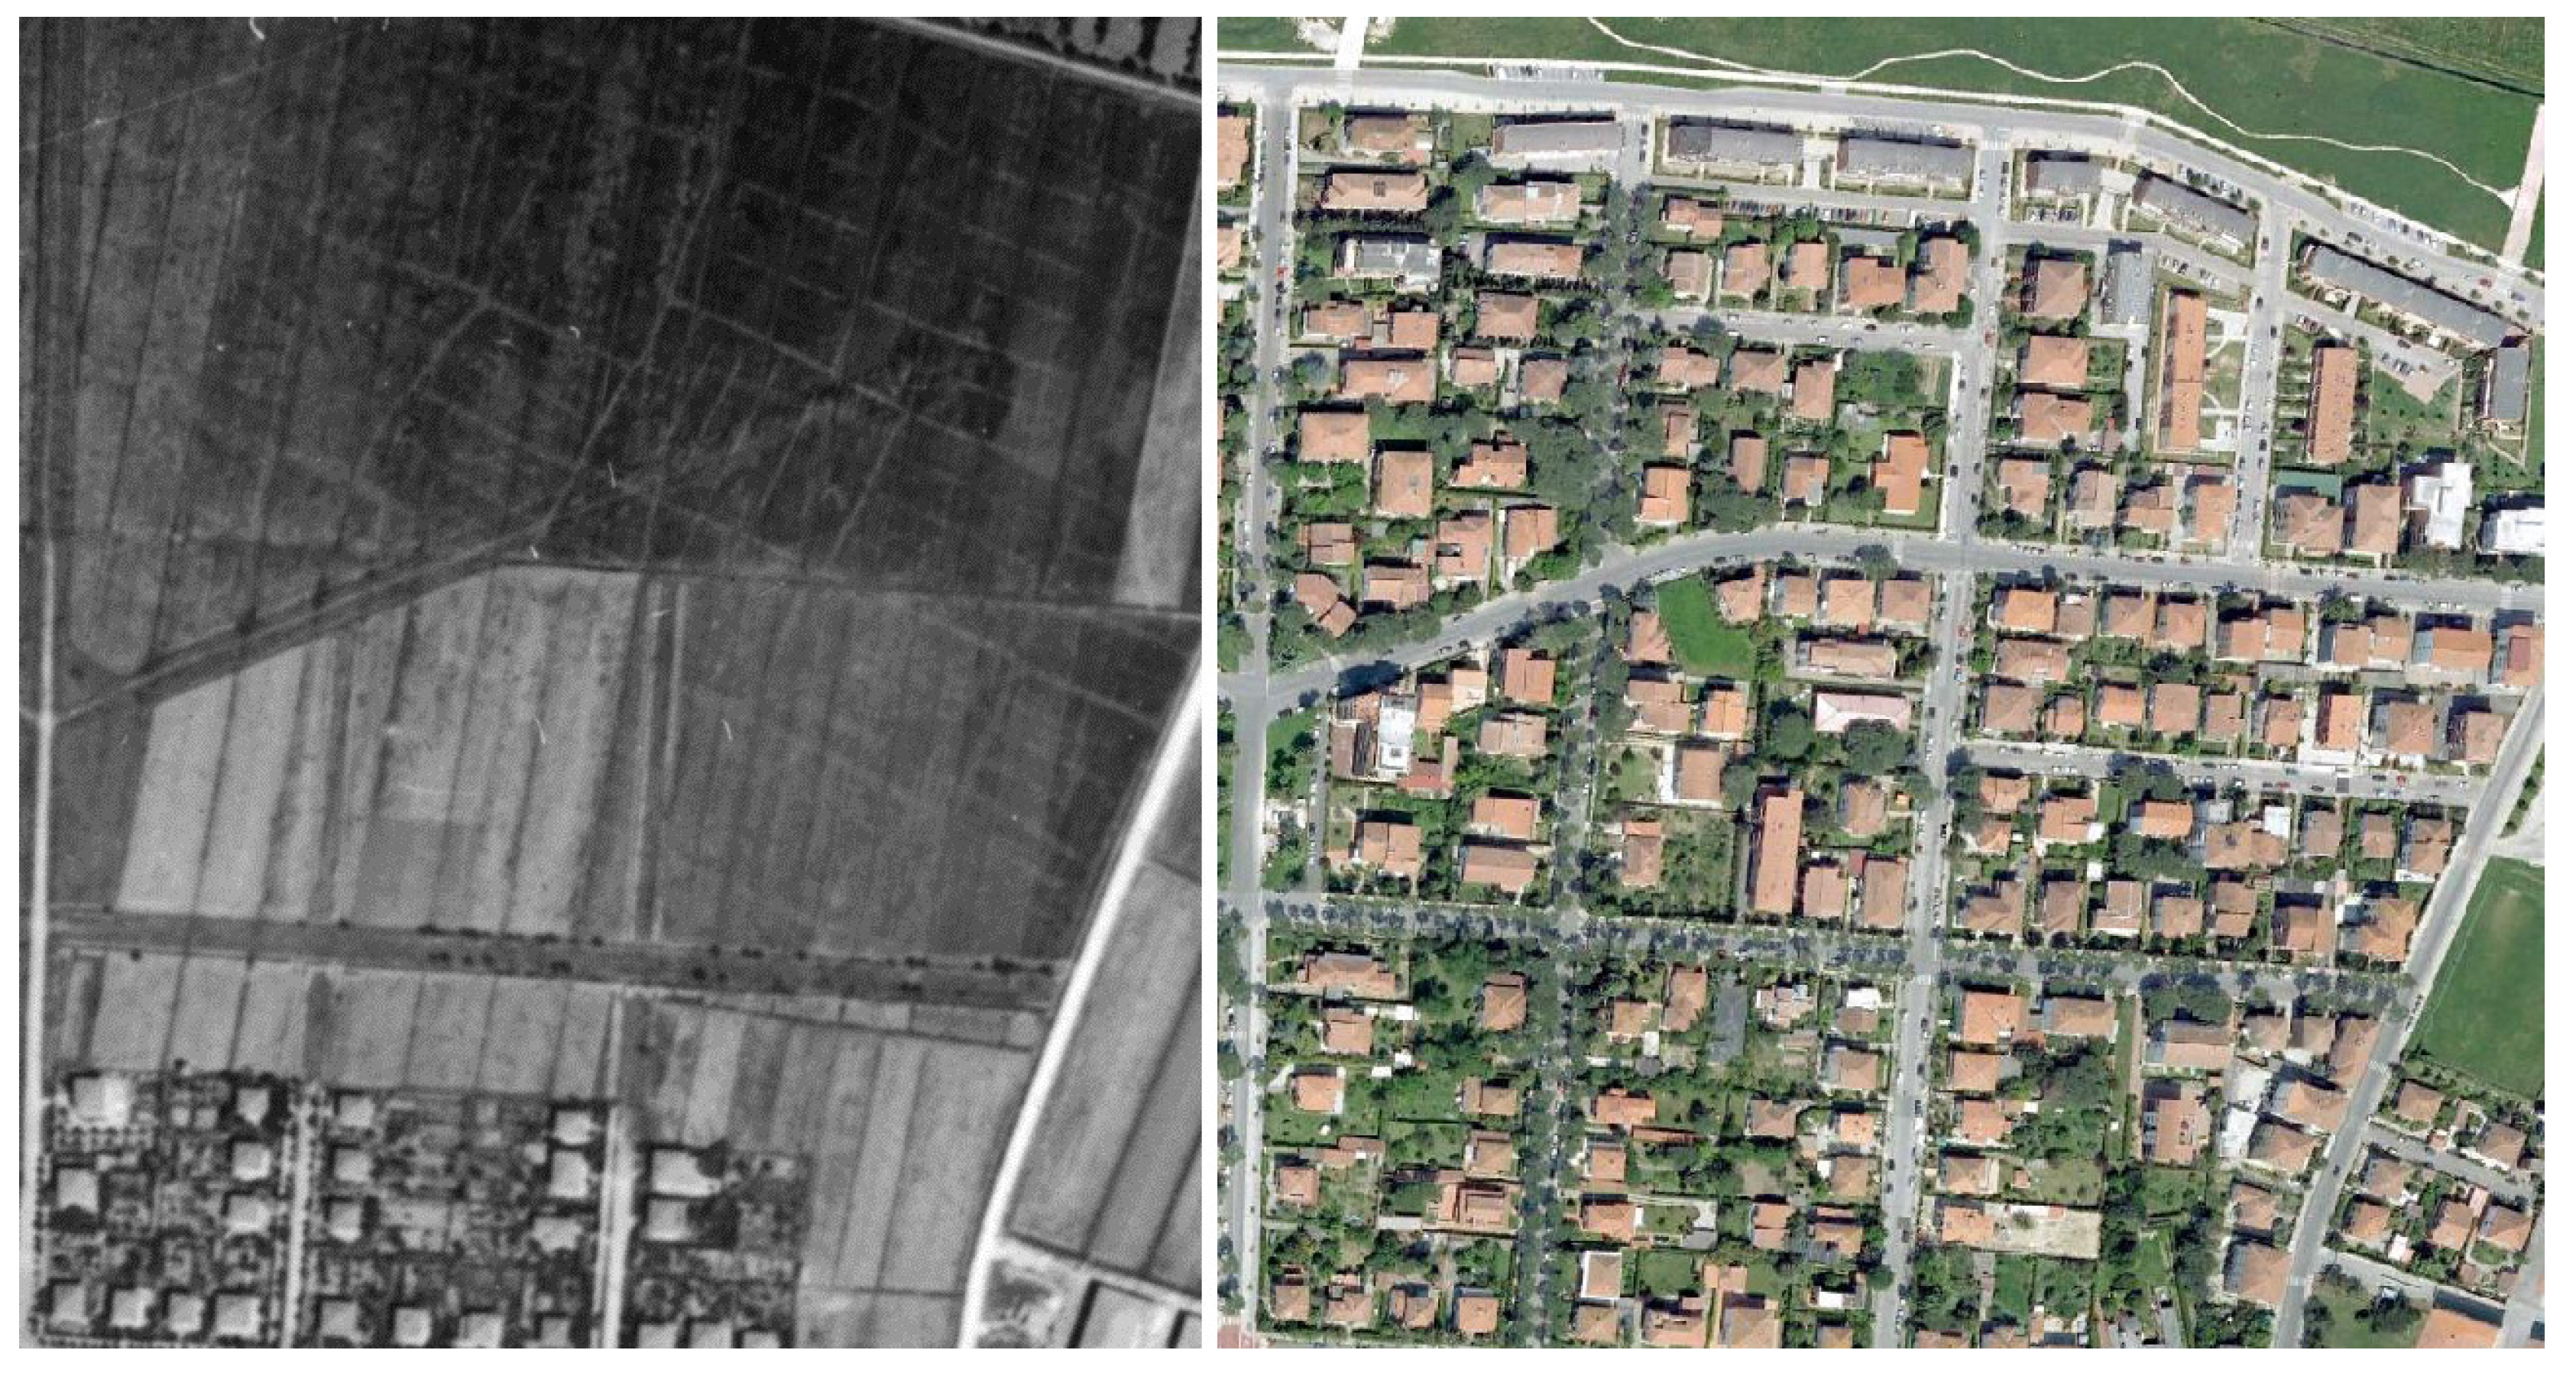
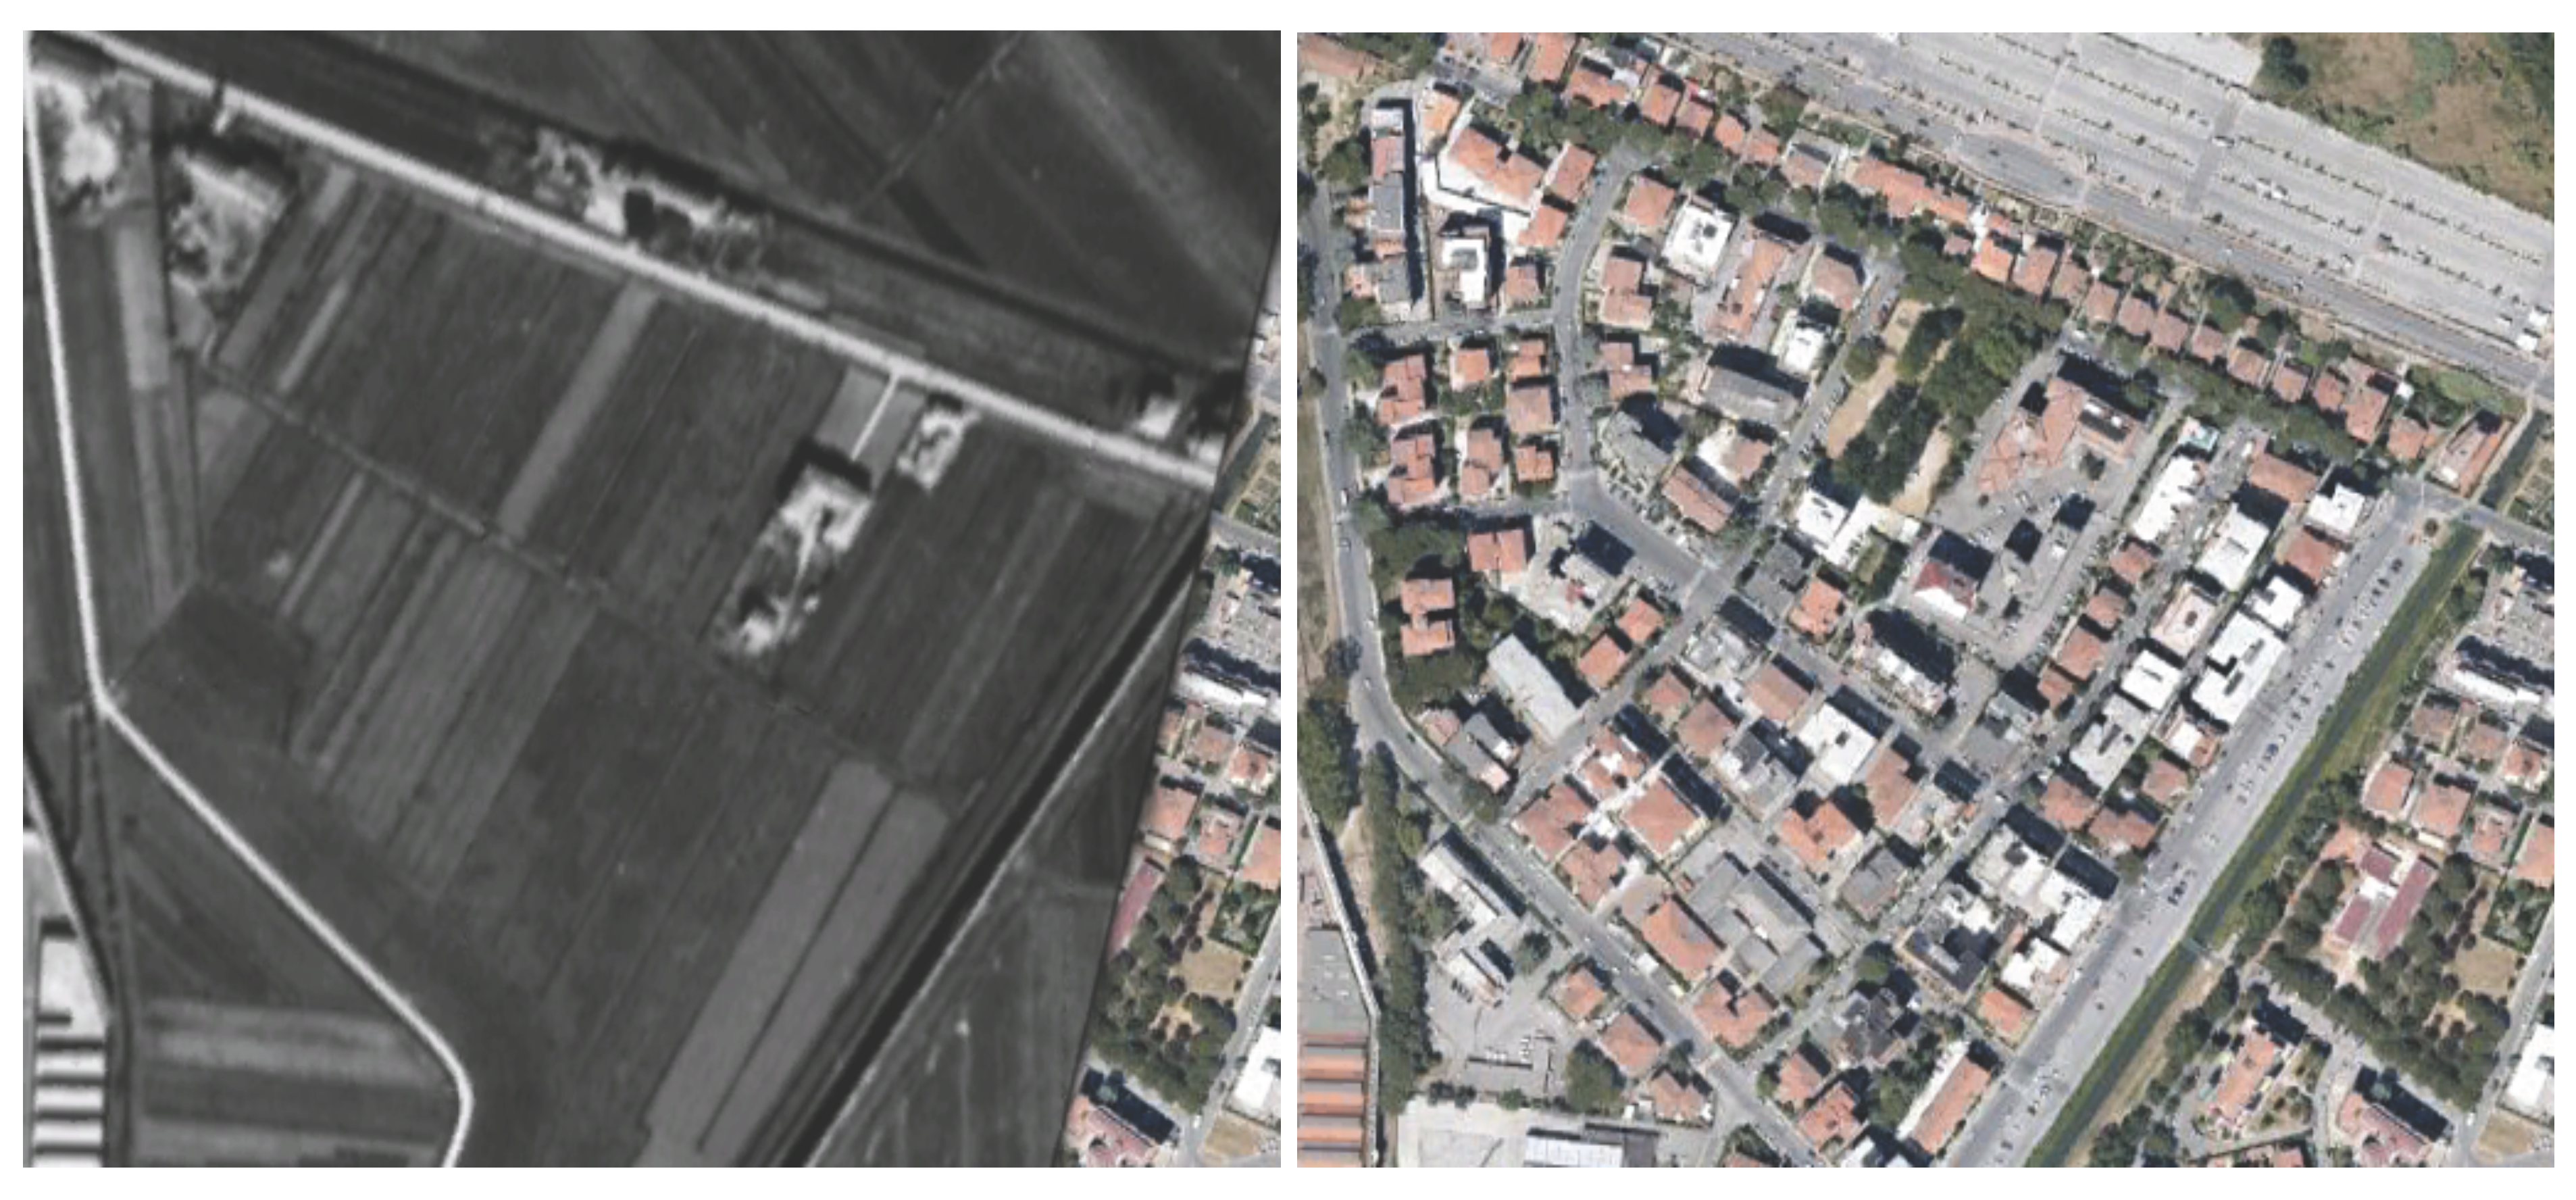
5.3. Urban Expansion Case Study

In addition to the aforementioned case of the city of Pisa (see Figure 11), there are many locations in which our application makes the urban expansion phenomenon evident. For example, the Italian city of Genoa has undergone dramatic changes in the topology of its landscape, as shown in Figure 16. The images show the construction of the Cristoforo Colombo airport, which was built in the Mediterranean Sea by filling the bay area with rubble. Before the construction, the area was a beach that used to be a popular place for locals, and there was a castle erected between 1881 and 1885 called Castello Raggio that was severely damaged during World War II and finally destroyed to make place for the airport.
Figure 16. Left: The bay of Genoa in 1943 before the construction of the airport, which was a popular beach for the locals. Right: The bay as it is now, taken up by the Cristoforo Colombo airport (©MiBAC-ICCD, Aerofototeca Nazionale, fondo RAF. ©2010 Google).
Ijgi 02 00432 g016

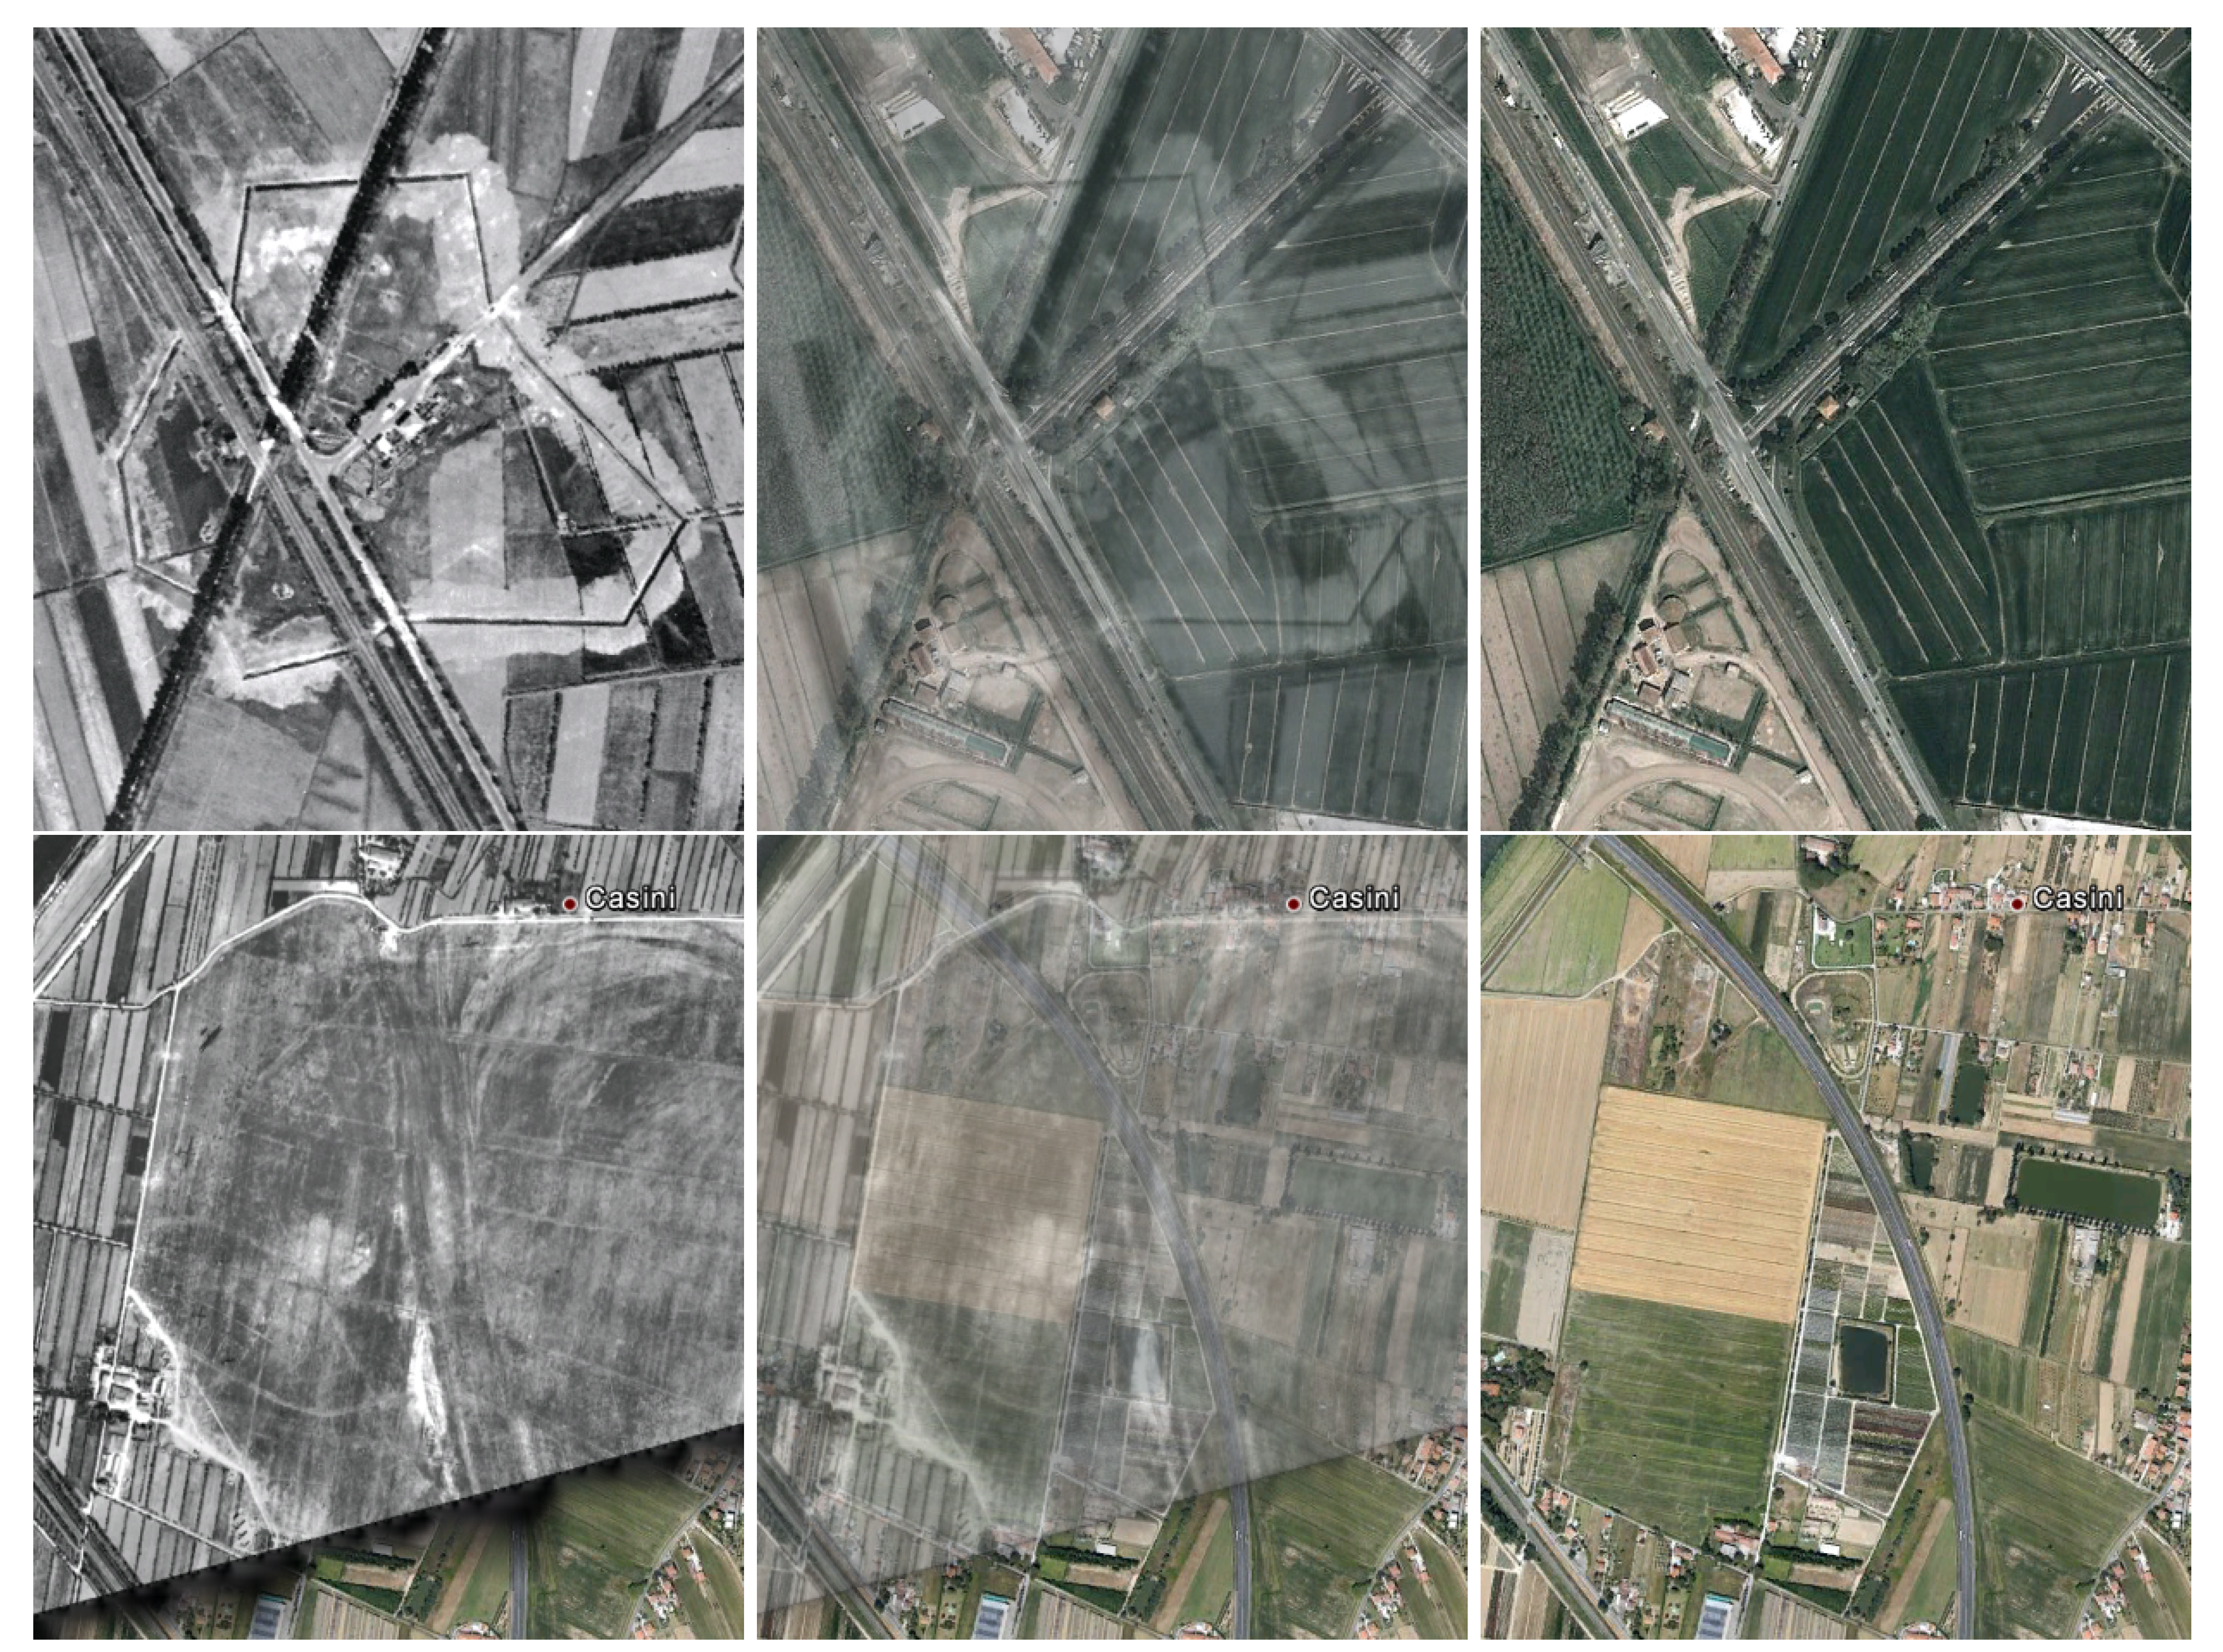
5.4. Historical and Archeological Case Study

The GeoMemories application also has great potential to become a valuable resource for both historians and archaeologists [35].
In Figure 17, so-called crop marks [36] are visible on the left. Unfortunately, they have been almost completely covered by modern buildings, which can be seen on the right in a recent Google Earth satellite image. Nonetheless, thanks to the images provided by AFN, archaeologists can still study the site using the GeoMemories application despite the fact that no excavation can be performed. The marks in the photos are thought to show traces of an ancient Roman agricultural land division (canals or field boundaries) [37]. Again, chromatic differences can be used to isolate areas in which the vegetation growth is influenced by traces of old water streams buried in the ground.
Another example of historically relevant imagery is the one showing the original location of the San Savino abbey, destroyed during a flood between 1111 and 1117 and then rebuilt in a higher position. The discovery was made by Marcello Cosci, who noticed that in a 1966 aerial photo the ruins of the building are visible in the river near the town of Riglione (Figure 18).
Figure 17. Visible crop marks from Roman times (Left) that reveal some agricultural divisions (canals or field boundaries) and modern constructions (Right) that cover the same area (©MiBAC-ICCD, Aerofototeca Nazionale, fondo RAF. ©2010 Google).
Ijgi 02 00432 g017
Figure 18. Left: The ruins of the San Savino abbey are visible in the water of the Arno river (lower-left corner). Right: The Arno river and the town of Riglione today (©Marcello Cosci Aerial Photography Documentation Centre. ©2010 Google).
Ijgi 02 00432 g018
Figure 19. Two examples of historical evidences of World War II compared to recent imagery: a German fortification (top) and an airfield (bottom), where a Messerschmitt 323 Gigant airplane can be spotted in the upper-left corner (©MiBAC-ICCD, Aerofototeca Nazionale, fondo RAF. ©2010 Google).
Ijgi 02 00432 g019

6. Conclusions

The GeoMemories project aims to make the AFN archive publicly available through an application that makes it possible to explore Italy in both time and space. The web is undoubtedly the platform of choice to reach a vast amount of users, both academics and non-experts. Our focus on providing an intuitive experience of the changes in the Italian landscape led us to implement the fading behavior, which lets users perceive visually the evolution of the territory by giving them direct control on the time variable. These choices led us to the adoption of Google Earth technology, and to seek a high-precision georeferencing, at a photographic level.
The challenges of digitizing millions of photos, such as adjusting them to fit into the Google Earth environment, are enormous and time consuming. We have been working on making the process as quick as possible without sacrificing the quality of the preserved heritage. We decided to focus mainly on RAF photographs of cities, in order to reduce their amount while keeping the most interesting (and also less difficult to georeference) images. The results of our analysis on the informative content of AFN photos provided us with the optimal value of 600 dpi for the acquisition process. The choice to rely heavily on computer vision techniques helped the project to automate many steps, and to obtain bigger mosaics and images of better quality; we thus provide users with maps that span tens of kilometers, with a uniform illumination. We decided to exploit pyramidalization techniques in order to scale to even bigger maps, without compromising their fruition via the Web.
In its current form, the application allows the user to blend different layers of photos from different times making comparisons with the current Google Earth satellite photos. In this paper we have offered several examples of changes in the environment in Italy caused both by humans and nature, but there are surely many more examples than we know of in the maps that we have digitized and inserted in the application. Undoubtedly, even more are about to be discovered as photos from the AFN archive are added to the application.
Aerial photography has proven to be an important source for digging in the past. The GeoMemories application can facilitate such research, and is therefore a valuable tool in a variety of areas. Different aspects of the application itself will be improved over time after leveraging user feedback.
GeoMemories has been well received by end users, both as a web portal (with about 200 individual visitors per day for the first three months), and when presented to the public in three scientific festivals. The project has also been featured in some press columns. Comments from users have been positive and encouraging, and many of them have found it natural to want to contribute to the project with their own memories of the past. Moreover, many scientists, experts, and institutions studying landscape, history and archeology, such as the aforementioned Marcello Cosci Aerial Photography Documentation Centre, have already expressed their interest in the project and have begun collaborations.
The workflow for creating historical maps is rather heavy due to its many individual steps, often requiring human input and guidance. There are several crucial steps in the registration of the historical photos, which could be improved and to some extent automatized. In particular, the georeferencing could be made easier if ground control points could be found automatically. We are currently developing alternatives to SIFT that could be used to match historical aerial photos with new satellite photos, which is a task that at the moment no feature detector handles really well as the differences are too large. Nevertheless, there will always be a need for human control and intervention in the process in order to assure that images are correctly registered, especially when the change is so great that the computer vision algorithms cannot determine any correspondences. When users interact with the fading control, it is important for the overlap to be as accurate as possible; otherwise they cannot draw adequate conclusions from what they see. Furthermore, measurements in the images would not be correct if there were excessive differences between locations.
In our current process, many photos are stitched and blended together [24] to form a map that is subsequently pyramidalized into smaller tiles suitable for Web applications. This poses a scalability limit on the number of photos that can be merged together. Since every image is about 20–40 MB, composing a map of more than 30 photos would be a very onerous process, and would produce a mosaic that is undesirably enormous. We aim to integrate the mosaicking step with the pyramidalization, thus avoiding stitching a great number of photos together as a big image by computing the individual tiles directly from each image. Hence, the blending will have to be done only on the bottom level of the pyramid when necessary, i.e., when parts of two georeferenced images would lie in the same tile. By developing such techniques, GeoMemories would be able to handle larger mosaics, even maps of the whole Italian territory.
The GeoMemories public Web portal could be reimplemented to avoid the need for the Google Earth plugin, using more up-to-date technologies such as the Google Maps API. However, a substantial change to KML-related modules of the system would become necessary. This technology switch is currently under consideration, and an early prototype of a new interface is already online at http://www.geomemories.org/minimal/. This new prototype also attempts to resolve some usability issues of the current system, leaning towards the non-expert user end of the spectrum.
Ancient maps are another extremely valuable source of historic and geographic data [38,39], although they pose new challenges for the project [40,41]. We have a 1,765 cadastral map already integrated in our system, but we are willing to add many more. Two examples of rich ancient maps archives are http://www.igmi.org/ancient/ and http://etc.usf.edu/maps/galleries/Europe/italy/index.php. Furthermore, a social collaboration infrastructure can be envisaged, mimicking the behavior of Wiki software, that could open up the possibility of collecting historical memory from the end users. The size of the AFN archive makes it desirable to seek contributions from voluntary users in the georeferencing step of the procedure as well.

Acknowledgements

We would like to thank the Italian Internet Domains Registry (Registro.it) for funding the project, and Paolo Basile, Fabio Cosci, Giuseppe Di Gennaro, Davide Gazze`, Maria Letizia Gualandi, Alessandro Lugari, Alessandro Prosperi and Elizabeth Jane Shepherd for their valuable contributions to GeoMemories.
All MiBAC/ICCD images are used by permission of “Istituto Centrale per il Catalogo e la Documentazione-MiBAC” and “British School at Rome”. No further reproduction, by any means, is permitted.

Conflict of Interest

The authors declare no conflict of interest.

References

  1. Bourgeois, J.; Meganck, M. Aerial Photography and Archaeology 2003: A Century of Information; Archaeological Reports; Academic Press: Waltham, MA, USA, 2005. [Google Scholar]
  2. Brophy, K.; Cowley, D. From the Air: Understanding Aerial Archaeology; Tempus Publishing Ltd.: Gloucestershire, UK, 2005. [Google Scholar]
  3. Riley, D. Air Photography and Archaeology; University of Pennsylvania Press: Philadelphia, PA, USA, 1987. [Google Scholar]
  4. Wilson, D.R. Air Photo Interpretation for Archaeologists, 2nd ed.; The History Press Ltd.: Gloucestershire, UK, 2000. [Google Scholar]
  5. Kirk, T. The Architecture of Modern Italy: Visions of Utopia, 1900-Present; The Architecture of Modern Italy, Princeton Architectural Press: New York, NY, USA, 2005. [Google Scholar]
  6. Dunnage, J. Twentieth Century Italy: A Social History; Prentice Hall: Upper Saddle River, NJ, USA, 2002. [Google Scholar]
  7. Llc, B. Natural Disasters in Italy: Earthquakes in Italy, Floods in Italy, 2009 L’Aquila Earthquake,1966 Flood of the River Arno; General Books: Memphis, TN, USA, 2010. [Google Scholar]
  8. The Google Maps/Bing Maps spherical Mercator Projection. Available online: http://alastaira.wordpress.com/2011/01/23/the-google-maps-bing-maps-spherical-mercator-projection/ (accessed on 5 December 2012).
  9. Szeliski, R. Computer Vision: Algorithms and Applications, 1st ed.; Springer-Verlag New York, Inc.: New York, NY, USA, 2010. [Google Scholar]
  10. Lowe, D.G. Distinctive image features from scale-invariant keypoints. Int. J. Comput. Vision 2004, 60, 91–110. [Google Scholar] [CrossRef]
  11. Fischler, M.A.; Bolles, R.C. Random sample consensus: A paradigm for model fitting with applications to image analysis and automated cartography. Commun. ACM 1981, 24, 381–395. [Google Scholar] [CrossRef]
  12. Raguram, R.; Frahm, J.M.; Pollefeys, M. A Comparative Analysis of RANSAC Techniques Leading to Adaptive Real-Time Random Sample Consensus. In Proceedings of the 10th European Conference on Computer Vision: Part II (ECCV ’08), Marseille, France, 12–18 October 2008; Springer-Verlag: Berlin/Heidelberg, Germany; pp. 500–513.
  13. Hast, A.; Marchetti, A. An Efficient Preconditioner and a Modified RANSAC for Fast and Robust Feature Matching. In Proceedings of the International Conferences in Central Europe on Computer Graphics, Visualization and Computer Vision (WSCG 2012), Pilsen, Czech Republic, 25–28 June 2012; pp. 11–18.
  14. Hartley, R.I.; Zisserman, A. Estimation 2D Projective Transformations. In Multiple View Geometry, 2nd ed.; Cambridge University Press: Cambridge, UK, 2003; pp. 87–90, 121–122. [Google Scholar]
  15. Brown, M.; Lowe, D.G. Automatic panoramic image stitching using invariant features. Int. J. Comput. Vision 2007, 74, 59–73. [Google Scholar] [CrossRef]
  16. Bjørk, A.A.; Kjær, K.H.; Korsgaard, N.J.; Khan, S.A.; Kjeldsen, K.K.; Andresen, C.S.; Larsen, N.K.; Funder, S. An aerial view of 80 years of climate-related glacier fluctuations in southeast Greenland. Nat. Geosci. 2012. [Google Scholar] [CrossRef]
  17. Gennaretti, F.; Ripa, M.N.; Gobattoni, F.; Boccia, L.; Pelorosso, R. A methodology proposal for land cover change analysis using historical aerial photos. J. Geogr. Reg. Plan. 2011, 4, 542–556. [Google Scholar]
  18. Scardozzi, G. The contribution of historical aerial and satellite photos to archaeological and geo-archaeological research: Case studies in Italy and Turkey. Adv. Geosci. 2010, 24, 111–123. [Google Scholar] [CrossRef]
  19. Hast, A.; Marchetti, A. Retrospective Illumination Correction of Greyscale Historical Aerial Photos. In Proceedings of the ICIAP ’11, Ravenna, Italy, 14–16 September 2011; Volume 16, pp. 1–10.
  20. Burt, P.J.; Adelson, E.H. A multiresolution spline with application to image mosaics. ACM Trans. Graph. 1983, 2, 217–236. [Google Scholar] [CrossRef]
  21. Aguilar, M.A.; Aguera, F.; Aguilar, F.J.; Carvajal, F. Geometric accuracy assessment of the orthorectification process from very high resolution satellite imagery for Common Agricultural Policy purposes. Int. J. Remote Sens. 2008, 29, 7181–7197. [Google Scholar] [CrossRef]
  22. Hill, L.L. Georeferencing; The MIT Press: Cambridge, MA, USA, 2006. [Google Scholar]
  23. Brown, M.; Lowe, D.G. Automatic panoramic image stitching using invariant features. Int. J. Comput. Vision 2007, 74, 59–73. [Google Scholar] [CrossRef]
  24. Szeliski, R. Image alignment and stitching: A tutorial. Found. Trend. Comput. Graph. Vis. 2006, 2, 1–104. [Google Scholar] [CrossRef]
  25. Harris, C.; Stephens, M. mbined Corner and Edge Detection. In Proceedings of the Alvey Vision Conference, Manchester, UK, 31 August–2 September 1988; pp. 147–151.
  26. Bay, H.; Tuytelaars, T.; van Gool, L. SURF: Speeded up Robust Features. In Proceedings of the 9th European Conference on Computer Vision (ECCV’06), Graz, Austria, 7–13 May 2006; Springer-Verlag: Berlin/Heidelberg, Germany, 2006. Part I. pp. 404–417. [Google Scholar]
  27. Michaelsen, E.; von Hansen, W.; Kirchhof, M.; Meidow, J.; Stilla, U. Estimating the Essential Matrix: GOODSAC versus RANSAC. In Proceedings of the Photogrammetric Computer Vision, Bonn, Germany, 20–22 September 2006; pp. 1–6.
  28. Hast, A.; Marchetti, A. Putative Match Analysis—A Repeatable Alternative to RANSAC for Matching of Aerial Images. In Proceedings of the International Conference on Computer Vision Theory and Applications, Rome, Italy, 24–26 February 2012; pp. 1–4.
  29. Mclauchlan, P.F.; Jaenicke, A.; Xh, G.G. Image Mosaicing Using Sequential Bundle Adjustment. In Proceedings of the British Machine Vision Conference, Bristol, UK, 11–14 September 2000; pp. 751–759.
  30. Blonquist, K.F.; Pack, R.T. A bundle adjustment approach with inner constraints for the scaled orthographic projection. ISPRS J. Photogramm. 2011, 66, 919–926. [Google Scholar] [CrossRef]
  31. Keller, Y.; Averbuch, A. A projection-based extension to phase correlation image alignment. Signal Process. 2007, 87, 124–133. [Google Scholar] [CrossRef]
  32. Kuglin, C.; Hines, D. The Phase Correlation Image Alignment Method. In Proceedings of the IEEE Confernce Cybernet, San Francisco, CA, USA, 23–25 September 1975; pp. 163–165.
  33. Kovesi, P. MATLAB and Octave Functions for Computer Vision and Image Processing. Available online: http://www.csse.uwa.edu.au/pk/research/matlabfns/ (accessed on 5 December 2012).
  34. Cosci, M. Ricerche Aeree in Toscana. In In volo nel Passato. Aerofotografia e Cartografia Archeologica; All’Insegna del Giglio: Siena, Italy, 2005; pp. 263–272. [Google Scholar]
  35. Marchetti, A.; Hast, A.; Rapisarda, B.; Shepherd, J.; Tesconi, M. Geomemories—A Spatial-Temporal Atlas of the Italian Landscape. In Proceedings of the International Symposium on Virtual Reality, Archaeology and Cultural Heritage, Prato, Italy, 18–21 October 2011; pp. 41–44.
  36. BAJR. Aerial Photography and Manual Rectification: A Short Guide. 2012. Available online: www.bajr.org/Documents/AerialSurvey.pdf (accessed on 5 December 2012).
  37. Anichini, F.; Fabiani, F.; Gattiglia, G.; Gualandi, M.L. Mappa-Volume 1 Eng. Methodologies Applied to Archaeological Potential Predictivity; Edizioni Nuova Cultura: Pisa, Italy, 2012. [Google Scholar]
  38. Brovelli, M.A.; Minghini, M.; Giori, G.; Beretta, M. Web geoservices and ancient cadastral maps: The web CARTE project. Trans. GIS 2012, 16, 125–142. [Google Scholar] [CrossRef]
  39. Huang, S. The Exploration of Matteo Ricci’s World Map. In New Perspectives on the Research of Chinese Culture; Springer: Berlin/Heidelberg, Germany, 2013; pp. 119–136. [Google Scholar]
  40. Mastronunzio, M. Laccuratezza planimetrica della cartografia storica a grande scala. GEOmedia 2012, 15, 40–42. [Google Scholar]
  41. Ye, Z.; Zhuang, L.; Wu, J.; Du, C.; Wei, B.; Zhang, Y. In-Depth Utilization of Chinese Ancient Maps: A Hybrid Approach to Digitizing Map Resources in CADAL. In Proceedings of the 10th Annual Joint Conference on Digital Libraries, Gold Coast, QLD, Australia, 21–25 June 2010; ACM: New York, NY, USA, 2010; pp. 263–272. [Google Scholar]

