1. Introduction
Floods pose a significant threat to human life [
1] and cause extensive economic damages on a yearly basis [
2,
3]. Especially in urban environments, vulnerability is significantly increased as a higher concentration of population and assets makes flooding more costly and difficult to manage. In addition, given the complexity of socioeconomic activities in urban settlements, urban floods can potentially disrupt activities, businesses and social groups beyond the actual flooded area (e.g., disruption of transportation services). Moreover, the importance of urban floods in the overall risk is expected to grow even more [
4] as global urban population is projected to increase further [
5,
6,
7].
There is extensive literature and a well-established knowledge on how urban development affects basin hydrology, hydraulic conditions of channels and floodplains, as well as flood discharges and frequency [
8,
9,
10,
11]. In several cases, poorly planned development carried out to accommodate fast population increase has caused substantial changes in local hydrology and natural drainage networks [
12]. In addition, it has led to the increase in vulnerability to flood risk through the urbanization of flood-prone areas [
4]. Nevertheless, there is limited literature on how urban flooding phenomena evolve spatially in the long-term, influenced by changes in the urban environment.
Spatio-temporal databases have been used before to study temporal patterns of disasters and natural hazards [
13,
14,
15,
16]. In particular, GIS databases have proved to be an excellent tool to identify and quantify spatial changes and trends in natural hazards and other environmental phenomena [
17].
The objective of this work was to provide a better understanding of the spatial evolution of flooding phenomena in Athens, Greece, given the city’s significant expansion during the last century. To this aim, the study developed a spatio-temporal GIS database, containing information on the location and the timing of flood damages and fatalities in Athens, to identify possible changes and trends in the spatial migration of flooding phenomena and to illustrate their evolution throughout the study period. In addition, the study aims to identify and delineate particular areas of the city that present distinct increasing trends in the number of flood incidents, a result that has the potential to become a useful tool in strategic decision making regarding future flood risk mitigation actions.
2. Study Area
Athens is the capital and the most extensive urban area in Greece. The city is situated in central Greece, in the region of Attica and is built in a morphologic basin that occupies an area of approximately 534 km
2, formed between Penteli, Parnitha, Ymittos and Aigaleo mountains and Saronikos Gulf in the south (
Figure 1a). The basin is shaped primarily by Kifissos and Ilissos river networks. The area is relatively dry [
18] with a mean annual rainfall of approximately 390 mm [
19] and a poorly developed river network dominated by streams with small amounts of water for most of the year.
During the last century, Athens has been a rapidly evolving urban center, both in terms of population and spatial expansion, leading to a gradual urbanization of a significant part of the basin (
Figure 1b) [
20,
21,
22,
23]. Nowadays, approximately 68% of the basin is occupied by urban expanses that are host to about 4 million people [
24].
Figure 1.
(a) Map of Athens basin showing the river network, (b) the built areas and (c) the slope gradient of the basin.
Figure 1.
(a) Map of Athens basin showing the river network, (b) the built areas and (c) the slope gradient of the basin.
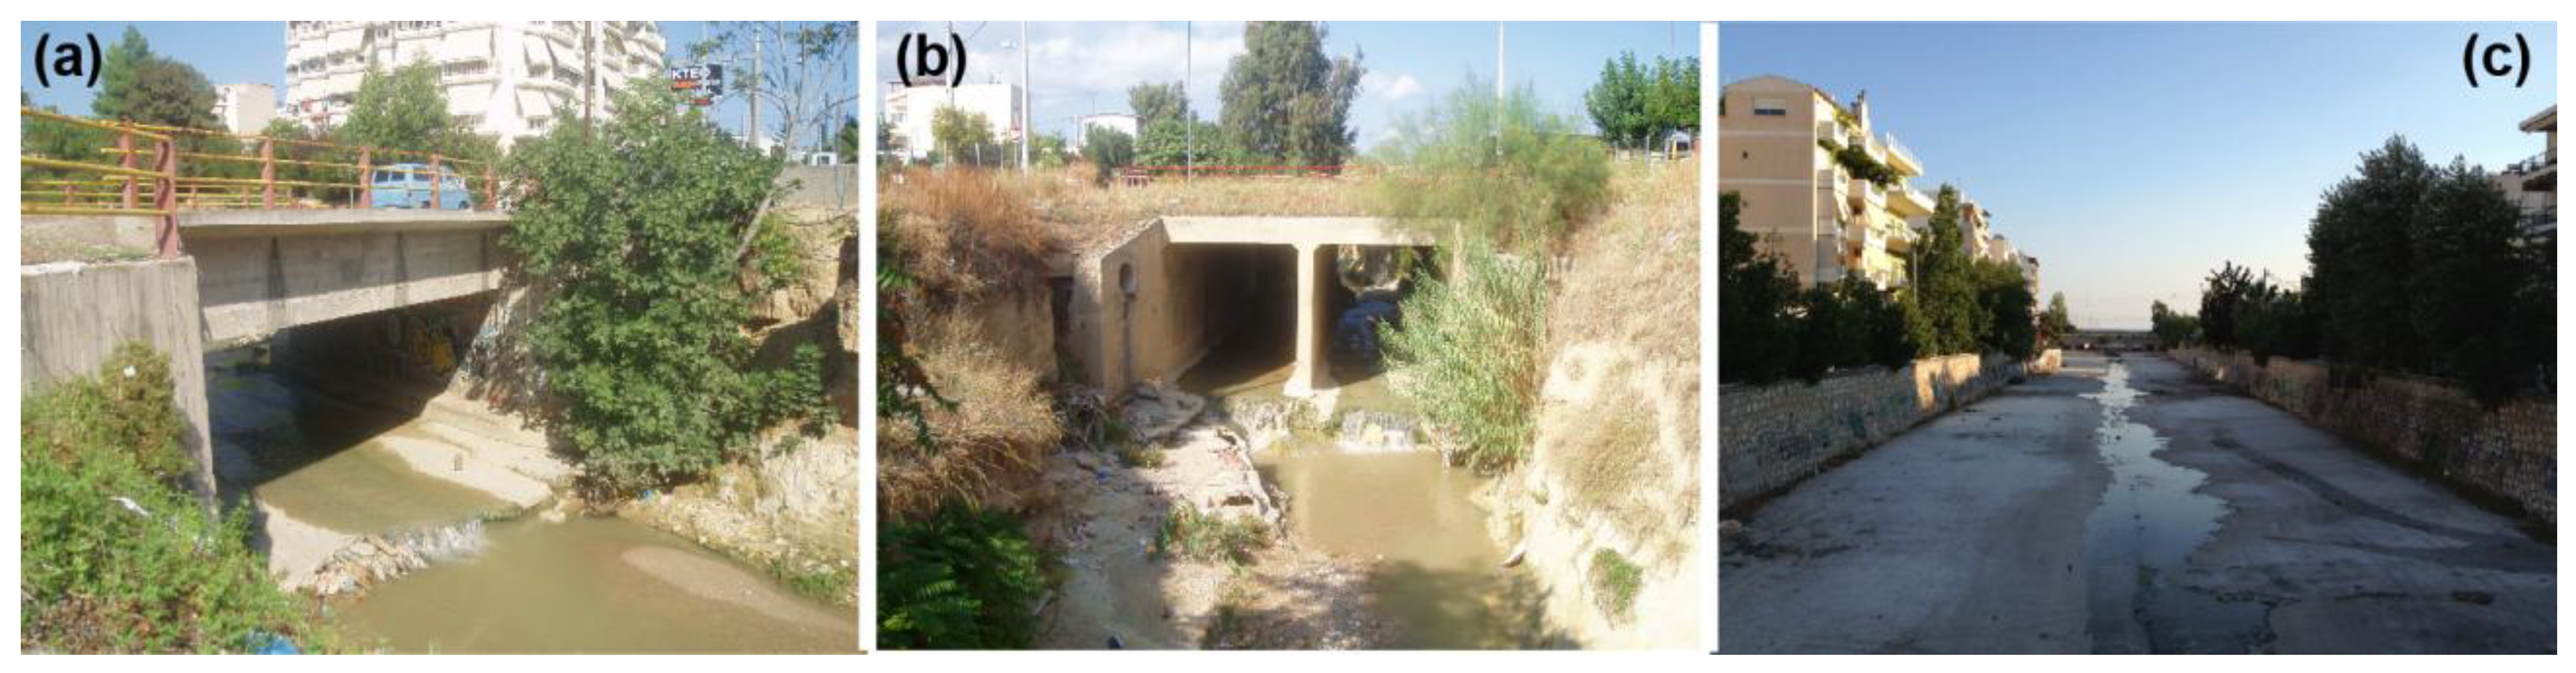
The increased pressure for development has led to the expansion of human activities and infrastructure within the vicinity of Athens’ ephemeral watercourses, in many cases in areas of elevated flood hazard, not suitable for building. In fact, several authors suggest that poorly-planned development in the city has affected the drainage capacity of the river network noting that several parts of it were shrunk or converted into streets while critical river cross sections were diminished (
Figure 2) [
18,
22,
23,
25].
Therefore, a combination of poor planning, extensive urbanization, reduction of soil infiltration capacity and building in flood-prone areas (
Figure 2c) led to a rich record of floods events in the city [
18,
26,
27,
28]. In fact, detailed study of the temporal evolution of floods in the basin has shown a positive trend during the last century, and even though immediate loss of life is not showing clear increase [
28], fatalities still remain an issue [
29].
Figure 2.
Typical examples of the condition of the drainage network in Athens including (a) cases of reduced cross sectional area due to bridge construction, (b) torrents covered or converted into streets and (c) buildings built directly alongside the riverbed in flood-prone areas.
Figure 2.
Typical examples of the condition of the drainage network in Athens including (a) cases of reduced cross sectional area due to bridge construction, (b) torrents covered or converted into streets and (c) buildings built directly alongside the riverbed in flood-prone areas.
4. Results and Discussion
In total, 1,819 damages and 182 fatalities were recorded between 1880 and 2010 in Athens basin, caused by 52 flood events. A significant number of FIs was found to be clustered in the central part of the city in agreement with the findings of Nikolaidou and Chatzichristou [
27] and Diakakis [
28]. However, examination of their spatial distribution in different time segments showed a gradual dispersion of these incidents across Athens basin. Comparison with the evolution of the built areas showed that this dispersion follows the gradual expansion of the city throughout the study period (
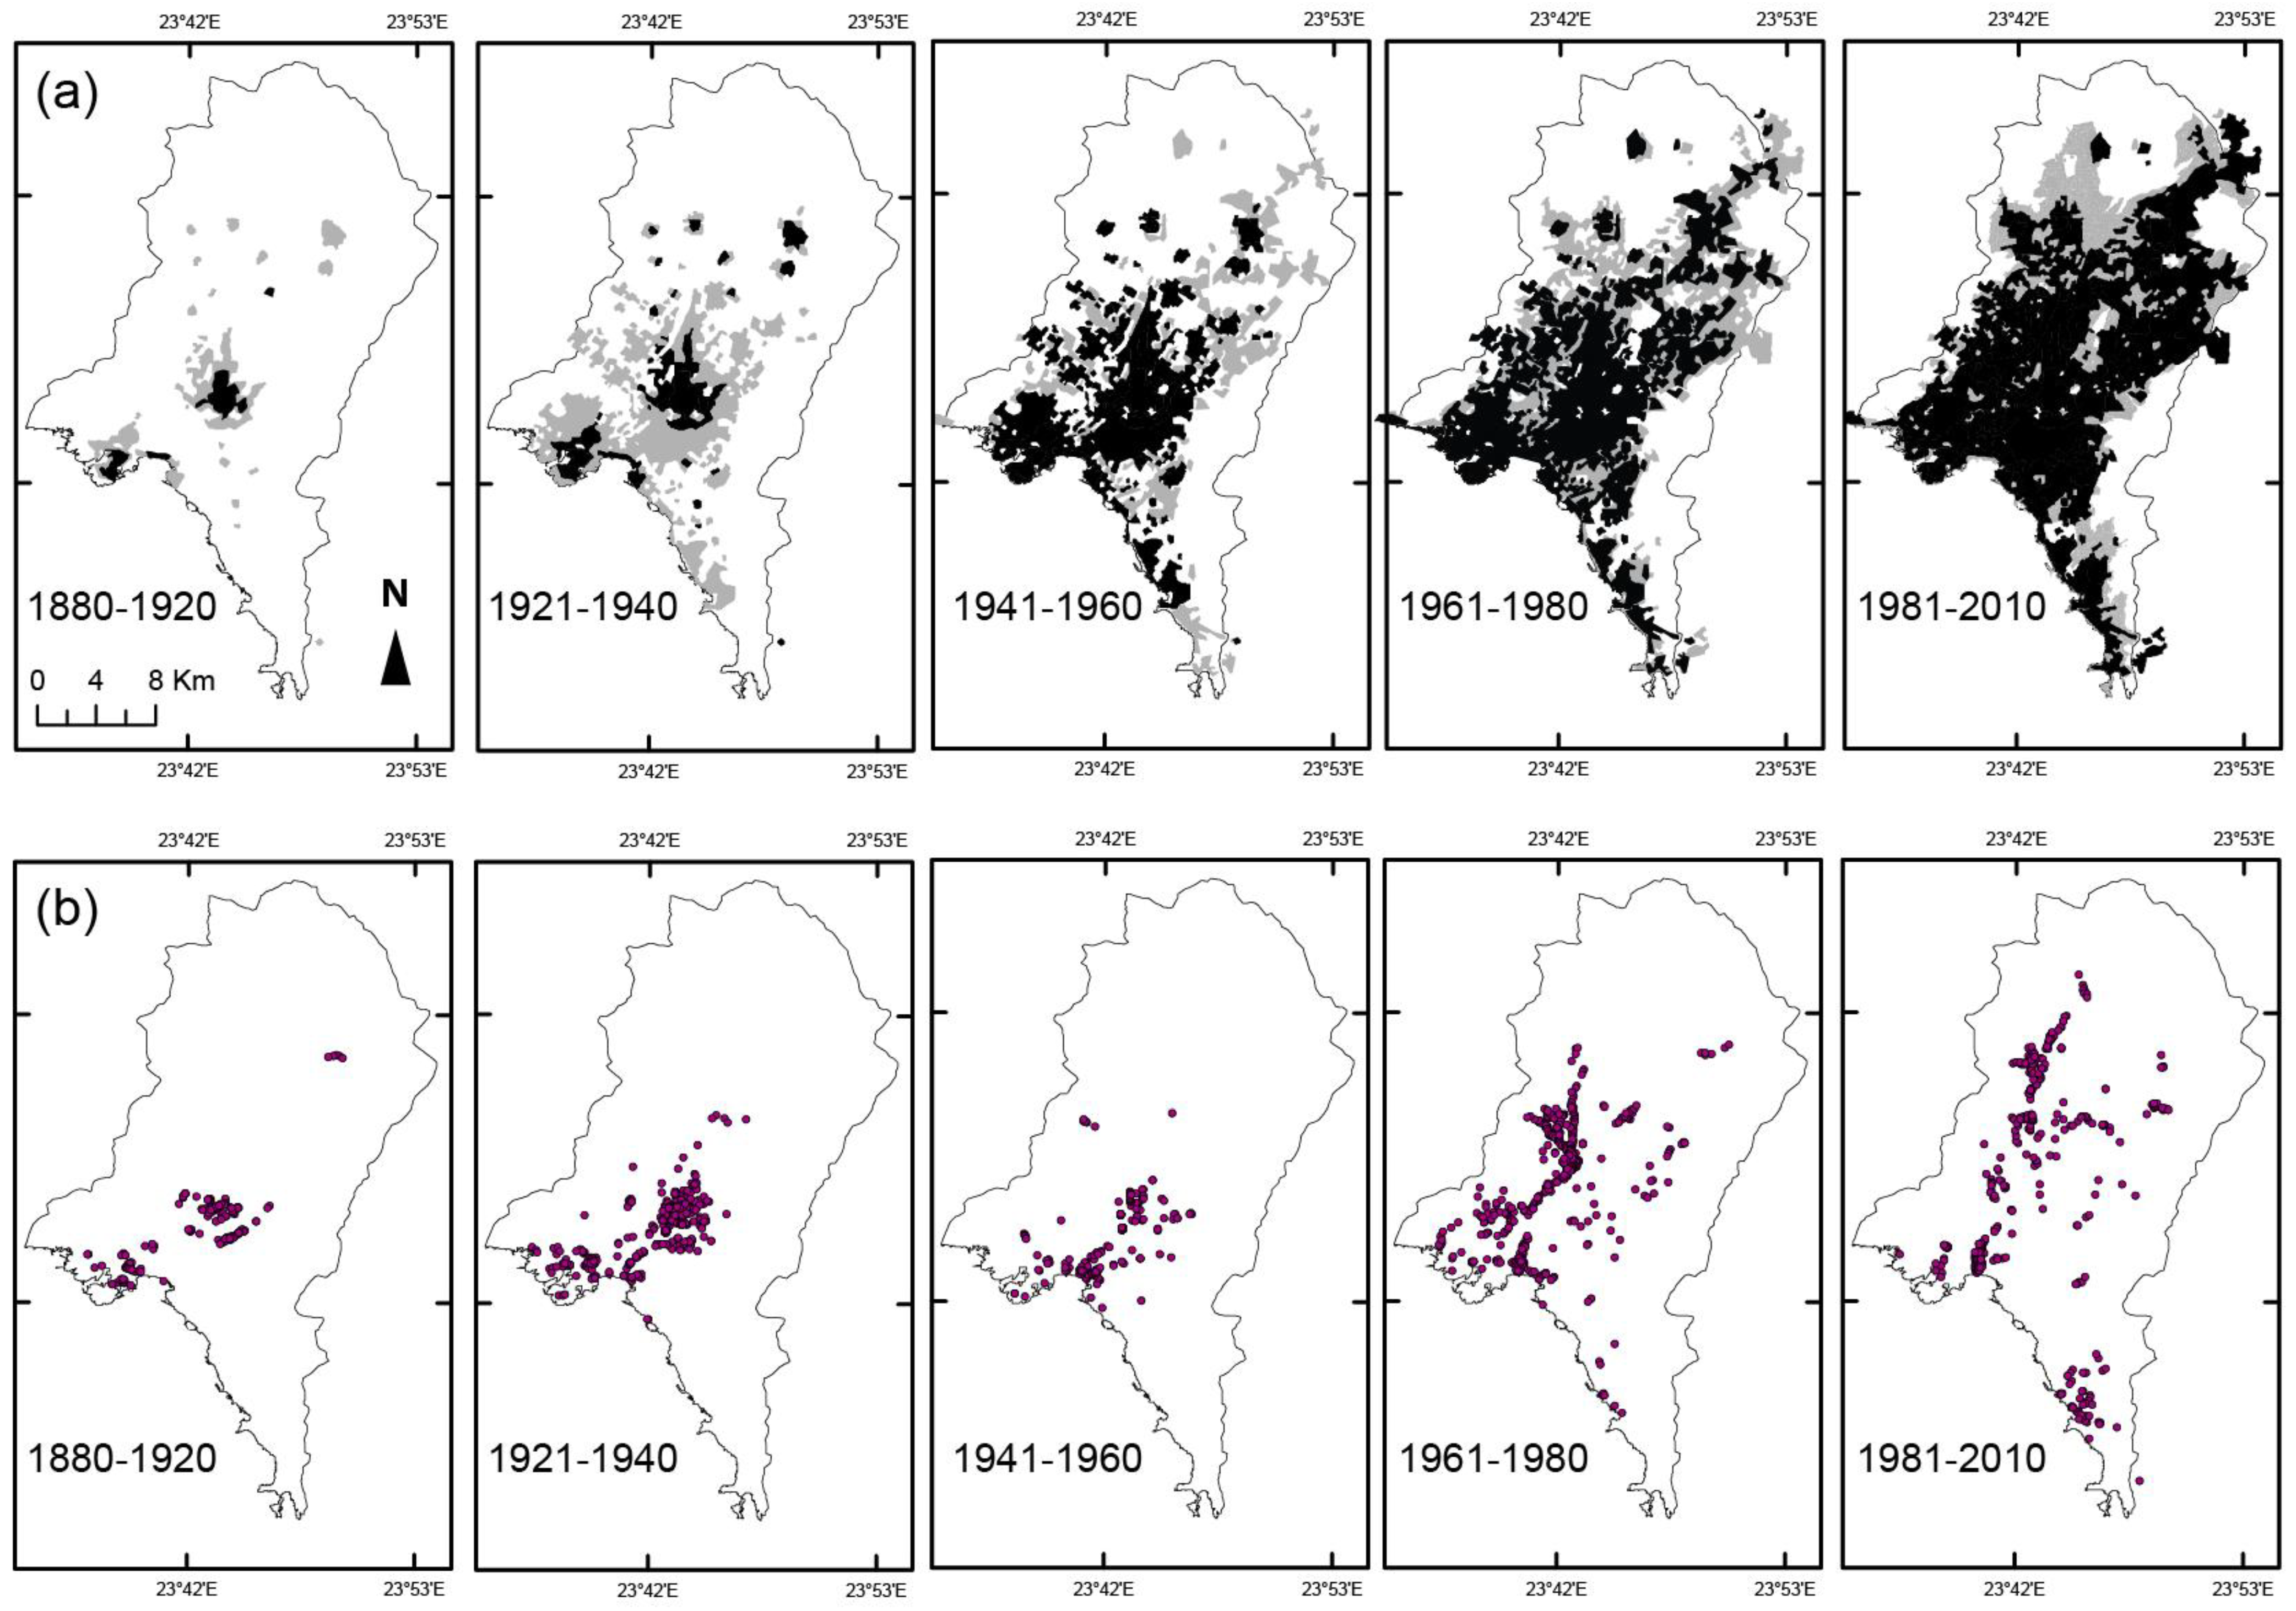
Figure 4).
The dispersion of FI locations is evident mostly after 1960 (
Figure 4b), after an extensive development of Athens towards the west and the northeast recorded between 1940 and 1980 (
Figure 4a). Specifically, during the period from 1960 to 1980, a significant shift of FI locations towards the west is apparent, together with an increase in dispersion and a small but noticeable migration of FIs to the eastern and southern parts of the basin. During the same period, the city is expanded further towards all directions, however, the most dense and intensive development takes place at the western part [
33]. Similarly, after 1980, the development of the northern and the southern suburbs of the city coincides with a further dispersion of FI locations towards the north and the south parts. In addition, a small migration of FI locations towards the east and northeast is also noticeable although it is considered limited in comparison with the extent of the city’s growth in these areas.
Figure 4.
(
a) Spatial evolution of the city’s built environment according to [
31,
32,
33] and (
b) of the flood-related incidents in five study periods. The dark and the light grey areas represent the limits of the city at the beginning and at the end of each period, respectively.
Figure 4.
(
a) Spatial evolution of the city’s built environment according to [
31,
32,
33] and (
b) of the flood-related incidents in five study periods. The dark and the light grey areas represent the limits of the city at the beginning and at the end of each period, respectively.
Despite the gradually increased dispersion in all five segments of the study period, the migration of FI locations towards the north and the west is much more extensive than towards the northeast, where the city has experienced significant development. This is attributed to the fact that the western and central part of the basin is developed within higher flood hazard areas, that is the floodplain of Kifissos river, which is the principal part of the local drainage network and the part with the richest flood record [
27,
28].
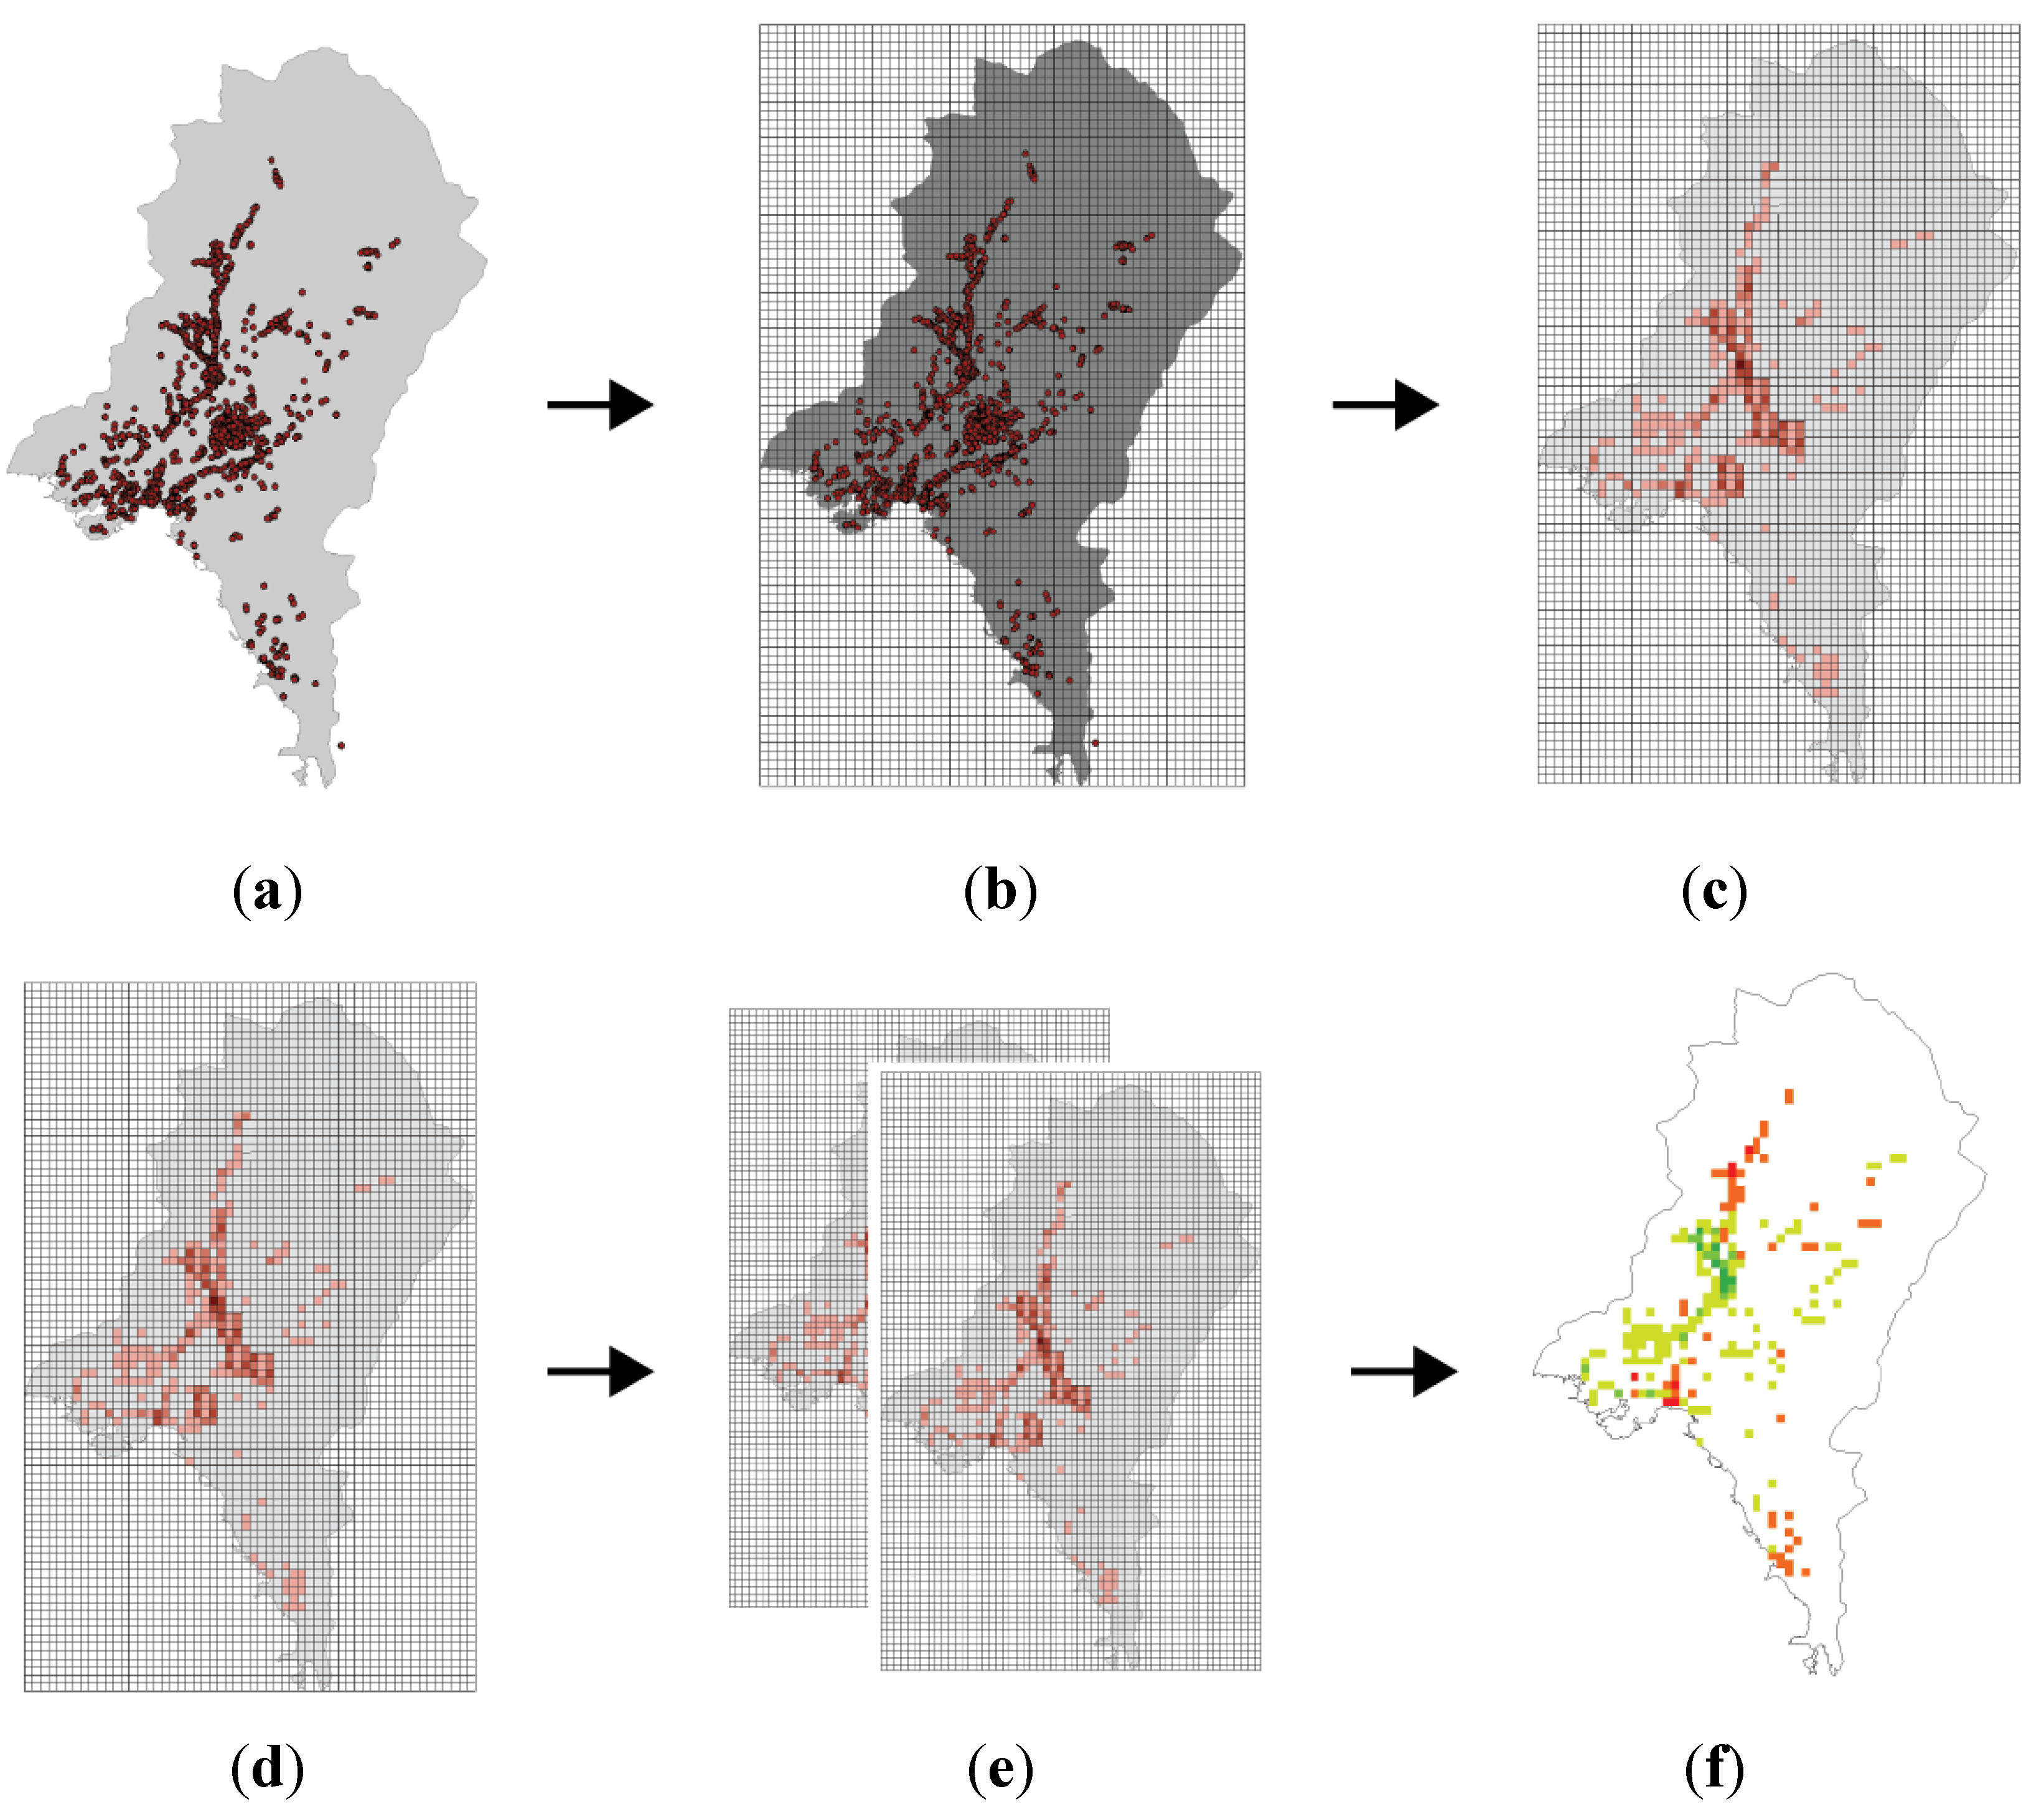
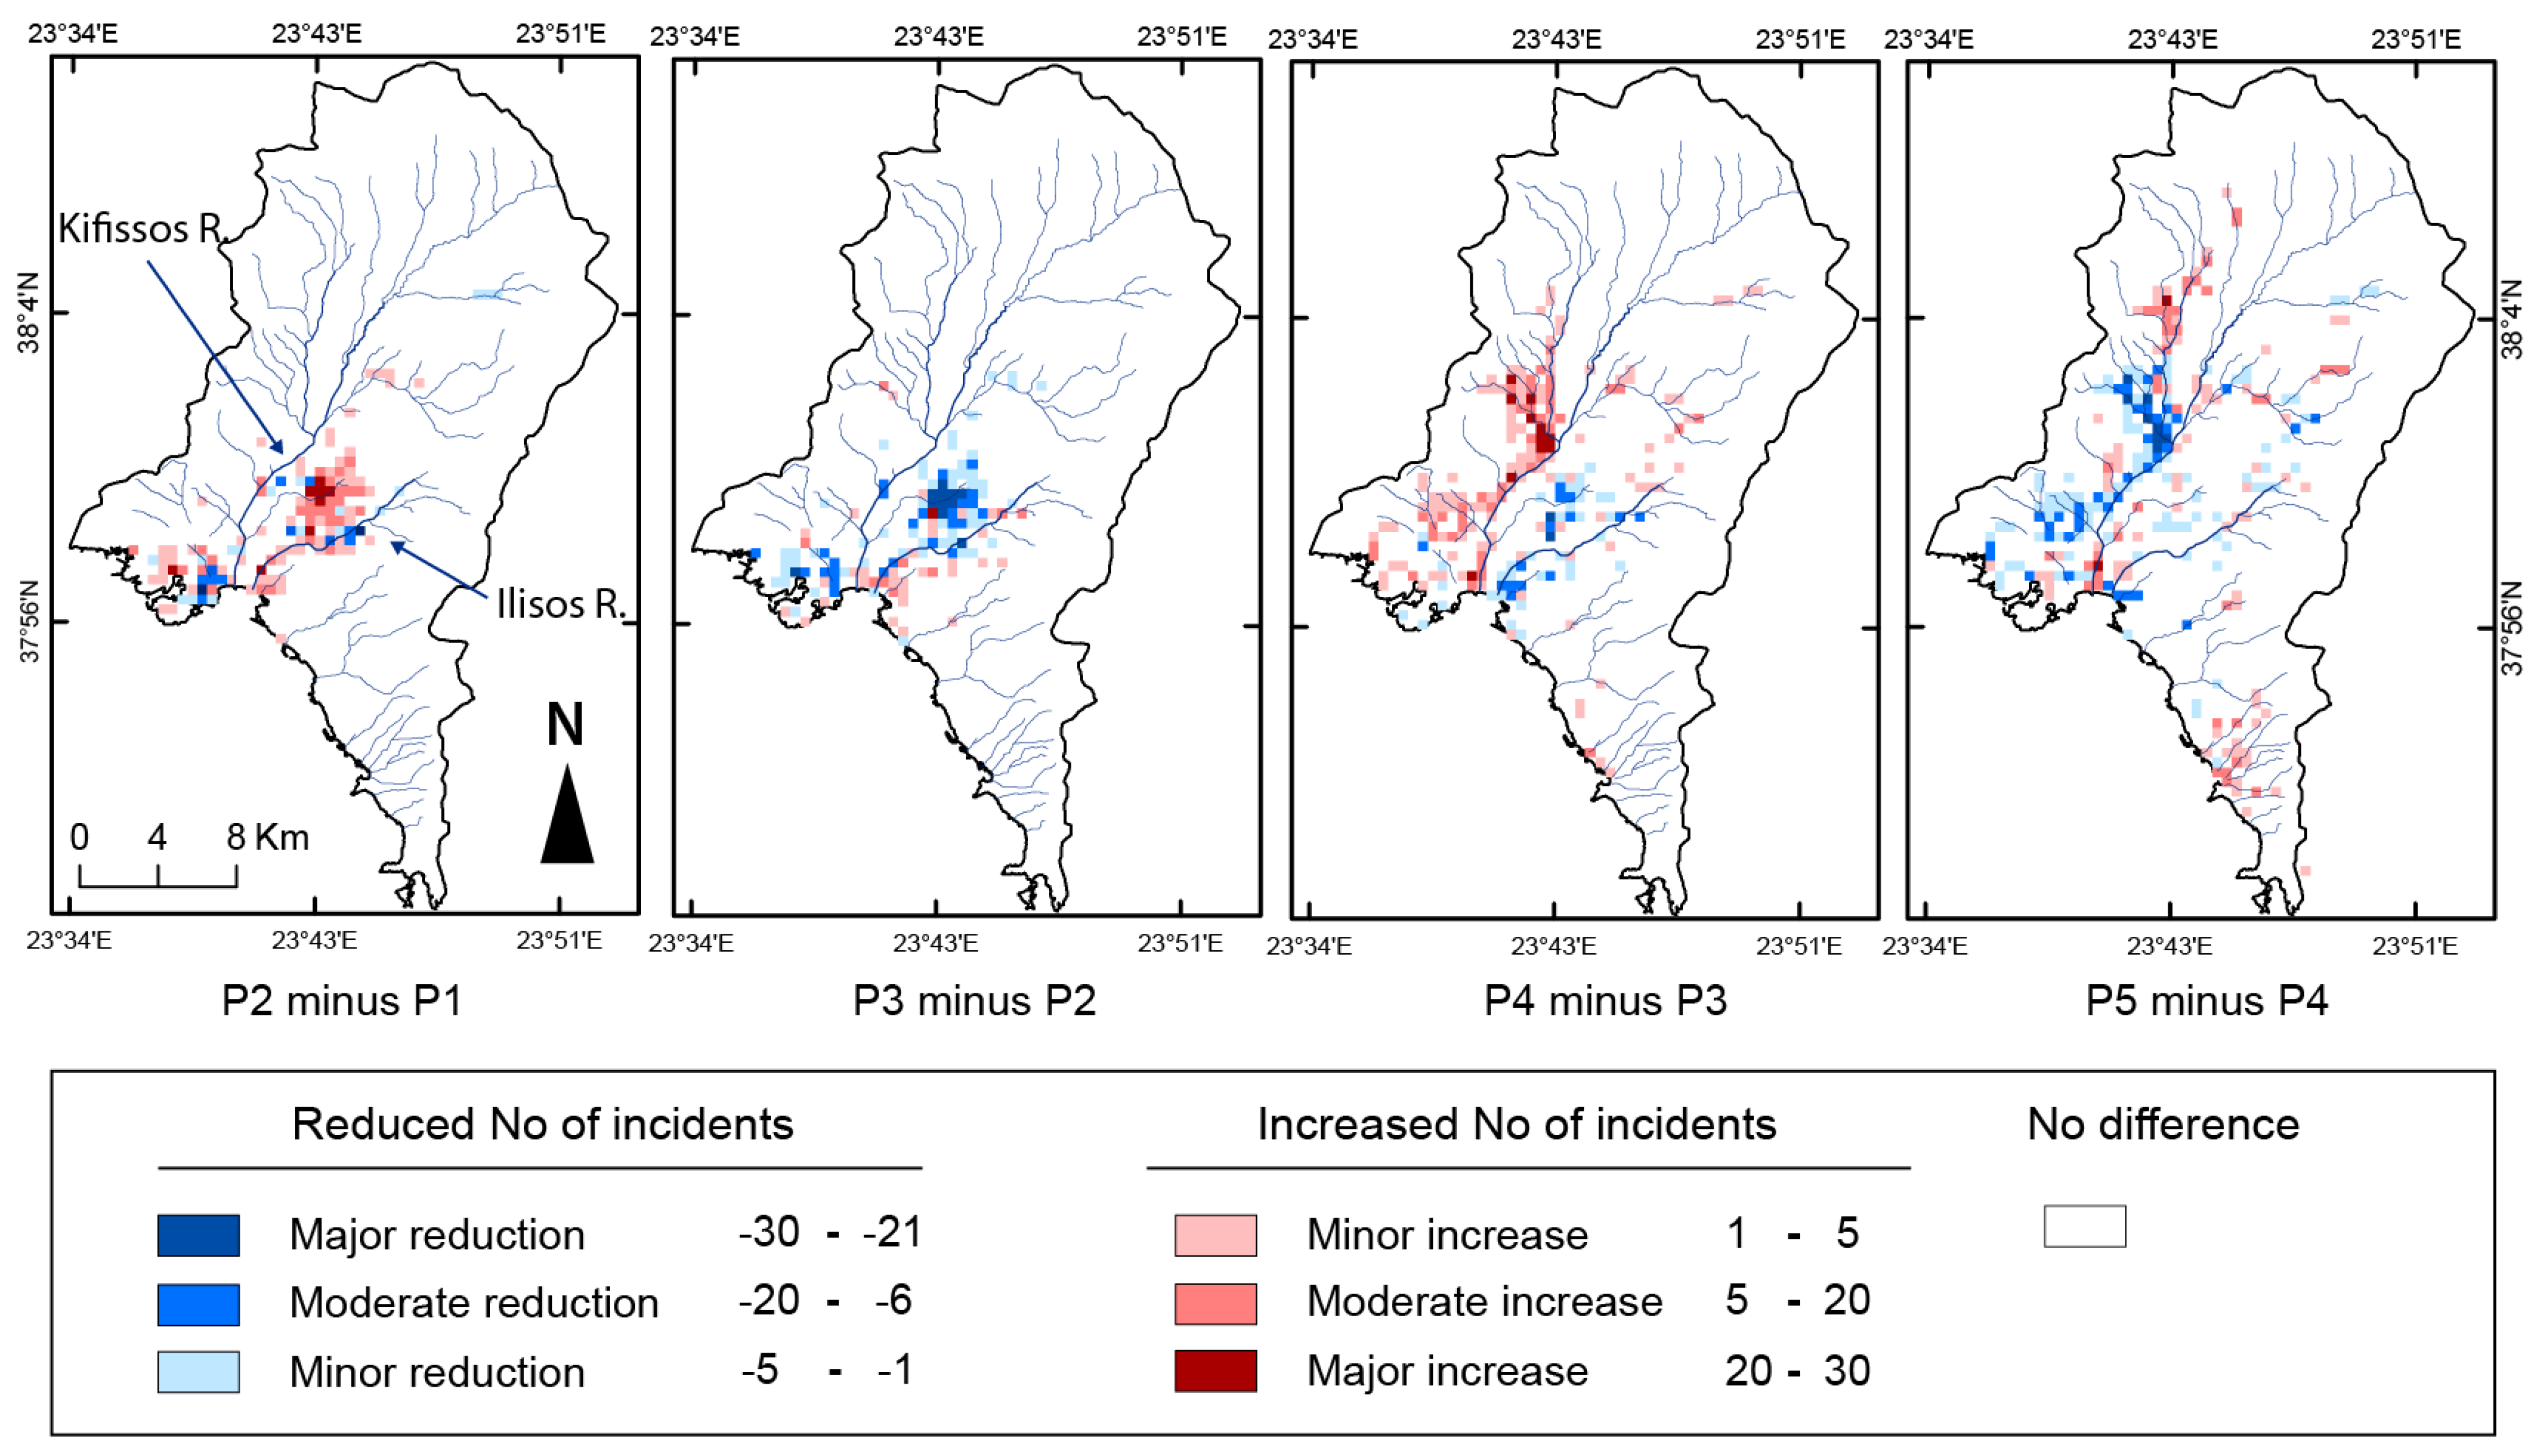
Quantification of spatio-temporal differences of incident locations between successive segments of the study period was possible through subtraction of grids on a cell-by-cell basis (
Figure 5).
Figure 5.
Spatio-temporal differences of incident locations count between successive segments of the study period through subtraction of respective grids on a cell-by-cell basis.
Figure 5.
Spatio-temporal differences of incident locations count between successive segments of the study period through subtraction of respective grids on a cell-by-cell basis.
In detail, subtraction of P2 (1920–1940) from P1 (1880–1920) grid showed an important increase of FI numbers in central Athens, indicating an increase of incidents in this specific location. On the contrary, subtraction of P3 (1940–1960) from P2 (1920–1940) grid showed a decrease of FI numbers in the central part and a slight increase near the coast, southwest of the center where Kifissos and Ilissos flow into the sea. No significant shift in spatial terms is identified in this case. Nevertheless, a decline in their numbers is apparent. Subtraction of P4 (1960–1980) from P3 (1940–1960) grid shows an important shift in locations of FIs with a substantial and spatially extensive increase in the western part and a decrease in the central part of the city. Moreover, a minor but distinct increase is apparent in the east and northeast and in the south of the basin. At the coast, the number of FIs is showing a rise around Kifissos River mouth and a decrease around Ilissos mouth (shown in
Figure 1), indicating a decline in flood events occurring in Ilissos basin. Finally, the subtraction of P5 (2010–1980) from P4 (1960–1980) grid shows an extensive decrease of incidents in the western part of the city and a moderate but clear increase in the northwest and the southern parts. In this case too, the area around the mouth of Kifissos is the only location in the oldest part of the city that presents an increase.
Overall, results show that after 1960, the number of FIs in the central part of the city is greatly reduced and a migration towards all directions is recorded. However, the prevalent shift is the one towards the west. After 1980, the increase in the southern suburbs becomes clear and a migration is recorded from the western part towards the northwest. Meanwhile, the western part of the city presents a substantial decrease in numbers, although FIs still exist after 1980 in this area (
Figure 4b). This decrease in the older parts of the city shows a migration rather than an expansion of flooding phenomena towards the newest parts of Athens. This trend is attributed to structural measures taken after flood events in the central parts of the drainage network [
28] that gradually improved the discharge capacity of the rivers, mitigating the local flooding problems. Such measures included building restrictions in the vicinity of rivers [
35], bridge redesign using more durable construction materials (such as armed cement) and higher safety standards. In addition, in parts of the river network where floods occurred repeatedly, embankments were developed and channels were improved using gabions and concrete walls that provided higher discharge capacity, stable riverbanks and reduced erosion rates. Nevertheless, the area around the mouth of Kifissos River, although situated in the oldest part of the city (
Figure 4a), records an increase in FI numbers in all consecutive periods, indicating a persistence of flood phenomena in the area (
Figure 4b and
Figure 5).
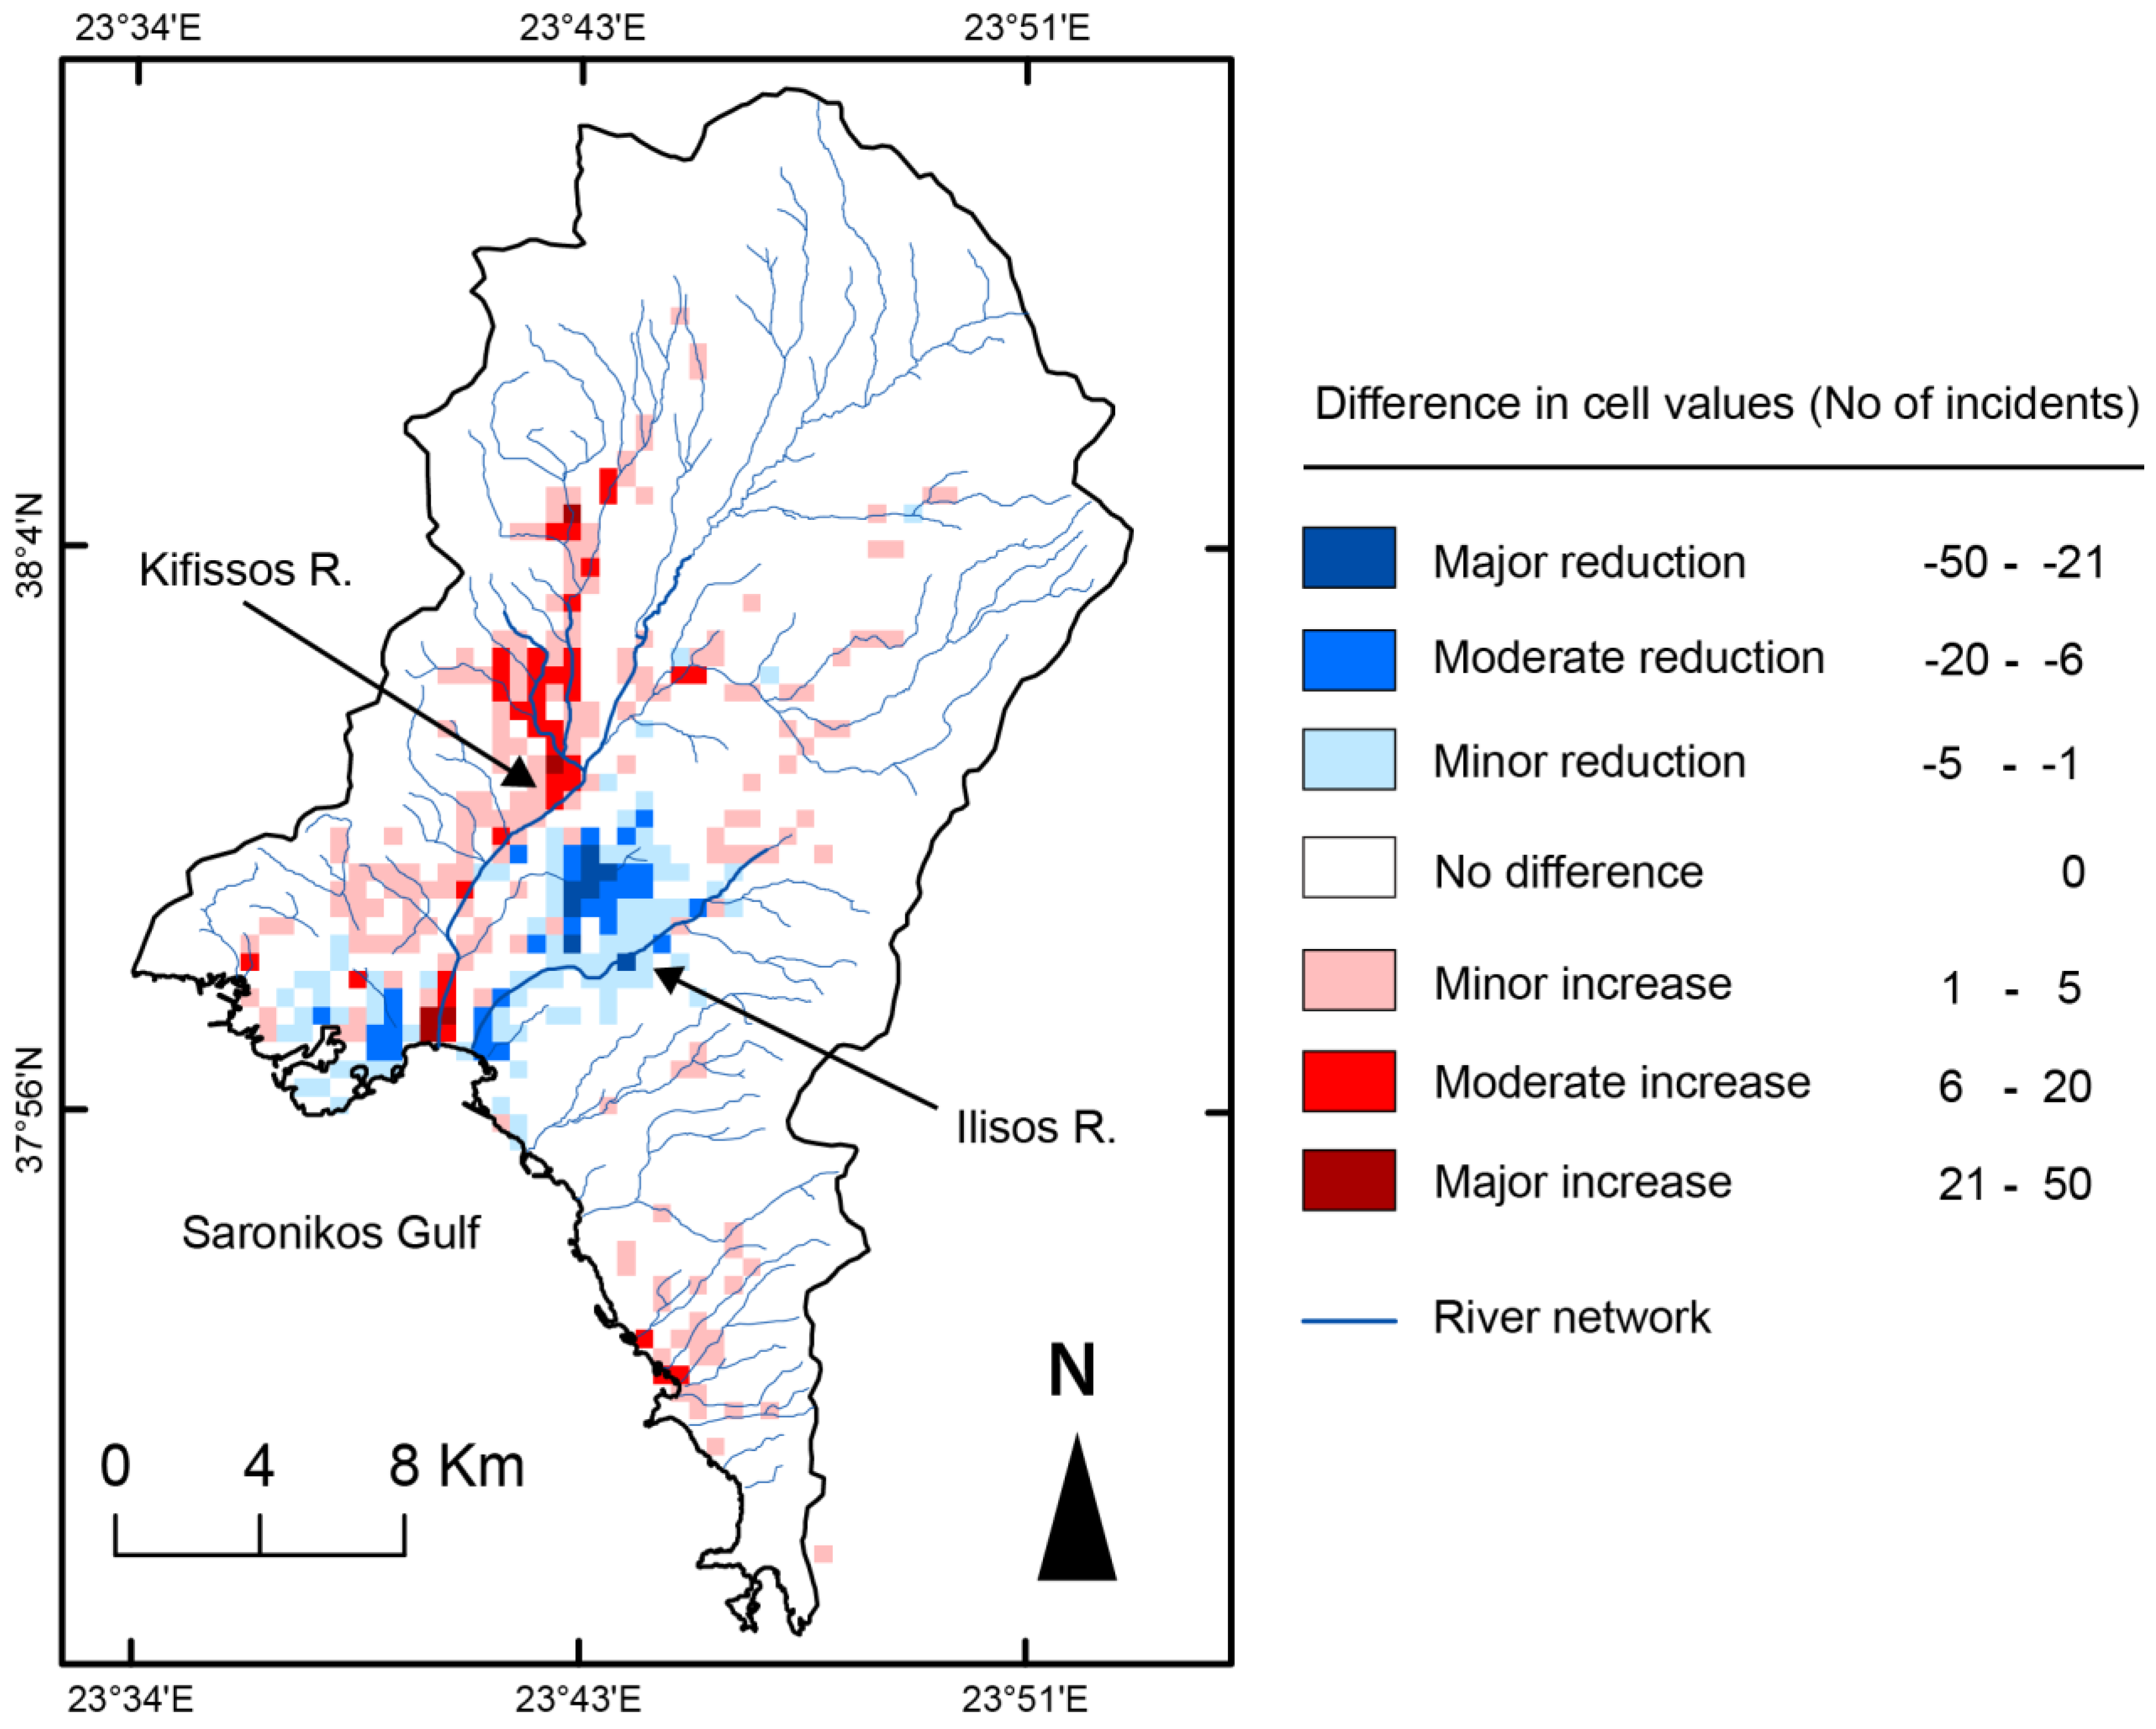
Given the importance of the 1960 change, a comparison was carried out, using the same method, between the locations of FIs before and after 1960. The result showed a substantial increase of flood-related incidents towards the west and the northwest, mostly along the route of Kifissos (
Figure 6).
Figure 6.
Change in flood-related incident numbers between the periods 1880–1960 and 1960–2010 in Athens metropolitan area.
Figure 6.
Change in flood-related incident numbers between the periods 1880–1960 and 1960–2010 in Athens metropolitan area.
In addition, an increase was recorded in the southern suburbs. On the contrary, an important decrease in numbers of FIs is recorded in the central (and oldest) parts of the city. An exception to this decline is the area near the mouth of Kifissos River, which shows a spatially limited but substantial increase. Finally, the eastern and northeastern part of the basin presents a minor but clear rise in FI numbers.
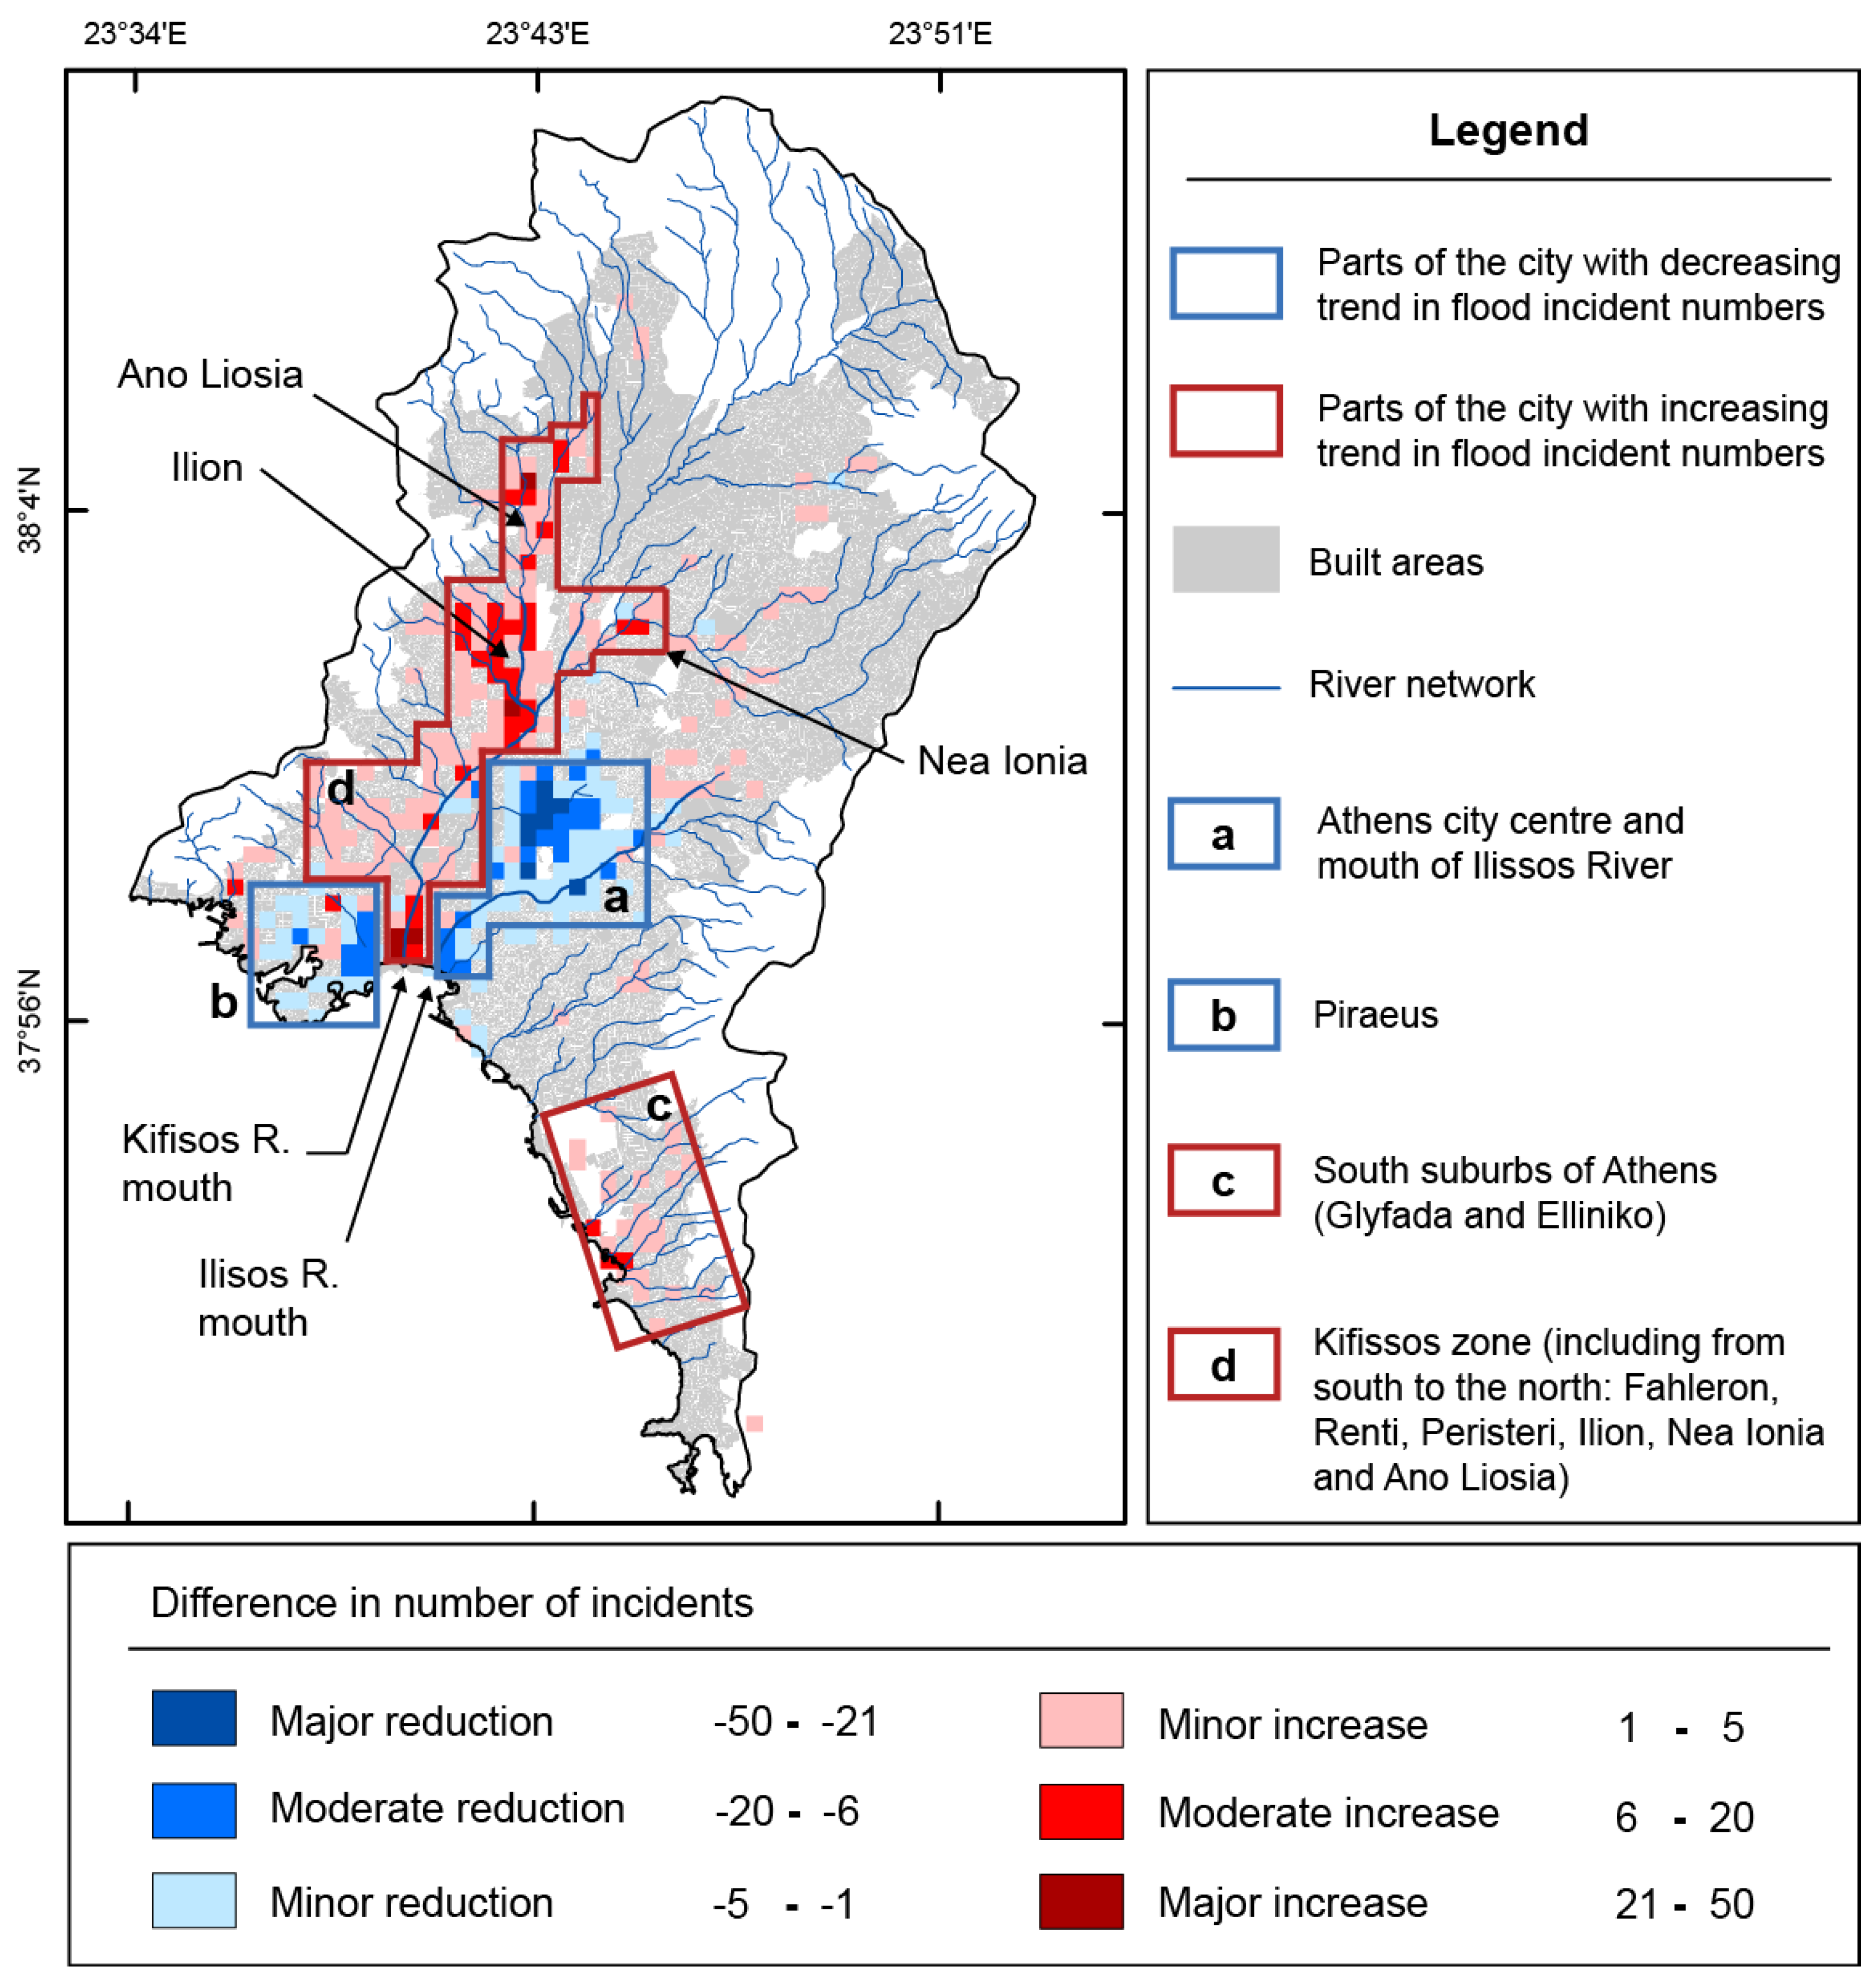
Based on this comparison, the parts of the city that present distinct increasing or decreasing trends can be delineated (
Figure 7).
Figure 7.
Delineation of parts of the city presenting increasing and decreasing trends in flood-related incident numbers.
Figure 7.
Delineation of parts of the city presenting increasing and decreasing trends in flood-related incident numbers.
Two main areas of decrease in FI numbers can be identified at the central part of the basin at the oldest part of the city. One of them corresponds to the area of the city center of Athens, the main course of Ilissos River and its mouth on Saronikos Gulf (
Figure 7a). The second one is the area around the port of Piraeus to the southwest of the basin. On the contrary, two parts of the city were found to present a general increasing trend. The first is located in the southern suburbs of the city (
Figure 7c) near the municipalities of Glyfada and Elliniko. In this area, the increase is not widespread in spatial terms and not extensive in numbers, with the exception of some locations near the coastline.
The second area is extended mainly along the course of Kifissos River and its main tributaries (
Figure 7d), over a number of different parts of the city such as Fahleron and Rentis at the southern end, Peristeri and Ilion (just northwest of the city center) and Ano Liossia on the northern end. Taking also into account the change that occurred after 1980 (shown in
Figure 5), one can conclude that, since the 1980s, the highest rate of increase occurs in the northernmost part of this area (
Figure 7d). However, substantial numbers of FIs still appear after 1980 in the western part of the basin.
The increasing trend identified in these areas is attributed to a combination of human interference with hydrological processes and natural susceptibility to flooding at these particular parts of the city. In detail, both areas experienced poorly planned and intensive development that gradually led to the decrease in the discharge capacity of the river network locally. In addition, expansion of the city in this particular part of the basin, that is the floodplain of Kifissos River and the southern suburbs, led to a substantial increase in exposure of buildings and infrastructure to high flood hazard, as dense development forced a large number of structures to be built adjacent to the river bed, in areas susceptible to flood.
Identification of the sections of the city where increasing trends are recorded is considered particularly important for flood risk mitigation. Civil protection and emergency management professionals can improve their decision making process for flood protection measures and actions by setting priorities based on the recorded trends. In addition, the performance of emergency management agencies can be improved by selecting optimum locations for emergency units and by focusing their flood risk studies on specific parts of the city where flood impact is increasing. Based on the conclusions of this study, local authorities in the locations where increase is identified (especially in the northwest and south part of the basin) should develop flood risk maps, maintain river beds and sewerage in good condition, examine the stability of the riverbanks and intervene with structural measures where needed, and study the adequacy of critical cross sections.
5. Conclusions
The study examined the spatial evolution of flood phenomena in Athens, Greece, using a spatio-temporal database. The methodology compared the distribution of flood incidents across the city in different time periods. Results showed a gradual dispersion of flood damages and fatalities from the central and oldest part of the city towards the outer parts, following the city’s growth throughout the study period.
In general, the use of a spatio-temporal database exploited the spatial analysis capabilities of GIS in monitoring the locations of incidents in the rapidly changing and complex environment of a metropolitan area like Athens. The method succeeded to illustrate and quantify the gradual migration of flood-related incidents from the central part of the city towards the western and then the northwestern and the southern parts. Two significant shifts were identified in the course of the study period—in 1960 and in 1980, respectively—defining three major phases in the migration of flooding in Athens basin.
The results provided a better understanding of the impact of flooding in the study area. Although it was known in an anecdotal sense that flood impact had expanded to the outer parts of the city, the present analysis is unique in defining this migration in spatial terms, in showing its extent and in recording the important decline of migration numbers in the oldest parts of the city, introducing in this way a migration rather than an expansion concept.
The analysis also identified particular areas of Athens that present increasing trends in flood incident numbers. This can be particularly useful for civil protection authorities as a guide during strategic decision making in setting priorities for flood mitigation measures.


