1. Introduction
Connecting cities and hinterlands, roads infrastructure is the artery of a country’s economy. It enables cheap and quick transportation of people, services and goods inland. In developing countries, of late, there has been increased focus and budget allotted for the construction and maintenance of highways. But the local urban and rural roads have been neglected due to insufficient funds, poor planning and lack of coordination between municipal authorities and contractors. Under-maintained roads deteriorate over time and become unusable and go beyond repair. In India, the better funded national highways account only for 1.9% of the entire road network, although it has the world’s second longest, length of roads. These roads are laid with asphalt, bitumen tar and concrete or even compacted mud depending upon the requirements of the location and incur different maintenance costs. Hence, statistics of the road condition or quality and road surface type is essential to help convince the decision makers to allocate budget to new roads and maintenance projects. It can also help them prioritize maintenance of certain areas depending on the extent of damage that the road incurs.
Road maintenance is either done periodically or as an event to fix major issues of road condition like potholes, surface cracks and the like. To identify and locate the latter, continuous monitoring of roads for these dynamic changes is needed as part of a well-defined operational Geographical Information systems (GIS) based Road information system that keeps track of the road condition and surface type. Apart from providing geometry and location of the road features, current GIS systems usually provide attribute data like speed limit, area type, traffic flow direction, and occasionally some of the road furniture like traffic signals and signboards. However these systems do not have an efficient data collection infrastructure to update its dynamic attributes. Current practice is to typically record manually the road characteristics for every 100 m segment, a costly and time-consuming approach to capture attributes that were either missed out previously or those that are changing over time.
Instead of observing the ground truth from manual inspections, the use of technology for accurate road quality monitoring has been preferred. Expensive vehicle mounted systems that use high power laser or radar sensors have been proposed but are a challenge to scale up across the cities and regions due to their low coverage and unavailability of skilled operators. Alternatively, using smart phones as data collection platforms has been of much interest in various studies including road monitoring applications as it has an array of useful sensors like GPS, camera,
etc. Smart phones are also pervasive and inexpensive platforms, but the use of consumer grade sensors for data collection may produce noisy and unreliable data. Hence in the context of road monitoring, cheap and smart systems need to be built that uses heterogeneous data to achieve a comparable information level of the road condition [
1,
2] similar to the expensive laser based systems. This paper proposes and builds a prototype system that recognizes and classifies road condition and road surface type by fusing multisensory data, derived from accelerometer, GPS and camera, at an information level. It efficiently classifies the road surface type into asphalt/bitumen tar, concrete or mud roads and the road condition into four distinct levels, which are good, satisfactory, unsatisfactory and poor.
2. Existing Road Monitoring Systems
While a range of road monitoring systems are in practice, ranging from a fully manual, paper based one to a fully automated laser guided engineering grade information provider, it is important to understand and evaluate these in terms of information diversity, accuracy and the related parameters: affordability and scalability. Road monitoring agencies have witnessed a paradigm shift from camera-based systems towards laser scanners starting with the introduction of “LASER Road Imaging System” (LRIS) in 2005 [
3] and similar laser systems like IBEO Laser [
4] and PPS [
5]. Typically, one or two illuminating laser beams reflected by the road surface are imaged by line cameras to provide 3D profile of the road. These systems provide high fidelity (1 mm resolution) and low per-sortie operational time (>100 Kph). However high equipment cost, complexity of data processing and skilled resource requirement of these systems slows down the overall operation and make them impractical to be applied as a tool for continuous road monitoring. VOTERS PAVEMON [
6] is a web based GIS system that uses integrated multi sensor data like tire pressure sensor, accelerometer, laser, radar, and imagery to arrive at road distress parameters. Despite the capabilities, the need for specialized vehicle set up confines the system from being used as a mass data collection platform. While the above two systems provide engineering grade accurate information on the road condition, other additional information like road surface has to be manually collected. In addition, these systems score less on affordability and scalability.
Imitating the recent trend in data collection methodologies, smart phones have been utilized as a road monitoring platform. Smartphones in today’s world are a frequent sight and also have an arsenal of valuable sensors to be used for data collection. Sophisticated systems may be beneficial but cell phone based systems can easily scale up and is a valuable advantage that they offer. Smart phone based prototypes Nericell [
7] and Wolverine [
8] detect road bumps based on change in accelerometer readings along the direction of gravity (Z direction). Additionally, they also estimate the traffic conditions based on braking events that results in persistence of surge in accelerometer reading along the direction of vehicle motion (X direction). While Nericell employs fixed thresholds Z-Peak [
9] and Z-Sus [
7] at two speed levels for road condition classification, Wolverine learns the thresholds by training an SVM based on six features—the mean and standard deviations in the three coordinate axes (µX, µY, µZ, σX, σY and σZ) over a window of 1 s. Work has also been done in distinguishing potholes from other road anomalies like rail crossing, center lane lights, speed breakers
etc. (Pothole Patrol (P
2) [
9]) by analyzing the patterns in accelerometer reading using X–Z ratio and Speed-Z ratio. The assumption that potholes impact only one side of the car and spatial clustering on collected data improved the accuracy of the detection by reducing false positives. Roadroid [
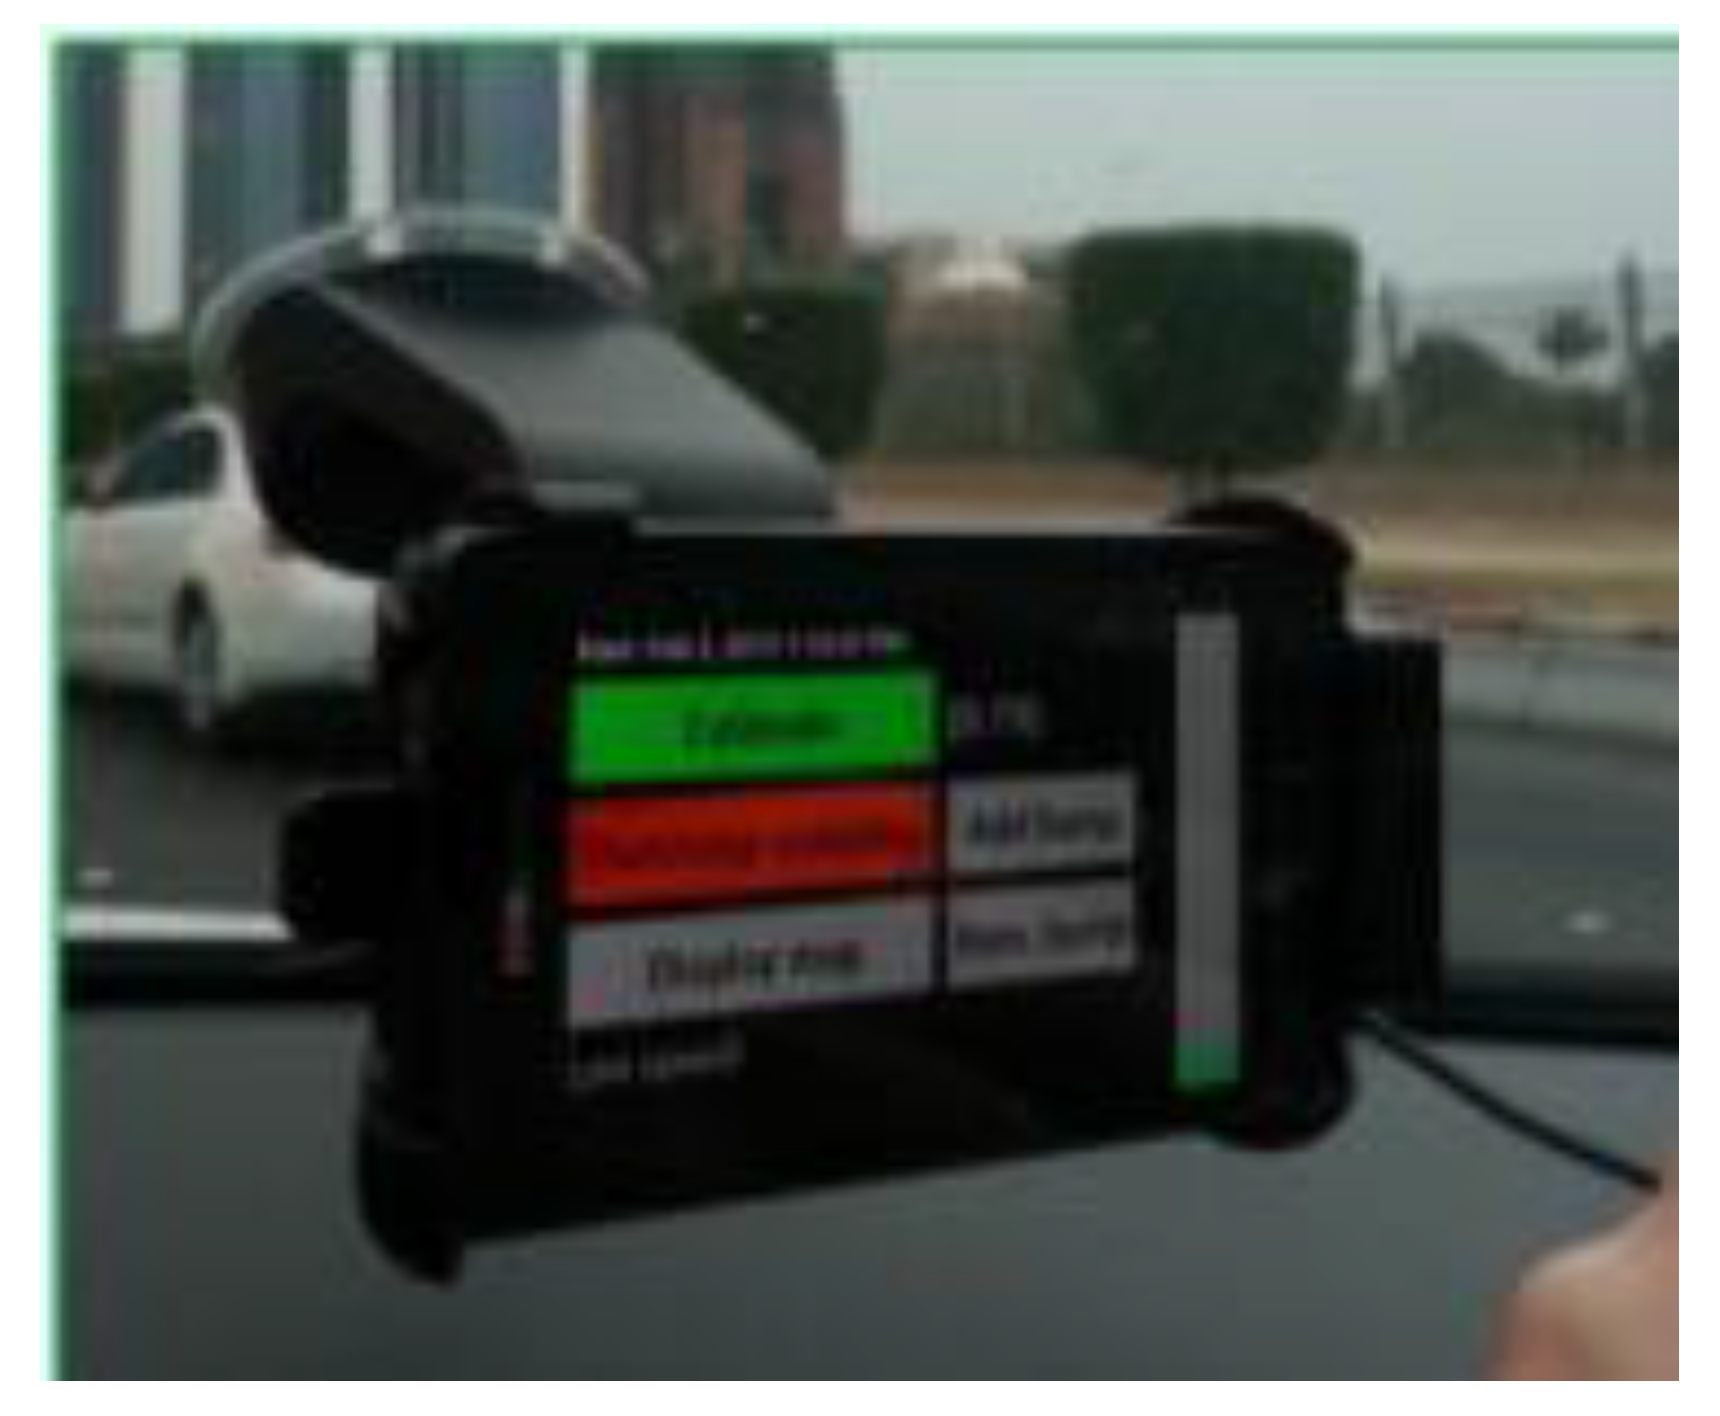
1] is a commercially available smart phone based system for road monitoring. It classifies the road into good, satisfactory, unsatisfactory and poor based on calculated IRI (International Roughness Index) values and claims 80% to 90% accuracy for the results. Vehicle type and mobile platform sensitivity are taken into account for the calculations involved. This system can also be used as an inspection tool by manually adding information about bumps and also taking snapshots of the road and uploading them to the web database. The road surface imagery that is collected is used only for manually validating the road condition reports and no useful information is extracted automatically out of them. Smart phone running Roadroid App is shown in the
Figure 1.
Figure 1.
Roadroid App on a Smartphone.
Figure 1.
Roadroid App on a Smartphone.
Though these smartphone based systems are affordable and scalable, the main drawback of these are that they produce data at an information quality level of 3 or 4 compared to precision laser systems whose quality level is 1 [
2]. Research needs to focus on using additional data, either heterogeneous or redundant, in order to push up the accuracy score of these systems. Earlier system designs were dominated by system performance [
7,
8] but with the ever-increasing processing capabilities, phones are equipped to handle computationally expensive tasks like on-board image processing. This opens up a lot more possibilities in data gathering. Moreover, road monitoring does offer the luxury of offline processing.
3. System Design
3.1. Process Block Diagram
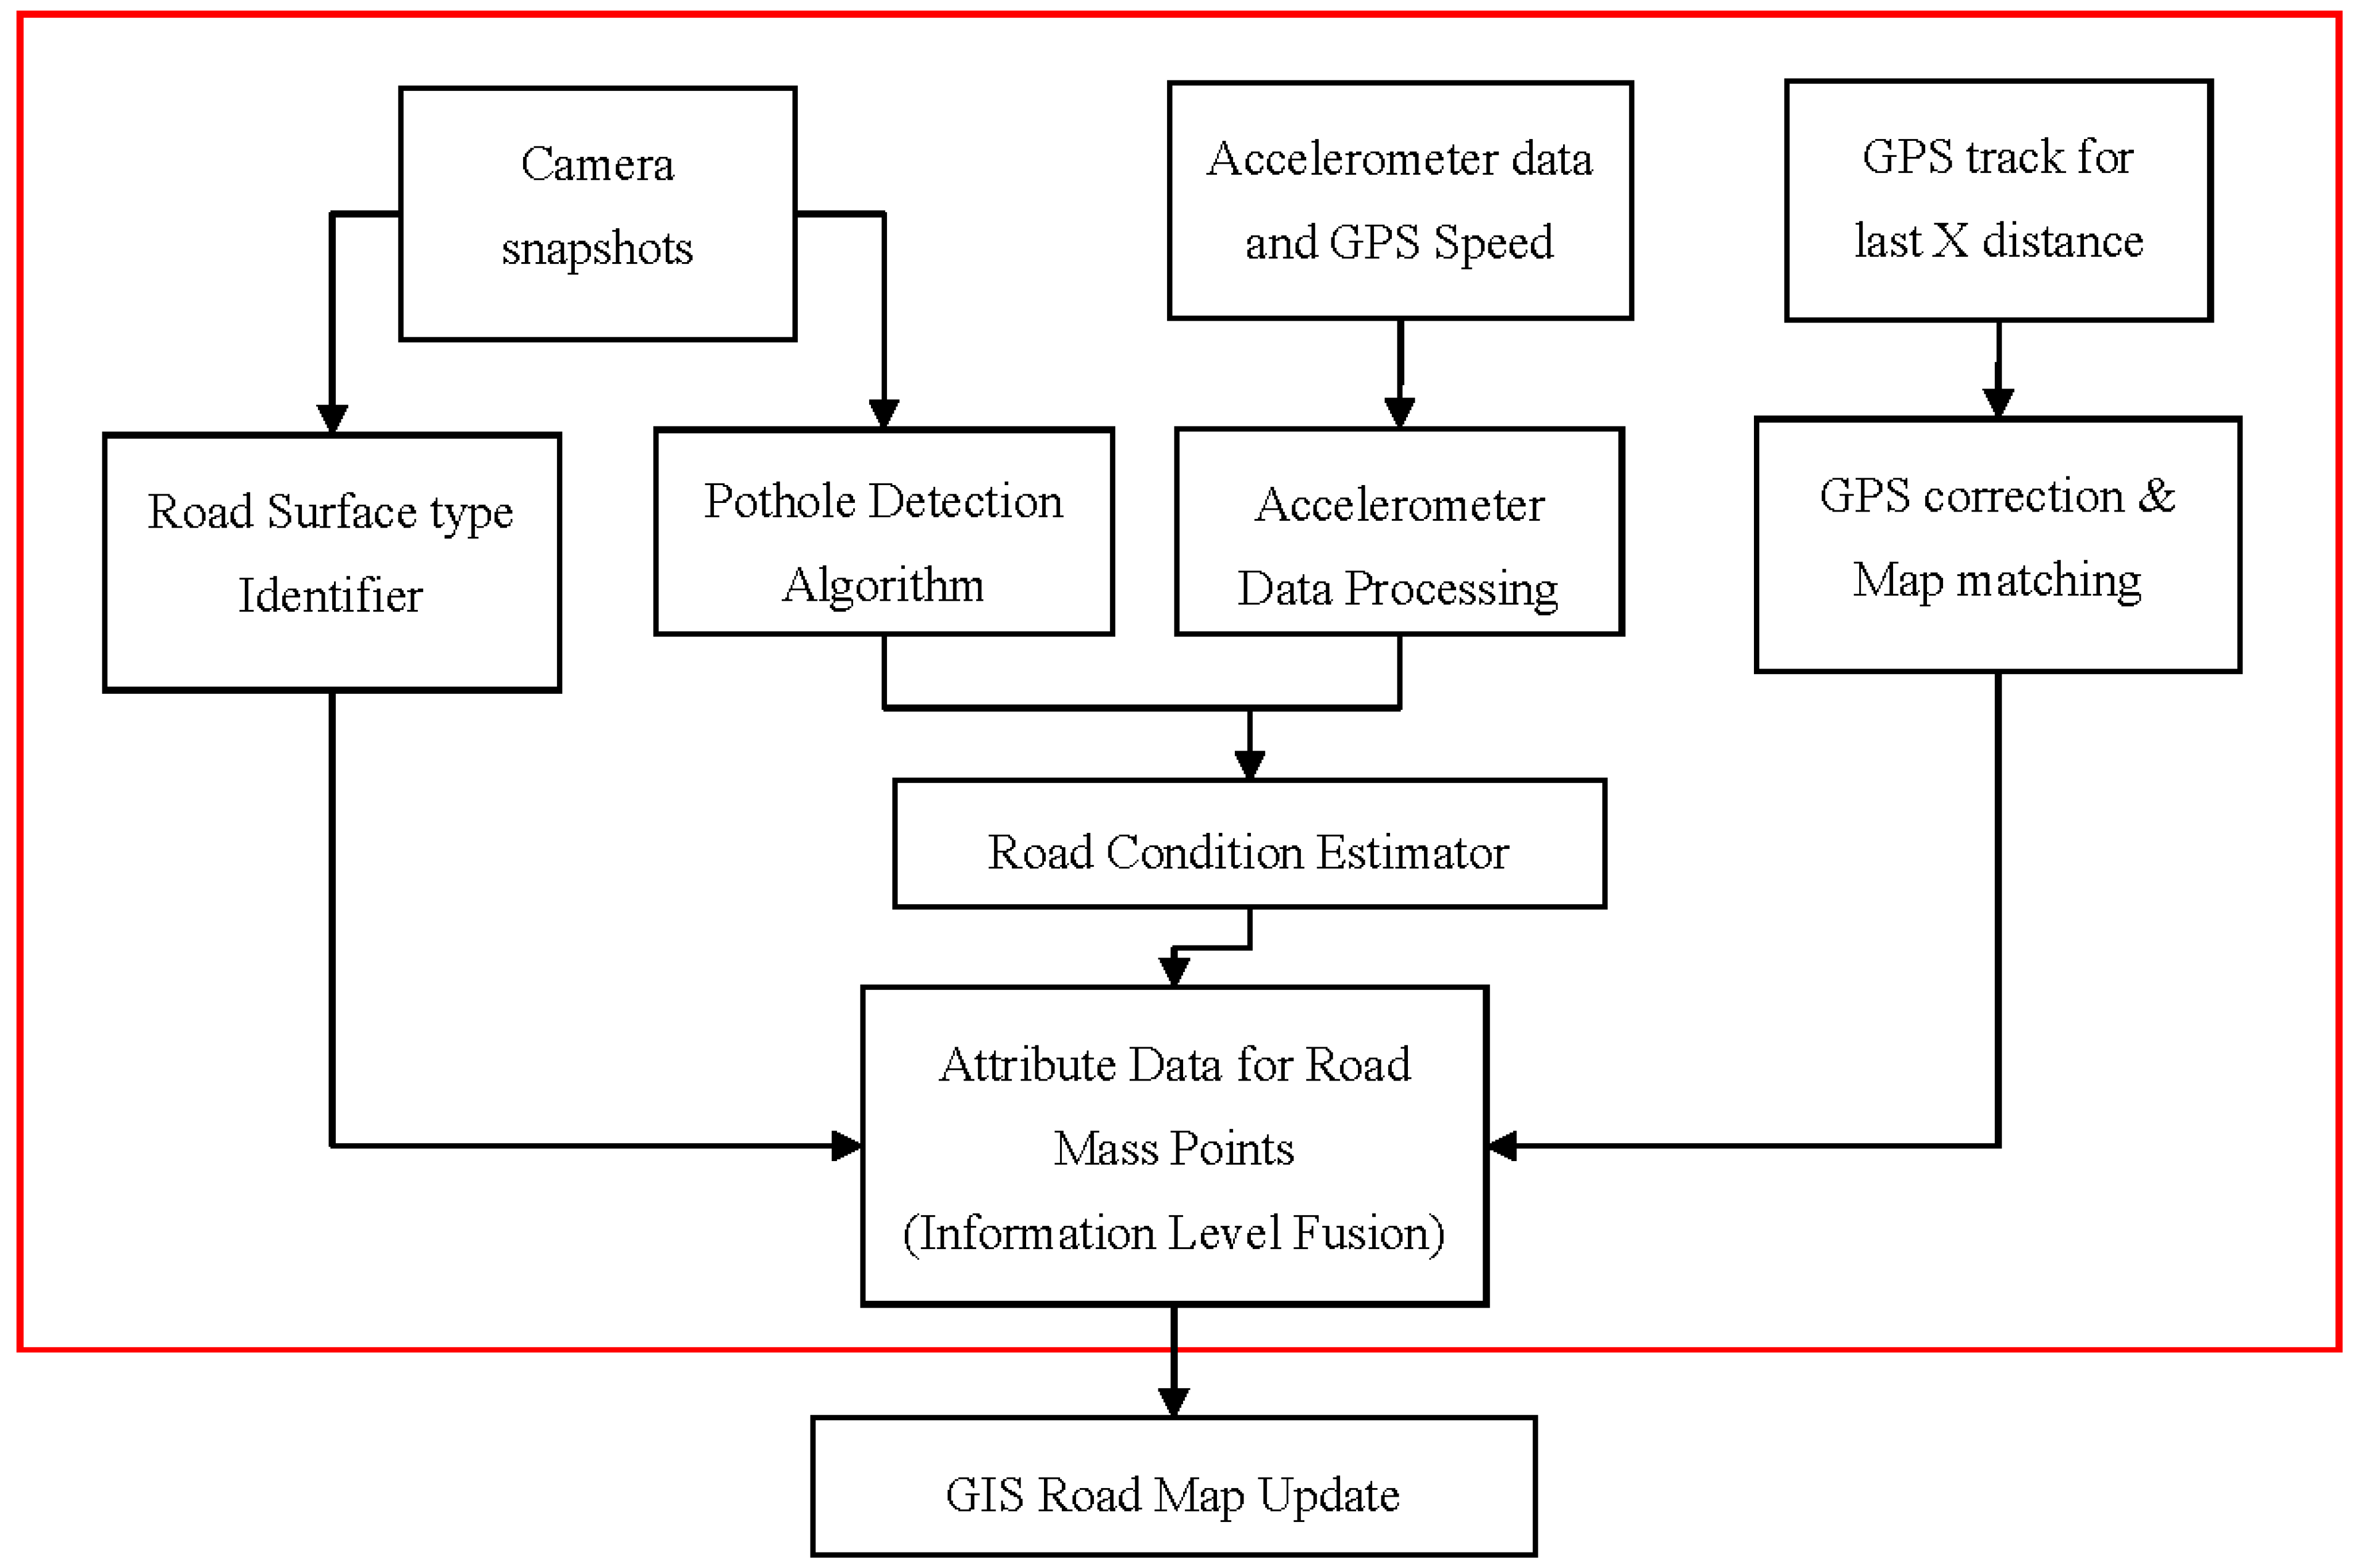
The proposed system uses camera images, GPS trajectory and accelerometer data to perform spatially explicit road surface type and road condition mapping. The system is primarily aimed at monitoring and updating a Road GIS database with appropriate attribute information. At present, this system is not a road evaluation tool and generating engineering grade data is out of its scope.
Figure 2 shows the functional blocks of the proposed system, MAARGHA.
Road surface type estimation is performed using the periodic snapshots from the camera. Independently, images that are captured are utilized for detecting potholes. It provides additional information to the road condition estimator thread that is performed in parallel using accelerometer and GPS speed data. Information obtained from all the processing threads are finally fused at an information level using the present position given by the GPS map matching algorithm. Result is a set of road mass points whose attribute data is generated. The attribute data can then be used to update the road characteristics on a GIS database. This paper focuses on the part of the system shown by the process blocks bound within the red box in
Figure 2.
Figure 2.
MAARGHA system Overview.
Figure 2.
MAARGHA system Overview.
3.2. Prototype Design
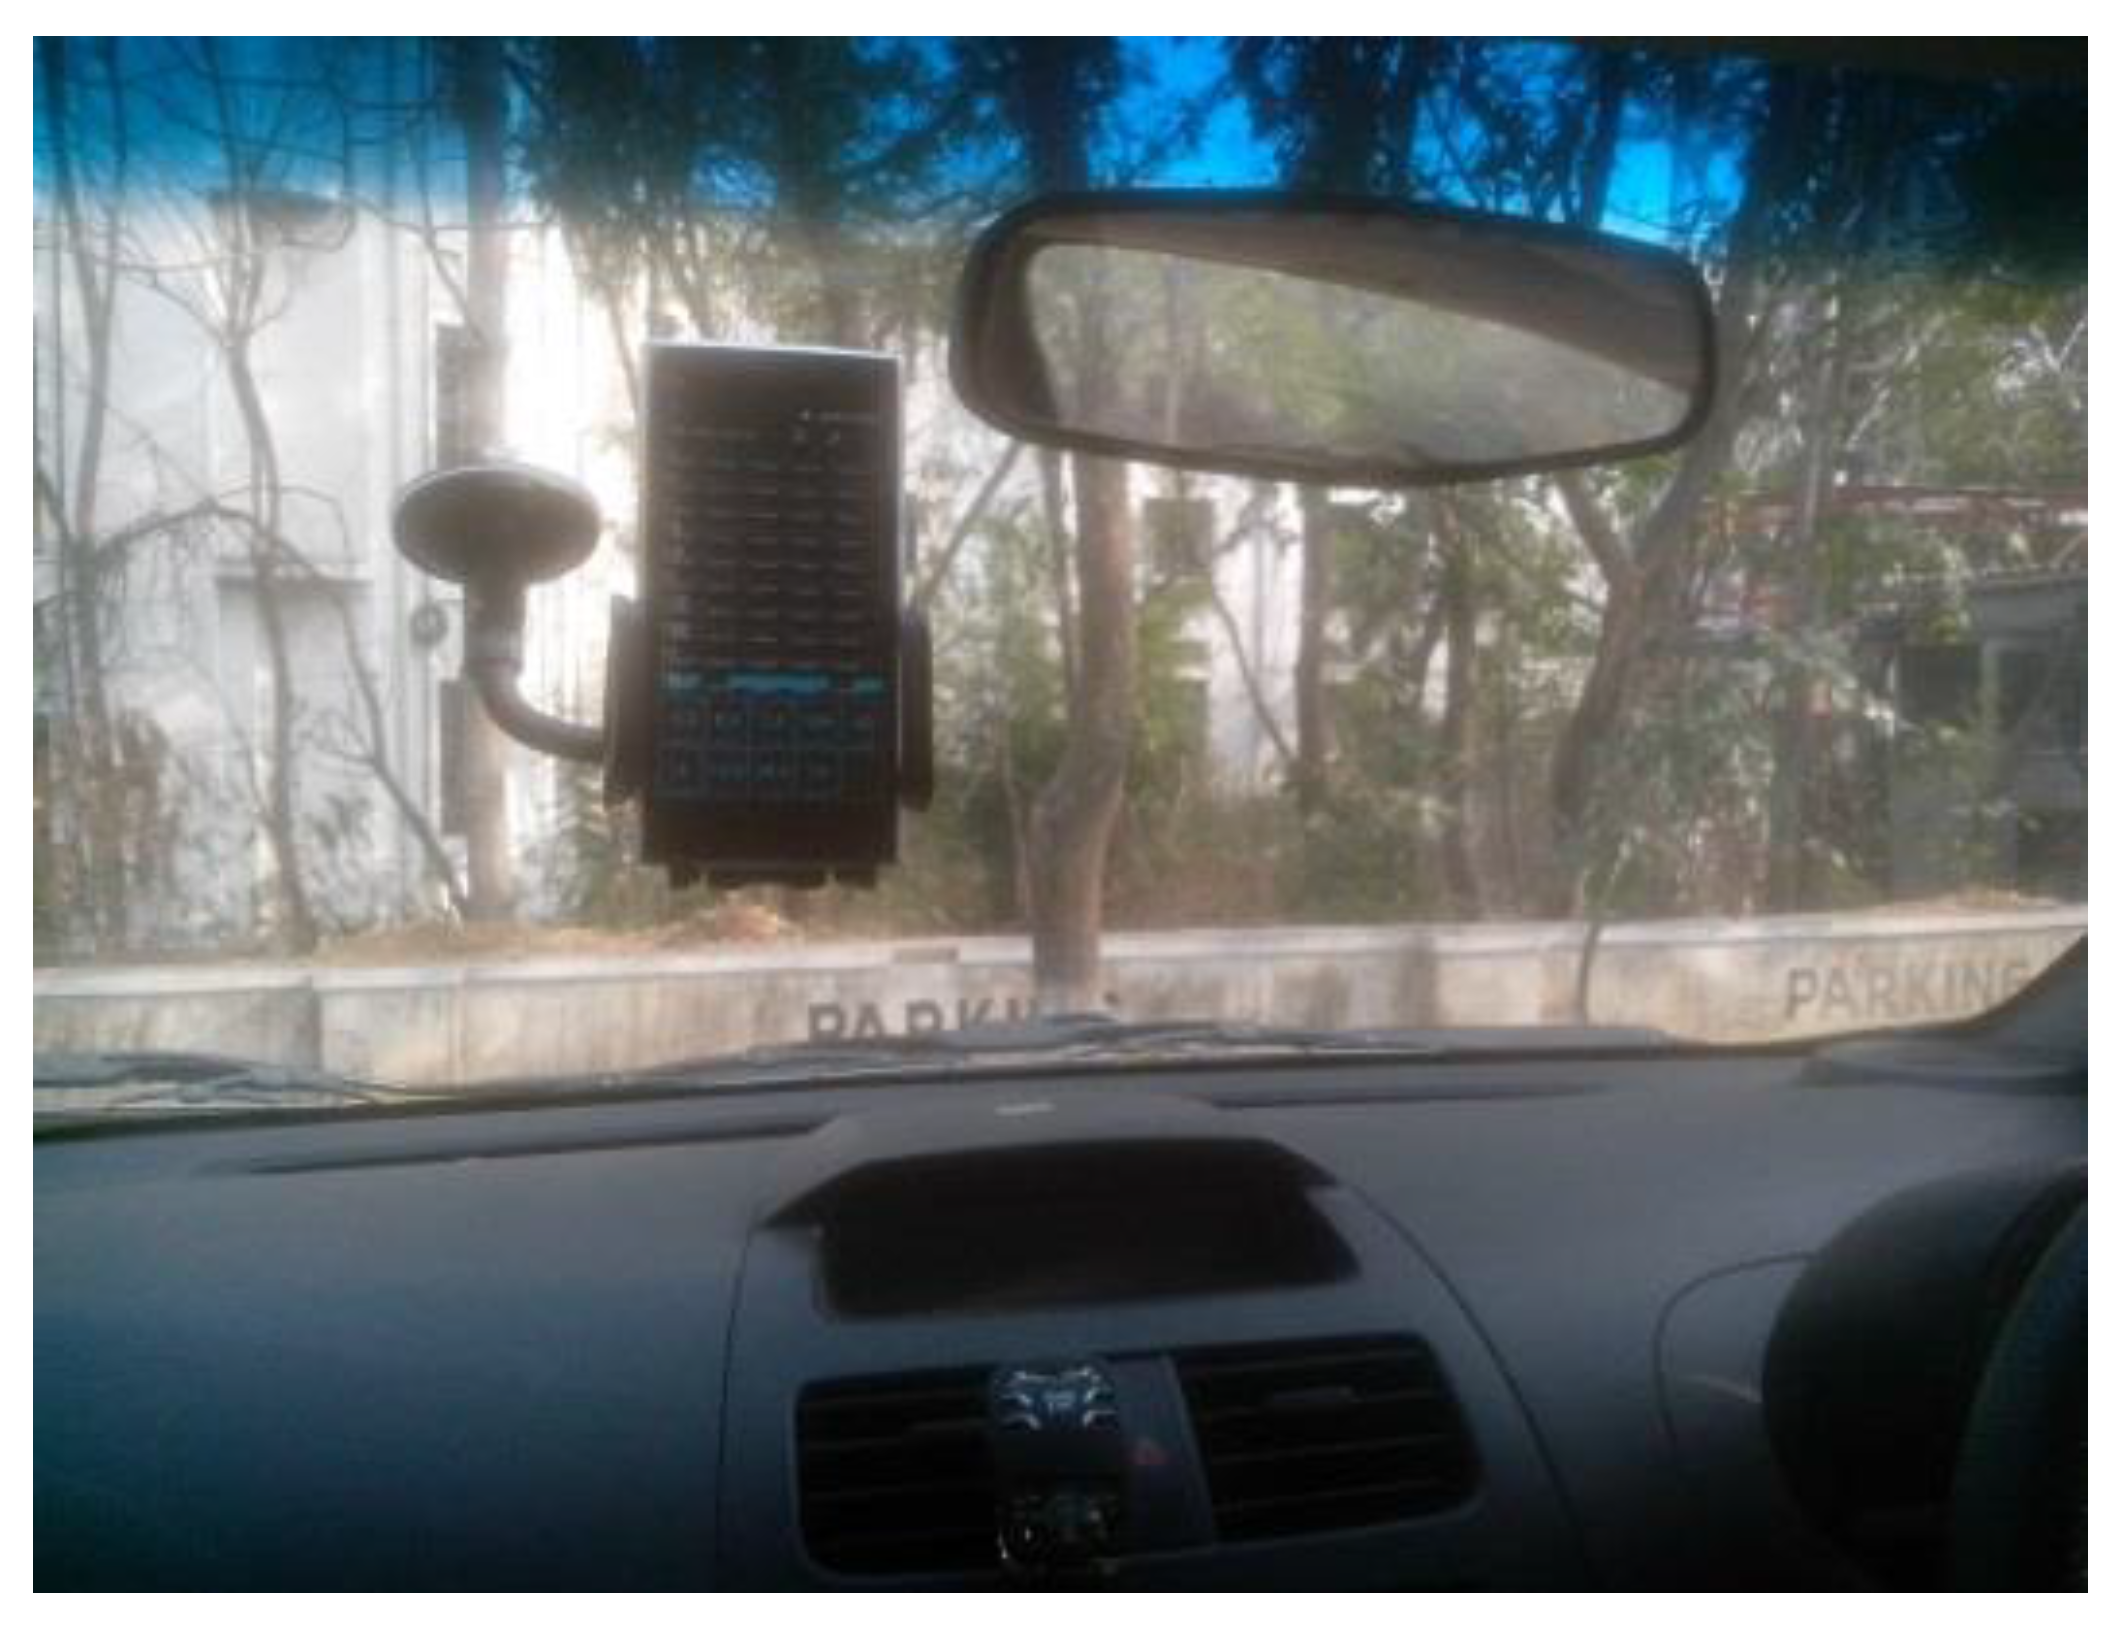
The prototype was developed using an Android smart phone for data collection, and a laptop for running the offline data processing algorithms. The smartphone was mounted on the car’s windshield or the dashboard (see
Figure 3) and the data was collected using a sensor data-logging app, at frequencies as listed in
Table 1 for each sensor. The smart phone app synchronizes the raw data collected from different sensors using timestamp.
Table 1.
Sensor Data Collection Frequency.
Table 1.
Sensor Data Collection Frequency.
| Sensor Device | Frequency of Data Collection |
|---|
| Camera (640 × 480 resolution) | 0.5 Hz |
| GPS Location | 1 Hz |
| GPS Speed | 1 Hz |
| Accelerometer | 15 Hz |
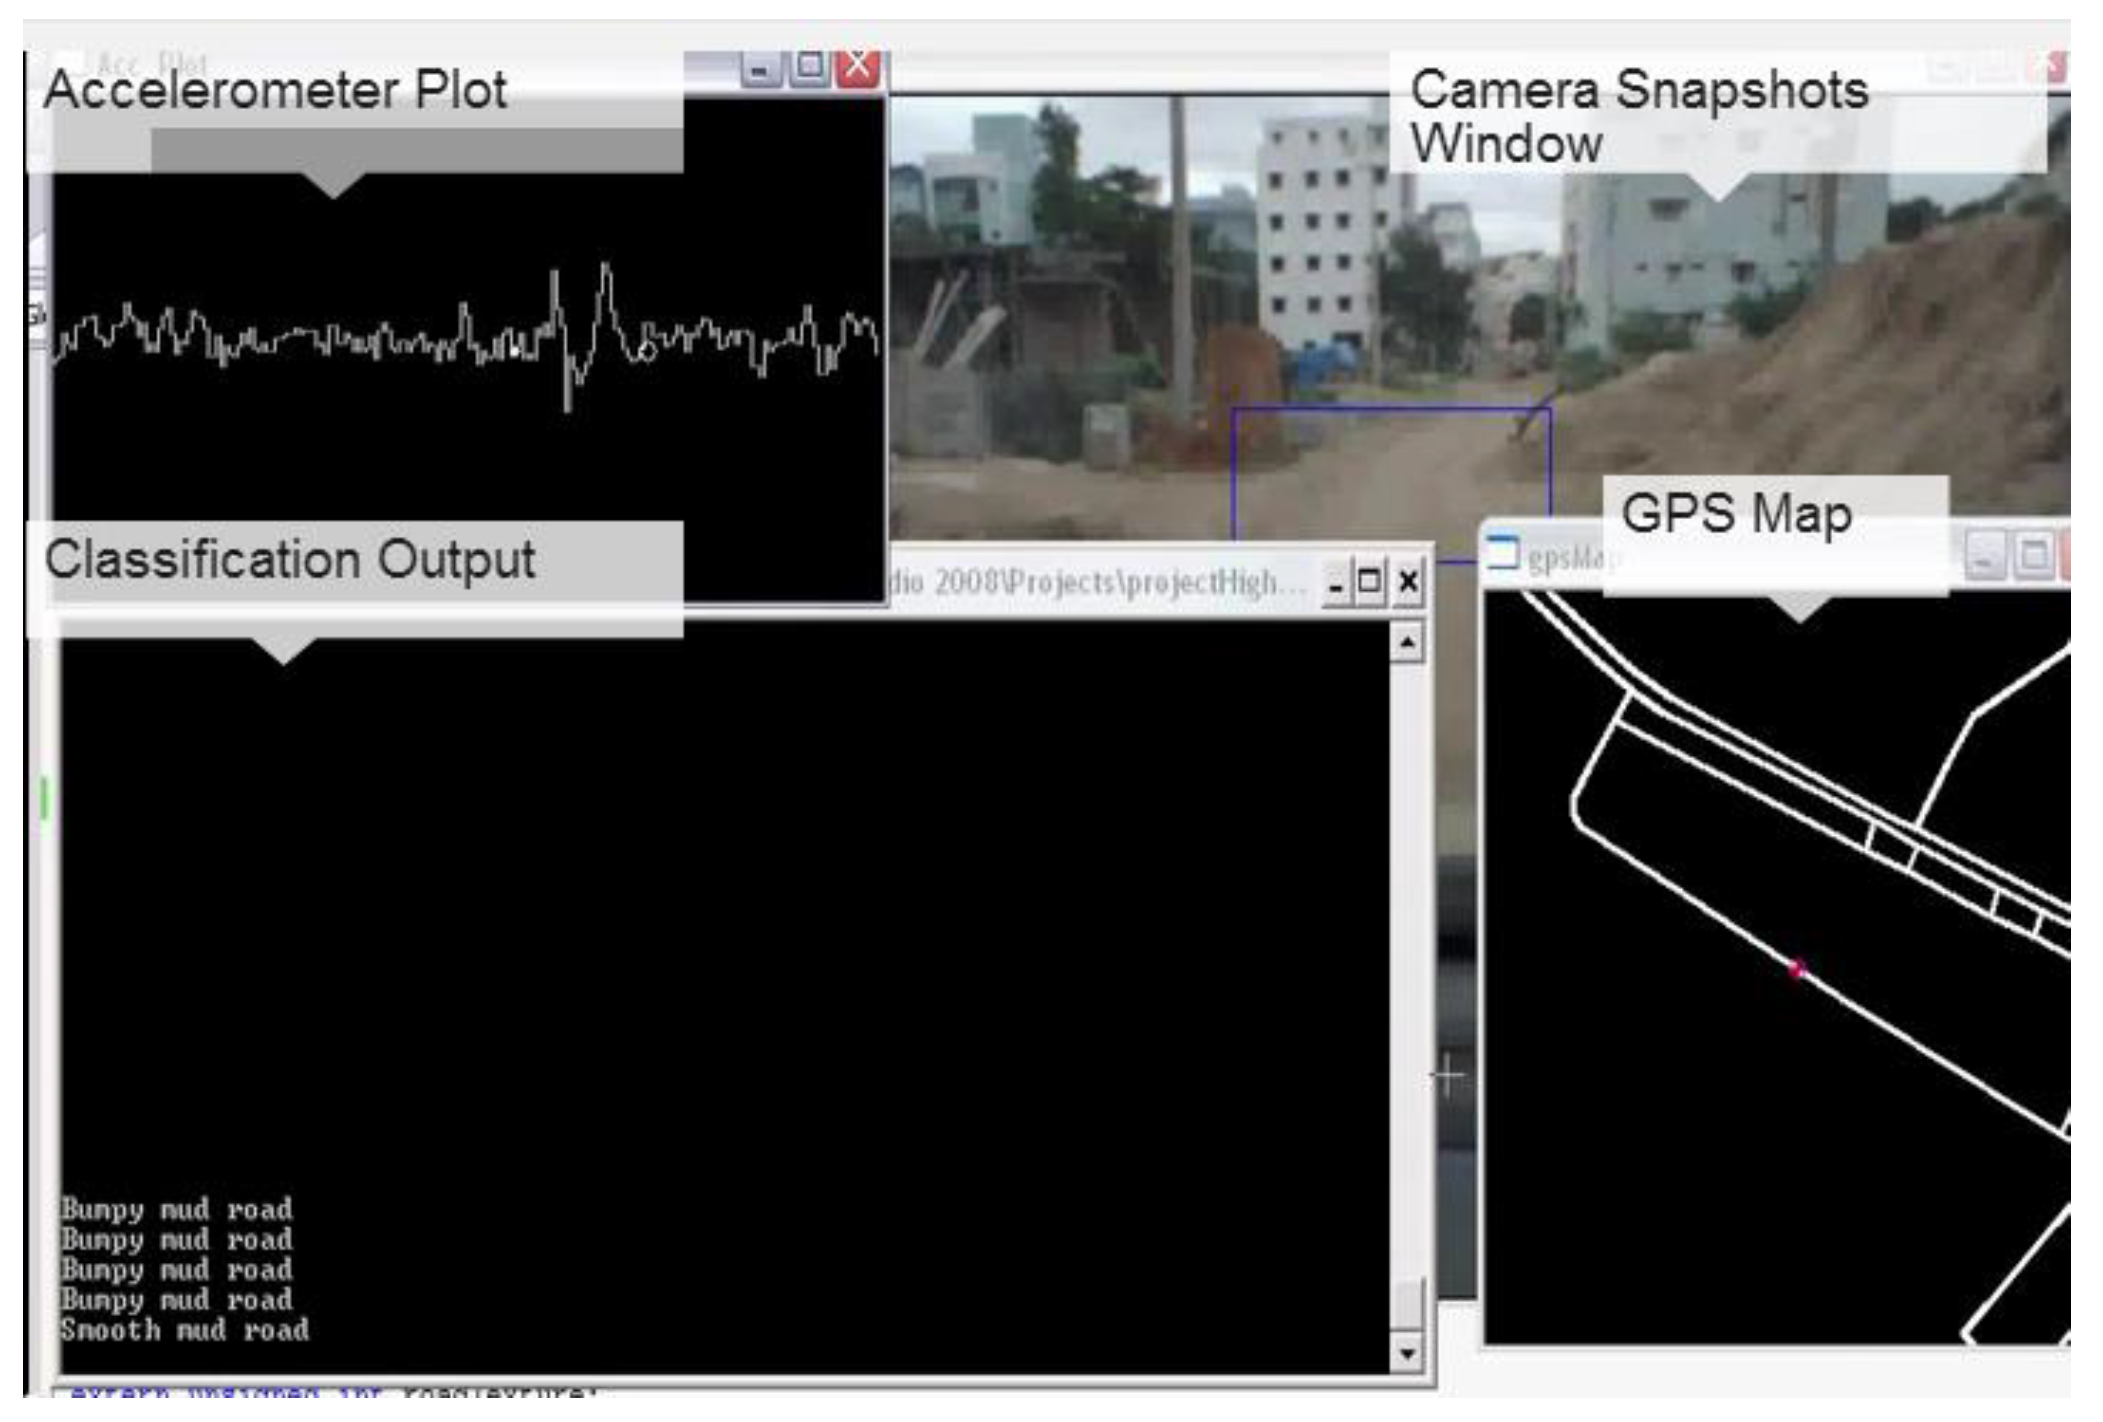
The screenshot of the software application running on the laptop is shown in the
Figure 4 and a demo of the same is accessible [
10].
Table 2 shows the software and hardware requirements for the development of the proposed system.
Figure 3.
Smartphone Mounted on Windshield with Data Collection App Running.
Figure 3.
Smartphone Mounted on Windshield with Data Collection App Running.
Figure 4.
Screenshot of the PC application.
Figure 4.
Screenshot of the PC application.
Table 2.
Software and Hardware System Requirements.
Table 2.
Software and Hardware System Requirements.
| Software Requirements | ANSI C++, OpenCV 2.3, Open Street Maps, Windows (32/64 bit), Data Logging App on Smartphone |
| Hardware Requirements | 2 GB RAM, Intel Core 2 Duo, Android Smartphone with accelerometer, GPS, camera |
4. Methodology
4.1. Road Condition Estimator
4.1.1. Accelerometer Data Processing
Accelerometer readings are an indirect way of finding the undulations on the road surface by measuring the degree of vibration inside the vehicle. The vibrations are measured along the three measurement axes: direction of gravity (
Z-axis), direction of vehicle motion (
Y-axis) and the direction parallel to the dashboard (
X-axis). For simplicity, the smart phone is carefully mounted in a well-oriented position with the
X-,
Y-, and
Z-axes of the phone aligning with the measurement axes. In practice the accelerometer readings have to be reoriented as in Nericell [
7] depending on the mount position. Except for intentional speed breakers, vibrations that get through the car’s suspension system is mostly chaotic and is reflected on all the three accelerometer axes of measurement. Standard deviation (SD) of accelerometer readings along
X-,
Y-, and
Z-axes (
Ax,
Ay,
Az) and GPS Speed are considered as features (σ
x, σ
y, σ
z,
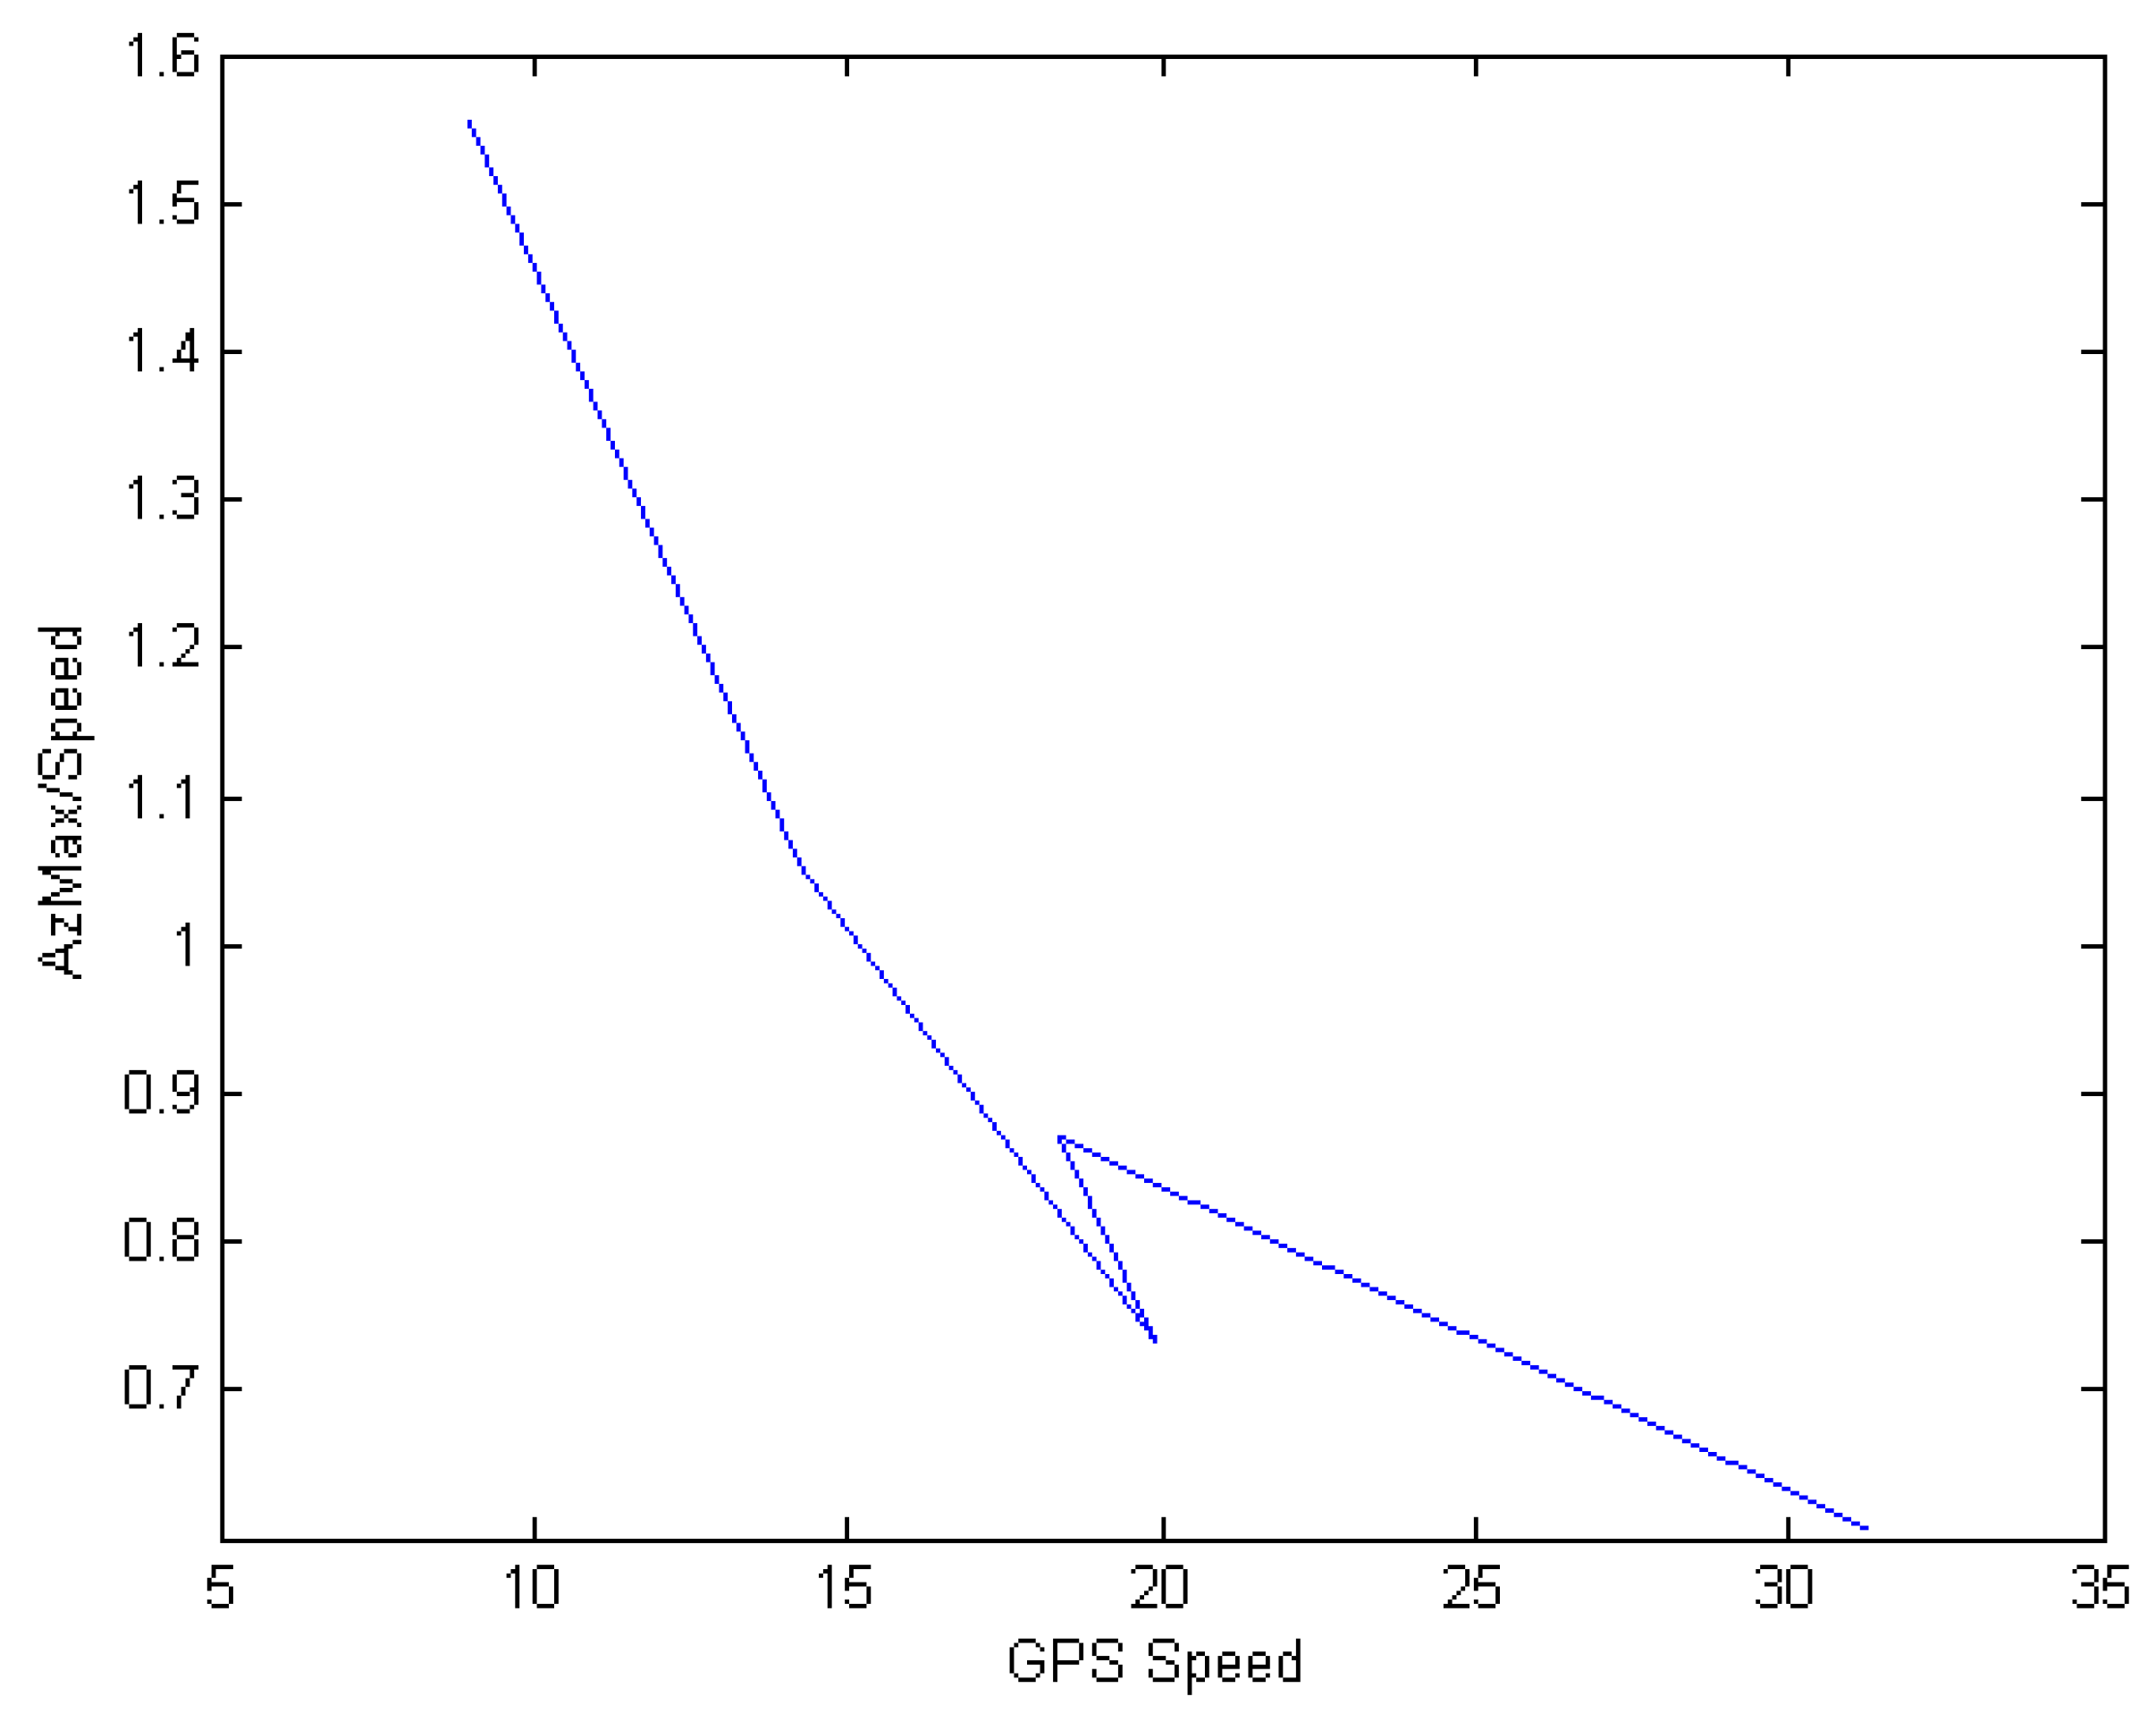
Vg). Vehicle speed considered in the feature vector is the instantaneous speed. Unlike
P2 [
9], the speed is considered as a separate feature instead of a ratio
Az/
Vg since it is found that the maximum-vibration-amplitude to speed ratio is not constant when traversing similar sized speed breakers at different speed values (
Figure 5). Vehicle breaking and turning shows sustained reading changes in
Ax and
Ay. Hence such slow changes in readings are removed using a high pass filter so that only high frequency data is used for SD calculation. Accelerometer readings are obtained at 15 Hz frequency and the features are extracted over a window of 2 s. A non-parametric approach is adopted and the system is trained manually for a supervised classification. The roads are labeled into poor, unsatisfactory, satisfactory and good for the training and sufficient samples are collected. Later a K-Nearest Neighbor (K-NN) algorithm is used for classification of fresh data in to the above-mentioned classes.
Figure 5.
Vibration Response: Plot of ratio between AzMax and Average GPS Speed (Vg) while driving through similar speed breakers.
Figure 5.
Vibration Response: Plot of ratio between AzMax and Average GPS Speed (Vg) while driving through similar speed breakers.
4.1.2. Camera Based Pothole Detection
Primary objective of this work is to improve the information quality level of the current state of the art in road monitoring systems using heterogeneous data. Bad road condition across the width of the roads is detected using the accelerometer but the scattered potholes are mostly missed, as it is a general tendency to avoid them while driving. In the current systems, Nericell [
7] and Roadroid [
1], the images captured by the camera are not utilized and serves only as an occasional visual validation proof. Camera snapshots are typically captured at a frequency of 0.3 Hz to 0.5 Hz and as a result it becomes an overhead to manually inspect every image post data capture, especially when monitoring is done across a vast area. However, robust image segmentation based pothole detection is a difficult problem considering the complexity of the scenes captured by the dashboard camera. Emir Buza
et al. [
11] proposed a method to detect pothole using image processing and spectral clustering for rough estimation of potholes. Otshu [
12] based thresholding is applied to select darker pixels of the road for pothole detection. However, potholes cannot be generalized only as patches that have darker pixels inside the boundary compared to the surroundings. The color of the interior pixels depend on the road or mud layer that is exposed as a result of wearing out of the top layer. This can result in pothole interior pixels to have the same or even higher average pixel intensity than the surroundings (
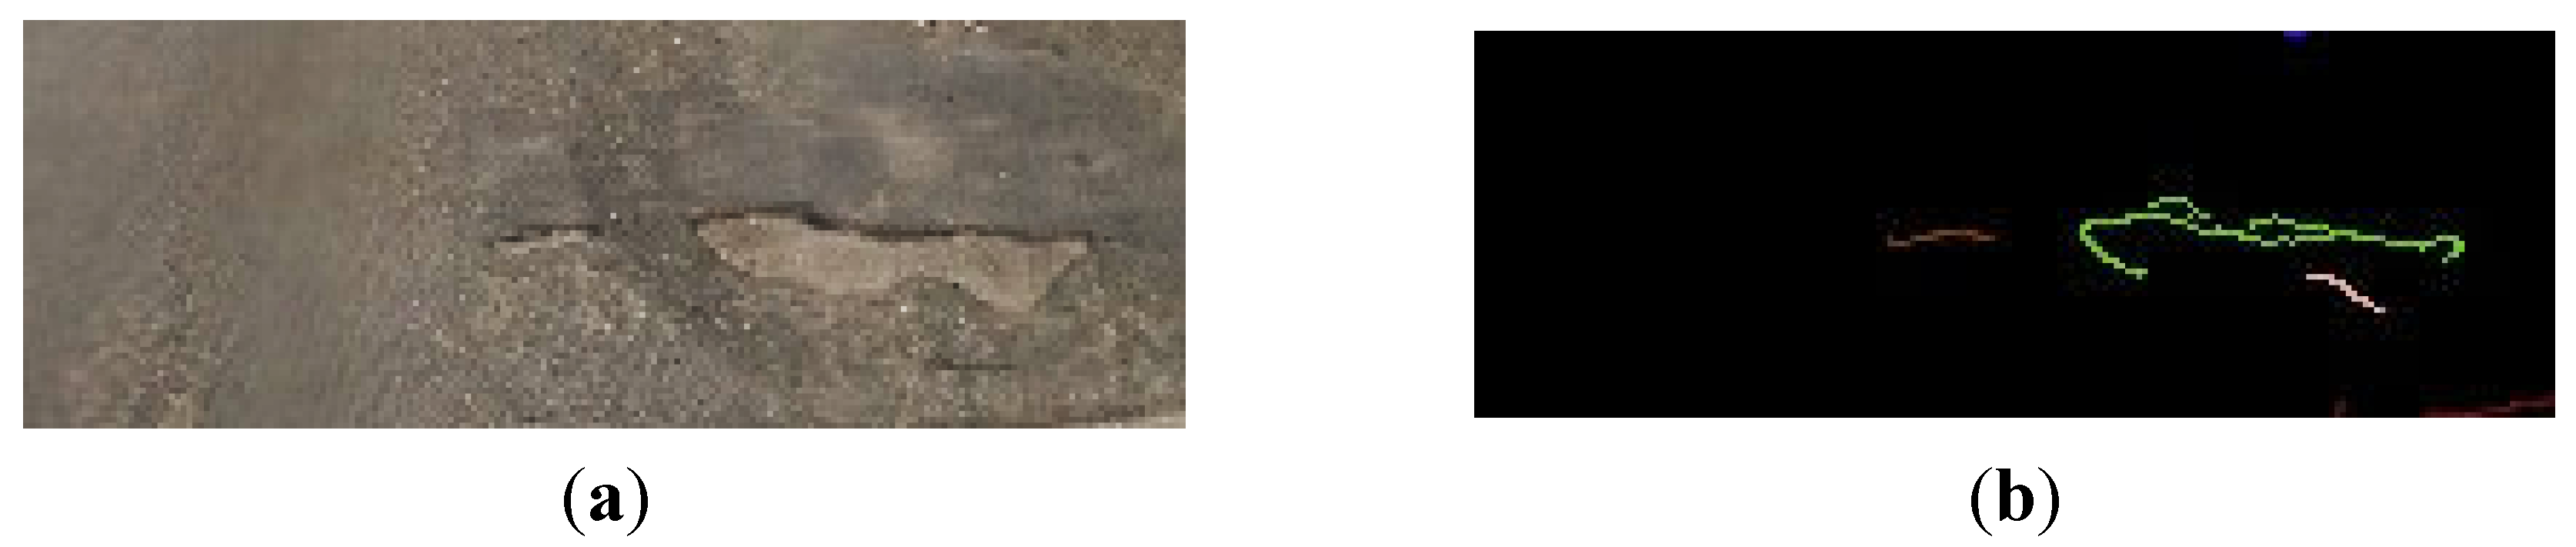
Figure 6). The proposed system MAARGHA, detects potholes based on the edge features detected on the images (
Figure 7). The results of image based detection supplements the accelerometer readings in detecting the missed out potholes.
Figure 6.
Easily Avoided Potholes.
Figure 6.
Easily Avoided Potholes.
Figure 7.
(a) Pothole on the road (b) corresponding edge information.
Figure 7.
(a) Pothole on the road (b) corresponding edge information.
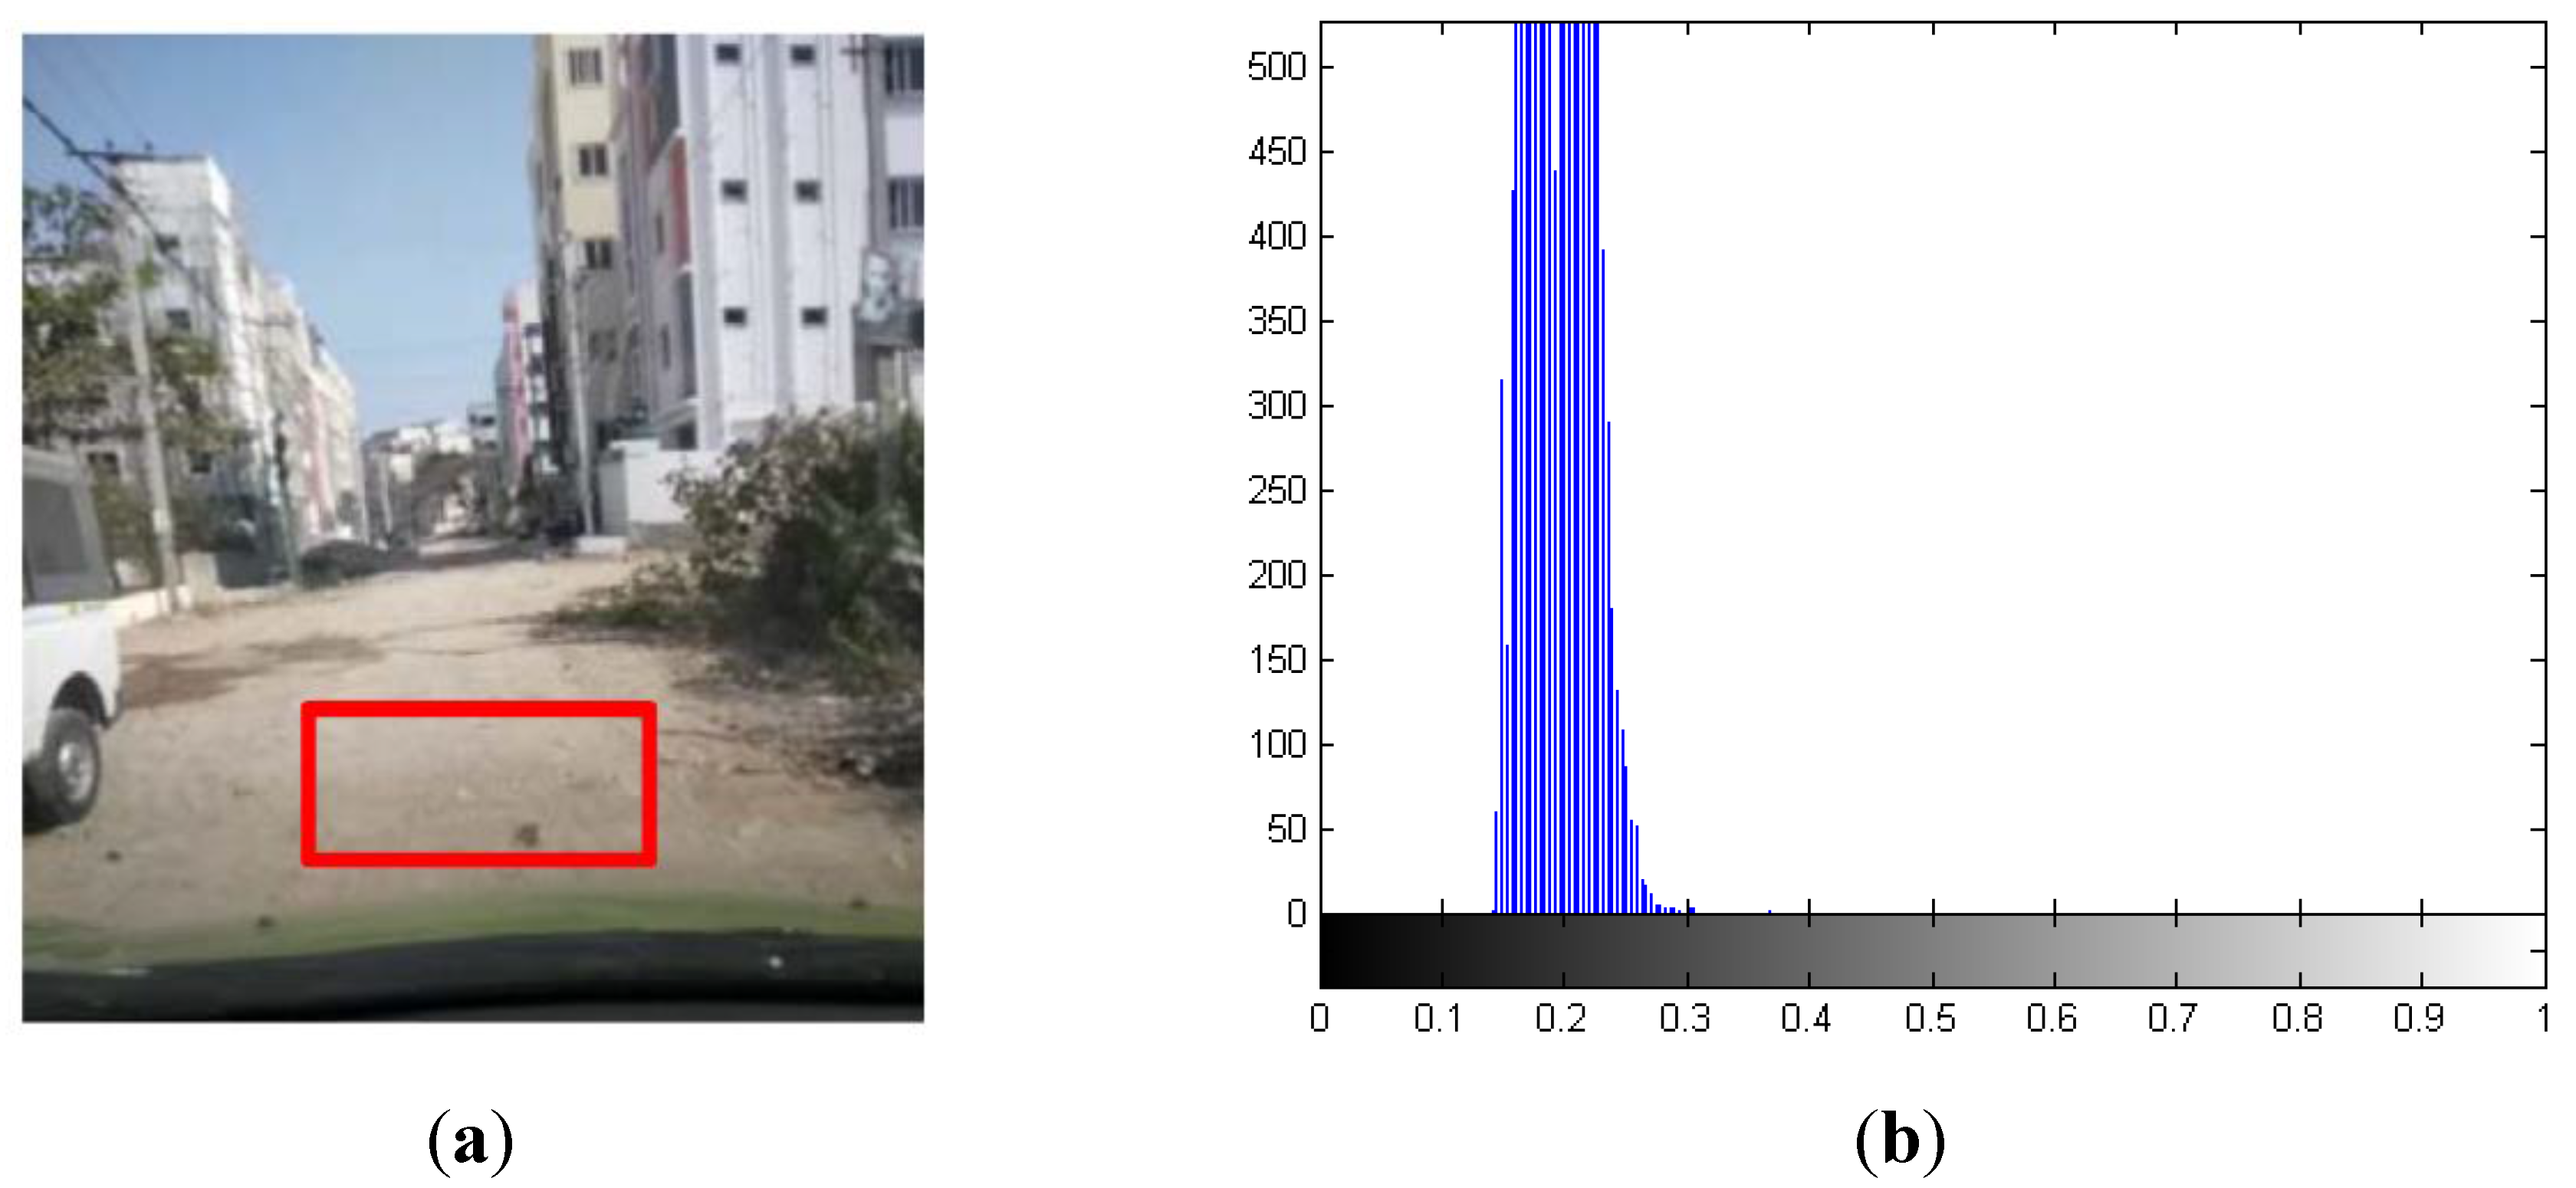
The smart phone is mounted with the camera facing towards the road and the captured snapshots are cropped to focus the region of interest to 1 or 2 m ahead of the car. The sub-image is then smoothed using a 5 × 5 bilateral filter, which preserves the sharp edges of potholes and shadows. Because shadows are regions of low intensity (
Figure 8a) and are connected to the boundary of the image, they are identified using intensity threshold based connected component analysis (
Figure 8b). If the shadowed regions constitute more than 50% of the image the scene is ignored for further processing to avoid false positives. Consequently, a canny filter with an empirical lower gradient threshold of 30 is used to obtain the edges of the sub-images and edge contours are extracted. Commonly used high:low gradient threshold ratio of 3:1 is used to obtain the higher threshold value. A second level of filtering is done by selecting the images that have a limited number of contours
n (empirical value). The selected images are assigned unsatisfactory road condition score. The pseudo algorithm is given below in Algorithm 1.
| Algorithm 1. Pothole Detection Algorithm |
| Step 1: Apply 5 × 5 bilateral filter on sub-image I |
| Step 2: Reject I if pixels with intensity values <100 constitute more than 50% of the sub-image |
| Step 3: Detect n contours {C1, C2, ..., Cn} based on Canny edges with 90-high and 30-low threshold value |
| Step 4: Pothole detected if 1 < n < 5 |
Ghost images do get formed due to the reflection on the windshield of the car and these need to be filtered out from the input set to the algorithm. The position of the sun with respect to the car can be used to detect such possible images and neglect them. Linear shapes like lane markings can be removed by exploiting the small length to breadth ratio of a bounding box. However, such enhancements are operational details and have not been implemented under the scope of this work.
Figure 8.
(a) Shadowed Region along the Road, (b) Intensity based segmentation.
Figure 8.
(a) Shadowed Region along the Road, (b) Intensity based segmentation.
The road condition estimator takes both the accelerometer based classification and the pothole detection algorithm to provide the four-class output, with precedence to the latter algorithm in case where the classification is worse than the former method.
4.2. Road Surface Type Classification Using Camera
4.2.1. Histogram Based Road Surface Type Recognition
Based on the composition of the construction materials used, the roads appear in different colors. Much work has been done in the domain of autonomous navigation systems (Survey by Vipul
et al. [
13,
14]), but mostly to distinguish between road and non-road regions. Color content, color features and additional features like road boundary [
6] and depth sensors based road region modeling have been used in road detection. But the problem in hand is to classify the detected road into different surface material types like bitumen, concrete and mud. This is a problem of outdoor color classification. Methods discussed in [
15] have adopted parametric and non-parametric approaches for outdoor colour classification and can be applied in the context of road surface type identification. Parametric methods [
16,
17,
18,
19,
20,
21,
22] predict the color based on illumination models while non-parametric methods [
23,
24,
25,
26] follow sample based training and classification regime. The later has been successfully applied for road surface type estimation in the proposed system due to its smaller computational footprint. The classification problem is simplified if carried out in two steps. First is to differentiate between tar roads
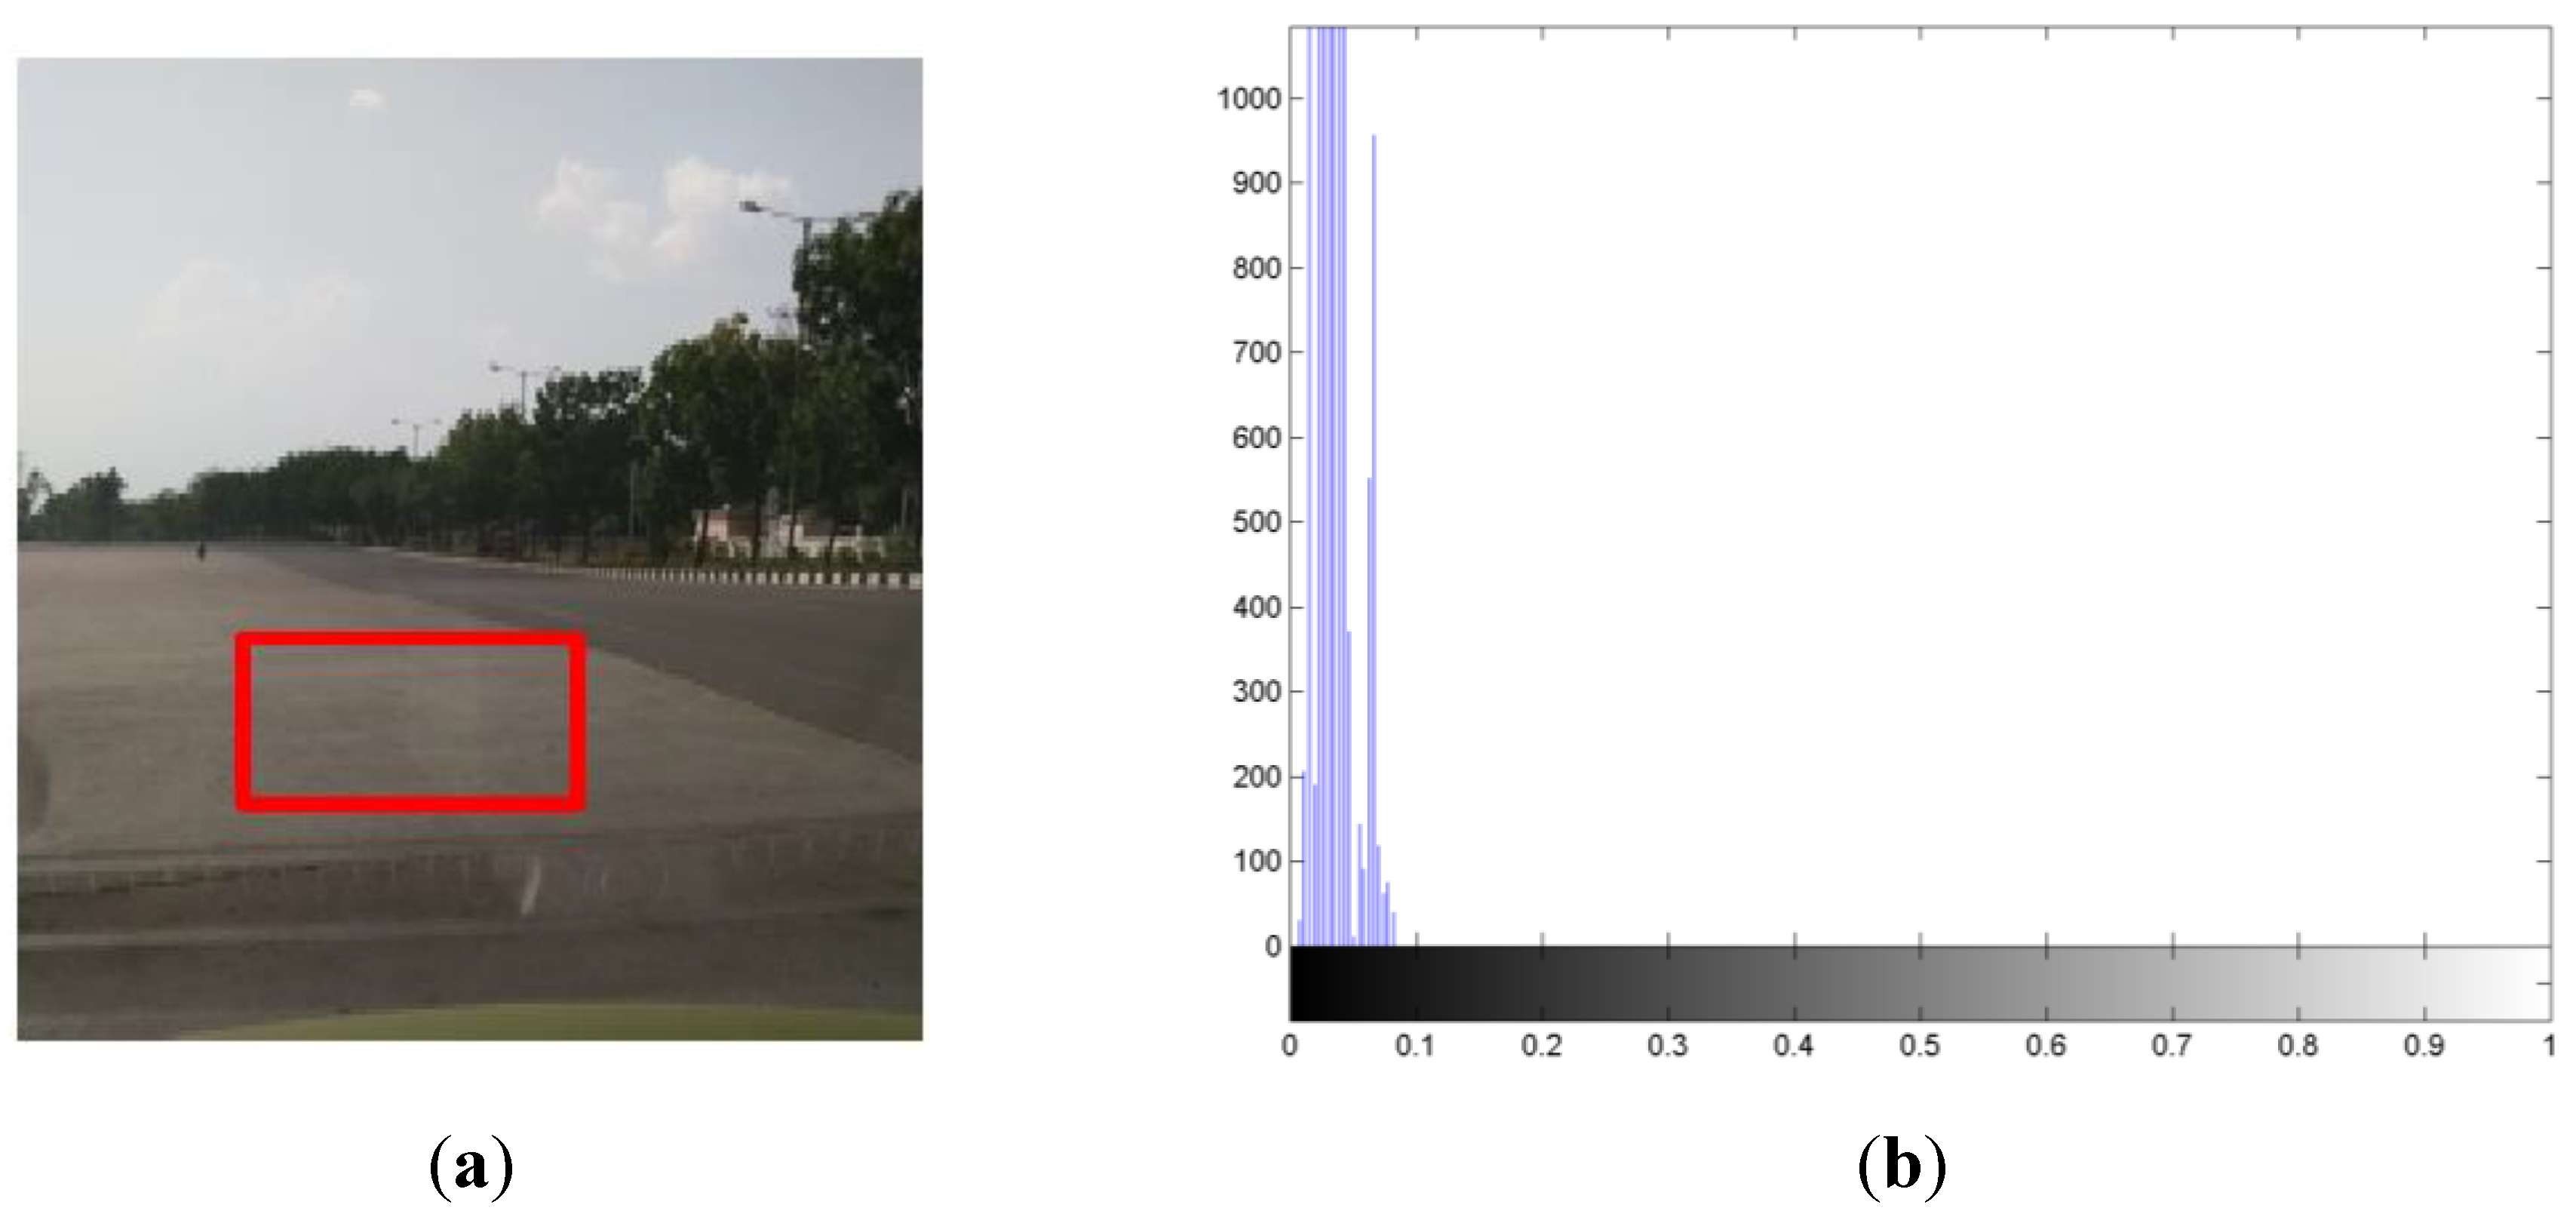
vs. mud/concrete roads based on the intensity distribution of the scene. In the second step, the mud roads are differentiated from concrete roads depending on the colorfulness of image.
Image is converted to HSI color space and the histograms are calculated for Saturation and Intensity components of the sub-image. Intensity histograms are then used as features in the first stage classification. Under open sky conditions, the intensity values of mud and concrete roads are higher than the tar/bitumen roads. HSI color space is the closest to the way humans perceive colors and hence hue is commonly utilized for color classification [
27]. However, HSI being a cylindrical color space the hue component which explains the color of the object, is unstable as the saturation and intensity decreases. Whereas, the saturation is found to be stable and describes the colorfulness of the scene. Thus, the histogram of the saturation channel is used as a feature vector to train the system to differentiate between mud and concrete roads in the second stage classification. The marked difference between the saturation values of mud and concrete roads is seen in the saturation channel histograms shown in
Figure 9 and
Figure 10. The training dataset used for the first stage classification is built by collecting sufficient intensity channel histograms of tar, mud and concrete class samples and labeling them as either mud-concrete pair or tar. The second stage training dataset is built by collecting saturation channel histogram samples of mud and concrete classes. During classification, if the first stage classification results in mud-concrete pair, the second stage classification is invoked to differentiate between mud and concrete.
Figure 9.
(a) Mud road sample and (b) its histogram of saturation channel.
Figure 9.
(a) Mud road sample and (b) its histogram of saturation channel.
Figure 10.
(a) Concrete road sample and (b) its histogram of saturation channel.
Figure 10.
(a) Concrete road sample and (b) its histogram of saturation channel.
4.2.2. Histogram Distance Metric
Performing color classification using histograms needs a measure of histogram similarity. There are a number of distance metrics that are used for histogram comparison. The paper [
28] talks about the failure of Euclidean distance metric at higher dimensions. Aherene
et al. [
29] proposes Bhattacharyya distance (equation 1) to be used for histogram comparison when compared to the famed Chi-Squared distance method. A Bhattacharyya distance of zero means a perfect match where as a distance of 1 means a perfect mismatch. This distance metric is used for performing a K-NN classification using the training dataset.
refers to the value of the
bin of the histogram.
4.3. Map Matching of GPS Ticks
To associate the road profile and surface type data accurately with the correct stretch of the road, GPS data is used. But the common commercial grade GPS used in mobile phones are less accurate and may also experience multipath reflection while driving through streets. So the GPS ticks obtained by the devices are distributed randomly on either sides of the road segment. A simple online map matching algorithm, discussed as “Algorithm 2” in [
30], is used. Raw GPS ticks are snapped to the nearest road segment that is parallel to the direction of vehicle motion, as derived from the heading data (
Figure 11). A good resolution of the road data is selected such that the separate road center lines are available along the vehicle driving direction (Two center lines if it is a two way road).
Figure 11.
GPS Map Matching (AB and CD are road segments. p1, p2, p3, p4, and p5 are raw GPS coordinates. q1, q2, q3, q4, and q5 are map matched GPS points).
Figure 11.
GPS Map Matching (AB and CD are road segments. p1, p2, p3, p4, and p5 are raw GPS coordinates. q1, q2, q3, q4, and q5 are map matched GPS points).
Post map matching, for every unique GPS point, the latest results from road condition and road surface type classification is associated depending on the timestamp of the GPS data point. The result is a set of GPS points called the road mass points, whose road condition and road surface type attributes are available. This marks the information level fusion of the results obtain from different modules and can be used to update a Road Information System.
5. Demonstration and Results
5.1. Data Sets
The training set was generated in a nearby locality at Hyderabad, India by driving through different types of roads and manually classifying the road surface type and road condition. Adequate samples were collected for asphalt/tar, concrete and mud surface types and also for the various road conditions. Both the training data were saved in separate text files and synchronized using time stamps.
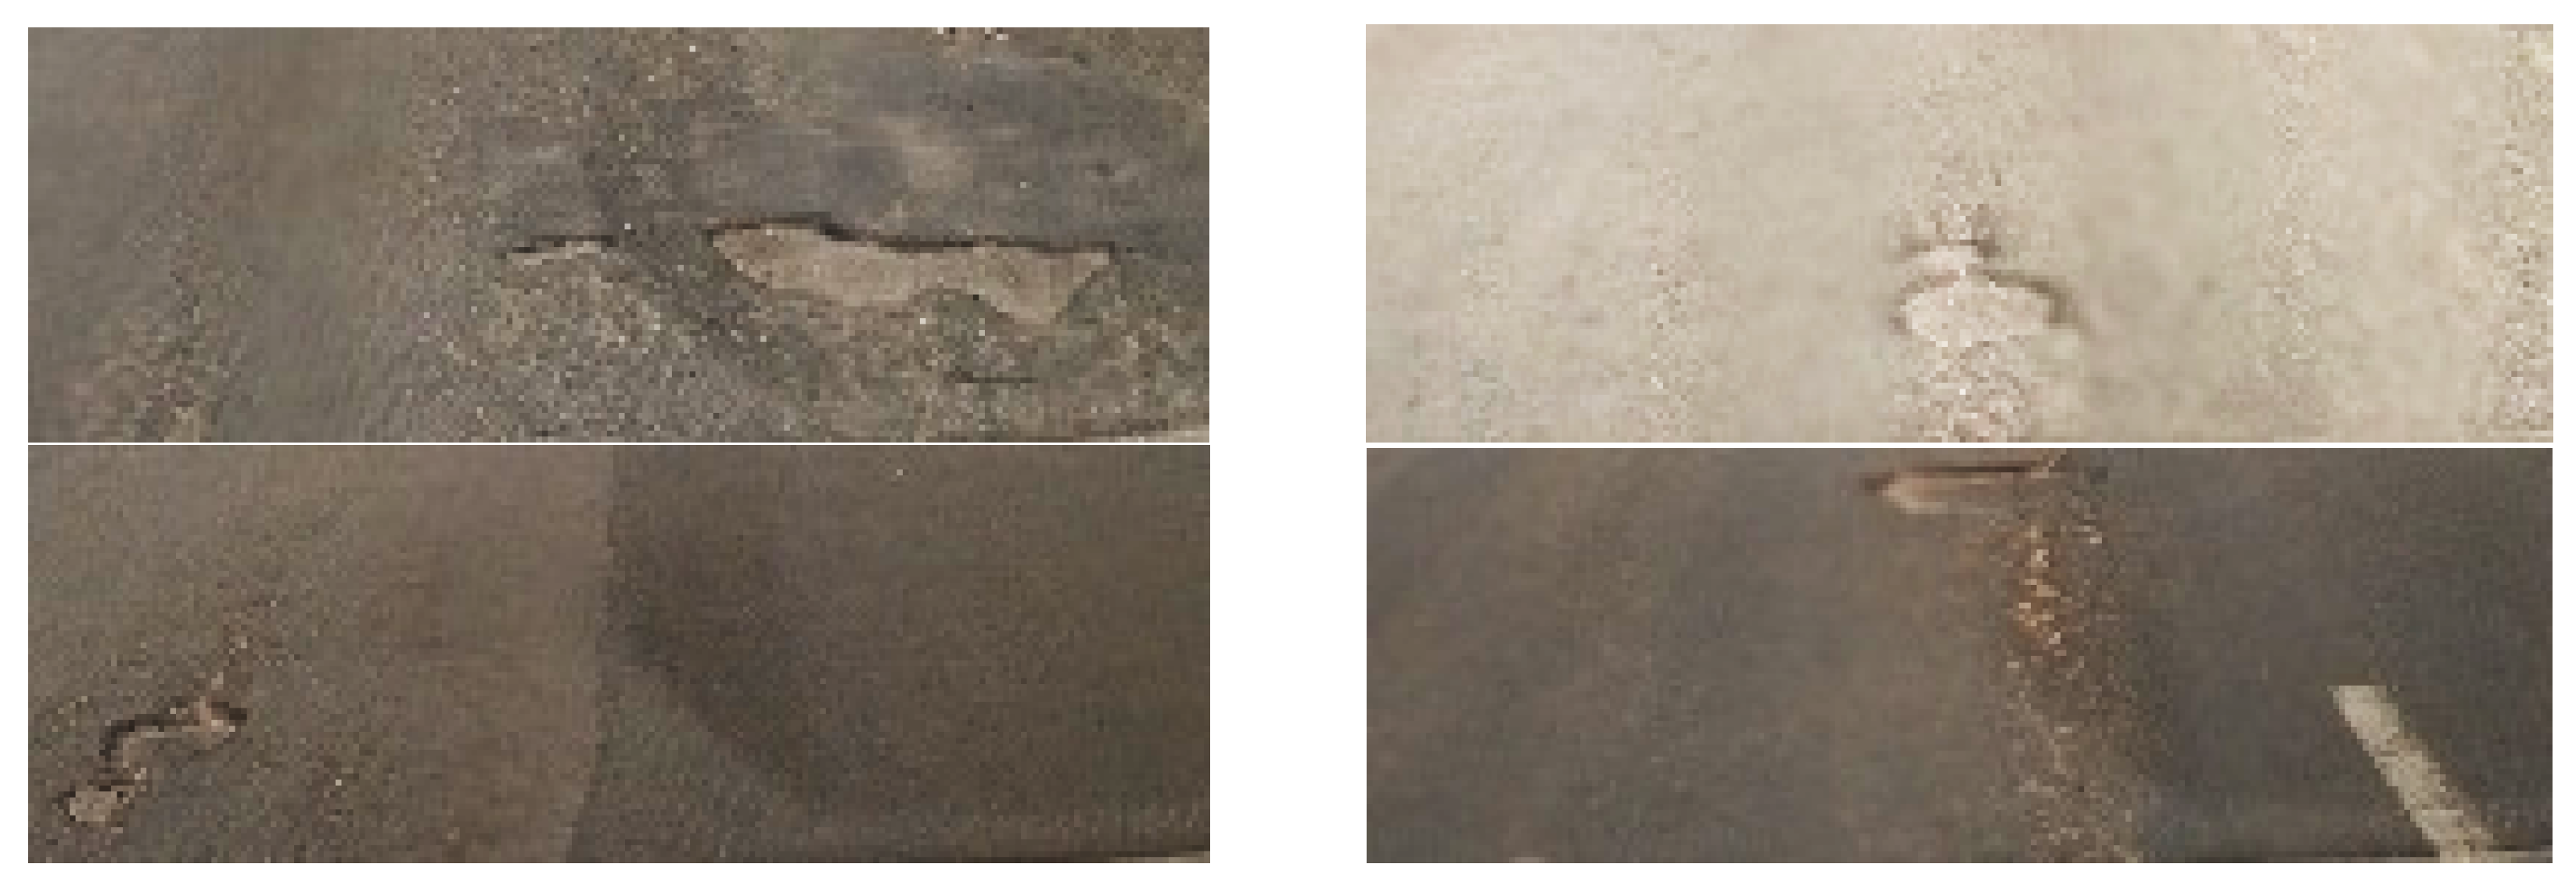
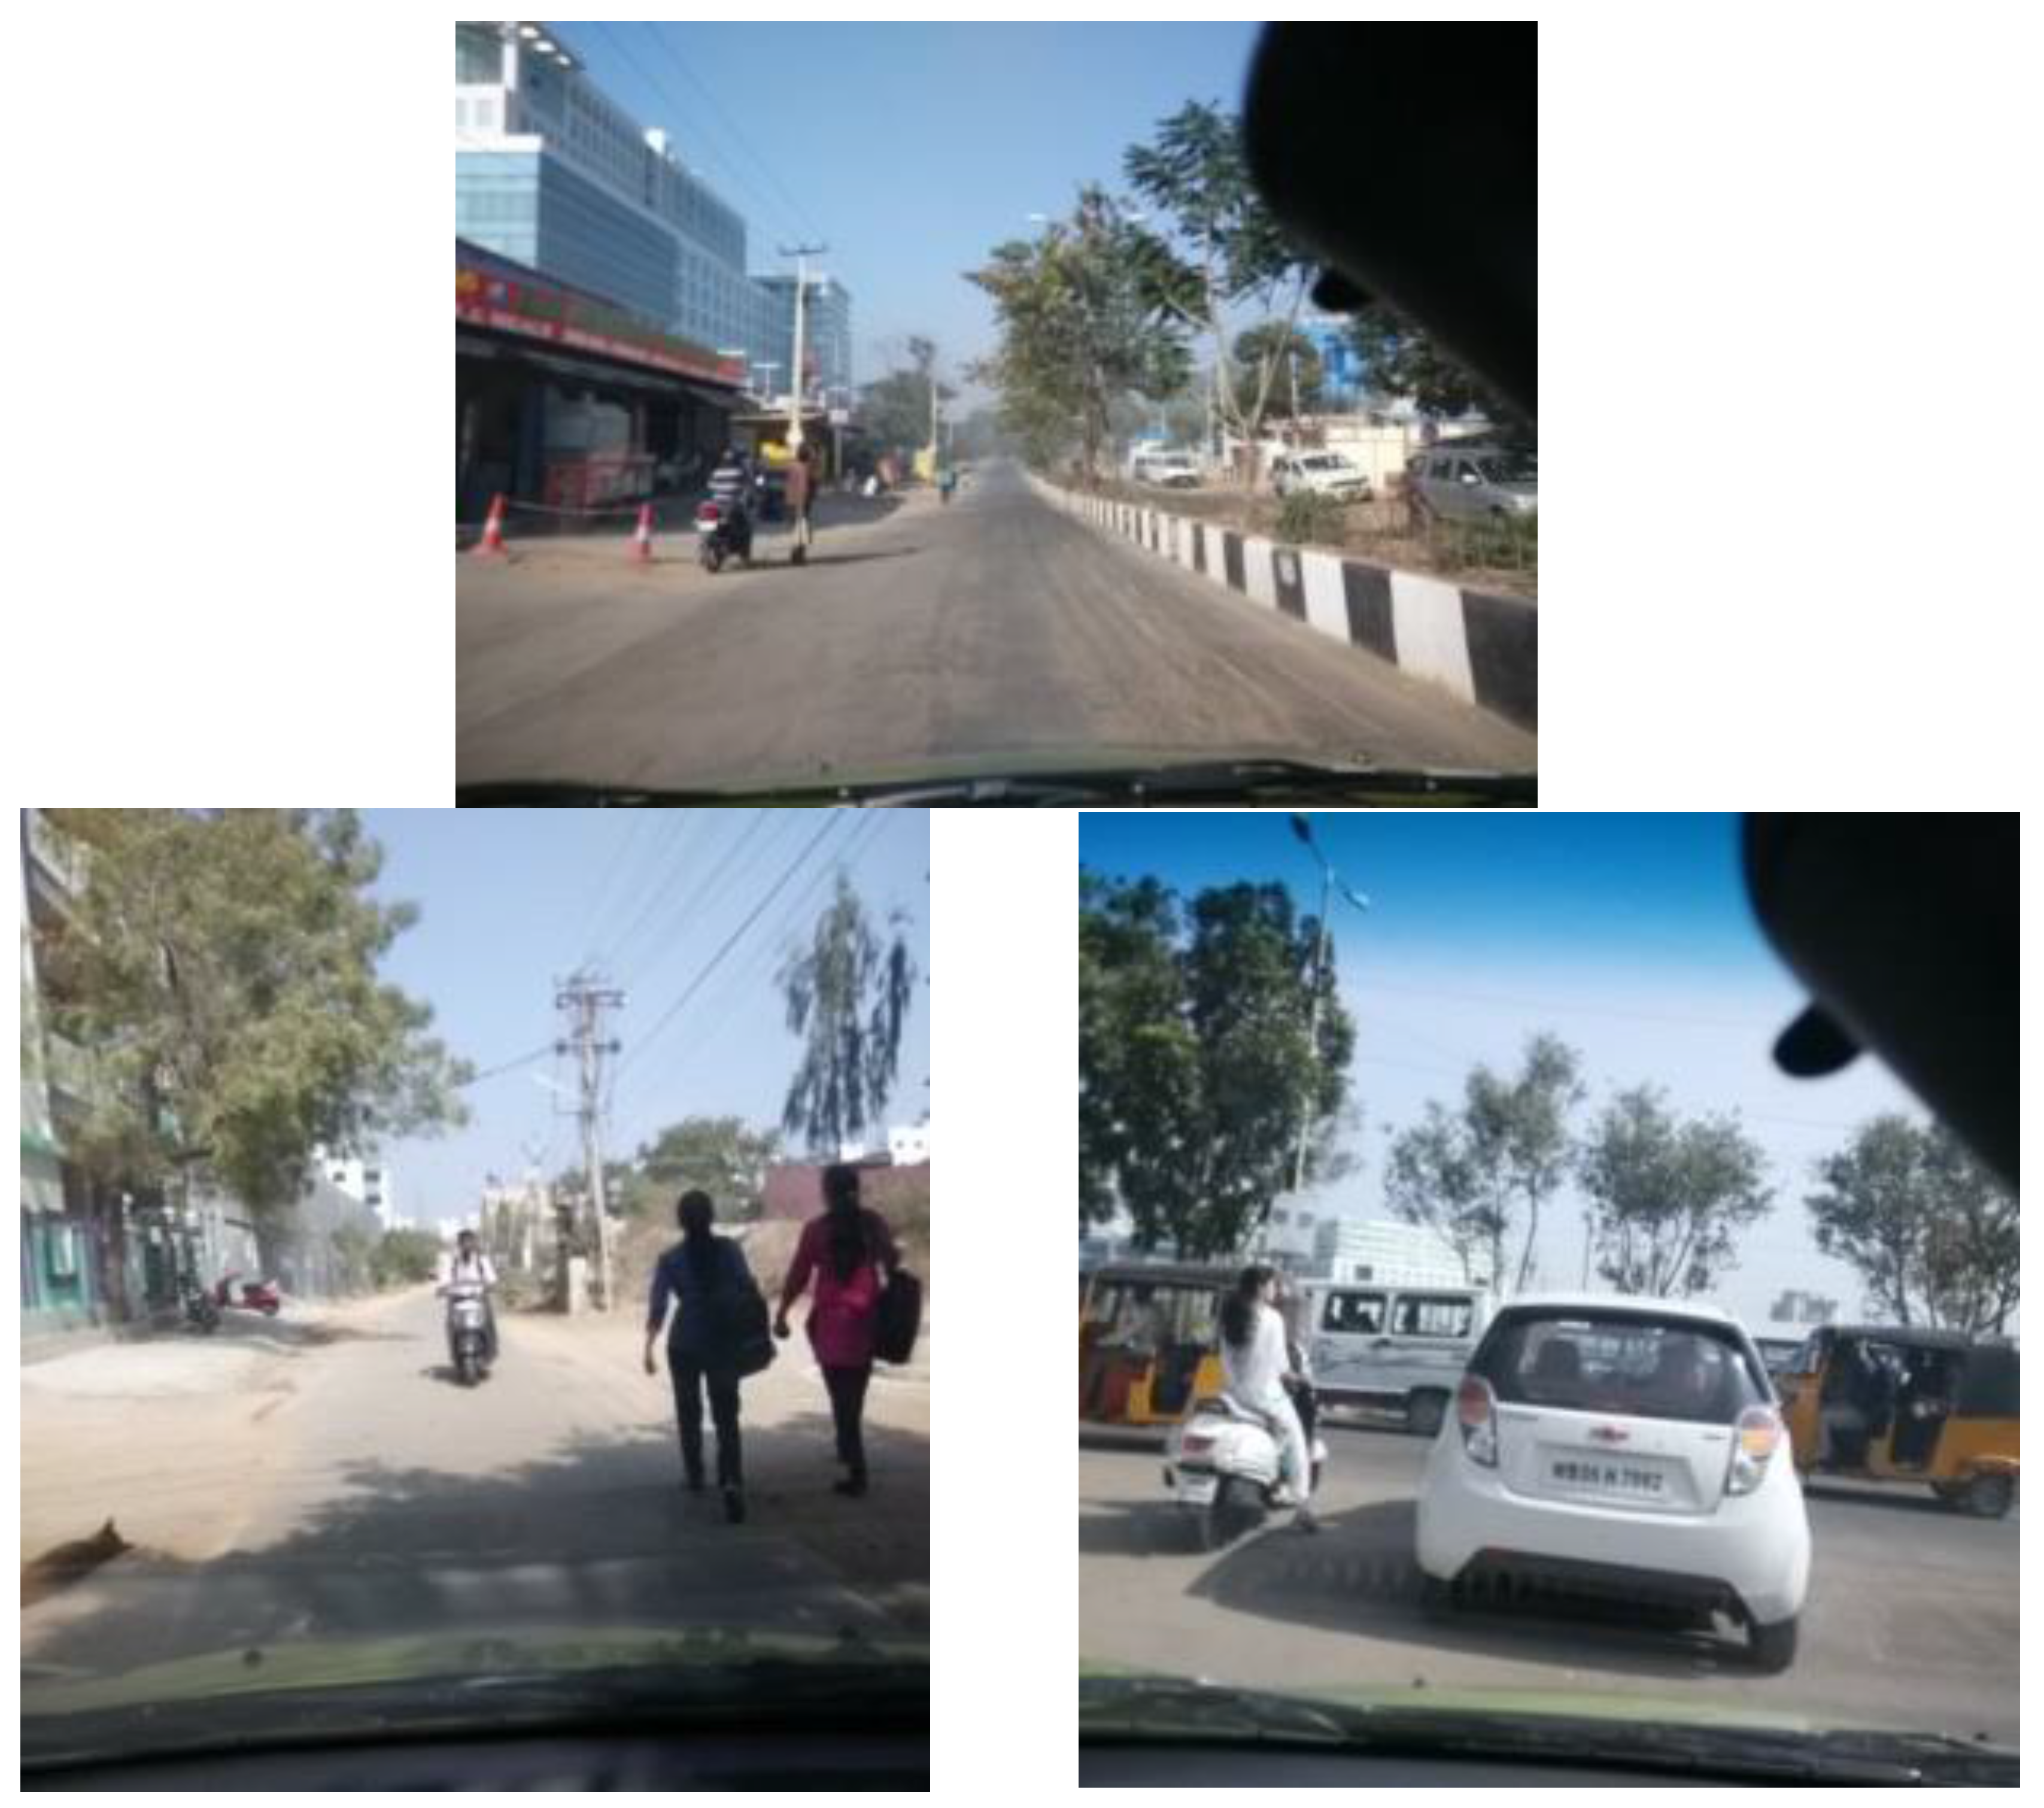
The collected data was grouped into two sets based on the image information available. The first group of datasets was collected on sections of the roads having few shadowed regions and under clear sky conditions (Ideal Data). The second class of data has many gaps in terms of shadows, disturbances in the path, unclear road surface type,
etc. (See
Figure 12). The system was trained using one part of the ideal data and classification performed for all conditions (
Table 3).
Figure 12.
Ideal road visibility conditions—Dataset 1 (Top row); and Cluttered views with unclear road surface—Dataset 2 (Bottom row).
Figure 12.
Ideal road visibility conditions—Dataset 1 (Top row); and Cluttered views with unclear road surface—Dataset 2 (Bottom row).
Table 3.
Number of Training Samples for Road Condition and Surface type Classes.
Table 3.
Number of Training Samples for Road Condition and Surface type Classes.
| Road Class | Type | Data Points (Samples) |
|---|
| Good | Condition | 41 |
| Satisfactory | Condition | 30 |
| Unsatisfactory | Condition | 22 |
| Poor | Condition | 35 |
| Asphalt/Bitumen Tar | Surface Type | 24 |
| Mud-Concrete | Surface Type | 68 |
| Concrete | Surface Type | 38 |
| Mud | Surface Type | 30 |
5.2. Results
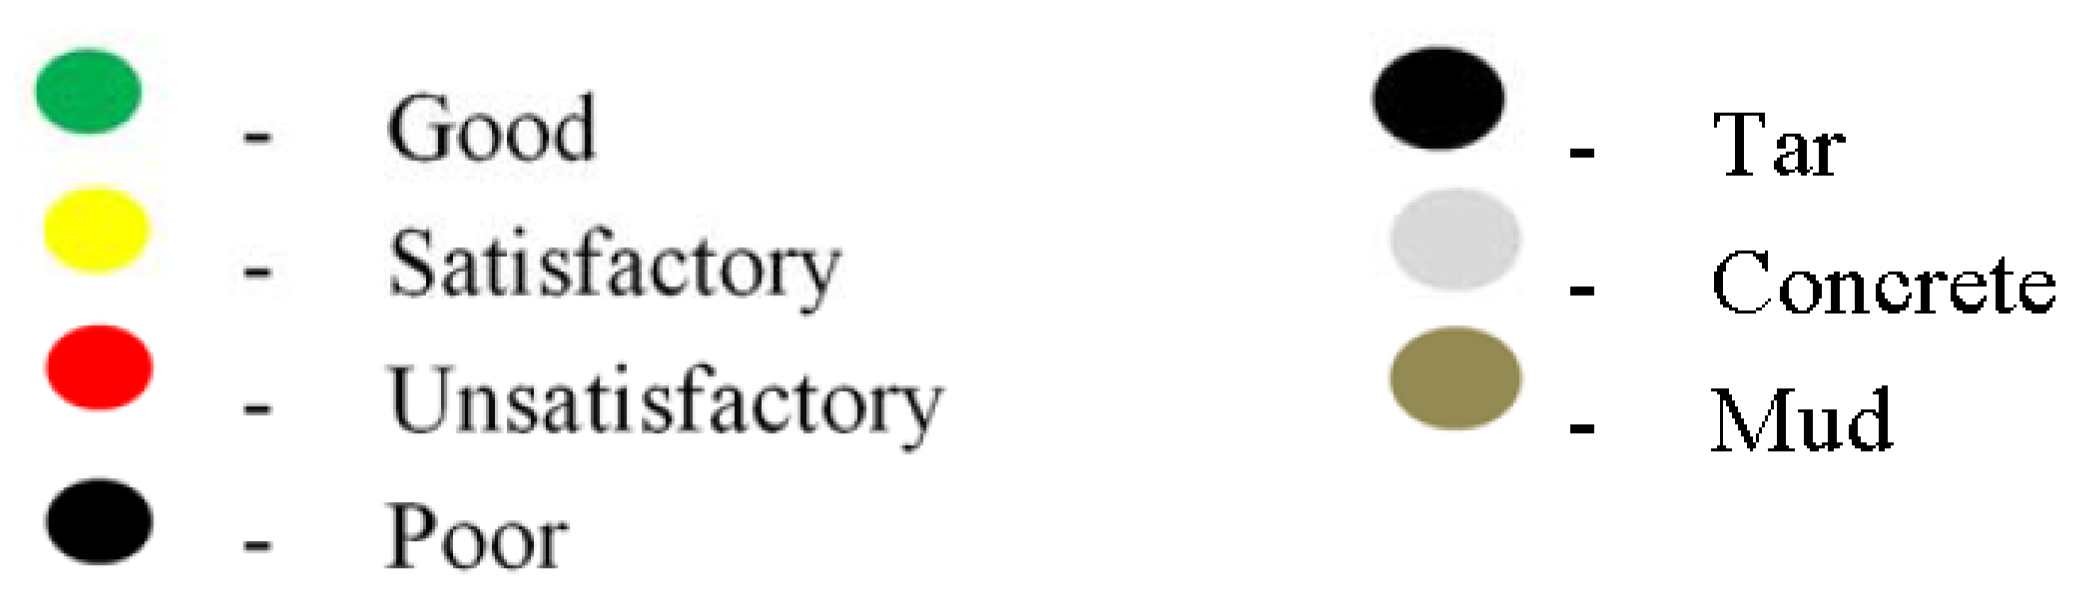
The classification mode of the application takes in the sensor data and performs a K-NN classification for both road condition and the road surface type data. The value of K was chosen as 5 based on the accuracy of the results after experimentation with different K values. To avoid incorrect classification when the vehicle is stationary, the classification is performed only when the speed of the vehicle exceeds 3 Kph. The legend for road condition and surface type mapping results is shown in
Figure 13. The results presented in
Figure 14,
Figure 15,
Figure 16,
Figure 17,
Figure 18,
Figure 19 and
Figure 20 were obtained by driving the vehicle mounted with the setup for a total stretch of around 4 km in a nearby locality (The demo is available at [
10]). The locality was chosen based on the availability of different types of the road surface and road condition classes. Classification of road surface type and road condition is performed every 2 s.
Figure 13.
Legend for Road Condition and Surface type Mapping.
Figure 13.
Legend for Road Condition and Surface type Mapping.
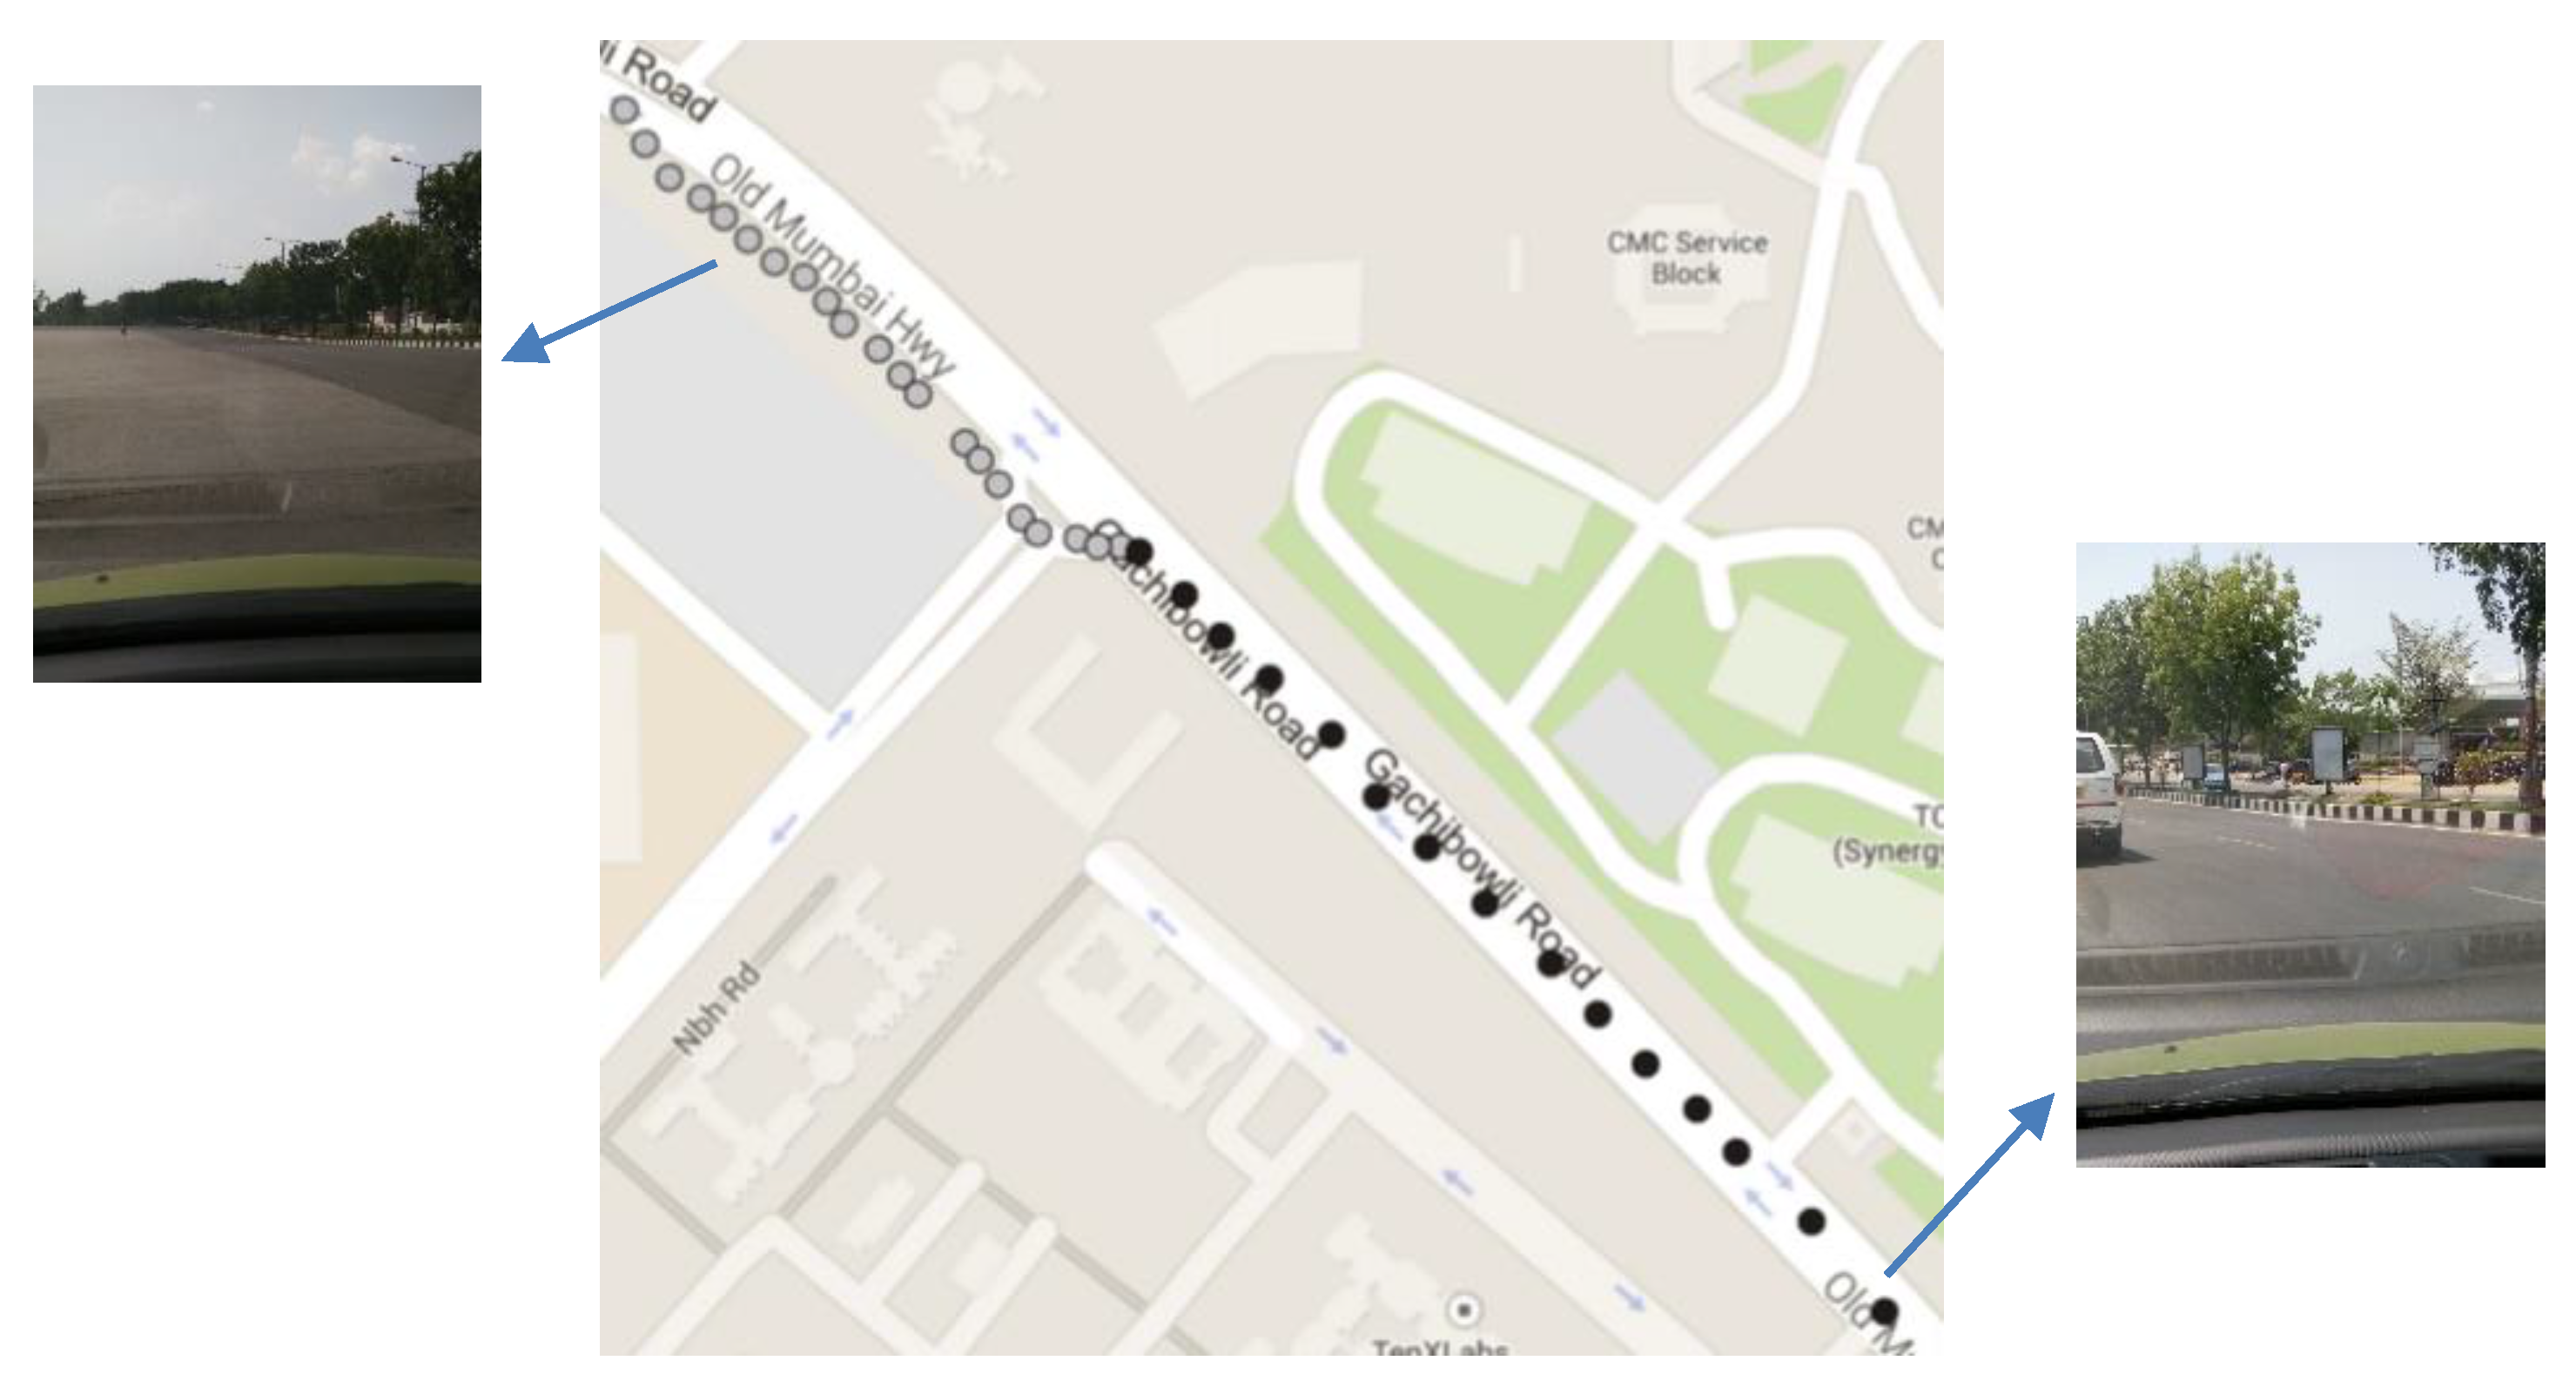
Figure 14.
Road Surface type Map for dataset 1 (few snapshots from the sortie are shown to the left and right of the map)—largely consisting of Asphalt and Concrete road.
Figure 14.
Road Surface type Map for dataset 1 (few snapshots from the sortie are shown to the left and right of the map)—largely consisting of Asphalt and Concrete road.
Figure 15.
Road Surface type Map for dataset 2 (red circle indicates one set of erroneous classification while green circle shows some of the correct classification results)—primarily a mud road with one section being Asphalt road.
Figure 15.
Road Surface type Map for dataset 2 (red circle indicates one set of erroneous classification while green circle shows some of the correct classification results)—primarily a mud road with one section being Asphalt road.
Figure 16.
Results comparison for predominantly Smooth Road. (a) is the Road Condition Results Map from MAARGHA, while (b) is from Roadroid (Screenshot from its cloud server).
Figure 16.
Results comparison for predominantly Smooth Road. (a) is the Road Condition Results Map from MAARGHA, while (b) is from Roadroid (Screenshot from its cloud server).
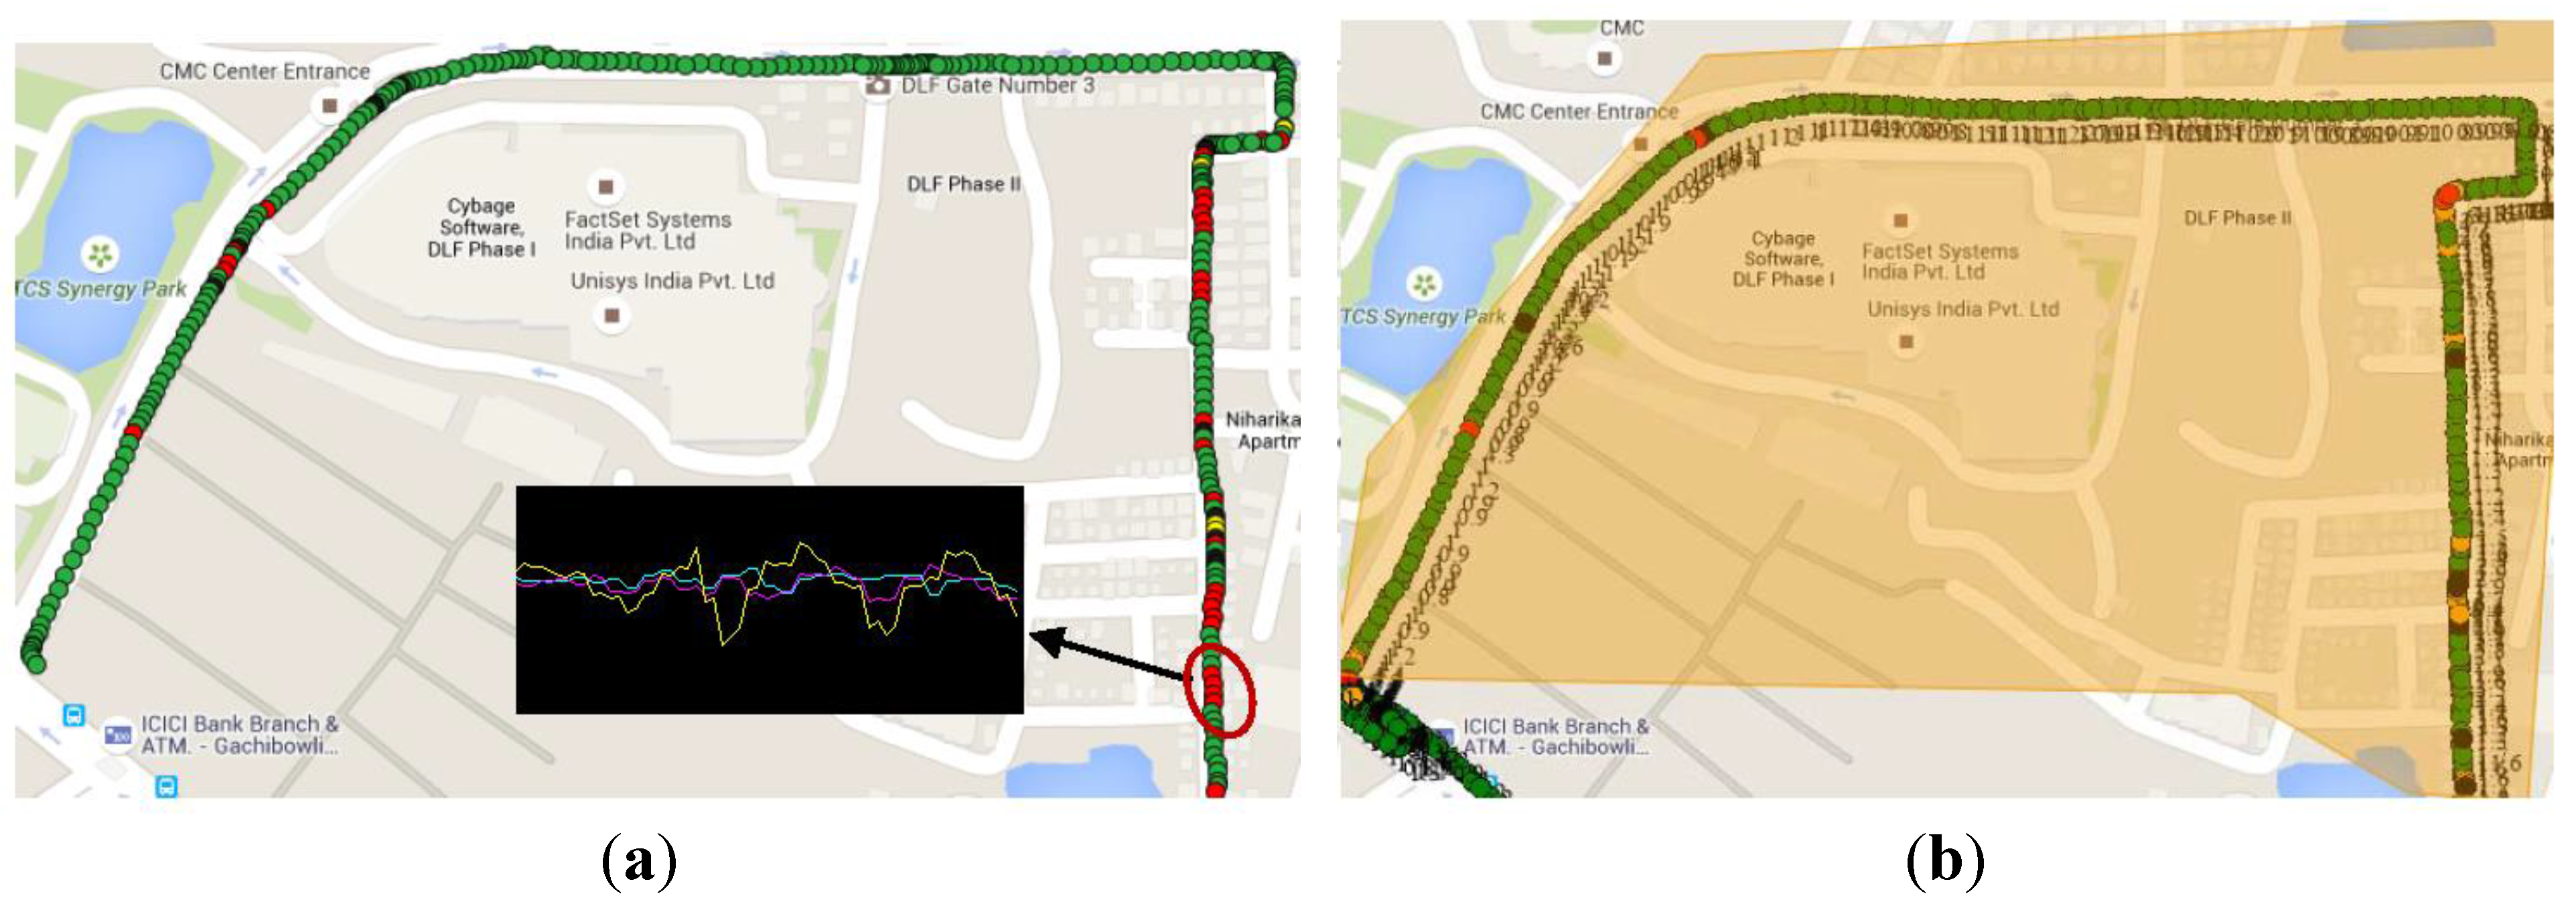
Figure 17.
Results comparison for moderately rough road. (a) is the Road Condition Results Map from MAARGHA (sub image: accelerometer readings), while (b) is from Roadroid (Screenshot from its cloud server).
Figure 17.
Results comparison for moderately rough road. (a) is the Road Condition Results Map from MAARGHA (sub image: accelerometer readings), while (b) is from Roadroid (Screenshot from its cloud server).
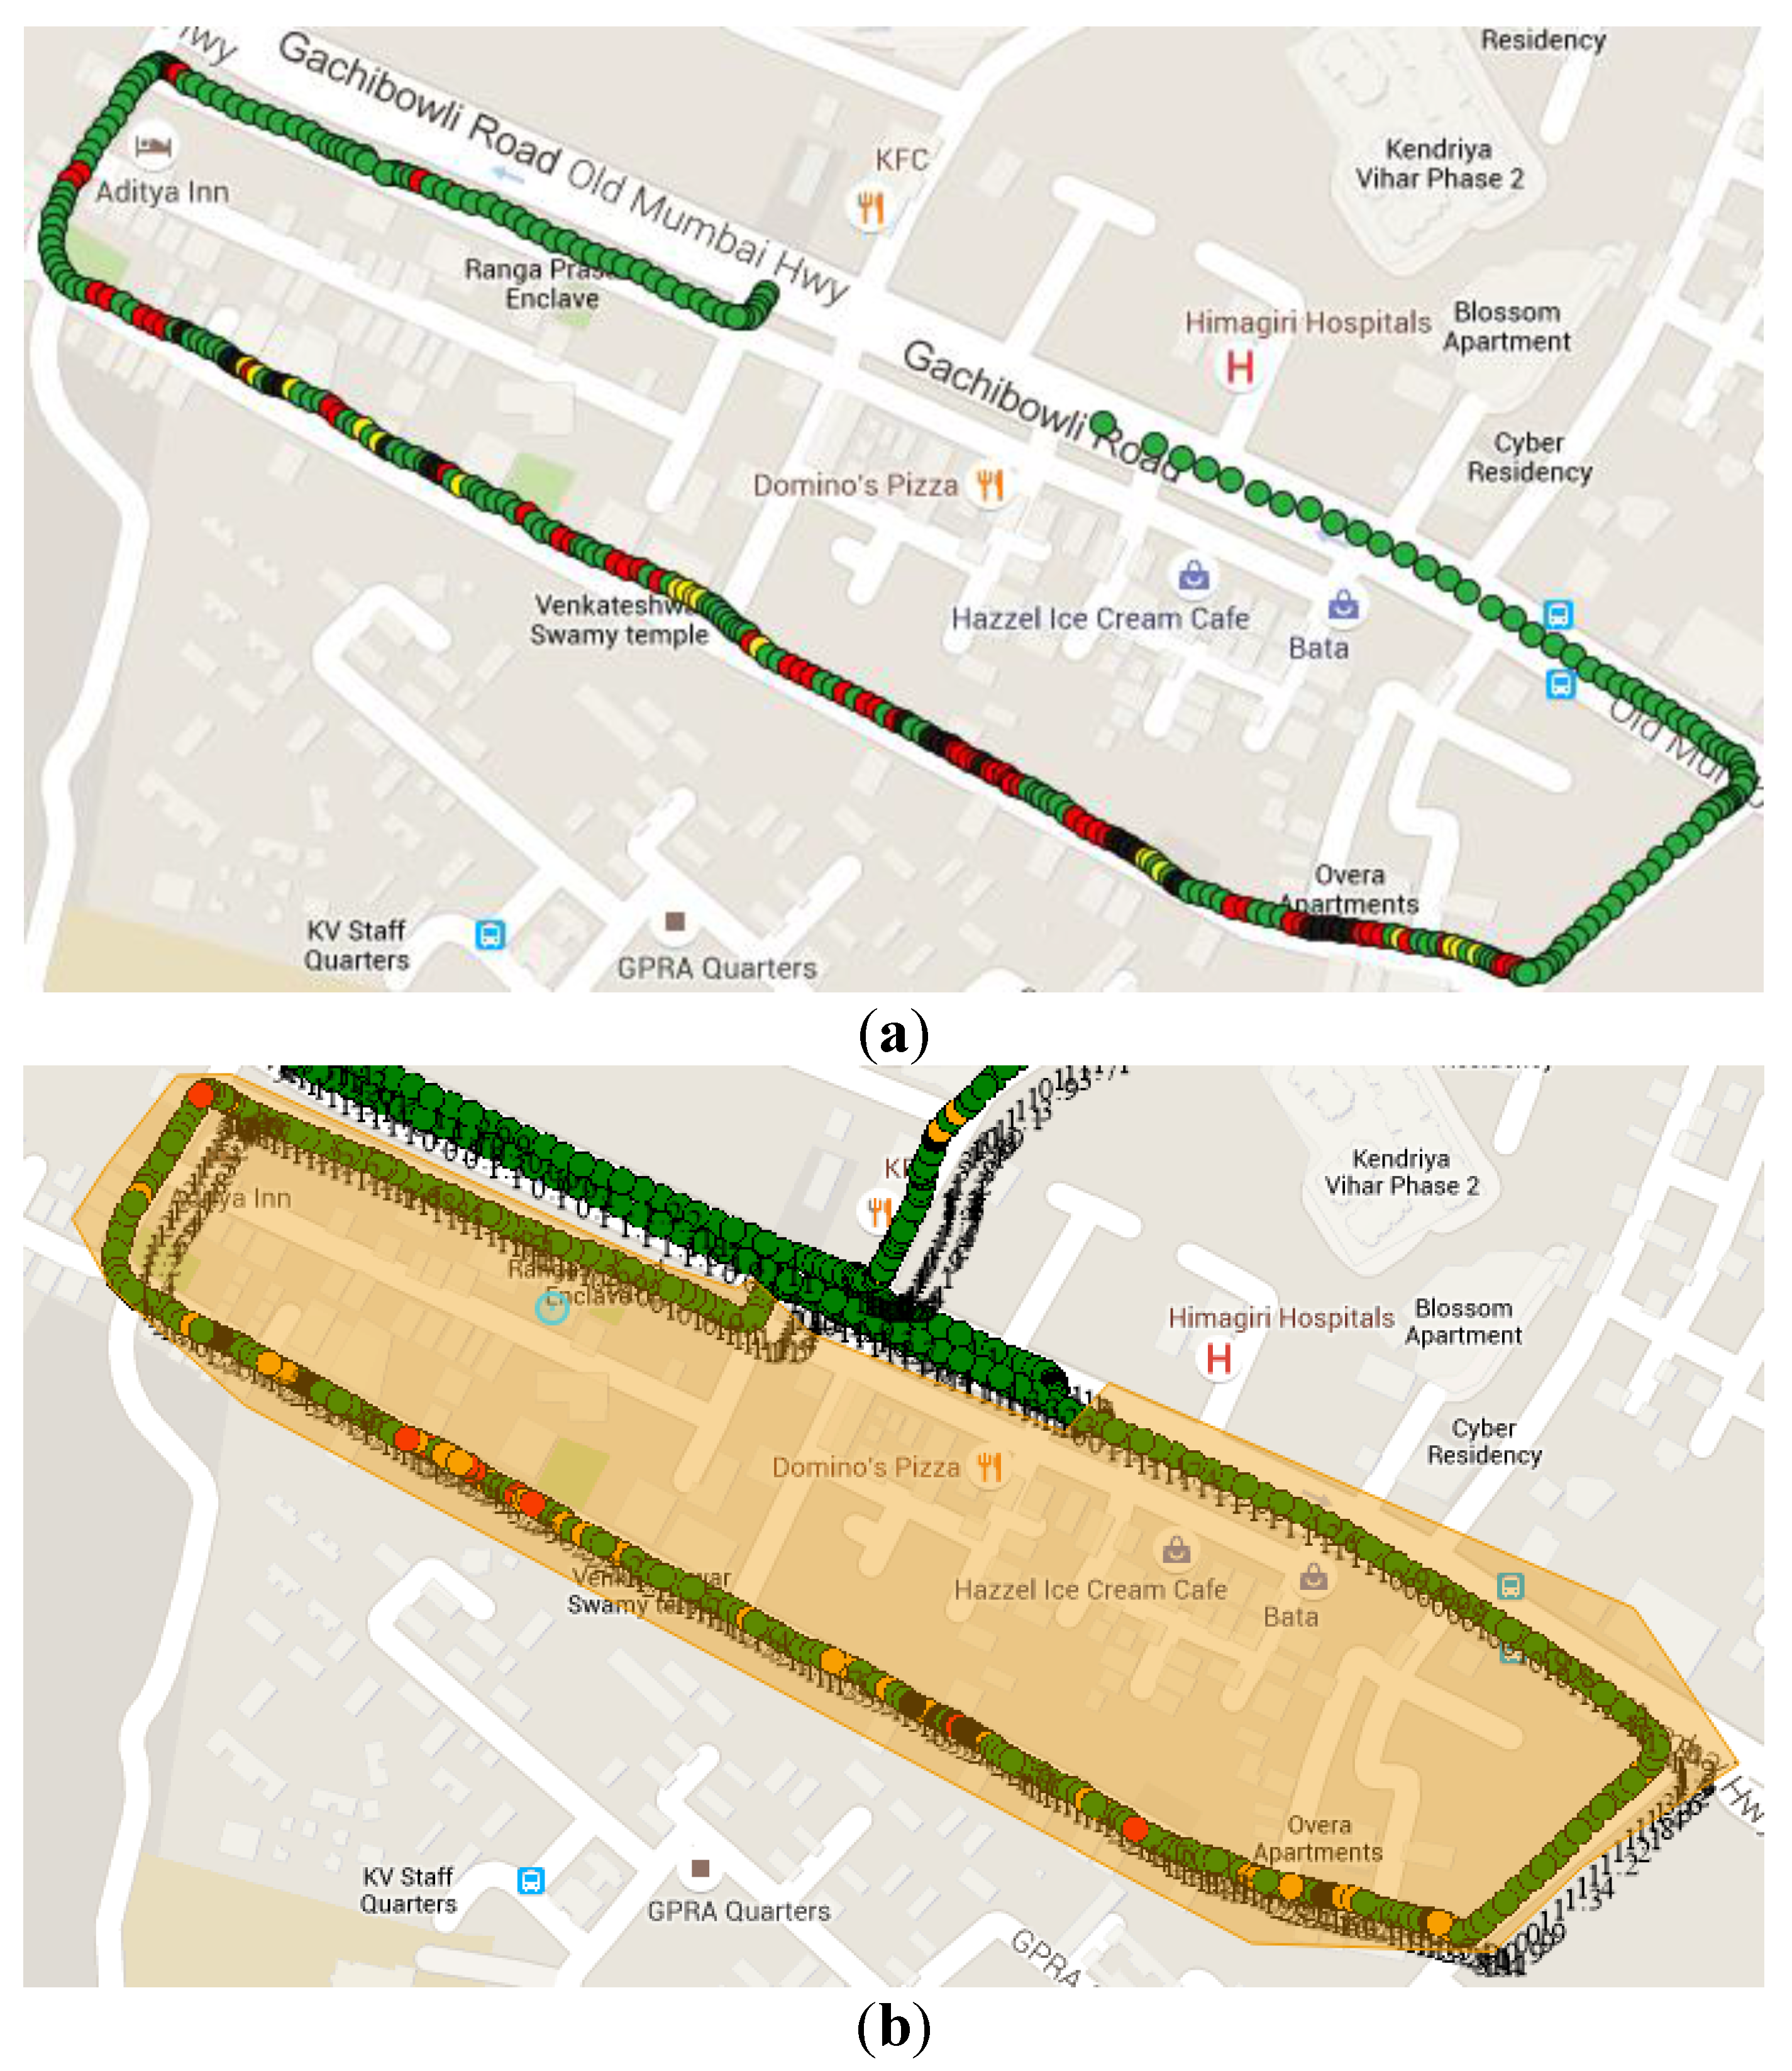
Figure 18.
Results comparison for significantly rough Road. (a) is the Road Condition Results Map from MAARGHA, while (b) from Roadroid (Screenshot from its cloud server).
Figure 18.
Results comparison for significantly rough Road. (a) is the Road Condition Results Map from MAARGHA, while (b) from Roadroid (Screenshot from its cloud server).
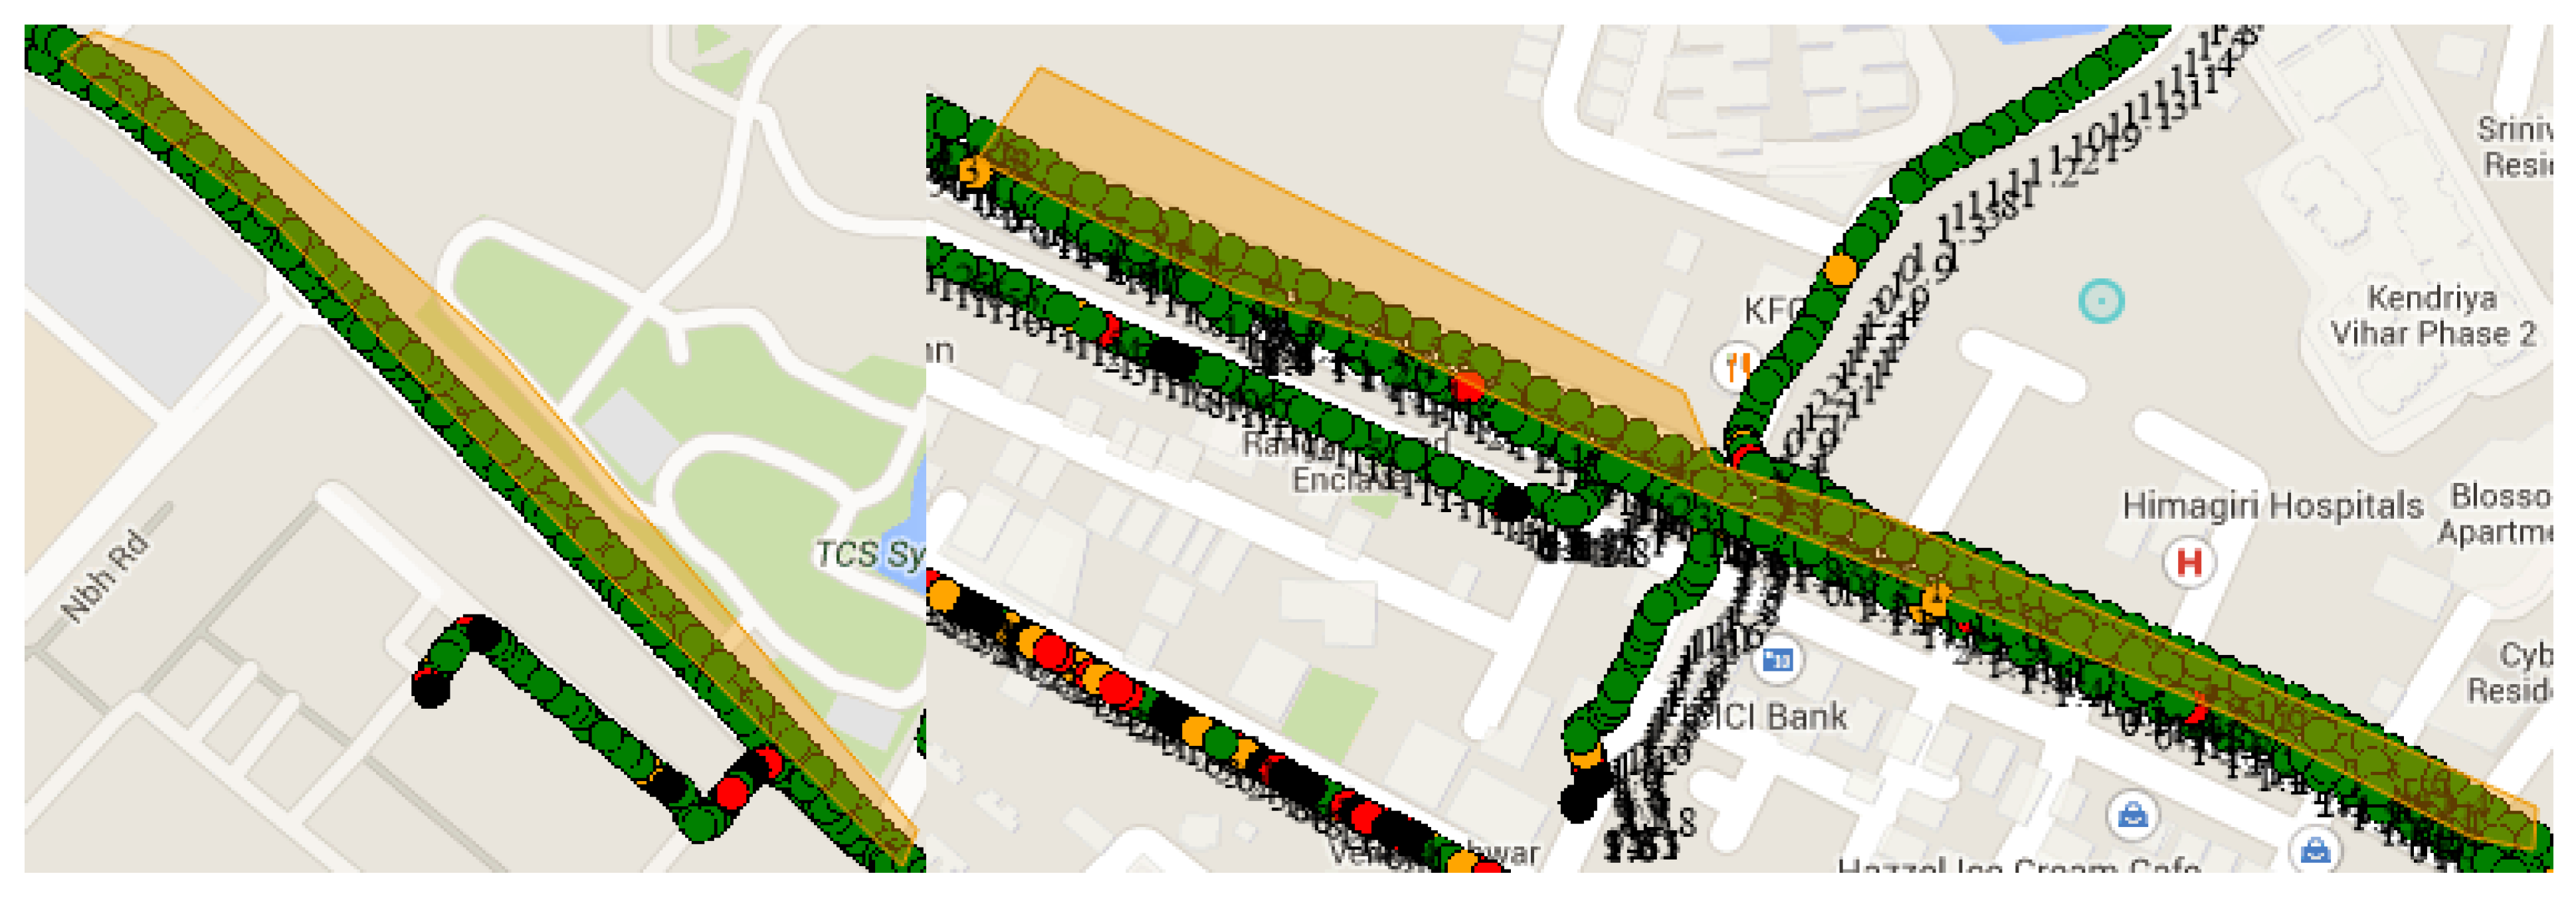
Figure 19.
Roadroid results showing 100% smooth road condition for a section of the road that does have minor potholes.
Figure 19.
Roadroid results showing 100% smooth road condition for a section of the road that does have minor potholes.
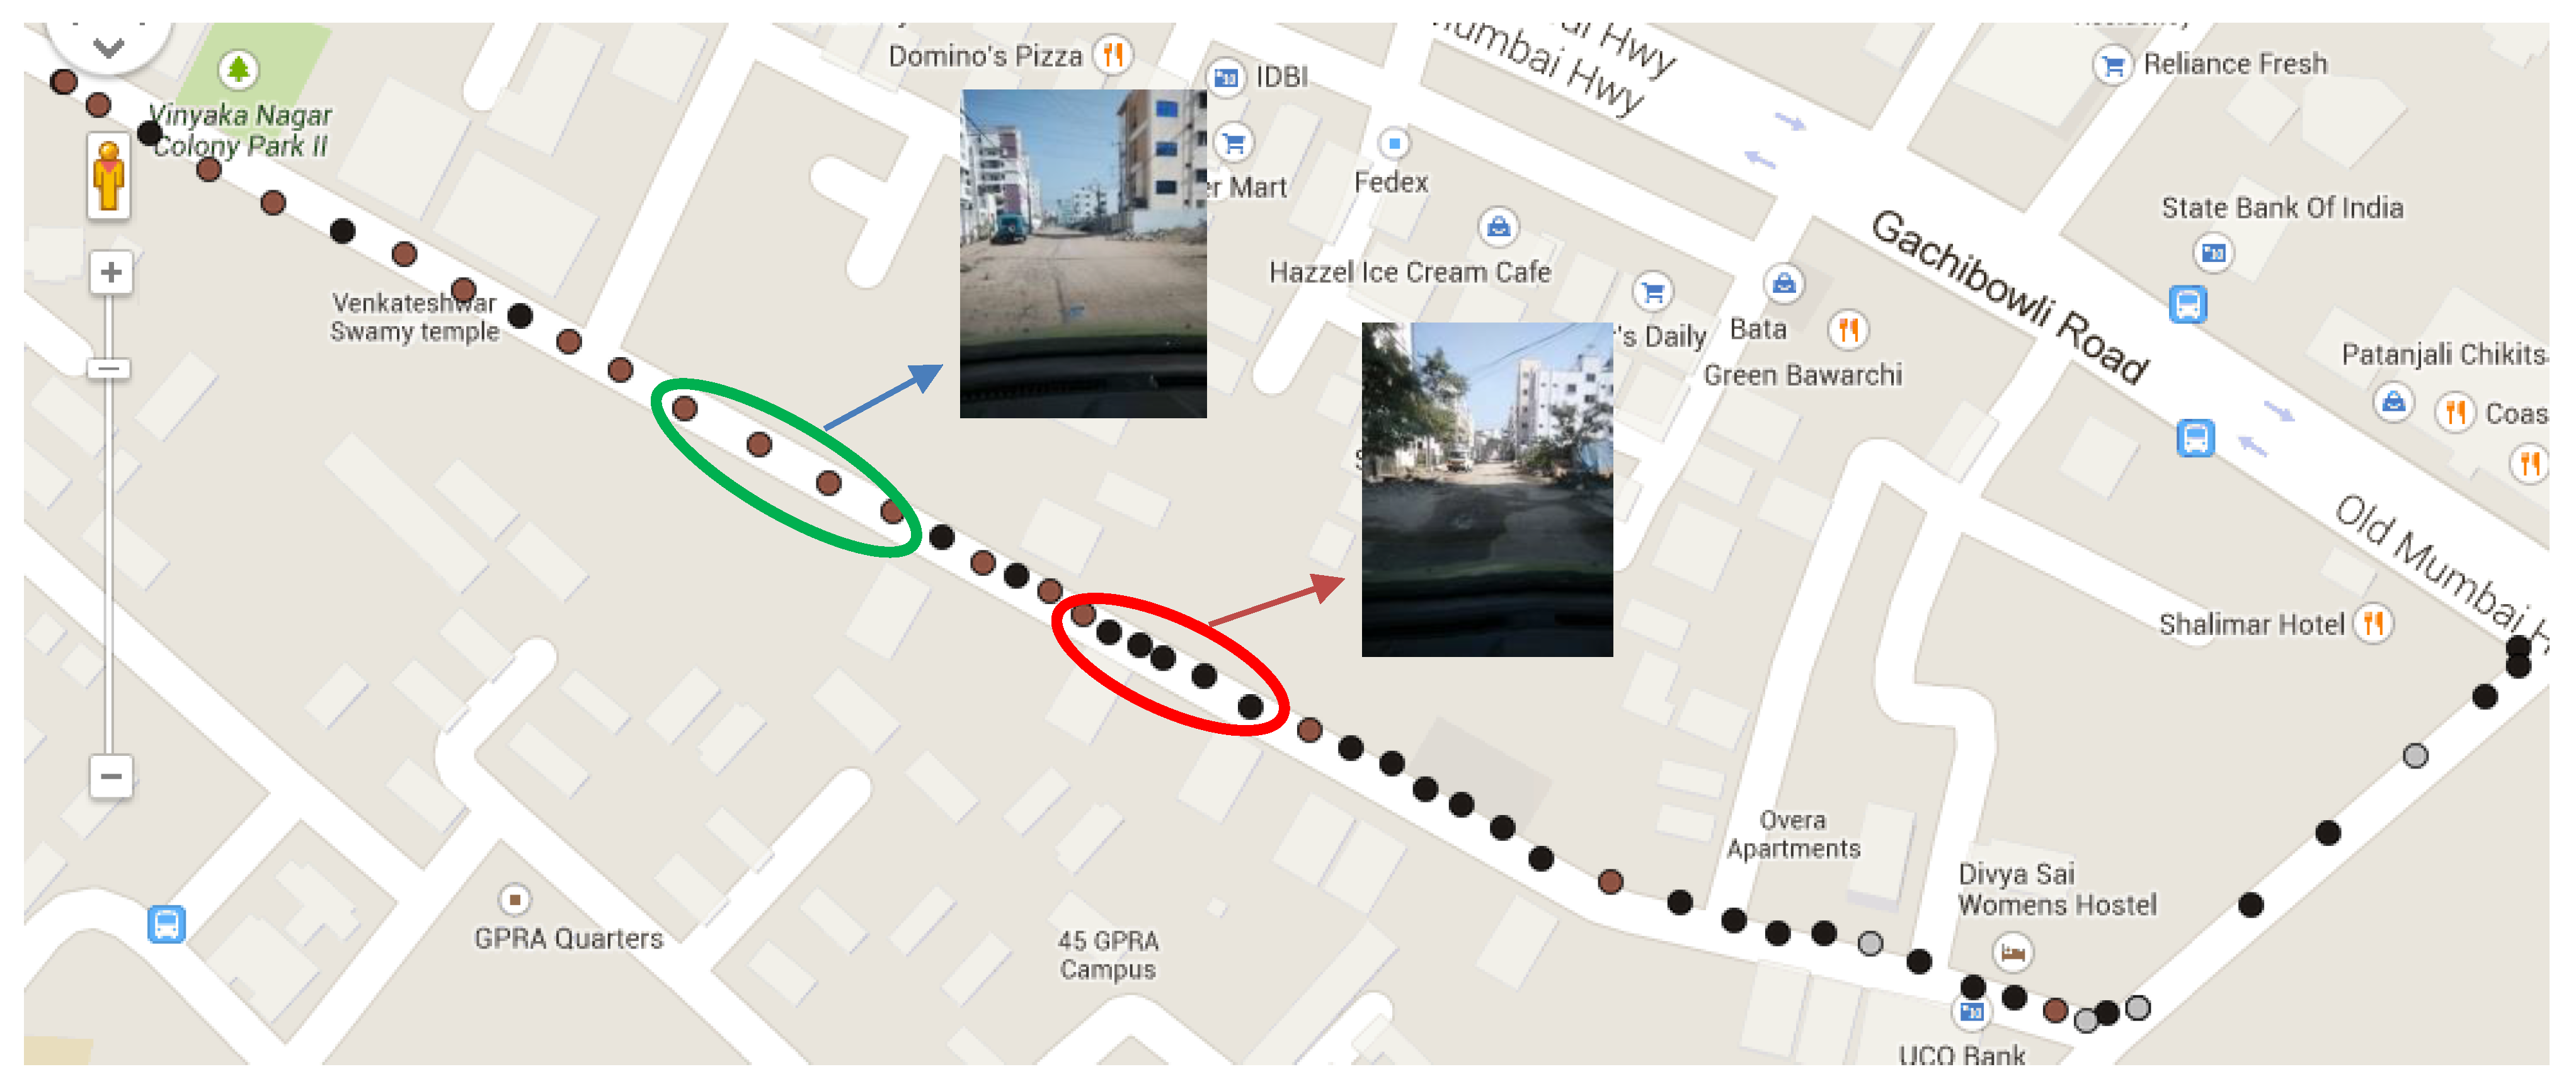
Figure 20.
MAARGHA accelerometer results supplemented by pothole detection showing some unsatisfactory road condition points (red circles are some of the detected potholes shown with their snapshots).
Figure 20.
MAARGHA accelerometer results supplemented by pothole detection showing some unsatisfactory road condition points (red circles are some of the detected potholes shown with their snapshots).
5.2.1. Road Surface Type Classification Results
The road surface type classification accuracy was measured against a manually generated ground truth by calculating the percentage of correct classification as per Equation (2). True positives are the number of instances when the algorithm matched with the manual classification. False positives are the number of instances when the surface type was misclassified. True and false negatives were considered to be zero as they cannot be measured in this scenario. The results of road classification for the two groups of datasets have been presented below.
The
Figure 14 and
Table 4 shows a 100% accurate surface type classification result under clear sky conditions and when there are no shadowed regions.
Figure 15 shows results from dataset 2, where larger part of the road stretch is laden with shadows of buildings, which resulted in incorrect classification.
Table 5 summarizes the results, showing an initial accuracy of 51%. Given that the ideal dataset was used for training, the shadowed road surfaces tend to get classified as tar/bitumen class as seen in
Figure 15. The true positives occur at sections of the road without shadows. As road surface type does not change frequently, sparsely distributed incorrect classification results can be corrected either using the neighborhood information or manually picking the odd results. In this case, around seven such instances can be identified and removed bringing up the accuracy to 60%. However, time of the day based filtering of the results from multiple sorties can significantly minimize the effect of shadows.
5.2.2. Road Condition Classification Results
The results presented here are from both the proposed MAARGHA system and the Roadroid system [
1], obtained by gathering data at the same time for the same stretch of the road segments. The setup needed two smartphones to be mounted to the vehicle windshield, one running Roadroid app and the other one running the data collection app used by MAARGHA. While the figures provide a visual comparison of the results obtained, the corresponding table tabulates and presents the performance of these two systems. A rough estimate of the ground truth was known from the microphone recordings of the vehicle driver while conducting the experiments.
Table 4.
Road Surface type Classification for dataset 1.
Table 4.
Road Surface type Classification for dataset 1.
| Category | True | False |
|---|
| Positives | 36 | 0 |
| Negatives | 0 | 0 |
| Accuracy | 100% |
Table 5.
Road Surface type Classification for dataset 2.
Table 5.
Road Surface type Classification for dataset 2.
| Category | True | False |
|---|
| Positives | 24 | 23 |
| Negatives | 0 | 0 |
| Accuracy | 51% |
The road condition results in
Figure 16 and
Table 6 reflects high correlation between MAARGHA and Roadroid systems for predominantly smooth roads. In roads intermittent with rough patches (
Figure 17 and
Table 7) both the systems identified similar bad patches (poor) but they opine slightly different in the road condition classification. Few of the road mass points that were classified as “good” and “satisfactory” in Roadroid has been classified as “unsatisfactory” in “MAARGHA”. Inspecting the accelerometer readings at such instances, it is observed that the vehicle produced more body roll than vertical motion, when moving slowly in continuous bad patches of the road. The yellow line in the sub image of
Figure 17 is the lateral acceleration along the
X-axis corresponding to the body roll of the vehicle. Roadroid appears to be less sensitive towards this lateral motion. Other than such differences the results of both the systems match each other for the poor and smoother sections of the road. According to the ground truth recorded in the microphone, the third comparison result is for a road stretch that had significant rough road condition. This road stretch consisted of rough mud road at the beginning and smoother tar road towards the end. As per the results (
Figure 18 and
Table 8) Roadroid follows similar trend of assigning more “good” and “satisfactory” scores as compared to MAARGHA, while the latter produced more “unsatisfactory” results. Overall, both systems are comparable having similar response to smooth roads and slightly divergent response to the rough roads as seen visually from the
Figure 16,
Figure 17 and
Figure 18. Both the systems successfully identify major road anomalies and thus providing the important information expected out of a road survey.
5.2.3. Pothole Detection Results
The proposed system uses images obtained from the smartphone camera to identify the potholes that are usually missed out by accelerometer only approach. In sections of the roads where accelerometer based results from MAARGHA and results from Roadroid (
Figure 19) showed 100% “good” roads, image based identification helped to identify the missed out potholes. Since the frequency of the snapshots is 0.5 Hz, generally multiple runs (
Figure 20 shows MAARGHA results from a single run) produces 100% detection. The end result of the classification is more realistic with the additional sensor information and move closer towards ground. The combined results of MAARGHA and Roadroid is summarized in
Table 9.
Table 6.
Comparison Report 1.
Table 6.
Comparison Report 1.
| Road Condition Class | MAARGHA(Num of Points) | MAARGHA—% of Points | Roadroid—Num of Points | Roadroid—% of Points |
|---|
| Good | 76 | 100 | 71 | 100 |
| Satisfactory | 0 | 0 | 0 | 0 |
| Unsatisfactory | 0 | 0 | 0 | 0 |
| Poor | 0 | 0 | 0 | 0 |
| Total | 76 | | 71 | |
Table 7.
Comparison Report 2.
Table 7.
Comparison Report 2.
| Road Condition Class | MAARGHA—Num of Points | MAARGHA—% of Points | Roadroid—Num of Points | Roadroid—% of Points |
|---|
| Good | 224 | 83.27138 | 220 | 80.9 |
| Satisfactory | 3 | 1.115242 | 22 | 8.1 |
| Unsatisfactory | 30 | 11.15242 | 12 | 4.4 |
| Poor | 12 | 4.460967 | 18 | 6.6 |
| Total | 269 | | 172 | |
Table 8.
Comparison Report 3.
Table 8.
Comparison Report 3.
| Road Condition Class | MAARGHA—Num of Points | MAARGHA—% of Points | Roadroid—Num of Points | Roadroid—% of Points |
|---|
| Good | 214 | 68.81029 | 253 | 80.06329 |
| Satisfactory | 18 | 5.787781 | 39 | 12.34177 |
| Unsatisfactory | 54 | 17.36334 | 12 | 3.797468 |
| Poor | 25 | 8.038585 | 12 | 3.797468 |
| Total | 311 | | 316 | |
Table 9.
Comparison Report showing significance of image based pothole detection.
Table 9.
Comparison Report showing significance of image based pothole detection.
| Road Condition Class | MAARGHA—Num of Points | MAARGHA—% of Points | Roadroid—Num of Points | Roadroid—% of Points |
|---|
| Good | 100 | 96.15385 | 118 | 100 |
| Satisfactory | 0 | 0 | 0 | 0 |
| Unsatisfactory | 4 | 3.846154 | 0 | 0 |
| Poor | 0 | 0 | 0 | 0 |
| Total | 104 | | 118 | |
6. Conclusions
The developed system based on multi-sensor information fusion here provided a unique and simple way of classifying the roads. There is always a trade-off between computational complexity, ease of implementation and the accuracy of results achieved while building a system. While highly complex algorithms may provide a high accuracy, the computational and implementation needs of such algorithms on mobile or other simple platforms may be quite challenging. In the proposed system, accelerometer and camera sensors helped in collecting data to perform the classification, whereas the GPS provided for accurately geo-tagging and updating the GIS database. Moreover, all the sensors used in this application are common and are available in a modern smart phone.
Results show that the proposed system compares well with the current state of the art systems that produce information levels of 3 and 4. The use of images helped identify information usually missed out by the conventional systems, thus improving the information level further. The images also helped to provide additional information like road surface type, thus improving the information diversity. Though the proposed system is currently not an engineering grade solution, but it can be potentially extended to measure the exact dimensions of the potholes, provided a calibrated camera is being used. Also, the proposed system enables easy manual inspection of bad road images for large road monitoring projects.
Further work is needed through extensive field trials for evaluating many other field conditions and improving the algorithm heuristics to deliver an operational system of MAARGHA. Algorithmic approaches can be introduced to filter and remove lesser quality data especially with respect to the clutter of the images. The surface type classification thread of the application depends on the brightness of the camera scene; classification accuracy can be improved by using additional luminance sensors to adjust the sensitivity of the camera. On the other hand, given the ease of the system application, multiple data points for each location including at different times of the day can be generated by multiple users of the system—an ideal condition for using this application within a crowd sourced platform of GIS based Road Information system’s data generation and updating. The latter leads to a situation where improving the accuracy of road classification will become purely an operational challenge. Overall, the proposed system provides a valuable contribution in bridging the needs of the road maintenance agencies like the municipal corporations, highway authorities and the developments in imaging and sensor technologies for road surveillance at all levels.
Acknowledgments
Authors acknowledge the support from their institution IIIT-Hyderabad that helped them present the idea at the Tracking and Imaging Challenge 2014 at Zurich, Switzerland.
Authors thank the Roadroid developers for providing the license for evaluating the results.
Author Contributions
Deepak Rajamohan and Bhavana Gannu developed the prototype and wrote the paper. Krishnan Sundara Rajan guided the authors in designing and developing the prototype and reviewed the work.
Conflicts of Interest
The authors declare no conflict of interest.
References
- Jones, H.; Forslof, L. Roadroid continuous road condition monitoring with smartphones. In Proceedings of the 5th SARF/IRF Regional Conference, Pretoria, South Africa, 2–4 September 2014.
- Sayers, M.W.; Gillespie, T.D. The International Road Roughness Experiment: Establishing Correlation and a Calibration Standard for Measurements; World Bank: Washington, DC, USA, 1986; p. 45. [Google Scholar]
- Wang, K.C.P.; Smadi, O. Automated Imaging Technologies for Pavement Distress Surveys; Transportation Research Board: Washington, DC, USA, 2011. [Google Scholar]
- Yu, S.-J.; Sukumar, S.R.; Koschan, A.F.; Page, D.L.; Abidi, M.A. 3D reconstruction of road surfaces using an integrated multi-sensory approach. In Optics and Lasers in Engineering; Elsevier: Knoxville, TN, USA, 2007; Volume 45, pp. 808–818. [Google Scholar]
- Pavement Profile Scanner (PPS) White Paper. Available online: http://www.phnx-sci.com/ (accessed on 20 July 2015).
- Shamsabadi, S.S.; Wang, M.L.; Birken, R. Pavemon: A GIS-based pavement monitoring system using large amounts of near-surface geophysical sensor data. In Proceedings of the 27th Annual Symposium on the Application of Geophysics to Engineering and Environmental Problems (SAGEEP), Boston, MA, USA, 16 March 2014.
- Mohan, P.; Padmanabhan, V.N.; Ramjee, R. Nericell: Rich monitoring of road and traffic conditions using mobile smartphones. In Proceedings of the 6th ACM Conference on Embedded Network Sensor Systems, Raleigh, NC, USA, 4–7 November 2008.
- Bhoraskar, R.; Vankadhara, N.; Raman, B.; Kulkarni, P. Wolverine: Traffic and road condition estimation using smartphone sensors. In Proceedings of the 2012 Fourth International Conference on Communication Systems and Networks (COMSNETS 2012), Bangalore, India, 3–7 January 2012.
- Eriksson, J.; Girod, L.; Hull, B.; Newton, R.; Madden, S.; Balakrishnan, H. The pothole patrol: Using a mobile sensor network for road surface monitoring. In Proceedings of the 6th international conference on Mobile systems, applications, and services, Breckenridge, CO, USA, 17–20 June 2008.
- Road Condition and Texture Estimation. Available online: https://www.youtube.com/watch?v=geu6IoKTqw4&list=UUjh7yE6kU9HPVF9FqdspqcQ (accessed on 17 July 2015).
- Buza, E.; Omanovic, S.; Huseinovic, A. Pothole detection with image processing and spectral clustering. In Proceedings of the 2nd International Conference on Information Technology and Computer Networks (ITCN ’13), Antalya, Turkey, 8–10 October 2013.
- Zhang, J.; Hu, J. Image segmentation based on 2D Otsu method with histogram analysis. In Proceedings of the 2008 International Conference on Computer Science and Software Engineering, Wuhan, China, 12–14 December 2008.
- Mistry, V.H.; Makwana, R. Survey: Vision based road detection techniques. Int. J. Comput. Sci. Inf. Technol. 2014, 5, 4741–4747. [Google Scholar]
- Zhang, J.; Nagel, H.-H. Texture based segmentation of road images. In Proceedings of the Symposium of Intelligent Vehicles, Paris, France, 24–26 October 1994.
- Buluswar, S.D.; Draper, B.A. Color recognition in outdoor images. In Proceedings of the Sixth International Conference on Computer Vision (IEEE Cat. No.98CH36271), Bombay, India, 7 January 1998.
- Alvarez, J.M.; Lopez, A.; Baldrich, R. Illuminant-invariant model-based road segmentation. In Proceedings of the IEEE Intelligent Vehicles Symposium, Eindhove, Netherlands, 4–6 June 2008.
- Horn, B.K.P. Robot Vision; MIT Press: Cambridge, MA, USA, 1987. [Google Scholar]
- Nayar, S.K.; Ikeuchi, K.; Kanade, T. Determining shape and reflectance of hybrid surfaces by photometric sampling. IEEE Trans. Robot. Automat. 1990, 6, 418–431. [Google Scholar] [CrossRef]
- Phong, B.T. Illumination for computer generated images. Commun. ACM 1975, 18, 311–317. [Google Scholar] [CrossRef]
- Finlayson, G.; Hordley, S.; Drew, M. Removing shadows from images. In Proceedings of the European Conference on Computer Vision, Copenhagen, Denmark, 27 May–2 June 2002.
- Finlayson, G.D.; Drew, M.S.; Lu, C. Intrinsic images by entropy minimization. In Proceedings of the 8th European Conference on Computer Vision, Prague, Czech Republic, 11–14 May 2004.
- Sahragard, N. Daylight color model for outdoor machine vision in Bandar Abbas, Iran. Int. J. Emerg. Trends Technol. Comput. Sci. 2013, 2, 249–254. [Google Scholar]
- Pomerleau, D.A. Neural Network Perception for Mobile Robot Guidance; Kluwer Academic Publishers: Boston, MA, USA, 1993. [Google Scholar]
- Rumelhart, D.E.; McClelland, J.L.; California, S.D. A general framework for parallel distributed processing. In Parallel Distributed Processing: Explorations in the Microstructure of Cognition; MIT Press: Cambridge, Mass, USA, 1986; Volume 1, pp. 45–76. [Google Scholar]
- Thorpe, C.E. Color vision for road following. In Vision and Navigation the Carnegie Mellon Navlab; Springer US: Boston, MA, USA, 1990; pp. 175–185. [Google Scholar]
- Brodley, C.E.; Utgoff, P.E. Multivariate decision trees. Mach. Learn 1995, 19, 45–77. [Google Scholar] [CrossRef]
- Huang, J.; Kong, B.; Li, B.; Zheng, F.A. New method of unstructured road detection based on hsv color space and road features. In Proceedings of the International Conference on Information Acquisition, Seogwipo-si, Korea, 8–11 July 2007.
- Aggarwal, C.C.; Hinneburg, A.; Keim, D.A. On the surprising behavior of distance metrics in high dimensional space. In Proceedings of the 8th International Conference on Database Theory, London, UK, 4–6 January 2001.
- Aherene, F.J.; Thacker, N.A.; Rockett, P.I. The bhattacharyya metric as an absolute similarity measure for frequency coded data. Kybernetika 1997, 32, 1–7. [Google Scholar]
- White, C.E.; Bernstein, D.; Kornhauser, A.L. Some map matching algorithms for personal navigation assistants. Transp. Res. 2000, 8, 91–108. [Google Scholar] [CrossRef]
© 2015 by the authors; licensee MDPI, Basel, Switzerland. This article is an open access article distributed under the terms and conditions of the Creative Commons Attribution license (http://creativecommons.org/licenses/by/4.0/).


