1. Introduction
Social media has become a major issue in today’s society. It changed everyday life for many people as well as the internet itself. Online platforms like Facebook or Twitter have become an important aspect in information science because new opportunities of producing and sharing information arise. Social media is not only a regional phenomenon but influences the way of communication in the world and society. According to Castells [
1] we refer to the “network society” which is predominantly represented in so called “Informational Cities” [
2,
3,
4].
“The new spatial logic, characteristic of the Informational City, is determined by the preeminence of the space of flows over the space of places. By space of flow, I refer to the system of exchanges of information, capital, and power that structures the basic processes of societies, economies and states between different localities, regardless of localization”.
Furthermore, flows of information often play a role when it comes to world city analyses [
6]. World cities overcome distances by their connections. Those connections can be physical, like airports which offer flights from and to all mayor destinations in the world, or digital, like emails or telephone correspondence. Referring to Stock [
3], today we may find “Informational Cities” which are global player in a world city hierarchy. Those cities are hubs in a global network [
2] regarding their space of flows. According to Mainka
et al. [
7], we will call those cities “Informational World Cities”. Their definition of “Informational World Cities” and the 31 cities they identified form the foundation of this paper.
The question arises of how to measure flows of information. On the city level, we could measure the communication that is occurring between actors located in different cities. The flow of information through electronic communication between employees in firms is not an available resource for researchers [
8], but, through the mass communication on social media channels, we are able to analyze connections between users located in cities or spreading information about cities. We will not separate the users in hierarchical levels, e.g., celebrities and ordinary users, but deem the connections between them as vertical. To analyze vertical connections, we will use a scientrometric approach. Here, the flow of information is measured e.g., by scientific publications and their reputation or co-authorship [
9]. Those flows can also be measured on country or city level. For example, Haustein
et al. [
10] studied the citation and collaboration rates between researchers in the Asia-Pacific region on the country level. Thus, it is possible to see from where the information is coming, e.g., an information flow from China to Indonesia is given when a researcher from Indonesia cites a research paper which was written by a Chinese researcher. Furthermore, the closeness of both researchers is given if both are cited by a third researcher. We will adapt the idea of this study in regard to an informetric investigation of microblogging connectivity of 31 informational world cities on Twitter. Regarding this, an information flow on Twitter is given on a metadata level, (1) when a user located in city A replies to a tweet from a user located in city B, or (2) the content of a tweet is referring to more than one city. The use of metric methods from scientometry in other environments, like the web, is referred to as webometrics or altmetrics [
11]. The broader term that combines all these measuring methods is still informetric [
12]. Thus, we measure whether information flows through cities exist and if cities are connected in the Twittersphere. The Twittersphere includes all postings (
i.e., tweets) made on Twitter and therefore just refers to users of this microblog. Hence, these are the limitations of this analysis. Twitter is not equally spread in all cities in the world. Furthermore, Twitter is blocked in China [
13] and therefore just visitors or citizens who know how to bypass this barrier are included in this analysis.
Launched in 2006 with a total number of about a billion registered users today and 241 million monthly active users that created 300 billion tweets until October 3rd 2013, sending 500 million new tweets every day [
14], Twitter is among the biggest social networks and microblogging services available. Twitter is an example of a microblogging platform that is based on the production of real-time updates [
15]. Every post is restricted to 140 characters. Users can be addressed by user mentions (e.g., @ladygaga) and tweets can be indexed into categories by using hashtags (e.g., #tweetsandthecity). In addition, publicly-traded companies are highlighted by using the dollar sign right before their stock ticker symbol (e.g., $SI for Siemens). Hence, we are dealing with rapidly changing huge data sets that cannot be analyzed with classical data processing methods, so-called Big Data. Thus, Twitter is a great target of scientific investigations and mining approaches regarding many different topics like the usage by sport clubs [
16,
17], political sentiment analyses [
18], spreading and recommendation of news [
19,
20] natural disasters and events [
21,
22,
23] to only mention a few. Weller
et al. [
24] provide a great collection of recent important work in their publication “Twitter and Society” by bringing the work of the leading international Twitter researchers together in one publication. It shows the importance and diversity of Twitter research and reinforces our engagement to investigate Informational World Cities on Twitter.
Investigations that examine cities or locations on Twitter in general have already been done for different aims. Heverin and Zach [
25] investigated the Twitter activities in 60 U.S. cities with populations greater than 300,000 of which 30 police departments have active Twitter accounts. They observed that most of the tweets posted by these accounts contain crime or incident information. Topic detection could also be used to identify the geo-location of social media users. Han and Cook [
26] (p. 452) assume that some topics like “Piccadilly” and “tube” are more often used in tweets by persons located in London than in another city.
Weidemann [
27] showed that only 6% of all Twitter users share their geo-location. An investigation on general Twitter activities in London, Paris and New York City has already been done by Adnan & Longley [
28]. They compared names, probable ethnicities and genders of Twitter users in these cities. According to their findings, the majority of twitter users are male and English speaking, In addition, users in certain areas are more active than others. For example, Queens shows a rather low Twitter activity in comparison to Manhattan.
Mossberger, Wu and Crawford [
29] created an “Interactivity Score“ for the 75 largest U.S. cities that determines the interactivity between governments and citizens in social networks, such as Twitter. They reach the conclusion that the use of Twitter by governments in these cities increased from 25% (2009) to 87% (2011). In their ranking, New York City, Los Angeles and Chicago occupy places in the top 10 of the most interactive cities. San Francisco (#18) and Boston (#26) are lower ranked. Mainka
et al. [
30] did a similar study for the 31 informational world cities. They come to the conclusion that Twitter is the most actively used social media platform for goverment and library use. This confirms our suspicion that Twitter activities of these cities are worth being investigated. Thus, our investigation of 31 cities in the Twittersphere will analyze the following research questions:
- (1)
How many Twitter users do the analyzed cities have?
- (2)
Which websites are predominant in information flows of the analyzed cities in the Twittersphere?
- (3)
Which content is predominant in information flows of the analyzed cities in the Twittersphere?
- (4)
Is it possible to measure the connectedness between cities via Twitter content analyses?
These four questions build on each other. Firstly, we want to know how active users in the 31 cities are. To be more precise, we want to know how many tweets are produced in each of the cities to obtain an indication of how relevant the more profound results are. Answering questions 2 and 3 gives as a good overview of what content is produced in each city. With these results, we can finally try to find content-based explanations for the connectedness between the cities. As a result, the first three questions contribute to the analysis of the results of question 4. The flow of information will be measured by geo located metadata and content analysis. Finally, the findings of this investigation show a short term investigation and represent a small excerpt of the Twittersphere. To our knowledge, it is one of the first attempts to measure information flows between cities using the microblog Twitter with an informetric approach.
2. Collecting City-Related Content on Twitter
Since Twitter provides diverse parameters that can be used to find tweets, it was possible to define two criteria that a tweet has to meet to be related to a city [
31].
- (1)
The city name is mentioned in the tweet as a hashtag or as a regular term.
- (2)
The tweet is tagged with a geo-location that is located within the city territory.
For this purpose, Twitter offers two different APIs (application programming interfaces): the REST API and the Streaming API. The former one results from multiple resources like users, timelines, friends and followers. To find tweets matching user queries, we use the Search resource—Search API—respectively. Tweets tagged by a specified geo-location, without taking the content into account, can be detected by using the Streaming API. For searching tweets, we use the city names of the 31 informational world cities in diverse spellings. In order to retrieve a corpus as exhaustive as possible, all cities are searched in the respective national language and in the nine most spoken languages using the Latin alphabet: Spanish, English, Portuguese, German, French, Italian, Polish, Romanian and Dutch [
32]. To keep the error rate as low as possible, the queries that contain non-Latin characters are split into two or more queries. For example the queries for Beijing are split as follows:
- (1)
Beijing OR #Beijing OR Běijīng OR #Běijīng OR Pechino OR #Pechino OR Pekin OR #Pekin OR Peking OR #Peking OR Pekín OR #Pekín OR Pequim OR #Pequim OR Pékin OR #Pékin
- (2)
北京 OR #北京
For those queries that do not contain any non-Latin characters, it is sufficient to just use only one single query.
The restriction to Latin alphabet-based languages has been chosen to read and translate languages more easily. Considering that in countries without Latin alphabet-based languages, many tweets are in English anyway—according to Semiocast [
33] about 40% of all tweets are written in English—the amount of tweets that are not collected even if they contain one of the cities names should be within acceptable limits. In addition, some popular abbreviations like #la for Los Angeles and #nyc for New York City are included in queries, if a well-known abbreviation exists. We decided to leave out terms that are strongly related to cities like “Times Square” (New York) or “Piccadilly” (London) to receive a first good in impression of how cities are represented in tweets and if the city names are a sufficient indicator for measuring the frequency of city-related tweets.
When using Twitter’s Streaming API to find tweets tagged within a specific area, a bounding box has to be specified. A bounding box is characterized by its southwestern and northeastern corners which in turn are defined as longitude, latitude pairs. As a consequence, a rectangle is being formed that defines the area to be monitored. The sizes of the rectangles are based on the official sizes of the city areas if an official declaration is provided. Otherwise, we used the Google Maps definition of the city area that can be achieved by using the Google Maps API v3 (The website displays bounding boxes using Google Maps API v3 like at:
http://www.mapdevelopers.com/geocode_bounding_box.php).
2.1. The Database and the Collecting Process
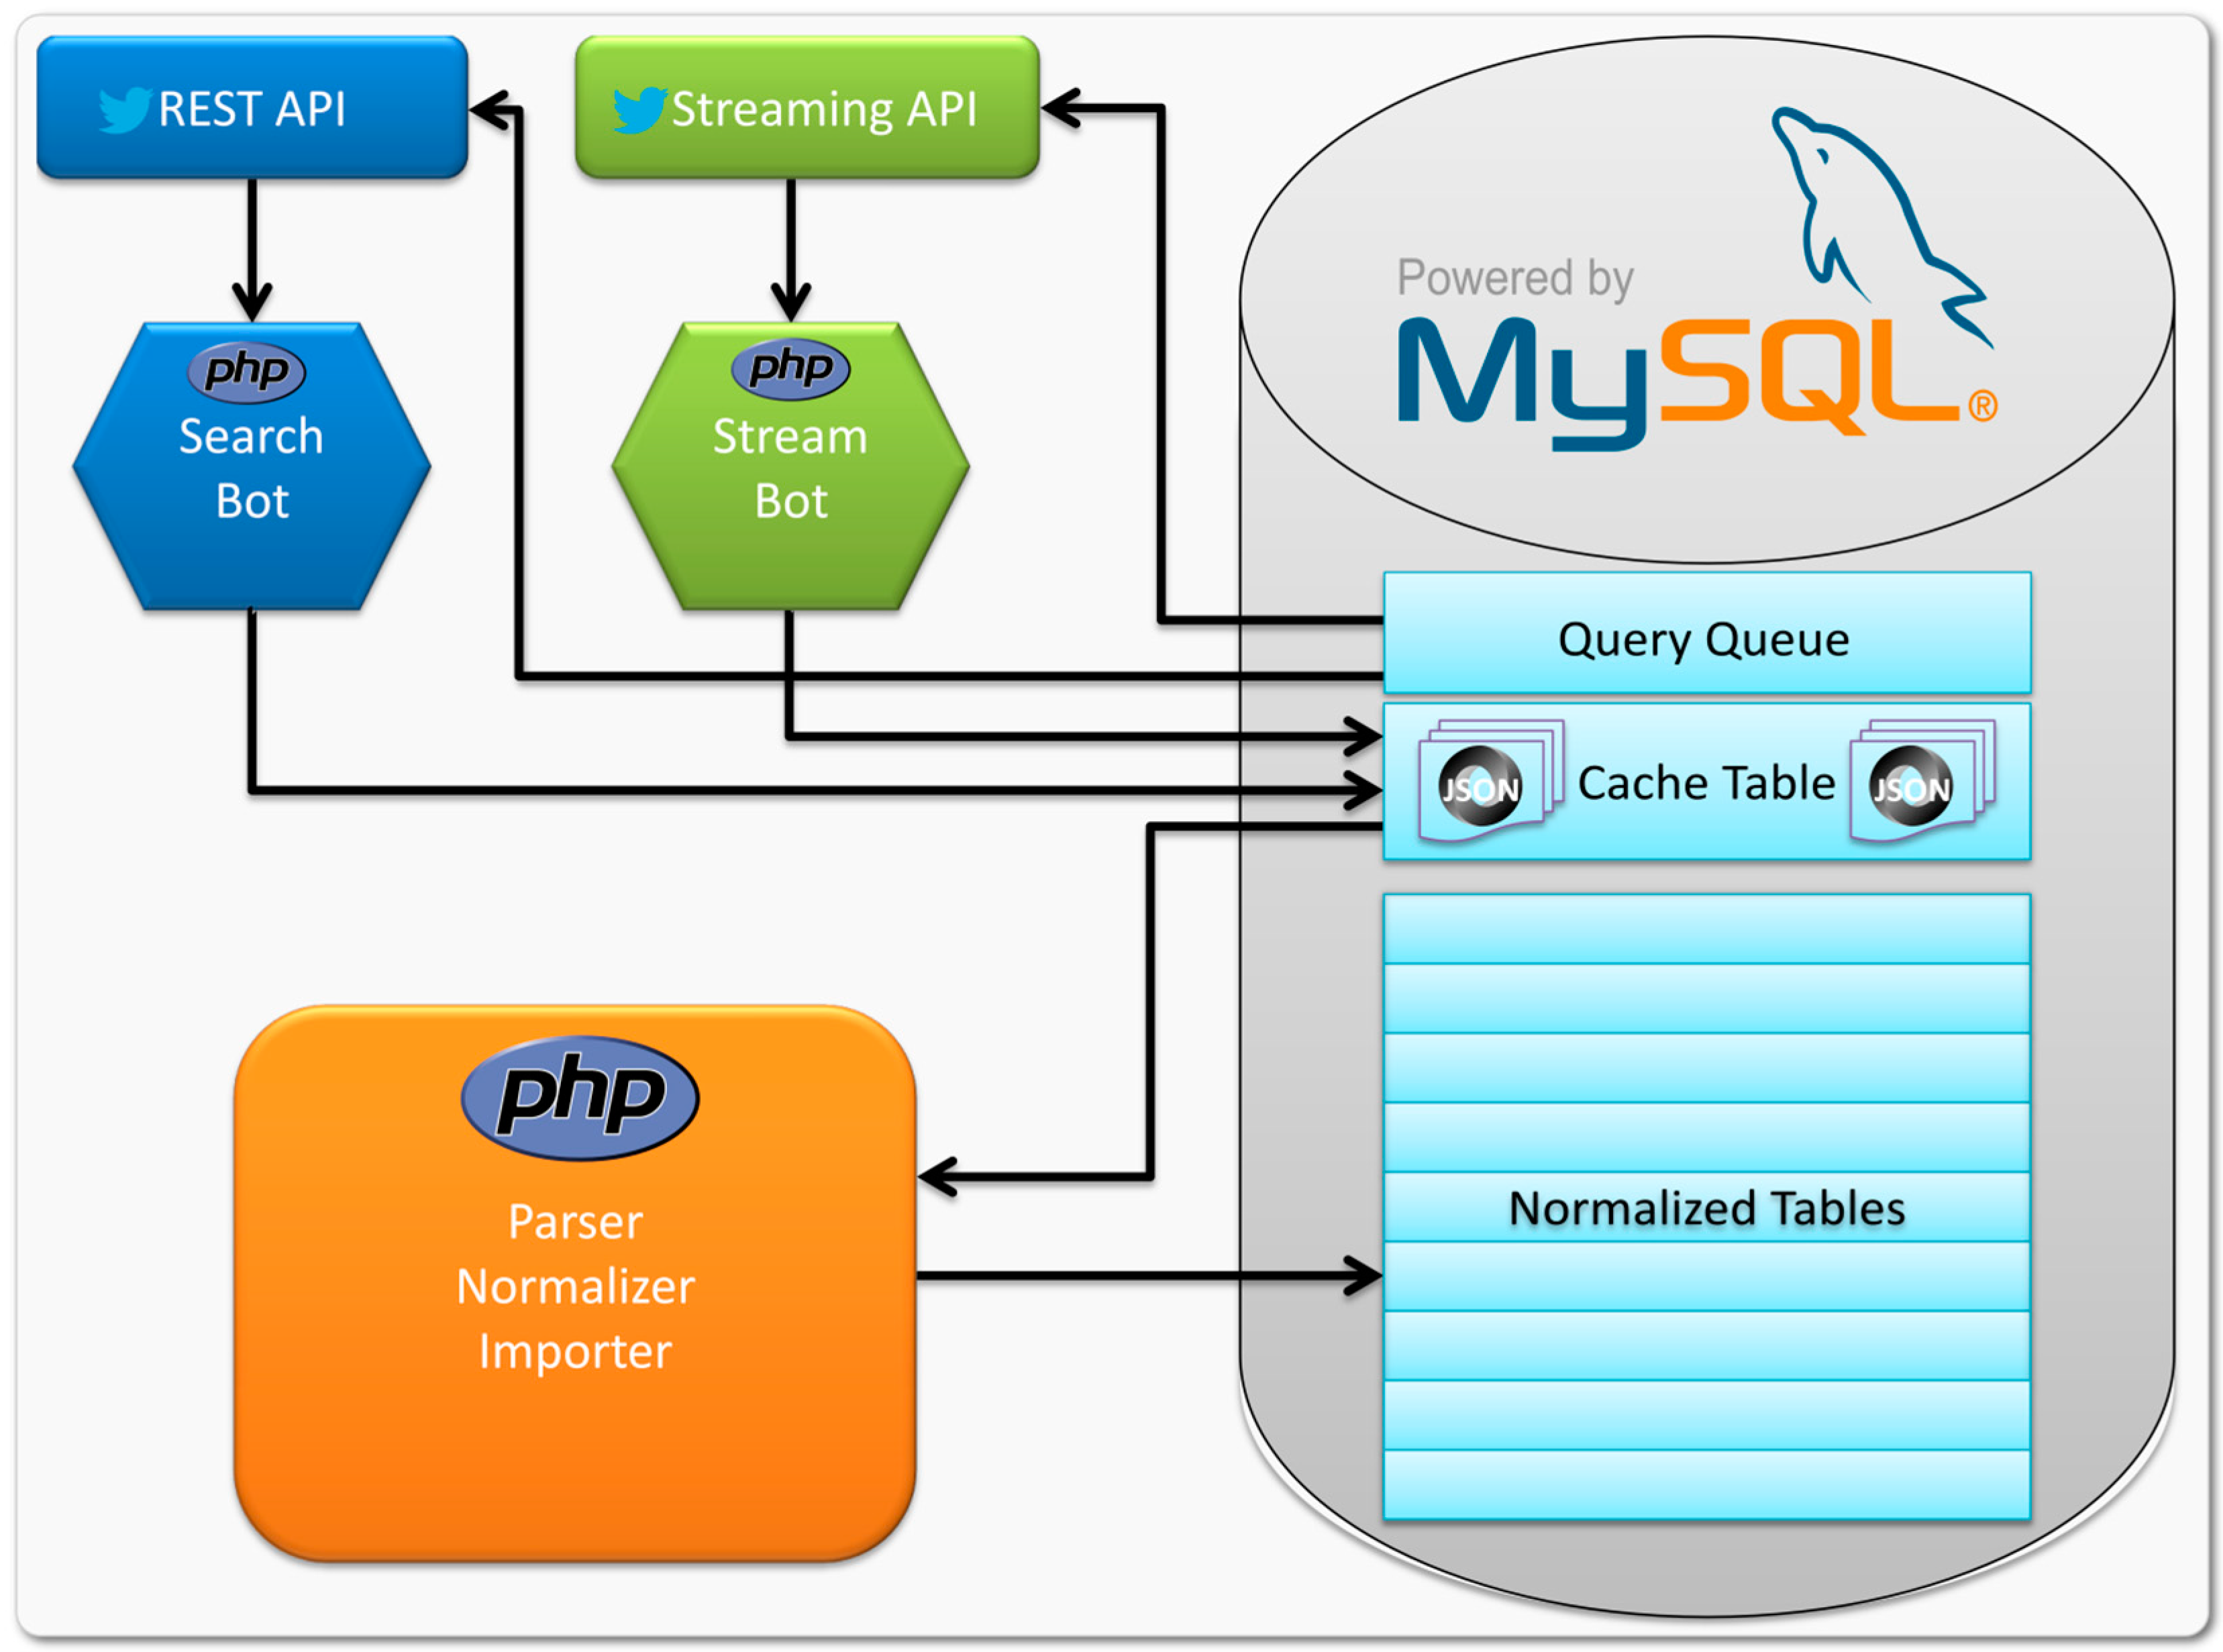
The tweets were collected between 2nd December 2013 and 16th December 2013. As a result, our dataset contains two weeks of Twitter data which seems to be a short time frame. Our purpose is to get indications of how to analyze these datasets to create the optimal method for determining characteristics of information flow and connectedness between informational world cities. In addition, since a tweet only “lives” for about one hour, two weeks can give a good impression about the flows happening on Twitter. In order to handle the different conditions of Twitter’s REST and Streaming API two different bots (automatic programs to gather data) have been created using the scripting language PHP (version 5.4.4): the Search Bot and the Stream Bot. Both bots are working with a queue of queries, which is stored in a MySQL (version 5.6) database. The difference between the Stream Bot and the Search Bot is that the Search Bot periodically fetches the next query from the database, sends the HTTP request to the REST API, and updates the query to be placed at the end of the query queue. The Stream Bot instead fetches the queries only once when it is initialized and keeps a persistent HTTP connection to the Streaming API open until the bot is stopped by the user. After either of the two bots retrieves new tweet data from one of the two APIs, the JSON (JavaScript Object Notation)-response is stored into the cache table. A permanently running process checks this table for newly inserted data and delegates it to the scripts that parse and normalize the data to the format defined by the database model and finally import the data into it. This approach can be considered as a modified version of the simple model used in the architecture for Twitter data collection described by Oussalah, Bhat, Challis and Schnier [
34], which only uses Twitter’s Streaming API to collect tweets. The full process is visualized in
Figure 1.
Figure 1.
The collecting process.
Figure 1.
The collecting process.
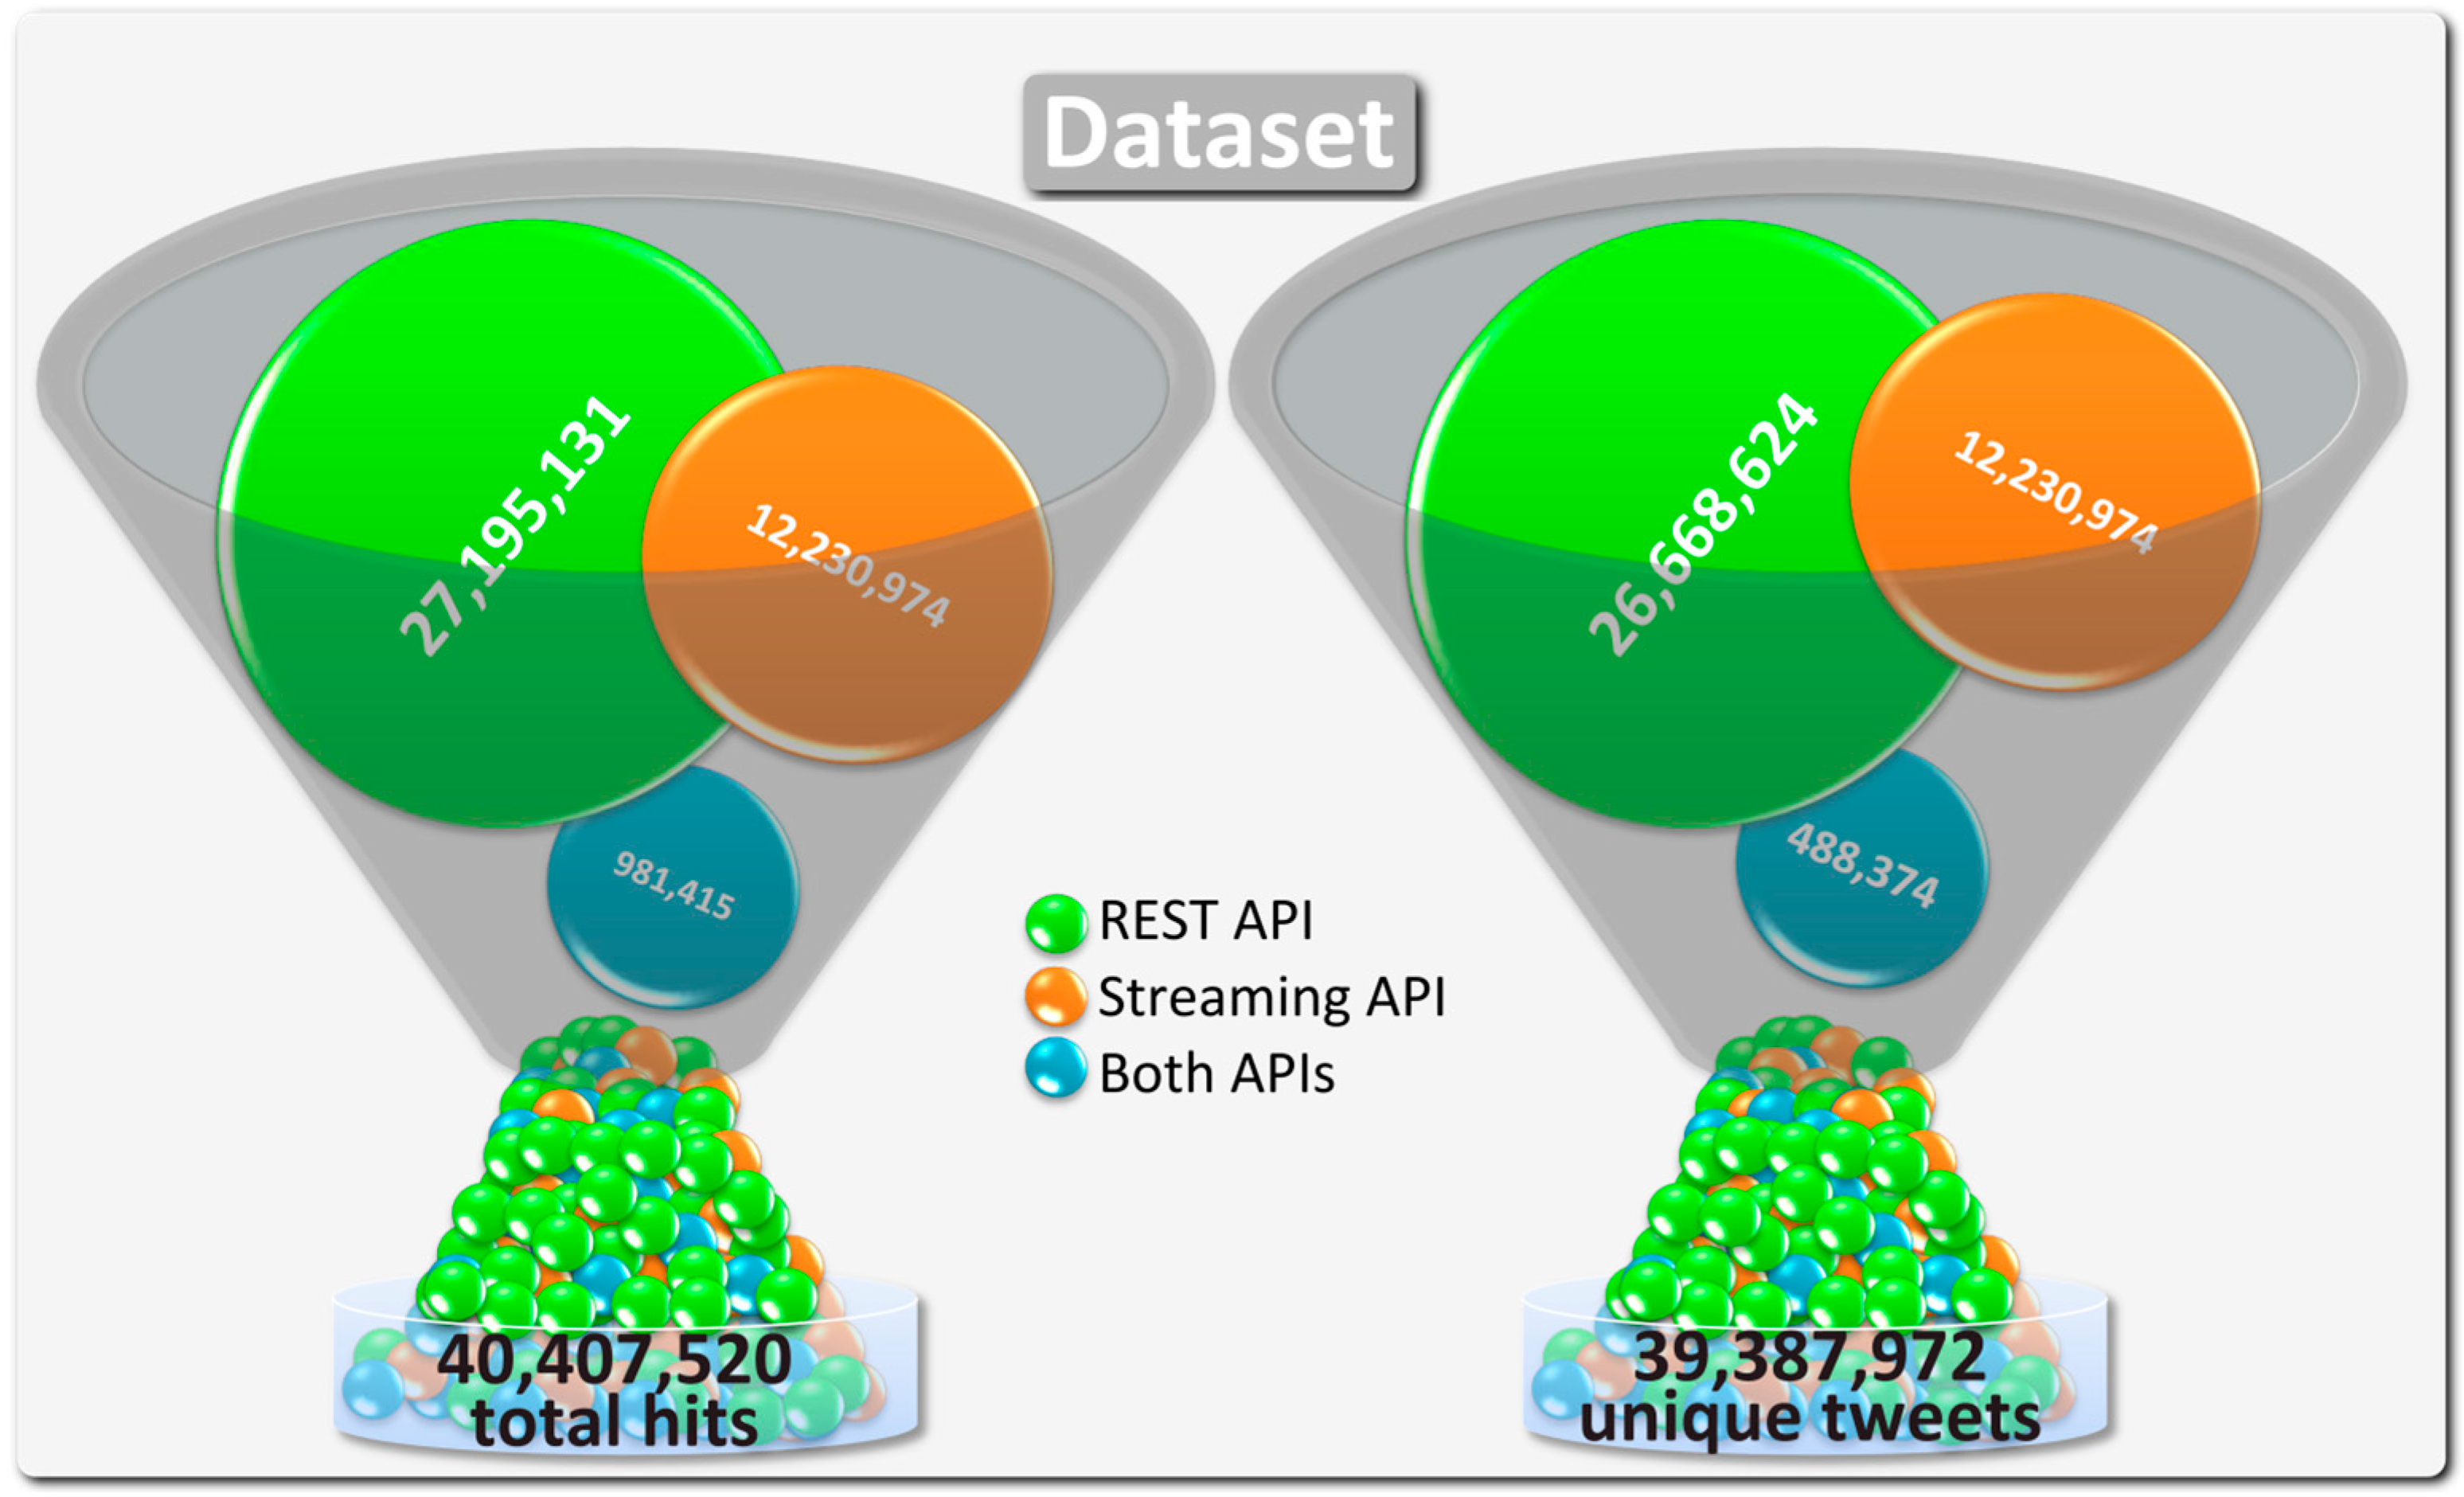
2.2. The Dataset
The database contains 40 million tweets that were found using the different queries for the two APIs mentioned before and therefore has duplicates. For example, when using Twitter’s REST API, a tweet is found
via the search term “New York” if it contains the string “New York City”. If this tweet with the unique id provided by Twitter does not exist in the database, a new record is stored and the query that matches will be connected with it. If the tweet is found again because it additionally contains #paris, only the connection between the query for Paris and the tweet will be stored in the database and the record, containing the tweet data, will not be stored twice. In addition, it is possible that the previous tweet has geo-information assigned and its coordinates are located within the rectangle of Berlin. Thus, this tweet is found a third time but this time
via the Streaming API and a new connection between tweet and query will be stored. Hence, there is a difference between counting how often a tweet was found using any of the APIs and counting the unique tweets stored in the database.
Figure 2 shows the number of tweets the corpus contains segmented into two categories with three subcategories each. The subcategory REST API represents all tweets that are only found using Twitter’s REST API. If our example tweet was found using the term “New York” and a second time using the term “Paris,” it would fall into this category. As a result, it increases the number of unique tweets found only
via the REST API by one and the number of all tweets containing duplicates by two because it has been found using the queries for New York City and Paris. However, since our example tweet has been found twice using the REST API and once using the Streaming API, we have only one unique tweet but three hits for the category of all tweets containing duplicates that have been found in both APIs. As
Figure 2 shows, there is a difference of 1,019,548 tweets between unique and duplicate tweets. The values of the unique and duplicate tweets found by the Streaming API are identical, because a tweet cannot be tagged with two different geo-locations. Comparing the two query methods used to create the corpus, it is obvious that more tweets were found using search terms than using geo-locations, which is due to users not specifying their locations. About 68% of all (not unique) tweets were found using the REST API, 31% using the Streaming API and 1% using both.
2.3. Topic Detection
The largest part of the analysis has been realized using MySQL’s features like full-text search or aggregate functions. In addition, automated PHP (server-side scripting language) scripts that have been written for our purpose did the work when it comes to MySQL’s limits. For content analyses, MySQL’s text analyzing methods are not sufficient. Thus, the tweet data additionally has been indexed into an Apache Lucene Index that was designed to handle Big Data and provides a full-text search engine with more suitable features. Each tweet has been indexed as one single document with the following data and metadata:
Tweet ID,
Text,
Date of creation,
Related cities (Geo or Query),
ID of the including conversation if existing,
Is Retweet,
Is Spam,
Favorite Count,
Retweet Count,
Language provided by Twitter.
Therefore, it is possible to query the corpus in all imaginable combinations of these attributes. It is now possible to formulate queries like “get all tweets that are related to Munich and have more than 1000 favorites” as an example.
For each city, we have now created two lists of the top 100 used hashtags in our corpus. We used the simple tweet count as the value for the weighting and totalized the numbers to get an ordered list of the most assigned topics to hashtags and therefore to the tweets in the dataset. The topics have been manually defined through content analysis and all hashtags added using a specified coding scheme. Again, we used two hashtag lists for determining the topics represented by hashtags. One list is for the geo-tagged tweets and the other for the tweets found through search terms. Unlike the term lists, the lists of hashtags each consist of the 25 most used hashtags. As an example, the hashtag #music and the hashtag #song are assigned to the topic “Photos, Movies and Music”. The firstly mentioned hashtag has been found in 500 tweets and the secondly mentioned hashtag in 350 tweets. As a result, we get a total tweet count of 850 tweets for the topic “Photos, Movies and Music”.
2.4. Spam Detection
We used a pared-down form of spam detection algorithm with some manual aspects to abolish most of the spam tweets. Firstly, we detected the top 100 users in the whole dataset classified by tweet count. Secondly, for all these users, a request to the users/show resource of Twitter’s REST API has been done. If the API response contains the information, that the account has been suspended by Twitter, all tweets from this account have been marked as spam. Thirdly, we manually checked all remaining accounts whether they produce tweets with relevant content. Accounts that only produce retweets for a certain hashtag or topic like the “Toronto Retweeter” (@toronto_rt) or the “Vancouver Retweeter” (@vancouver_rt) are classified as spammers because they do not produce relevant content for this analysis. Most of these accounts contain the info “I am a bot” in their account description. Finally, some of the previously identified spam accounts produce tweets that can be identified as spam by their content. For a user, it is obvious that the tweet is a spam tweet just by reading the tweet text. For an example tweet of this kind, see
Figure 3.
To identify other similar tweets and mark them as spam we queried the Lucene index (
http://lucene.apache.org/) for all spam tweets and all unique tokens the result set of the documents contains. All terms that are not potential spam words have been filtered out manually with a resulting list of 580 potential spam words. To find additional spam tweets, we queried the database for tweets that contain at least two of these spam words because a tweet that contains the term mature is not necessarily a spam tweet. A tweet that contains mature and porn is most likely to be a spam tweet. To keep the false positive rate as low as possible, we checked all found tweets manually and removed the ones that cannot be marked as spam. The selection of tweets took place by keeping the following questions in mind:
Does the tweet come from a real user?
Does the tweet not only contain hashtags?
Aren’t there any other tweets with the same content (i.e., created by retweet bots, etc.) in the dataset?
If one of the questions about a tweet can be answered with “no”, in most cases the tweet can be marked as a spam tweet. These spam tweets are filtered out in all investigations where they may distort the results.
Figure 3.
Example of a spam tweet.
Figure 3.
Example of a spam tweet.
3. Results and Discussion
Table 1 shows the number of tweets found for each city, either through a query of terms and Twitter’s REST API or through a provided geo-location and Twitter’s Streaming API ranked according to the total amount of Tweets. It is obvious that we have a clear leader: Tokyo. With almost 4.5 million tweets found through search terms, Tokyo absconds from the other cities with a notable gap from second place, which is held by New York City with about three million tweets. It is striking that from Paris to Barcelona another significant gap occurs and from that point on, the number of tweets shrinks constantly. To summarize, the four cities amount to 45% of tweets found using search terms for 31 cities. This phenomenon could be explained by the fact that these four cities show a high rate of urban tourism [
31]. New York City (over 10 million visitors), London (over 15 million visitors), and Paris (over 8 million visitors) belong to the cities in our set which had the most international visitors in 2011 [
35]. Tokyo had only about 2.7 million international visitors, but it has had always a strong domestic tourism (430 million domestic visitors in 2008).
Taking the numbers into account that represent the tweet counts per city and have been found through geo-locations, we can identify the two frontrunners Paris and São Paulo with an almost equal number of tweets (about 1.8 million). New York City and London follow as the next pair (both about 1.3 million tweets) after a gap of about 470 thousand tweets less than São Paulo and then the third pair of cities, Los Angeles and Kuala Lumpur, with about 1.4–1.7 million tweets, represent the last group that is prominent before the number of tweets shrinks constantly. As a relatively logical result, we can locate the three Chinese cities—Beijing, Shanghai and Shenzhen—which rank 29–31, if we take a look at tweets that have their origin in either of these cities. This is a result of the restricted availability of Twitter in China and the fact that there exists an extremely widespread Twitter-clone, called Weibo [
36].
In our previous quantitative analysis [
31], we already quoted some influencing factors that can explain the immense differences between the numbers we calculated from our dataset. For example, we observe a large number of tweets found through geo-locations for São Paulo and Kuala Lumpur, but a rather small amount of tweets that mention the name of the two cities. The German cities Berlin, Frankfurt and Munich show a contrary picture. For these cities, we found rather few geo-tagged tweets. We assume that the high level of awareness of data privacy protection in Germany [
37] can be a factor for the small amount of geo-tagged tweets. Thus, German users do not share their location the same way users in Brazil or Malaysia do. We also found out that the penetration rate of smartphones, which obviously influences the amount of geo-tagged tweets due to the built-in GPS modules, seems to have an impact on the number. Rowinski [
38] counts 70 million smartphone users in Brazil and only 32 million in Germany. France, however, also has only 33 million smartphone users, which leads to the assumption that this factor cannot be generalized.
Table 1.
Tweets per city ranked by the total amount of collected tweets between 2nd December 2013 and 16th December 2013.
Table 1.
Tweets per city ranked by the total amount of collected tweets between 2nd December 2013 and 16th December 2013.
| No. | City | Query | Location |
|---|
| 1 | Tokyo | 4,465,123 | 865,492 |
| 2 | New York City | 3,055,425 | 1,323,259 |
| 3 | London | 2,724,022 | 1,316,485 |
| 4 | Paris | 1,971,704 | 1,814,664 |
| 5 | Barcelona | 1,451,510 | 114,892 |
| 6 | Milan | 1,378,095 | 92,402 |
| 7 | Chicago | 1,371,202 | 632,030 |
| 8 | Dubai | 1,210,888 | 186,166 |
| 9 | Boston | 964,364 | 253,953 |
| 10 | Los Angeles | 857,534 | 1,178,099 |
| 11 | Sydney | 808,115 | 126,103 |
| 12 | Singapore | 761,102 | 315,672 |
| 13 | Toronto | 724,243 | 237,821 |
| 14 | São Paulo | 522,466 | 1,793,413 |
| 15 | Melbourne | 482,487 | 59,677 |
| 16 | Amsterdam | 479,377 | 69,303 |
| 17 | Munich | 467,448 | 20,288 |
| 18 | Hong Kong | 400,388 | 61,769 |
| 19 | San Francisco | 399,487 | 520,670 |
| 20 | Berlin | 390,895 | 55,305 |
| 21 | Seoul | 366,721 | 233,164 |
| 22 | Beijing | 286,691 | 11,503 |
| 23 | Vancouver | 278,951 | 40,380 |
| 24 | Montréal | 246,757 | 89,092 |
| 25 | Shanghai | 225,418 | 11,127 |
| 26 | Vienna | 217,948 | 25,945 |
| 27 | Kuala Lumpur | 152,464 | 1,140,118 |
| 28 | Stockholm | 92,843 | 90,359 |
| 29 | Frankfurt am Main | 80,964 | 12,996 |
| 30 | Helsinki | 32,579 | 19,301 |
| 31 | Shenzhen | 14,768 | 1155 |
3.1. Twitter as a Sharing Service for Other Social Media Services
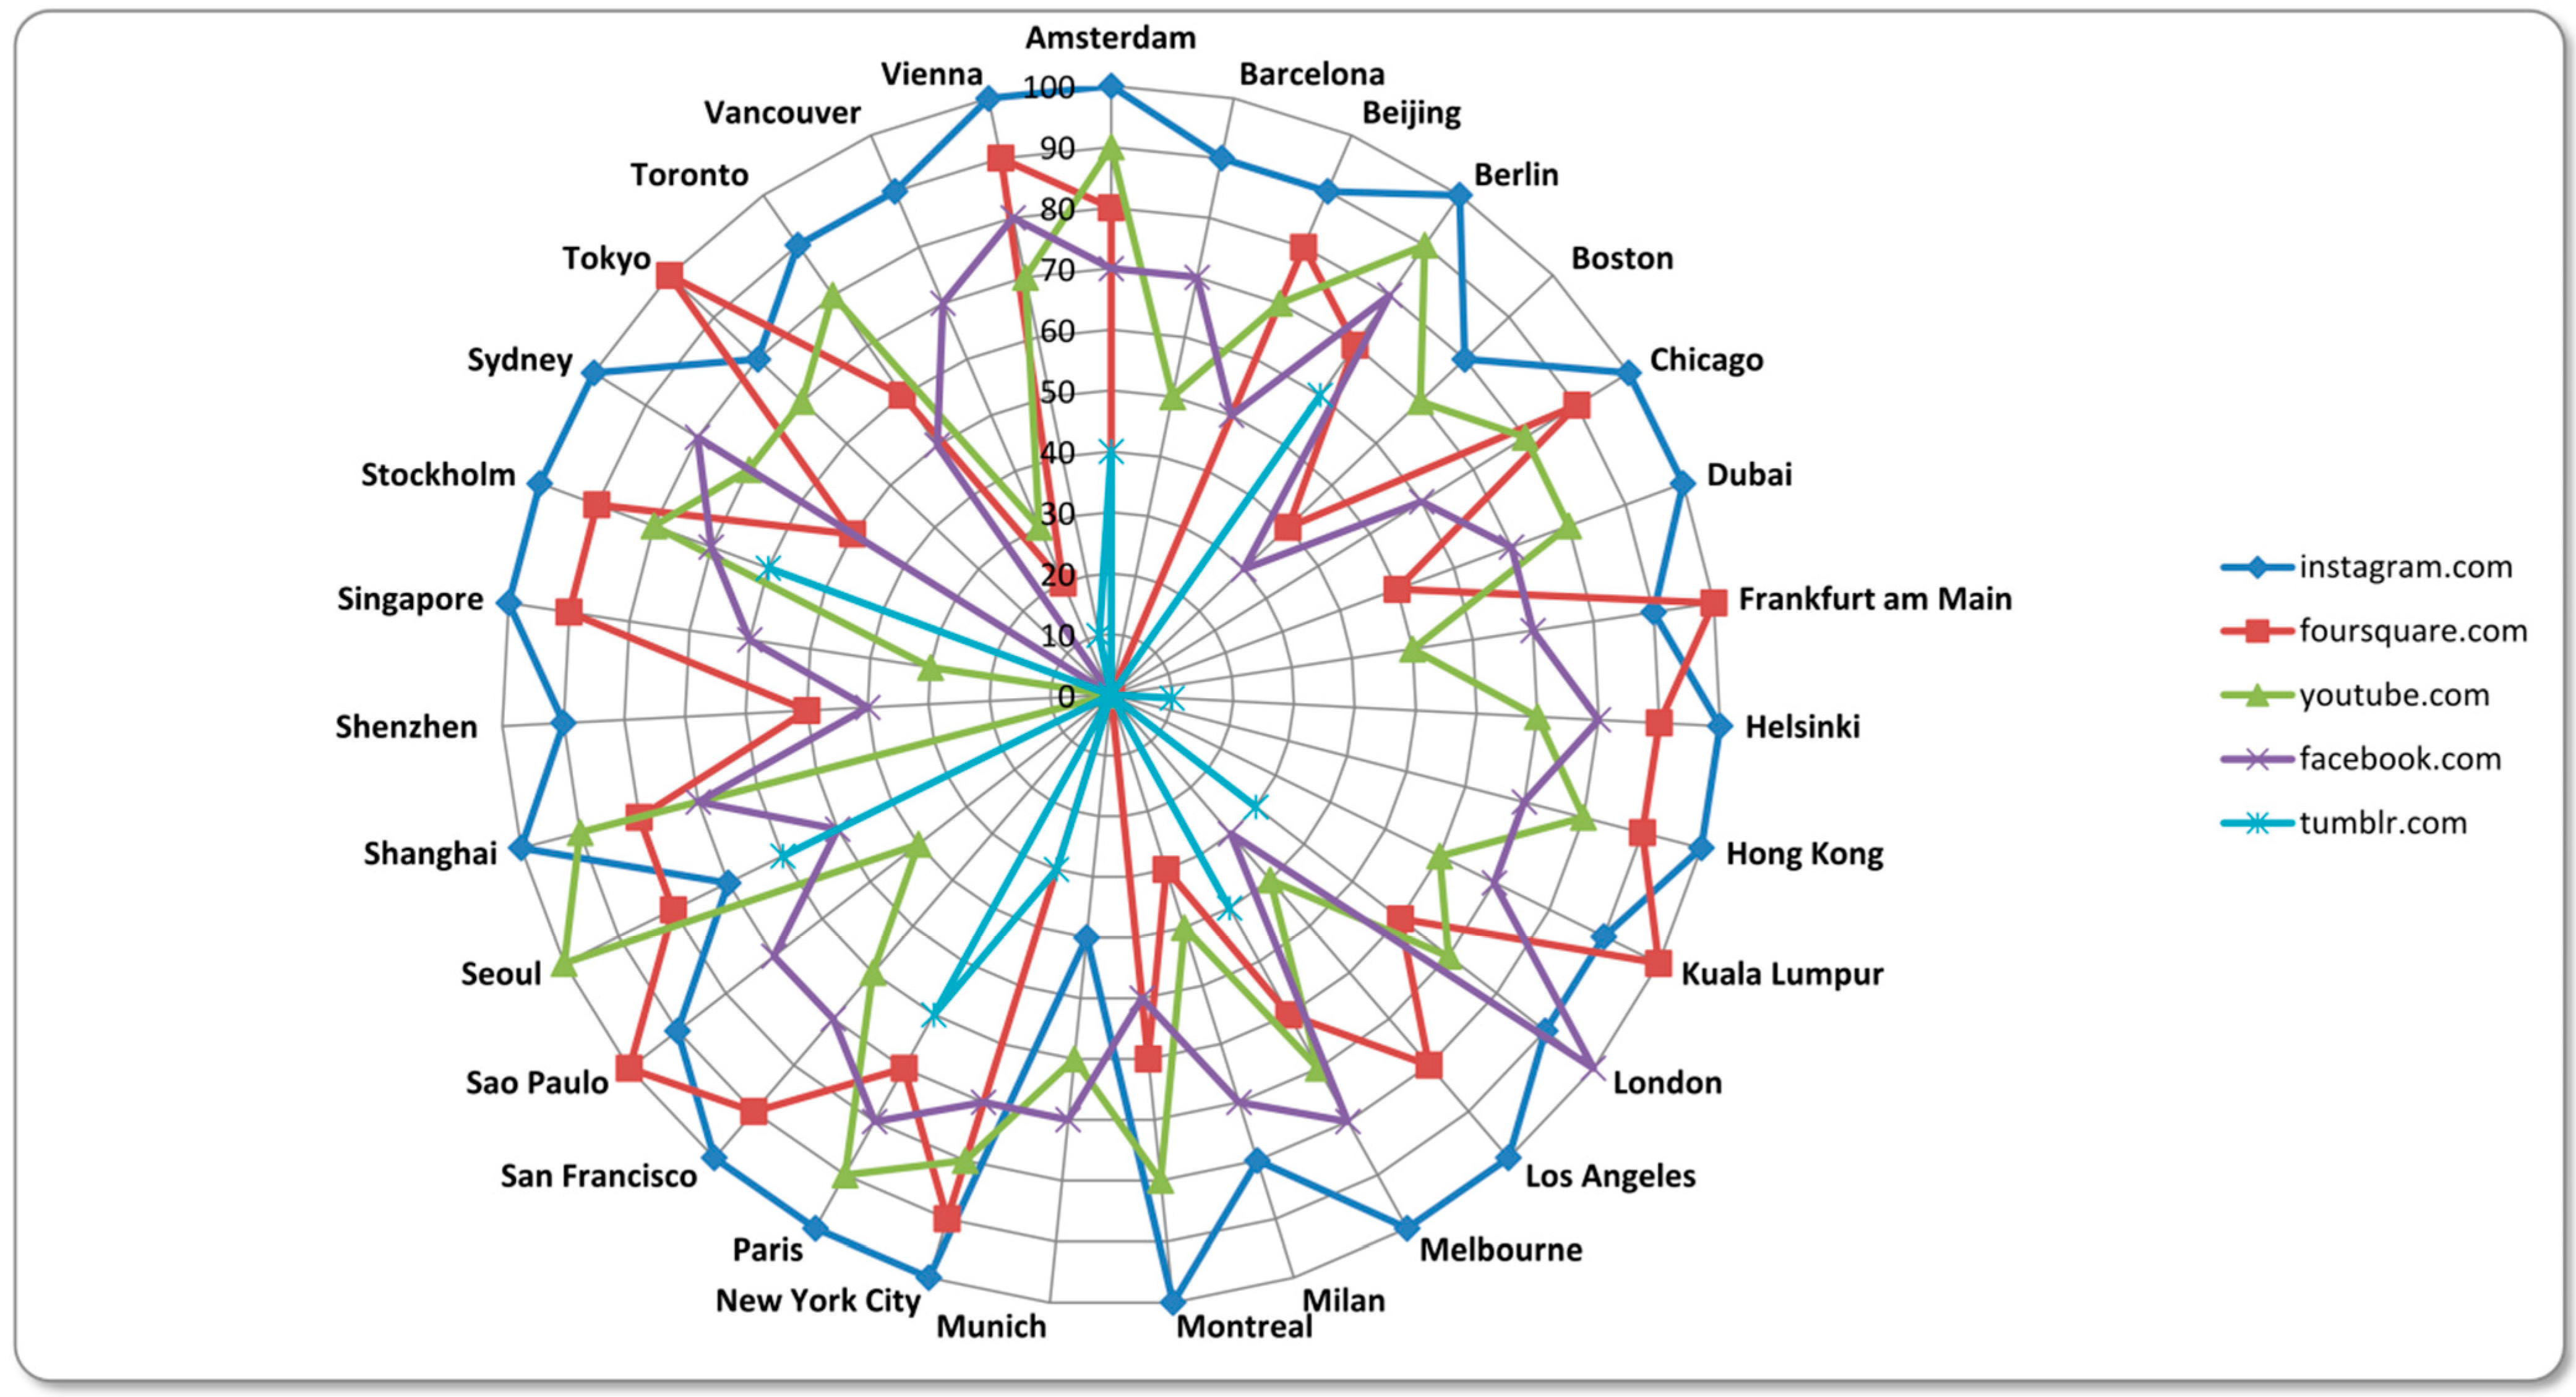
The extraction of the top links shared in tweets related to informational world cities have bring into light that other social media services lead the ranking in almost every city.
Figure 4 shows the five most common services that are shared. The values are inverted. Rank one gain 100 points, rank two 90 points, rank three 80 points and so on. If a website does not make it to the top 10 of the most shared links in tweets related to a specific city, it ends up with zero points.
The biggest winner of this calculation is Instagram. Almost all rankings of the most shared websites result in a score of 70–100 points for Instagram. Merely Munich is an exception here. Instagram comes to a score of 40 points in tweets related to Munich only. A similar phenomenon can be observed when looking at the values for the second ranked website Foursquare that does not even make it to the top 10 of Munich-related. However, Munich has this in common with Barcelona. People in these cities obviously are not very interested in sharing their current location via Foursquare or they just did not connect their Foursquare account to their Twitter account. Users from Tokyo, Frankfurt, Kuala Lumpur and São Paulo seem to use this feature much more frequently, though, as Foursquare is the top scorer for these cities. YouTube and Facebook show almost a similar importance when looking at tweets linking to other websites. YouTube comes to a total score of 2040 and Facebook to a score of 1980. Facebook scores a hundred points in London and YouTube in Seoul scores hundred points, as well. In all the other cities, the two services can be located in the midfield. With a score of 400, Tumblr also belongs to the top five of social media services shared via Twitter. All other services, like Pinterest, Flickr or LinkedIn, are just of marginal interest in this investigation and therefore not included in our visualization. The Chinese microblogging service Weibo, for example, only matters in the Chinese cities but does not make it to the top ten in any of the cities, though.
3.2. The Main Topics in Tweets
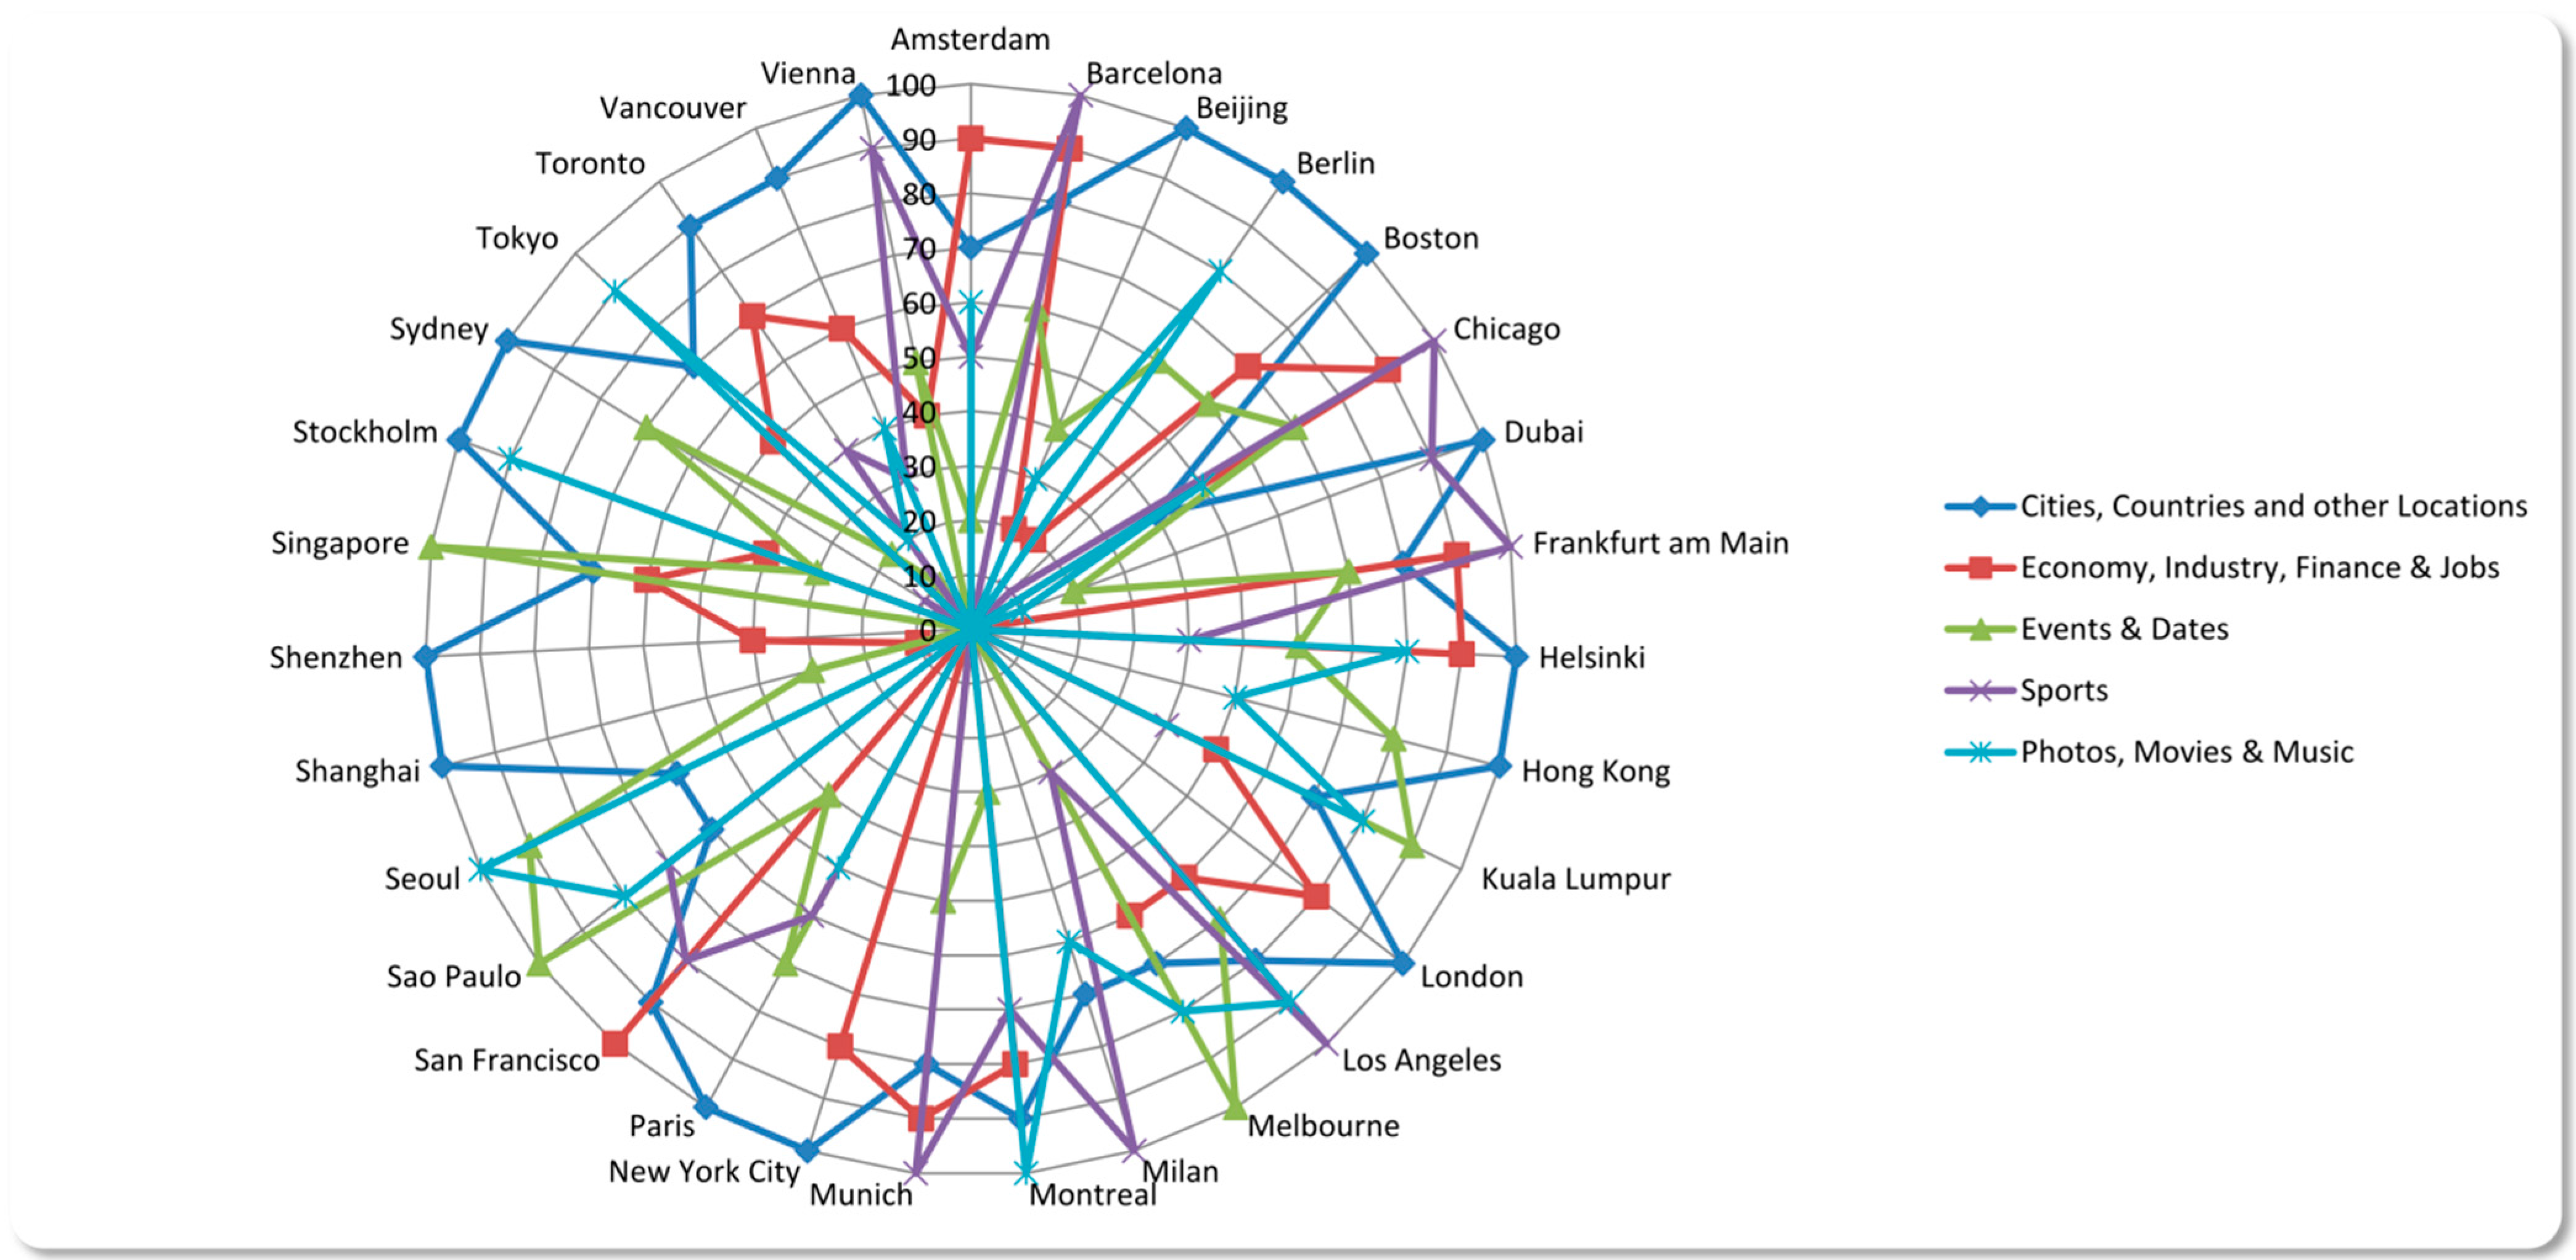
As we are not only interested in quantitative results, we also want to follow a more qualitative approach by determining the main topics in tweets. Which content is predominant in information flows between cities in the Twittersphere? The analyzed data shows that mentioning other cities or geographical locations is very popular in tweets that are related to informational world cities. Since we previously identified Foursquare as one of the most shared websites in our dataset, and sharing locations is the business model of this service, this is not surprising.
Twitter is also frequently used for job offers, either by job agencies or the companies themselves. As a result, the topic category “Economy, Industry, Finance & Jobs” is even more present then “Events & Dates” which we also expected to be one of the top topics due to the event-driven nature a microblogging service like Twitter is. Because of cities like Barcelona or Munich with their famous soccer teams, but also cities like Chicago or Los Angeles with their famous American Football, Basketball or Baseball teams, “Sports” can also be found among the most popular topics. This also impacts the number of conversations between users from different informational world cities, which we will show in the next chapter.
Figure 4.
The top five shared services on Twitter.
Figure 4.
The top five shared services on Twitter.
Figure 5.
The most important topics in tweets I.
Figure 5.
The most important topics in tweets I.
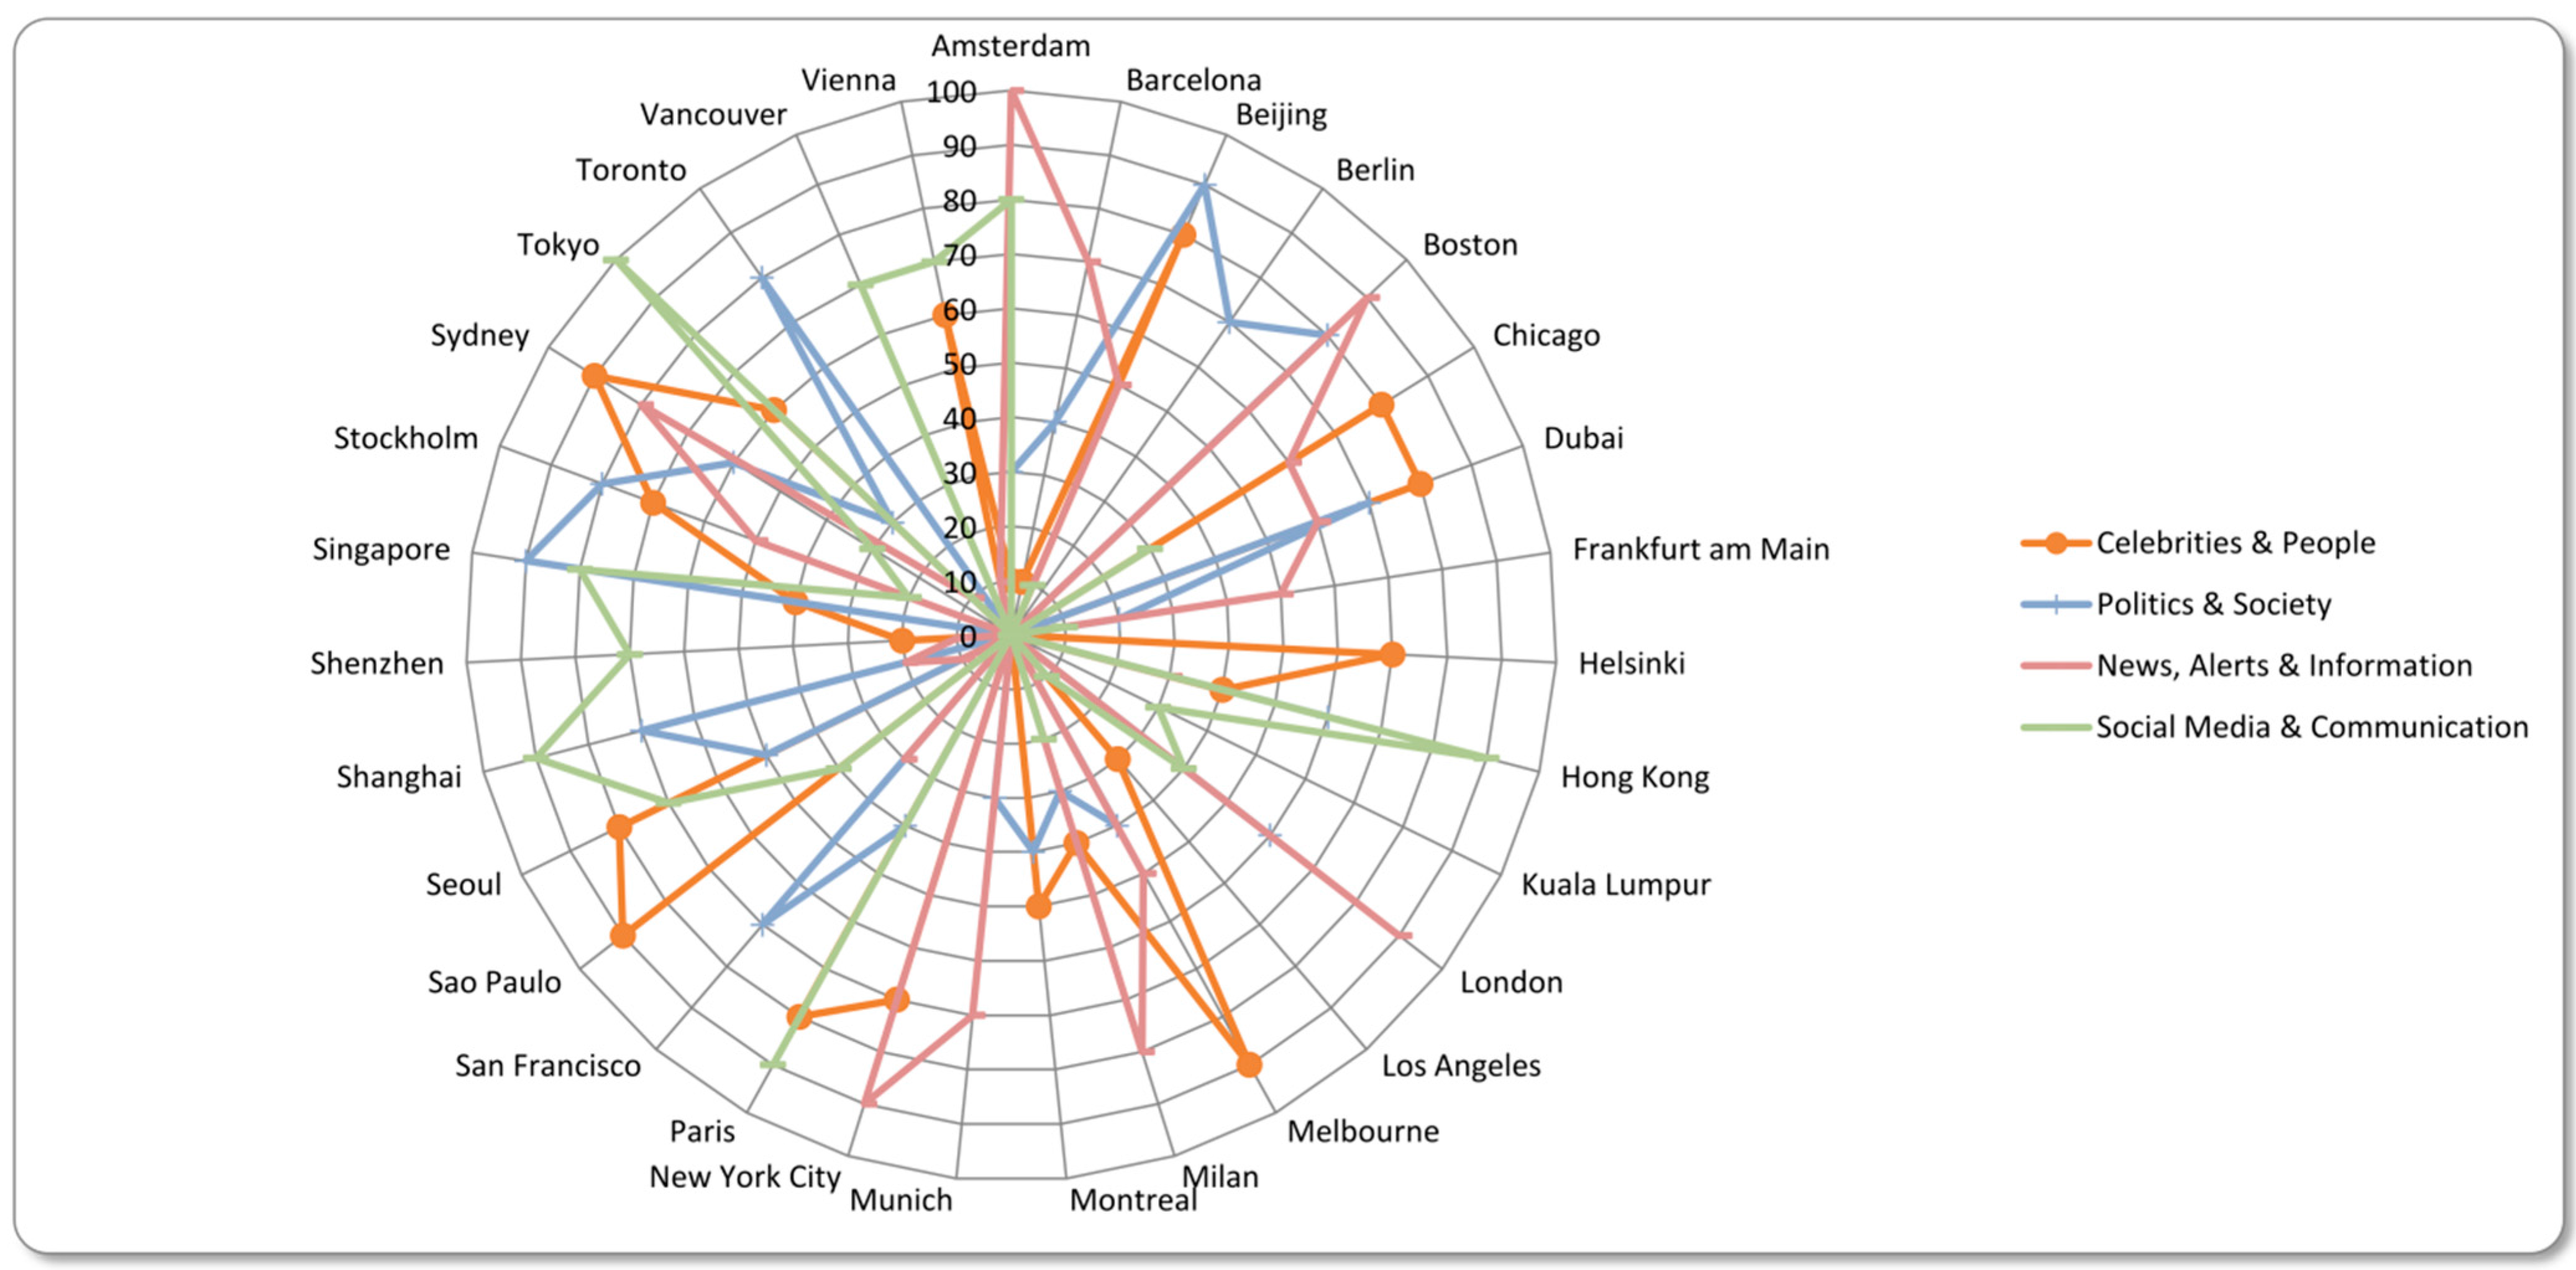
Due to the possibility to share multimedia content or links to multimedia content, there is also a remarkably huge number of tweets in our dataset that we could assign to the category “Photos, Movies and Music”. In addition, many radio stations of the cities have their own account and share tweets about their currently playing music (#nowplaying).
Figure 6.
The most important topics in tweets II.
Figure 6.
The most important topics in tweets II.
In addition to the already mentioned topics, Twitter is also used to talk about celebrities, share news from online news services like the websites of newspapers or to talk about politics. During our collecting period, a political affair in Toronto regarding Mayor Rob Ford occurred. A video has been revealed that shows him smoking crack [
39]. As a result, “Politics and Society” was one of the most important topic categories during that time.
The last category to mention we call “Social Media and Communcation”. It refers to all tweets that contain content that is commonly used within Twitter to communicate or participate in certain events. An example would be the hashtag #ff or #followfriday or also the hashtag #tbt (“Throwback Thursday”). The nine most important topics are shown in
Figure 5 and
Figure 6 ranked by our inverted calculation on a scale from 0 to 100.
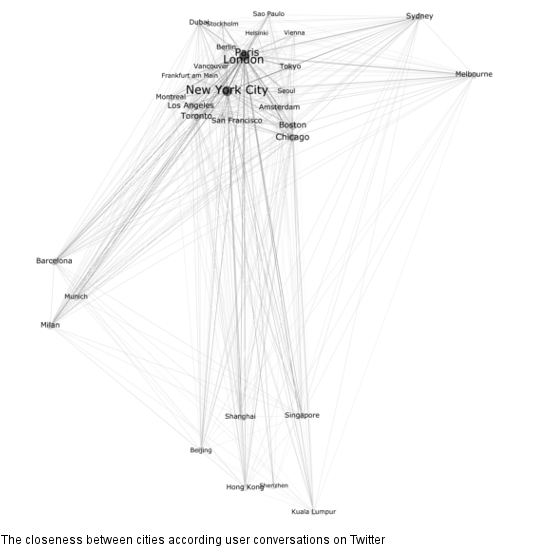
3.3. The Closeness between Informational World Cities
An interesting aspect of informational world city research is the determination of the closeness of the cities to each other. The closeness can be analyzed through connections in a network of hubs. The data provided by Twitter has the potential of extracting conversations by a conversation id within the metadata. Thus, we extracted all conversations in our dataset and analyzed the cities that either are mentioned or tagged with geo codes. The cities form the nodes in this network. As a result, we built a clustered graph containing all cities connected through the number of conversations. For example, 1438 conversations can be assigned to Chicago and New York at the same time so this number shows us the degree of “connectedness” between the two cities. By using the OpenOrd algorithm in Gephi, an open tool for the visualization of network graphs (gephi.github.io), we now can calculate a graph that clusters all our cities based on the number of conversations they have with each other (
Figure 7). The type size indicates the importance of a node that represents a city. The more conversations a city can be assigned to in total, the more important the node in the graph gets. Hence, the investigated network is just a snapshot which represents a given timespan. The relations we see here, may be influenced through special events, e.g., the formula one takes place in a city, which gains worldwide attention and also would affect conversations on Twitter and accordingly result in a bigger node of this city.
Figure 7.
The closeness between cities according user conversations.
Figure 7.
The closeness between cities according user conversations.
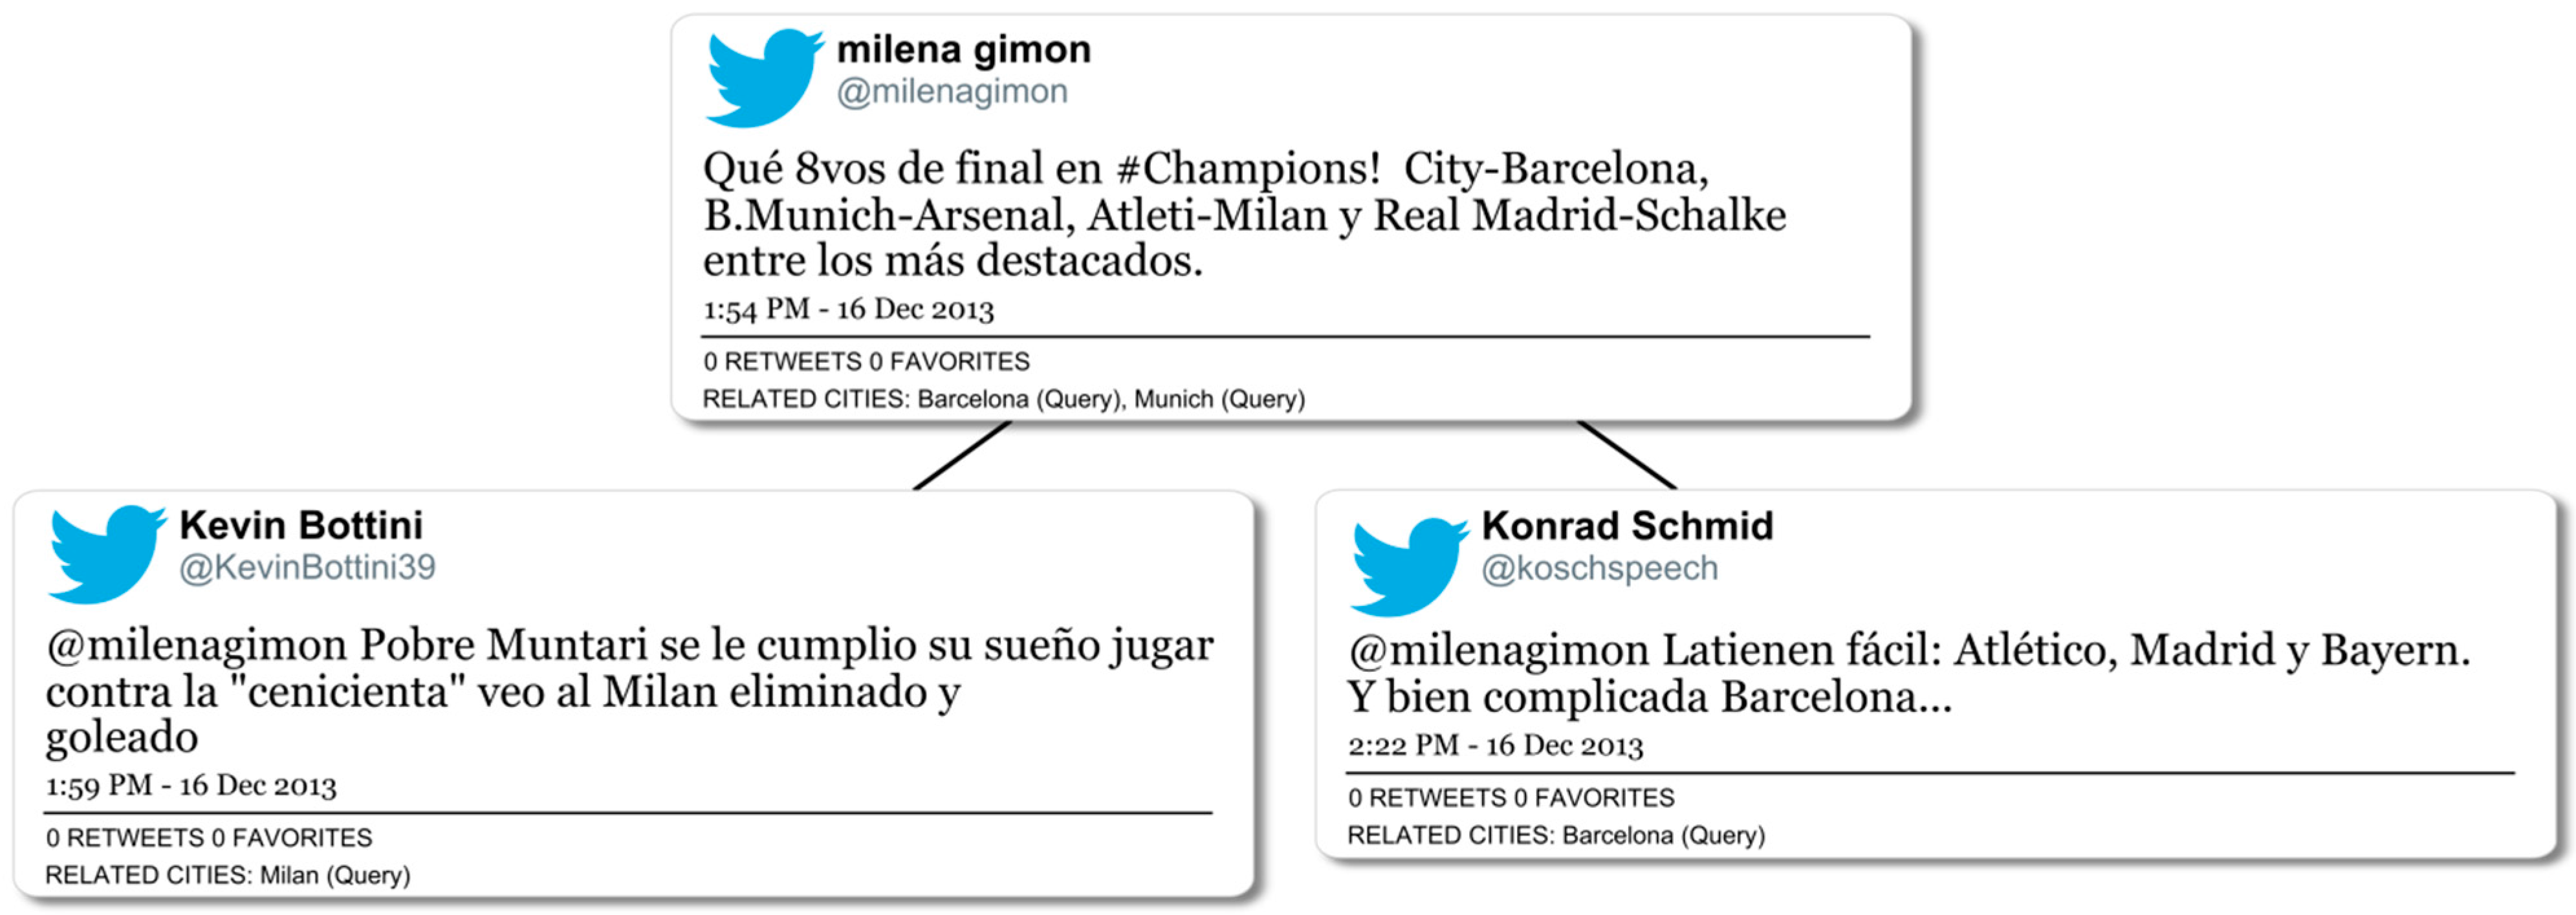
The most obvious phenomenon in the graph is the distribution of four clusters of different sizes. We find an Australian cluster consisting of Melbourne and Sydney and a South East Asian cluster consisting of Beijing, Shanghai, Singapore, Hong Kong, Shenzhen and Kuala Lumpur. Besides these two clusters that mainly include cities that in the real world are geographically close as well, two other clusters popped up that do not fulfill this characteristic. The cluster that contains Barcelona, Munich, and Milan, we call the “soccer cluster”. As the top topics in tweets related to each of these cities in our dataset are clearly dominated by sports or more precisely soccer, it therefore can be assumed that the content of the tweets has also an influence of where the users come from that communicate through direct conversations
via Twitter or which cities they talk about. By analyzing the conversations assigned to the three cities we found out that most of them are dealing with the top soccer teams which are originated in these cities: FC Barcelona, AC Milan and FC Bayern Munich. One could think, that this occurs because the sport club names include the city name but other clusters are not dominant, e.g., the University of Amsterdam does not build a cluster with other universities. As a result, common interests of people who live in informational world cities seem to lead to more inter-city communication.
Figure 8 shows an example conversation related to all three cities.
The last cluster shown in the graph is also the biggest. It contains all Northern and Southern American cities that are part of our investigation and except for Barcelona, Milan and Munich all European cities as well. With Tokyo, we can also find the only city from South East Asia that is close to the other cities in this cluster but not close to the other cities from its own region. As a result, Tokyo seems to be more strongly connected to other informational world cities than other cities from South East Asia.
The biggest cluster also contains the biggest nodes represented by Paris, London and New York. As shown in the figure, the nodes of Paris and London almost lie on top of each other. This phenomenon results from the fact that, with a value of 1833, these cities showed the highest number of common conversations in our dataset. New York City, however, shows the highest amount of conversations, with other cities in total coming to a number of 9230 conversations that are connected to at least one of the other thirty cities as well. By way of comparison, London comes to a number of 8300 conversations and Paris comes to 6335 conversations. Without any surprise, Shenzhen represents the smallest node in the graph (79 conversations in total).
Figure 8.
Example conversation related to Milan, Barcelona and Munich.
Figure 8.
Example conversation related to Milan, Barcelona and Munich.
4. Informational World Cities in the Twittersphere
Our results strongly contribute to current informational world city research. If we want to know how “informational” a city is, we have to analyze social media behavior of users that produce city-related content. We have seen some hints of how connected some of the cities are to each other by analyzing conversations. There is a connection based on content (e.g., soccer) and a connection based on the geographical location. This gives us a hint that cities which are “close” to each other on Twitter are also close to each other due to other factors. As a result, we could assume that social media services can be a mirror of the society they are used in. Neighbors talk with and about neighbors and soccer fans talk with other soccer fans, no matter of where they are located.
The most important topics in city-related tweets can give us a hint of the quality of the content produced at social media platforms in and about informational world cities. Long-term investigations can show if Twitter is mainly used to (automatically) share locations or if it is also used to discuss topics of higher quality. Similar to the topics, we can also use links to make assumptions about content-quality. The domination of other social media services in the top list of shared websites suggests that there’s also a huge amount of content that is only a reference to other content and services.
Our analysis underlays a few limitations. The first limitation to mention is the Twitter APIs and their technical restrictions. For our investigation, we had to rely on the data Twitter provides users with no access to the Twitter Firehose. Studies showed that users can receive from 1% up to 40% of public tweets from the Streaming API [
40]. Furthermore, server or database failures may lead to temporary short-term data loss, although we did not track any of these issues during our collecting period.
Due to the strong multilingualism in our dataset represented by 59 languages, we received from Twitter’s language recognition algorithm, including uncommon languages like Cherokee, we were confronted with several challenges. There exist some writing systems (e.g., Chinese) which do not necessarily separate words with whitespaces and thereby have to be analyzed using dictionaries which we did not have access to. Since we were not able to translate all languages in the corpus, we had to rely on automatic translation tools (i.e., Google Translate, Bing Translator) or several online dictionaries (i.e., dict.cc, leo.org, Wiktionary) to identify topics in tweets. Thus, topic-detection in this investigation is best-effort and may underlie a few inaccuracies like most of the automatic or semi-automatic investigations on corpora which are based on natural language.
Our results show that there are still problems concerning homonymy, although we did filter the severest problems (i.e., “Paris Hilton”) out. It is difficult to filter tweets that mention a city that is named similar to a city we are looking for and, additionally, are not geo-tagged. If a tweet contains, for example, the text “I’m in Sydney”, how do we know whether the user means the Australian city or Sydney, MT, USA? It seems that we have to accept a certain percentage of false positives in the dataset while searching tweets via Twitter’s REST API. At least, the search for geo-locations provides only tweets from the city we are looking for. However, other homonymy problems can be solved manually. For example, tweets that are found due to a user mention contains the city’s name can easily be filtered by manually checking all tweets, though it will take some time in a dataset as big as the one we used for our investigation.
5. Conclusions and Future Work
Our analysis is a great step forward in the research of informational world cities presented in social media. We have been given many indications of how an Informational World City can be classified regarding Twitter activities. Indeed, research on this field does not end here. As we have seen, several limitations underlay this investigation that, if possible, must be overcome in future investigations. For this, it is necessary to create and collect heuristics that eliminate most of the problems with homonymy. In addition, a fully developed spam filter algorithm has to be created or used to avoid the vast majority of spam tweets. The results of the given article can only be confirmed by following investigation with new datasets. For that purpose, another period of time can be used to collect tweets. It can be interesting to analyze a dataset that contains tweets produced in a whole month or even a year and make the data comparable to our two-week-dataset.
Apart from the further research on the aspects, we investigated in the given paper, other aspects are also in our interest. A sentiment analysis of the tweets and the topics of the tweets can provide further conclusions about user behavior in informational world cities. In addition, Twitter provides other key figures like follower counts, retweets or favorite counts and others. These key figures can also be used to classify the quality of the content produced that can be related to either one of the cities.
Altogether we showed, using Twitter as an example, that social media research cannot be neglected when investigating the prototypical cities of the knowledge society, since social media has been established as an important part of it.


