Article

Early Flood Detection for Rapid Humanitarian Response: Harnessing Near Real-Time Satellite and Twitter Signals

by
Brenden Jongman
1,*,
Jurjen Wagemaker
2,
Beatriz Revilla Romero
3,4 and
Erin Coughlan De Perez
1,5,6
1
Institute for Environmental Studies, VU University Amsterdam, De Boelelaan 1085, Amsterdam 1084HC, The Netherlands
2
Floodtags, The Hague 2516 BE, The Netherlands
3
European Commission Joint Research Centre, Ispra 21027, Italy
4
Faculty of Geosciences, Utrecht University, Utrecht 3512 JE, The Netherlands
5
Red Cross/Red Crescent Climate Centre, The Hague 2521 CV, The Netherlands
6
International Research Institute for Climate and Society, Palisades, NY 10964, USA
*
Author to whom correspondence should be addressed.
ISPRS Int. J. Geo-Inf. 2015, 4(4), 2246-2266; https://0-doi-org.brum.beds.ac.uk/10.3390/ijgi4042246
Submission received: 29 June 2015 / Revised: 30 September 2015 / Accepted: 10 October 2015 / Published: 23 October 2015
(This article belongs to the Special Issue Geoinformation for Disaster Risk Management)

Abstract

:
Humanitarian organizations have a crucial role in response and relief efforts after floods. The effectiveness of disaster response is contingent on accurate and timely information regarding the location, timing and impacts of the event. Here we show how two near-real-time data sources, satellite observations of water coverage and flood-related social media activity from Twitter, can be used to support rapid disaster response, using case-studies in the Philippines and Pakistan. For these countries we analyze information from disaster response organizations, the Global Flood Detection System (GFDS) satellite flood signal, and flood-related Twitter activity analysis. The results demonstrate that these sources of near-real-time information can be used to gain a quicker understanding of the location, the timing, as well as the causes and impacts of floods. In terms of location, we produce daily impact maps based on both satellite information and social media, which can dynamically and rapidly outline the affected area during a disaster. In terms of timing, the results show that GFDS and/or Twitter signals flagging ongoing or upcoming flooding are regularly available one to several days before the event was reported to humanitarian organizations. In terms of event understanding, we show that both GFDS and social media can be used to detect and understand unexpected or controversial flood events, for example due to the sudden opening of hydropower dams or the breaching of flood protection. The performance of the GFDS and Twitter data for early detection and location mapping is mixed, depending on specific hydrological circumstances (GFDS) and social media penetration (Twitter). Further research is needed to improve the interpretation of the GFDS signal in different situations, and to improve the pre-processing of social media data for operational use.

1. Introduction

Flooding of river systems caused over US$1 trillion in damages and 220,000 fatalities, globally, since 1980 [1]. Many low-income countries are especially vulnerable to floods, given the generally low standards of flood protection and the limited capacity of disaster response, social protection, and healthcare facilities [2,3]. National and international humanitarian organizations, therefore, have an important role in supporting both ex ante disaster risk reduction and ex post disaster response of these countries. The need for disaster response was exemplified recently during the recent 2015 Malawi floods, when the Red Cross/Red Crescent Movement alone launched an emergency appeal of over CHF 2 million within days of the event to assist over 40,000 affected people [4]. Humanitarian aid is offered daily on a smaller scale for the hundreds of flood events that happen around the world each year [5].
The effectiveness of these disaster response efforts is contingent on accurate and timely information regarding the geographical location and impacts of the ongoing flood event. Decisions on the deployment of emergency aid and the distribution of supplies should be based on insights in where impacts are faced and what the nature of these impacts is [6].
Here, we consider three questions that are of interest to humanitarian organizations in the immediate aftermath of a flood:
(1)
Where is the flood?
(2)
When can we know about the flooding?
(3)
What do we know about the impacts?
Traditionally, such information reaches humanitarian organizations through a network of field stations, employees, and volunteers, as well as through common news outlets, such as radio and television [7,8]. However, the intelligence that is received through these channels often reaches the right people only with a delay of many hours or even several days, and cannot always fully capture the three key parameters: timing, location, and impacts of the event. Innovative systems for early flood detection are recently being developed to provide additional spatial and intensity information that could be used in disaster response [9]. In this paper, we focus on two such innovative systems, the first based on near-real-time satellite data and the other on near-real-time Twitter data, and analyze how these systems sources may support effective humanitarian response. We perform the analysis based on case-studies in Pakistan and the Philippines.
Global satellite-based early detection systems are often able to identify riverine flood-induced water coverage from space within 24 h. Examples of such systems are the flood maps based on MODIS [10,11] and the Global Flood Detection System (hereinafter refer as GFDS) [12]. MODIS uses an optical signal to estimated inundated areas, which was used successfully for near-real-time inundation mapping in the 2012 Pakistan floods [13]. GFDS uses daily passive microwave satellite observations for rapidly identifying inundated areas, and has been applied for this purpose in recent floods; for example, in Bolivia 2014 and in India 2014. During these events, GFDS was proven useful in disaster response by providing flood extent, and time series of satellite observations for the current and the three previous years, in order to provide information about the importance of the flood event in relationship to potential previous events. Examples of disaster response assistance maps produced using daily GFDS data can be found at the Emergency Response Coordination Centre (ERCC) ortal [14].
Separate from the developments in satellite observation, past years have seen a spur of development in the use of near-real-time data streams from (social) media platforms such as Twitter, Facebook, Instagram, and news websites during and after disasters. Whereas satellite information has a typical delay of 24 h or more, social media messages can already be accessed within minutes of publication. Recent advances have made it possible to attribute social media information to geographic locations by extracting the body text (e.g., “New York City”) and linking this to the location on a map [15,16,17]. One of the first times that social media was used on a large scale for disaster monitoring was after the earthquake in Haiti in 2010 [18]. A team lead by Patrick Meijer collected tweets of observers and placed them on a map using the Ushahidi platform, assisting rescue operations [9]. Since then, social monitoring tools have been used regularly during or after disasters, including wildfires [19], earthquakes [20], floods [21], winter storms [22], heavy snowfall [23], and typhoons [24]. Several platforms have been designed to support these efforts, such as Twitter Alerts and GeoFeedia. The Operations Centre of the Philippine Red Cross, for example, uses Twitter for disaster tracking. They both pay close attention to the messages in which they are called upon (“@philredcross”) and search for keywords and hashtags to track known incidents (e.g., #flood, #insurgency, #earthquake, etc.). In addition, the Operations Centre use Twitter to follow agencies such as PAGASA (Philippines Atmospheric, Geophysical and Astronomical Services Administration), USGS and others, to monitor typhoons and earthquakes.
The main uses of social media in disaster situations have been improving situational awareness throughout the post-event response phase, two-way communication with affected people, psychological analysis [25], and relief coordination [24]. Earle et al. (2010) show that Twitter can also be used for the rapid mapping of disasters. Their results demonstrate that Twitter messages can be used to delineate earthquake-affected areas within several minutes, before official earthquake observations are available.
Whereas the use of satellite information and social media data for disaster response is gaining an increasing amount of attention, the ways in which these methods compare to one another and how they could complement current best practice in humanitarian organizations, remains largely undiscussed. For floods, specifically, the usability and accuracy of these distinct types of information sources has, furthermore, never been assessed comparatively. The aim of this paper is to provide a first comparison of these three channels of early detection information, in terms of the timing of the signal, as well as the type and value of the information. For this purpose, we analyzed data for a range of major and smaller flood events in Pakistan and the Philippines, all of which occurred in 2014. For all of these events we have had access to disaster response information from the local Red Cross National Societies, data from the near-real-time satellite flood detection system GFDS, and social media reporting through Twitter.
This paper continues as follows. Section 2 describes the methodologies and data sources used for the analysis. Section 3 presents the results of the flood mapping, early detection and event understanding. Section 4 provides discussion and conclusions.

2. Methods and Data

We assess the effectiveness and usability of the near-real-time satellite and (social) media data for disaster response, by analyzing a range of flood events reported in Pakistan and the Philippines. For Pakistan, we focus on one single major flood event in September 2014, whereas for the Philippines we analyze 80 smaller flood events. For each of the events, we combine information on flood detection from three data sources: disaster response organizations (Section 2.1), the GFDS satellite signal (Section 2.2), and Twitter (Section 2.3). We analyze the potential added value of the remote sensing and Twitter data for each of the humanitarian questions regarding flood response (Section 2.4): location, timing, and impacts.

2.1. Disaster Reporting and Response Information

As a baseline, we consider the reported flood impact information that existed at the time of the flooding events in Pakistan and the Philippines, from January 2014 onwards.
For Pakistan, we focused on the major September 2014 floods. These floods were caused by monsoon rains in the catchment areas of the eastern rivers of Jhelum, Sutlej, Ravi, and Chenab. The floods affected over 2.5 million people, causing 367 fatalities and destroying over 100,000 houses. We considered a range of documents that detailed the information available post-flood, including (1) Daily Emergency and Response Situational Reports, produced by USAID and iMMAP (2–4 September); (2) Weather Report and Flood Advisory documents produced by the NDMA [26]; (3) Internal communications kindly made available by the International Federation of the Red Cross/Red Crescent office in Islamabad; and (4) post-event analysis documents of flood extent and impacts dated late September or early October 2014, including the official NDMA Recovery and Needs Assessment [27].
For the Philippines, we analyzed flood events as reported to the Philippines Red Cross Society (PRC) between January 2014 and January 2015. This database contains 80 individual events, which can be attributed to 21 individual hydro-meteorological extremes (intense rainfall events, tropical typhoons, dam bursts, etc.). For each of the 80 events, the database contains information on the event cause; geographical location, date of the event, date of event reporting to the PRC, and date and type of intervention by the PRC. See Table 1 for an example entry from this dataset. The dataset clearly outlines the timeline in event occurrence, reporting, and action, and is therefore ideally suited for the range of analytics pursued in this study.
Table 1. Extract from event occurrence and response dataset provided by the PRC (date: day/month year).
WHAT Kind of Flood (Floods, Flash Floods, and Flooding Caused by the Opening or Failure of Dams)WHERE did the Event Happen (Village/Region)WHEN did the Event Happen?WHEN Was the Event Reported/Known to the PRC (and by What Media, if Possible)?WHEN Was Action Undertaken by PRC in Response to the Event?Event Type
Overflowing of rivers due to TD Lingling (Local name: Agaton)Compostela Valley11/1/201411/1/2014 (Online news and local PRC Chapter report)11/1/2014—Deployed volunteer for assessment 13/1/2014—Served Hot meals to 530 personsTropical Depression
Overflowing of river due to Typhoon Rammasun (Local name: Glenda)Northern Samar15/7/201415/7/2014 (Chapter Report/Volunteers on the ground)Alerted volunteers to the area and mobilised 35 volunteers and staff. 16/7/2015—Served hot meals to 620 individuals, Distributed Non Food Items to 202 Families, and Food Items to 788 Families.Typhoon

2.2. Near-Real-Time Satellite Data

Near-real-time information from satellite observation is recently becoming available to disaster response organizations during ongoing floods. The Global Flood Detection System (GFDS) is one of the main systems used for this purpose. GFDS is an experimental system set up to detect and map in near-real-time major river floods based on daily passive microwave satellite observations. The purpose of this system is to identify and measure floods with potential humanitarian consequences after they occur. In order to quantify the magnitude of the flood event, GFDS calculates the “flood magnitude” product as the number of standard deviations (sd) from the mean (avg): M = (signal − avg)/sd. Floods appear typically for anomalies of two (small and regular flood) or above four (large and unusual flood). All data are available as global raster maps at a spatial resolution of 0.09° × 0.09° (~10 km at the equator).
In this project, we retrieved the geospatially explicit GFDS signal for seven days before until seven days after the reported date of the event. We then used this data to analyze the development of the signal over time for the impact locations as specified by the disaster response data (Section 2.1), as well as for national-level analytics (see Section 2.4).
The reasoning behind using GFDS for this analysis, is because: (1) the GFDS data are published openly through a user-friendly web interface; (2) the raw pre-processed images can be freely accessed; (3) the system provides consistent outputs with short intervals of one day; (4) in addition to flood location and extent (which is also possible using MODIS imagery), GFDS allows for the analysis of time series; and (5) the system is based on observations rather than hydrological model outputs (a flood detection methodology used for example by the Global Flood Monitoring System [28]). A disadvantage of the GFDS system is its relatively coarse resolution. Data from MODIS-based flood detection products such as produced by the Dartmouth Flood Observatory (DFO) provide flood extents at higher resolution, but these do not allow for time series analysis, nor can they provide a signal under cloud-covered conditions.

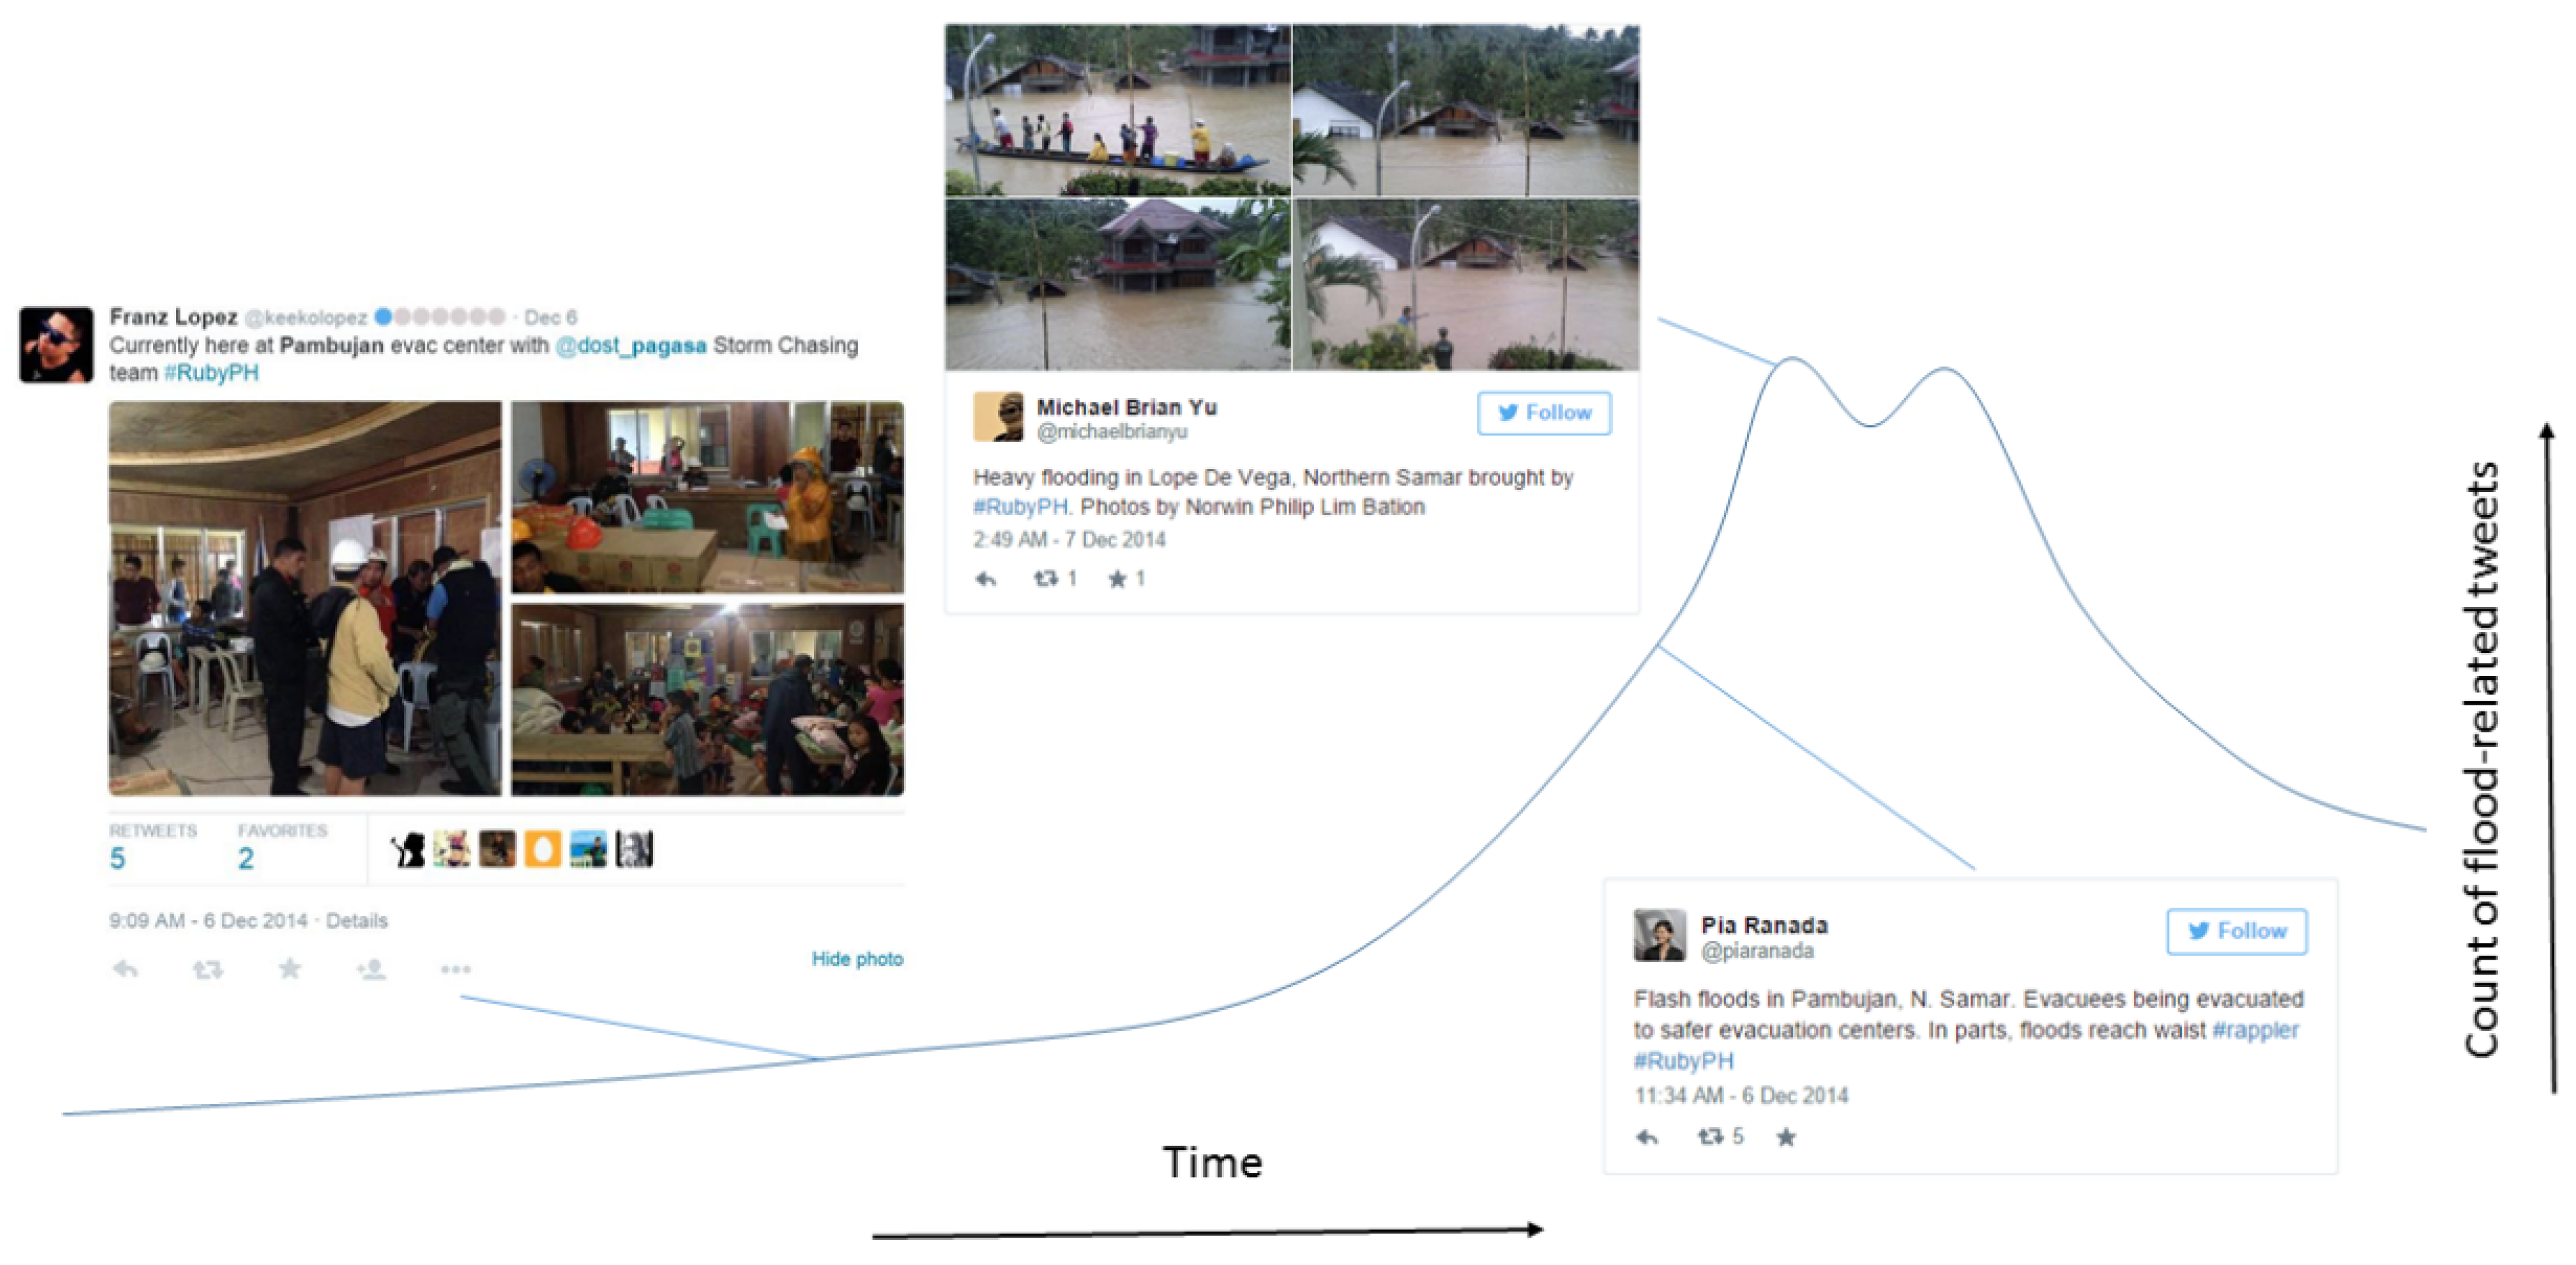
2.3. Near-Real-Time Twitter Data

The biggest challenge in effectively using social media information for disaster response is the systematic and rapid analysis of often vast amounts of data. In this study, we use the automated social media analytics platform Floodtags [29], which enables the filtering, visualization, and mapping of social media content based on location and keywords. We retrieve Twitter content for the September 2014 flood event in Pakistan and a selection of nine out of the 80 reported flood incidents in the Philippines. These nine incidents are linked to five individual flood events, and were selected to cover a range of different types of flooding (small, large, rain-induced, dam failure, etc.).
We retrieved the data for Philippines and Pakistan from the streaming API from Twitter. We searched for the words “baha”, “bumabaha”, “apaw”, “pagbaha”, “pag-apaw”, “guho”, “سیلاب”, “flood”, “floods”, “flooding”, “inundation”, “inundations”. Next, we enriched the tweets with Open Street Map data in order to get more location-specific detail, we filtered out place names with four or less characters and we excluded ambiguous English words (e.g., college, villa, etc.). This analysis of message body text is the methodology used for assigning a location to each Twitter message where possible. Whereas the metadata that comes with Twitter messages posted by a mobile device also include information on the geographical location of that device at the time of posting, this information is not used in this study. The first reason for this choice is the fact that the majority of tweets report second-hand information, i.e., they discuss events that do not happen at the location of the person publishing the tweet [24]. Second, even when a tweet refers to a first-hand observation, it is not obvious that this observation has happened at the same time and place of the sending of the tweet [30]. If a flood happens in a remote area of the country without Internet access, it can be expected that observations are only tweeted as soon as the person reaches an area with Internet access, e.g., a larger town, causing more noise in the location data coming directly from Twitter. Uncertainty in the location detection remains, however, because certain place names may be featured multiple times in the same country [31], for example. See Discussion and Conclusions for a more extensive discussion of these challenges.
Wherever a specific tweet referred to a web page (URL), we also downloaded that web page as additional information. See Table 2 for the number of tweets for Pakistan and Philippines in the selected timeframes (September 2014 for Pakistan and the entire year 2014 for Philippines). Note that the temporal coverage and number of tweets vary strongly between the two case-study countries. We do not aim to conduct a comparative assessment, but rather use the data for different purposes throughout this paper.
The penetration rate of social media is relatively low in Pakistan, at 4% of the population; in the Philippines the penetration is higher at 29% [32]. A relatively large share of the Twitter users in both countries can be expected to reside in larger towns and cities. Therefore, the spatial variation displayed by a Twitter based heat map (i.e., a map of absolute Twitter activity on a specific subject) will have a bias to showing floods in densely populated places [33]. Further research efforts are needed to develop methods for normalizing the data for population or social media penetration.
Table 2. Filtered flood-related tweets between 1 September 2014 and 31 January 2015.
LanguageFlood Tweets Containing Pakistan Places (September 2014; One Event)Flood Tweets Containing Philippine Places (July 2014–January 2015; Multiple Events)
English197,651458,689
Urdu74,1410
Filipino036,055

2.4. Analytics and Outputs

In this paper, we bring the information from disaster response organizations, the GFDS satellite signal, and Twitter activity together in an analytical framework, to produce three types of analyses: location mapping (i.e., “where is the flood?”); early detection (i.e., “when can we know about the flooding?”); and event understanding (i.e., “what do we know about the causes and effects?”). These specific analyses are chosen to assess the diverse potential of the near-real-time data for disaster response activities. We conduct the three analyses using a selection of the satellite and Twitter datasets for Pakistan and the Philippines, without aiming to analyze all three questions for both countries and for both data types.

2.4.1. Location mapping

Accurate information about the spatial extent of the ongoing flood at a given point in time is essential for effective disaster response. We assess the use of GFDS and online media information for near-real-time flood mapping, using the extracted data for Pakistan.
By analyzing the GFDS signal, we can produce an estimated significance of the flood at each gridded pixel of about 10 by 10 km. In this study, in order to show the detected spatial flood extent and for clarity, we selected those pixels with a magnitude value above four as the threshold of a flood occurrence in an analogous way as the experimental global flood maps uses the GFDS data.
Similarly, the real-time analysis of online (social) media content can be used to produce “heat maps” of online activity surrounding a specific topic [34,35], such as flooding. Such maps show the spatial intensity of tweets in a color scheme, at a given time interval (min, h, days, months). For consistency with the GFDS data, which is available on a daily basis, we also derived daily heat maps in this study.

2.4.2. Early detection

We assessed the effectiveness of GFDS and Twitter signals to be used for the early detection of floods, using the datasets extracted for the Philippines. For both data types we studied the temporal trend in the signal strength (i.e., flood magnitude for GFDS, and tweet count for Floodtags data). These signals were then compared to the timing of the reporting of the flood event by the PRC. The results of this exercise are displayed as a graphical overlay of the timing graphs of GFDS and Floodtags data. For Floodtags data, this method is illustrated in Figure 1.
Figure 1. Schematic display of a typical Twitter count pattern leading up to a flood event (graph is illustrative; tweets are actual messages derived from flood events in the Philippines in 2014).
Ijgi 04 02246 g001
In addition, we analyzed the GFDS signal across all events, to draw a statistical distribution of the signal strength across all cases. The main purpose of this analysis is to assess the performance of the GFDS signal in the case of the Philippines events versus the Pakistan flood.

2.4.3. Event understanding

Twitter information provides almost unlimited scope for qualitative situational analysis right before, during, and after disasters [9]. This may include sentiment analysis, photograph analysis, as well as impact assessment. In this study, we argue that information from social media may be especially useful to improve the understanding of, and response to, unexpected or controversial flood occurrences. Within the flood episode in Pakistan, we handpicked a number of such occurrences for which we retrieved and analyzed qualitative Twitter information. These occurrences include an intentional breaching of flood defenses to protect selected areas, and the downstream flooding following the opening of hydropower dams. For both these types of events we analyze the timeline as well as the content of Twitter data, to evaluate its use in disaster response. For hydropower dam openings, we also analyze the GFDS signal to analyze the potential of the satellite system to detect such events. These are selected to provide insights in the timeline, cause, and effects of such controversial events, using information that is available in near-real-time.

3. Results and Discussion

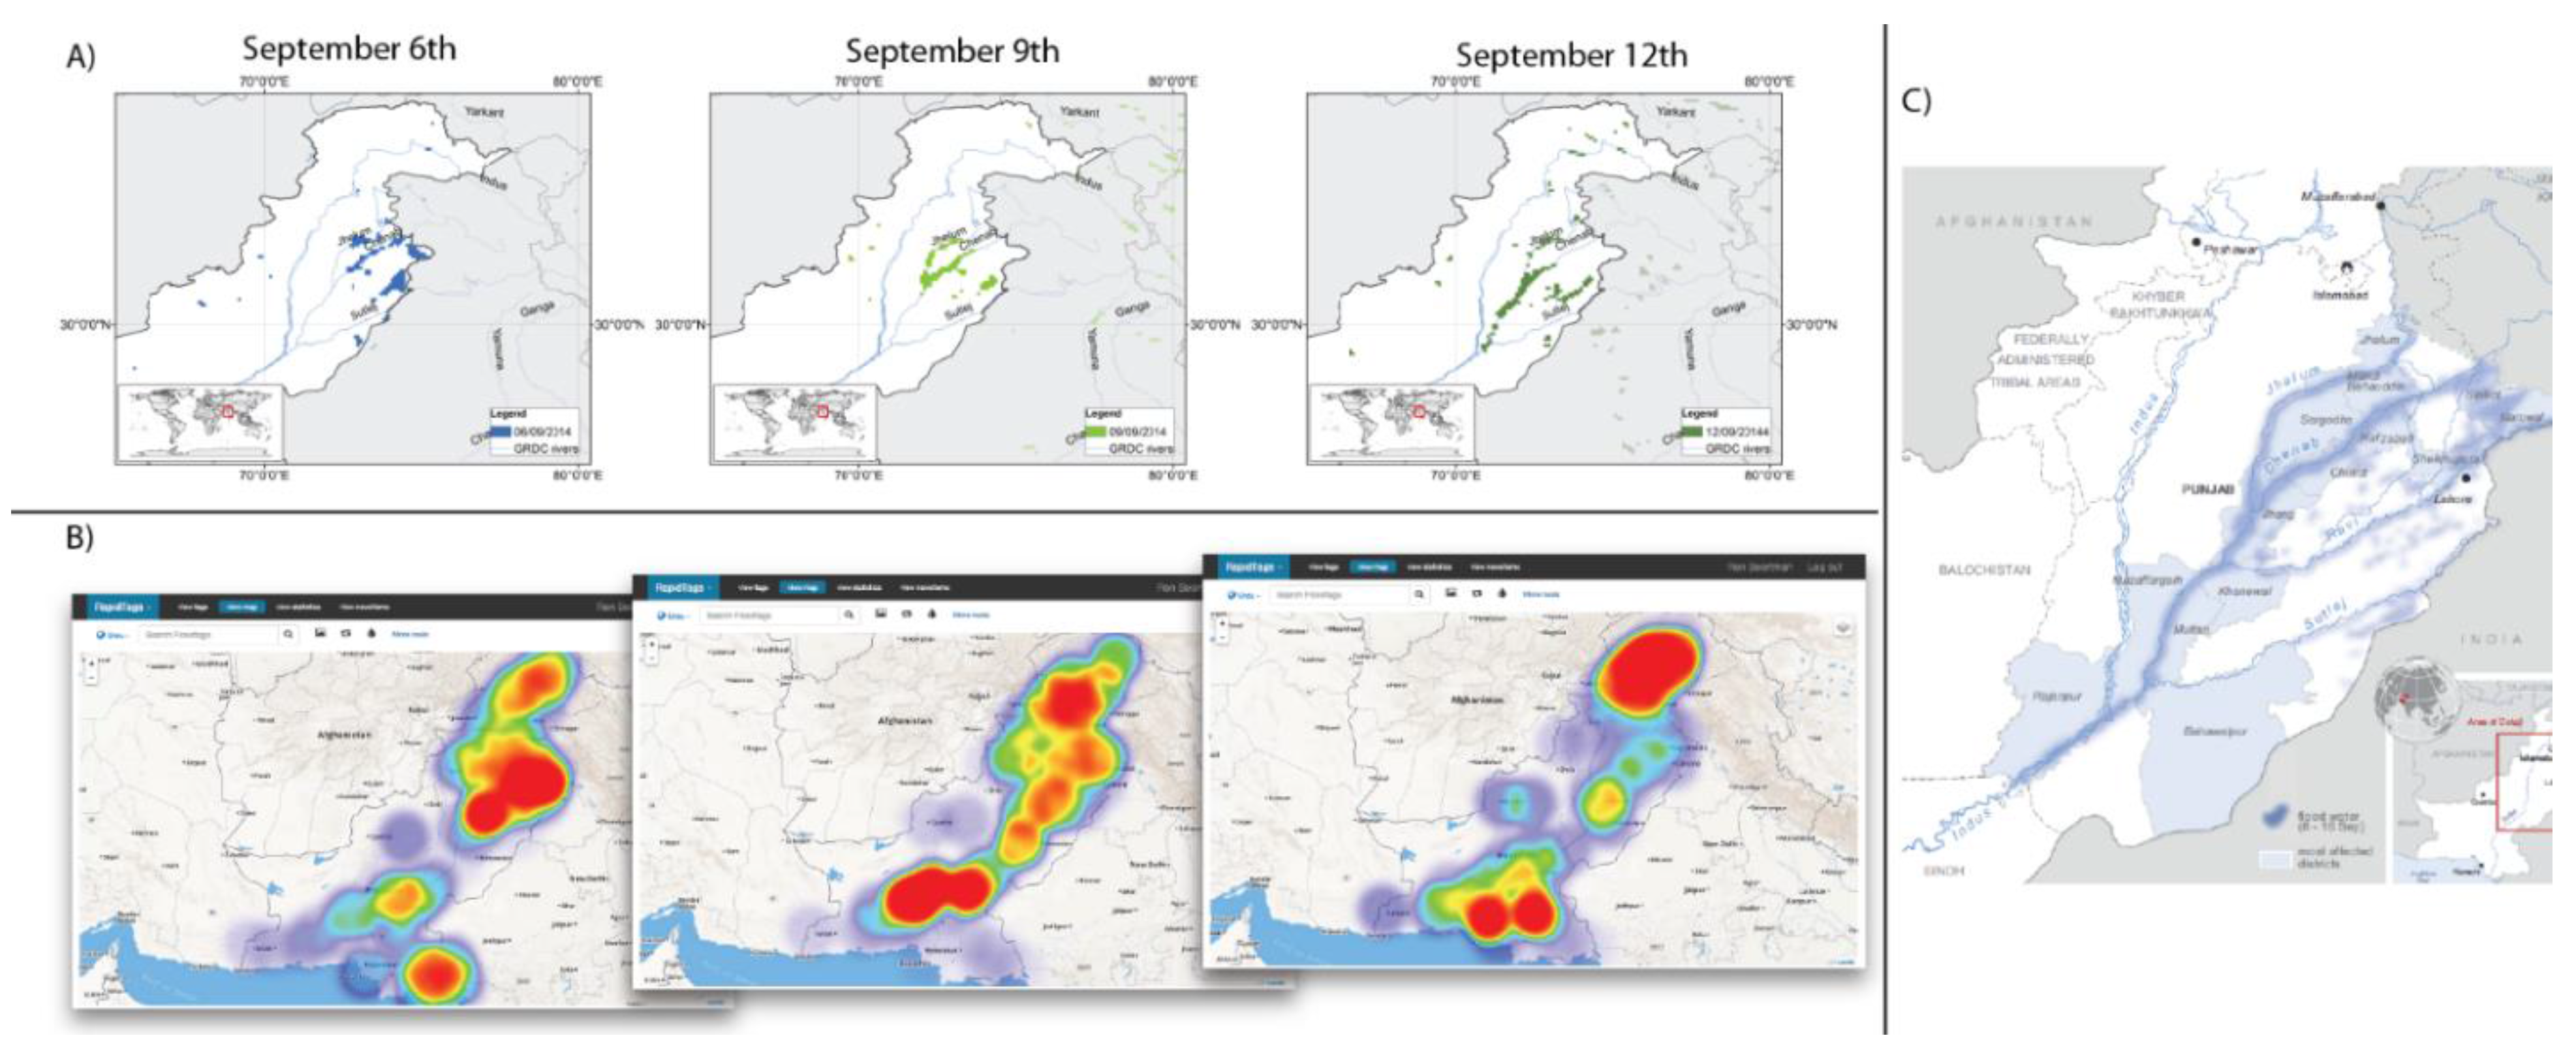
3.1. Rapid Flood Mapping

Figure 2 shows the estimated daily flood affected areas in Pakistan for 6th, 9th, and 12th September, as estimated from the GFDS satellite signal (Figure 2A) and the Twitter activity (Figure 2B). Figure 2C shows the flood affected areas as published by UN-OCHA two weeks after the end of the flooding episode [36].
Figure 2. Affected flood areas as derived from different sources: (A) flood signal from GFDS for 6, 9 and 12 September. (B) heat map based on flood related Twitter activity for 6, 9 and 12 September; and (C) inundation map published by UN-OCHA in October 2014, outlining all areas that were inundated at some point in September 2014.
Ijgi 04 02246 g002
The results demonstrate that the daily flood extents identified in near-real-time by the GFDS signal (Figure 2A) agree well with the detailed assessment that was produced weeks after the ending of the flooding. Furthermore, these maps highlight that detail on the spatial development of the flooding, i.e., the gradual change in inundated areas across the region, can be tracked with a delay of less than a day.
The spatial mapping of the twitter activity using the Floodtags platform (Figure 2B) shows a substantially different pattern from the GFDS data, highlighting that spatial information derived from social media is more complex to assess than satellite-based data. First of all, in contrast to the satellite-based inundation identification, flood-related tweets are not necessarily an indication of an ongoing flood at the same time and place as where the tweet was posted. Research has shown that less than 5% of the disaster related tweets during Typhoon Haiyan dealt with personal observations, whereas 40% reflected second-hand information (i.e., re-tweets, or tweets about news reports) [24]. Second, the heat maps are strongly biased towards urban areas, both those affected from floods and those outside of the flood plain. This bias is caused by a higher penetration of Internet and social media in urban areas. The result from both of these effects is clear from the heat maps, which show a large concentration of tweets in urban centers, such as Islamabad (in the north of the country), Hyderabad, and Karachi (in the south of the country). These centers of Twitter activity are not directly affected by major flooding, highlighting a clear mismatch between the event location and signal location in this case.

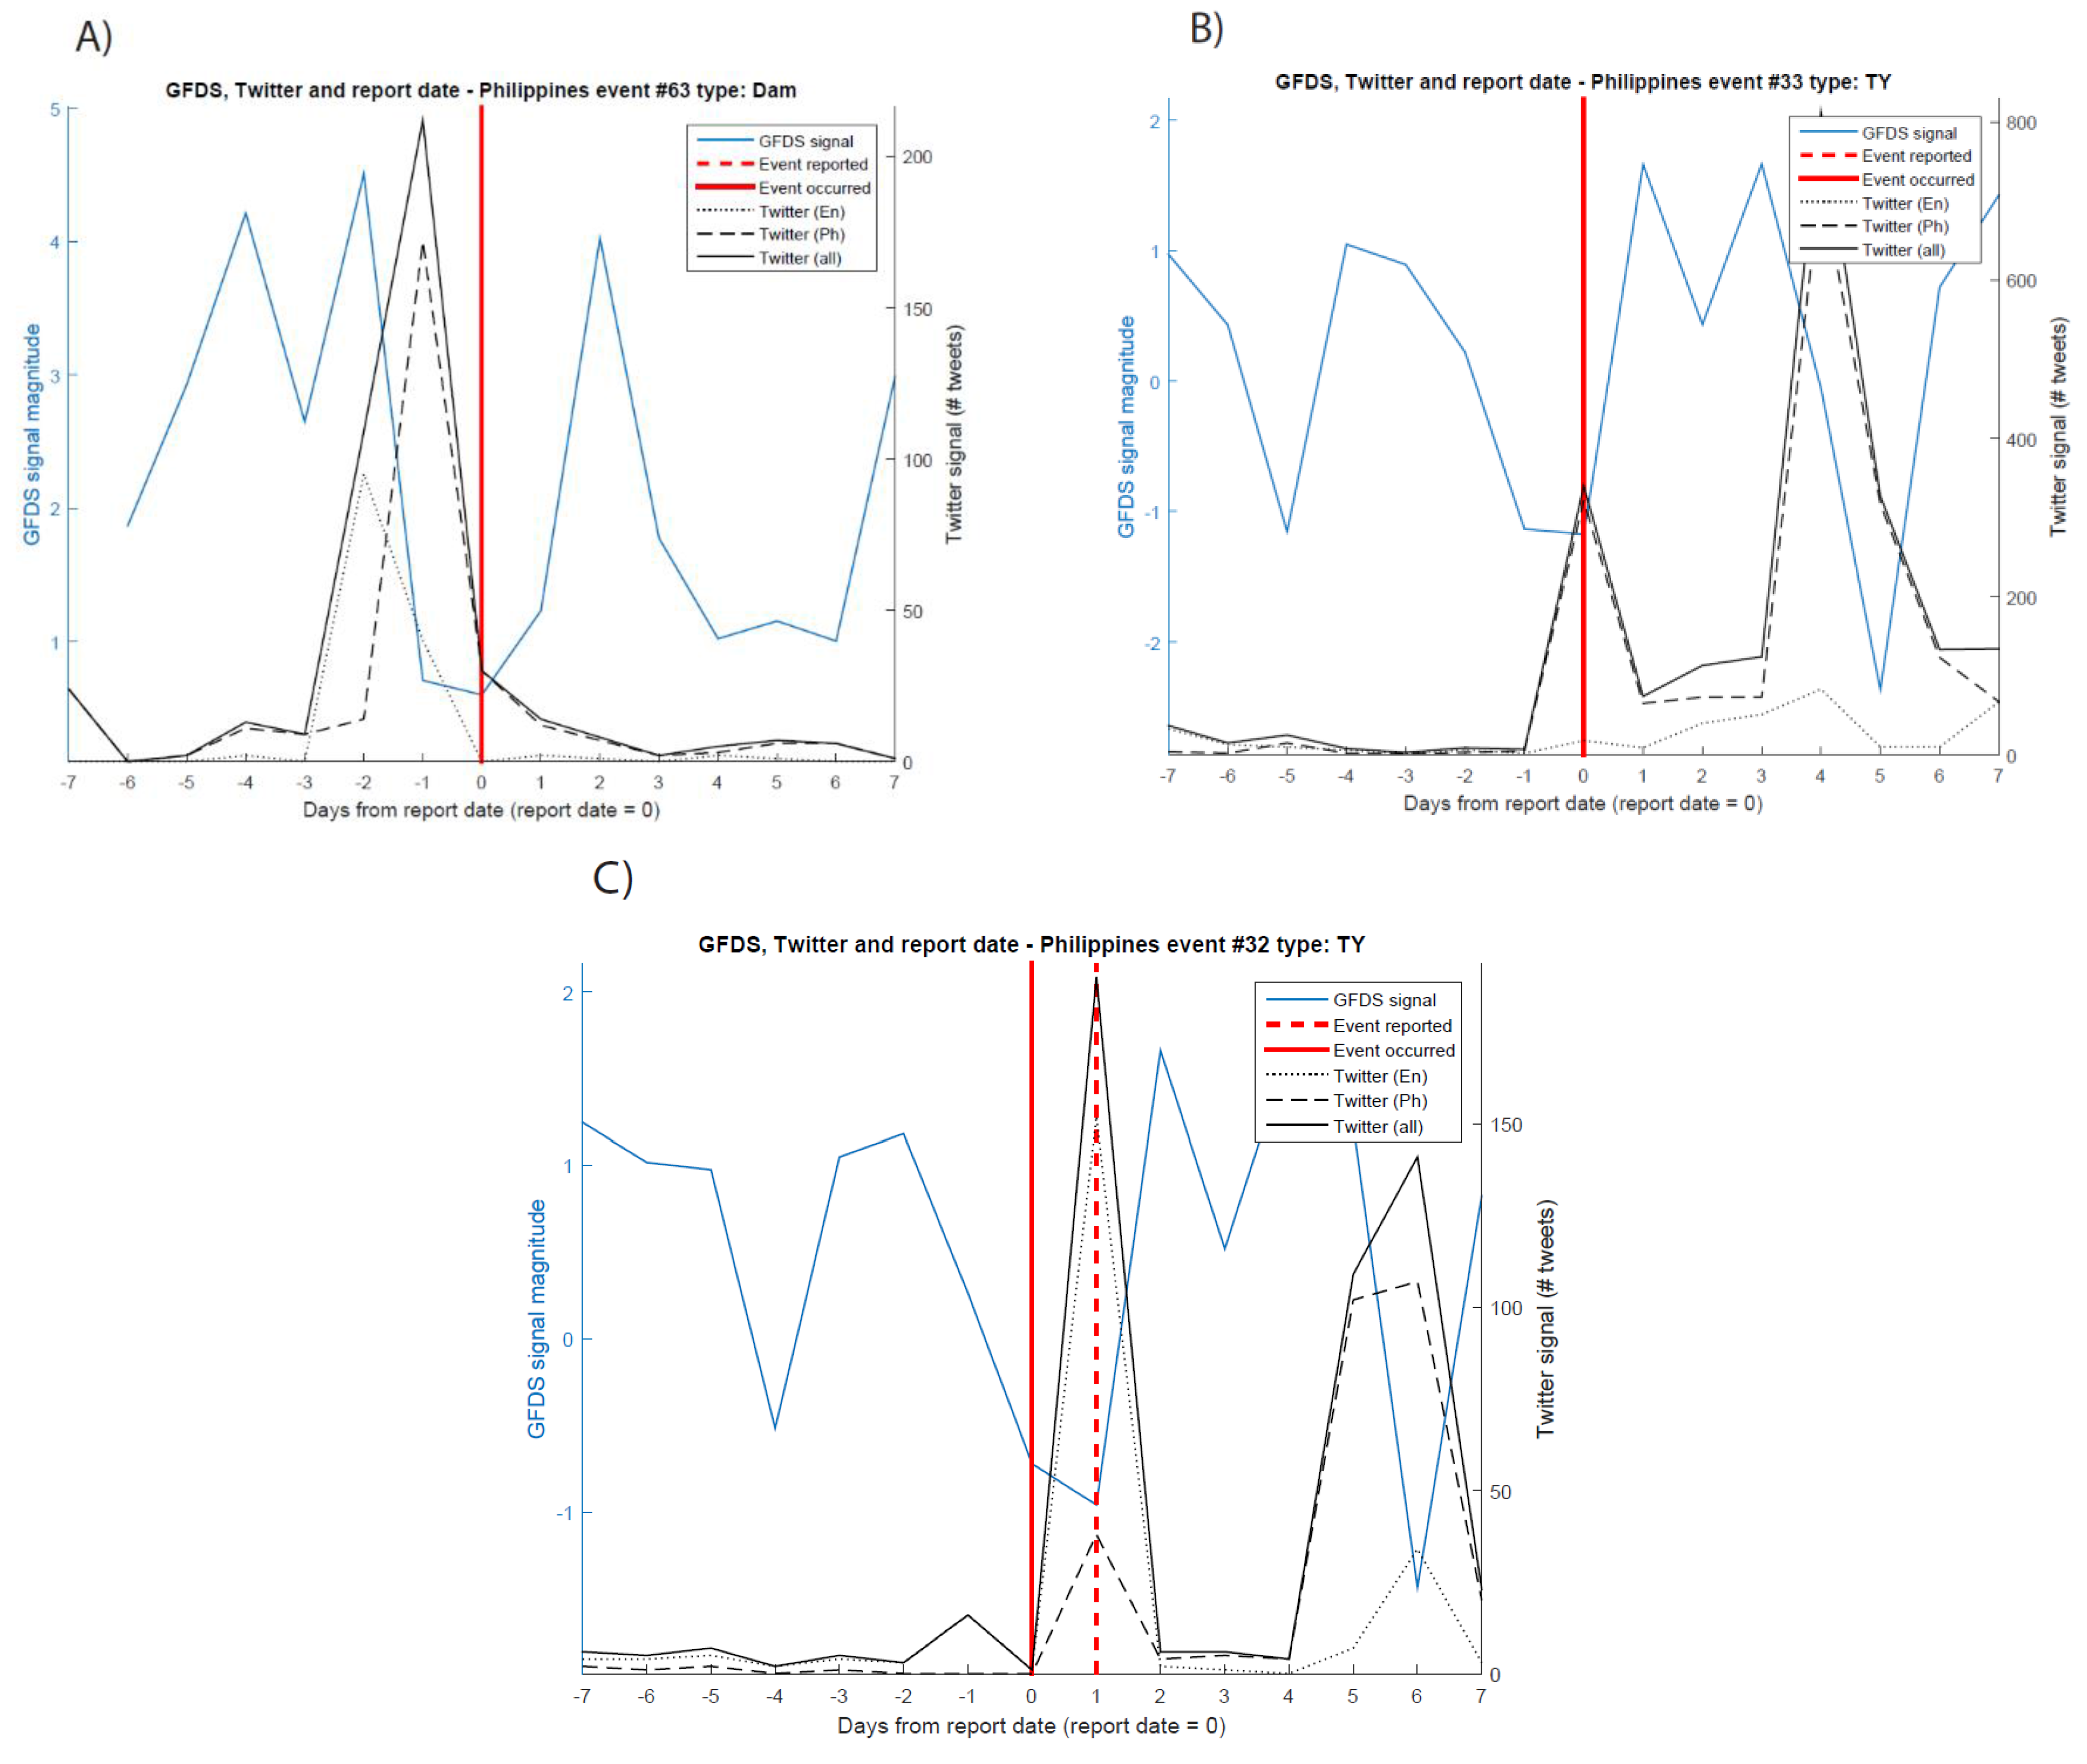
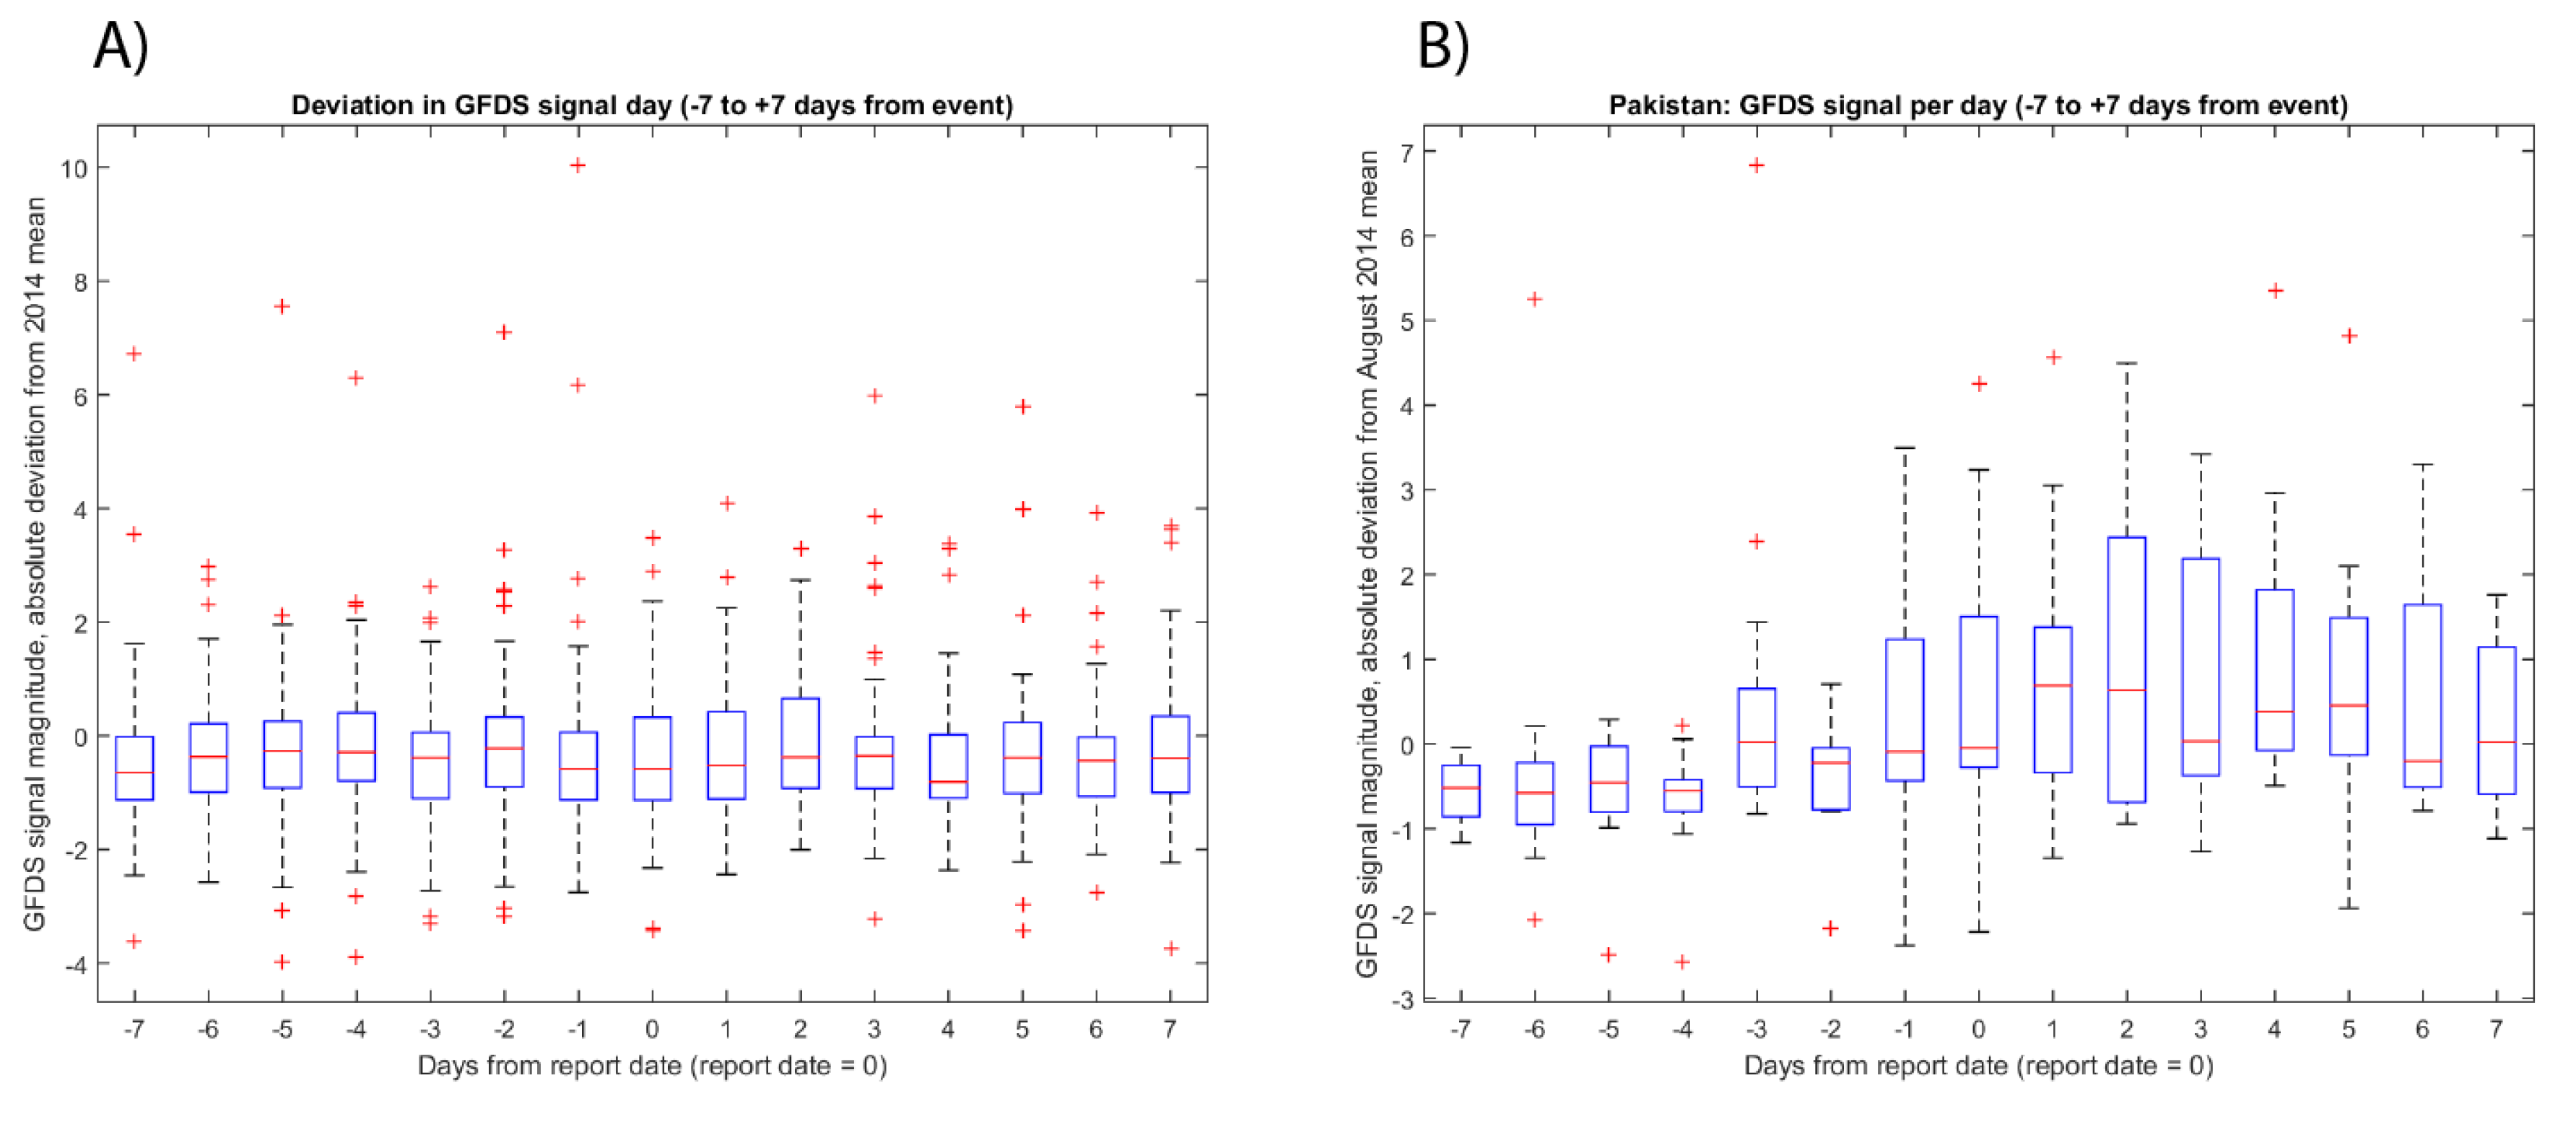
3.2. Rapid Flood Detection

We assessed the capabilities of the GFDS and Twitter data to rapidly detect flood events, by comparing the timing of those signals to the moment on which the flood events were reported by the disaster management organizations (PNDA in Pakistan; and PRC in the Philippines). Figure 3 shows the results of this analysis for three selected flood events, numbered 63 (Figure 3A); 33 (Figure 3B), and 32 (Figure 3C). These three examples highlight the mixed performance of both the Twitter and satellite signal for flagging the reported flood events.
Figure 3. Flood signal from GFDS (blue line) and Twitter analysis (black lines for tweets in English language (fine dash); Filipino language (coarse dash); and both languages (solid line). The red lines indicate when the event occurred (solid) and was reported (dashed). If only one red line is shown, the dates of occurrence and reporting are the same. Flood types refer to dam break (“Dam”) and typhoon (“TY”). The individual graphs are for different events that occurred throughout 2014, including (A) one dam overtopping and (B,C).two typhoon-triggered river floods.
Ijgi 04 02246 g003
Event #63 (Figure 3A) was a local flood event in Pambujan, in Northern Samar region, caused by the landfall of Typhoon Ruby. Disaster management organizations in the Philippines, including the PRC, were well-prepared for the landfall of this typhoon. For this specific location, flooding due to overflowing of a dam was reported to the national PRC on December 8th and acted upon shortly after, according to the information available to the authors (red vertical line). On Twitter, however, over 200 tweets and photos testifying and discussing the start of the flooding were already posted starting two days earlier (6 December). Small-scale evacuations shown in these tweets emphasized that local disaster response organizations (including the Municipal Disaster Risk Reduction Management Office) were aware of the ongoing event between the 6 and 8 December. A high GFDS satellite signal was also recorded between the 4 and the 6 December, suggesting that high rainfall and flooding may have taken place in that period. In the case of this event, therefore, monitoring of the Twitter and GFDS signals may therefore have had potential for earlier detection and more rapid disaster response by national-level humanitarian organizations.
A consistent early signal based on the analysis of both Twitter and satellite data like this, however, is not found for most of the events under analysis. Since the PRC already uses Twitter and other (social) media sources to some extent for disaster detection and monitoring, the peak in the Twitter signal can often be found on the same day the disaster was known to the PRC (Figure 3B). In the case of event #32 (Figure 3C), the information received from the PRC indicated that the event was reported (dashed red line) one day after it occurred (solid red line). Again, a small signal in the Twitter count data (black lines) and GFDS data (blue lines) was recorded 1–2 days earlier. However, the biggest peak in the Twitter signal is recorded on the day of reporting (i.e., one day after the event occurred). This emphasizes that the majority of flood-related tweets are generally reporting second-hand information, by retweeting eye witness reports or news items [24].
The performance of the GFDS signal in these three flood events visualised in Figure 3 is mixed. In the case of event #63 (Figure 3A), the system seemed to have performed well, and there was a strong (>4 magnitude) signal several days before the event was reported. In the other two events (Figure 3B,C), however, there was no clear peak before the event and the magnitude remained low (<3) between seven days before and seven days after the event.
We analyzed the statistical distribution of the GFDS signal for this 15 day period surrounding each of the 80 flood events in the Philippines, and for 17 different locations during the September 2014 Pakistan floods. For comparability across events, we analyzed the deviation of the GFDS signal compared to the average value for each pixel, rather than the absolute GFDS magnitude values. The results of this analysis are displayed in Figure 4, for the Philippines (Figure 4A) and Pakistan (Figure 4B). Note that a single event date of 4 September is assumed for Pakistan (which is the first date on which flooding was reported), whereas the 21 individual event dates are used for the Philippines events. In places where GFDS performs well, we would expect a relatively high magnitude signal (compared to average) on the days right before and after a reported flood (“day 0” in Figure 4).
The results in Figure 4A show that, across all reported flood events in the Philippines, the GFDS signal fluctuates without a clear pattern. In general, there is no strong signal of higher magnitudes directly before or after reported flood events, although for few locations the relative magnitude values are high. There does seem to be a trend in the outliers prior to events in the Philippines, perhaps indicating that some events were well-captured, whereas many were not. In contrast, the results for Pakistan show a clear pattern of increasing signal for all locations right before the date of first flooding (4 September), which continues to rise and then slowly decreases. This shows that for most locations in the Pakistan analysis, the GFDS signal performs well in showing relative changes in flood magnitude. These findings emphasize that the performance of the GFDS system depends on the hydrological situation, as well as the land-use. The microwave satellite signal is generally better able to detect changes in water cover in dry areas (e.g., Pakistan) than in the irrigated agricultural lands, wetlands and coastal areas that characterize most of the Philippines. Obviously, the Pakistan floods were also a more extreme event than the Philippines event and, therefore, easier to detect by satellite observation. A full comparison of a wide range of similar-sized events in both countries would be needed to assess the effectiveness in early detection in different circumstances.
Figure 4. Box plots showing the distribution of signal deviation from the mean, for (A) all 80 flood events (i.e., 80 locations) reported throughout 2014 in the Philippines; and (B) the September 2014 floods in Pakistan at 17 locations. For the event date (“day 0” on x-axis), we used the specific reported event date for each individual event for the Philippines; and 4 September 2014 for Pakistan.
Ijgi 04 02246 g004

3.3. Improving Event Understanding

Satellite early detection signals provide a quantitative indication of the location and possible magnitude of an ongoing event. In addition to providing insights in these aspects, near-real-time data from social media platforms can also provide qualitative insights in the situation on the ground [9]. These insights may include public discussions about risk prevention and evacuation measures (either pre-emptive, forced or voluntary evacuation); picture evidence of ongoing floods; and requests for emergency aid.
In order to assess the use of such data for disaster response, we analyzed tweets surrounding the flooding near the town of Athara Hazari, in north-eastern Pakistan. This specific case was noticed due to the particular and long-lasting pattern of flood-related Twitter messages over the period 4–29 September, with a number of activity peaks. By analyzing the content of these messages, a reconstruction of the events during this period can be made (Figure 5). This reconstruction shows a following timeline of events: starting on 4 September, people are increasingly worried about rising water levels; on September 8th, public discussions start about potential management strategies of the government, which include intentionally undermining flood protection around Athara Hazari in order to protect the headworks at Trimmu and the city Jhang; on September 10th, a range of tweets indicate that these dykes are actually blown without warning to the local population, inundating at least 100 villages; in the period after 10 September, these decisions and their implications were heavily discussed within the affected region and beyond. The discussions largely considered questions of why this had happened, including speculation that flood protection was jeopardized in order to protect the sugar mills owned by the family of the Prime Minister.
Figure 5. Twitter activity in Pakistan surrounding the blowing of flood defenses around Athara Hazari for the protection of the Sugar Mills at Trimmu and the city Jhang.
Ijgi 04 02246 g005
The sudden flooding of lands by blowing of levees and opening or breaking of dams can also be identified using the GFDS satellite signal. Figure 6 shows the GFDS signal for two locations downstream (Figure 6A) and upstream (Figure 6B) of the Tarbella dam in Pakistan, for seven days before and seven days after the 4 September. Figure 6A shows a very strong peak (>8) in the flood magnitude signal downstream of the Tarbella dam on the 1 September, indicating a sudden opening of this dam. Figure 6B indicates that the water cover upstream of the dam did not see a similar peak, and indeed dropped steeply 2–3 days later.
Pakistan has more than 20 major dams and barrages, which have an important role in the occurrence and management of floods. Twitter is an important platform for the population to discuss issues surrounding these dams, such as full reservoirs; sudden dam openings; and barrage overtopping. We analyzed the twitter signal about a range of dams in the affected areas in Pakistan, as well as a range of dams located further upstream in India (districts Jammu, Kashmir, Himachal Pradesh, and Punjab) and immediately downstream in Pakistan (districts Jhelum and Mandi Bahaudin) (Figure 7). The peaks in the Twitter activity follow the flow of the river. Tweet counts in Indian districts peak around mid-August; the Mangla dam in North-Eastern Pakistan shows a small peak on 5 September; four days later, a peak is recorded in the Jhelum district further downstream; and another few days after, the Mandi Bahauddin district peaks. As noted previously, only part of the Twitter messages can be attributed to direct observations, whereas a majority of tweets are reflecting upon these observations.
Figure 6. GFDS signal for locations directly (A) downstream and (B) upstream of the Tarbella Dam, in North-Eastern Pakistan.
Ijgi 04 02246 g006
Figure 7. Tweet count related to dams and barrages, along the Jhelum, Chenab, and Ravi rivers. The locations are roughly ordered from upstream to downstream (numbered 1 to 6).
Ijgi 04 02246 g007
Analyzing the content of the tweets, we find that the small peak at Mangla Dam on the 5 September includes Twitter users discussing their worry about the full capacity of Mangla Reservoir. Later in the month (20 September) Twitter users discuss the fact that the Meteorological Department in Pakistan advised Mangla Dam to release water as early as mid-August. According to Twitter users, this warning had not been followed up, leading to the Mangla Dam being full despite warnings. A full dam capacity is hazardous when high rainfall is expected in the upstream area, since it may force the dam operator to open the dam for the release of substantial amounts of water. Actively following these dam-related conversations on social media could give humanitarian organizations enhanced insights in the potential for a dam opening upon high rainfall upstream, and could therefore be useful in preparing for potential flood impacts. Twitter could also be used as a medium for two-way communication with people living downstream of the dam, to gain further intelligence and to advise these people on possible preparedness activities.

4. Conclusions and Recommendations

In this research we analyzed the potential value of near-real-time satellite and social media information for improving the understanding of the location, timing, causes, and impacts of floods, in order to enhance the speed and effectiveness of disaster response. Both the GFDS satellite data and the Twitter data that we analyzed in this paper have huge potential for enhancing disaster response, whereas both also have issues. In this section we will discuss some of these issues and propose further research directions.

4.1. GFDS satellite information

In general, GFDS is suited for monitoring and measuring large riverine floods and less so for small floods of short duration. In particular, GFDS provides unique information to assess the dynamic aspects of floods and for the quantitative measurement of flood impact. However, there are some known errors in the signal [37], including: (1) in agricultural areas, irrigation of the measurement and comparison pixels can affect the signal, as was shown by the relatively weak performance of the signal in the Philippines compared to Pakistan (Section 3.2); (2) intermittent instrument noise occasionally produce intermittent positive spikes in discharge (here work by the Dartmouth Flood Observatory is ongoing to solve this issue); (3) snow gives a similar signal as water and is not filtered out in the current version; and (4) due to the methodology applied to calculate the signal, GFDS may give erroneous results in coastal areas. The GFDS signal is therefore less suited for use in delta regions and islands.
Furthermore, care should be taken when interpreting the absolute magnitude values from GFDS. For the flood maps shown is this study (Section 3.1), we used only those flood magnitude values above four, because we wanted to spatially focus on the areas with more extreme flood anomaly detected by GFDS. However, values between two and four are typically associated a small and regular floods. From a humanitarian action point of view, these values could be combined with field knowledge of the vulnerability of specific areas. Values above two can then be used to set up monitoring and prepare for the potential development of a large flood. This can be complementary to analysis of forecasted extreme precipitation or flood forecasts from national meteorological services and global systems such as the Global Flood Awareness System. In addition, the GFDS offers the possibility to facilitate monitoring by displaying areas of interest in a (pre-) operational manner into the website, as is done for Bangladesh [38].
As research and technology progresses, additional satellite products should be considered as alternatives to GFDS. At this point, GFDS and MODIS (see Section 2.1) are the only sources of satellite water detection which are publicly available with a daily time step. One separate development that may be a promising alternative is the progress in global flood forecasting models [39], such as GloFAS (Global Flood Awareness System) [40] and GFMS (Global Flood Monitoring System) [28]. The performance of these systems for taking DRM actions prior to flood events is currently being tested by the Uganda Red Cross, together with the German Red Cross and the Red Cross/Red Crescent Climate Centre [41]. Currently, the uncertainty in the predictions is still large, and such forecast products cannot be considered as reliable as detection products, such as GFDS. However, the lack of adequate ground truth for most of the flood events that occurs, makes the evaluation of both (prototype) flood forecasting and satellite monitoring systems challenging [42]. Nevertheless, there are several studies that have tested the impact of using satellite-derived flood inundation products for calibration [43,44] or data assimilation [45,46] within hydrological models to improve its skill, showing promising results.

4.2. Twitter Analysis

In contrast to the GFDS signal, which is better suited for monitoring large floods, Twitter can be used to monitor floods of any size, as long as the observations and discussions are shared by people on social media. This analysis was shown to have several challenges. First, the consistent and accurate geographical allocation of the Twitter messages is complex [24,47,48]. In assessing the geographical location, we are looking for the impact location, rather than the geographical location of reporting, by analyzing place indications in the body of the tweet text. This is complex, since body texts may contain many ambiguous words, including place names, which may cause a substantial share of the messages that cannot be confidently georeferenced. In addition, there may be place names that are featured multiple times within the same country [31]. Georeferencing messages outside of the affected area is a key priority, given that the majority of tweets is discussing second hand information rather than observations [24].
A second challenge is analyzing the spatial distribution of tweet intensity. For densely populated areas, results showed that we can easily find large numbers of tweets about (upcoming) floods. However, for rural areas, such as Northern Samar in the Philippines, we found only two eye witnesses tweeting. Such a small tweet intensity is unlikely to alarm observers from humanitarian organizations, unless these are specifically called upon in the tweet (e.g., by using “@philredcross”). In addition, such small numbers of eye-witness reports raise questions about false-alarm rates. Given the costs associated with disaster response, one or two eye-witness reports are unlikely to trigger action on the side of the humanitarian organization. However, they could trigger further investigation, for example by responding directly to the specific Twitter user.
Third, there are challenges surrounding the selection of tweets that are relevant for the issues we need answers to. For this study, we conducted the assessment using a relatively simple query and using its statistics. Whereas the results are already promising, the accuracy could improve if we would improve the processing of data, for example by classifying the data using clusters [49]. Clustering according to subjects may enable the user to distinguish the different types of observations and use them accordingly.
Finally, when monitoring social media, it may be interesting to distinguish individual messages from the “wisdom of the crowds” [50]. While a single tweet may not say much (e.g., one person worries about a flood), the crowd may indicate that something will actually happen (e.g., many people worry about a flood and with it, predict the flood). This effect could be nourished by making people aware that their messages are used effectively for disaster response, which may lead to more responsible and informative tweets.

4.3. Recommendations for further research

In this study we have identified a number of recommendations for further research on the use of near-real time satellite and Twitter data for disaster response.
-
Post-processing and filtering: further research efforts are needed to develop comprehensive near-real-time post-processing and filtering methodologies for social media content. These methodologies, which may include more sophisticated textual, geographical, and sentimental analyses, should aim for improving the accuracy of the location and impact analytics that are derived from this data, making the information more useful for humanitarian organizations.
-
Near-real-time action trigger analysis: this study has shown that many of the flood events can be traced in the GFDS and Twitter signal, as a relative increase in signal compared to the baseline. However, there is currently no link between a certain signal magnitude and the probability or intensity of a flood and, therefore, with certain preparedness or response measures. Further research efforts are needed to analyze the signal magnitude during floods in various geographical settings, to link these magnitudes to relevant preparedness measures at the side of humanitarian organizations, and to establish the communication links between the data producers and humanitarian organizations to enable these actions to be taken.
-
Linking signals with vulnerabilities: humanitarian organizations such as the PRC are conducting regular Vulnerability Capacity Assessments (VCAs) in order to understand the vulnerability of communities [51]. There is a potential for linking the flood signals from satellite observation and social media to detailed knowledge of the vulnerabilities in the area, to make a more substantiated judgment about potential humanitarian actions in the region.
-
Citizen reporters: there are currently initiatives ongoing in the Philippines to deploy “citizen reporters”, which are civilians who are asked for real-time information of ongoing events which is then used publicly by TV news stations. The system of citizen reporters may be equally valuable for humanitarian organizations, who could follow and support their volunteers during ongoing events, using social media such as Twitter. Research is needed to assess how such an approach could be implemented in the work flow of humanitarian organizations, and how this could be used to improve disaster response.
-
Partnerships: Easy access to information generated by social media, and using it accordingly, can be a way forward towards new partnerships in disaster preparedness and response, and towards evolving approaches of working together. Research is needed to establish which partners are currently involved in disaster reduction and response, and how harnessing social media could change their relationships.

Acknowledgments

We are grateful to Gwendolyn Pang and Maycarol Layugan (Philippines Red Cross), Muhammad Qaswar Abbas (IFRC Pakistan Country Delegation) and Donna Lagdameo (Red Cross/Red Crescent Climate Centre) for the data, support and technical assistance which they provided and which made this study possible. We acknowledge ESRC-DFID-NERC for providing funding for this research under the Big Data for Resilience programme. Further funding was provided by an NWO-VICI Grant (Grant Agreement 45314006).

Author Contributions

Brenden Jongman, Jurjen Wagemaker, Beatriz Revilla Romero and Erin Coughlan de Perez jointly designed the research. Jurjen Wagemaker and Beatriz Revilla Romero extracted Twitter and satellite data, respectively. Brenden Jongman, Jurjen Wagemaker and Beatriz Revilla Romero analyzed the data and produced maps and figures. All authors jointly interpreted results and wrote the manuscript.

Conflicts of Interest

The authors declare no conflict of interest.

References

  1. Munich Re. NatCatSERVICE Database; Munich Reinsurance Company Geo Risks Research: Munich, Germany, 2014. [Google Scholar]
  2. Jongman, B.; Winsemius, H.C.; Aerts, J.C.J.H.; Coughlan de Perez, E.; van Aalst, M.K.; Kron, W.; Ward, P.J. Declining vulnerability to river floods and the global benefits of adaptation. Proc. Natl. Acad. Sci. USA 2015, 112. [Google Scholar] [CrossRef] [PubMed]
  3. The United Nations Office for Disaster Risk Reduction (UNISDR). Global Assessment Report on disaster risk reduction 2015: Making Development Sustainable: The Future of Disaster Risk Management; The United Nations Office for Disaster Risk Reduction: Geneva, Switzerland, 2015. [Google Scholar]
  4. International Federation of Red Cross and Red Crescent Societies (IFRC). Emergency Appeal: Malawi Floods 2015; International Federation of Red Cross and Red Crescent Societies (IFRC): Geneva, Switzerland, 2015. [Google Scholar]
  5. Kellett, J.; Caravani, A. Financing Disaster Risk Reduction: A 20 Year Story of International Aid; Global Facility for Disaster Reduction and Recovery (GFDRR): Washington, DC, USA, 2013. [Google Scholar]
  6. Coughlan de Perez, E.; Monasso, F.; van Aalst, M.; Suarez, P. Science to prevent disasters. Nat. Geosci. 2014, 7, 78–79. [Google Scholar] [CrossRef]
  7. Zhang, D.; Zhou, L.; Nunamaker, J.F., Jr. A knowledge management framework for the support of decision making in humanitarian assistance/disaster relief. Knowl. Inf. Syst. 2002, 4, 370–385. [Google Scholar] [CrossRef]
  8. Asplund, M.; Nadjm-Tehrani, S.; Sigholm, J. Emerging information infrastructures: Cooperation in disasters. In Critical Information Infrastructure Security; Setola, R., Geretshuber, S., Eds.; Springer: Berlin, Germany, 2009; pp. 258–270. [Google Scholar]
  9. Meier, P. Digital Humanitarians: How Big Data Is Changing the Face of Humanitarian Response; Taylor and Francis Press: Abingdon, UK, 2015. [Google Scholar]
  10. NASA NRT. Global Flood Mapping. Available online: http://oas.gsfc.nasa.gov/floodmap/ (accessed on 13 Junuary 2015).
  11. Brakenridge, R.; Anderson, E. MODIS-based flood detection, mapping and measurement: The potential for operational hydrological applications. In Transboundary Floods: Reducing Risks Through Flood Management; Marsalek, J., Stancalie, G., Balint, G., Eds.; Springer: Rotterdam, The Netherlands, 2006; pp. 1–12. [Google Scholar]
  12. De Groeve, T.; Riva, P. Global real-time detection of major floods using passive microwave remote sensing. In Proceedings of the 33rd International Symposium on Remote Sensing of Environment, Stresa, Italy, 4–8 May 2009.
  13. Memon, A.A.; Muhammad, S.; Rahman, S.; Haq, M. Flood monitoring and damage assessment using water indices: A case study of Pakistan flood-2012. Egypt. J. Remote Sens. Sp. Sci. 2015, 18, 99–106. [Google Scholar] [CrossRef]
  14. European Commission Humanitarian Aid & Civil Protection ERCC Portal. Available online: http://erccportal.jrc.ec.europa.eu/Maps/Daily-maps# (accessed on 18 August 2015).
  15. Ao, J.; Zhang, P.; Cao, Y. Estimating the locations of emergency events from Twitter streams. Procedia Comput. Sci. 2014, 31, 731–739. [Google Scholar] [CrossRef]
  16. Abdelhaq, H.; Gertz, M. On the locality of keywords in Twitter streams. In Proceedings of the 5th ACM SIGSPATIAL International Workshop on GeoStreaming, Dallas, TX, USA, 4 November 2014.
  17. Leetaru, K.H.; Perkins, T.K.; Rewerts, C. Fulltext geocoding versus spatial metadata for large text archives: Towards a geographically enriched wikipedia. D-Lib Mag. 2012, 18. [Google Scholar] [CrossRef]
  18. Muralidharan, S.; Rasmussen, L.; Patterson, D.; Shin, J.H. Hope for Haiti: An analysis of Facebook and Twitter usage during the earthquake relief efforts. Public Relat. Rev. 2011, 37, 175–177. [Google Scholar] [CrossRef]
  19. Goodchild, M.F.; Glennon, J.A. Crowdsourcing geographic information for disaster response: A research frontier. Int. J. Digit. Earth 2010, 3, 231–241. [Google Scholar] [CrossRef]
  20. Earle, P.; Guy, M.; Buckmaster, R.; Ostrum, C.; Horvath, S.; Vaughan, A. OMG earthquake! Can Twitter improve earthquake response? Seismol. Res. Lett. 2010, 81, 246–251. [Google Scholar] [CrossRef]
  21. Vieweg, S.; Hughes, A.L.; Starbird, K.; Palen, L. Microblogging during two natural hazards events: What Twitter may contribute to situational awareness. In Proceedings of the 2010 ACM Conference on Human Factors in Computing Systems, Atlanta, GA, USA, 10–15 April 2010.
  22. Muller, C.L.; Chapman, L.; Johnston, S.; Kidd, C.; Illingworth, S.; Foody, G.; Overeem, A.; Leigh, R.R. Crowdsourcing for climate and atmospheric sciences: Current status and future potential. Int. J. Climatol. 2015, 35, 3185–3203. [Google Scholar] [CrossRef]
  23. Muller, C.L. Mapping snow depth across the West Midlands using social media-generated data. Weather 2013, 68, 82. [Google Scholar] [CrossRef]
  24. Takahashi, B.; Tandoc, E.C.; Carmichael, C. Communicating on Twitter during a disaster: An analysis of Tweets during Typhoon Haiyan in the Philippines. Comput. Hum. Behav. 2015, 50, 392–398. [Google Scholar] [CrossRef]
  25. Neubaum, G.; Rösner, L.; Rosenthal-von der Pütten, A.M.; Krämer, N.C. Psychosocial functions of social media usage in a disaster situation: A multi-methodological approach. Comput. Hum. Behav. 2014, 34, 28–38. [Google Scholar] [CrossRef]
  26. Monsoon Weather Situation Report 2014; North Dakota Medical Association (NDMA): Islamabad, Pakistan, 2014.
  27. Pakistan Floods 2014: Recovery Needs Assessment and Action Framework 2014–2016. Available online: http://www.ndma.gov.pk/new/Documents/Recovery_Needs_Assessment.pdf (accessed on 26 June 2015).
  28. Wu, H.; Adler, R.F.; Tian, Y.; Huffman, G.J.; Li, H.; Wang, J. Real-time global flood estimation using satellite-based precipitation and a coupled land surface and routing model. Water Resour. Res. 2014, 50, 2693–2717. [Google Scholar] [CrossRef]
  29. FloodTags. Available online: https://www.floodtags.com/ (accessed on 8 September 2015).
  30. Hahmann, S.; Purves, R.; Burghardt, D. Twitter location (sometimes) matters: Exploring the relationship between georeferenced tweet content and nearby feature classes. J. Spat. Inf. Sci. 2014, 2014, 1–36. [Google Scholar] [CrossRef]
  31. Leetaru, K.; Wang, S.; Cao, G.; Padmanabhan, A.; Shook, E. Mapping the global Twitter heartbeat: The geography of Twitter. First Monday 2013, 18. [Google Scholar] [CrossRef]
  32. 30 m Internet Users in Pakistan, Half on Mobile: Report. Available online: http://tribune.com.pk/story/567649/30m-internet-users-in-pakistan-half-on-mobile-report/ (accessed on 21 May 2015).
  33. Guan, X.; Chen, C. Using social media data to understand and assess disasters. Nat. Hazards 2014, 74, 837–850. [Google Scholar] [CrossRef]
  34. Gove, R.; Gramsky, N.; Kirby, R.; Sefer, E.; Sopan, A.; Dunne, C.; Shneiderman, B.; Taieb-Maimon, M. NetVisia: Heat map & matrix visualization of dynamic social network statistics & content. In Proceedings of the 2011 IEEE Third International Conference on Privacy, Security, Risk and Trust and 2011 IEEE Third International Conference on Social Computing (SocialCom), Boston, MA, USA, 9–11 October 2011; pp. 19–26.
  35. Schreck, T.; Keim, D. Visual analysis of social media data. Computer 2013, 46, 68–75. [Google Scholar] [CrossRef]
  36. UN Office for the Coordination of Humanitarian Affairs. Pakistan: Humanitarian Snapshot—Floods (as of 2 Oct 2014); UN Office for the Coordination of Humanitarian Affairs: Geneva, Switzerland, 2014. [Google Scholar]
  37. Brakenridge, G.R.; Kettner, A.; Syvitski, J.; Overeem, R.; de Groeve, T.; Cohen, S.; Nghiem, S.V. River Watch 2. Satellite River Discharge and Runoff Measurements: Technical Summary; University of Colorado: Boulder, CO, USA.
  38. European Commission Joint Research Centre. Global Flood Detection System: Flood status report for Bangladesh. Available online: http://www.gdacs.org/flooddetection/monitoringregion.aspx?filter=Bangladesh (accessed on 14 September 2015).
  39. Ward, P.J.; Jongman, B.; Salamon, P.; Simpson, A.; Bates, P.; de Groeve, T.; Muis, S.; de Perez, E.C.; Rudari, R.; Trigg, M.A.; et al. Usefulness and limitations of global flood risk models. Nat. Clim. Chang. 2015, 5, 712–715. [Google Scholar] [CrossRef]
  40. Alfieri, L.; Burek, P.; Dutra, E.; Krzeminski, B.; Muraro, D.; Thielen, J.; Pappenberger, F. GloFAS-global ensemble streamflow forecasting and flood early warning. Hydrol. Earth Syst. Sci. 2013, 17, 1161–1175. [Google Scholar] [CrossRef] [Green Version]
  41. Coughlan de Perez, E.; van den Hurk, B.; van Aalst, M.K.; Jongman, B.; Klose, T.; Suarez, P. Forecast-based financing: An approach for catalyzing humanitarian action based on extreme weather and climate forecasts. Nat. Hazards Earth Syst. Sci. 2015, 15, 895–904. [Google Scholar] [CrossRef]
  42. Revilla-Romero, B.; Hirpa, F.A.; Thielen, J.; Salamon, P.; Brakenridge, G.R.; Pappenberger, F.; de Groeve, T. Evaluation of global flood forecasting and satellite monitoring systems in data-sparse regions—A challenge. Remote Sens 2015. under review. [Google Scholar]
  43. Di Baldassarre, G.; Schumann, G.; Bates, P.D. A technique for the calibration of hydraulic models using uncertain satellite observations of flood extent. J. Hydrol. 2009, 367, 276–282. [Google Scholar] [CrossRef]
  44. Milzow, C.; Krogh, P.E.; Bauer-Gottwein, P. Combining satellite radar altimetry, SAR surface soil moisture and GRACE total storage changes for hydrological model calibration in a large poorly gauged catchment. Hydrol. Earth Syst. Sci. 2011, 15, 1729–1743. [Google Scholar] [CrossRef]
  45. Zhang, Y.; Hong, Y.; Wang, X.; Gourley, J.J.; Gao, J.; Vergara, H.J.; Yong, B. Assimilation of passive microwave streamflow signals for improving flood forecasting: A first study in Cubango River Basin, Africa. IEEE J. Sel. Top. Appl. Earth Obs. Remote Sens. 2013, 6, 2375–2390. [Google Scholar] [CrossRef]
  46. Giustarini, L.; Matgen, P.; Hostache, R.; Montanari, M.; Plaza, D.; Pauwels, V.R. N.; de Lannoy, G.J. M.; de Keyser, R.; Pfister, L.; Hoffmann, L.; et al. Assimilating SAR-derived water level data into a hydraulic model: A case study. Hydrol. Earth Syst. Sci. 2011, 15, 2349–2365. [Google Scholar] [CrossRef] [Green Version]
  47. Van Laere, O.; Schockaert, S.; Dhoedt, B. Georeferencing Flickr resources based on textual meta-data. Inf. Sci. 2013, 238, 52–74. [Google Scholar] [CrossRef] [Green Version]
  48. Dunkel, A. Visualizing the perceived environment using crowdsourced photo geodata. Landsc. Urban. Plan. 2015, 142, 173–186. [Google Scholar] [CrossRef]
  49. Hürriyetoğlu, A. Tweet stream analysis for flood time estimation. In Proceedings of the 25th Meeting of Computational Linguistics in the Netherlands, Antwerp, Belgium, 5–6 February 2015.
  50. Galton, F. Vox Populi (The wisdom of the crowds). Nature 1949, 75, 450–451. [Google Scholar] [CrossRef]
  51. Van Aalst, M.K.; Cannon, T.; Burton, I. Community level adaptation to climate change: The potential role of participatory community risk assessment. Glob. Environ. Chang. 2008, 18, 165–179. [Google Scholar] [CrossRef]

