Article

An Improved PDR/Magnetometer/Floor Map Integration Algorithm for Ubiquitous Positioning Using the Adaptive Unscented Kalman Filter

1
School of Environmental Science and Spatial Informatics, China University of Mining and Technology, Xuzhou 221116, China
2
School of Mathematical and Geospatial Sciences, Royal Melbourne Institute of Technology University, Melbourne, Vic 3001, Australia
3
School of Computer Science and Technology, China University of Mining and Technology, Xuzhou 221116, China
4
Chemical Engineering Institute, China University of Mining and Technology, Xuzhou 221116, China
*
Author to whom correspondence should be addressed.
ISPRS Int. J. Geo-Inf. 2015, 4(4), 2638-2659; https://0-doi-org.brum.beds.ac.uk/10.3390/ijgi4042638
Submission received: 25 August 2015 / Accepted: 17 September 2015 / Published: 25 November 2015

Abstract

:
In this paper, a scheme is presented for fusing a foot-mounted Inertial Measurement Unit (IMU) and a floor map to provide ubiquitous positioning in a number of settings, such as in a supermarket as a shopping guide, in a fire emergency service for navigation, or with a hospital patient to be tracked. First, several Zero-Velocity Detection (ZDET) algorithms are compared and discussed when used in the static detection of a pedestrian. By introducing information on the Zero Velocity of the pedestrian, fused with a magnetometer measurement, an improved Pedestrian Dead Reckoning (PDR) model is developed to constrain the accumulating errors associated with the PDR positioning. Second, a Correlation Matching Algorithm based on map projection (CMAP) is presented, and a zone division of a floor map is demonstrated for fusion of the PDR algorithm. Finally, in order to use the dynamic characteristics of a pedestrian’s trajectory, the Adaptive Unscented Kalman Filter (A-UKF) is applied to tightly integrate the IMU, magnetometers and floor map for ubiquitous positioning. The results of a field experiment performed on the fourth floor of the School of Environmental Science and Spatial Informatics (SESSI) building on the China University of Mining and Technology (CUMT) campus confirm that the proposed scheme can reliably achieve meter-level positioning.

Graphical Abstract

1. Introduction

Pedestrian Dead Reckoning (PDR) [1,2] is a priority technique for the first responder ubiquitous positioning system. Several positioning algorithms have been developed over the past ten years.
The basic PDR model involves three components: step detection, step length estimation and heading angle estimation [3,4]. Acceleration measurements are an ideal choice for step detection because of the periodicity of a pedestrian’s walking pattern. They require little or no infrastructure for pre-installation in buildings, but without an external reference, errors quickly accrue [5].
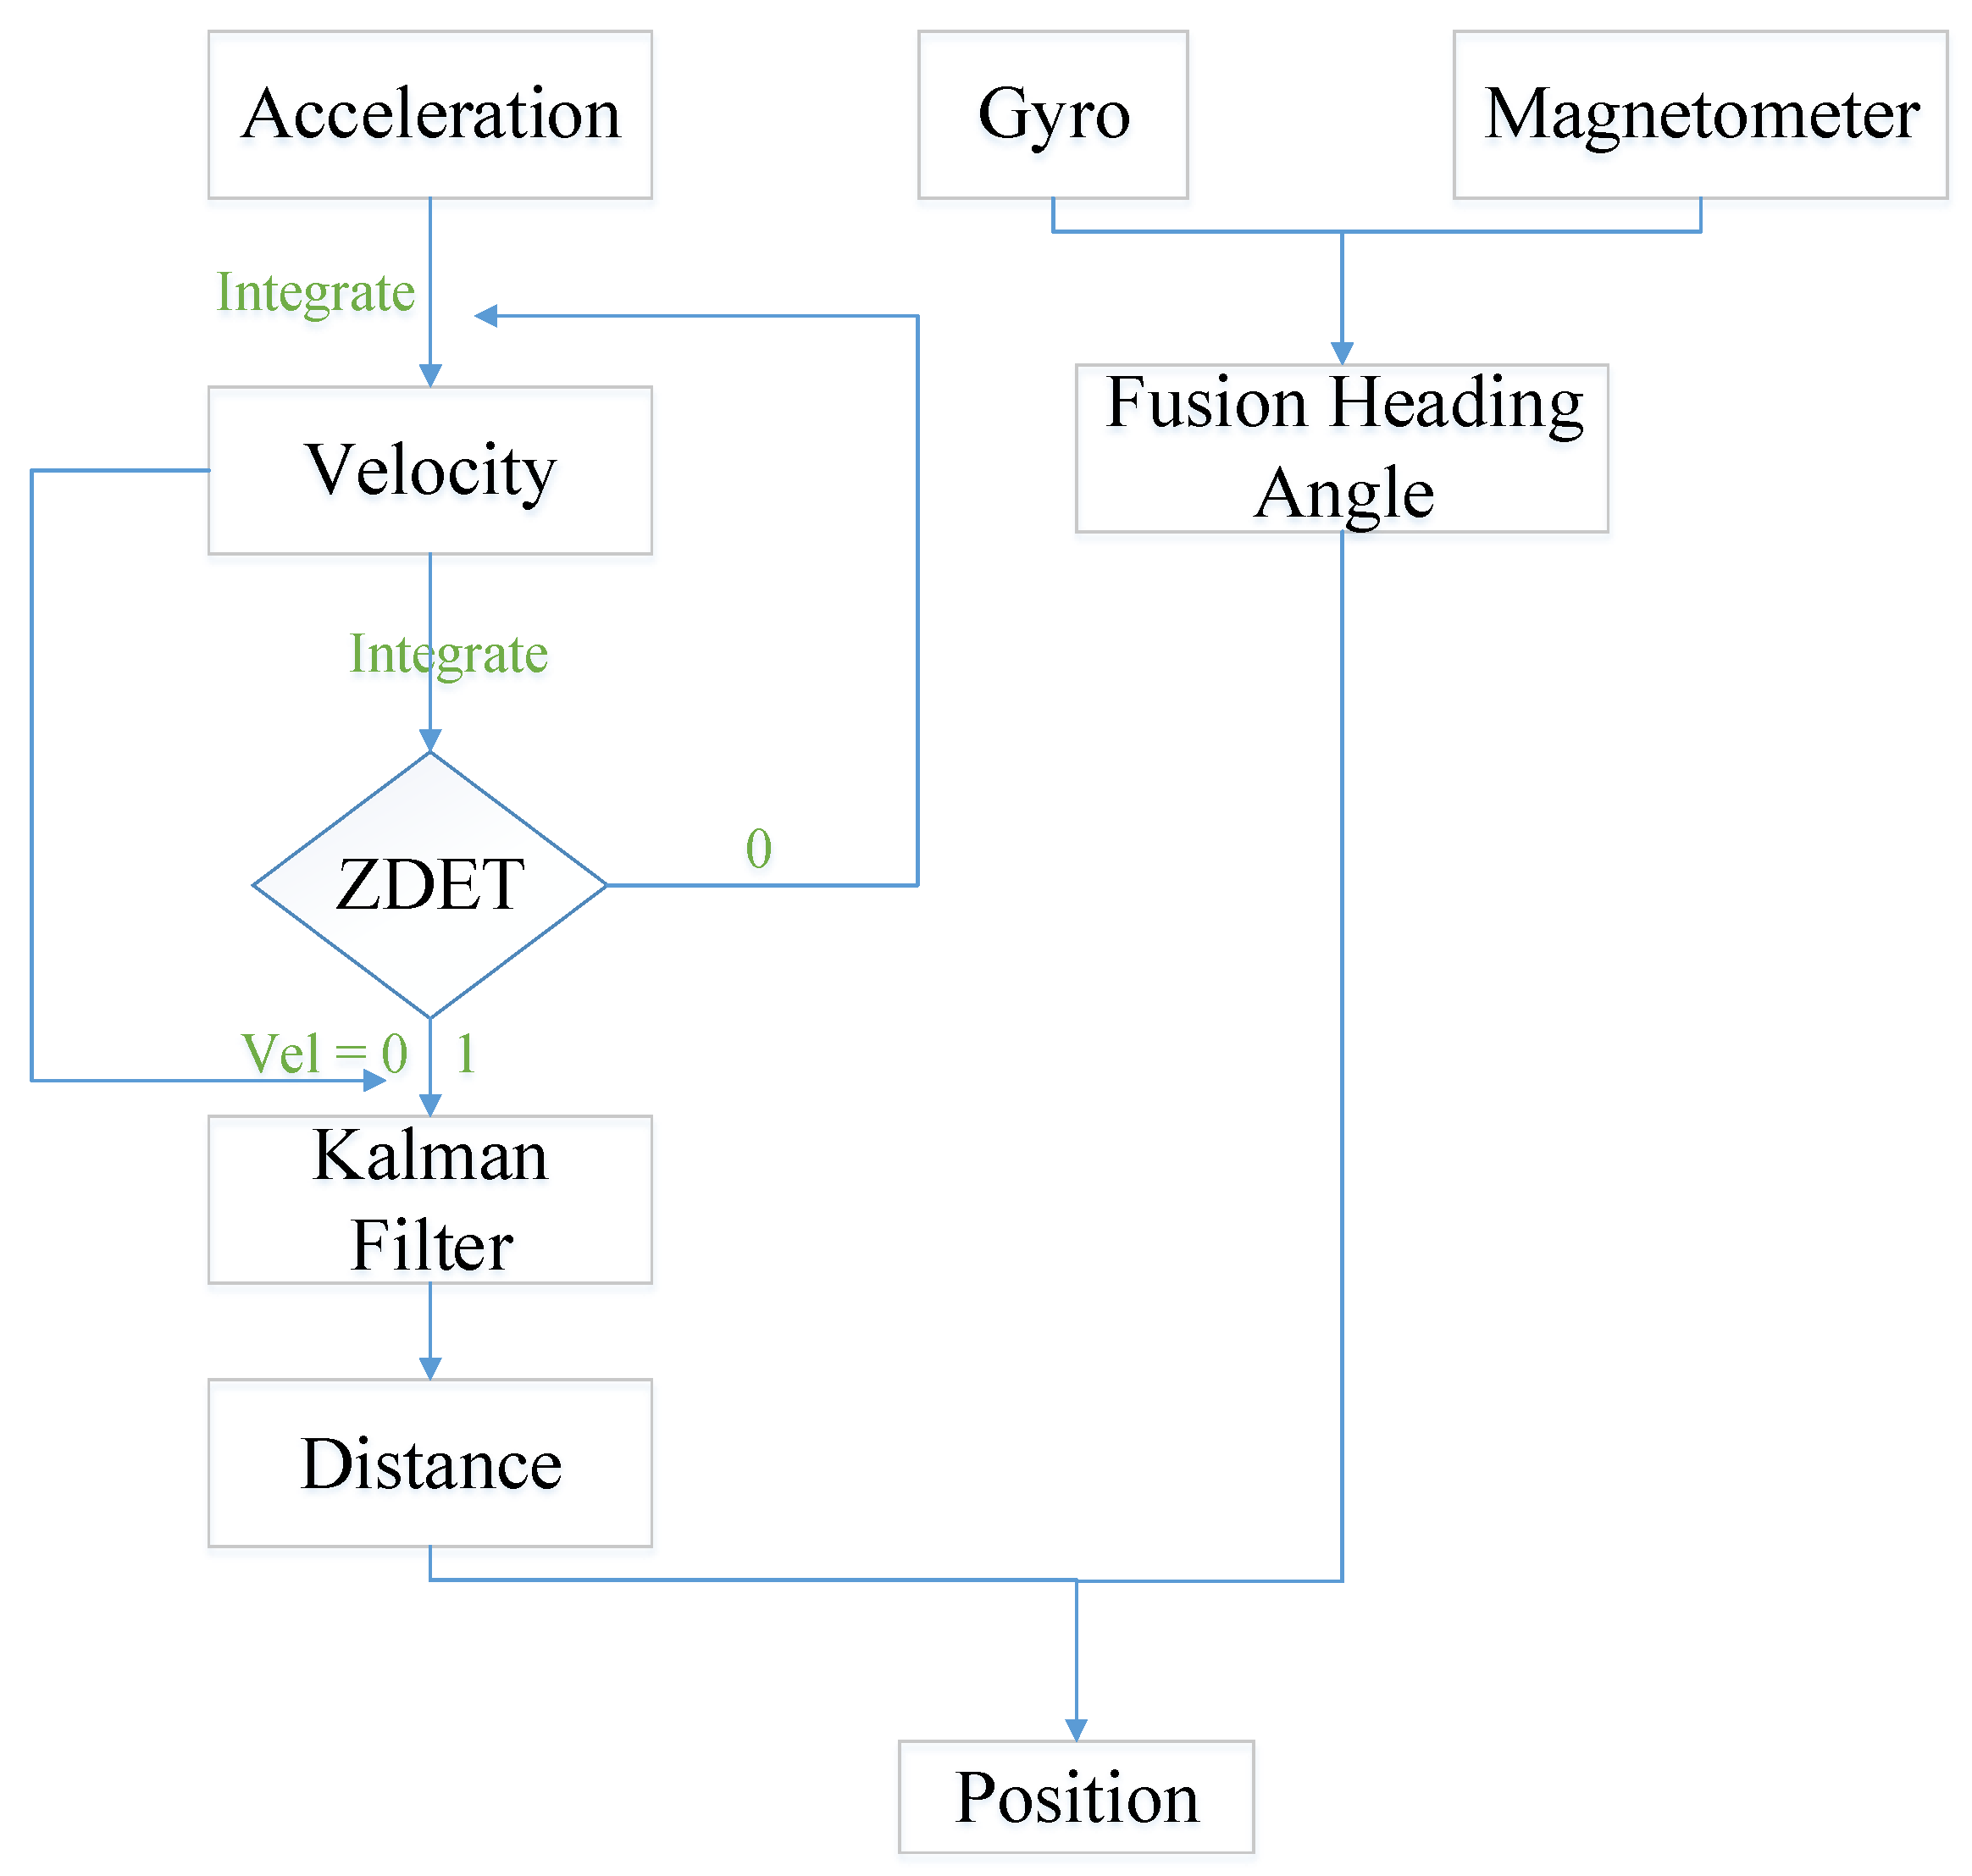
In a standard PDR algorithm, the step number and length are detected using the threshold for vertical acceleration, and the accuracy of the results is not as good as that of the estimates. In practice, while walking, the velocity of one foot should be zero when it is settled down. Therefore, considering the different walking patterns of different users, the Zero-velocity information, which can improve the position result, can be used to detect the step and calculate the step length.
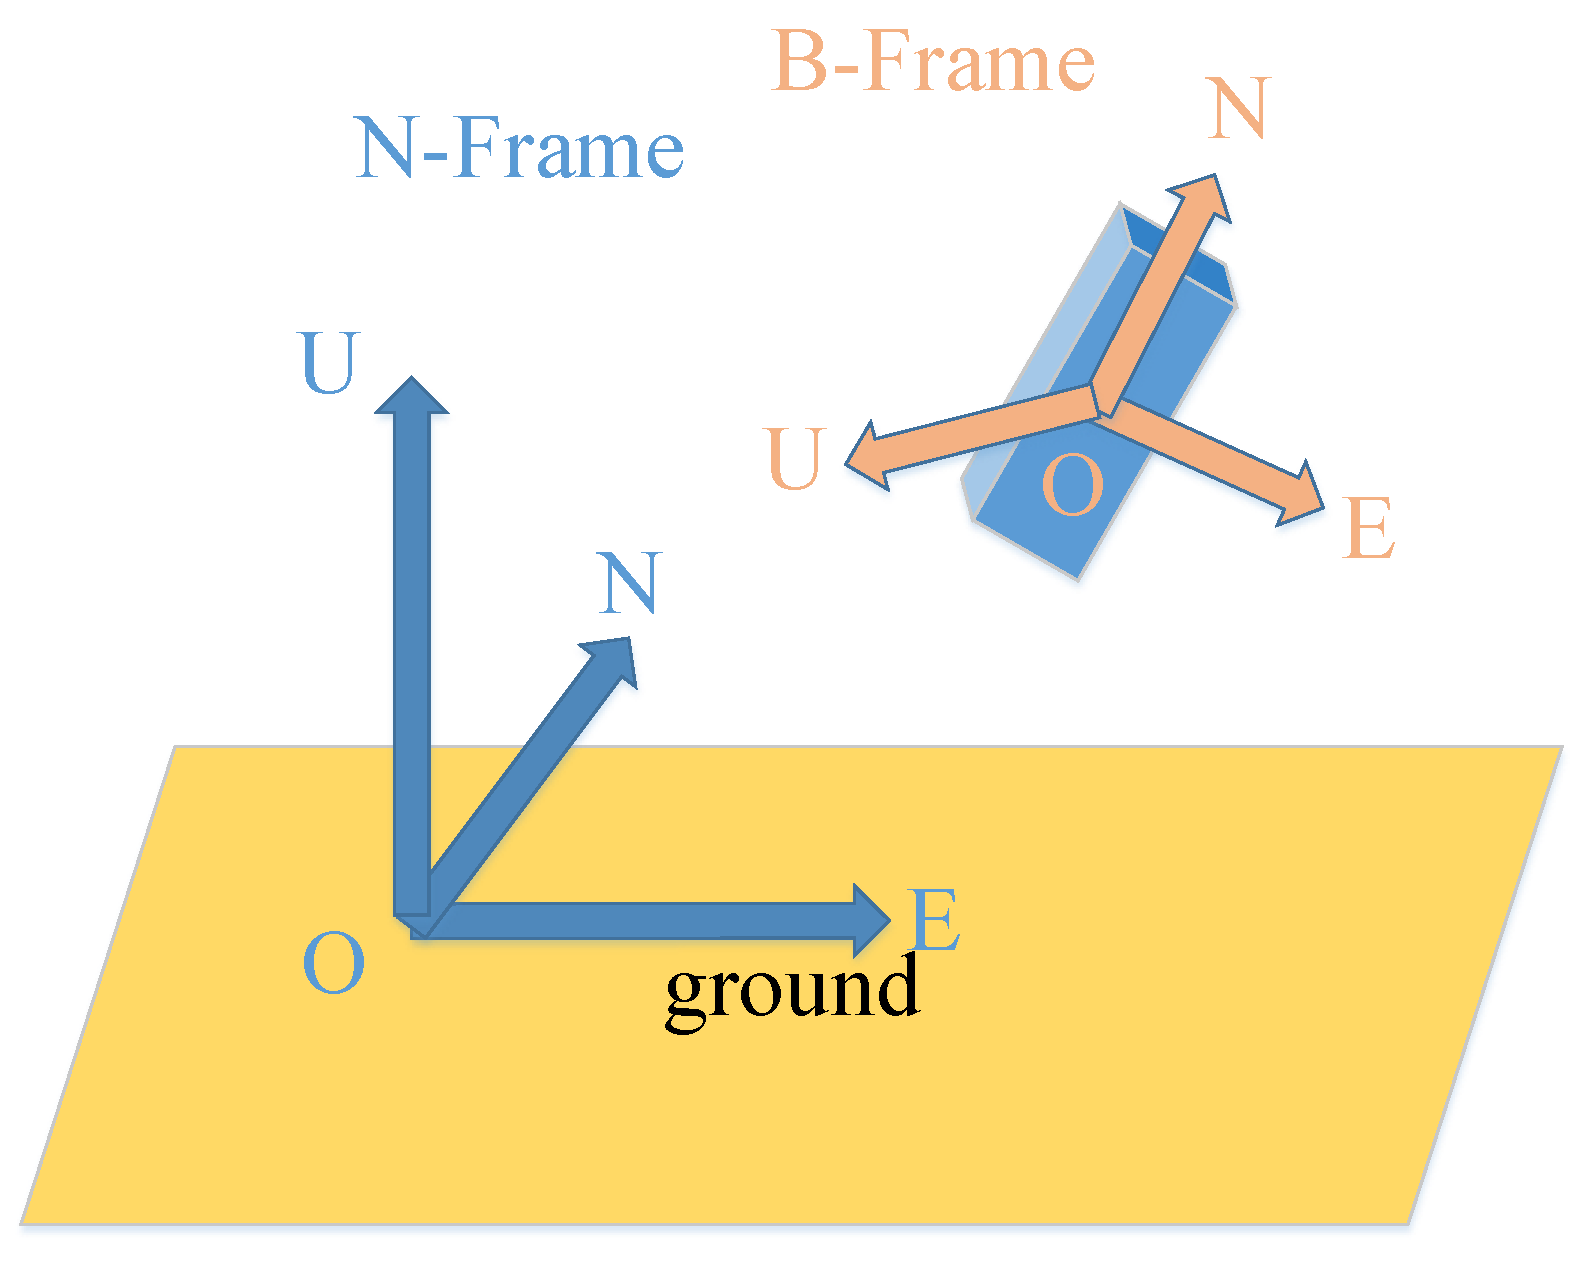
Meanwhile, orientation determination is also an essential issue for the PDR algorithm that requires attention because the sensor is unlikely to be axis-aligned. It continuously rotates with respect to the Navigation frame (N-frame) during the walking cycle. We must, therefore, track the rotation of the sensor by using the angular velocities provided by the gyroscopes and the magnetic field strength (MFS) from the magnetometer. However, both have their associated limitations.
Moreover, as we know, measurement errors are inevitably present within the sensor data, and a triple integration results in a potentially cubic growth in time (drift). Taking the drift into account has implications on regularly closing the integration loop by applying external constraints to the system. The most widespread PDR constraint is provided by Zero Velocity Updates (ZUPTs) [6,7,8], which is also used in this paper [9].
Hence, floor map information is important for this kind of research. To overcome the constraints we elaborated on before, a floor map can be used to further calibrate the bias and correct for unreasonable positioning results, keeping the walking trace under control. It works by rectifying the weight of the position information or correcting the heading angle, among others. For example, combining gyroscope measurements with the use of a floor map allows the orientation to be corrected using only map aids [10,11], and large heading errors are eliminated via long-range geometrical constraints exploited by Particle Filters (PFs) [2,11,12]. Unfortunately, the large number of particles makes such algorithms unrealistic in terms of real-time operations. Hence, the unscented Kalman filter, which requires a limited number of particles (2n+1, where n denotes the dimension of the state vector) and still confers the advantage of a Kalman filter, has been chosen for this study.
In addition, it is also well recognized that there exist many surveys on various positioning systems in the literature such as WiFi [13,14], UWB [15,16], RFID [17,18], Zigbee [19,20], and Image-Based Location (IBL) [21,22], among others. However, most of them require a fundamental facility to support their detection. In this paper, zero-velocity is detected and used to develop an improved PDR model, and thereafter, it is used to fuse floor map topology to provide a more accurate position without any other hardware preparation.
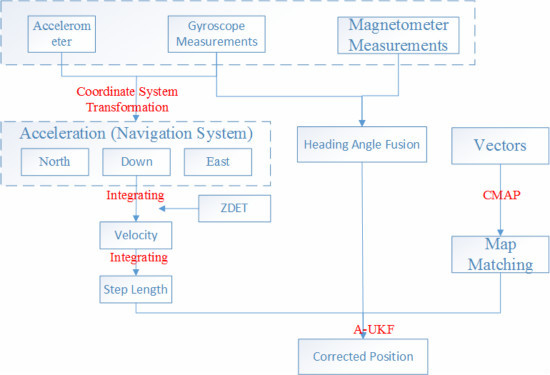
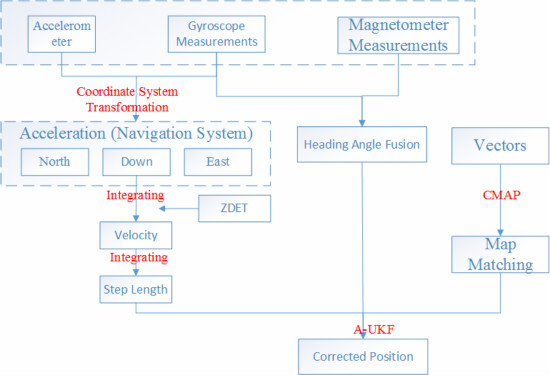
In this paper, a scheme for indoor positioning by fusing the floor map and sensor data to obtain a real-time hybrid indoor navigation result is presented. Compared with the existing technology, integrating the zero-velocity detection method and high sampling frequency could improve the accuracy and sensitivity of step detection and step length estimation to some extent. Moreover, an adaptive unscented Kalman filter (A-UKF) is presented to fuse the map information with the improved PDR result, as a compromise for considering both accuracy and Computational Load (CL). In Section 2, a type of zero-velocity detection method is proposed, and Section 3 proposes the basic theory for map matching used in this method. Subsequently, a fusion algorithm based on an A-UKF is demonstrated in Section 4. Then, Section 5 details the methodologies used in this study. Section 6 lists the equipment and environment for the experiments and the test designs to verify the accuracy and robustness of the idea, which is also analyzed. Finally, Section 7 concludes the paper.

2. An Improved PDR Model

2.1. Zero-Velocity Detection

The ZDET algorithm is considered the most reliable and versatile method regardless of the user and displacement patterns (walk, run, side walk, crisscross) [23]. Just as its name implies, at foot stance, the velocity is zero, while v, which is obtained by integrating the free acceleration, should be below some certain threshold δ. However, due to the measurement noise and bias of the accelerometers, de-noising has to be applied. The algorithm is elaborated below.

2.1.1. Acceleration Processing

As the acceleration measurements have noise and gross errors, a processing model is required before PDR model development.
(1)
Transform the captured accelerations. acci from the B-frame (B) is transformed into the Navigation frame (N) as the Figure 1 shows below using the rotation matrix:
a c c i N = R B N   ·   a c c i b ; then, the influence of gravity is canceled out.
(2)
Filter the acceleration at every stance event:
(a)
Compute the accelerometer magnitude: a c c _ m a g =   a c c X 2 + a c c Y 2 + a c c Z 2 , where a c c X , a c c Y and a c c Z denote the tri-axis acceleration in the navigation frame.
(b)
High-Pass (HP) filter accelerometer data. The Butterworth digital and analog filter, which is a kind of ordinary HP/LP filter, is used in this algorithm: [ b , a ] = B U T T E R ( N , W n , ' s ' ) , where N is equal to 1 and “s” equals “high”. W n must satisfy 0.0 < W n < 1.0, with 1.0 corresponding to half the sample rate.
Then, a c c _ m a g F i l t = filtfilt ( b , a , a c c _ m a g ) the transfer function is [24]:
H ( s ) = b ( 1 ) s n + b ( 2 ) s n 1 + Λ + b ( n + 1 ) s n + a ( 2 ) s n + Λ + a ( n + 1 )
Figure 1. Illustration of the two coordinate systems.
Ijgi 04 02638 g001

2.1.2. Zero-Velocity Detection (ZDET) Model

We do not have a consensus on the best model for Zero-velocity detection (ZDET) for all situations. Hence, in this experiment, four kinds of detector models, provided by Nilsson [9], have been chosen as alternative schemes. They are presented below:
(1)
Generalized likelihood ratio test (GLRT)
T = i = 1 n ( g ( i ) T * g ( i ) ε g 2 + f ( i ) T * f ( i ) ε f 2 ) n
where g ( i ) and f ( i ) represent the data on the tri-axis gyros and free acceleration, respectively, and ϵ g and ϵ f denote the standard deviation of the respective associated noise. Meanwhile, n denotes the window size of the zero-velocity detector, and T is the test statistic for the detector.
(2)
Accelerometer measurement variance test (MV)
T = i = 1 n ( a ( i ) a v g ) T * ( a ( i ) a v g ) ε f 2 n
where a ( i ) denotes the raw data on the tri-axis acceleration and a v g denotes the average value of the acceleration from 1 to n.
(3)
Accelerometer measurement magnitude test (MAG)
T = i = 1 n ( n o r m ( a ( i ) ) g r a v ) 2 ε f 2 n
where n o r m is the linearization and g r a v denotes local gravity.
(4)
Angular rate measurement energy test (ARE)
T = i = 1 n ( n o r m ( g ( i ) ) ) 2 ε f 2 n
To verify the accuracy of the four schemes, we tested them under conditions similar to our test site (with corners and lines), and the results are shown below:
As we see in Table 1, the covariance denotes the gap between the measured result and real trajectory for each step. GLRT and ARE perform much better than the other two models. We therefore choose GLRT as our ZDET model in the experiments.
Table 1. Covariance of the four Zero-Velocity Detection (ZDET) models.
TypeCovariance (m2)
GLRT0.43197
MV1.04398
MAG2.68470
ARE0.43931

2.2. Step Length Estimation

(1)
The acceleration after step detection during each step, a c c i N , is integrated to obtain the linear velocity v e l i N : v e l i N =   v e l i N + a c c i N / S a m p l e R a t e . We set the velocity to be zero when the foot is stationary [25].
(2)
We obtain the position increment at step k, Δ P k = ( Δ P k ( n o r t h ) , Δ P k ( e a s t ) , Δ P k ( u p ) ) , by integrating the corrected velocity samples, v e l i N , at every single step:
Δ P k = j = i ( k 1 ) i ( k ) v e l i N / S a m p l e R a t e
(3)
The 2D SL is computed by taking the horizontal Cartesian distance of the position increment:
S L Z U P T k = Δ P k ( n o r t h ) 2 + Δ P k ( e a s t ) 2
The step length estimation results for the respective Walking and Running models are shown in Table 2:
Table 2. Gait recognition based on the ZDET algorithm.
WalkingStep NumberAccuracy RateRunningStep NumberAccuracy Rate
150100.0%110100.0%
260100.0%220100.0%
37097.1%33096.7%
48092.5%44092.5%
59096.7%55098.0%
610096.0%66086.7%
The results demonstrate that the accuracy of Walking and Running for several tests with the same experimenter, but different steps, are above 90% and 85%, respectively (compared with ground truth), indicating that the method developed is a reliable method for indoor experiments.

2.3. Heading Determination by Fusing Gyroscope and Magnetometer Data

Heading determination is a significant component of PDR-based positioning. The heading angle ψ is defined as the angle of rotation about the Z-axis with respect to the horizon/ground, which can be estimated using a gyroscope integrated with a magnetometer as well as by a magnetic field.
First, we fuse the data from the magnetometer and gyroscope using the heading estimation algorithm presented by Wonho Kang in [21]. The fused heading angle is calculated as follows:
{ θ k = α θ k 1 + β θ m , k + γ θ g , k ,       θ Δ , c θ c , θ Δ , m θ m θ k = β θ m , k + γ θ g , k ,                     θ Δ , c θ c , θ Δ , m θ m θ k = α θ k 1 ,                                 θ Δ , c θ c , θ Δ , m θ m θ k = α θ k 1 + γ θ g , k ,                     θ Δ , c θ c , θ Δ , m θ m    θ Δ , c = | θ m , k θ g , k | θ Δ , m = | θ m , k θ m , k 1 | .
where m and n denote the magnetometer and the gyroscope, respectively, and α, β and γ are the weights of the current measurements from the gyroscope and the magnetometer. θ m , k and θ g , k denote the measurements acquired by the gyroscope and the magnetometer, respectively, for the k t h step. θ m is the standard deviation of the magnetometer, and θ c is the correlation between the magnetometer and the gyroscope readings. θ Δ , c is the difference between θ m , k and θ g , k . θ Δ , m is the difference in the magnetometer readings between two consecutive steps k and k − 1.
Figure 2. A test of heading fusion.
Ijgi 04 02638 g002
Figure 2 presents the fusion results of a test for which a person walked forward dozens of steps with a smartphone held firmly in his hand and then crossed the first corner (turn of almost 38.5 degrees). After a long corridor, the experimenter eventually turned left (turn of approximately 90 degrees) and reach the destination. The results reveal that the pseudo-heading measurements recorded by the magnetometer before and after the turn are considerably smoothed by the proposed algorithm, reducing fluctuation to a certain extent [12].

2.4. The Improved PDR

Presented below is the flow chart (Figure 3) for the improved PDR method:
Figure 3. Flow chart of the improved PDR.
Ijgi 04 02638 g003
Compared with the traditional PDR method, ZDET could render the velocity to be zero, which eliminates the residual error in the velocity.

3. Floor Map Matching Algorithm

Map matching is a kind of position-calibrated method based on software technology, which is used as a sort of pseudo-measured technology. The main idea involves comparing localization results and the passable zone in the floor map, from which the most suitable trajectory should be found. We can use the Point of Interest (POI), such as a corner, to calibrate the accumulated error. In a broad sense, map matching in Indoor Positioning can be classified into a combined application category rather than a framework model category [26].

3.1. Correlation Matching Algorithm Based on Projection (CMAP)

The CMAP is a kind of matching algorithm that involves mapping points to arcs. As shown in Figure 4 when the user’s position (Point P) exceeds the set buffer zone, by comparing the respective distances (d1, d2 and d3) between Point P and each Line (L1, L2 and L3), an optimal solution that matches the user’s position to the nearest lines instead of knots and sharp points (“nearest” here represents the shortest distance between the terminal and road) can be determined. In most situations, this strategy performs better than the point to point (P2P) method [10].
Figure 4. Demonstration of Correlation Matching Algorithm based on Projection (CMAP).
Ijgi 04 02638 g004

3.2. Zone Division

First, the base map is to be divided into several components, such as passable zones and impassable zones. The passable zone can also be divided into linear vector zones and non-linear vector zones [12].
As the width of the corridor (indoor) has a limit, the walking trace can be seen as an approximate straight line, denoted by the grey components in Figure 5, and the corners can be thought of as non-linear zones.
Figure 5. Zone division.
Ijgi 04 02638 g005

3.3. Vector Matching

When the walking trace is out of range, such as observed when running into an impassable zone, it can be rectified by CMAP to a certain extent. Moreover, the POI can be evaluated using the accumulated gyroscope data, as shown in Figure 6. When we turn a corner, the valley of accumulated data may be under a certain limit (10 rad in this instance).
Figure 6. Accumulated gyroscope data.
Ijgi 04 02638 g006
The method for floor map matching (Figure 7) is shown below:
Figure 7. The flow of map matching.
Ijgi 04 02638 g007

4. Adaptive Unscented Kalman Filter (A-UKF)

Despite the better accuracy of the approaches described above, the absolute heading angle obtained using pre-process formula (5) may exhibit unpredictable errors, which could be eliminated by map matching (CMAP) to a certain extent. Considering the combination of the above methods and the non-linearized features of the observation equation, the Unscented Kalman Filter may be a suitable method to use [27,28,29].

4.1. Dynamic Equation

The system state is estimated using recursive UKF equations, and the state equation is
X k = ( N k E k θ k ) = ( N k 1 + s ˜ cos θ k 1 E k 1 + s ˜ sin θ k 1 θ k 1 + θ ˜ ) + W k 1
where N k and E k are the position states in the northern direction and the eastern direction, respectively, at time k; θ k denotes the heading angle of the pedestrian; s ˜ and θ ˜ denote the step length and angle velocity, respectively; and Wk−1 is the system noise at time k − 1.

4.2. Observation Equation

The observation equation for the integrated step length based on AHRS, the heading angle and orientation measurements can be written as follows:
  Z k = [ s k Δ θ k θ k ] = [ ( x k x k 1 ) 2 + ( y k y k 1 ) 2 θ k θ k 1 θ k ] + V   
where s k is the step length calculated using velocity increments of two consecutive steps and Δ θ k is the heading angle variable determined by CMAP, including corners and galleries. θ k is the kth heading angle measured by formula (5), and V is the measurement noise vector.

4.3. A-UKF Algorithm

If the dynamic model of the system is abnormal, the variance of the dynamic model has to be adjusted to control the parameter estimation. Based on an Unscented Kalman filter (UKF) and the adaptive filtering algorithm, using the UKF algorithm for importance sampling, the sampling variance and mean value can be calculated by establishing the adaptive factor and real-time adjustment of the sampling variance, thereby weakening the error state model [30].
The steps for calculating the adaptive state parameter variance, which is different from ordinary UKF, is as follows:
(1)
Adaptive parameter
The distinguishing statistic of the adaptive factor is the discrepancy of the state. X ¯ k | k 1 denotes the state forecasting value, x ˜ k denotes the robust state solution, and V ¯ k denotes the difference between the state forecasting value and robust solution. When V ¯ k reaches a certain limit, the system is considered to be in an abnormal state [31].
V ¯ k = x ¯ k | k 1 x ˜ k
Δ V ¯ k = V ¯ k t r ( P V ¯ k )
where tr(·) denotes the trace formula. The form of the adaptive factor function is:
γ k = { 1 | Δ V ¯ k | c c | Δ V ¯ k | | Δ V ¯ k | > c
where C is constant and ranges in value between 0.85 and 1.
(2)
Calculating the adaptive filter equivalent variance
P ¯ v v = ( P v v P v k ) / γ k + P v k
K ¯ k = P x v P v v ¯ / γ k
P k = P k | k 1 / γ k K ¯ k P v v K ¯ k T
where P k | k 1 denotes the variance of the Predictive Sample Point (PSP) and P v v and P x v represent the variance and covariance of the Predictive Measurement Point (PMP), respectively.
The flowchart is shown below in Figure 8:
Figure 8. Flowchart of the filter process.
Ijgi 04 02638 g008

4.4. Adaptive Factor Test

To verify the effectiveness of the adaptive factor, an experiment was designed for proving the effect of A-UKF. The route in the SESSI building is shown below in Figure 9:
Figure 9. Test Route in the School of Environmental Science and Spatial Informatics (SESSI) Building.
Ijgi 04 02638 g009
Moreover, three artificial error points are added into the data for each linear corridor in the route (approximately 60 steps, 126 steps and 219 steps), and the results are shown below:
Figure 10. The results of the test: (a) estimated position based on Unscented Kalman Filter (UKF) and A-UKF and (b) variance of the adaptive parameter.
Ijgi 04 02638 g010
As we can see in Figure 10a, the A-UKF trace is much closer to the real trace than the classic UKF trace, and it eliminates the influence of artificial error more rapidly. In addition, from Figure 10b, we see that when a gross error appears, the adaptive factor will rectify it, as does the two corners method, but with much less fluctuation, which means that the corners may cause some error that is still smaller than the gross error, which is also corrected.

5. An Improved PDR/Magnetometer/Floor Map Integration Scheme

In summary, the methodologies used are described below:
(1)
Theoretical analysis. A series of basic studies have been analyzed. As mentioned in the introduction, recent PDR systems are becoming a feasible option for indoor localization due to the continual miniaturization of inertial sensors (Inertial Management Unit and Attitude Heading Reference System). Moreover, based on the three main components of PDR (step detection, step length estimation and orientation determination), we select the ZDET algorithm, an unusual but accurate algorithm, to detect the step. Then, during every step, a continuous integration algorithm is used to determine the distance with the acceleration, which is recorded from the accelerometer and transformed to N-frame coordinates. Moreover, the determination of orientation should be the most essential step. We therefore use a hybrid filter to fuse the data, provided by the AHRS system, to guarantee the stability and precision of the orientation.
(2)
Integration Methodology Development. In the experiment, several filters are tested, such as the Extended Kalman Filter, Unscented Kalman Filter, Particle Filter, and others. Considering various factors, including Measuring Accuracy (MA) and Computational Load (CL), we eventually choose one kind of adaptive unscented Kalman filter (A-UKF) as the fusion algorithm.
(3)
Physical System Implementation and Tests. A specific flowchart is shown in Figure 11:
Figure 11. The general flowchart.
Ijgi 04 02638 g011

6. Experiment and Analysis

6.1. Equipment and Situation

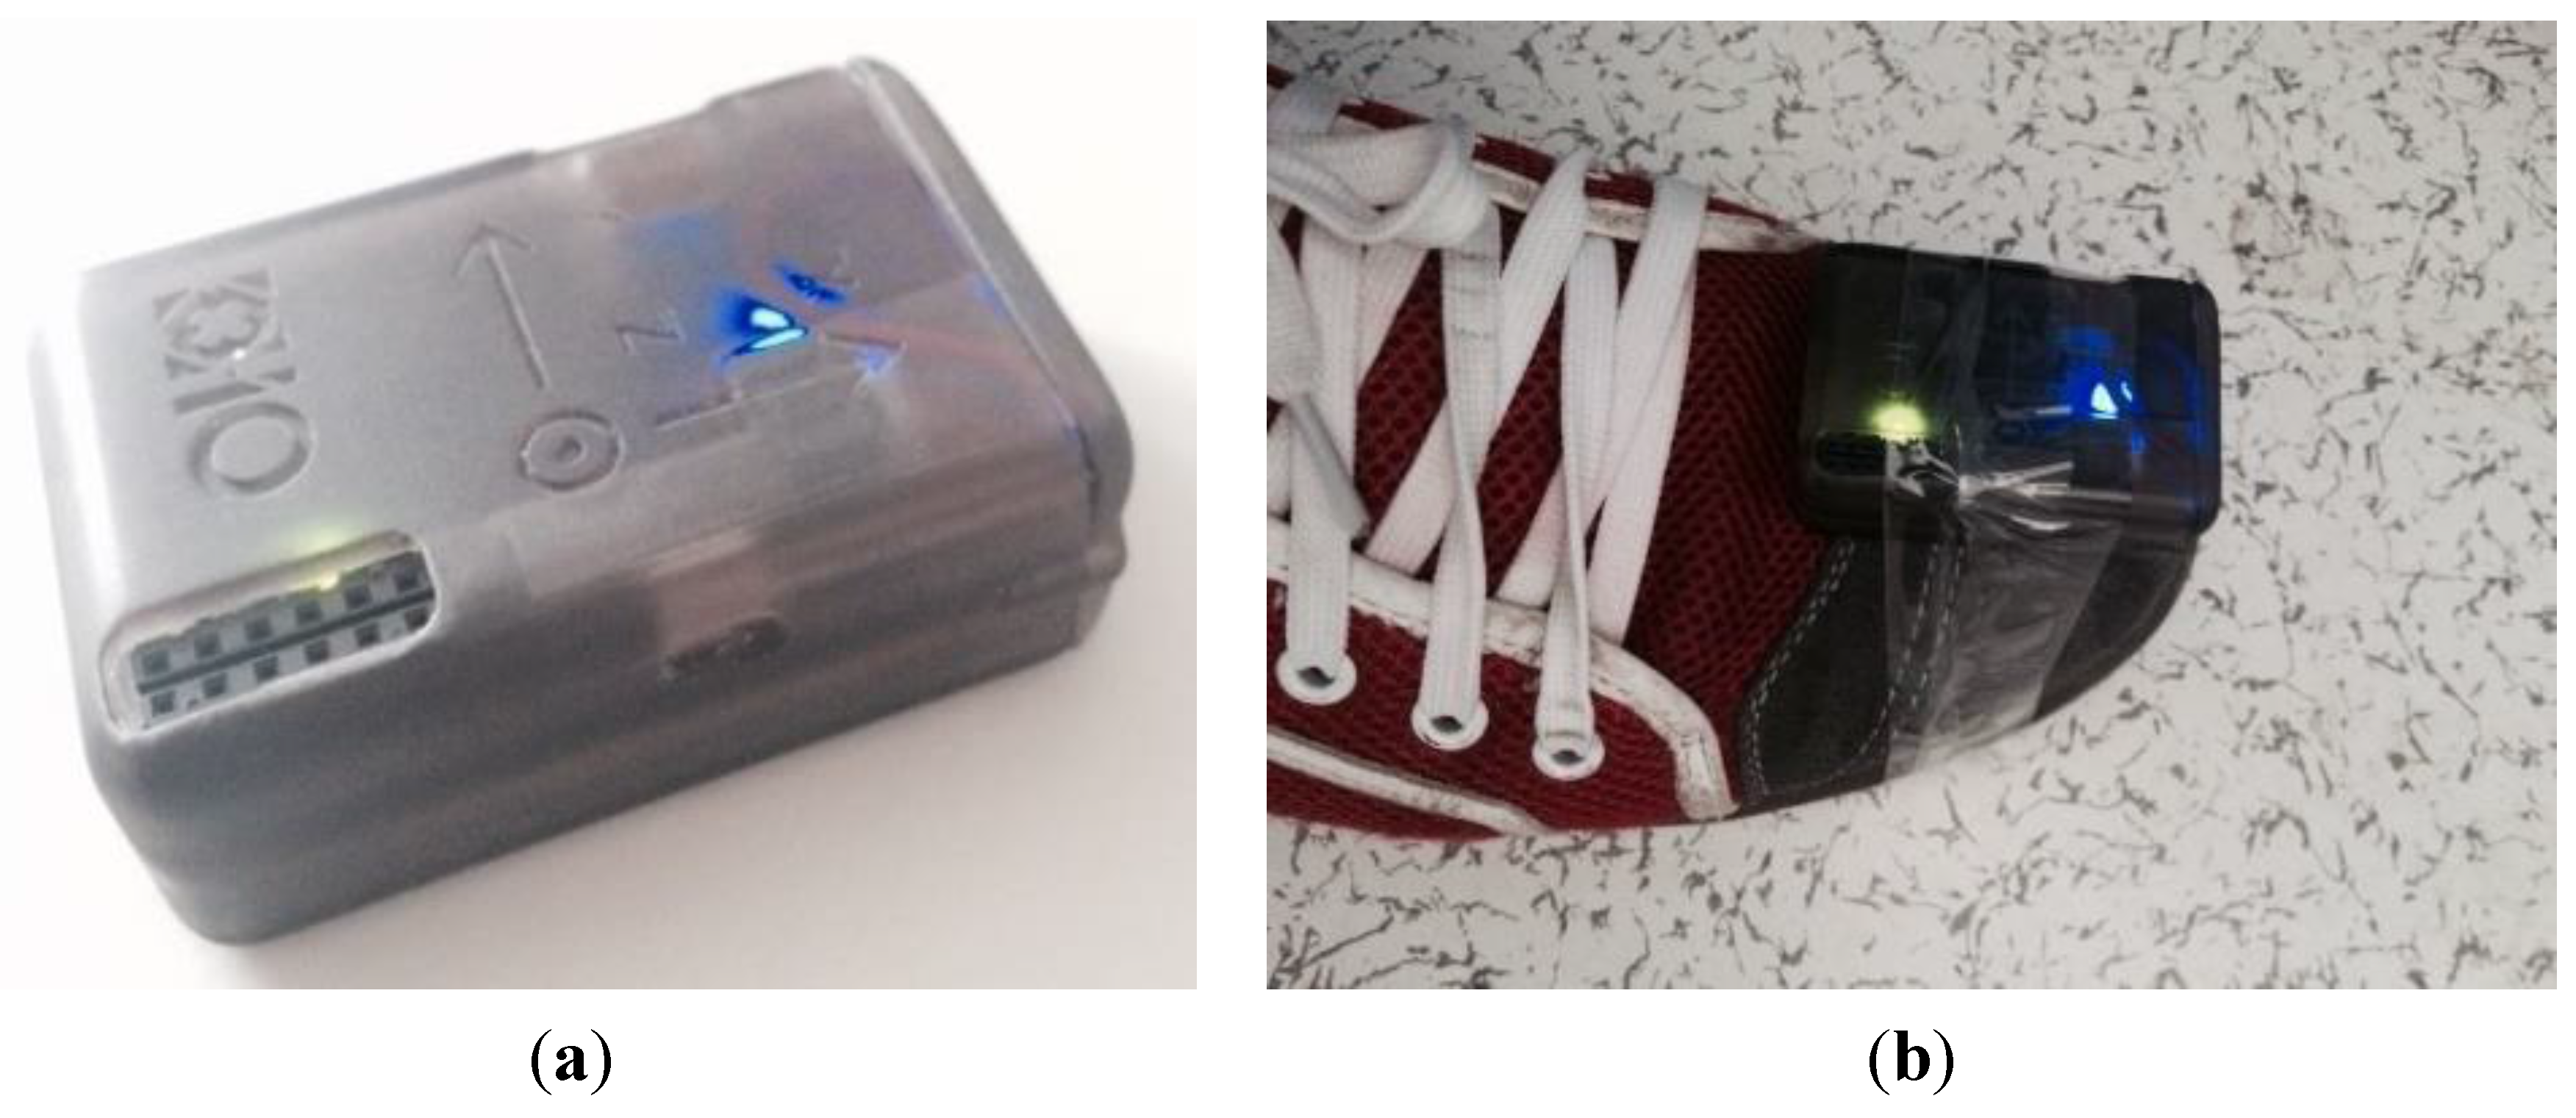
We use a commercially available Inertial Measurement Unit, x-IMU, from x-io Technologies in UK. Figure 12 shows this sensor. It is 55 × 35 × 18 mm (L × W × H) in size and almost 50 g in weight.
Figure 12. Photos of the equipment and their usage: (a) the x-IMU and (b) foot-mount installation.
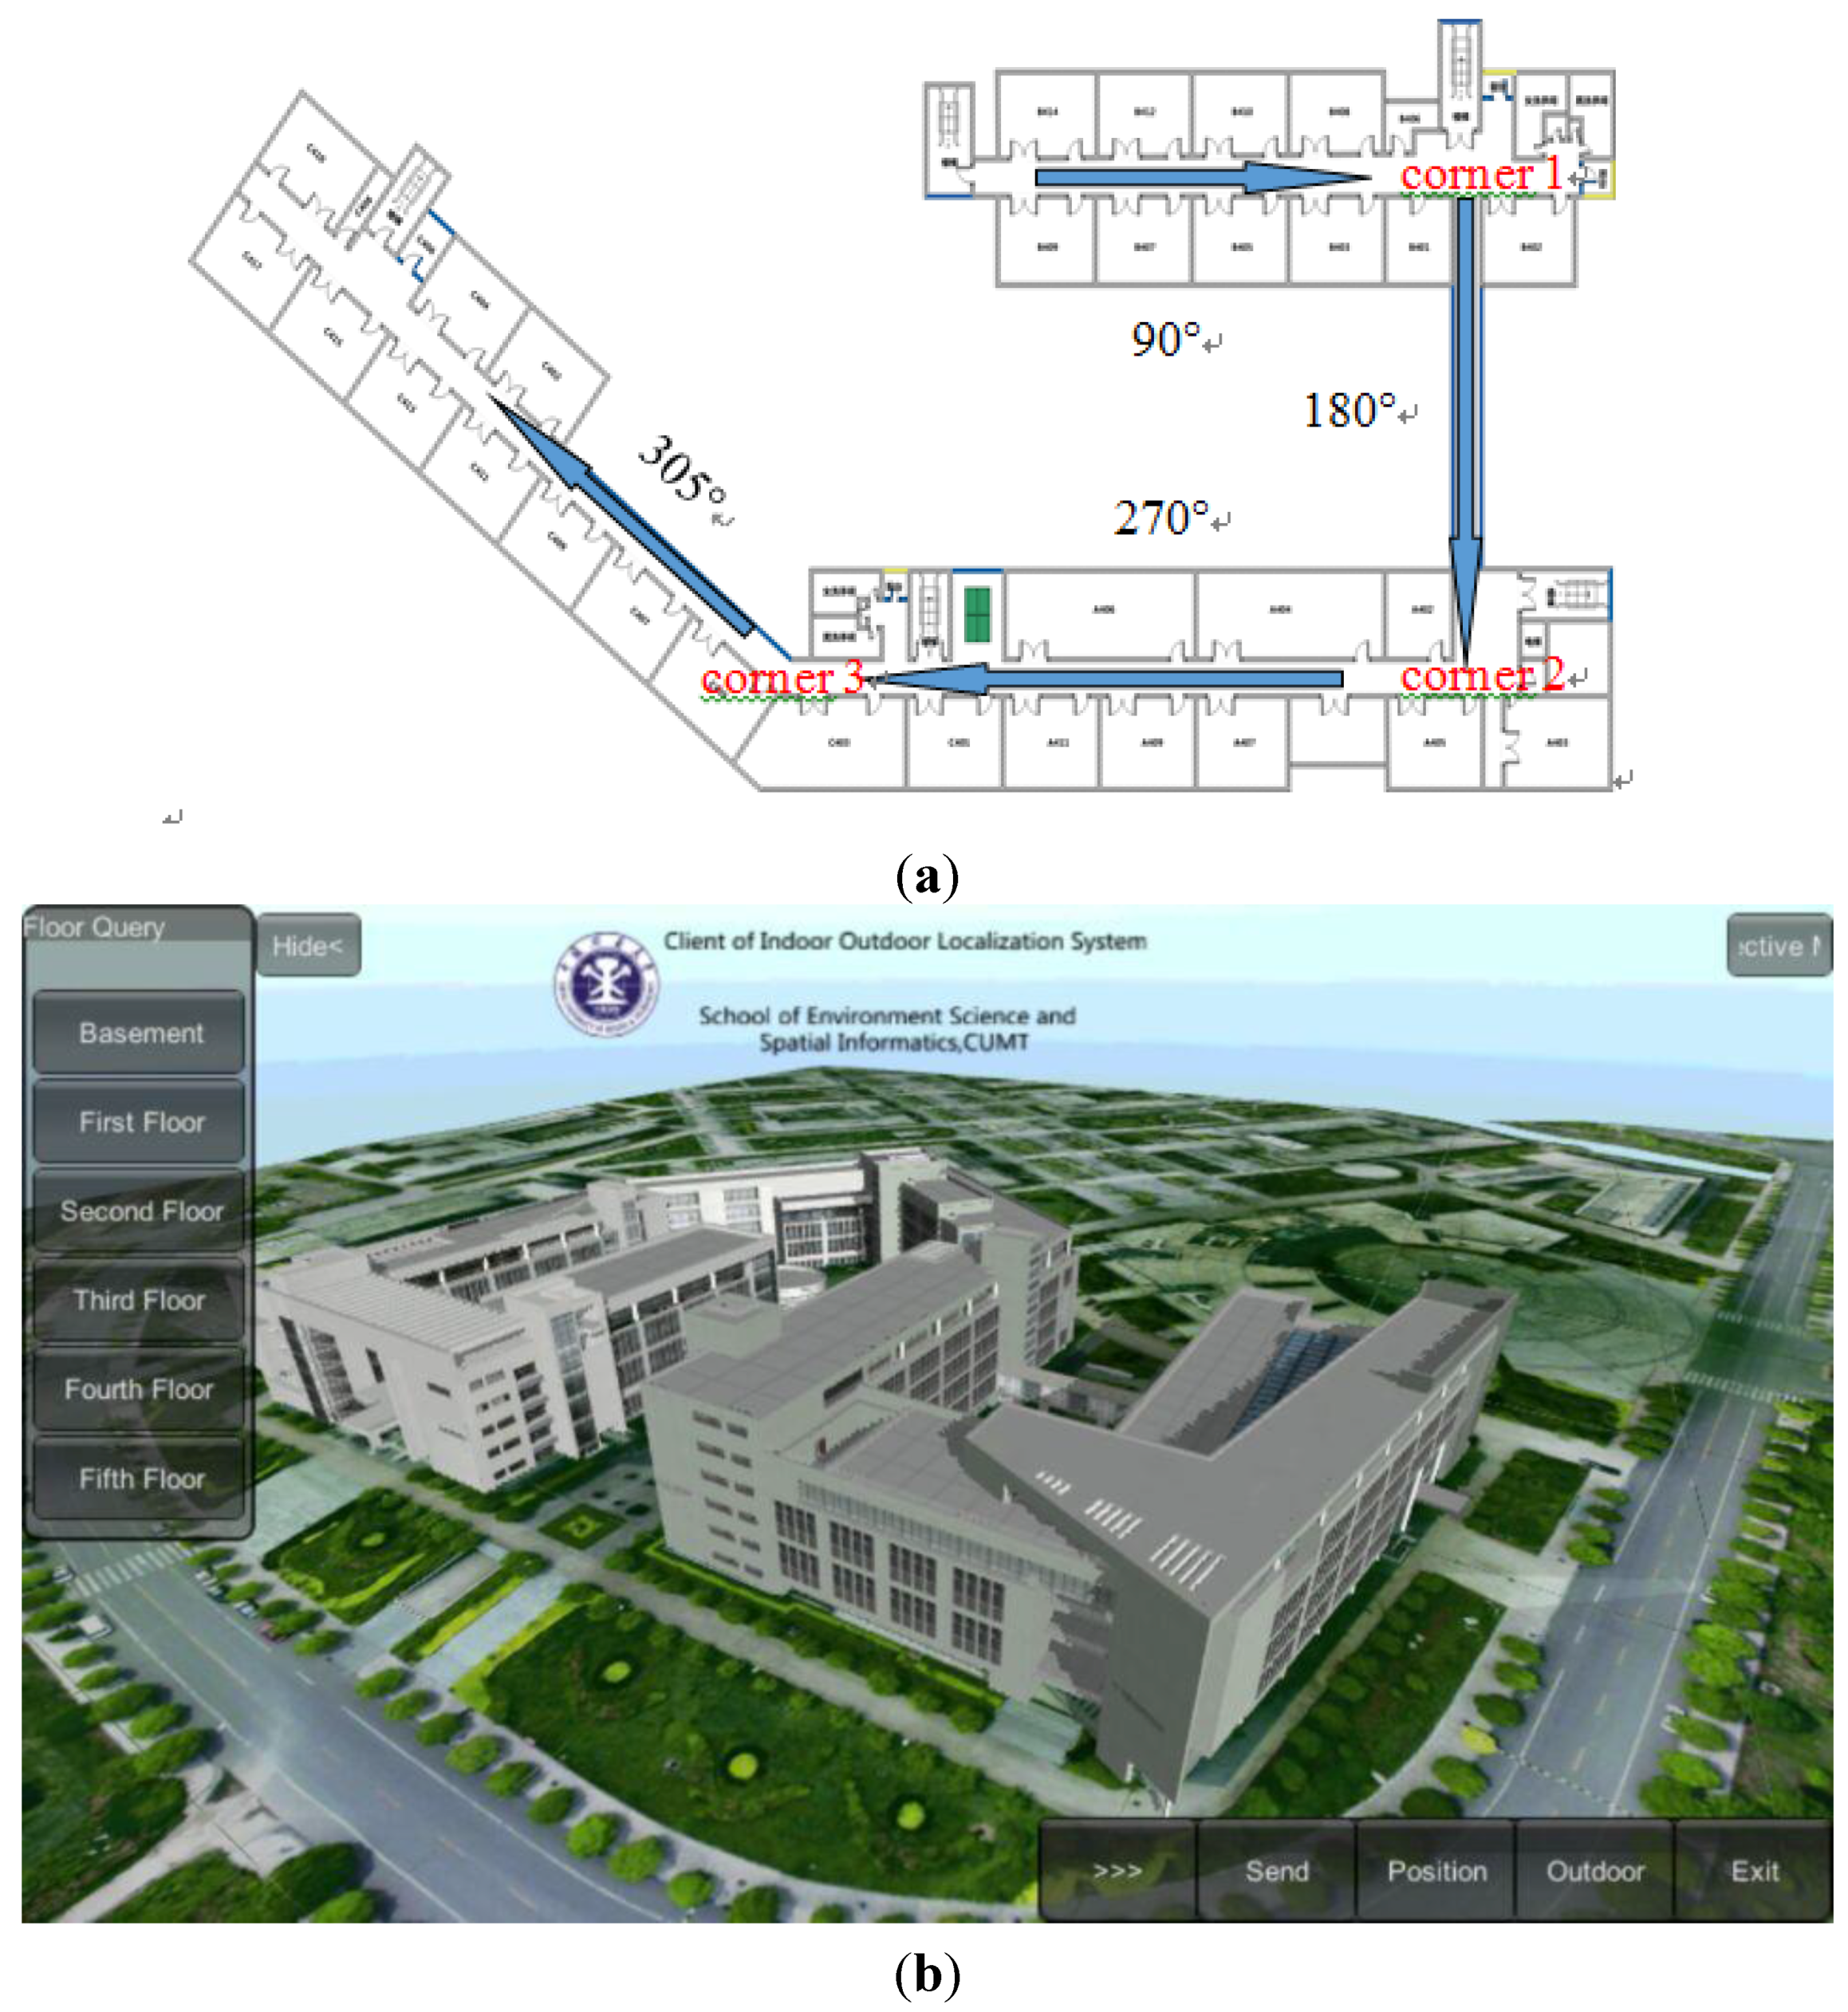
Ijgi 04 02638 g012
Figure 13. 
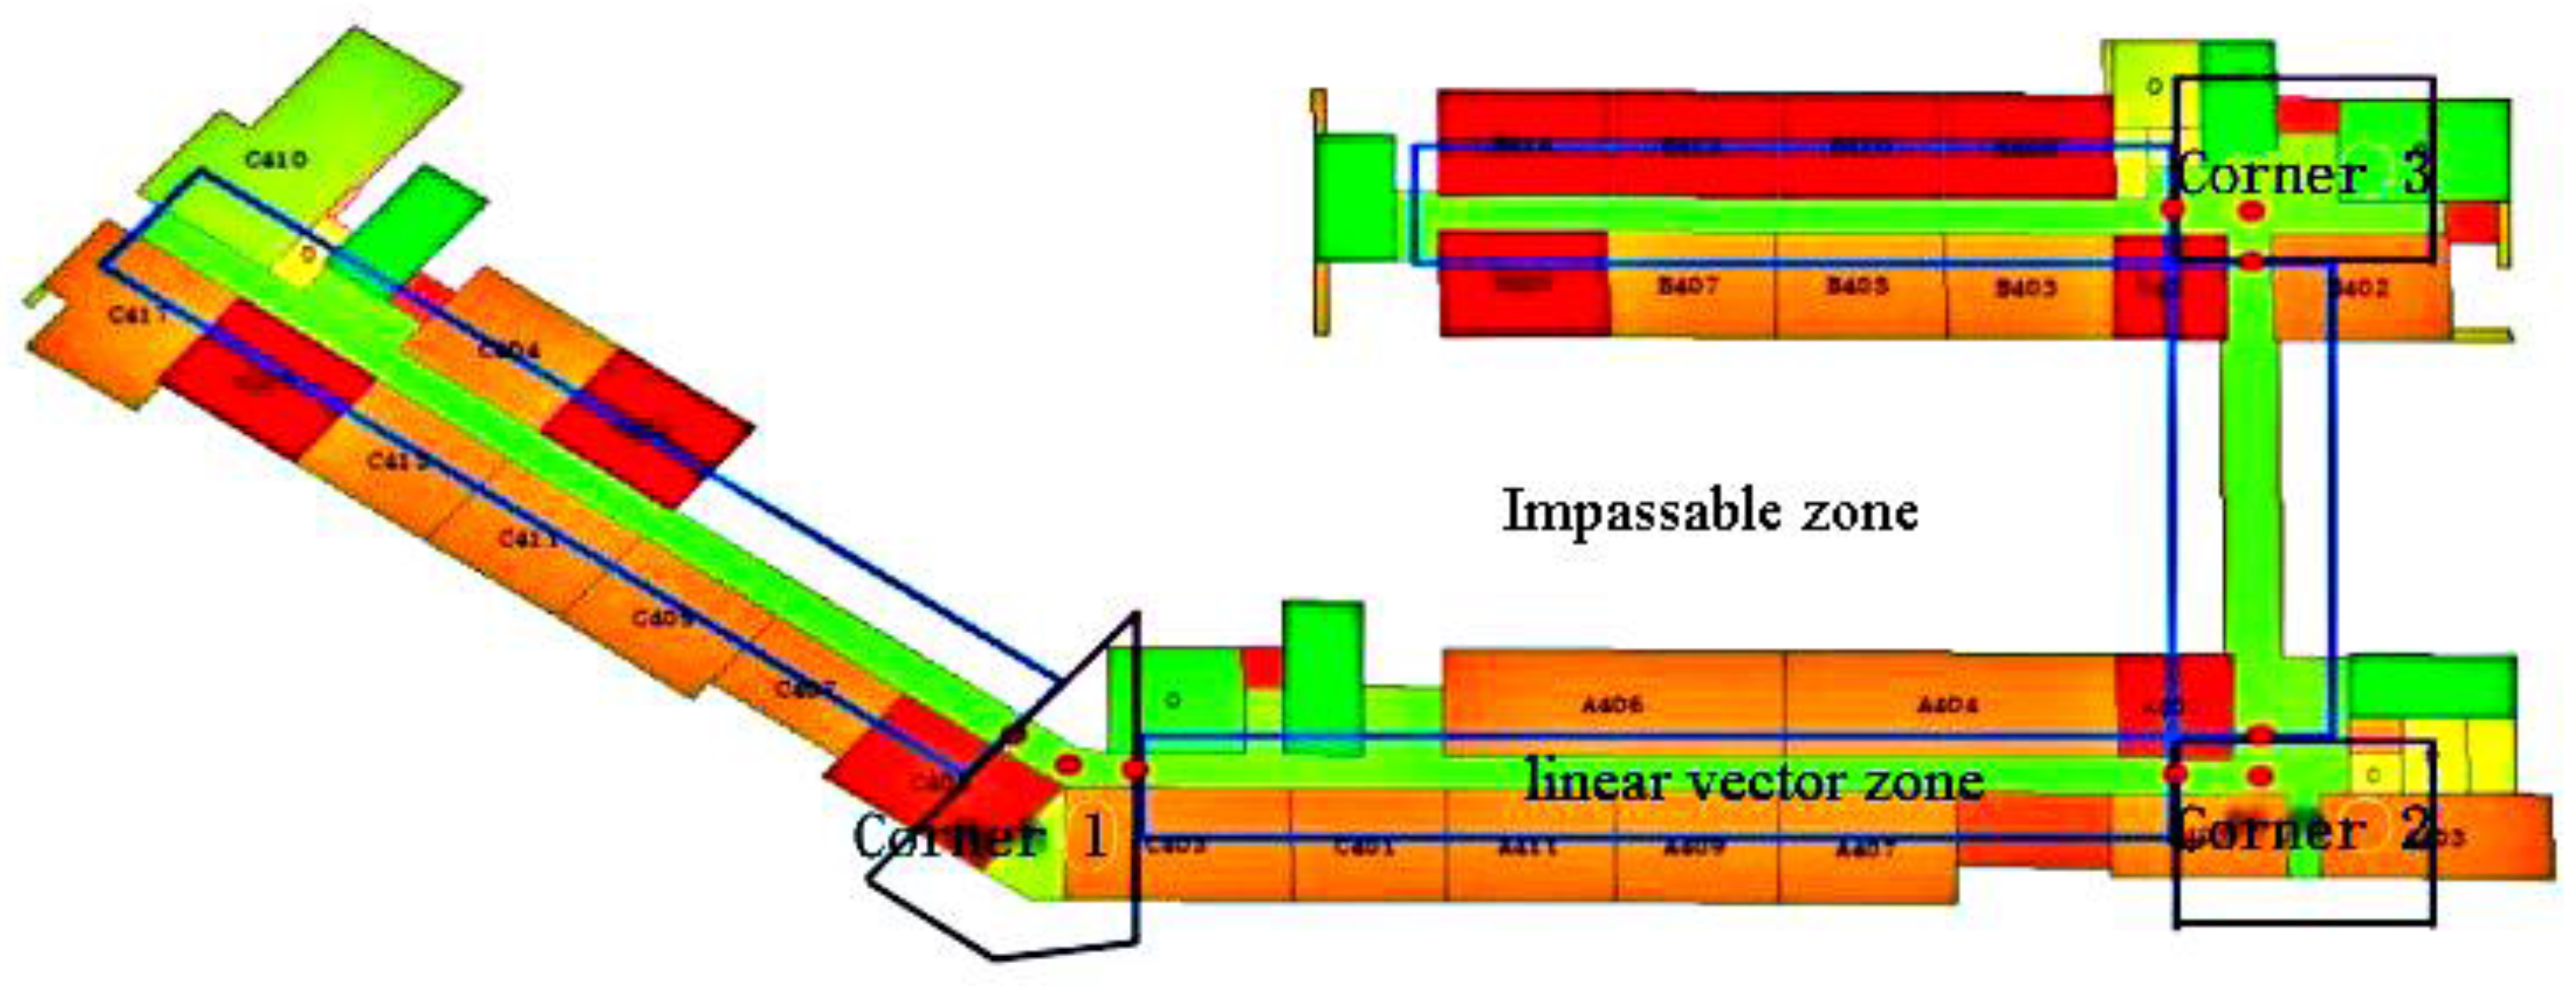
Experimental site: (a) floor map of the fourth floor and (b) 3D model of the experimental site.
Ijgi 04 02638 g013
The x-IMU was designed to be the most versatile Inertial Measurement Unit (IMU) and Attitude Heading Reference System (AHRS) platform available. It hosts on-board sensors, a configurable auxiliary port and real-time communication via USB, Bluetooth or UART, which makes it both a powerful sensor and controller. The on-board SD card, battery charger (via USB), real-time clock/calendar and motion trigger wake up also make the x-IMU an ideal standalone data logger.
The x-IMU has three orthogonally oriented accelerometers, three gyroscopes and three magnetometers. The accelerometers and gyroscopes are MEMS solid state with capacitive readouts, providing linear acceleration and rate of turn, respectively. Magnetometers use a thin-film magnetoresistive principle to measure the Earth’s magnetic field.
The performance of each individual MEMS sensor within this facility is summarized in Table 1. They suffer from a significant bias, and this bias also varies over time; therefore, PDR algorithms have the challenge of avoiding excessive error accumulation (drift) during integration.
To verify the effectiveness of the proposed algorithm, a field experiment was performed on the fourth floor of the School of Environmental Science and Spatial Informatics (SESSI) building on the campus of China University of Mining and Technology (CUMT) in Xuzhou, Jiangsu, China. In Figure 13a, blue arrows indicate linear corridors, and red “corners” indicate non-linear corridors and other areas that are unavailable for a person to pass through. A type of AHRS named x-imu produced by x-io Technologies Limited was used as the user terminal in the experiment; its technical specifications are shown in Table 3.
Table 3. Technical specifications of the IMU.
InstrumentScale FactorRandom Walk
Accelerometer (m/s2)10.3333±0.0005
Gyroscope (m/s2)5.2457±0.0003
Magnetometer (μT)800.0000±0.0400

6.2. Experiment

To compare the tracking results, four schemes were designed:
  • Scheme 1: Floor-map-aided PDR-based tracking result by hand-held smartphone (MPDR).
  • Scheme 2: ZDET-based indoor positioning test with ordinary data (ZDET).
  • Scheme 3: ZDET-based indoor positioning test with map-matching (MZDET).
Map matching (achieved by A-UKF) was used to correct the information from different sensors for Schemes 1 and 3. In Schemes 2 and 3, the ZDET was used for step detection and step length estimation, and the ordinary PDR was accepted by Scheme 1. The floor level should, in general, be determined in advance from Z-axis accelerometer measurements, although only 2D positioning was considered here.
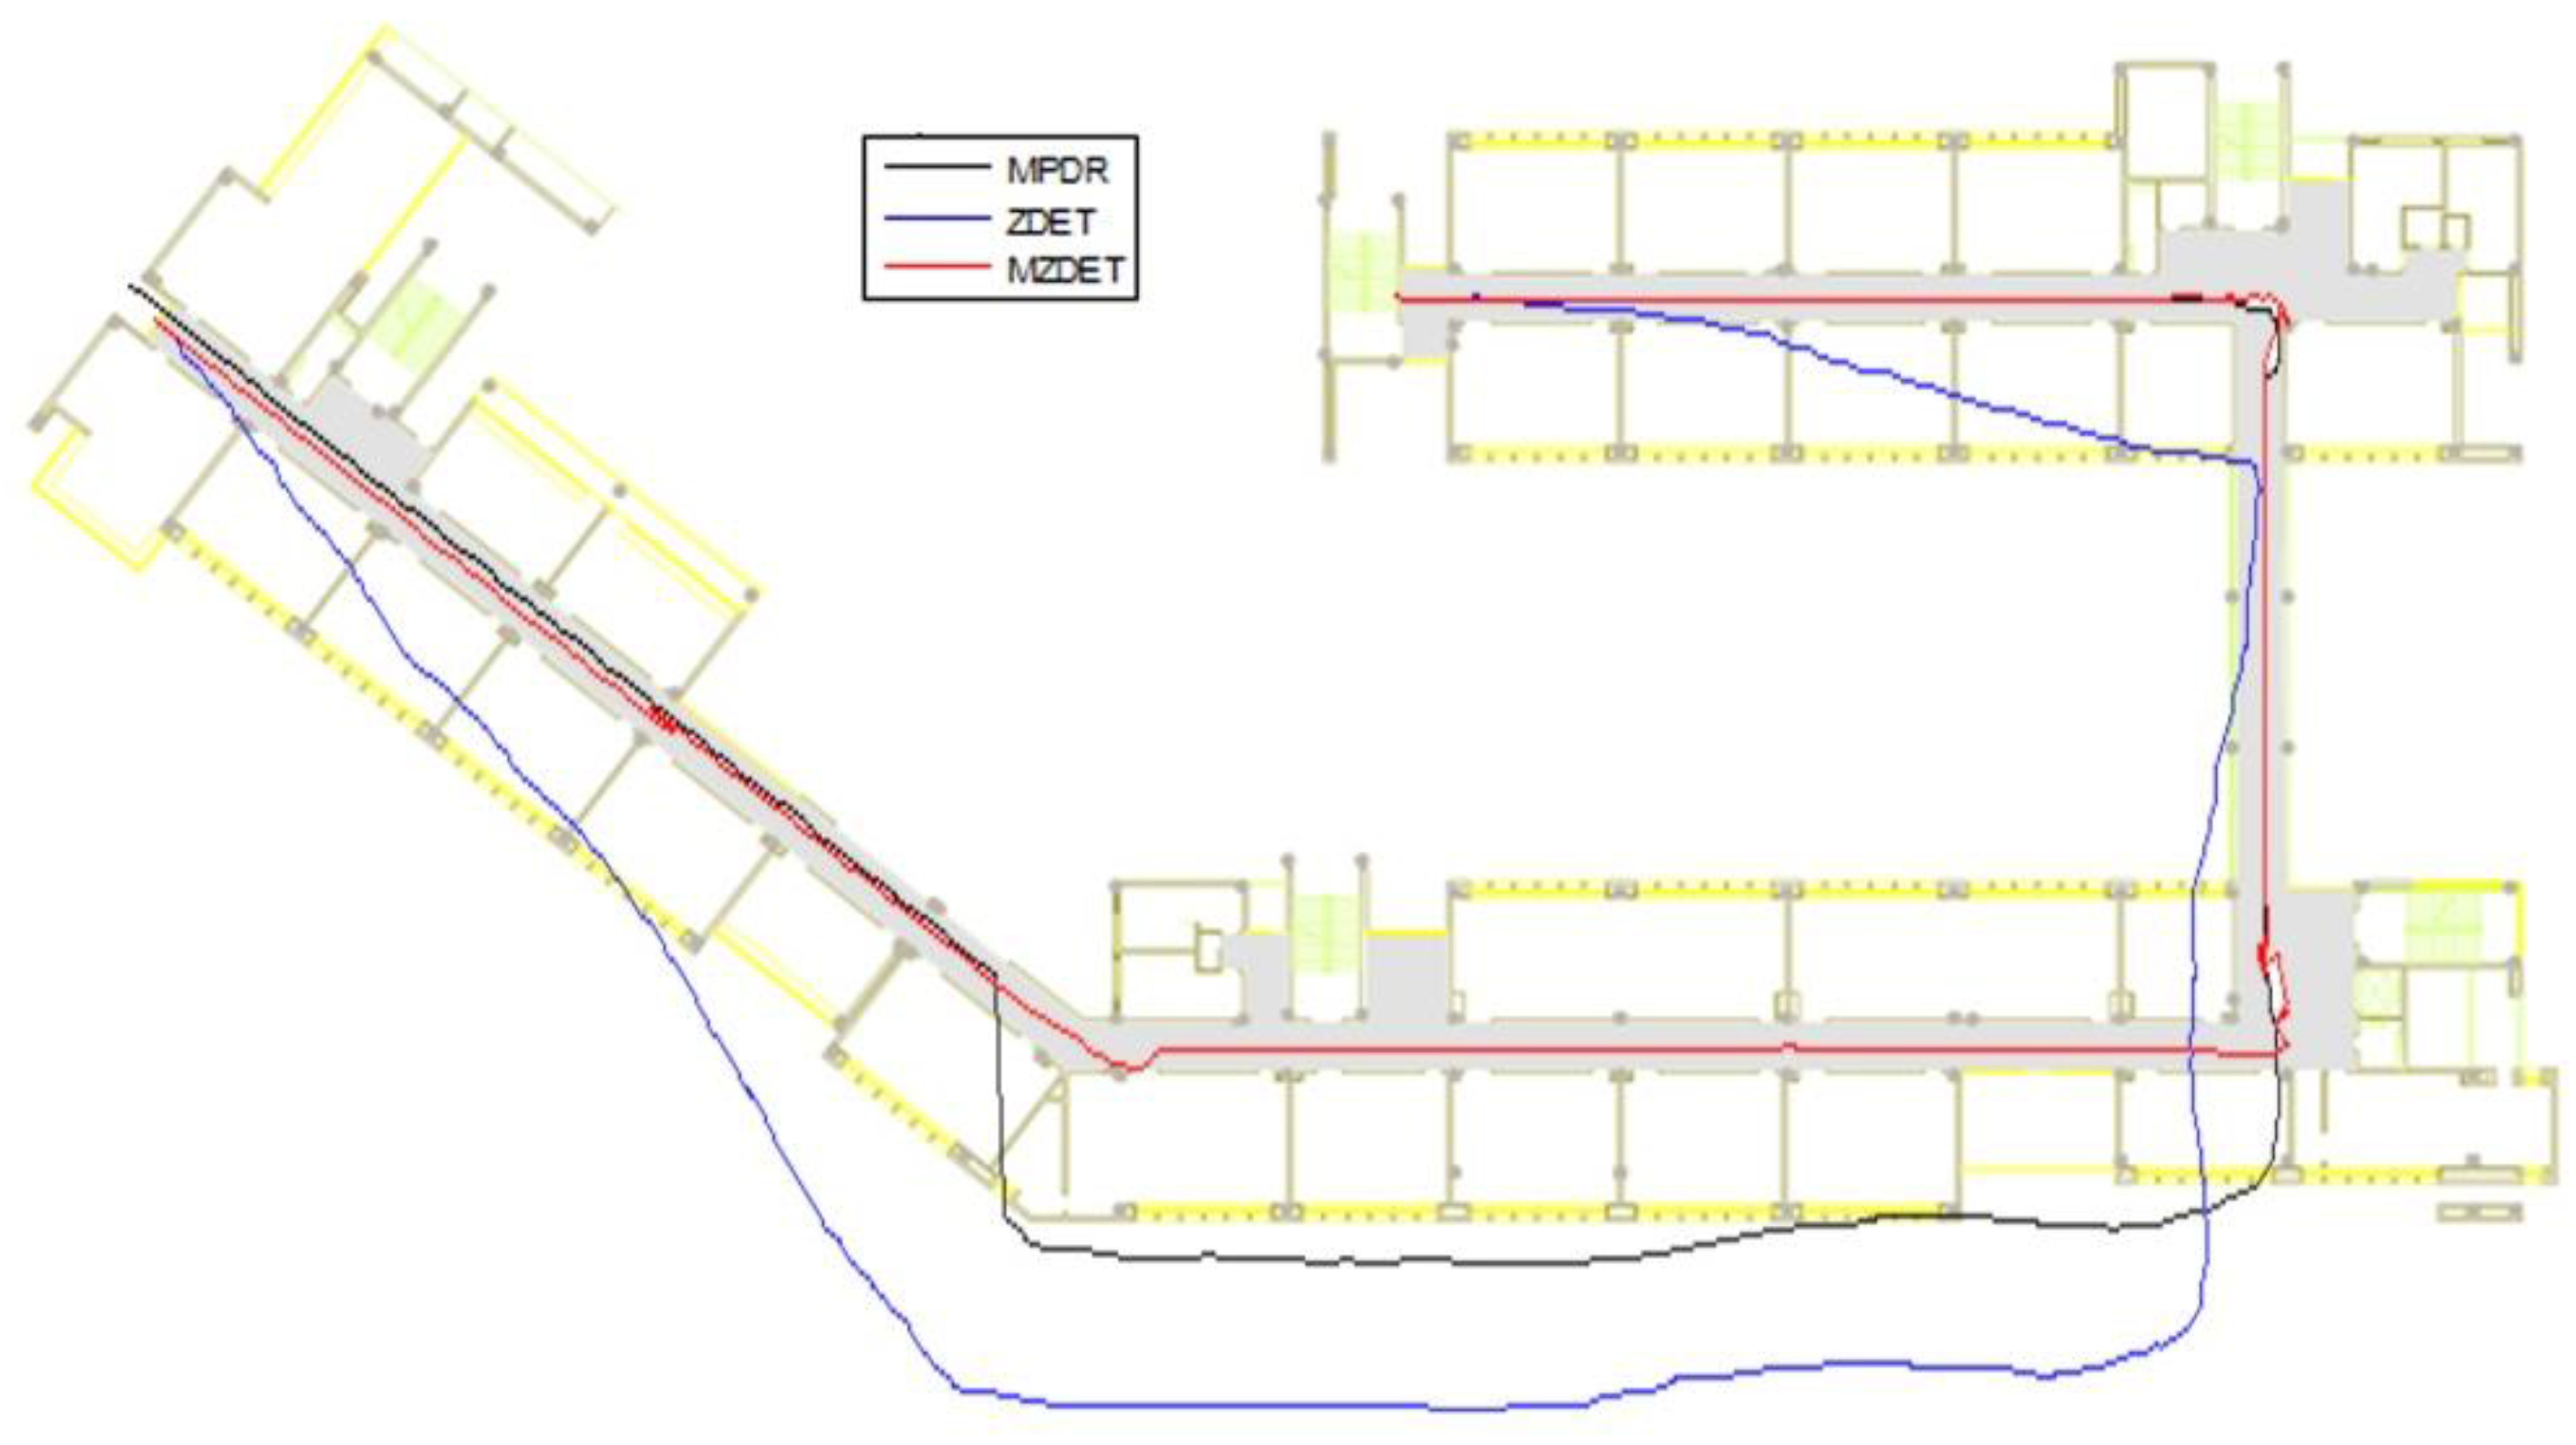
Figure 14 shows the position trajectories for the three schemes. The colorful lines represent the travel paths calculated using the different schemes. In the test, the test participant walked with a uniform and stable gait; therefore, the true trajectory should be stable.
As seen from Figure 15, the map-matching algorithm could help PDR eliminate the accumulated error, which should be an inevitable problem for classic PDR. However, some issues are still revealed to some degree; the step length estimation and step detection may be imprecise, and the error will be accumulated just as a black line in a block. Moreover, compared with ZDET, the positioning results of the MZDET are more accurate and rarely suffer from the influence of a variable heading angle.
Figure 14. Estimated position of the three schemes.
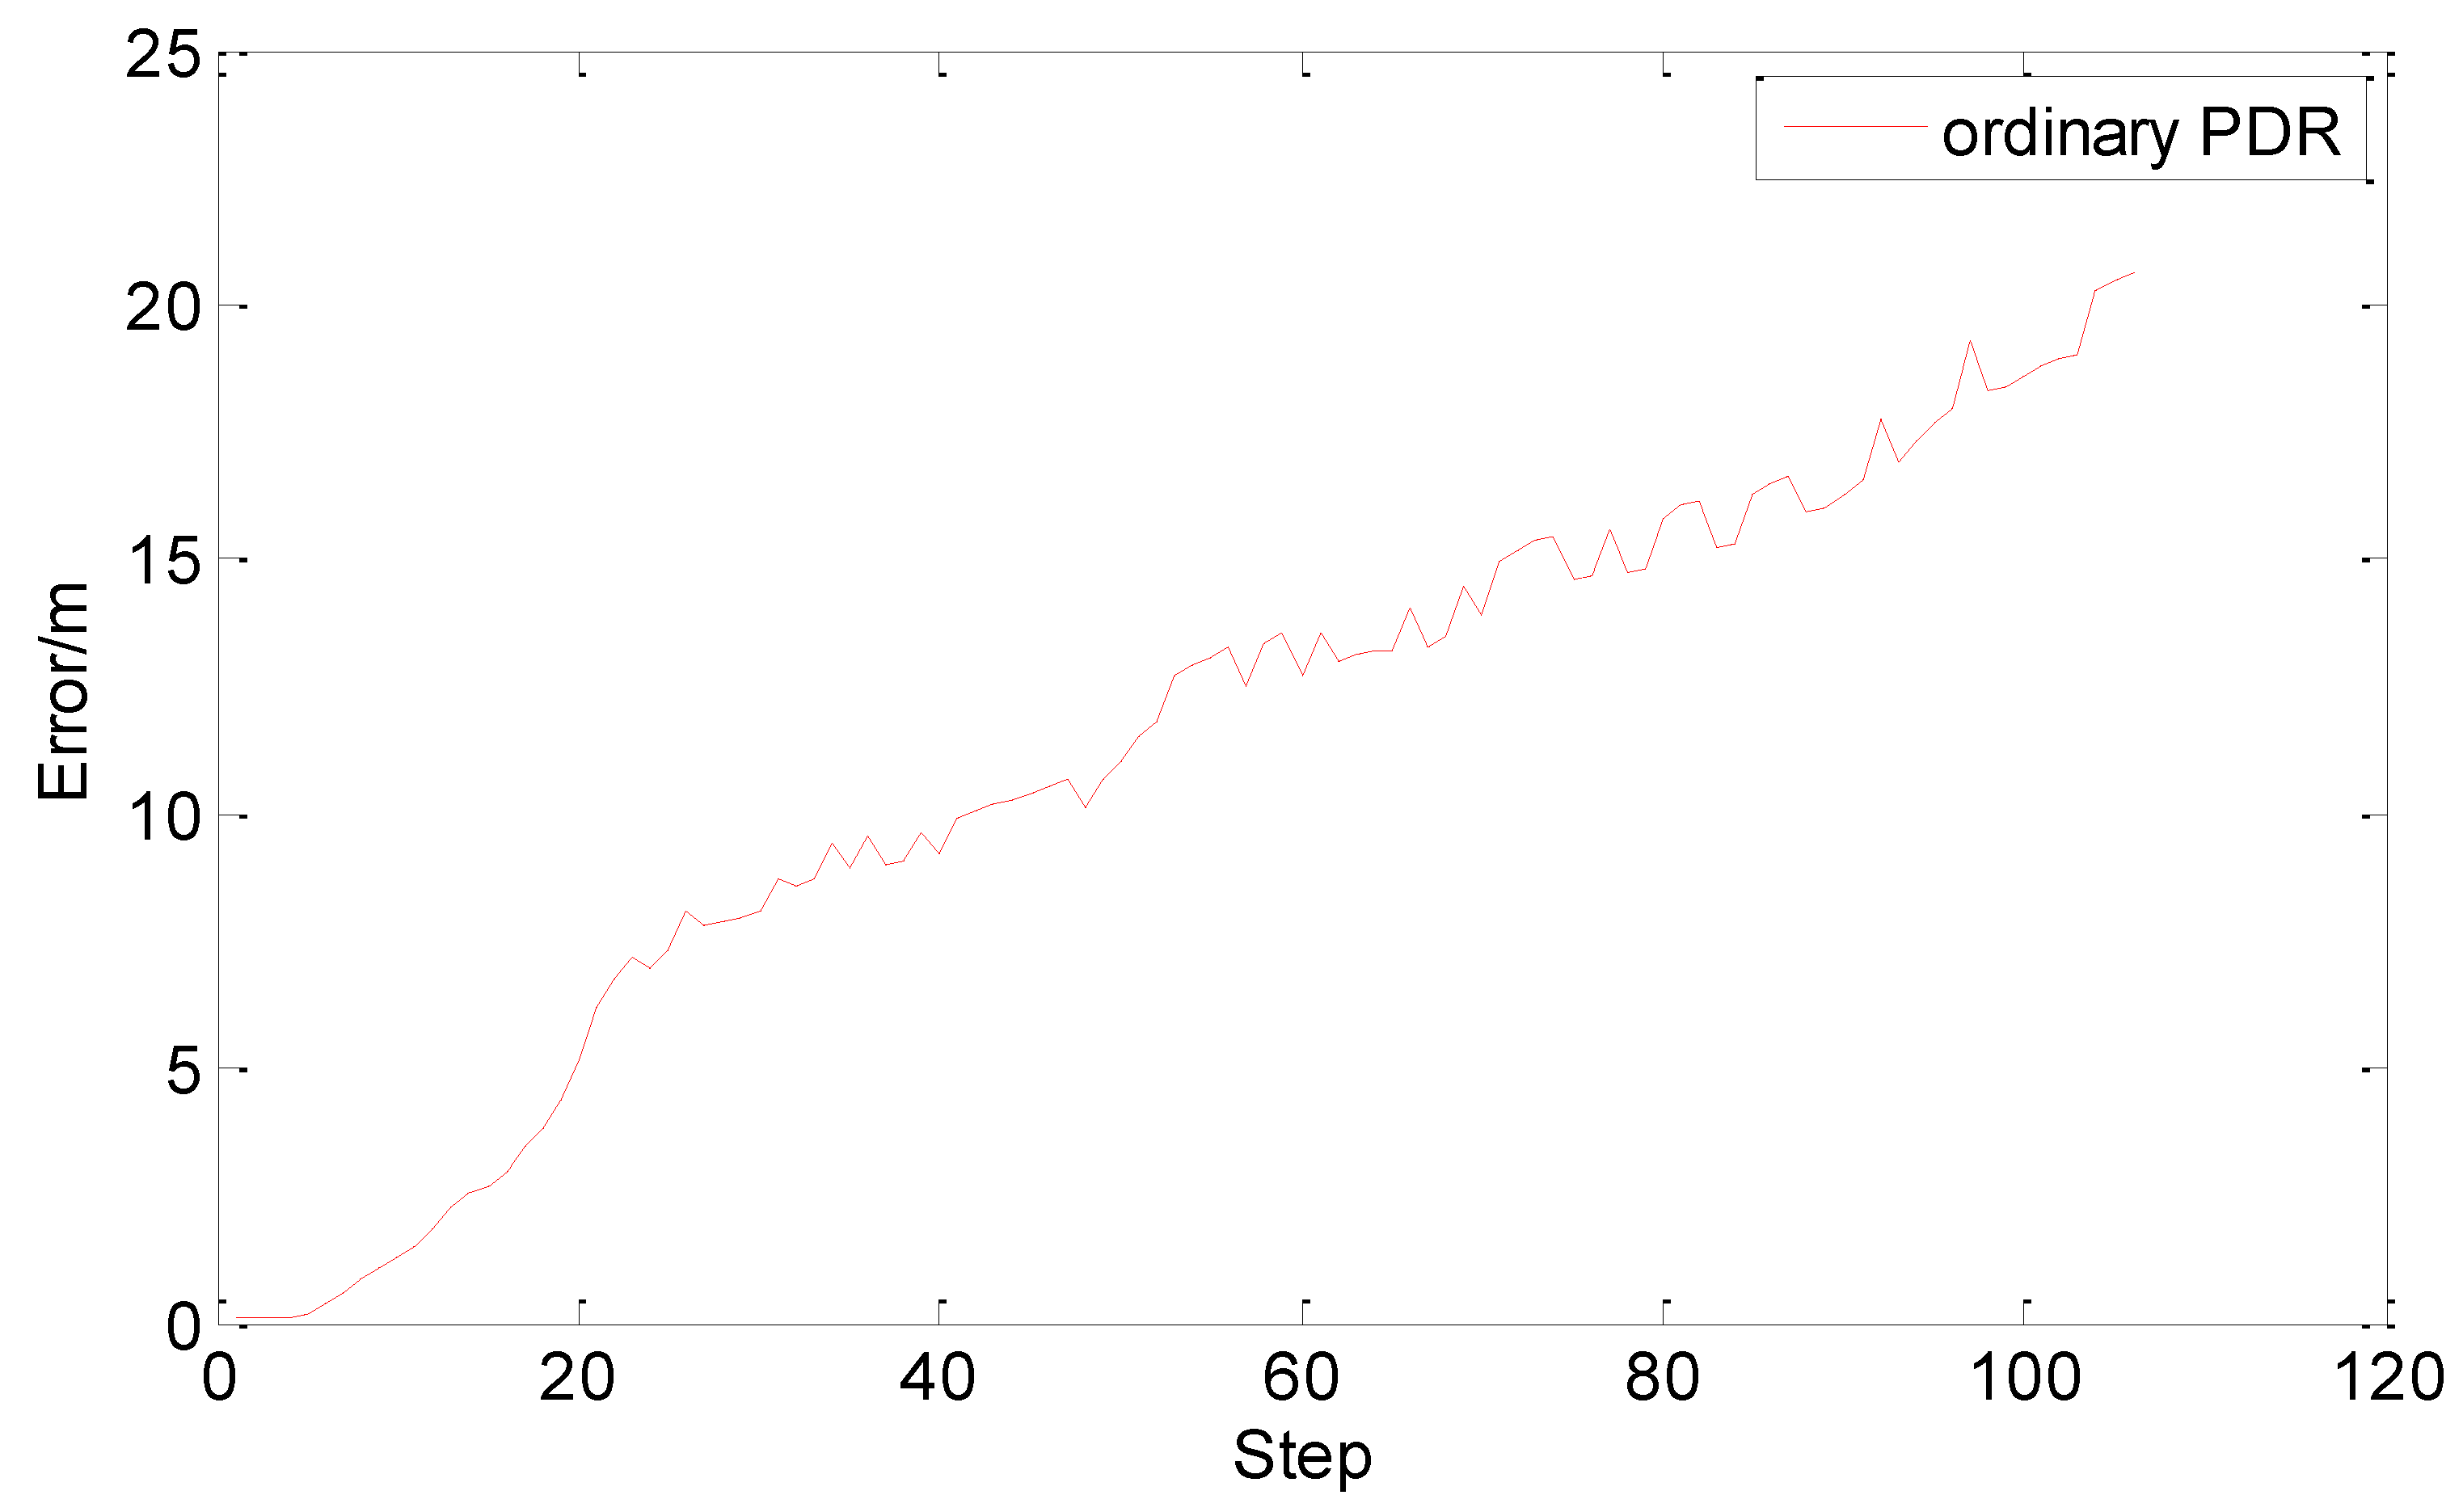
Ijgi 04 02638 g014
Figure 15. The accumulated error of the PDR algorithm.
Ijgi 04 02638 g015
Moreover, compared with an ordinary PDR algorithm, the figure below illustrates that the UKF algorithm preserves the continuity and stability of the PDR algorithm while simultaneously restricting the accumulation of errors, thereby improving the positioning accuracy.
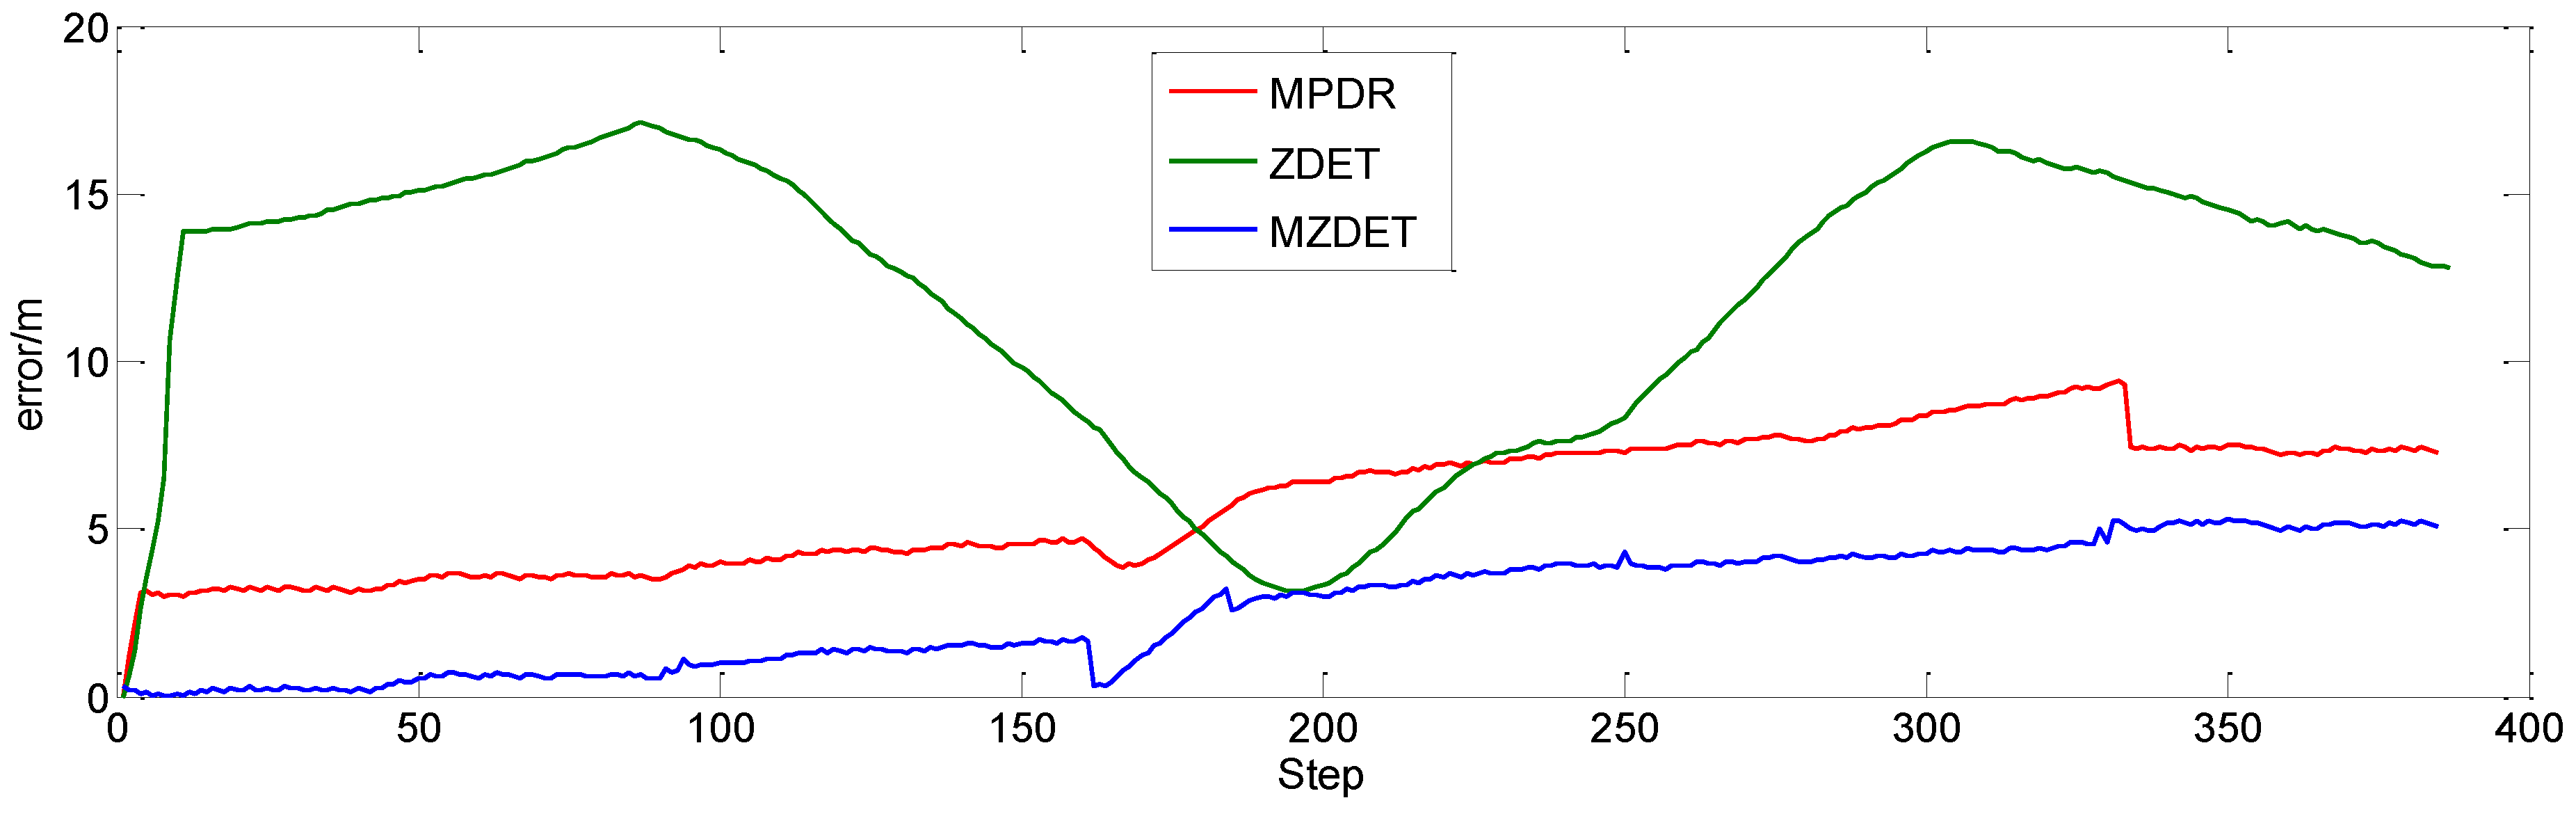
Figure 16 shows the step series of the position errors of the three schemes with respect to the reference positions provided by a master station. The largest errors of the MZDET integration algorithm were observed during hundreds of steps, which it shows much better than the other two methods.
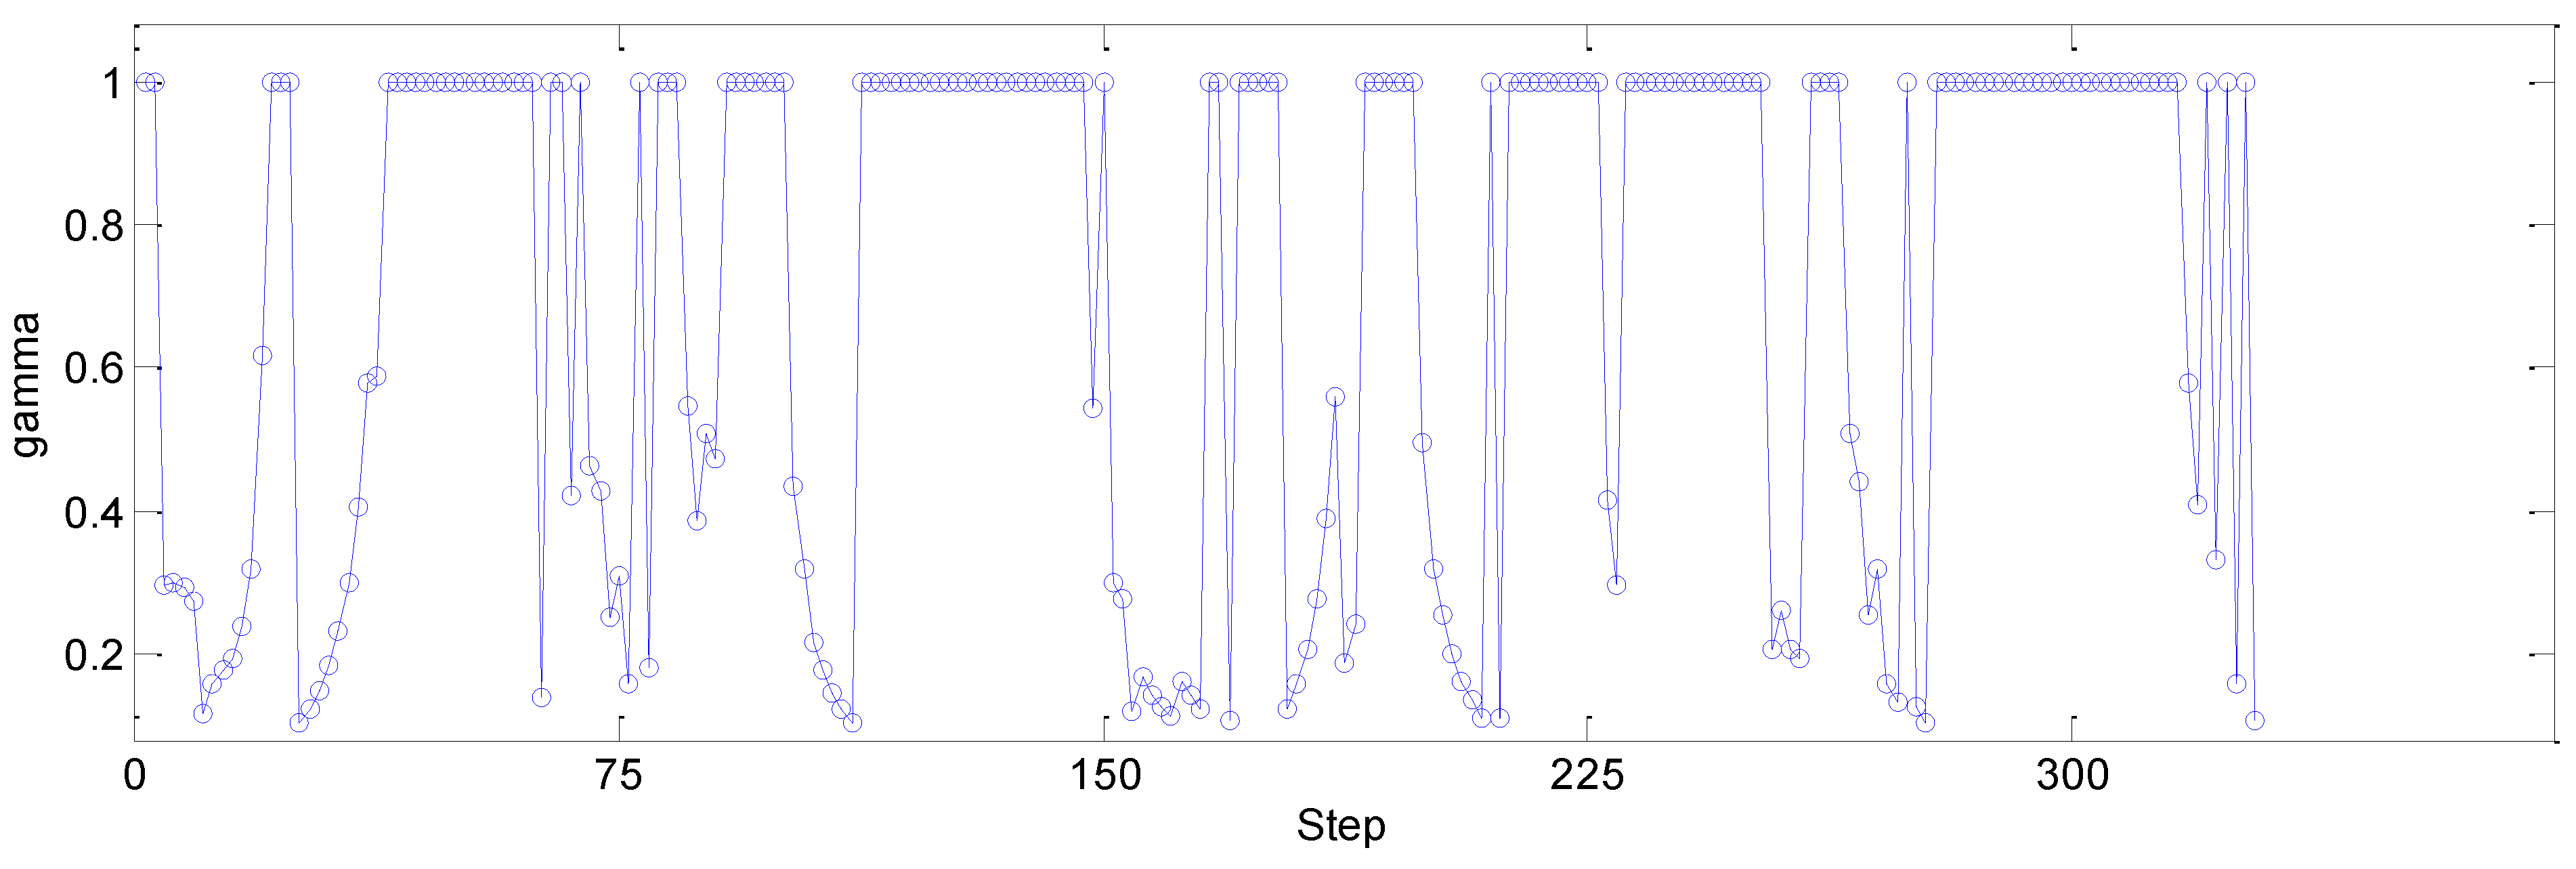
Moreover, we can see in Figure 17 that when a gross error (huge error) is observed, the adaptive factor is able to react and rectifies it rapidly.
Figure 16. The error step series of the three schemes.
Ijgi 04 02638 g016
Figure 17. The variance of the adaptive parameter.
Ijgi 04 02638 g017
The MSE, the average error (AE) and the maximum error (ME) reveal that the map-aided ZDET algorithm achieved the most reliable and accurate positioning results. In this test, the accuracy indicated by the MSE of the integrated MZDET indoor positioning algorithm was improved by 78.3% compared with the pure ZDET algorithm, and the AE and ME were reduced by 73.8% and 69.2%, respectively. Compared with the MPDR algorithm, the MSE of the integrated WPO algorithm was improved by 32.2%, and the AE and ME were reduced by 39.5% and 53.7%, respectively (Table 4).
Table 4. Error analysis of the three schemes.
ERRORMPDRZDETMZDET
MSE/m4.44313.9033.011
AE/m4.36012.1902.639
ME/m11.42717.1425.285
As seen from the comparison, the integrated MZDET positioning algorithm results in an improvement in the accuracy, reliability, and calculation rate and a decrease in the accumulated error; therefore, this method is superior to the others to a certain extent.

6.3. Robustness Test

To demonstrate the robustness of the A-UKF integration algorithm for a foot-mounted indoor positioning system, some gross errors (three times the threshold of the step length covariance) were added to the step length observations as listed in Table 5:
Table 5. Gross errors added to the step length measurements.
Time (s)306085126178219269
s (m)3333333
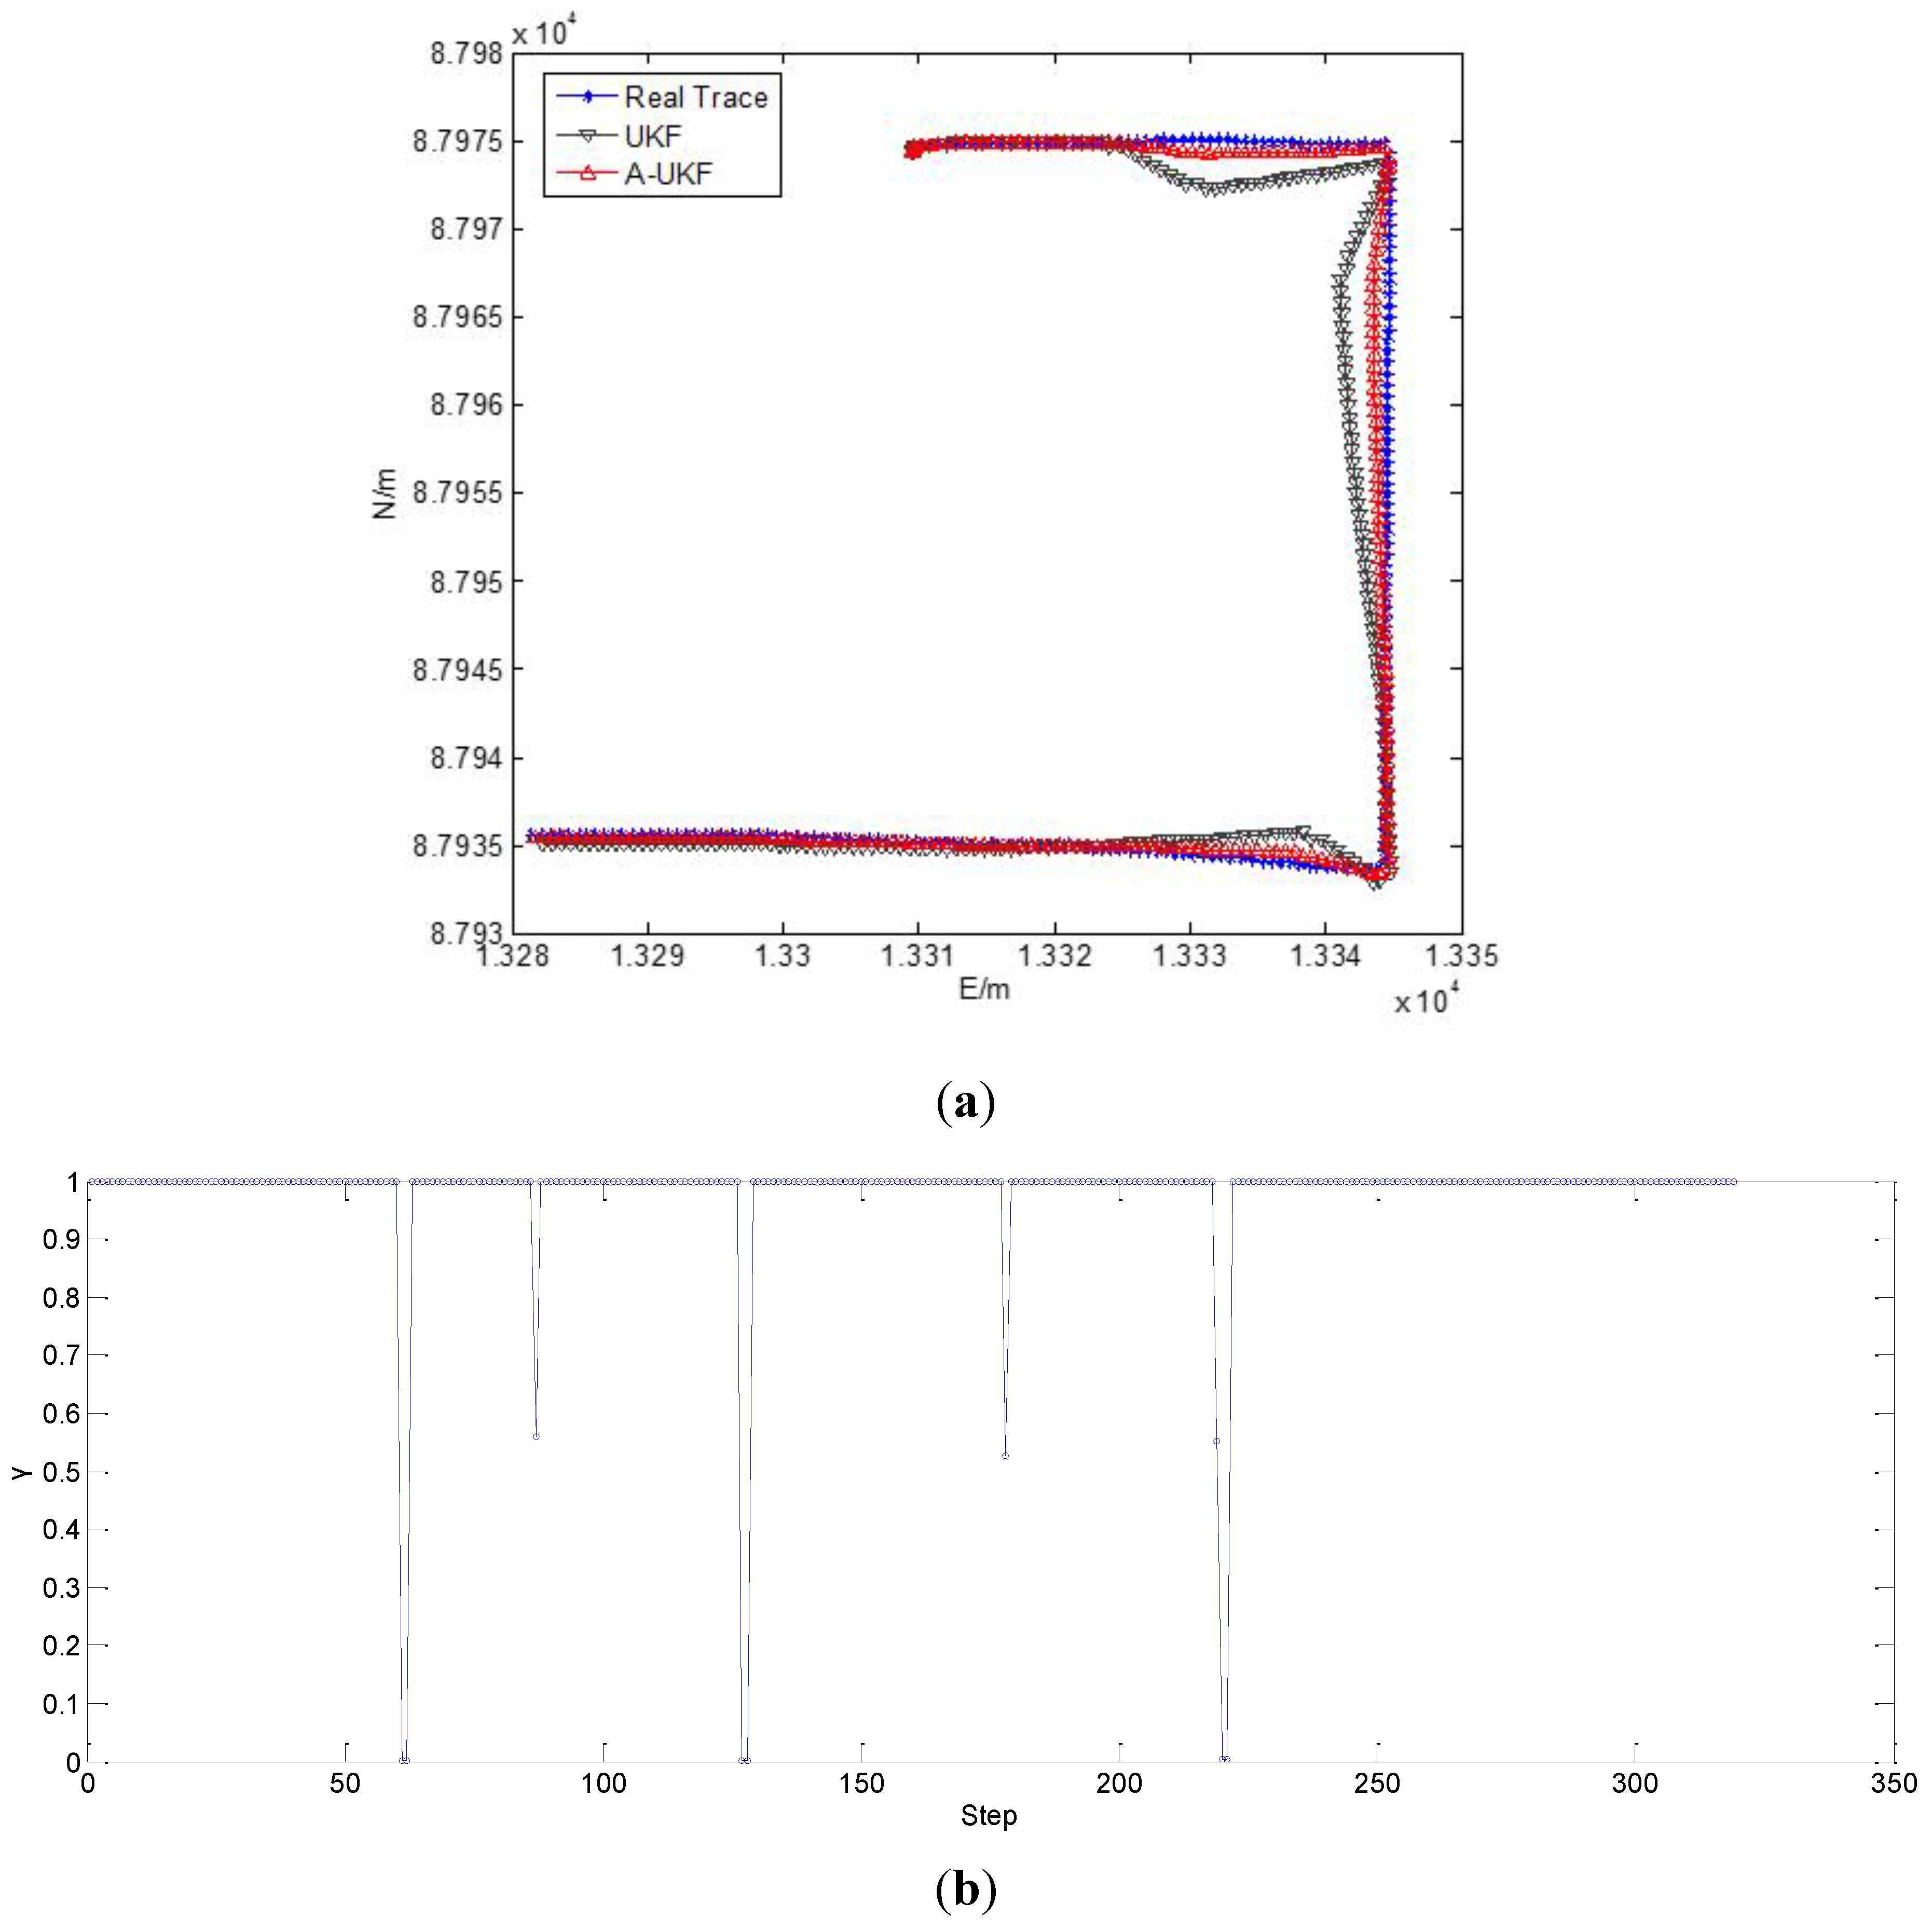
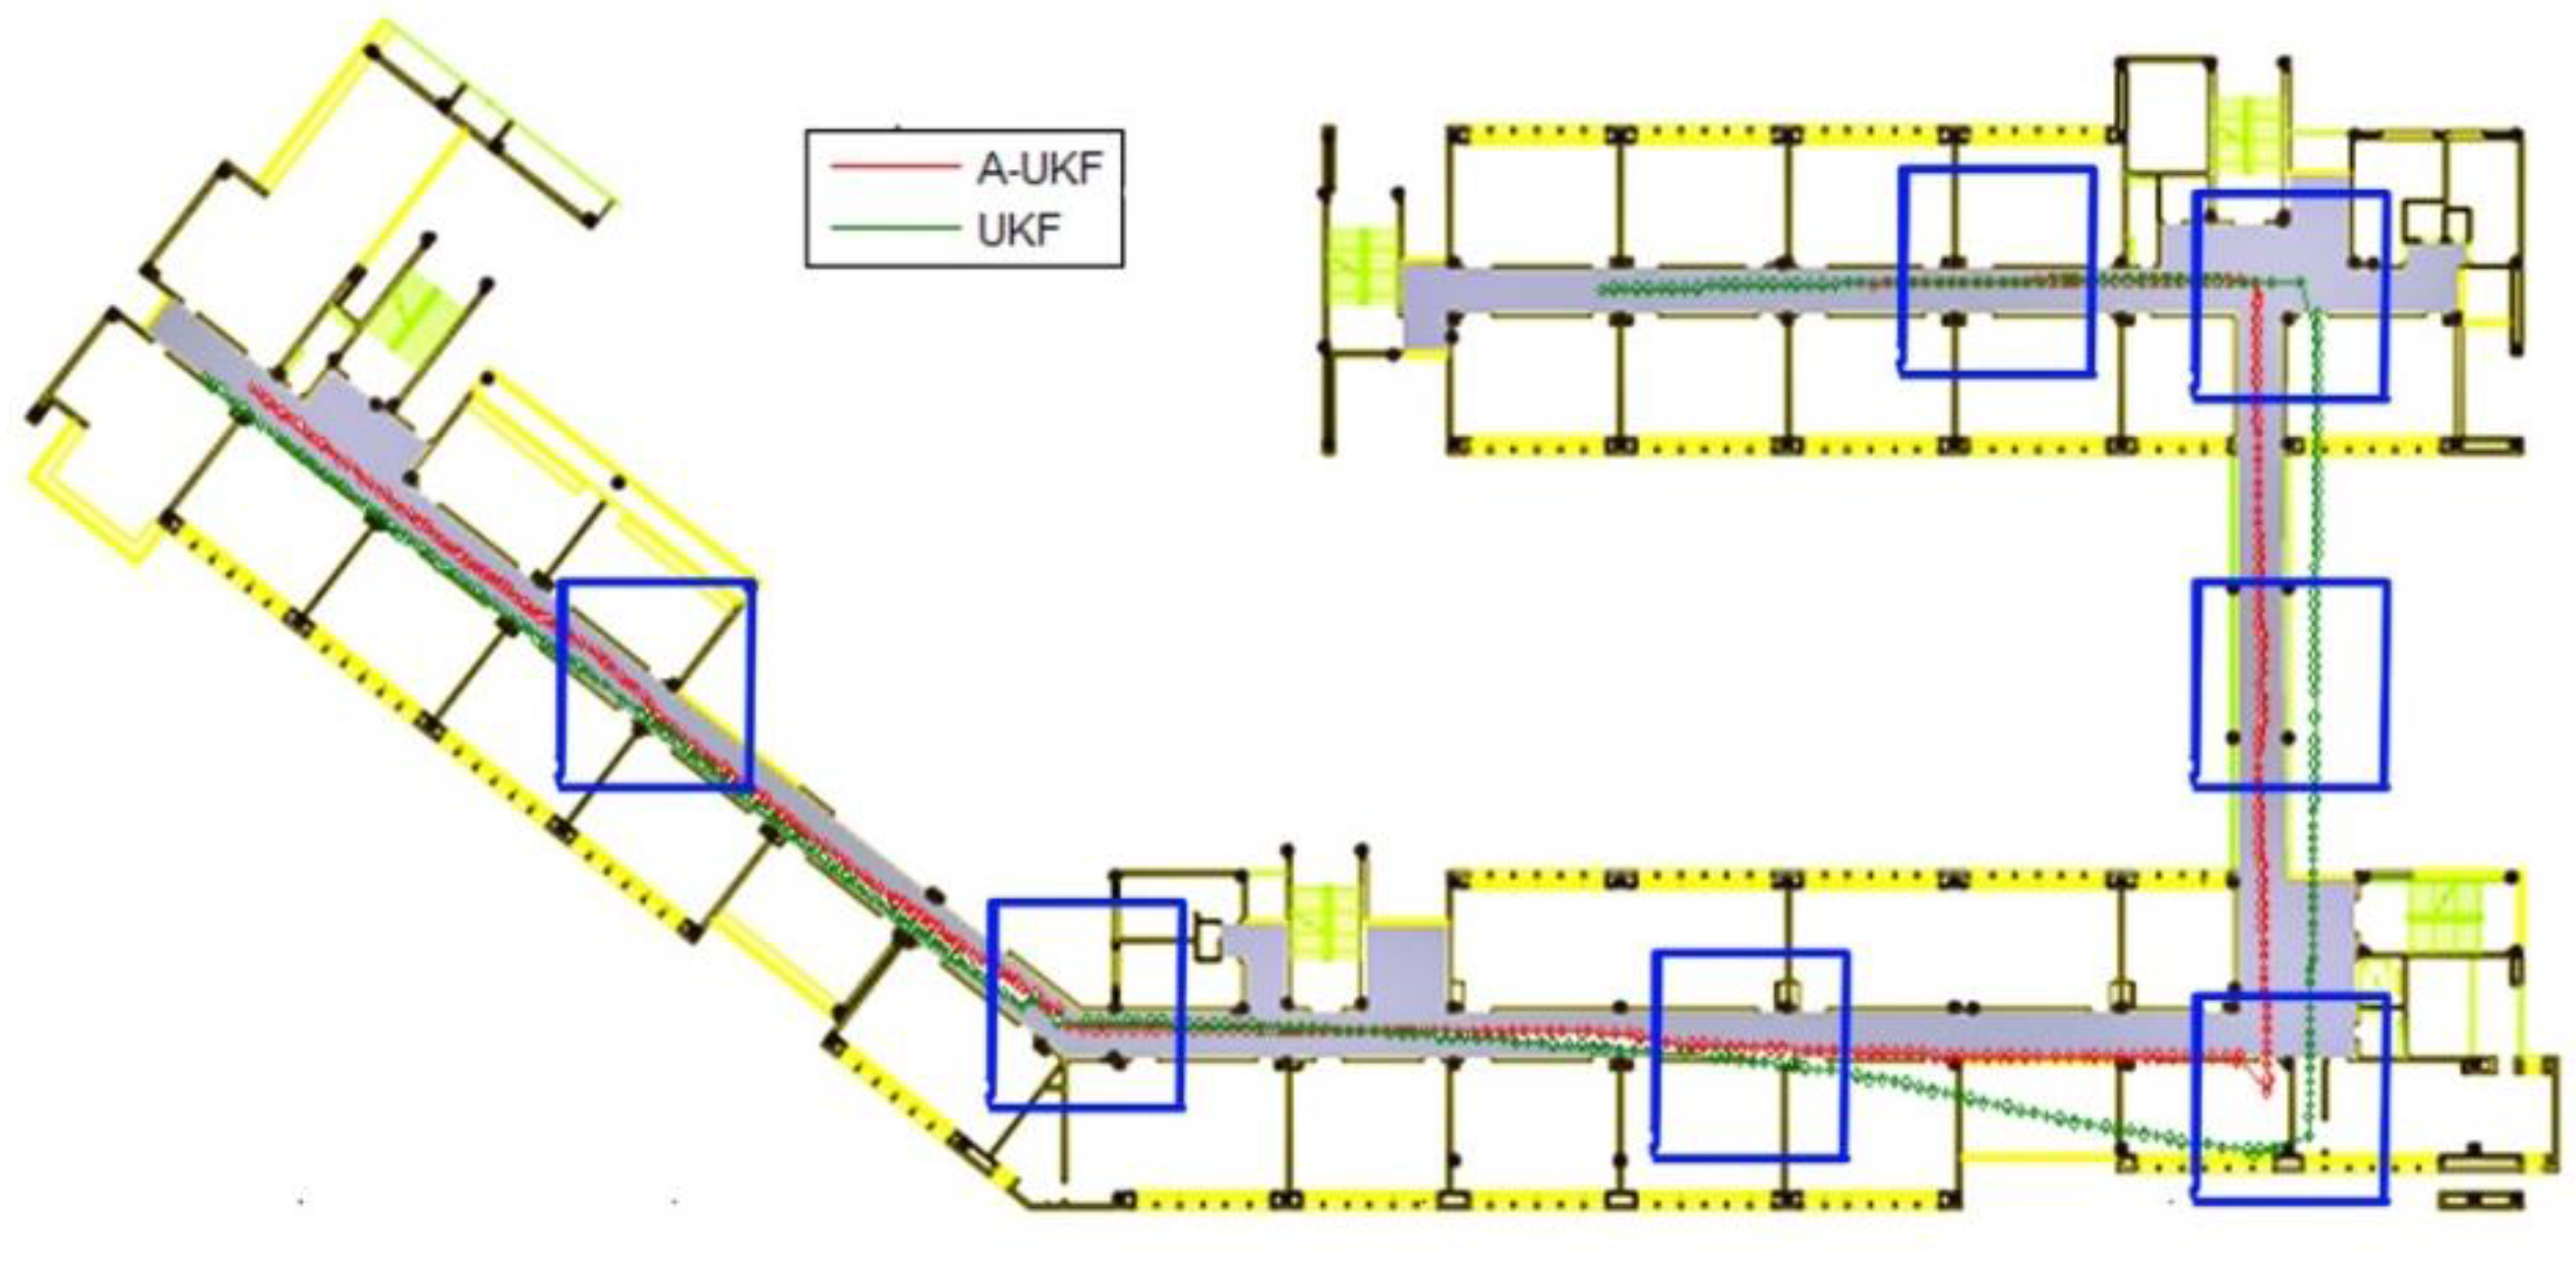
Figure 18 illustrates the positioning trajectories determined using the UKF algorithm and the A-UKF algorithm. As shown in Table 6, seven gross-error-contaminated points, which cause the trajectory to be deteriorated, are observed around each corner and linear corridor in Figure 13a. Table 6 shows the residuals of these two algorithms for each affected time point (as shown in the table before), and the results demonstrate that the A-UKF algorithm achieves a much higher reliability and accuracy.
Figure 18. Estimated position based on A-UKF and UKF.
Ijgi 04 02638 g018
Table 6. Residuals of the gross-error epochs.
Time (s)UKF(m)A-UKF (m)
301.501.39
60 1.990.43
93 3.000.32
126 2.570.58
1721.840.76
2191.481.08
2691.501.05
Gross errors were also added to the θk measurements (three times the threshold of the heading angle covariance), as listed in Table 7, to verify the robustness of both algorithms. The resulting positioning trajectories obtained by using the UKF algorithm and the A-UKF algorithm are shown in Figure 19. As shown in Figure 19, the seven gross-error-contaminated points cause the trajectory to be deteriorated around the affected epochs as a result of the algorithms’ recursions. Table 8 lists the residuals of the gross-error-contaminated epochs.
Table 7. Gross errors added to the orientation measurements.
Time (s)306093126172219269
θk (°)+20+20+20+20+20+20+20
Figure 19. Estimated position based on UKF and A-UKF.
Ijgi 04 02638 g019
Table 8. Residuals of the gross-error epochs.
Time (s)UKF (m)A-UKF (m)
300.232.13
601.081.10
930.920.14
1262.150.27
1721.780.50
2190.560.46
2691.080.75
These results demonstrate that the A-UKF algorithm is more robust than the ordinary UKF algorithm, regardless of where the gross error originated.
These observations yield the following conclusions regarding the investigated positioning algorithms for indoor navigation systems.
(1)
Considering the issue of step detection, a ZDET method was proposed to improve the accuracy of detection, thereby decreasing the fluctuation to an acceptable level and improving the accuracy of the entire algorithm.
(2)
Despite the high accuracy provided by zero-velocity detection, PDR always requires a considerable precision of orientation, and therefore, most experiments using PDR require constraints to cope with the information obtained from the gyroscope or magnetometer. However, incorporating an electronic map of the structure by UKF into the analysis eliminates redundant operations, thereby helping to improve the computational speed and quality.
(3)
Considering the stability of UKF, the adaptive parameter is integrated into the algorithm. The experiments show that compared with the classic UKF, A-UKF offers a much more powerful robustness, improving the positioning reliability and producing a dramatic upward shift in operating rate and quality.
(4)
In view of the considerable CL of A-UKF, which could load upon read-time calculation on an ordinary smartphone, there is the possibility of quasi-real-time measurements using mobile phones instead of a central computer, as has generally been used in other recent experiments.

7. Conclusions

This paper investigated several positioning algorithms for indoor navigation systems. A Zero-Velocity Update (ZDET) algorithm step detection method was presented. The proposed floor-map-aided ZDET algorithm was combined with an adaptive unscented Kalman filter (A-UKF). The experimental test results indicate that the ZDET methods eliminated the error of step length estimation and step detection to a certain extent. It was also demonstrated that the A-UKF could be very useful for correcting the heading angle and improving the quality and accuracy of the positioning results. Further development of the algorithm will focus on fusing other data sources, such as WiFi and ibeacon based on Bluetooth Low Energy (BLE), which could improve the accuracy and stability of the algorithm and make it more efficient.

Acknowledgments

This work was partially supported by Special funds for basic scientific research business of Central University (No. 2015XKMS051).

Author Contributions

The corresponding author Jian Wang proposed the research, organized the equipment and guide writing the paper. Andong Hu purposed the experimental program, collected most of the field data, did the analysis and drafted the manuscript. Xin Li and Yan Wang performed part of the field data and involved in drafting the manuscript.

Conflicts of Interest

The authors declare no conflicts of interest.

References

  1. Cho, S.Y.; Park, C.G. Mems based pedestrian navigation system. J. Navig. 2006, 59, 135–153. [Google Scholar] [CrossRef]
  2. Klepal, M.; Beauregard, S. A backtracking particle filter for fusing building plans with PDR displacement estimates. In Proceedings of 5th Workshop on Positioning, Navigation and Communication, Hannover, Germany, 27 March 2008; pp. 207–212.
  3. Li, F.; Zhao, C.; Ding, G.; Gong, J.; Liu, C.; Zhao, F. A reliable and accurate indoor localization method using phone inertial sensors. In Proceedings of the 14th International Conference on Ubiquitous Computing, Pittsburgh, PA, USA, 5–8 September 2012; pp. 421–430.
  4. Kourogi, M.; Kurata, T. Personal positioning based on walking locomotion analysis with self-contained sensors and a wearable camera. In Proceedings of the 2nd IEEE/ACM International Symposium on Mixed and Augmented Reality, Washington, DC, USA, 7–10 October 2003; pp. 103–112.
  5. Harle, R. A survey of indoor inertial positioning systems for pedestrians. IEEE Commun. Surv. Tutor. 2013, 15, 1281–1293. [Google Scholar] [CrossRef]
  6. Lan, K.C.; Shih, W.Y. Using smart-phones and floor plans for indoor location tracking. IEEE Trans. Hum. Mach. Syst. 2014, 44, 211–221. [Google Scholar]
  7. Colomar, D.S.; Nilsson, J.; Handel, P. Smoothing for ZUPT-aided INSs. In Proceedings of 2012 International Conference on Indoor Positioning and Indoor Navigation (IPIN), Sydney, Australia, 13–15 November 2012; pp. 1–5.
  8. Nilsson, J.O.; Skogl, I.; Handel, P.; Hari, K.V.S. Foot-mounted INS for everybody—An open-source embedded implementation. In Proceedings of the 2012 IEEE/ION Position Location and Navigation Symposium (PLANS), Myrtle Beach, SC, USA, 23–26 April 2012; pp. 140–145.
  9. Handel, P.; Rantakokko, J.; Skog, I.; Nilsson, J.O. Zero-velocity detection—An algorithm evaluation. IEEE Trans. Biomed. Eng. 2010, 57, 2657–2666. [Google Scholar]
  10. Attia, M.; Moussa, A.; El-Sheimy, N. Map aided pedestrian dead reckoning using buildings information for indoor navigation applications. Positioning 2013, 4, 227–239. [Google Scholar] [CrossRef]
  11. Nurminen, H.; Ristimaki, A.; Ali-Loytty, S.; Piché, R. Particle filter and smoother for indoor localization. In Proceedings of 2013 International Conference on Indoor Positioning and Indoor Navigation (IPIN), Montleliard-Belfort, France, 28–31 October 2013; pp. 1–10.
  12. Wang, J.; Hu, A.; Liu, C.; Li, X. A floor-map-aided WIFI/pseudo-odometry integration algorithm for an indoor positioning system. Sensors 2015, 15, 7096–7124. [Google Scholar] [CrossRef] [PubMed]
  13. Lim, C.-H.; Wan, Y.; Ng, B.-P.; See, C. A real-time indoor WIFI localization system utilizing smart antennas. IEEE Trans. Consum. Electron. 2007, 53, 618–622. [Google Scholar] [CrossRef]
  14. Lim, J.-S.; Jang, W.-H.; Yoon, G.-W.; Han, D.-S. Radio map update automation for WIFI positioning systems. IEEE Commun. Lett. 2013, 17, 693–696. [Google Scholar] [CrossRef]
  15. Mahfouz, M.R.; Kuhn, M.J.; To, G.; Fathy, A.E. Integration of UWB and wireless pressure mapping in surgical navigation. IEEE Trans. Microw. Theory Tech. 2009, 57, 2550–2564. [Google Scholar] [CrossRef]
  16. Marano, S.; Gifford, W.M.; Wymeersch, H.; Win, M.Z. Nlos identification and mitigation for localization based on UWB experimental data. IEEE J. Sel. Areas Commun. 2010, 28, 1026–1035. [Google Scholar] [CrossRef]
  17. Sanpechuda, T.; Kovavisaruch, L. A review of RFID localization: Applications and techniques. In Proceedings of the 5th International Conference on Electrical Engineering/Electronics, Computer, Telecommunications and Information Technology, Krabi, Thailand, 14–17 May 2008; pp. 769–772.
  18. Kim, T.; Shin, J.; Tak, S. Cell planning for indoor object tracking based on RFID. In Proceedings of the 10th International Conference on Mobile Data Management: Systems, Services and Middleware, Taipei, Taiwan, 18–20 May 2009; pp. 709–713.
  19. Nabih, A.K.; Osman, H.; Gomaa, M.; Aly, G.M. New fuzzy-based indoor positioning scheme using ZigBee wireless protocol. In Proceedings of the 7th International Conference on Computer Engineering & Systems (ICCES), Cairo, Egypt, 27–29 November 2012; pp. 16–20.
  20. Chang, A.Y.; Liu, T.-C. Performance evaluation of real-time indoor positioning with active RFID and ZigBee-based WSN systems. J. Vibroeng. 2013, 15, 736. [Google Scholar]
  21. Ghinamo, G.; Corbi, C.; Lovisolo, P.; Lingua, A.; Aicardi, I.; Grasso, N. Accurate positioning and orientation estimation in urban environment based on 3D models. In New Trends in Image Analysis and Processing—ICIAP 2015 Workshops; Murino, V., Ed.; Springer: Cham, Switzerland, 2015; pp. 185–192. [Google Scholar]
  22. Ghinamo, G.; Corbi, C.; Francini, G.; Lepsoy, S.; Lovisolo, P.; Lingua, A.; Aicardi, I. The MPEG7 visual search solution for image recognition based positioning using 3D models. In Proceedings of the 27th International Technical Meeting of The Satellite Division of the Institute of Navigation, Tampa, FL, USA, 8–12 September 2014.
  23. Feliz Alonso, R.; Zalama Casanova, E.; Gómez García-Bermejo, J. Pedestrian tracking using inertial sensors. J. Phys. Agents 2009, 3, 35–43. [Google Scholar]
  24. Madgwick, S.O. An Efficient Orientation Filter for Inertial and Inertial/Magnetic Sensor Arrays. Available online: https://www.samba.org/tridge/UAV/madgwick_internal_report.pdf (accessed on 30 April 2010).
  25. Madgwick, S.O.H.; Harrison, A.J.L.; Vaidyanathan, A. Estimation of IMU and MARG orientation using a gradient descent algorithm. In Proceedings of the 2011 IEEE International Conference on Rehabilitation Robotics (ICORR), Zurich, Switzerland, 29 June–1 July 2011; pp. 1–7.
  26. Bernstein, D.; Kornhauser, A. An Introduction to Map Matching for Personal Navigation Assistants; New Jersey TIDE Center: Newark, NJ, USA, 1998. [Google Scholar]
  27. Jiménez, A.R.; Seco, F.; Prieto, J.C.; Guevara, J. Indoor pedestrian navigation using an INS/EKF framework for yaw drift reduction and a foot-mounted IMU. In Proceedings of the 7th Workshop on Positioning Navigation and Communication (WPNC), Dresden, Germany, 11–12 March 2010; pp. 135–143.
  28. Moder, T.; Hafner, P.; Wisiol, K.; Wieser, M. 3D indoor positioning with pedestrian dead reckoning and activity recognition based on bayes filtering. In Proceedings of the International Conference on Indoor Positioning and Indoor Navigation, Busan, Korea, 27–30 October 2014.
  29. Zampella, F.; Khider, M.; Robertson, P.; Jiménez, A. Unscented kalman filter and magnetic angular rate update (MARU) for an improved pedestrian dead-reckoning. In Proceedings of the 2012 IEEE/ION Position Location and Navigation Symposium (PLANS), Myrtle Beach, SC, USA, 21–23 September 2011; pp. 129–139.
  30. Yang, Y.; Gao, W. An optimal adaptive kalman filter. J. Geod. 2006, 80, 177–183. [Google Scholar] [CrossRef]
  31. Ren, X.; Yang, Y. Robust spectral analysis of time series of Geo ionospheric correction. J. Geod. Geodyn. 2014, 2, 115–119. [Google Scholar]

