
Applications of 3D City Models: State of the Art Review


Abstract
:
1. Introduction

2. Related Work
3. Methodology
3.1. Principal Sources of Our Survey
3.2. Terminology and Segmentation

3.3. Criteria for the Inclusion
3.3.1. Granularity and Forms of the Data
3.3.2. Added Value of 3D Data
- use cases that are only possible with 3D city models as defined in the previous section, and
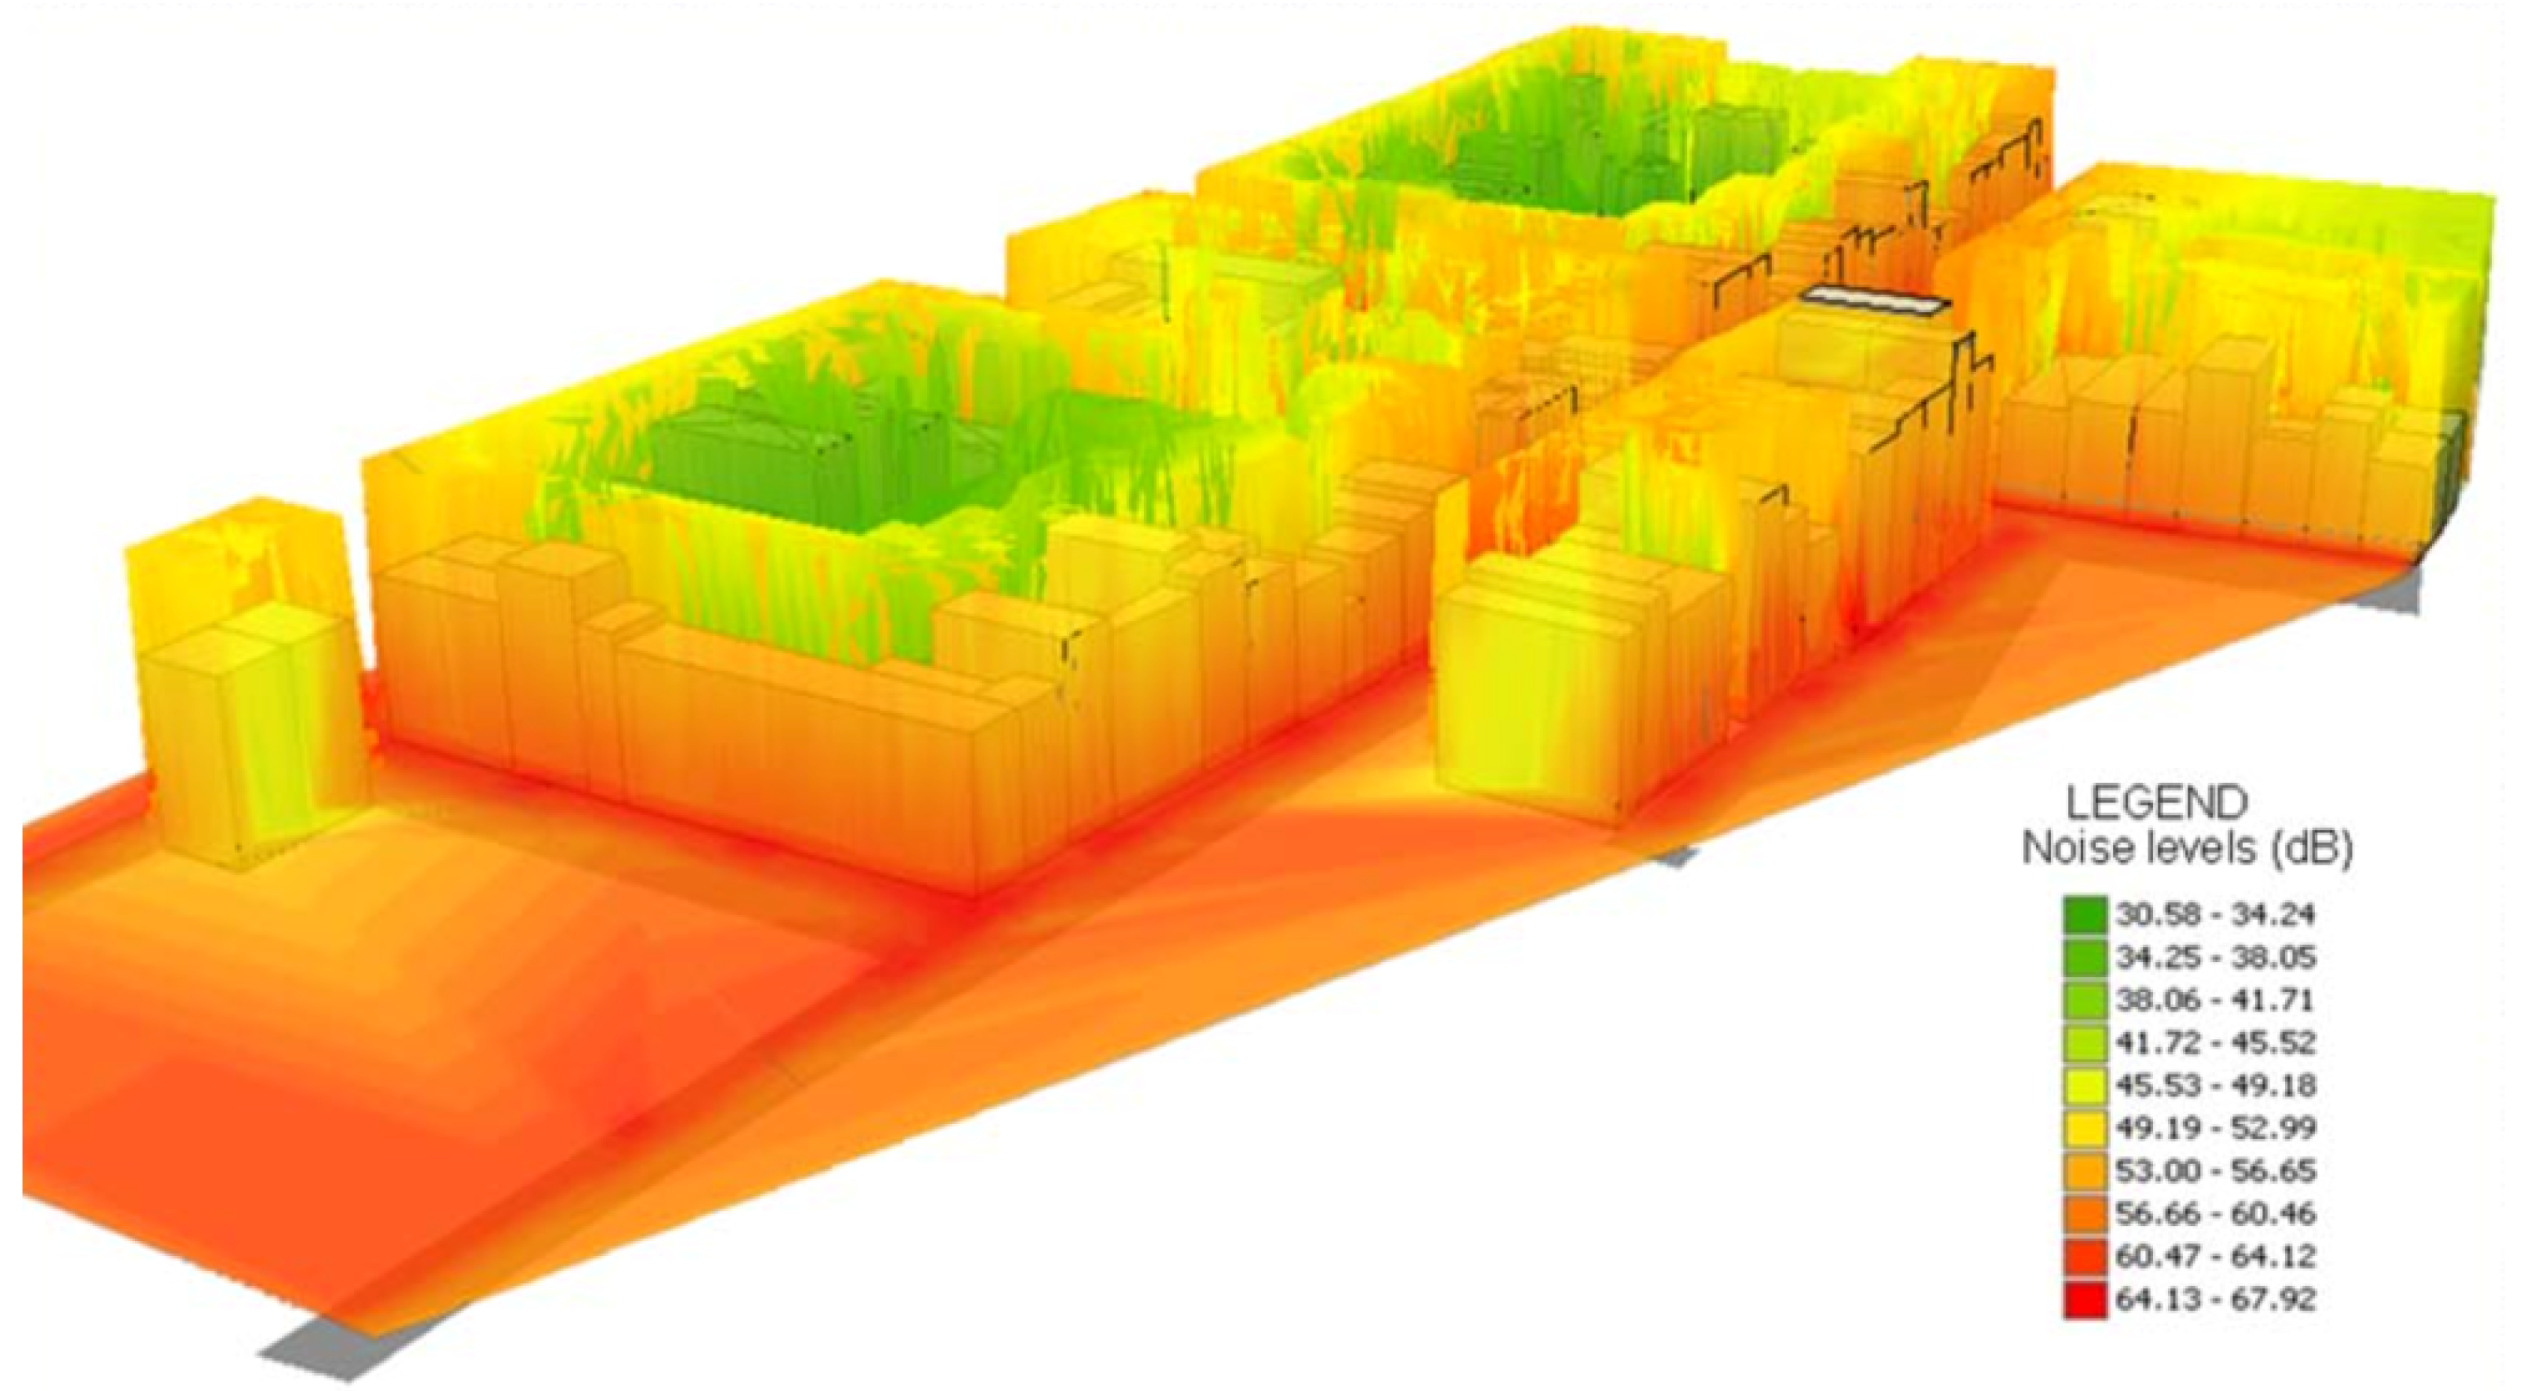
- use cases that are possible with 2(.5)D GIS data, but that are significantly improved when 3D data is used (e.g., increased accuracy, more applications). For instance, de Kluijver and Stoter [76] present a method to estimate the propagation of noise in urban environment from 2D data. In a subsequent paper, Stoter et al. [77] use 3D city models for the same purpose, providing a clear improvement in the estimation. While this use case is possible with 2D data, using 3D models adds a substantial increase in the accuracy of the results and their interpretation.
3.3.3. Limit on the Usefulness, and Minor or Potential Use Cases
3.4. Taxonomy of Use Cases
- Non-visualisation use cases, which do not require visualising the 3D models and the results of the 3D spatial operations. That is, the outcome of the spatial operation(s) can be stored in a database, e.g., solar potential of a roof surface, without the need of being visualised. The results can be visualised, but that is not essential to achieve the purpose of the use case, and it is not essential to visualise it in 3D (e.g., we can show the calculated information using color density instead).
- Visualisation-based use cases. This includes:
- Use cases that require running computations as in the group 1., but where visualisation is very important and the use cases would not make much sense without it (e.g., navigation, serious gaming, and urban planning).
- Visualisation-only use cases such as communication of urban information and virtual reality, which do not necessarily rely on spatial operations, but where 3D city models have been found as an important component. Note that we do not have empirical evidence, nor do we survey empirical studies in this paper. Therefore, we do not contend that these are best suited to be visualised in 3D; rather, we document that they are currently visualised in 3D in the body of literature we have surveyed.
- By the required minimum level of detail 3D city models are characterised by the level of detail (LOD), a measure that indicates their grade and scale [82,83]. The LOD implies the intended scope of use of 3D geoinformation and some use cases require datasets of a certain minimum LOD to be usable [84,85,86]. However, this classification is not a good idea for following reasons: (1) papers commonly do not give a focus on the LOD that was used in the analysis nor what would be the minimum required LOD; (2) the documented uses of LODs can be quite dispersed—we have encountered use cases that are used both with simple block models and architecturally detailed models containing interior (e.g., for determining the volumetric visibility); and (3) the performance of use cases is rarely investigated LOD-wise [87].
- By the level of spatial granularity The uses of 3D data might be grouped by the spatial extent of the object of interest (e.g., city and neighbourhood level—see the classification of Richter et al. [88]). This approach falls short because there is too much variation within a use case. For instance, the estimation of the solar potential can be performed on one building only but also on all buildings in a city.
- By the spatio-semantic coherence CityGML is well-known for its spatio-semantic approach to urban features [89], however, 3D city models may include polygon meshes where buildings, roads, and other urban features are not separable. This might not be relevant for use cases such as computational fluid dynamics and the estimation of the radio-wave propagation, but it is vital for use cases related to energy.We reject this criteria because, similarly to the other described principles, there is too much overlap within the use cases. For instance, estimating the insolation of buildings is usually done on semantic 3D city models in order to relate the estimated values to each building. However, this may not be important for applications such as the urban thermal comfort where the insolation may also be estimated for each triangle in the polygon mesh where all the urban features are considered together.
- By the nature of the output of the use case Another potential way to distinguish between use cases would be by their output: quantitative or non-quantitative. For instance, using 3D city models to estimate the floorspace results in an quantitative result in m [90], but using 3D city models to enhance the navigation experience cannot be quantified in such an unambiguous way. The reason why we have decided to exclude this criteria is again fuzziness: for instance, urban planners use 3D city models to analyse shadows cast by buildings, which can be quantified (e.g., area of the shadow cast on the ground in m or the shaded volume in m [87]), however, our impression is that urban planners do not quantify it.
- By the texture Use cases in which visualisation plays an important role considerably benefit from textures. This is an interesting criteria, but we have not found a convincing separation between use cases. In many use cases textures add some value, but they are not essential and there is no research on the performance of textures towards the quality of the utilisation. Recent research even indicates that the role of textures in 3D city models may be overestimated [91].
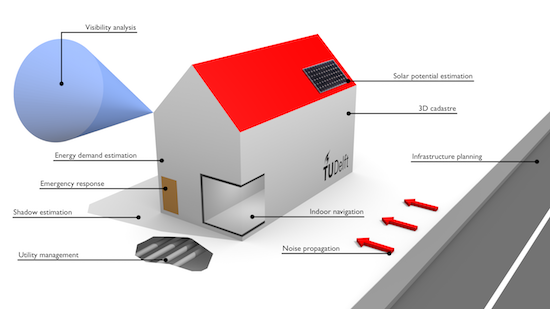
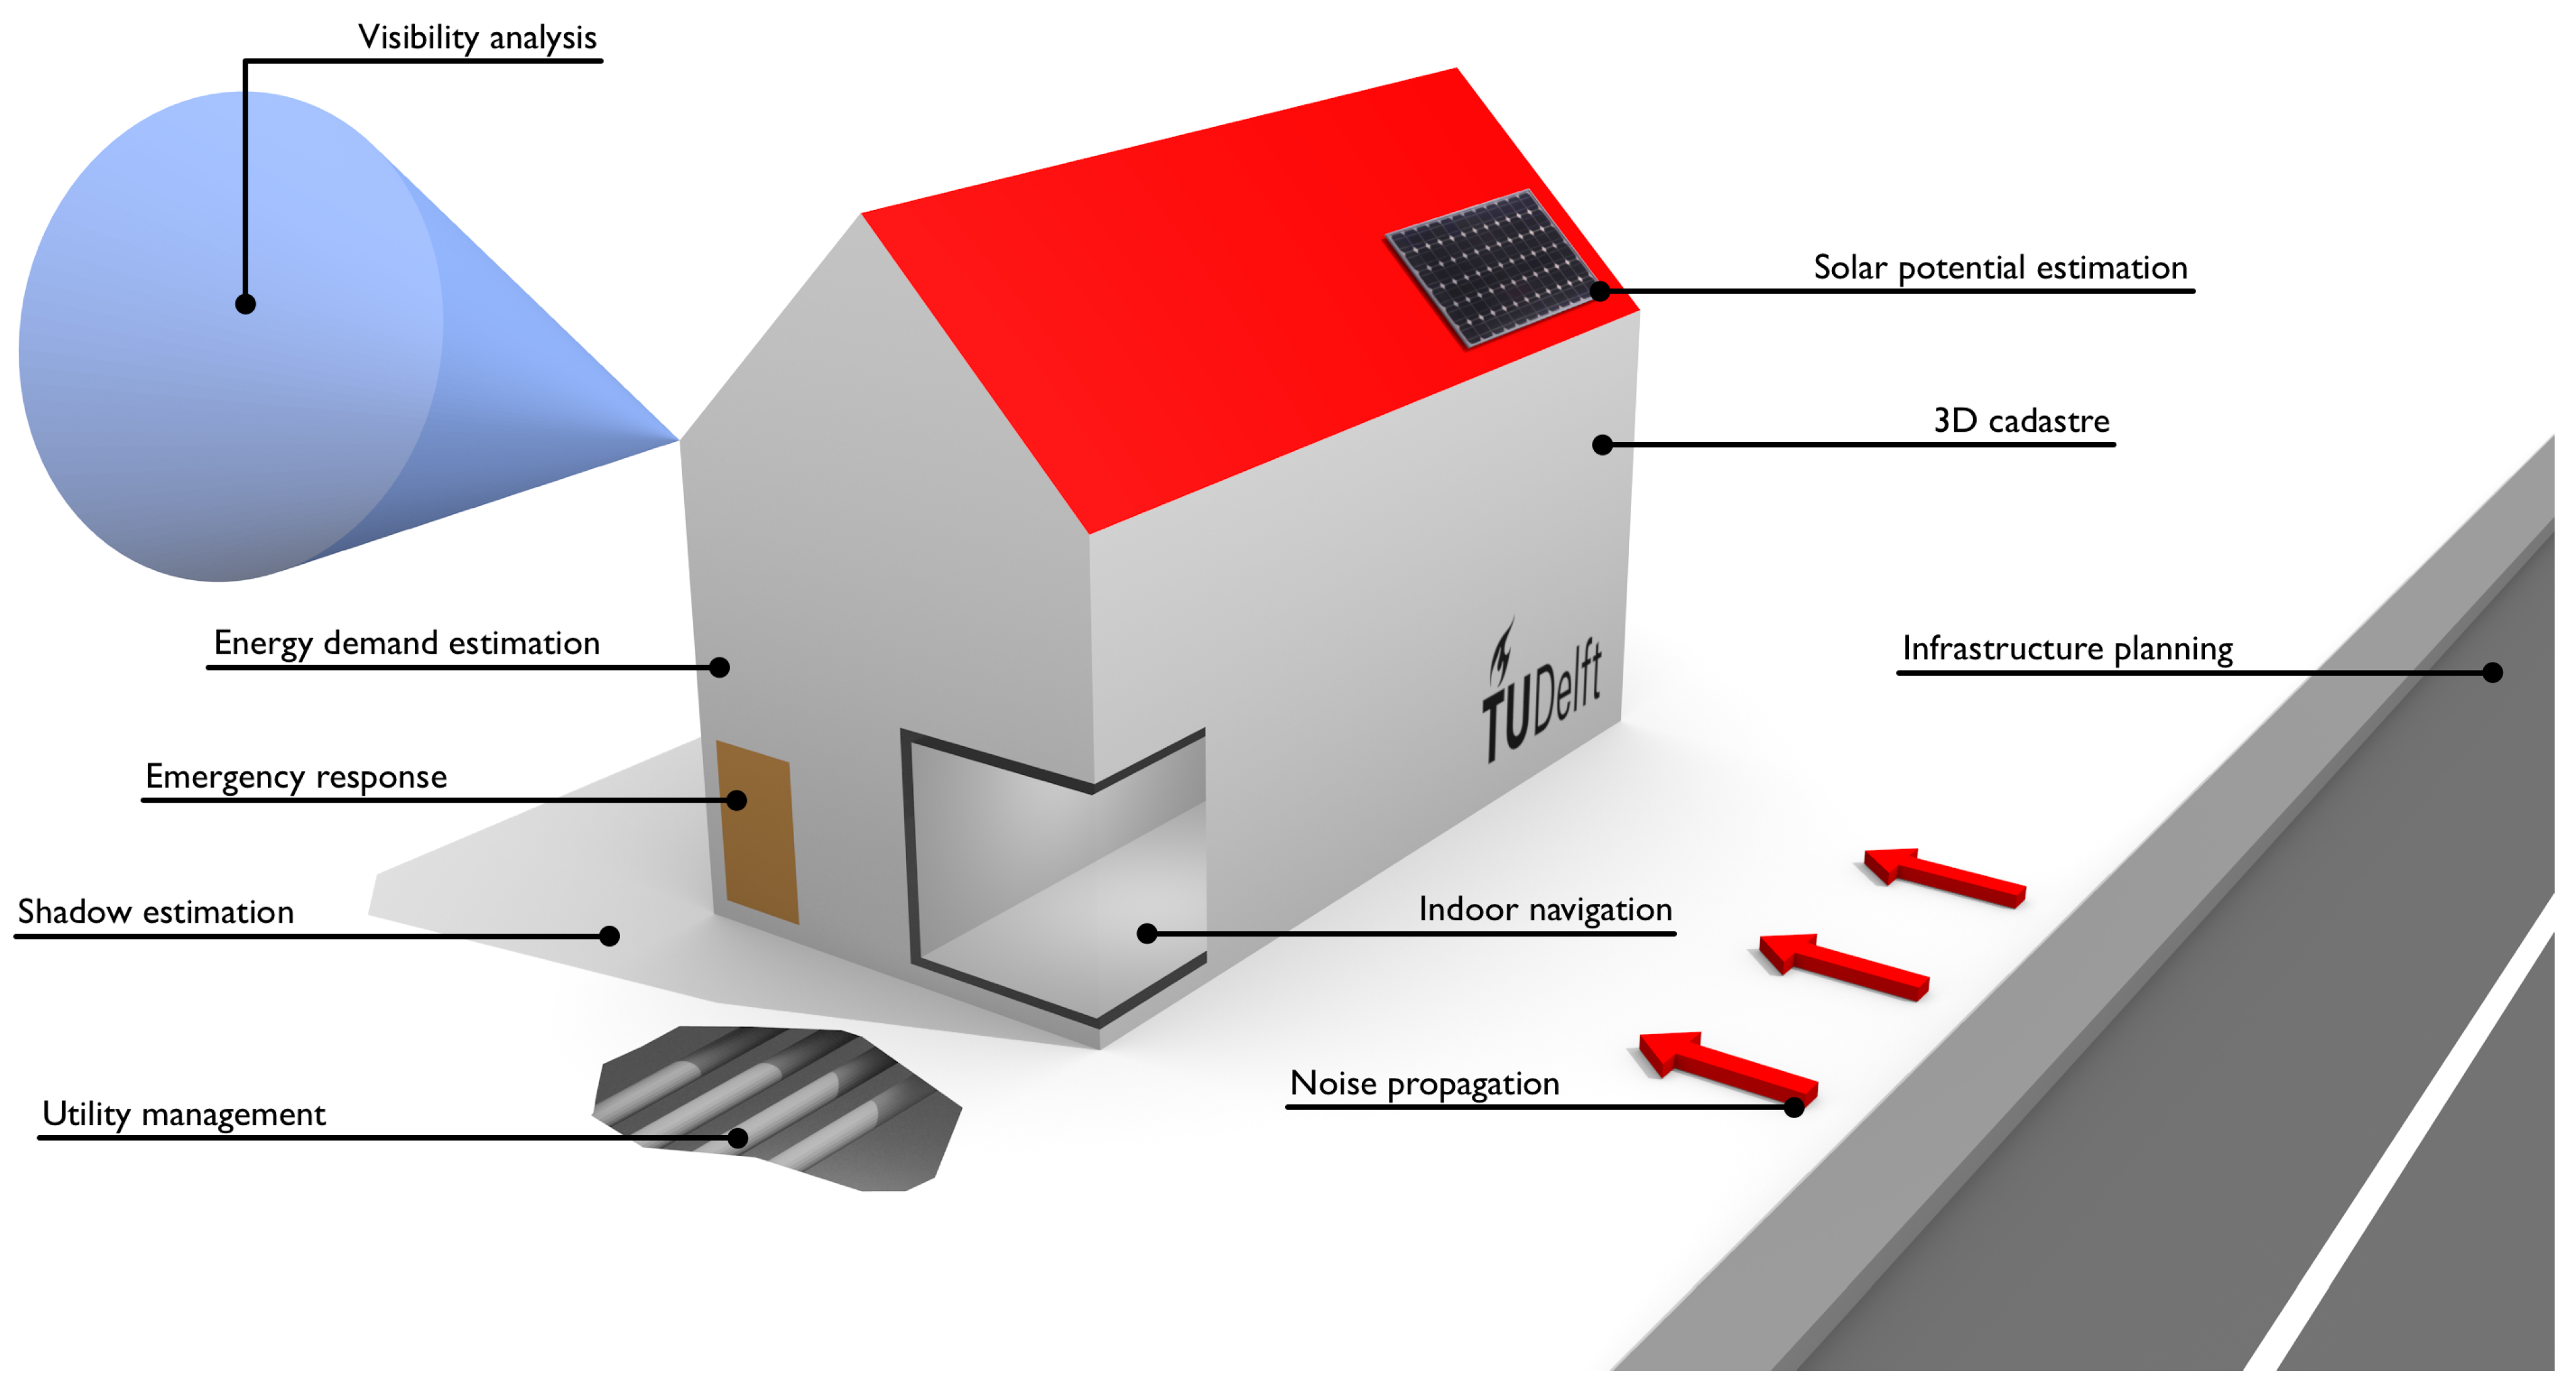
4. List and Description of Use Cases of 3D City Models
4.1. Non-Visualisation Use Cases
4.1.1. Estimation of the Solar Irradiation

| § | Use Case | Example of an Application |
|---|---|---|
| 4.1.1 | Estimation of the solar irradiation | Determining the suitability of a roof surface for installing photovoltaic panels |
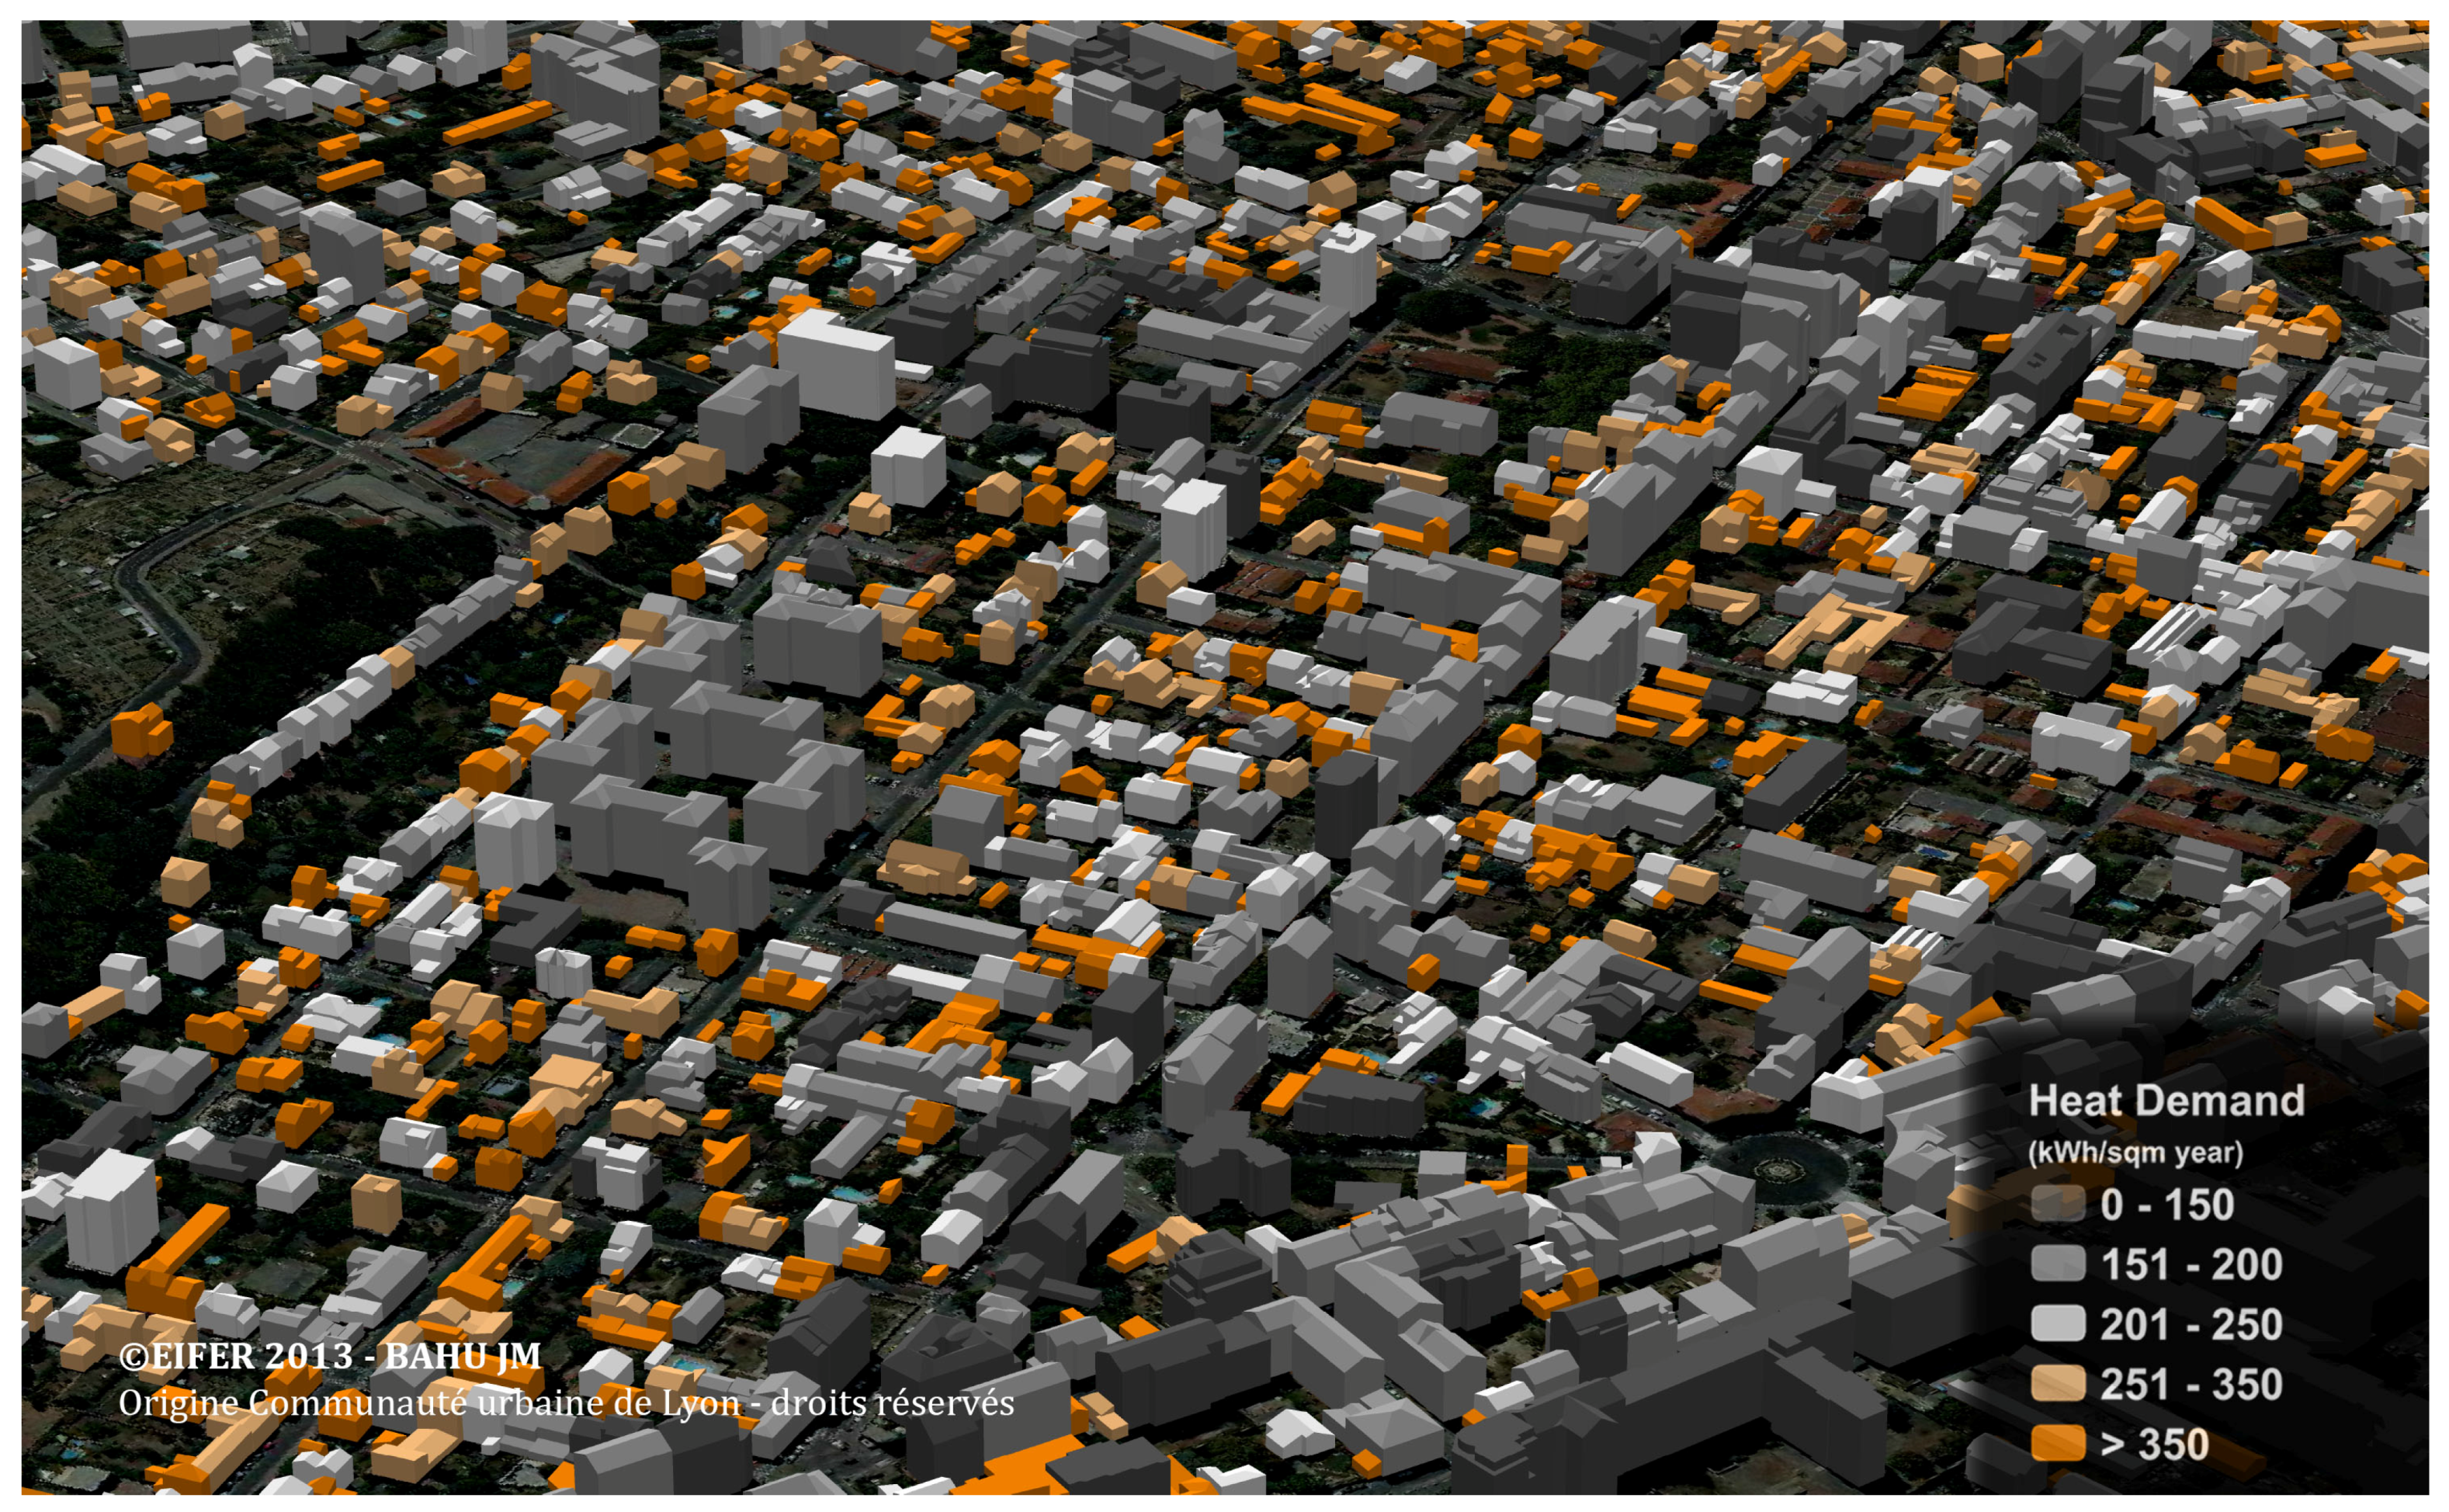
| 4.1.2 | Energy demand estimation | Assessing the return of a building energy retrofit |
| 4.1.3 | Aiding positioning | Map matching |
| 4.1.4 | Determination of the floorspace | Valuation of buildings |
| 4.1.5 | Classifying building types | Semantic enrichment of data sets |
| 4.2.1 | Geo-visualisation and visualisation enhancement | Flight simulation |
| 4.2.2 | Visibility analysis | Finding the optimal location to place a surveillance camera |
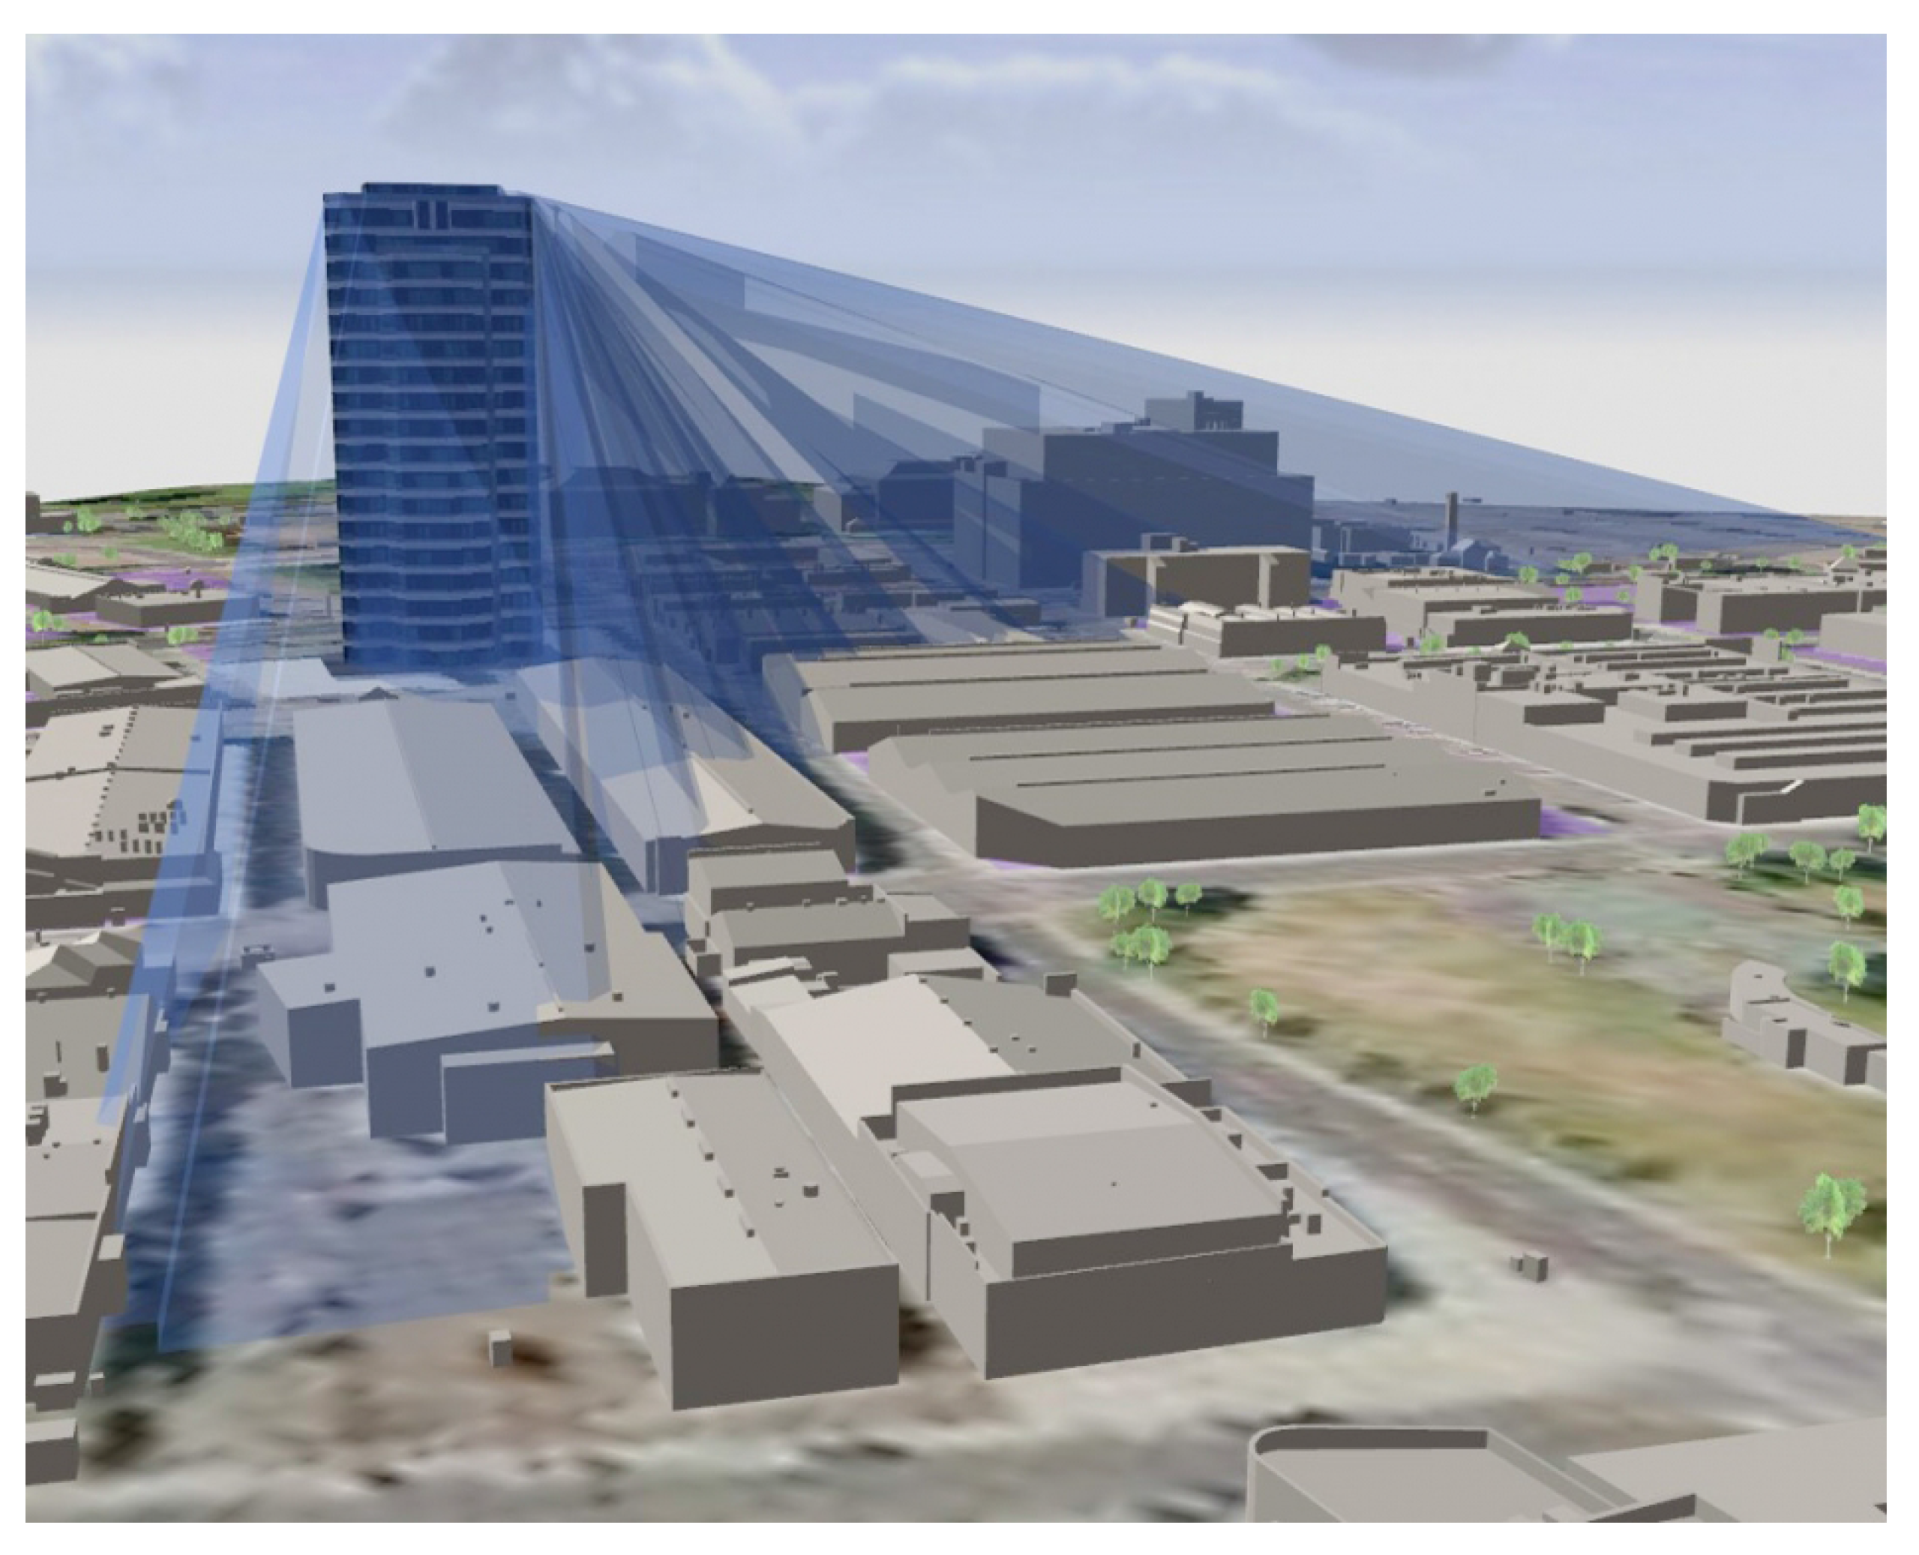
| 4.2.3 | Estimation of shadows cast by urban features | Determination of solar envelopes |
| 4.2.4 | Estimation of the propagation of noise in an urban environment | Traffic planning |
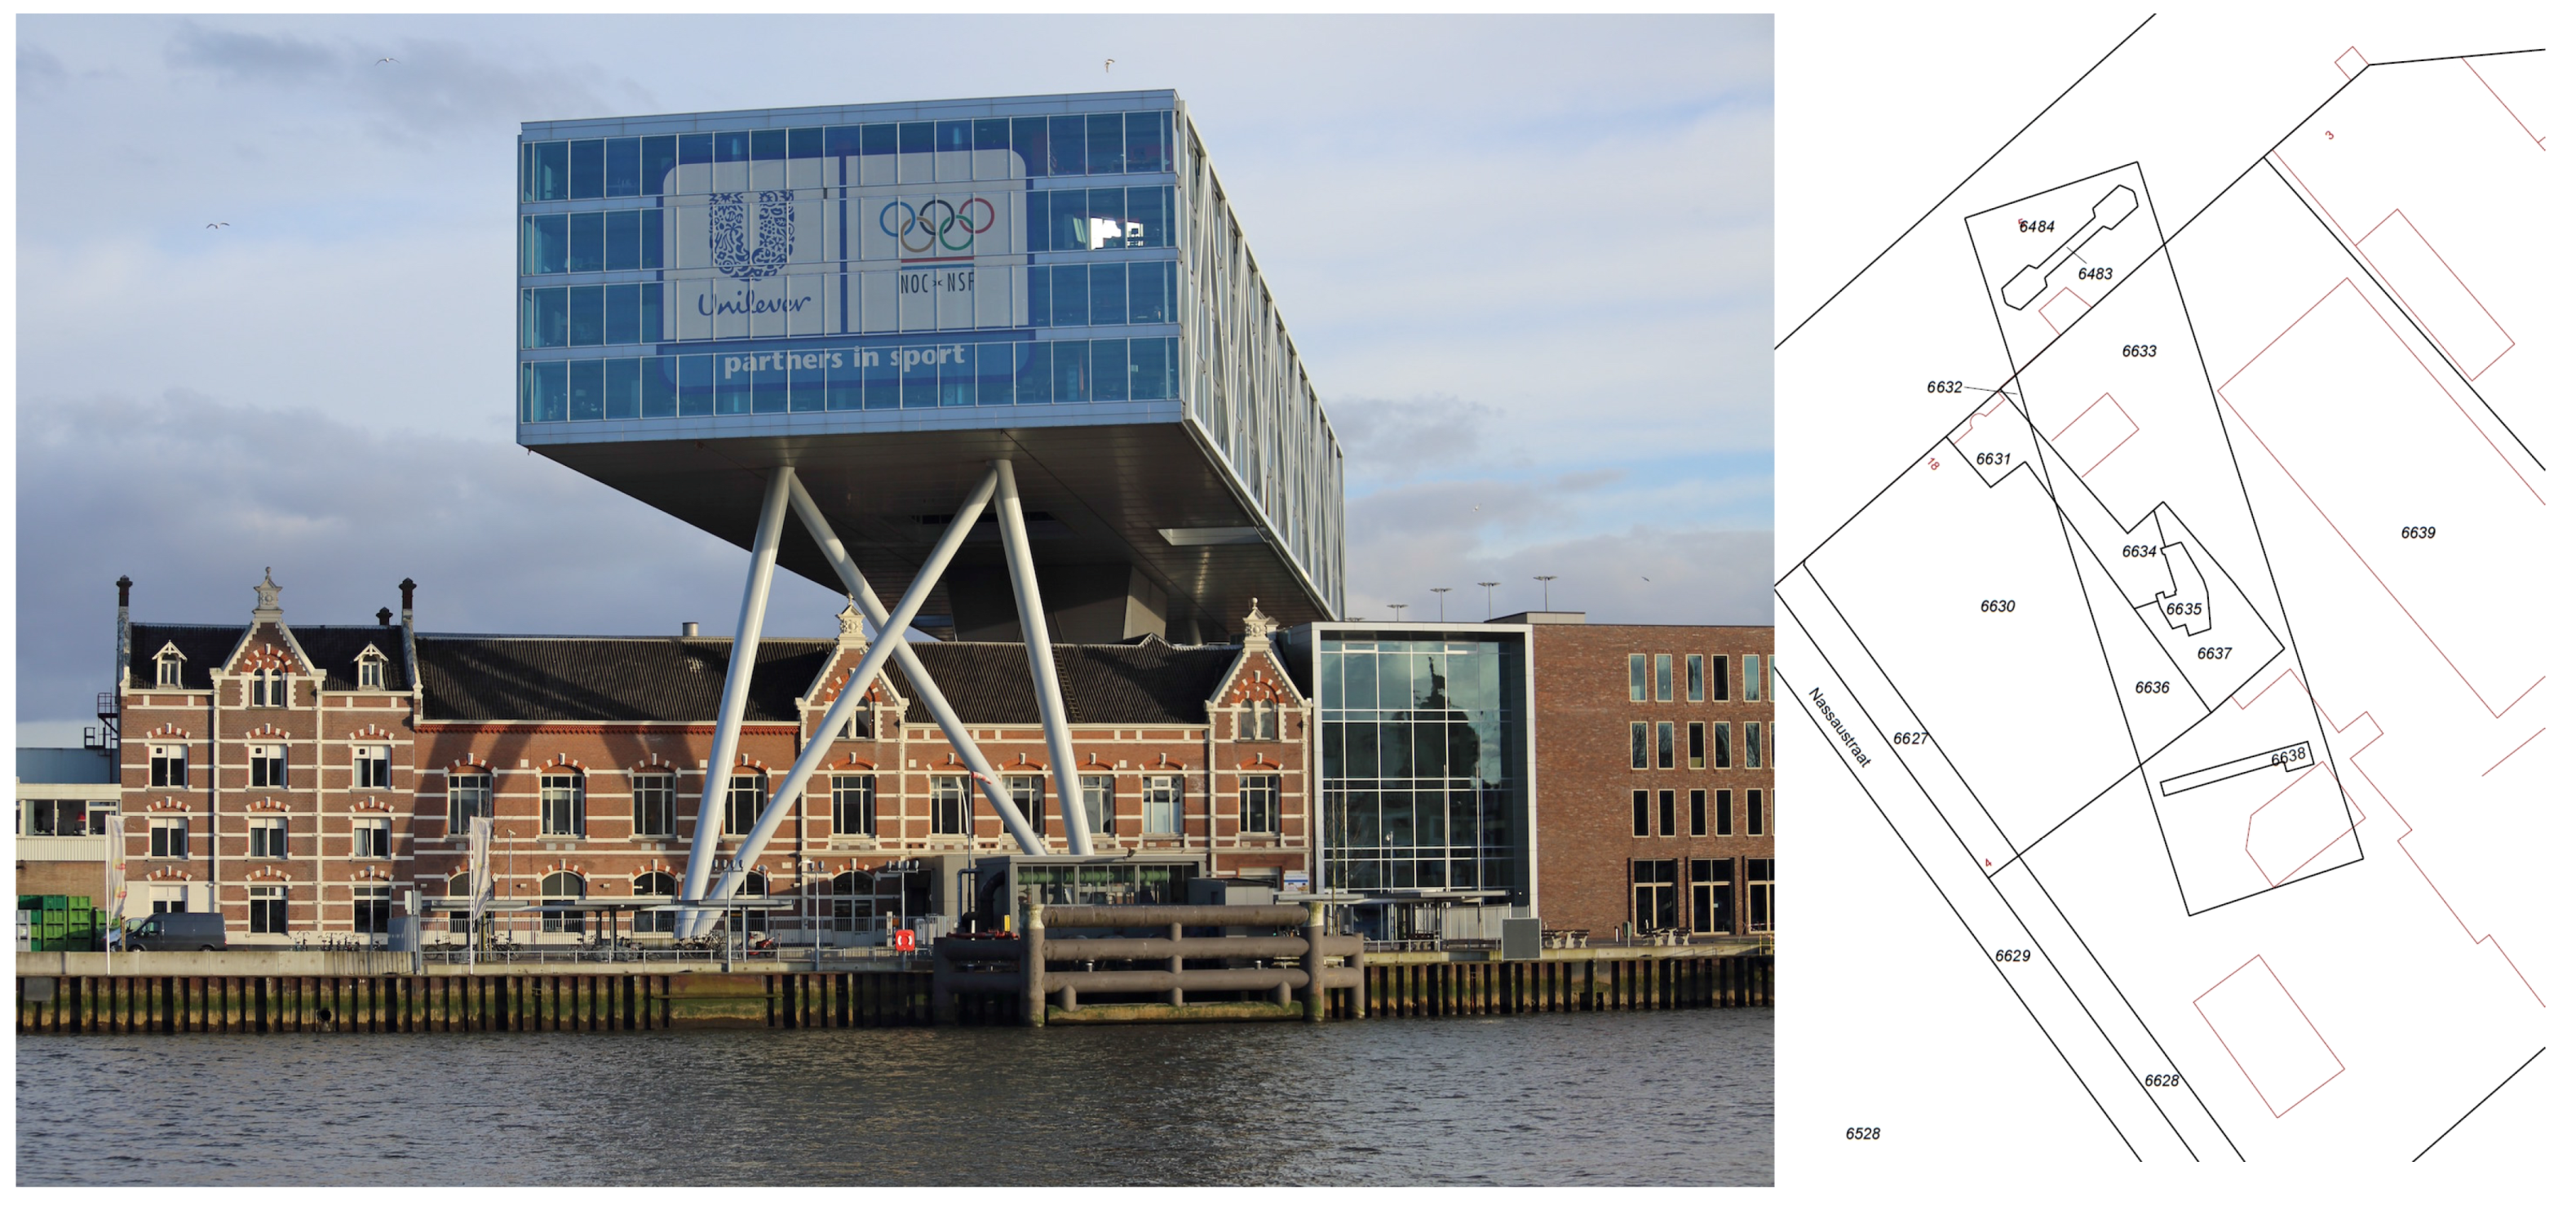
| 4.2.5 | 3D cadastre | Property registration |
| 4.2.6 | Visualisation for navigation | Navigation |
| 4.2.7 | Urban planning | Designing green areas |
| 4.2.8 | Visualisation for communication of urban information to citizenry | Virtual tours |
| 4.2.9 | Reconstruction of sunlight direction | Object recognition |
| 4.2.10 | Understanding SAR images | Interpretation of radar data |
| 4.2.11 | Facility management | Managing utilities |
| 4.2.12 | Automatic scaffold assembly | Civil engineering |
| 4.2.13 | Emergency response | Planning evacuation |
| 4.2.14 | Lighting simulations | Planning lighting of landmarks |
| 4.2.15 | Radio-wave propagation | Optimising radio infrastructure |
| 4.2.16 | Computational fluid dynamics | Predicting air quality |
| 4.2.17 | Estimating the population in an area | Crisis management |
| 4.2.18 | Routing | Understanding accessibility |
| 4.2.19 | Forecasting seismic damage | Insurance |
| 4.2.20 | Flooding | Mitigating damage to utility management |
| 4.2.21 | Change detection | Urban inventory |
| 4.2.22 | Volumetric density studies | Urban studies |
| 4.2.23 | Forest management | Predicting tree growth |
| 4.2.24 | Archaeology | Visualising ancient sites |

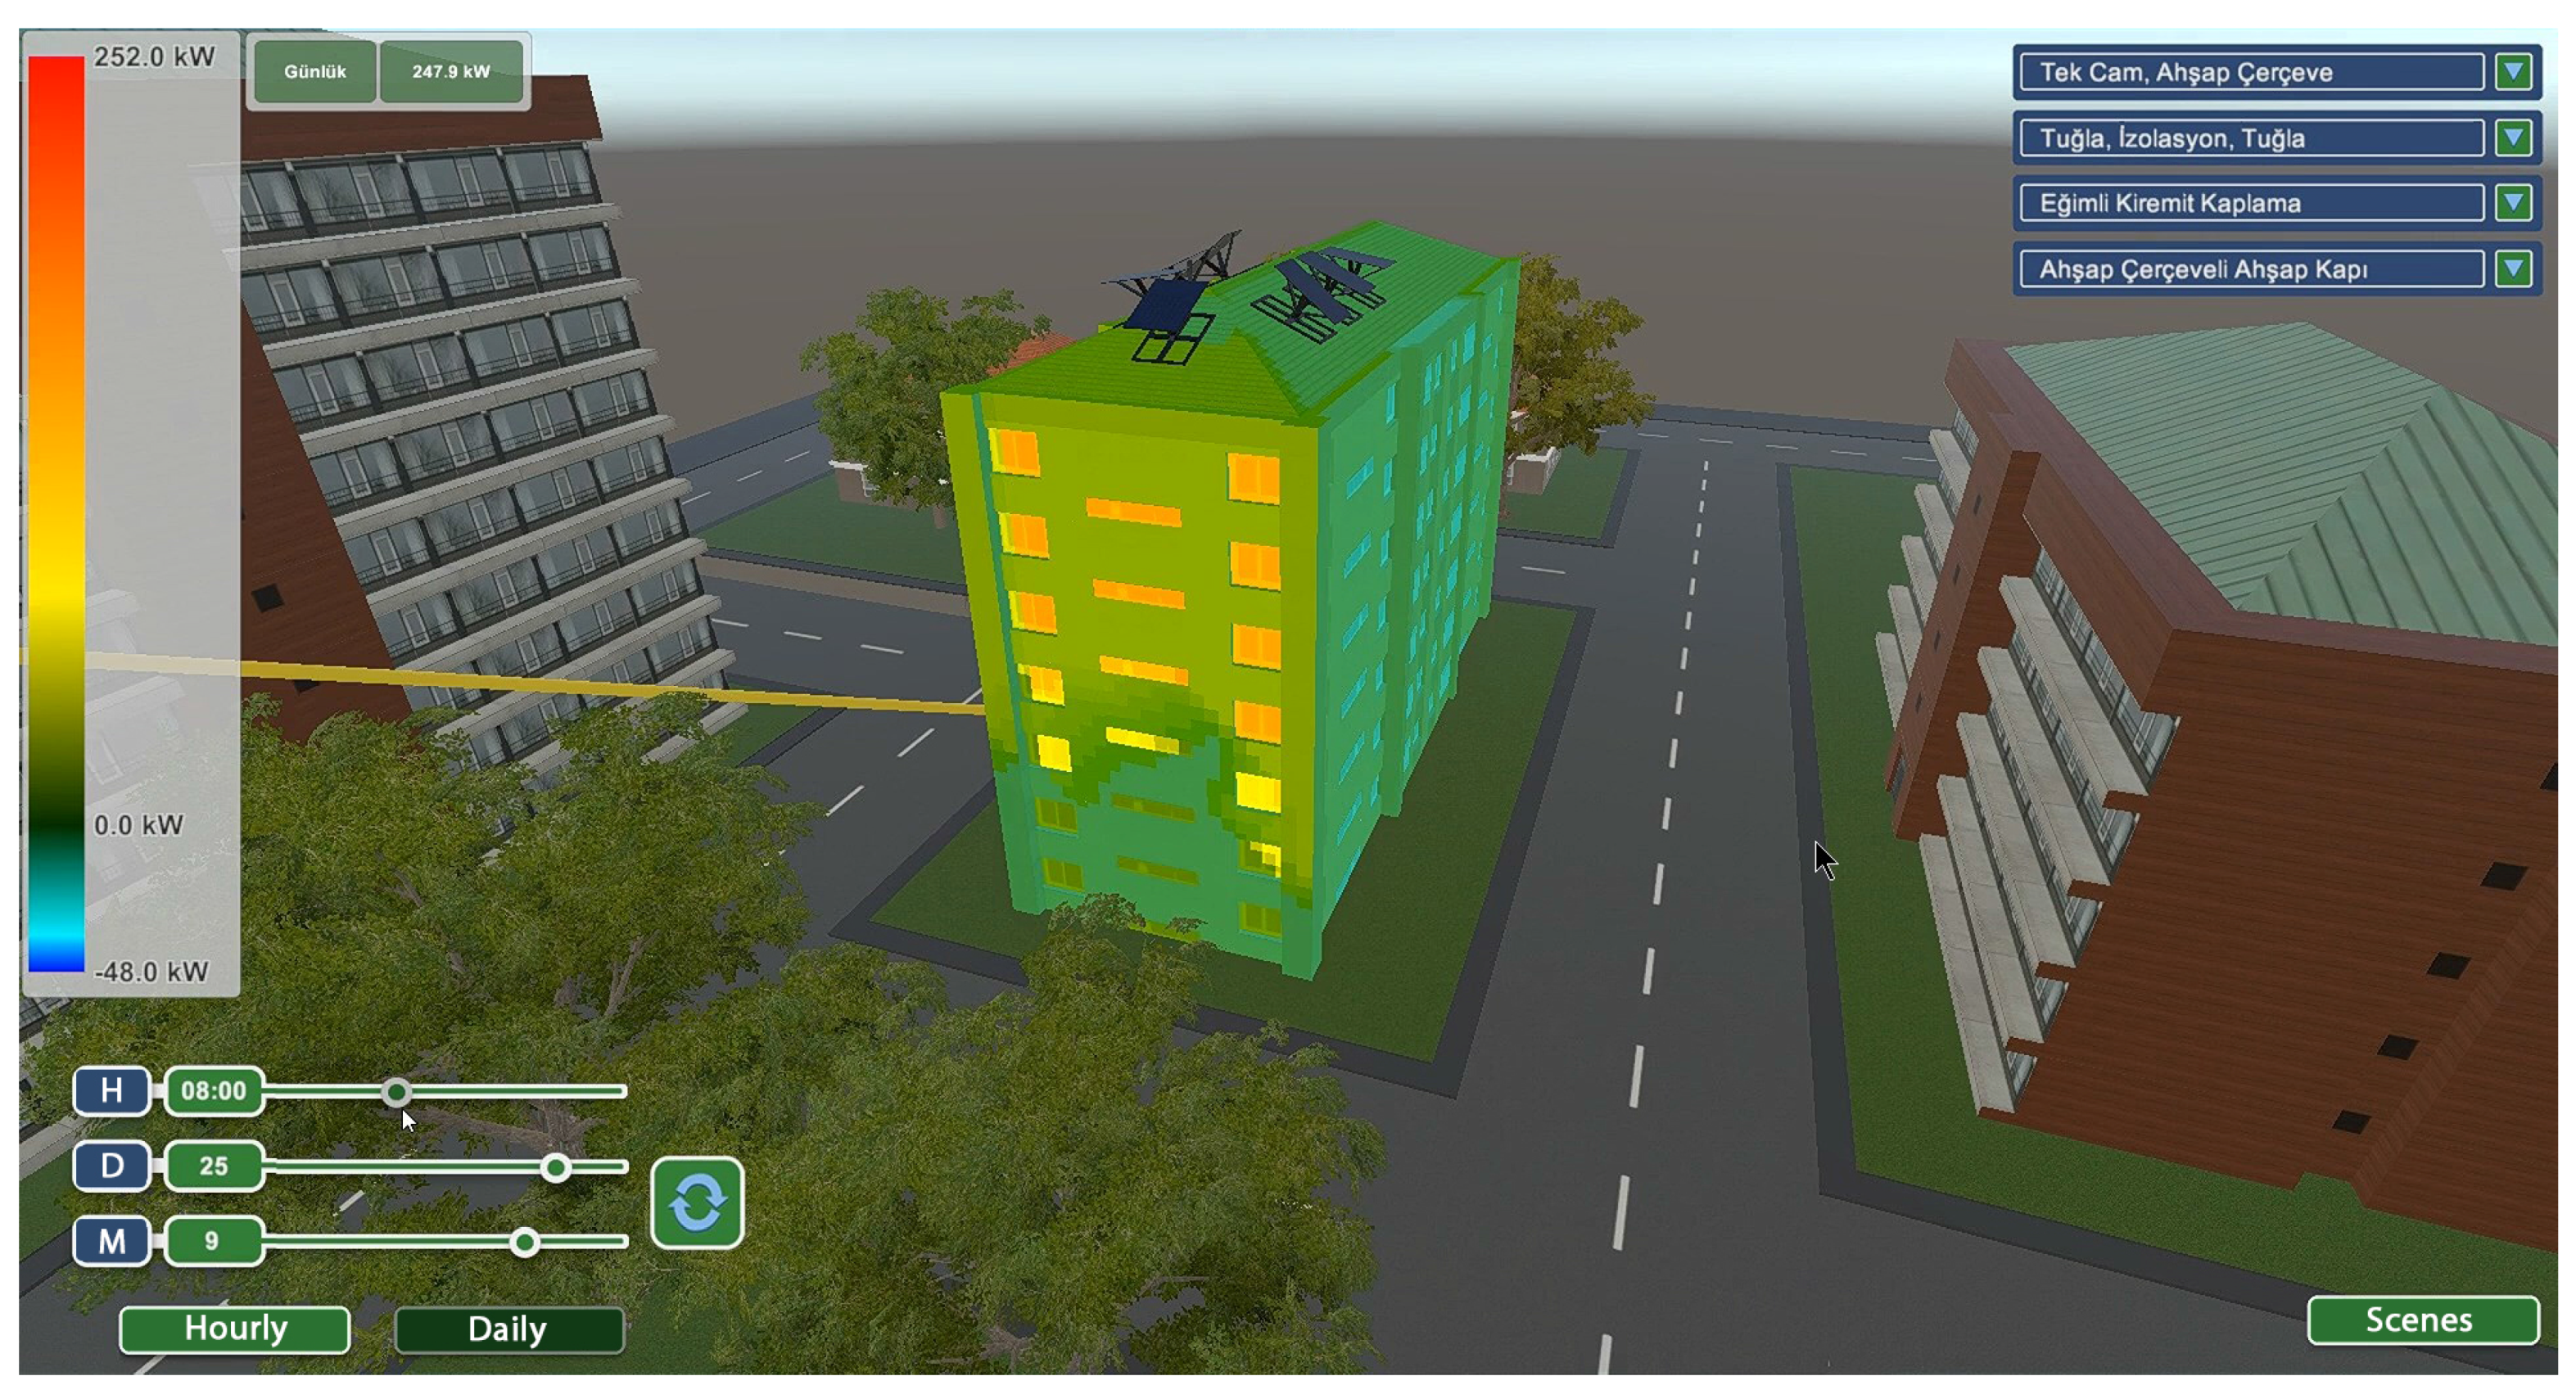
4.1.2. Energy Demand Estimation

4.1.3. Aiding Positioning
4.1.4. Determination of the Floorspace
4.1.5. Classifying Building Types
4.2. Visualisation-Based Use Cases
4.2.1. Geo-Visualisation and Visualisation Enhancement
4.2.2. Visibility Analysis
4.2.3. Estimation of Shadows Cast by Urban Features
4.2.4. Estimation of the Propagation of Noise in an Urban Environment

4.2.5. 3D Cadastre
4.2.6. Visualisation for Navigation
4.2.7. Urban Planning
4.2.8. Visualisation for Communication of Urban Information to Citizenry
4.2.9. Reconstruction of Sunlight Direction
4.2.10. Understanding Synthetic Aperture Radar Images
4.2.11. Facility Management
4.2.12. Automatic Scaffold Assembly
4.2.13. Emergency Response
4.2.14. Lighting Simulations
4.2.15. Radio-Wave Propagation
4.2.16. Computational Fluid Dynamics
4.2.17. Estimating the Population in an Area
4.2.18. Routing
4.2.19. Forecasting Seismic Damage
4.2.20. Flooding
4.2.21. Change Detection
4.2.22. Volumetric Density Studies
4.2.23. Forest Management
4.2.24. Archaeology
5. Conclusions
- Recent advances in augmented reality [392] and virtual reality [393]; developments in the fusion of computer graphics, GIS and BIM (e.g., [394,395,396,397,398,399]); and advances in procedural modelling [21,22,400,401,402] appear as promising catalysts that will contribute to providing 3D city models to practitioners.
- The majority of use cases rely on buildings, and not many use cases require models of other thematic classes, such as vegetation and bridges. We expect that, in the future, more use cases will take advantage of thematic features other than buildings.
- We expect that spatial analyses and use cases that are focused on 2D or 2.5D will evolve to take advantage of 3D city models when the case is appropriate (e.g., in logistics, for optimising delivery routes to customers [403]).
- Some application domains that have traditionally relied on 2D and/or 2.5D data are likely to embrace 3D use cases where third dimension is important. An example here is the house price models which can be augmented by already available 3D use cases such as estimating the environmental noise at a location.
Acknowledgements
Author Contributions
Conflicts of Interest
References
- Billen, R.; Cutting-Decelle, A.F.; Marina, O.; de Almeida, J.P.; Matteo, C.; Falquet, G.; Leduc, T.; Métral, C.; Moreau, G.; Perret, J.; et al. 3D City Models and urban information: Current issues and perspectives. In 3D City Models and Urban Information: Current Issues and Perspectives—European COST Action TU0801; EDP Sciences: Les Ulis, France, 2014; pp. 1–118. [Google Scholar]
- Zhu, Q.; Hu, M.; Zhang, Y.; Du, Z. Research and practice in three-dimensional city modeling. Geo-Spat. Inf. Sci. 2009, 12, 18–24. [Google Scholar] [CrossRef]
- Döllner, J.; Baumann, K.; Buchholz, H. Virtual 3D City Models as Foundation of Complex Urban Information Spaces. In Proceedings of the 11th International Conference on Urban Planning and Spatial Development in the Information Society, Vienna, Austria, 13–16 February 2006.
- Lancelle, M.; Fellner, D.W. Current issues on 3D city models. In Proceedings of the Proceedings of the 25th International Conference in Image and Vision Computing, Queenstown, New Zealand, 8–9 November 2010; pp. 363–369.
- Suveg, I.; Vosselman, G. Reconstruction of 3D building models from aerial images and maps. ISPRS J. Photogramm. Remote Sens. 2004, 58, 202–224. [Google Scholar] [CrossRef]
- Haala, N.; Kada, M. An update on automatic 3D building reconstruction. ISPRS J. Photogramm. Remote Sens. 2010, 65, 570–580. [Google Scholar] [CrossRef]
- Tomljenovic, I.; Höfle, B.; Tiede, D.; Blaschke, T. Building extraction from airborne laser scanning data: An analysis of the state of the art. Remote Sens. 2015, 7, 3826–3862. [Google Scholar] [CrossRef]
- Blaschke, T. Object based image analysis for remote sensing. ISPRS J. Photogramm. Remote Sens. 2010, 65, 2–16. [Google Scholar] [CrossRef]
- Ledoux, H.; Meijers, M. Topologically consistent 3D city models obtained by extrusion. Int. J. Geogr. Inf. Sci. 2011, 25, 557–574. [Google Scholar] [CrossRef]
- Arroyo Ohori, K.; Ledoux, H.; Stoter, J. A dimension-independent extrusion algorithm using generalised maps. Int. J. Geogr. Inf. Sci. 2015, 29, 1166–1186. [Google Scholar] [CrossRef]
- Shahzad, M.; Zhu, X.X. Robust reconstruction of building facades for large areas using spaceborne TomoSAR point clouds. IEEE Trans. Geosci. Remote Sens. 2015, 53, 752–769. [Google Scholar] [CrossRef]
- Zhu, X.X.; Shahzad, M. Facade reconstruction using multiview spaceborne TomoSAR point clouds. IEEE Trans. Geosci. Remote Sens. 2014, 52, 3541–3552. [Google Scholar] [CrossRef]
- Schmitt, M. Reconstruction of urban surface models from multi-aspect and multi-baseline interferometric SAR. Ph.D. Thesis, Technische Universität München, München, Germany, 2014. [Google Scholar]
- Stilla, U.; Soergel, U.; Thoennessen, U. Potential and limits of InSAR data for building reconstruction in built-up areas. ISPRS J. Photogramm. Remote Sens. 2003, 58, 113–123. [Google Scholar] [CrossRef]
- Thiele, A.; Wegner, J.D.; Soergel, U. Building reconstruction from multi-aspect InSAR data. In Remote Sensing and Digital Image Processing; Soergel, U., Ed.; Springer: Dordrecht, The Netherlands, 2010; pp. 187–214. [Google Scholar]
- Donkers, S.; Ledoux, H.; Zhao, J.; Stoter, J. Automatic conversion of IFC datasets to geometrically and semantically correct CityGML LOD3 buildings. Trans. GIS 2015. [Google Scholar] [CrossRef]
- Yin, X.; Wonka, P.; Razdan, A. Generating 3D building models from architectural drawings: A survey. IEEE Comput. Graph. Appl. 2009, 29, 20–30. [Google Scholar] [CrossRef] [PubMed]
- Lewis, R.; Séquin, C. Generation of 3D building models from 2D architectural plans. Comput.-Aided Des. 1998, 30, 765–779. [Google Scholar] [CrossRef]
- Sirmacek, B.; Lindenbergh, R. Accuracy assessment of building point clouds automatically generated from iphone images. Int. Arch. Photogramm. Remote Sens. Spat. Inf. Sci. 2014, XL-5, 547–552. [Google Scholar]
- Rosser, J.; Morley, J.; Smith, G. Modelling of building interiors with mobile phone sensor data. ISPRS Int. J. Geo-Inf. 2015, 4, 989–1012. [Google Scholar] [CrossRef]
- Besuievsky, G.; Patow, G. Recent advances on LoD for procedural urban models. In Proceedings of the 2014 Workshop on Processing Large Geospatial Data, Cardiff, UK, 8 July 2014.
- Tsiliakou, E.; Labropoulos, T.; Dimopoulou, E. Procedural modeling in 3D GIS environment. Int. J. 3-D Inf. Model. 2014, 3, 17–34. [Google Scholar] [CrossRef]
- Müller, P.; Wonka, P.; Haegler, S.; Ulmer, A.; van Gool, L. Procedural modeling of buildings. ACM Trans. Graph. 2006, 25, 614–623. [Google Scholar] [CrossRef]
- Smelik, R.M.; Tutenel, T.; Bidarra, R.; Benes, B. A Survey on procedural modelling for virtual worlds. Comput. Graph. Forum 2014, 33, 31–50. [Google Scholar] [CrossRef]
- Biljecki, F.; Ledoux, H.; Stoter, J. Error propagation in the computation of volumes in 3D city models with the Monte Carlo method. ISPRS Ann. Photogramm. Remote Sens. Spat. Inf. Sci. 2014, II-2, 31–39. [Google Scholar] [CrossRef]
- Martinović, A. Inverse Procedural Modeling of Buildings. Ph.D. Thesis, KU Leuven, Leuven, Belgium, 2015. [Google Scholar]
- Over, M.; Schilling, A.; Neubauer, S.; Zipf, A. Generating web-based 3D City Models from OpenStreetMap: The current situation in Germany. Comput. Environ. Urban Syst. 2010, 34, 496–507. [Google Scholar] [CrossRef]
- Goetz, M. Towards generating highly detailed 3D CityGML models from OpenStreetMap. Int. J. Geogr. Inf. Sci. 2013, 27, 845–865. [Google Scholar] [CrossRef]
- Goetz, M.; Zipf, A. Towards defining a framework for the automatic derivation of 3D CityGML models from Volunteered Geographic Information. Int. J. 3-D Inf. Model. 2012, 1, 1–16. [Google Scholar] [CrossRef]
- Sinning-Meister, M.; Gruen, A.; Dan, H. 3D city models for CAAD-supported analysis and design of urban areas. ISPRS J. Photogramm. Remote Sens. 1996, 51, 196–208. [Google Scholar] [CrossRef]
- Shiode, N. 3D urban models: Recent developments in the digital modelling of urban environments in three-dimensions. GeoJournal 2001, 52, 263–269. [Google Scholar] [CrossRef]
- Coors, V.; Flick, S. Integrating levels of detail in a web-based 3D-GIS. In Proceedings of the 6th ACM International Symposium on Advances in Geographic Information Systems, Washington, DC, USA, 2–7 November 1998.
- Stoter, J.; Zlatanova, S. 3D GIS, where are we standing? In Proceedings on the ISPRS Joint Workshop on Spatial, Temporal and Multi-Dimensional Data Modeling and Analysis, Cardiff, UK, 5–8 September 2003.
- Ulm, K. Virtual 3D City Models—Satisfaction through sustainability. Geomat. World 2010, 18, 16–18. [Google Scholar]
- Kolbe, T.H.; Gröger, G. Towards unified 3D city models. In Proceedings of the ISPRS Commission IV Joint Workshop—Challenges in Geospatial Analysis, Integration and Visualization II, Stuttgart, Germany, 8–9 September 2003.
- Ahmed, F.C.; Sekar, S.P. Using three-dimensional volumetric analysis in everyday urban planning processes. Appl. Spat. Anal. Policy 2014, 8, 393–408. [Google Scholar] [CrossRef]
- Kolbe, T.H. Representing and exchanging 3D city models with CityGML. In 3D Geo-Information Sciences; Zlatanova, S., Lee, J., Eds.; Springer: Berlin, Germany, 2009; pp. 15–31. [Google Scholar]
- Gröger, G.; Plümer, L. How to achieve consistency for 3D city models. GeoInformatica 2009, 15, 137–165. [Google Scholar] [CrossRef]
- Lemmens, M. Applying geo-information technology. In Geo-information. Technologies, Applications and the Environment; Springer Netherlands: Dordrecht, The Netherlands, 2011; pp. 229–258. [Google Scholar]
- Batty, M.; Chapman, D.; Evans, S.; Haklay, M.; Kueppers, S.; Shiode, N.; Smith, A.; Torrens, P.M. Visualizing the City: Communicating Urban Design to Planners and Decision-Makers; Technical Report Paper 26; Centre for Advanced Spatial Analysis (UCL): London, UK, 2000. [Google Scholar]
- Ross, L. Virtual 3D City Models in Urban Land Management—Technologies and Applications. Ph.D. Thesis, Technische Universität Berlin, Berlin, Germany, 2010. [Google Scholar]
- Stoter, J.; Beetz, J.; Ledoux, H.; Reuvers, M.; Klooster, R.; Janssen, P.; Penninga, F.; Zlatanova, S.; van den Brink, L. Implementation of a national 3D standard: Case of The Netherlands. In Progress and New Trends in 3D Geoinformation Sciences; Springer: Berlin, Germany, 2012; pp. 277–298. [Google Scholar]
- Stoter, J.; Vosselman, G.; Goos, J.; Zlatanova, S.; Verbree, E.; Klooster, R.; Reuvers, M. Towards a national 3D spatial data infrastructure: Case of The Netherlands. Photogramm.—Fernerkund.—Geoinf. 2011, 2011, 405–420. [Google Scholar] [CrossRef]
- Goos, J.; Klooster, R.; Stoter, J.; Verbree, E.; Vestjens, G.; Vosselman, G. 3D Pilot: Eindrapport Werkgroep Aanbod van 3D Geo-Informatie; Netherlands Geodetic Commission: Delft, The Netherlands, 2011. [Google Scholar]
- Berntssen, M.; Danes, M.; Goos, J.; Klooster, R.; Kooijman, J.; Noordegraaf, L.; Stoter, J.; Veldhuis, C.; Vosselman, G. 3D Pilot: Eindrapport Werkgroep 3D Use Cases; Netherlands Geodetic Commission: Delft, The Netherlands, 2012. [Google Scholar]
- Wong, K.K.Y. Economic Value of 3D Geographic Information; EuroSDR and the Department of Computer Science, University College London: London, UK, 2015. [Google Scholar]
- Stoter, J.; Roensdorf, C.; Home, R.; Capstick, D.; Streilein, A.; Kellenberger, T.; Bayers, E.; Kane, P.; Dorsch, J.; Woźniak, P.; et al. 3D modelling with national coverage: Bridging the gap between research and practice. In Advances in 3D Geo-Information Sciences; Springer International Publishing: New York, NY, USA, 2015; pp. 207–225. [Google Scholar]
- Cetl, V.; Tomić, H.; Lisjak, J. Primjena 3D Modela u Upravljanju Gradom; Faculty of Geodesy, University of Zagreb: Zagreb, Croatia, 2013. [Google Scholar]
- Snyder, G.I. The benefits of improved national elevation data. Photogramm. Eng. Remote Sens. 2013, 79, 105–110. [Google Scholar]
- Dassot, M.; Constant, T.; Fournier, M. The use of terrestrial LiDAR technology in forest science: application fields, benefits and challenges. Ann. For. Sci. 2011, 68, 959–974. [Google Scholar] [CrossRef]
- Axelsson, P. Processing of laser scanner data—algorithms and applications. ISPRS J. Photogramm. Remote Sens. 1999, 54, 138–147. [Google Scholar] [CrossRef]
- Zhang, X.; Zhu, Q. Applications of 3D city models based spatial analysis to urban design. Int. Arch. Photogramm. Remote Sens. Spat. Inf. Sci. 2004, XXXV/B2, 325–329. [Google Scholar]
- Chen, R. The development of 3D city model and its applications in urban planning. In Proceedings of the 19th International Conference on Geoinformatics, Shanghai, China, 26 June 2011; pp. 1–5.
- Shepherd, I.D.H. Travails in the Third Dimension: A Critical Evaluation of Three-dimensional Geographical Visualization. In Geographic Visualization: Concepts, Tools and Applications; Dodge, M., McDerby, M., Turner, M., Eds.; John Wiley & Sons, Ltd.: Chichester, UK, 2008; pp. 199–210. [Google Scholar]
- Dall’Acqua, L.; Coltekin, A.; Noetzli, J. A comparative user evaluation of six alternative permafrost visualizations for reading and interpreting temperature information. In Proceedings of the GeoViz Hamburg 2013 Interactive Maps that Help People Think, Hamburg, Germany, 6–8 March 2013.
- Savage, D.M.; Wiebe, E.N.; Devine, H.A. Performance of 2D versus 3D topographic representations for different task types. Proc. Hum. Factors Ergon. Soc. Ann. Meet. 2004, 48, 1793–1797. [Google Scholar] [CrossRef]
- St John, M.; Cowen, M.B.; Smallman, H.S.; Oonk, H.M. The use of 2D and 3D displays for shape-understanding versus relative-position tasks. Hum. Factors 2001, 43, 79–98. [Google Scholar] [CrossRef] [PubMed]
- Smallman, H.S.; Cook, M.B.; Manes, D.I.; Cowen, M.B. Naïve realism in terrain appreciation. In Proceedings of the 51st Annual Meeting of the Human Factors and Ergonomics Society, Baltimore, ML, USA, 1–5 October 2007.
- Hegarty, M.; Smallman, H.S.; Stull, A.T.; Canham, M.S. Naïve cartography: How intuitions about display configuration can hurt performance. Cartograph.: Int. J. Geogr. Inf. Geovis. 2009, 44, 171–186. [Google Scholar] [CrossRef]
- Biljecki, F. A scientometric analysis of selected GIScience journals. Int. J. Geogr. Inf. Sci. 2016. [Google Scholar] [CrossRef]
- Sanborn. 3D Cities™; Sanborn: Colorado Springs, CO, USA, 2014. [Google Scholar]
- Coors, V.; Holweg, D.; Matthias, E.; Petzold, B. Broschüre “3D-Stadtmodelle”; Ingeoforum: Darmstadt, Germany, 2013; p. 20. [Google Scholar]
- Billen, R.; Cutting-Decelle, A.F.; Métral, C.; Falquet, G.; Zlatanova, S.; Marina, O. Challenges of semantic 3D city models. Int. J. 3-D Inf. Model. 2015, 4, 68–76. [Google Scholar] [CrossRef]
- Gröger, G.; Plümer, L. CityGML—Interoperable semantic 3D city models. ISPRS J. Photogramm. Remote Sens. 2012, 71, 12–33. [Google Scholar] [CrossRef]
- Open Geospatial Consortium. OGC City Geography Markup Language (CityGML) Encoding Standard 2.0.0; Open Geospatial Consortium, 2012. [Google Scholar]
- SwissTopo. swissBUILDINGS3D 1.0. Vereinfachte 3D-Gebäude der Schweiz; Swiss Federal Office of Topography: Wabern, Switzerland, 2010. [Google Scholar]
- Stoter, J.; Ledoux, H.; Reuvers, M.; van den Brink, L.; Klooster, R.; Janssen, P.; Beetz, J.; Penninga, F.; Vosselman, G. Establishing and implementing a national 3D standard in The Netherlands. Photogramm.—Fernerkund.—Geoinf. 2013, 2013, 381–392. [Google Scholar] [CrossRef]
- Gröger, G.; Plümer, L. The interoperable building model of the European Union. In Geoinformation for Informed Decisions; Abdul-Rahman, A., Boguslawski, P., Anton, F., Said, M.N., Omar, K.M., Eds.; Springer International Publishing: New York, NY, USA, 2013; pp. 1–17. [Google Scholar]
- Ordnance Survey. OS MasterMap Topography Layer—Building Height Attribute. Getting Started Guide, 1st ed.; Ordnance Survey: Southampton, UK, 2014. [Google Scholar]
- AdV (Arbeitsgemeinschaft der Vermessungsverwaltungen). Modellierungsbeispiele für 3D-Gebäudemodelle; AdV: Berlin, Germany, 2013. [Google Scholar]
- Aringer, K.; Roschlaub, R. Bavarian 3D building model and update concept based on LiDAR, image matching and cadastre information. In Innovations in 3D Geo-Information Sciences; Springer International Publishing: Cham, Switzerland, 2014; pp. 143–157. [Google Scholar]
- Jacobson, I. Object-Oriented Software Engineering: A Use Case Driven Approach; Addison-Wesley: Reading, MA, USA, 1992. [Google Scholar]
- Kaden, R.; Kolbe, T.H. Simulation-based total energy demand estimation of buildings using semantic 3D city models. Int. J. 3-D Inf. Model. 2014, 3, 35–53. [Google Scholar] [CrossRef]
- Lu, Z.; Im, J.; Quackenbush, L. A volumetric approach to population estimation using lidar remote sensing. Photogramm. Eng. Remote Sens. 2011, 77, 1145–1156. [Google Scholar] [CrossRef]
- Tavares, G.; Zsigraiova, Z.; Semiao, V.; Carvalho, M.G. Optimisation of MSW collection routes for minimum fuel consumption using 3D GIS modelling. Waste Manag. 2009, 29, 1176–1185. [Google Scholar] [CrossRef] [PubMed]
- de Kluijver, H.; Stoter, J. Noise mapping and GIS: Optimising quality and efficiency of noise effect studies. Comput. Environ. Urban Syst. 2003, 27, 85–102. [Google Scholar] [CrossRef]
- Stoter, J.; de Kluijver, H.; Kurakula, V. 3D noise mapping in urban areas. Int. J. Geogr. Inf. Sci. 2008, 22, 907–924. [Google Scholar] [CrossRef]
- Herbert, G.; Chen, X. A comparison of usefulness of 2D and 3D representations of urban planning. Cartogr. Geogr. Inf. Sci. 2015, 42, 22–32. [Google Scholar] [CrossRef]
- Taylor, S.M.; Breston, B.E.; Hall, F.L. The effect of road traffic noise on house prices. J. Sound Vib. 1982, 80, 523–541. [Google Scholar] [CrossRef]
- Cohen, J.P.; Coughlin, C.C. Spatial hedonic models of airport noise, proximity, and housing prices. J. Reg. Sci. 2008, 48, 859–878. [Google Scholar] [CrossRef]
- Wilhelmsson, M. The impact of traffic noise on the values of single-family houses. J. Environ. Plan. Manag. 2000, 43, 799–815. [Google Scholar] [CrossRef]
- Biljecki, F.; Ledoux, H.; Stoter, J.; Zhao, J. Formalisation of the level of detail in 3D city modelling. Comput. Environ. Urban Syst. 2014, 48, 1–15. [Google Scholar] [CrossRef]
- Coltekin, A.; Reichenbacher, T. High quality geographic services and bandwidth limitations. Future Internet 2011, 3, 379–396. [Google Scholar] [CrossRef] [Green Version]
- Biljecki, F.; Heuvelink, G.B.M.; Ledoux, H.; Stoter, J. Propagation of positional error in 3D GIS: estimation of the solar irradiation of building roofs. Int. J. Geogr. Inf. Sci. 2015, 29, 2269–2294. [Google Scholar] [CrossRef]
- Arroyo Ohori, K.; Ledoux, H.; Biljecki, F.; Stoter, J. Modeling a 3D cty model and its levels of detail as a true 4D model. ISPRS Int. J. Geo-Inf. 2015, 4, 1055–1075. [Google Scholar] [CrossRef]
- Strzalka, A.; Monien, D.; Koukofikis, A.; Eicker, U. Sensitivity analysis for minimization of input data for urban scale heat demand forecasting. In Proceedings of the 14th International Conference on Sustainable Energy Technologies SET, Nottingham, UK, 25–27 August 2015; pp. 1–10.
- Biljecki, F.; Ledoux, H.; Stoter, J. Does a finer level of detail of a 3D city model bring an improvement for estimating shadows? In Advances in 3D Geoinformation; Springer International Publishing: Cham, Switzerland, 2016; in press. [Google Scholar]
- Richter, D.; Richter, K.F.; Winter, S. The impact of classification approaches on the detection of hierarchies in place descriptions. In Advances in 3D Geo-Information Sciences; Vandenbroucke, D., Bucher, B., Crompvoets, J., Eds.; Springer International Publishing: Cham, Switzerland, 2013; pp. 191–206. [Google Scholar]
- Stadler, A.; Kolbe, T.H. Spatio-semantic coherence in the integration of 3D city models. Int. Arch. Photogramm. Remote Sens. Spat. Inf. Sci. 2007, XXXVI-2/C43, 8. [Google Scholar]
- Boeters, R.; Arroyo Ohori, K.; Biljecki, F.; Zlatanova, S. Automatically enhancing CityGML LOD2 models with a corresponding indoor geometry. Int. J. Geogr. Inf. Sci. 2015, 29, 2248–2268. [Google Scholar] [CrossRef]
- Garnett, R.; Freeburn, J.T. Visual acceptance of library-generated CityGML LOD3 building models. Cartograph.: Int. J. Geogr. Inf. Geovis. 2014, 49, 218–224. [Google Scholar] [CrossRef]
- Kumar, L.; Skidmore, A.K.; Knowles, E. Modelling topographic variation in solar radiation in a GIS environment. Int. J. Geogr. Inf. Sci. 1997, 11, 475–497. [Google Scholar] [CrossRef]
- Fath, K.; Stengel, J.; Sprenger, W.; Wilson, H.R.; Schultmann, F.; Kuhn, T.E. A method for predicting the economic potential of (building-integrated) photovoltaics in urban areas based on hourly Radiance simulations. Sol. Energy 2015, 116, 357–370. [Google Scholar] [CrossRef]
- Redweik, P.; Catita, C.; Brito, M. Solar energy potential on roofs and facades in an urban landscape. Sol. Energy 2013, 97, 332–341. [Google Scholar] [CrossRef]
- Eicker, U.; Nouvel, R.; Duminil, E.; Coors, V. Assessing passive and active solar energy resources in cities using 3D city models. Energy Proced. 2014, 57, 896–905. [Google Scholar] [CrossRef]
- Šúri, M.; Hofierka, J. A new GIS-based solar radiation model and its application to photovoltaic assessments. Trans. GIS 2004, 8, 175–190. [Google Scholar] [CrossRef]
- Santos, T.; Gomes, N.; Freire, S.; Brito, M.C.; Santos, L.; Tenedório, J.A. Applications of solar mapping in the urban environment. Appl. Geogr. 2014, 51, 48–57. [Google Scholar] [CrossRef]
- Jakubiec, J.A.; Reinhart, C.F. A method for predicting city-wide electricity gains from photovoltaic panels based on LiDAR and GIS data combined with hourly Daysim simulations. Sol. Energy 2013, 93, 127–143. [Google Scholar] [CrossRef]
- Szabó, S.; Enyedi, P.; Horváth, M.; Kovács, Z.; Burai, P.; Csoknyai, T.; Szabó, G. Automated registration of potential locations for solar energy production with Light Detection And Ranging (LiDAR) and small format photogrammetry. J. Clean. Prod. 2016, 112, 3820–3829. [Google Scholar] [CrossRef]
- Wiginton, L.K.; Nguyen, H.T.; Pearce, J.M. Quantifying rooftop solar photovoltaic potential for regional renewable energy policy. Comput. Environ. Urban Syst. 2010, 34, 345–357. [Google Scholar] [CrossRef]
- Peronato, G.; Rey, E.; Andersen, M. Sampling of building surfaces towards an early assessment of BIPV potential in urban contexts. In Proceedings of the 31st International PLEA Conference, Bologna, Italy, 9–11 September 2015.
- Strzalka, A.; Alam, N.; Duminil, E.; Coors, V.; Eicker, U. Large scale integration of photovoltaics in cities. Appl. Energy 2012, 93, 413–421. [Google Scholar] [CrossRef]
- Redweik, P.; Catita, C.; Brito, M.C. 3D local scale solar radiation model based on urban LiDAR data. In Proceedings of the ISPRS Workshop High-Resolution Earth Imaging for Geospatial Information, Hannover, Germany, 14–17 June 2011; pp. 1–5.
- Li, Z.; Zhang, Z.; Davey, K. Estimating geographical PV potential using LiDAR data for buildings in downtown San Francisco. Trans. GIS 2015, 19, 930–963. [Google Scholar] [CrossRef]
- Lukač, N.; Žlaus, D.; Seme, S.; Žalik, B.; Štumberger, G. Rating of roofs’ surfaces regarding their solar potential and suitability for PV systems, based on LiDAR data. Appl. Energy 2013, 102, 803–812. [Google Scholar] [CrossRef]
- Catita, C.; Redweik, P.; Pereira, J.; Brito, M.C. Extending solar potential analysis in buildings to vertical facades. Comput. Geosci. 2014, 66, 1–12. [Google Scholar] [CrossRef]
- Liang, J.; Gong, J.; Li, W.; Ibrahim, A.N. A visualization-oriented 3D method for efficient computation of urban solar radiation based on 3D—2D surface mapping. Int. J. Geogr. Inf. Sci. 2014, 28, 780–798. [Google Scholar] [CrossRef]
- Hofierka, J.; Zlocha, M. A new 3-D solar radiation model for 3-D city models. Trans. GIS 2012, 16, 681–690. [Google Scholar] [CrossRef]
- Hofierka, J.; Kaňuk, J. Assessment of photovoltaic potential in urban areas using open-source solar radiation tools. Renew. Energy 2009, 34, 2206–2214. [Google Scholar] [CrossRef]
- Liang, J.; Gong, J.; Zhou, J.; Zhou, J.; Ibrahim, A.N.; Li, M.; Li, M. An open-source 3D solar radiation model integrated with a 3D Geographic Information System. Environ. Model. Softw. 2015, 64, 94–101. [Google Scholar] [CrossRef]
- Carneiro, C.; Golay, F. Solar radiation over the urban texture: LiDAR data and image processing techniques for environmental analysis at city scale. In 3D Geo-Information Sciences; Lee, J., Zlatanova, S., Eds.; Springer: Berlin, Germany, 2009; pp. 319–340. [Google Scholar]
- Jochem, A.; Höfle, B.; Rutzinger, M.; Pfeifer, N. Automatic roof plane detection and analysis in airborne Lidar point clouds for solar potential sssessment. Sensors 2009, 9, 5241–5262. [Google Scholar] [CrossRef] [PubMed]
- Gooding, J.; Crook, R.; Tomlin, A.S. Modelling of roof geometries from low-resolution LiDAR data for city-scale solar energy applications using a neighbouring buildings method. Appl. Energy 2015, 148, 93–104. [Google Scholar] [CrossRef]
- Yu, B.; Liu, H.; Wu, J.; Lin, W.M. Investigating impacts of urban morphology on spatio-temporal variations of solar radiation with airborne LIDAR data and a solar flux model: a case study of downtown Houston. Int. J. Remote Sens. 2009, 30, 4359–4385. [Google Scholar] [CrossRef]
- Freitas, S.; Catita, C.; Redweik, P.; Brito, M.C. Modelling solar potential in the urban environment: State-of-the-art review. Renew. Sustain. Energy Rev. 2015, 41, 915–931. [Google Scholar] [CrossRef]
- Chwieduk, D.A. Recommendation on modelling of solar energy incident on a building envelope. Renew. Energy 2009, 34, 736–741. [Google Scholar] [CrossRef]
- Nichol, J.; Wong, M.S. Modeling urban environmental quality in a tropical city. Landsc. Urban Plan. 2005, 73, 49–58. [Google Scholar] [CrossRef]
- Vermeulen, T.; Knopf-Lenoir, C.; Villon, P.; Beckers, B. Urban layout optimization framework to maximize direct solar irradiation. Comput. Environ. Urban Syst. 2015, 51, 1–12. [Google Scholar] [CrossRef]
- Aarsen, R.; Janssen, M.; Ramkisoen, M.; Biljecki, F.; Quak, W.; Verbree, E. Installed base registration of decentralised solar panels with applications in crisis management. Int. Arch. Photogramm. Remote Sens. Spat. Inf. Sci. 2015, XL-3/W3, 219–223. [Google Scholar] [CrossRef]
- Helbich, M.; Jochem, A.; Mücke, W.; Höfle, B. Boosting the predictive accuracy of urban hedonic house price models through airborne laser scanning. Comput. Environ. Urban Syst. 2013, 39, 81–92. [Google Scholar] [CrossRef]
- Saran, S.; Wate, P.; Srivastav, S.K.; Krishna Murthy, Y.V.N. CityGML at semantic level for urban energy conservation strategies. Ann. GIS 2015, 21, 27–41. [Google Scholar] [CrossRef]
- Robinson, D.; Stone, A. A simplified radiosity algorithm for general urban radiation exchange. Build. Serv. Eng. Res. Technol. 2005, 26, 271–284. [Google Scholar] [CrossRef]
- Carrión, D.; Lorenz, A.; Kolbe, T.H. Estimation of the energetic rehabilitation state of buildings for the city of Berlin using a 3D city model represented in CityGML. Int. Arch. Photogramm. Remote Sens. Spat. Inf. Sci. 2010, XXXVIII-4/W15, 31–35. [Google Scholar]
- Krüger, A.; Kolbe, T.H. Building analysis for urban energy planning using key indicators on virtual 3D city models—The energy atlas of Berlin. Int. Arch. Photogramm. Remote Sens. Spat. Inf. Sci. 2012, XXXIX-B2, 145–150. [Google Scholar] [CrossRef]
- Strzalka, A.; Bogdahn, J.; Coors, V.; Eicker, U. 3D City modeling for urban scale heating energy demand forecasting. HVAC&R Res. 2011, 17, 526–539. [Google Scholar]
- Bahu, J.M.; Koch, A.; Kremers, E.; Murshed, S.M. Towards a 3D spatial urban energy modelling approach. ISPRS Ann. Photogramm. Remote Sens. Spat. Inf. Sci. 2013, II-2/W1, 33–41. [Google Scholar] [CrossRef]
- Nouvel, R.; Schulte, C.; Eicker, U.; Pietruschka, D.; Coors, V. CityGML-based 3D city model for energy diagnostics and urban energy policy support. In Proceedings of the BS2013: 13th Conference of International Building Performance Simulation Association, Le Bourget Du Lac, France, 25–30 August 2013; pp. 218–225.
- Nouvel, R.; Zirak, M.; Dastageeri, H.; Coors, V.; Eicker, U. Urban energy analysis based on 3D city model for national scale applications. In Proceedings of the Fifth German-Austrian IBPSA Conference (BauSIM 2014), Aachen, Germany, 22–24 September 2014; pp. 83–90.
- Kaden, R.; Kolbe, T.H. City-wide total energy demand estimation of buildings using semantic 3D city models and statistical data. ISPRS Ann. Photogramm. Remote Sens. Spat. Inf. Sci. 2013, II-2/W1, 163–171. [Google Scholar] [CrossRef]
- Perez, D.; Kämpf, J.H.; Scartezzini, J.L. Urban area energy flow microsimulation for planning support: A calibration and verification study. Int. J. Adv. Syst. Meas. 2013, 6, 260–271. [Google Scholar]
- Bahu, J.M.; Koch, A.; Kremers, E.; Murshed, S.M. Towards a 3D Spatial Urban Energy Modelling Approach. Int. J. 3-D Inf. Model. 2015, 3, 1–16. [Google Scholar]
- Nouvel, R.; Mastrucci, A.; Leopold, U.; Baume, O.; Coors, V.; Eicker, U. Combining GIS-based statistical and engineering urban heat consumption models: Towards a new framework for multi-scale policy support. Energy Build. 2015, 107, 204–212. [Google Scholar] [CrossRef]
- Agugiaro, G. Energy planning tools and CityGML-based 3D virtual city models: Experiences from Trento (Italy). Appl. Geomat. 2015. [Google Scholar] [CrossRef]
- Robinson, D.; Campbell, N.; Gaiser, W.; Kabel, K.; Le-Mouel, A.; Morel, N.; Page, J.; Stankovic, S.; Stone, A. SUNtool—A new modelling paradigm for simulating and optimising urban sustainability. Sol. Energy 2007, 81, 1196–1211. [Google Scholar] [CrossRef]
- Previtali, M.; Barazzetti, L.; Brumana, R.; Cuca, B.; Oreni, D.; Roncoroni, F.; Scaioni, M. Automatic façade modelling using point cloud data for energy-efficient retrofitting. Appl. Geomat. 2014, 6, 95–113. [Google Scholar] [CrossRef]
- Tabrizi, A.; Sanguinetti, P. Case study: Evaluation of renewable energy strategies using building information modeling and energy simulation. Int. J. 3-D Inf. Model. 2014, 2, 25–37. [Google Scholar] [CrossRef]
- Löwner, M.O.; Sasse, A.; Hecker, P. Needs and potential of 3D city information and sensor fusion technologies for vehicle positioning in urban environments. In Advances in 3D Geo-Information Sciences; Springer: Berlin, Germany, 2010; pp. 143–156. [Google Scholar]
- Cappelle, C.; El Najjar, M.E.; Charpillet, F.; Pomorski, D. Virtual 3D city model for navigation in urban areas. J. Intell. Robot. Syst. 2011, 66, 377–399. [Google Scholar] [CrossRef]
- Coors, V.; Huch, T.; Kretschmer, U. Matching buildings: pose estimation in an urban environment. In Proceedings of the IEEE and ACM International Symposium on Augmented Reality (ISAR 2000), Munich, Germany, 5–6 October 2000; pp. 89–92.
- Shiravi, S.; Zhong, M.; Beykaei, S.A.; Hunt, J.D.; Abraham, J.E. An assessment of the utility of LiDAR data in extracting base-year floorspace and a comparison with the census-based approach. Environ. Plan. B: Plan. Des. 2015. [Google Scholar] [CrossRef]
- Boeters, R. Automatic Enhancement of CityGML LoD2 Models with Interiors and its Usability for Net Internal Area Determination. Master’s Thesis, Delft University of Technology, Delft, The Netherlands, 2013. [Google Scholar]
- Henn, A.; Römer, C.; Gröger, G.; Plümer, L. Automatic classification of building types in 3D city models. GeoInformatica 2012, 16, 281–306. [Google Scholar] [CrossRef]
- Köninger, A.; Bartel, S. 3D-GIS for urban purposes. GeoInformatica 1998, 2, 79–103. [Google Scholar] [CrossRef]
- Ellul, C.; Altenbuchner, J. Investigating approaches to improving rendering performance of 3D city models on mobile devices. Geo-Spat. Inf. Sci. 2014, 17, 73–84. [Google Scholar] [CrossRef]
- Rau, J.Y.; Cheng, C.K. A cost-effective strategy for multi-scale photo-realistic building modeling and web-based 3-D GIS applications in real estate. Comput. Environ. Urban Syst. 2013, 38, 35–44. [Google Scholar] [CrossRef]
- Pasewaldt, S.; Semmo, A.; Trapp, M.; Döllner, J. Multi-perspective 3D panoramas. Int. J. Geogr. Inf. Sci. 2014, 28, 2030–2051. [Google Scholar] [CrossRef]
- Zhang, L.; Han, C.; Zhang, L.; Zhang, X.; Li, J. Web-based visualization of large 3D urban building models. Int. J. Digit. Earth 2014, 7, 53–67. [Google Scholar] [CrossRef]
- Evans, A.; Romeo, M.; Bahrehmand, A.; Agenjo, J.; Blat, J. 3D graphics on the web: A survey. Comput. Graph. 2014, 41, 43–61. [Google Scholar] [CrossRef]
- Jochem, R.; Goetz, M. Towards interactive 3D city models on the web. Int. J. 3-D Inf. Model. 2012, 1, 26–36. [Google Scholar] [CrossRef]
- Mao, B.; Ban, Y. Online visualization of 3D city model using CityGML and X3DOM. Cartograph.: Int. J. Geogr. Inf. Geovis. 2011, 46, 109–114. [Google Scholar] [CrossRef]
- Coors, V. 3D-GIS in networking environments. Comput. Environ. Urban Syst. 2003, 27, 345–357. [Google Scholar] [CrossRef]
- Zhu, Q.; Zhao, J.; Du, Z.; Zhang, Y.; Xu, W.; Xie, X.; Ding, Y.; Wang, F.; Wang, T. Towards semantic 3D City modeling and visual explorations. In Advances in 3D Geo-Information Sciences. Lecture Notes in Geoinformation and Cartography; Kolbe, T.H., König, G., Nagel, C., Eds.; Springer: Berlin, Germany, 2011; pp. 275–294. [Google Scholar]
- Wolff, M.; Asche, H. Geospatial modelling of urban security: A novel approach with virtual 3D city models. In Computational Science and Its Applications—ICCSA 2008; Springer: Berlin, Germany, 2008; pp. 42–51. [Google Scholar]
- Wolff, M.; Asche, H. Towards geovisual analysis of crime scenes—A 3D crime mapping approach. In Advances in GIScience; Springer: Berlin, Germany, 2009; pp. 429–448. [Google Scholar]
- Besuievsky, G.; Patow, G. Procedural modeling historical buildings for serious games. Virtual Archeol. Rev. 2013, 4, 160–166. [Google Scholar] [CrossRef]
- Rüppel, U.; Schatz, K. Designing a BIM-based serious game for fire safety evacuation simulations. Adv. Eng. Inf. 2011, 25, 600–611. [Google Scholar] [CrossRef]
- Portalés, C.; Lerma, J.L.; Navarro, S. Augmented reality and photogrammetry: A synergy to visualize physical and virtual city environments. ISPRS J. Photogramm. Remote Sens. 2010, 65, 134–142. [Google Scholar] [CrossRef]
- Verbree, E.; van Maren, G.; Germs, R.; Jansen, F.; Kraak, M.J. Interaction in virtual world views-linking 3D GIS with VR. Int. J. Geogr. Inf. Sci. 1999, 13, 385–396. [Google Scholar] [CrossRef]
- Germs, R.; van Maren, G.; Verbree, E.; Jansen, F.W. A multi-view VR interface for 3D GIS. Comput. Graph. 1999, 23, 497–506. [Google Scholar] [CrossRef]
- van Maren, G. Key to virtual insight: A 3D GIS and virtual reality system. In Planning Support Systems in Practice; Springer: Berlin, Germany, 2003; pp. 193–204. [Google Scholar]
- Takase, Y.; Sho, N.; Sone, A.; Shimiya, K. Automatic generation of 3D city models and related applications. Int. Arch. Photogramm. Remote Sens. Spat. Inf. Sci. 2003, XXXIV-5/W10, 5. [Google Scholar]
- Zhou, Q.; Zhang, W. A preliminary review on three-dimensional city model. Geo-Spat. Inf. Sci. 2004, 7, 79–88. [Google Scholar]
- Ghadirian, P.; Bishop, I.D. Integration of augmented reality and GIS: A new approach to realistic landscape visualisation. Landsc. Urban Plan. 2008, 86, 226–232. [Google Scholar] [CrossRef]
- Vlahakis, V.; Ioannidis, N.; Karigiannis, J.; Tsotros, M.; Gounaris, M.; Stricker, D.; Gleue, T.; Daehne, P.; Almeida, L. Archeoguide: An augmented reality guide for archaeological sites. IEEE Comput. Graph. Appl. 2002, 22, 52–60. [Google Scholar] [CrossRef]
- Richards-Rissetto, H.; Remondino, F.; Agugiaro, G.; Robertsson, J.; von Schwerin, J.; Girardi, G. Kinect and 3D GIS in archaeology. In Proceedings of the 18th International Conference on Virtual Systems and Multimedia (VSMM), Milan, Italy, 2–5 September 2012; IEEE: Milan, Italy, 2012; pp. 331–337. [Google Scholar]
- Zamyadi, A.; Pouliot, J.; Bédard, Y.A.; Pouliot, J.; Bédard, Y. A three step procedure to enrich augmented reality games with CityGML 3D semantic modeling. In Progress and New Trends in 3D Geoinformation Sciences; Springer: Berlin, Germany, 2013; pp. 261–275. [Google Scholar]
- Moreno, A.; Segura, Á.; Zlatanova, S.; Posada, J.; García-Alonso, A. Benefit of the integration of semantic 3D models in a fire-fighting VR simulator. Appl. Geomat. 2012, 4, 143–153. [Google Scholar] [CrossRef]
- Glander, T.; Döllner, J. Abstract representations for interactive visualization of virtual 3D city models. Comput. Environ. Urban Syst. 2009, 33, 375–387. [Google Scholar] [CrossRef]
- Kemec, S.; Duzgun, S.; Zlatanova, S.; Dilmen, D.I.; Yalciner, A.C. Selecting 3D urban visualisation models for disaster management: Fethiye tsunami inundation case. In Proceedings of the 3rd International Conference on Cartography and GIS, Nessebar, Bulgaria, 15–20 June 2010.
- Patel, V.M.; Dholakia, M.B.; Singh, A.P. Tsunami risk 3D visualizations of Okha Coast, Gujarat (India). Int. J. Eng. Sci. Innov. Technol. 2013, 2, 130–138. [Google Scholar]
- Manyoky, M.; Wissen Hayek, U.; Heutschi, K.; Pieren, R.; Grêt-Regamey, A. Developing a GIS-based visual-acoustic 3D simulation for wind farm assessment. ISPRS Int. J. Geo-Inf. 2014, 3, 29–48. [Google Scholar] [CrossRef]
- Kwan, M.P. Interactive geovisualization of activity-travel patterns using three-dimensional geographical information systems: a methodological exploration with a large data set. Transp. Res. Part C—Emerg. Technol. 2000, 8, 185–203. [Google Scholar] [CrossRef]
- Congote, J.; Moreno, A.; Kabongo, L.; Pérez, J.L.; San José, R.; Ruiz, O. Web based hybrid volumetric visualisation of urban GIS data. In Usage, Usability, and Utility of 3D City Models—European COST Action TU0801; Leduc, T., Moreau, G., Billen, R., Eds.; EDP Sciences: Nantes, France, 2012; pp. 1–6. [Google Scholar]
- San José, R.; Pérez, J.L.; González-Barras, R.M. 3D visualization of air quality data. In Proceedings of the 11th International Conference “Reliability and Statistics in Transportation and Communication” (RelStat’11), 19–22 October 2011; pp. 1–9.
- San José, R.; Pérez, J.L.; González, R.M. Advances in 3D visualization of air quality data. In Usage, Usability, and Utility of 3D City Models— European COST Action TU0801; Leduc, T., Moreau, G., Billen, R., Eds.; EDP Sciences: Nantes, France, 2012; pp. 1–13. [Google Scholar]
- Yan, J.K. Advances in computer-generated imagery for flight simulation. IEEE Comput. Graph. Appl. 1985, 5, 37–51. [Google Scholar] [CrossRef]
- Besuievsky, G.; Patow, G. Customizable LoD for procedural architecture. Comput. Graph. Forum 2013, 32, 26–34. [Google Scholar] [CrossRef]
- Yang, P.P.; Putra, S.Y.; Li, W. Viewsphere: a GIS-based 3D visibility analysis for urban design evaluation. Environ. Plan. B: Plan. Des. 2007, 34, 971. [Google Scholar] [CrossRef]
- Liu, L.; Zhang, L.; Ma, J.; Zhang, L.; Zhang, X.; Xiao, Z.; Yang, L. An improved line-of-sight method for visibility analysis in 3D complex landscapes. Sci. China Inf. Sci. 2010, 53, 2185–2194. [Google Scholar] [CrossRef]
- Lonergan, C.; Hedley, N. Unpacking isovists: A framework for 3D spatial visibility analysis. Cartogr. Geogr. Inf. Sci. 2015, 43, 87–102. [Google Scholar] [CrossRef]
- Peters, R.; Ledoux, H.; Biljecki, F. Visibility analysis in a point cloud based on the medial axis transform. In Proceedings of the Eurographics Workshop on Urban Data Modelling and Visualisation 2015, Delft, The Netherlands, 23 November 2015; pp. 7–12.
- Bartie, P.; Reitsma, F.; Kingham, S.; Mills, S. Advancing visibility modelling algorithms for urban environments. Comput. Environ. Urban Syst. 2010, 34, 518–531. [Google Scholar] [CrossRef]
- Delikostidis, I.; Engel, J.; Retsios, B.; van Elzakker, C.P.J.M.; Kraak, M.J.; Döllner, J. Increasing the usability of pedestrian navigation interfaces by means of Landmark visibility analysis. J. Navig. 2013, 66, 523–537. [Google Scholar] [CrossRef]
- Albrecht, F.; Moser, J.; Hijazi, I. Assessing façade visibility in 3D city models for city marketing. Int. Arch. Photogramm. Remote Sens. Spat. Inf. Sci. 2013, XL-2/W2, 1–5. [Google Scholar] [CrossRef]
- Rabban, I.E.; Abdullah, K.; Ali, M.E.; Cheema, M.A. Visibility color map for a fixed or moving target in spatial databases. In Advances in Spatial and Temporal Databases; Springer International Publishing: Berlin, Germany, 2015; pp. 197–215. [Google Scholar]
- Ying, M.; Jingjue, J.; Fulin, B. 3D-City Model supporting for CCTV monitoring system. Int. Arch. Photogramm. Remote Sens. Spat. Inf. Sci. 2002, XXXIV, 1–4. [Google Scholar]
- Yaagoubi, R.; Yarmani, M.; Kamel, A.; Khemiri, W. HybVOR: A voronoi-based 3D GIS approach for camera surveillance network placement. ISPRS Int. J. Geo-Inf. 2015, 4, 754–782. [Google Scholar] [CrossRef]
- Jung Moon, S.; Cheol Jeon, M.; Dam Eo, Y.; Bin Im, S.; Wook Park, B. Campus CCTV allocation simulation for maximizing monitoring areas. Adv. Inf. Sci. Serv. Sci. 2013, 5, 1192–1198. [Google Scholar]
- Afghantoloee, A.; Doodman, S.; Karimipour, F.; Mostafavi, M.A. Coverage estimation of geosensor in 3D vector environments. Int. Arch. Photogramm. Remote Sens. Spat. Inf. Sci. 2014, XL-2/W3, 1–6. [Google Scholar] [CrossRef]
- Bassani, M.; Grasso, N.; Piras, M. 3D GIS based evaluation of the available sight distance to assess safety of urban roads. Int. Arch. Photogramm. Remote Sens. Spat. Inf. Sci. 2015, XL-3/W3, 137–143. [Google Scholar] [CrossRef]
- VanHorn, J.E.; Mosurinjohn, N.A. Urban 3D GIS modeling of terrorism sniper hazards. Soc. Sci. Comput. Rev. 2010, 28, 482–496. [Google Scholar] [CrossRef]
- Yu, S.M.; Han, S.S.; Chai, C.H. Modeling the value of view in high-rise apartments: a 3D GIS approach. Environ. Plan. B: Plan. Des. 2007, 34, 139–153. [Google Scholar] [CrossRef]
- Hamilton, S.E.; Morgan, A. Integrating lidar, GIS and hedonic price modeling to measure amenity values in urban beach residential property markets. Comput. Environ. Urban Syst. 2010, 34, 133–141. [Google Scholar] [CrossRef]
- Tomić, H.; Roić, M.; Mastelić Ivić, S. Use of 3D cadastral data for real estate mass valuation in the urban areas. In Proceedings of the 3rd International Workshop on 3D Cadastres: Developments and Practices, Shenzhen, China, 25–26 October 2012; pp. 73–86.
- Wang, L.; Groves, P.D.; Ziebart, M.K. GNSS shadow matching: Improving urban positioning accuracy using a 3D city model with optimized visibility scoring scheme. Navigation 2013, 60, 195–207. [Google Scholar] [CrossRef]
- Hsu, L.T.; Gu, Y.; Kamijo, S. 3D building model-based pedestrian positioning method using GPS/GLONASS/QZSS and its reliability calculation. GPS Solut. 2015. [Google Scholar] [CrossRef]
- Bradbury, J.; Ziebart, M.; Cross, P.A.; Boulton, P.; Read, A. Code multipath modelling in the urban environment using large virtual reality city models: Determining the local environment. J. Navig. 2007, 60, 95–105. [Google Scholar] [CrossRef]
- Wang, L.; Groves, P.D.; Ziebart, M.K. Multi-constellation GNSS performance evaluation for urban canyons using large virtual reality city models. J. Navig. 2012, 65, 459–476. [Google Scholar] [CrossRef]
- Kumar, R.; Petovello, M.G. A novel GNSS positioning technique for improved accuracy in urban canyon scenarios using 3D city model. In Proceedings of the ION GNSS+ 2014, Tampa, FL, USA, 8–12 September 2014.
- Gang-jun, L.; Kefei, Z.; Falin, W.; Liam, D.; Retscher, G. Characterisation of current and future GNSS performance in urban canyons using a high quality 3-D urban model of Melbourne, Australia. J. Appl. Geod. 2009, 3, 15–24. [Google Scholar] [CrossRef]
- Kleijer, F.; Odijk, D.; Verbree, E. Prediction of GNSS availability and accuracy in urban environments case study schiphol airport. In Location Based Services and TeleCartography II; Springer Berlin Heidelberg: Berlin, Germany, 2009; pp. 387–406. [Google Scholar]
- Bétaille, D.; Peyret, F.; Ortiz, M.; Miquel, S.; Fontenay, L. A new modeling based on urban trenches to improve GNSS positioning quality of service in cities. IEEE Intell. Transp. Syst. Mag. 2013, 5, 59–70. [Google Scholar] [CrossRef]
- Groves, P.D.; Jiang, Z. Height aiding, C/N 0 weighting and consistency checking for GNSS NLOS and multipath mitigation in urban areas. J. Navig. 2013, 66, 653–669. [Google Scholar] [CrossRef]
- Wada, Y.; Hsu, L.-T.; Gu, Y.; Kamijo, S. Optimization of 3D building models by GPS measurements. GPS Solut 2015. [Google Scholar] [CrossRef]
- Piñana-Díaz, C.; Toledo-Moreo, R.; Toledo-Moreo, F.; Skarmeta, A. A two-layers based approach of an enhanced-mapfor urban positioning support. Sensors 2012, 12, 14508–14524. [Google Scholar] [CrossRef] [PubMed]
- Fisher-Gewirtzman, D. 3D models as a platform for urban analysis and studies on human perception of space. In Usage, Usability, and Utility of 3D City Models—European COST Action TU0801; Leduc, T., Moreau, G., Billen, R., Eds.; EDP Sciences: Nantes, France, 2012; pp. 1–16. [Google Scholar]
- Fisher-Gewirtzman, D.; Natapov, A. Different approaches of visibility analyses applied on hilly urban environment. Surv. Rev. 2014, 46, 366–382. [Google Scholar] [CrossRef]
- Yasumoto, S.; Jones, A.P.; Nakaya, T.; Yano, K. The use of a virtual city model for assessing equity in access to views. Comput. Environ. Urban Syst. 2011, 35, 464–473. [Google Scholar] [CrossRef]
- Yasumoto, S.; Jones, A.; Yano, K.; Nakaya, T. Virtual city models for assessing environmental equity of access to sunlight: a case study of Kyoto, Japan. Int. J. Geogr. Inf. Sci. 2012, 26, 1–13. [Google Scholar] [CrossRef]
- Wilson, E. 3D Vision: BC Assessment’s Cool New Tools. Available online: http://www.rew.ca/ (accessed on 15 December 2015).
- Johnson, G.T.; Watson, I.D. The determination of view-factors in urban canyons. J. Clim. Appl. Meteorol. 1984, 23, 329–335. [Google Scholar] [CrossRef]
- Brasebin, M.; Perret, J.; Mustière, S.; Weber, C. Measuring the impact of 3D data geometric modeling on spatial analysis: Illustration with Skyview factor. In Usage, Usability, and Utility of 3D City Models— European COST Action TU0801; Leduc, T., Moreau, G., Billen, R., Eds.; EDP Sciences: Nantes, France, 2012; pp. (02001)1–16. [Google Scholar]
- Chen, L.; Ng, E.; An, X.; Ren, C.; Lee, M.; Wang, U.; He, Z. Sky view factor analysis of street canyons and its implications for daytime intra-urban air temperature differentials in high-rise, high-density urban areas of Hong Kong: a GIS-based simulation approach. Int. J. Climatol. 2012, 32, 121–136. [Google Scholar] [CrossRef]
- Gál, T.; Lindberg, F.; Unger, J. Computing continuous sky view factors using 3D urban raster and vector databases: comparison and application to urban climate. Theor. Appl. Climatol. 2009, 95, 111–123. [Google Scholar] [CrossRef]
- Hwang, R.L.; Lin, T.P.; Matzarakis, A. Seasonal effects of urban street shading on long-term outdoor thermal comfort. Build. Environ. 2011, 46, 863–870. [Google Scholar] [CrossRef]
- Besuievsky, G.; Barroso, S.; Beckers, B.; Patow, G. A configurable LoD for procedural urban models intended for daylight simulation. In Proceedings of the Eurographics Workshop on Urban Data Modelling and Visualisation 2014, Strasbourg, France, 6 April 2014; pp. 19–24.
- Unger, J. Connection between urban heat island and sky view factor approximated by a software tool on a 3D urban database. Int. J. Environ. Pollut. 2009, 36, 59. [Google Scholar] [CrossRef]
- Hämmerle, M.; Gál, T.; Unger, J.; Matzarakis, A. Comparison of models calculating the sky view factor used for urban climate investigations. Theor. Appl. Climatol. 2011, 105, 521–527. [Google Scholar] [CrossRef]
- Muñoz, D.; Beckers, B.; Besuievsky, G.; Patow, G. Far-LoD: Level of detail for massive sky view factor calculations in large cities. In Proceedings of the Eurographics Workshop on Urban Data Modelling and Visualisation 2015, Delft, The Netherlands, 23 November 2015; pp. 1–6.
- Den Haag. Voorstel van Het College Inzake Beleid Dakopbouwen (RIS 180461). Available online: http://www.denhaag.nl/home.htm (accessed on 15 December 2015).
- City of Mississauga. Standards for Shadow Studies. Available online: www6.mississauga.ca (accessed on 15 December 2015).
- Alam, N.; Coors, V.; Zlatanova, S.; Oosterom, P.J.M. Shadow effect on photovoltaic potentiality analysis using 3D city models. Int. Arch. Photogramm. Remote Sens. Spat. Inf. Sci. 2012, XXXIX-B8, 209–214. [Google Scholar] [CrossRef]
- Alam, N.; Coors, V.; Zlatanova, S. Detecting shadow for direct radiation using CityGML models for photovoltaic potentiality analysis. In Urban and Regional Data Management; Ellul, C., Zlatanova, S., Rumor, M., Laurini, R., Eds.; CRC Press: London, UK, 2013; pp. 191–196. [Google Scholar]
- Mardaljevic, J.; Rylatt, M. Irradiation mapping of complex urban environments: an image-based approach. Energy Build. 2003, 35, 27–35. [Google Scholar] [CrossRef]
- Nguyen, H.T.; Pearce, J.M. Incorporating shading losses in solar photovoltaic potential assessment at the municipal scale. Sol. Energy 2012, 86, 1245–1260. [Google Scholar] [CrossRef]
- Tooke, T.R.; Coops, N.C.; Voogt, J.A.; Meitner, M.J. Tree structure influences on rooftop-received solar radiation. Landsc. Urban Plan. 2011, 102, 73–81. [Google Scholar] [CrossRef]
- Eicker, U.; Monien, D.; Duminil, E.; Nouvel, R. Energy performance assessment in urban planning competitions. Appl. Energy 2015, 155, 323–333. [Google Scholar] [CrossRef]
- Yezioro, A.; Shaviv, E. Shading: A design tool for analyzing mutual shading between buildings. Sol. Energy 1994, 52, 27–37. [Google Scholar] [CrossRef]
- Morello, E.; Ratti, C. Sunscapes: “Solar envelopes” and the analysis of urban DEMs. Comput. Environ. Urban Syst. 2009, 33, 26–34. [Google Scholar] [CrossRef]
- Knowles, R.L. The solar envelope: its meaning for energy and buildings. Energy Build. 2003, 35, 15–25. [Google Scholar] [CrossRef]
- Lange, E.; Hehl-Lange, S. Combining a participatory planning approach with a virtual landscape model for the siting of wind turbines. J. Environ. Plan. Manag. 2005, 48, 833–852. [Google Scholar] [CrossRef]
- Kurakula, V.; Kuffer, M. 3D noise modeling for urban environmental planning and management. In Proceedings of the 13th International Conference on Urban Planning in Information and Knowledge Society; Schrenk, M., Popovich, V., Engelke, D., Elisei, P., Eds.; 2008; pp. 517–523. [Google Scholar]
- Pamanikabud, P.; Tansatcha, M. Geoinformatic prediction of motorway noise on buildings in 3D GIS. Transp. Res. Part D: Transp.Environ. 2009, 14, 367–372. [Google Scholar] [CrossRef]
- Lu, L.; Becker, T.; Löwner, M.O. 3D complete traffic noise analysis based on CityGML. In Advances in 3D Geoinformation; Springer International Publishing: Cham, Switzerland, 2016. [Google Scholar]
- Ranjbar, H.R.; Gharagozlou, A.R.; Nejad, A.R.V. 3D analysis and investigation of traffic noise impact from Hemmat Highway located in Tehran on buildings and surrounding areas. J. Geogr. Inf. Syst. 2012, 4, 322–334. [Google Scholar] [CrossRef]
- Law, C.W.; Lee, C.K.; Lui, A.S.w.; Yeung, M.K.l.; Lam, K.c. Advancement of three-dimensional noise mapping in Hong Kong. Appl. Acoust. 2011, 72, 534–543. [Google Scholar] [CrossRef]
- EC. Directive 2002/49/EC of the European Parliament and of the Council. Off. J. Eur. Communities 2002, 189/12, 12–25. [Google Scholar]
- Butler, D. Noise management: Sound and vision. Nature 2004, 427, 480–481. [Google Scholar] [CrossRef] [PubMed]
- Czerwinski, A.; Kolbe, T.H.; Plümer, L.; Elke, S.M. Interoperability and accuracy requirements for EU environmental noise mapping. In Proceedings of the International Conference on GIS and Sustainable Development (InterCarto—InterGIS 12), Berlin, Germany, 28–30 August 2006.
- Kubiak, J.; Ławniczak, R. The propagation of noise in a built-up area (on the example of a housing estate in Poznań). J. Maps 2015. [Google Scholar] [CrossRef]
- Law, C.W.; Lee, C.K.; Tai, M.K. Visualization of complex noise environment by virtual reality technologies. In Proceedings of the Symposium of the campaign “Science in the Public Service”, Hong Kong, China, 27 April 2006; p. 8.
- Czerwinski, A.; Kolbe, T.H.; Plümer, L.; Elke, S.M. Spatial data infrastructure techniques for flexible noise mapping strategies. In Proceedings of the 20th International Conference on Environmental Informatics-Managing Environmental Knowledge, Graz, Austria, 6–8 September 2006; pp. 99–106.
- Kurakula, V. A GIS-Based Approach for 3D Noise Modelling Using 3D City Models. Master’s Thesis, International Institute for Geo-information Science and Earth Observation, Enschede, The Netherlands, 2007. [Google Scholar]
- Billen, R.; Zlatanova, S. 3D spatial relationships model: a useful concept for 3D cadastre? Comput. Environ. Urban Syst. 2003, 27, 411–425. [Google Scholar] [CrossRef]
- Stoter, J.E.; van Oosterom, P.J.M. Technological aspects of a full 3D cadastral registration. Int. J. Geogr. Inf. Sci. 2005, 19, 669–696. [Google Scholar] [CrossRef]
- Stoter, J.; Ploeger, H.; van Oosterom, P. 3D cadastre in The Netherlands: Developments and international applicability. Comput. Environ. Urban Syst. 2013, 40, 56–67. [Google Scholar] [CrossRef]
- van Oosterom, P. Research and development in 3D cadastres. Comput. Environ. Urban Syst. 2013, 40, 1–6. [Google Scholar] [CrossRef]
- Çağdaş, V. An application domain extension to CityGML for immovable property taxation: A Turkish case study. Int. J. Appl. Earth Observ. Geoinf. 2013, 21, 545–555. [Google Scholar]
- Frédéricque, B.; Raymond, K.; van Prooijen, K. 3D GIS Applied to Cadastre; Bentley Systems Incorporated: Exton, PA, USA, 2011. [Google Scholar]
- Guo, R.; Li, L.; Ying, S.; Luo, P.; He, B.; Jiang, R. Developing a 3D cadastre for the administration of urban land use: A case study of Shenzhen, China. Comput. Environ. Urban Syst. 2013, 40, 46–55. [Google Scholar] [CrossRef]
- Pouliot, J.; Roy, T.; Fouquet-Asselin, G.; Desgroseilliers, J. 3D Cadastre in the Province of Quebec: A First Experiment for the Construction of a Volumetric Representation. In Advances in 3D Geo-Information Sciences; Springer: Berlin, Germany, 2011; pp. 149–162. [Google Scholar]
- Soon, K.H. A conceptual framework of representing semantics for 3D Cadastre in Singapore. In Proceedings of the 3rd International Workshop on 3D Cadastres, Shenzhen, China, 25–26 October 2012; pp. 361–379.
- Vandysheva, N.; Sapelnikov, S.; van Oosterom, P.J.M.; de Vries, M.E.; Spiering, B.; Wouters, R.; Hoogeveen, A.; Penkov, V. The 3D Cadastre Prototype and Pilot in the Russian Federation; International Federation of Surveyors (FIG): Rome, Italy, 2012. [Google Scholar]
- Shojaei, D.; Kalantari, M.; Bishop, I.D.; Rajabifard, A.; Aien, A. Visualization requirements for 3D cadastral systems. Comput. Environ. Urban Syst. 2013, 41, 39–54. [Google Scholar] [CrossRef]
- Pouliot, J.; Wang, C.; Hubert, F.; Fuchs, V. Empirical assessment of the suitability of visual variables to achieve notarial tasks established from 3D condominium models. In Innovations in 3D Geo-Information Sciences; Springer International Publishing: Cham, Switzerland, 2014; pp. 195–210. [Google Scholar]
- Jobst, M.; Germanchis, T. The employment of 3D in cartography—An overview. In Multimedia Cartography; Springer: Berlin, Germany, 2007; pp. 217–228. [Google Scholar]
- Oulasvirta, A.; Estlander, S.; Nurminen, A. Embodied interaction with a 3D versus 2D mobile map. Pers. Ubiquitous Comput. 2009, 13, 303–320. [Google Scholar] [CrossRef]
- Schilling, A.; Coors, V.; Laakso, K. Dynamic 3D maps for mobile tourism applications. In Map-Based Mobile Services; Springer-Verlag: Berlin, Germany, 2005; pp. 227–239. [Google Scholar]
- Rakkolainen, I.; Vainio, T. A 3D City Info for mobile users. Comput. Graph. 2001, 25, 619–625. [Google Scholar] [CrossRef]
- Nurminen, A. Mobile 3D city maps. IEEE Comput. Graph. Appl. 2008, 28, 20–31. [Google Scholar] [CrossRef]
- Musliman, I.A.; Abdul-Rahman, A.; Coors, V. 3D navigation for 3D-GIS—Initial requirements. In Innovations in 3D Geo Information Systems; Springer: Berlin, Germany, 2006; pp. 259–268. [Google Scholar]
- Coltekin, A.; Lokka, I.E.; Boer, A. The utilization of publicly available map types by non-experts—A choice experiment. In Proceedings of the 27th International Cartographic Conference (ICC2015), Rio de Janeiro, Brazil, 23–28 August 2015.
- Bernasocchi, M.; Çöltekin, A.; Gruber, S. An open source geovisual analytics toolbox for multivariate spatio-temporal data for environmental change modeling. ISPRS Ann. Photogramm. Remote Sens. Spat. Inf. Sci. 2012, I-2, 123–128. [Google Scholar] [CrossRef]
- Nedkov, S. Knowledge-based optimisation of 3D city models for car navigation devices. Master’s Thesis, Delft University of Technology, Delft, The Netherlands, 2012. [Google Scholar]
- Mao, B.; Ban, Y.; Harrie, L. Real-time visualization of 3D city models at street-level based on visual saliency. Sci. China Earth Sci. 2015, 58, 448–461. [Google Scholar] [CrossRef]
- Ranzinger, M.; Gleixner, G. GIS datasets for 3D urban planning. Comput. Environ. Urban Syst. 1997, 21, 159–173. [Google Scholar] [CrossRef]
- Lewis, J.L.; Casello, J.M.; Groulx, M. Effective environmental visualization for urban planning and design: interdisciplinary reflections on a rapidly evolving technology. J. Urban Technol. 2012, 19, 85–106. [Google Scholar] [CrossRef]
- Pullar, D.V.; Tidey, M.E. Coupling 3D visualisation to qualitative assessment of built environment designs. Landsc. Urban Plan. 2001, 55, 29–40. [Google Scholar] [CrossRef]
- Sabri, S.; Pettit, C.J.; Kalantari, M.; Rajabifard, A.; White, M.; Lade, O.; Ngo, T. What are essential requirements in planning for future cities using open data infrastructures and 3D data models? In Proceedings of the 14th International Conference on Computers in Urban Planning and Urban Management, Cambridge, MA, USA, 7–10 July 2015.
- Métral, C.; Falquet, G.; Vonlanthen, M. An ontology-based model for urban planning communication. In Ontologies for Urban Development; Springer: Berlin, Germany, 2007; pp. 61–72. [Google Scholar]
- Kibria, M.S.; Zlatanova, S.; Itard, L.; Dorst, M. GeoVEs as tools to communicate in urban projects: Requirements for functionality and visualization. In 3D Geo-Information Sciences; Springer: Berlin, Germany, 2009; pp. 379–395. [Google Scholar]
- Appleton, K.; Lovett, A. GIS-based visualisation of rural landscapes: Defining “sufficient” realism for environmental decision-making. Landsc. Urban Plan. 2003, 65, 117–131. [Google Scholar] [CrossRef]
- Benner, J.; Geiger, A.; Häfele, K.H. Concept for building licensing based on standardized 3d geo information. Int. Arch. Photogramm. Remote Sens. Spat. Inf. Sci. 2010, XXXVIII-4/W15, 9–12. [Google Scholar]
- Leszek, K. Environmental and urban spatial analysis based on a 3D city model. In Computational Science and Its Applications—ICCSA 2015; Springer International Publishing: New York, NY, USA, 2015; pp. 633–645. [Google Scholar]
- Isikdag, U.; Zlatanova, S. Interactive modelling of buildings in Google Earth: A 3D tool for Urban Planning. In Developments in 3D Geo-Information Sciences; Springer: Berlin, Germany, 2010; pp. 52–70. [Google Scholar]
- Lu, S.; Wang, F. Computer aided design system based on 3D GIS for park design. In Computer, Intelligent Computing and Education Technology; CRC Press: London, UK; 2014; pp. 413–416. [Google Scholar]
- Moser, J.; Albrecht, F.; Kosar, B. Beyond visualisation—3D GIS analyses for virtual city models. Int. Arch. Photogramm. Remote Sens. Spat. Inf. Sci. 2010, XXXVIII-4/W15, 143–146. [Google Scholar]
- Kaňuk, J.; Gallay, M.; Hofierka, J. Generating time series of virtual 3-D city models using a retrospective approach. Landsc. Urban Plan. 2015, 139, 40–53. [Google Scholar] [CrossRef]
- Guney, C.; Akdag Girginkaya, S.; Cagdas, G.; Yavuz, S. Tailoring a geomodel for analyzing an urban skyline. Landsc. Urban Plan. 2012, 105, 160–173. [Google Scholar] [CrossRef]
- Czyńska, K.; Rubinowicz, P. Application of 3D virtual city models in urban analyses of tall buildings—Today practice and future challenges. Architect. Artibus 2014, 19, 9–13. [Google Scholar]
- Chun, W.; Ge, C.; Yanyan, L.; Horne, M. Virtual-reality based integrated traffic simulation for urban planning. In Proceedings of the 2008 International Conference on Computer Science and Software Engineering, Wuhan, China, 15 August 2008; pp. 1137–1140.
- Wu, H.; He, Z.; Gong, J. A virtual globe-based 3D visualization and interactive framework for public participation in urban planning processes. Comput. Environ. Urban Syst. 2010, 34, 291–298. [Google Scholar] [CrossRef]
- Franić, S.; Bačić-Deprato, I.; Novaković, I. 3D model and a scale model of the City of Zagreb. Int. Arch. Photogramm. Remote Sens. Spat. Inf. Sci. 2009, XXXVIII-2/W11, 1–7. [Google Scholar]
- Döllner, J.; Kolbe, T.H.; Liecke, F.; Sgouros, T.; Teichmann, K. The virtual 3D city model of Berlin—Managing, integrating, and communicating complex urban information. In Proceedings of the 25th Urban Data Management Symposium (UDMS 2006), Aalborg, Denmark, 15–17 May 2006; pp. 1–12.
- Buhur, S.; Ross, L.; Büyüksalih, G.; Baz, I. 3D city modelling for planning activities, case study: Haydarpasa train station, haydarpasa port and surrounding backside zones, Istanbul. Int. Arch. Photogramm. Remote Sens. Spat. Inf. Sci. 2009, XXXVIII-1-4-7/W5, 1–6. [Google Scholar]
- City of Perth. Planning and Development Application. 3D Model Specification; City of Perth: Perth, Australia, 2013. [Google Scholar]
- Adelaide City Council. Development Information Guide of the Adelaide 3D City Model: Frequently Asked Questions for Architects, Designers and Developers; Adelaide City Council: Adelaide, Australia, 2009. [Google Scholar]
- Marina, O.; Masala, E.; Pensa, S.; Stavric, M. Interactive model of urban development in residential areas in Skopje. In Usage, Usability, and Utility of 3D City Models—European COST Action TU0801; Leduc, T., Moreau, G., Billen, R., Eds.; EDP Sciences: Nantes, France, 2012; pp. (02004)1–12. [Google Scholar]
- Koutsoudis, A.; Arnaoutoglou, F.; Chamzas, C. On 3D reconstruction of the old city of Xanthi. A minimum budget approach to virtual touring based on photogrammetry. J. Cult. Herit. 2007, 8, 26–31. [Google Scholar] [CrossRef]
- Novaković, I. 3D model of Zagreb. GIM Int. 2011, 25, 25–29. [Google Scholar]
- Ghawana, T.; Zlatanova, S. 3D printing for urban planning: A physical enhancement of spatial perspective. In Urban and Regional Data Management UDMS Annual 2013; Urban and Regional Data Management: UDMS Annual 2013: London, UK, 2013; pp. 211–224. [Google Scholar]
- Trapp, M.; Semmo, A.; Pokorski, R.; Herrmann, C.D.; Döllner, J.; Eichhorn, M.; Heinzelmann, M. Communication of digital cultural heritage in public spaces by the example of Roman Cologne. In Digital Heritage; Springer: Berlin, Germany, 2010; pp. 262–276. [Google Scholar]
- Liu, Y.; Gevers, T.; Li, X. Estimation of sunlight direction using 3D object models. IEEE Trans. Image Process. 2015, 24, 932–942. [Google Scholar] [PubMed]
- Auer, S.; Hinz, S.; Bamler, R. Ray-tracing simulation techniques for understanding high-resolution SAR images. IEEE Trans. Geosci. Remote Sens. 2010, 48, 1445–1456. [Google Scholar] [CrossRef]
- Franceschetti, G.; Iodice, A.; Riccio, D.; Ruello, G. SAR raw signal simulation for urban structures. IEEE Trans. Geosci. Remote Sens. 2003, 41, 1986–1995. [Google Scholar] [CrossRef]
- Margarit, G.; Mallorqui, J.J.; Pipia, L. Polarimetric characterization and temporal stability analysis of urban target scattering. IEEE Trans. Geosci. Remote Sens. 2010, 48, 2038–2048. [Google Scholar] [CrossRef] [Green Version]
- Franceschetti, G.; Iodice, A.; Riccio, D. A canonical problem in electromagnetic backscattering from buildings. IEEE Trans. Geosci. Remote Sens. 2002, 40, 1787–1801. [Google Scholar] [CrossRef]
- Margarit, G.; Mallorqui, J.J.; Lopez-Martinez, C. Grecosar, a SAR simulator for complex targets: Application to urban environments. In Proceedings of the 2007 IEEE International Geoscience and Remote Sensing Symposium, Barcelona, Spain, 23–27 July 2007; IEEE: Barcelona, Spain, 2007; pp. 4160–4163. [Google Scholar]
- Zlatanova, S.; Beetz, J. 3D spatial information infrastructure: The case of Port Rotterdam. In Usage, Usability, and Utility of 3D City Models— European COST Action TU0801; Leduc, T., Moreau, G., Billen, R., Eds.; EDP Sciences: Nantes, France, 2012; pp. 1–8. [Google Scholar]
- Tang, K.; Xu, J.K. Research on application of airport simulation system based on 3D GIS. Appl. Mech. Mater. 2012, 198–199, 717–720. [Google Scholar] [CrossRef]
- Liu, R.; Issa, R.R.A. 3D visualization of sub-surface Pipelines in connection with the building utilities: Integrating GIS and BIM for facility management. In Proceedings of the International Conference on Computing in Civil Engineering, Clearwater Beach, FL, USA, 17–20 June 2012; American Society of Civil Engineers: Clearwater Beach, FL, USA, 2012; pp. 341–348. [Google Scholar]
- Hijazi, I.H.; Ehlers, M.; Zlatanova, S. NIBU: A new approach to representing and analysing interior utility networks within 3D geo-information systems. Int. J. Digit. Earth 2012, 5, 22–42. [Google Scholar] [CrossRef]
- Becker, T.; Nagel, C.; Kolbe, T.H. Semantic 3D modeling of multi-utility networks in cities for analysis and 3D visualization. In Progress and New Trends in 3D Geoinformation Sciences; Springer: Berlin, Germany, 2013; pp. 41–62. [Google Scholar]
- Løvset, T.; Ulvang, D.M.; Bekkvik, T.C.; Villanger, K.; Viola, I. Rule-based method for automatic scaffold assembly from 3D building models. Comput. Graph. 2013, 37, 256–268. [Google Scholar] [CrossRef]
- Kwan, M.P.; Lee, J. Emergency response after 9/11: the potential of real-time 3D GIS for quick emergency response in micro-spatial environments. Comput. Environ. Urban Syst. 2005, 29, 93–113. [Google Scholar] [CrossRef]
- Tashakkori, H.; Rajabifard, A.; Kalantari, M. A new 3D indoor/outdoor spatial model for indoor emergency response facilitation. Build. Environ. 2015, 89, 170–182. [Google Scholar] [CrossRef]
- Chen, L.C.; Wu, C.H.; Shen, T.S.; Chou, C.C. The application of geometric network models and building information models in geospatial environments for fire-fighting simulations. Comput. Environ. Urban Syst. 2014, 45, 1–12. [Google Scholar] [CrossRef]
- Corre, Y.; Lostanlen, Y. Three-dimensional urban EM wave propagation model for radio network planning and optimization over large areas. IEEE Trans. Veh. Technol. 2009, 58, 3112–3123. [Google Scholar] [CrossRef]
- Lebherz, M.; Wiesbeck, W.; Krank, W. A versatile wave propagation model for the VHF/UHF range considering three-dimensional terrain. IEEE Trans. Antennas Propag. 1992, 40, 1121–1131. [Google Scholar] [CrossRef]
- Yang, G.; Pahlavan, K.; Lee, J.F.; Dagen, A.J.; Vancraeynest, J. Prediction of radio wave propagation in four blocks of New York City using 3D ray tracing. In Proceedings of the 5th IEEE International Symposium on Wireless Networks Catching the Mobile Future, Hague, The Netherlands, 18–23 September 1994.
- Rautiainen, T.; Wolfle, G.; Hoppe, R. Verifying path loss and delay spread predictions of a 3D ray tracing propagation model in urban environment. In Proceedings of the IEEE 56th Vehicular Technology Conference, Vancouver, Canada, 24–28 September 2002.
- Wagen, J.F.; Rizk, K. Radiowave propagation, building databases, and GIS: anything in common? A radio engineer’s viewpoint. Environ. Plan. B Plan. Des. 2003, 30, 767–787. [Google Scholar] [CrossRef]
- Yun, Z.; Iskander, M.F.; Lim, S.Y.; He, D.; Martinez, R. Radio wave propagation prediction based on 3-D building structures extracted from 2-D images. Antennas Wirel. Propag. Lett. 2007, 6, 557–559. [Google Scholar] [CrossRef]
- Beekhuizen, J.; Heuvelink, G.B.M.; Huss, A.; Bürgi, A.; Kromhout, H.; Vermeulen, R. Impact of input data uncertainty on environmental exposure assessment models: A case study for electromagnetic field modelling from mobile phone base stations. Environ. Res. 2014, 135, 148–155. [Google Scholar] [CrossRef] [PubMed]
- Lee, G. 3D coverage location modeling of Wi-Fi access point placement in indoor environment. Comput. Environ. Urban Syst. 2015, 54, 326–335. [Google Scholar] [CrossRef]
- Asawa, T.; Hoyano, A.; Yoshida, T.; Takata, M. A new approach to microclimate analysis using airborne remote sensing, 3D-GIS and CFD simulation. In Proceedings of the 1st Asia Conference of International Building Performance Simulation Association, Shanghai, China, 25–27 November 2012; pp. 1–8.
- Ujang, U.; Anton, F.; Abdul-Rahman, A. Unified data model of urban air pollution dispersion and 3D spatial city model: Groundwork assessment towards sustainable urban development for Malaysia. J. Environ. Prot. 2013, 4, 701–712. [Google Scholar] [CrossRef]
- Musy, M.; Malys, L.; Morille, B.; Inard, C. The use of SOLENE-microclimat model to assess adaptation strategies at the district scale. Urban Clim. 2015, 14, 213–223. [Google Scholar] [CrossRef]
- Lee, D.; Pietrzyk, P.; Donkers, S.; Liem, V.; van Oostveen, J.; Montazeri, S.; Boeters, R.; Colin, J.; Kastendeuch, P.; Nerry, F.; et al. Modeling and observation of heat losses from buildings: The impact of geometric detail on 3D heat flux modeling. In Proceedings of the 33rd European Association of Remote Sensing Laboratories (EARSeL) Symposium, Matera, Italy, 3–6 June 2013; pp. 353–372.
- Amorim, J.H.; Valente, J.; Pimentel, C.; Miranda, A.I.; Borrego, C. Detailed modelling of the wind comfort in a city avenue at the pedestrian level. In Usage, Usability, and Utility of 3D City Models— European COST Action TU0801; Leduc, T., Moreau, G., Billen, R., Eds.; EDP Sciences: Nantes, France, 2012; pp. (03008)1–6. [Google Scholar]
- Janssen, W.D.; Blocken, B.; van Hooff, T. Pedestrian wind comfort around buildings: Comparison of wind comfort criteria based on whole-flow field data for a complex case study. Build. Environ. 2013, 59, 547–562. [Google Scholar] [CrossRef]
- Maragkogiannis, K.; Kolokotsa, D.; Maravelakis, E.; Konstantaras, A. Combining terrestrial laser scanning and computational fluid dynamics for the study of the urban thermal environment. Sustain. Cities Soc. 2014, 13, 207–216. [Google Scholar] [CrossRef]
- Willenborg, B. Simulation of explosions in urban space and result analysis based on CityGML-City Models and a cloud-based 3D-Webclient. Master’s Thesis, Technical University Munich, Munich, Germany, 2015. [Google Scholar]
- Upadhyay, G.; Kämpf, J.; Scartezzini, J.L. Ground temperature modelling: The case study of Rue des Maraîchers in Geneva. In Proceedings of the Eurographics Workshop on Urban Data Modelling and Visualisation 2014, Strasbourg, France, 6 April 2014; pp. 13–18.
- Hsieh, C.M.; Aramaki, T.; Hanaki, K. Managing heat rejected from air conditioning systems to save energy and improve the microclimates of residential buildings. Comput. Environ. Urban Syst. 2011, 35, 358–367. [Google Scholar] [CrossRef]
- Zheng, M.H.; Guo, Y.R.; Ai, X.Q.; Qin, T.; Wang, Q.; Xu, J.M. Coupling GIS with CFD modeling to simulate urban pollutant dispersion. In Proceedings of the 2010 International Conference on Mechanic Automation and Control Engineering (MACE), Wuhan, China, 25–27 June 2008.
- Kunze, C.; Hecht, R. Semantic enrichment of building data with volunteered geographic information to improve mappings of dwelling units and population. Comput. Environ. Urban Syst. 2015, 53, 4–18. [Google Scholar] [CrossRef]
- Wu, S.s.; Qiu, X.; Wang, L. Population estimation methods in GIS and remote sensing: A review. GISci. Remote Sens. 2005, 42, 80–96. [Google Scholar] [CrossRef]
- Lwin, K.; Murayama, Y. A GIS approach to estimation of building population for micro-spatial analysis. Trans. GIS 2009, 13, 401–414. [Google Scholar] [CrossRef]
- Wu, S.s.; Wang, L.; Qiu, X. Incorporating GIS building data and census housing statistics for sub-block-level population estimation. Prof. Geogr. 2008, 60, 121–135. [Google Scholar] [CrossRef]
- Ural, S.; Hussain, E.; Shan, J. Building population mapping with aerial imagery and GIS data. Int. J. Appl. Earth Obs. Geoinf. 2011, 13, 841–852. [Google Scholar] [CrossRef]
- Silván-Cárdenas, J.L.; Wang, L.; Rogerson, P.; Wu, C.; Feng, T.; Kamphaus, B.D. Assessing fine-spatial-resolution remote sensing for small-area population estimation. Int. J. Remote Sens. 2010, 31, 5605–5634. [Google Scholar] [CrossRef]
- Lu, Z.; Im, J.; Quackenbush, L.; Halligan, K. Population estimation based on multi-sensor data fusion. Int. J. Remote Sens. 2010, 31, 5587–5604. [Google Scholar] [CrossRef]
- Kressler, F.; Steinnocher, K. Object-oriented analysis of image and LiDAR data and its potential for a dasymetric mapping application. In On segment based image fusion; Springer: Berlin, Germany, 2008; pp. 611–624. [Google Scholar]
- Dong, P.; Ramesh, S.; Nepali, A. Evaluation of small-area population estimation using LiDAR, Landsat TM and parcel data. Int. J. Remote Sens. 2010, 31, 5571–5586. [Google Scholar] [CrossRef]
- Lwin, K.K.; Murayama, Y. Estimation of building population from LiDAR derived digital volume model. In Spatial Analysis and Modeling in Geographical Transformation Process; Springer: Dordrecht, The Netherlands, 2011; pp. 87–98. [Google Scholar]
- Qiu, F.; Sridharan, H.; Chun, Y. Spatial autoregressive model for population estimation at the census block level using LiDAR-derived building volume information. Cartogr. Geogr. Inf. Sci. 2010, 37, 239–257. [Google Scholar] [CrossRef]
- Alahmadi, M.; Atkinson, P.M.; Martin, D. A comparison of small-area population estimation techniques using built-area and height data, Riyadh, Saudi Arabia. IEEE J. Sel. Top. Appl. Earth Obs. Remote Sens. 2014. [Google Scholar] [CrossRef]
- Sridharan, H.; Qiu, F. A spatially disaggregated areal interpolation model using light detection and ranging-derived building volumes. Geogr. Anal. 2013, 45, 238–258. [Google Scholar] [CrossRef]
- Tutschku, K. Demand-based radio network planning of cellular mobile communication systems. In Proceedings of the Seventeenth Annual Joint Conference of the IEEE Computer and Communications Societies, San Francisco, CA, USA, 29 March–2 April 1998; pp. 1054–1061.
- Schneiderbauer, S.; Ehrlich, D. Population Density Estimations for Disaster Management: Case Study Rural Zimbabwe. In Geo-information for Disaster Management; Springer: Berlin, Germany, 2005; pp. 901–921. [Google Scholar]
- Akbar, M.; Aliabadi, S.; Patel, R.; Watts, M. A fully automated and integrated multi-scale forecasting scheme for emergency preparedness. Environ. Model. Softw. 2013, 39, 24–38. [Google Scholar] [CrossRef]
- Hildebrandt, D.; Timm, R. An assisting, constrained 3D navigation technique for multiscale virtual 3D city models. GeoInformatica 2014, 18, 537–567. [Google Scholar] [CrossRef]
- Slingsby, A.; Raper, J. Navigable space in 3D city models for pedestrians. In Advances in 3D Geoinformation Systems; van Oosterom, P., Zlatanova, S., Penninga, F., Fendel, E., Eds.; Springer: Berlin, Germany, 2008; pp. 49–64. [Google Scholar]
- Thill, J.C.; Dao, T.H.D.; Zhou, Y. Traveling in the three-dimensional city: applications in route planning, accessibility assessment, location analysis and beyond. J. Transp. Geogr. 2011, 19, 405–421. [Google Scholar] [CrossRef]
- Liu, L.; Zlatanova, S. A “door-to-door” Path-Finding Approach for Indoor Navigation. ISPRS Ann. Photogramm. Remote Sens. Spat. Inf. Sci. 2011, II-4, 45–51. [Google Scholar]
- Jamali, A.; Abdul-Rahman, A.; Boguslawski, P.; Kumar, P.; Gold, C.M. An automated 3D modeling of topological indoor navigation network. GeoJournal 2015. [Google Scholar] [CrossRef]
- Nagel, C. Spatio-Semantic Modelling of Indoor Environments for Indoor Navigation. Ph.D. Thesis, TU Berlin, Berlin, Germany, 2014. [Google Scholar]
- Isikdag, U.; Zlatanova, S.; Underwood, J. A BIM-Oriented Model for supporting indoor navigation requirements. Comput. Environ. Urban Syst. 2013, 41, 112–123. [Google Scholar] [CrossRef]
- Kim, J.S.; Yoo, S.J.; Li, K.J. Integrating IndoorGML and CityGML for indoor space. In Web and Wireless Geographical Information Systems; Pfoser, D., Li, K.J., Eds.; Springer: Berlin, Germany; pp. 184–196.
- Kim, Y.; Kang, H.; Lee, J. Developing CityGML indoor ADE to manage indoor facilities. In Innovations in 3D Geo-Information Sciences; Springer International Publishing: Cham, Switzerland, 2014; pp. 243–265. [Google Scholar]
- Sternberg, H.; Keller, F.; Willemsen, T. Precise indoor mapping as a basis for coarse indoor navigation. J. Appl. Geod. 2013, 7, 231–246. [Google Scholar] [CrossRef]
- Atila, U.; Karas, I.R.; Abdul-Rahman, A. A 3D-GIS implementation for realizing 3D network analysis and routing simulation for evacuation purpose. In Progress and New Trends in 3D Geoinformation Sciences; Springer: Berlin, Germany, 2013; pp. 249–260. [Google Scholar]
- Atila, U.; Karas, I.R.; Abdul-Rahman, A. Integration of CityGML and oracle spatial for implementing 3D network analysis solutions and routing simulation within 3D-GIS environment. Geo-Spat. Inf. Sci. 2013, 16, 221–237. [Google Scholar] [CrossRef]
- Atila, U.; Karas, I.R.; Turan, M.K.; Abdul-Rahman, A. Automatic generation of 3D networks in CityGML and design of an intelligent individual evacuation model for building fires within the scope of 3D GIS. In Innovations in 3D Geo-Information Sciences; Springer International Publishing: Cham, Switzerland, 2014; pp. 123–142. [Google Scholar]
- Zhang, L.; Wang, Y.; Shi, H.; Zhang, L. Modeling and analyzing 3D complex building interiors for effective evacuation simulations. Fire Saf. J. 2012, 53, 1–12. [Google Scholar] [CrossRef]
- Meijers, M.; Zlatanova, S.; Pfeifer, N. 3D geoinformation indoors: Structuring for evacuation. In Proceedings of the 1st ISPRS/EuroSDR/DGPF International workshop on Next Generation 3D City Models, Bonn, Germany, 21–22 June 2005; pp. 1–6.
- Schaap, J.; Zlatanova, S.; van Oosterom, P. Towards a 3D geo-data model to support pedestrian routing in multimodal public transport travel advices. Int. Arch. Photogramm. Remote Sens. Spat. Inf. Sci. 2011, XXXVIII-4/C21, 59–76. [Google Scholar]
- Kim, K.; Wilson, J.P. Planning and visualising 3D routes for indoor and outdoor spaces using CityEngine. J. Spat. Sci. 2014, 60, 179–193. [Google Scholar] [CrossRef]
- Dao, T.H.D.; Zhou, Y.; Thill, J.C.; Delmelle, E. Spatio-temporal location modeling in a 3D indoor environment: the case of AEDs as emergency medical devices. Int. J. Geogr. Inf. Sci. 2012, 26, 469–494. [Google Scholar] [CrossRef]
- Christodoulou, S.; Vamvatsikos, D.; Georgiou, C. A BIM-based framework for forecasting and visualizing seismic damage, cost and time to repair. In Proceedings of the European Conference on Product and Process Modelling, Cork, Ireland, 14–16 September 2011.
- Kemec, S.; Zlatanova, S.; Duzgun, H.S. A framework for defining a 3D model in support of risk management. In Geographic Information and Cartography for Risk and Crisis Management; Springer: Berlin, Germany, 2010; pp. 69–82. [Google Scholar]
- Jain, S.K.; Singh, R.D.; Seth, S.M. Design flood estimation using GIS supported GIUHApproach. Water Resour. Manag. 2000, 14, 369–376. [Google Scholar] [CrossRef]
- Liu, Y.B.; Gebremeskel, S.; de Smedt, F.; Hoffmann, L.; Pfister, L. A diffusive transport approach for flow routing in GIS-based flood modeling. J. Hydrol. 2003, 283, 91–106. [Google Scholar] [CrossRef]
- Schulte, C.; Coors, V. Development of a CityGML ADE for dynamic 3D flood information. In Proceedings of the Joint ISCRAM-CHINA and GI4DM Conference on Information Systems for Crisis Management, Harbin, China, 4–6 August 2008.
- Varduhn, V.; Mundani, R.P.; Rank, E. Multi-resolution models: Recent progress in coupling 3D geometry to environmental numerical simulation. In 3D Geoinformation Science; Springer International Publishing: Cham, Switzerland, 2015; pp. 55–69. [Google Scholar]
- Amirebrahimi, S.; Rajabifard, A.; Mendis, P.; Ngo, T. A framework for a microscale flood damage assessment and visualization for a building using BIM—GIS integration. Int. J. Digit. Earth 2015. [Google Scholar] [CrossRef]
- Sharkawi, K.H.; Abdul-Rahman, A. Towards an efficient city inventory management system for urban authorities in developing countries—The case of 3D change detection. The Electron. J. Inf. Syst. Dev. Ctries 2014, 60, 1–13. [Google Scholar]
- Pédrinis, F.; Morel, M.; Gesquière, G. Change detection of cities. In 3D Geoinformation Science; Springer International Publishing: Cham, Switzerland, 2015; pp. 123–139. [Google Scholar]
- Qin, R. Change detection on LOD 2 building models with very high resolution spaceborne stereo imagery. ISPRS J. Photogramm. Remote Sens. 2014, 96, 179–192. [Google Scholar] [CrossRef]
- GeoSignum. Rotterdam Analyses City Lidar Data with New Technique. Available online: http://www.gim-international.com (accessed on 15 December 2015).
- Ghassoun, Y.; Löwner, M.O.; Weber, S. Exploring the benefits of 3D city models in the field of urban particles distribution modelling—A comparison of model results. In Advances in 3D Geo-Information Sciences; Springer: Berlin, Germany, 2015; pp. 193–205. [Google Scholar]
- Hamaina, R.; Leduc, T.; Moreau, G. A new method to characterize density adapted to a coarse city model. In Information Fusion and Geographic Information Systems (IF and GIS 2013); Popovich, V., Claramunt, C., Schrenk, M., Korolenko, K., Eds.; Springer: Berlin, Germany, 2014; pp. 249–263. [Google Scholar]
- Ghassoun, Y.; Ruths, M.; Löwner, M.O.; Weber, S. Intra-urban variation of ultrafine particles as evaluated by process related land use and pollutant driven regression modelling. Sci. Total Environ. 2015, 536, 150–160. [Google Scholar] [CrossRef] [PubMed]
- Ghassoun, Y.; Löwner, M.O. Comparison of 2D & 3D parameter-based models in urban fine dust distribution modelling. In Advances in 3D Geoinformation; Springer International Publishing: Cham, Switzerland, 2016. [Google Scholar]
- Roßmann, J.; Hoppen, M.; Bücken, A. GML-based data management and semantic world modelling for a 4D forest simulation and information system. Int. J. 3-D Inf. Model. 2015, 3, 50–67. [Google Scholar] [CrossRef]
- Rahlf, J.; Breidenbach, J.; Solberg, S.; Næsset, E.; Astrup, R. Comparison of four types of 3D data for timber volume estimation. Remote Sens. Environ. 2014, 155, 325–333. [Google Scholar] [CrossRef]
- Piccoli, C. CityEngine for Archaeology. In Proceedings of the Mini Conference 3D GIS for Mapping the via Appia, Amsterdam, The Netherlands, 19 April 2013.
- De Hond, R. Mapping the Via Appia—3D GIS. In Proceedings of the Mini Conference 3D GIS for Mapping the via Appia, Amsterdam, The Netherlands, 19 April 2013.
- De Roo, B.; Bourgeois, J.; de Maeyer, P. Usability assessment of a virtual globe-based 4D archaeological GIS. In Advances in 3D Geoinformation; Springer International Publishing: Cham, Switzerland, 2016; in press. [Google Scholar]
- Gaiani, M.; Gamberini, E.; Tonelli, G. VR as work tool for architectural & archaeological restoration: the ancient Appian way 3D web virtual GIS. In Proceedings of the Seventh International Conference on Virtual Systems and Multimedia, Berkeley, CA, USA, 25–27 October 2001; pp. 86–95.
- Apollonio, F.I.; Gaiani, M.; Benedetti, B. 3D reality-based artefact models for the management of archaeological sites using 3D Gis: a framework starting from the case study of the Pompeii Archaeological area. J. Archaeol. Sci. 2012, 39, 1271–1287. [Google Scholar] [CrossRef]
- Losier, L.M.; Pouliot, J.; Fortin, M. 3D geometrical modeling of excavation units at the archaeological site of Tell ‘Acharneh (Syria). J. Archaeol. Sci. 2007, 34, 272–288. [Google Scholar] [CrossRef]
- Katsianis, M.; Tsipidis, S.; Kotsakis, K.; Kousoulakou, A. A 3D digital workflow for archaeological intra-site research using GIS. J. Archaeol. Sci. 2008, 35, 655–667. [Google Scholar] [CrossRef]
- Wüst, T.; Nebiker, S.; Landolt, R. Applying the 3D GIS DILAS to Archaeology and cultural heritage projects requirements and first results. Int. Arch. Photogramm. Remote Sens. Spat. Inf. Sci. 2004, XXXV/P-B5, 407–412. [Google Scholar]
- von Schwerin, J.; Richards-Rissetto, H.; Remondino, F.; Spera, M.G.; Auer, M.; Billen, N.; Loos, L.; Stelson, L.; Reindel, M. Airborne LiDAR acquisition, post-processing and accuracy-checking for a 3D WebGIS of Copan, Honduras. J. Archaeol. Sci.: Rep. 2016, 5, 85–104. [Google Scholar] [CrossRef]
- Auer, M.; Agugiaro, G.; Billen, N.; Loos, L.; Zipf, A. Web-based Visualization and Query of semantically segmented multiresolution 3D Models in the Field of Cultural Heritage. ISPRS Ann. Photogramm. Remote Sens. Spat. Inf. Sci. 2014, II-5, 33–39. [Google Scholar] [CrossRef]
- von Schwerin, J.; Richards-Rissetto, H.; Remondino, F.; Agugiaro, G.; Girardi, G. The MayaArch3D project: A 3D WebGIS for analyzing ancient architecture and landscapes. Lit. Linguist. Comput. 2013, 28, 736–753. [Google Scholar] [CrossRef]
- Bernknopf, R.; Shapiro, C. Economic assessment of the use value of geospatial information. ISPRS Int. J. Geo-Inf. 2015, 4, 1142–1165. [Google Scholar] [CrossRef]
- Castelein, W.T.; Bregt, A.; Pluijmers, Y. The economic value of the Dutch geo-information sector. Int. J. Spat. Data Infrastruct. Res. 2010, 5, 58–76. [Google Scholar]
- Trapp, N.; Schneider, U.A.; McCallum, I.; Fritz, S.; Schill, C.; Borzacchiello, M.T.; Heumesser, C.; Craglia, M. A meta-analysis on the return on investment of geospatial data and systems: A multi-country perspective. Trans. GIS 2015, 19, 169–187. [Google Scholar] [CrossRef]
- Carmigniani, J.; Furht, B.; Anisetti, M.; Ceravolo, P.; Damiani, E.; Ivkovic, M. Augmented reality technologies, systems and applications. Multimedia Tools Appl. 2011, 51, 341–377. [Google Scholar] [CrossRef]
- Çöltekin, A.; Clarke, K.C. A representation of everything. Geospat. Today 2011, 1, 26–28. [Google Scholar]
- El-Mekawy, M.; Östman, A.; Hijazi, I. A unified building model for 3D urban GIS. ISPRS Int. J. Geo-Inf. 2012, 1, 120–145. [Google Scholar] [CrossRef]
- de Laat, R.; van Berlo, L. Integration of BIM and GIS: The development of the CityGML GeoBIM extension. In Advances in 3D Geo-Information Sciences; Springer: Berlin, Germany, 2011; pp. 211–225. [Google Scholar]
- Isikdag, U.; Zlatanova, S. Towards defining a framework for automatic generation of buildings in CityGML using building information models. In 3D Geo-Information Sciences; Springer: Berlin, Germany, 2009; pp. 79–96. [Google Scholar]
- El-Mekawy, M.; Östman, A.; Hijazi, I. An evaluation of IFC-CityGML unidirectional conversion. Int. J. Adv. Comput. Sci. Appl. 2012, 3, 159–171. [Google Scholar] [CrossRef]
- Biljecki, F.; Arroyo Ohori, K. Automatic semantic-preserving conversion between OBJ and CityGML. In Proceedings of the Eurographics Workshop on Urban Data Modelling and Visualisation 2015, Delft, The Netherlands, 23 November 2015; pp. 25–30.
- Kumar, K.; Saran, S.; Kumar, A.S. CityGML based interoperability for the transformation of 3D data models. Trans. GIS 2016, in press. [Google Scholar]
- Müller Arisona, S.; Zhong, C.; Huang, X.; Qin, H. Increasing detail of 3D models through combined photogrammetric and procedural modelling. Geo-Spat. Inf. Sci. 2013, 16, 45–53. [Google Scholar] [CrossRef]
- Martinović, A.; Knopp, J.; Riemenschneider, H.; van Gool, L. 3D all the way: Semantic segmentation of urban scenes from start to end in 3D. In Proceedings of the 28th IEEE Conference on Computer Vision and Pattern Recognition, Boston, MA, USA, 7–12 June 2015; pp. 4456–4465.
- Rautenbach, V.; Bevis, Y.; Coetzee, S.; Combrinck, C. Evaluating procedural modelling for 3D models of informal settlements in urban design activities. South Afr. J. Sci. 2015, 111. [Google Scholar] [CrossRef]
- Jung, H.; Lee, K.; Chun, W. Integration of GIS, GPS, and optimization technologies for the effective control of parcel delivery service. Comput. Ind. Eng. 2006, 51, 154–162. [Google Scholar] [CrossRef]
© 2015 by the authors; licensee MDPI, Basel, Switzerland. This article is an open access article distributed under the terms and conditions of the Creative Commons Attribution license (http://creativecommons.org/licenses/by/4.0/).
Share and Cite
Biljecki, F.; Stoter, J.; Ledoux, H.; Zlatanova, S.; Çöltekin, A. Applications of 3D City Models: State of the Art Review. ISPRS Int. J. Geo-Inf. 2015, 4, 2842-2889. https://0-doi-org.brum.beds.ac.uk/10.3390/ijgi4042842
Biljecki F, Stoter J, Ledoux H, Zlatanova S, Çöltekin A. Applications of 3D City Models: State of the Art Review. ISPRS International Journal of Geo-Information. 2015; 4(4):2842-2889. https://0-doi-org.brum.beds.ac.uk/10.3390/ijgi4042842
Chicago/Turabian StyleBiljecki, Filip, Jantien Stoter, Hugo Ledoux, Sisi Zlatanova, and Arzu Çöltekin. 2015. "Applications of 3D City Models: State of the Art Review" ISPRS International Journal of Geo-Information 4, no. 4: 2842-2889. https://0-doi-org.brum.beds.ac.uk/10.3390/ijgi4042842