
Visualizing the Intellectual Structure of Eye Movement Research in Cartography


Abstract
:1. Introduction
2. Bibliometric Analysis Methods and Tools
3. Data and Methodology
3.1. Data
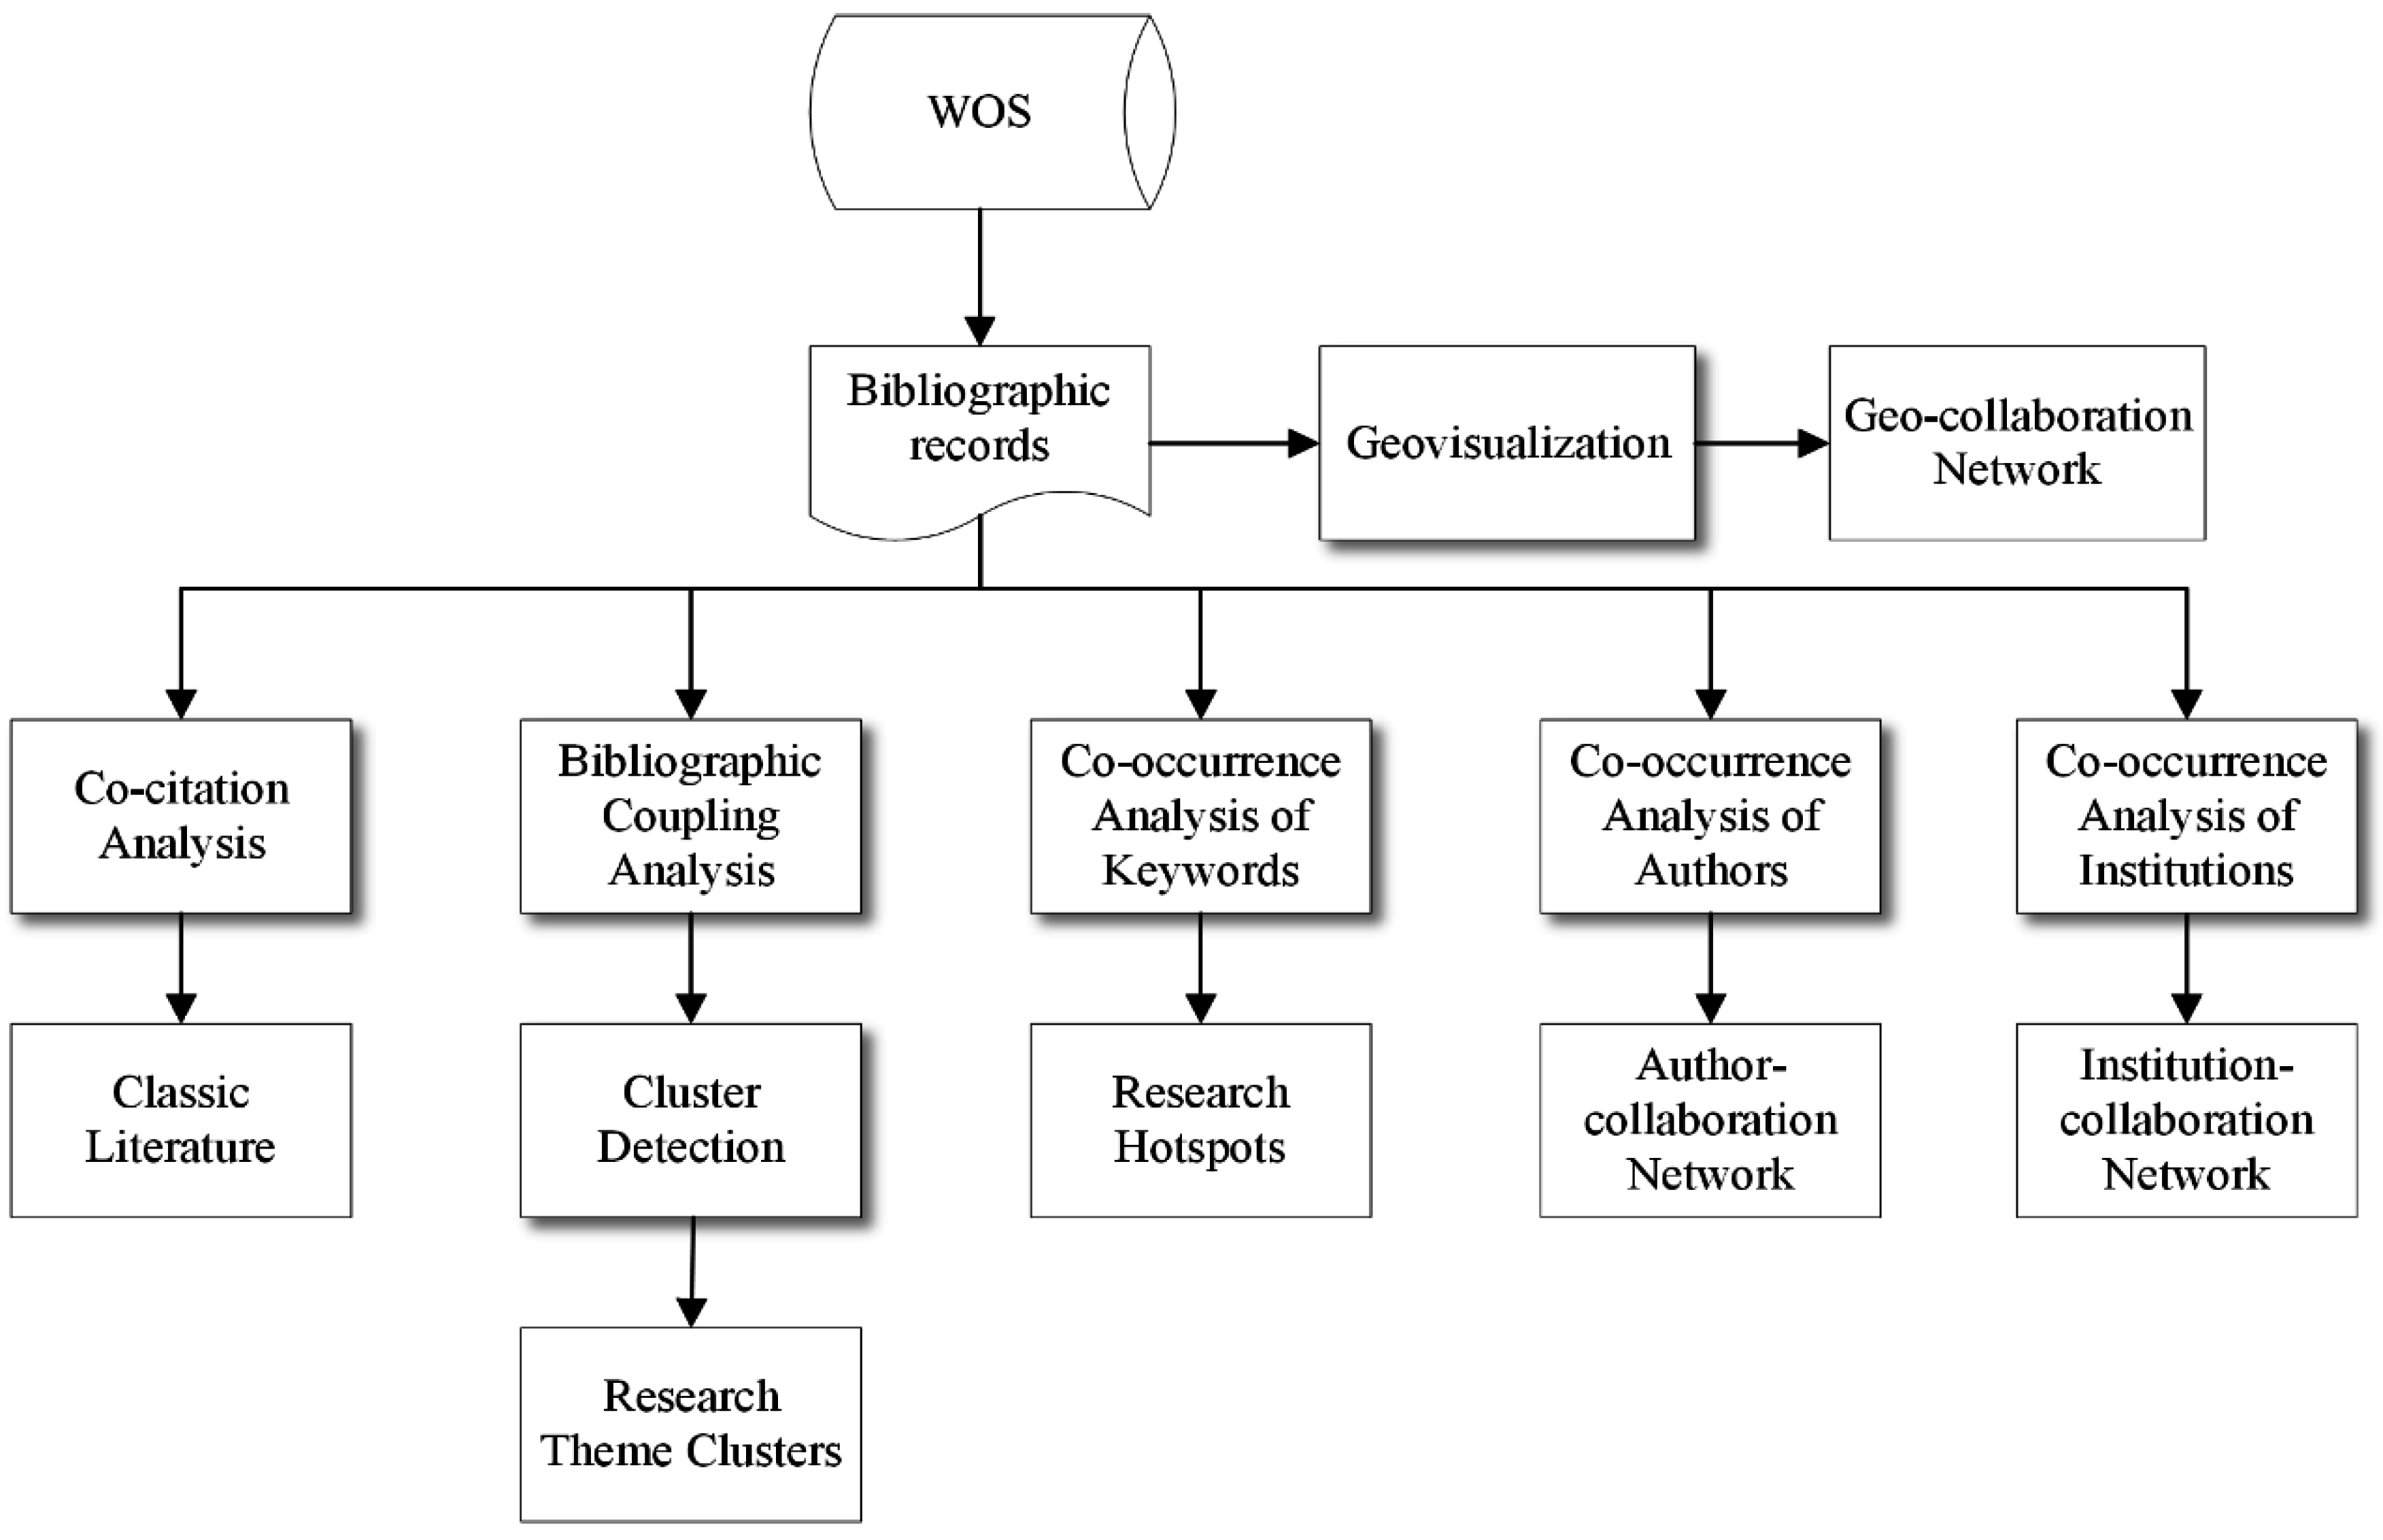
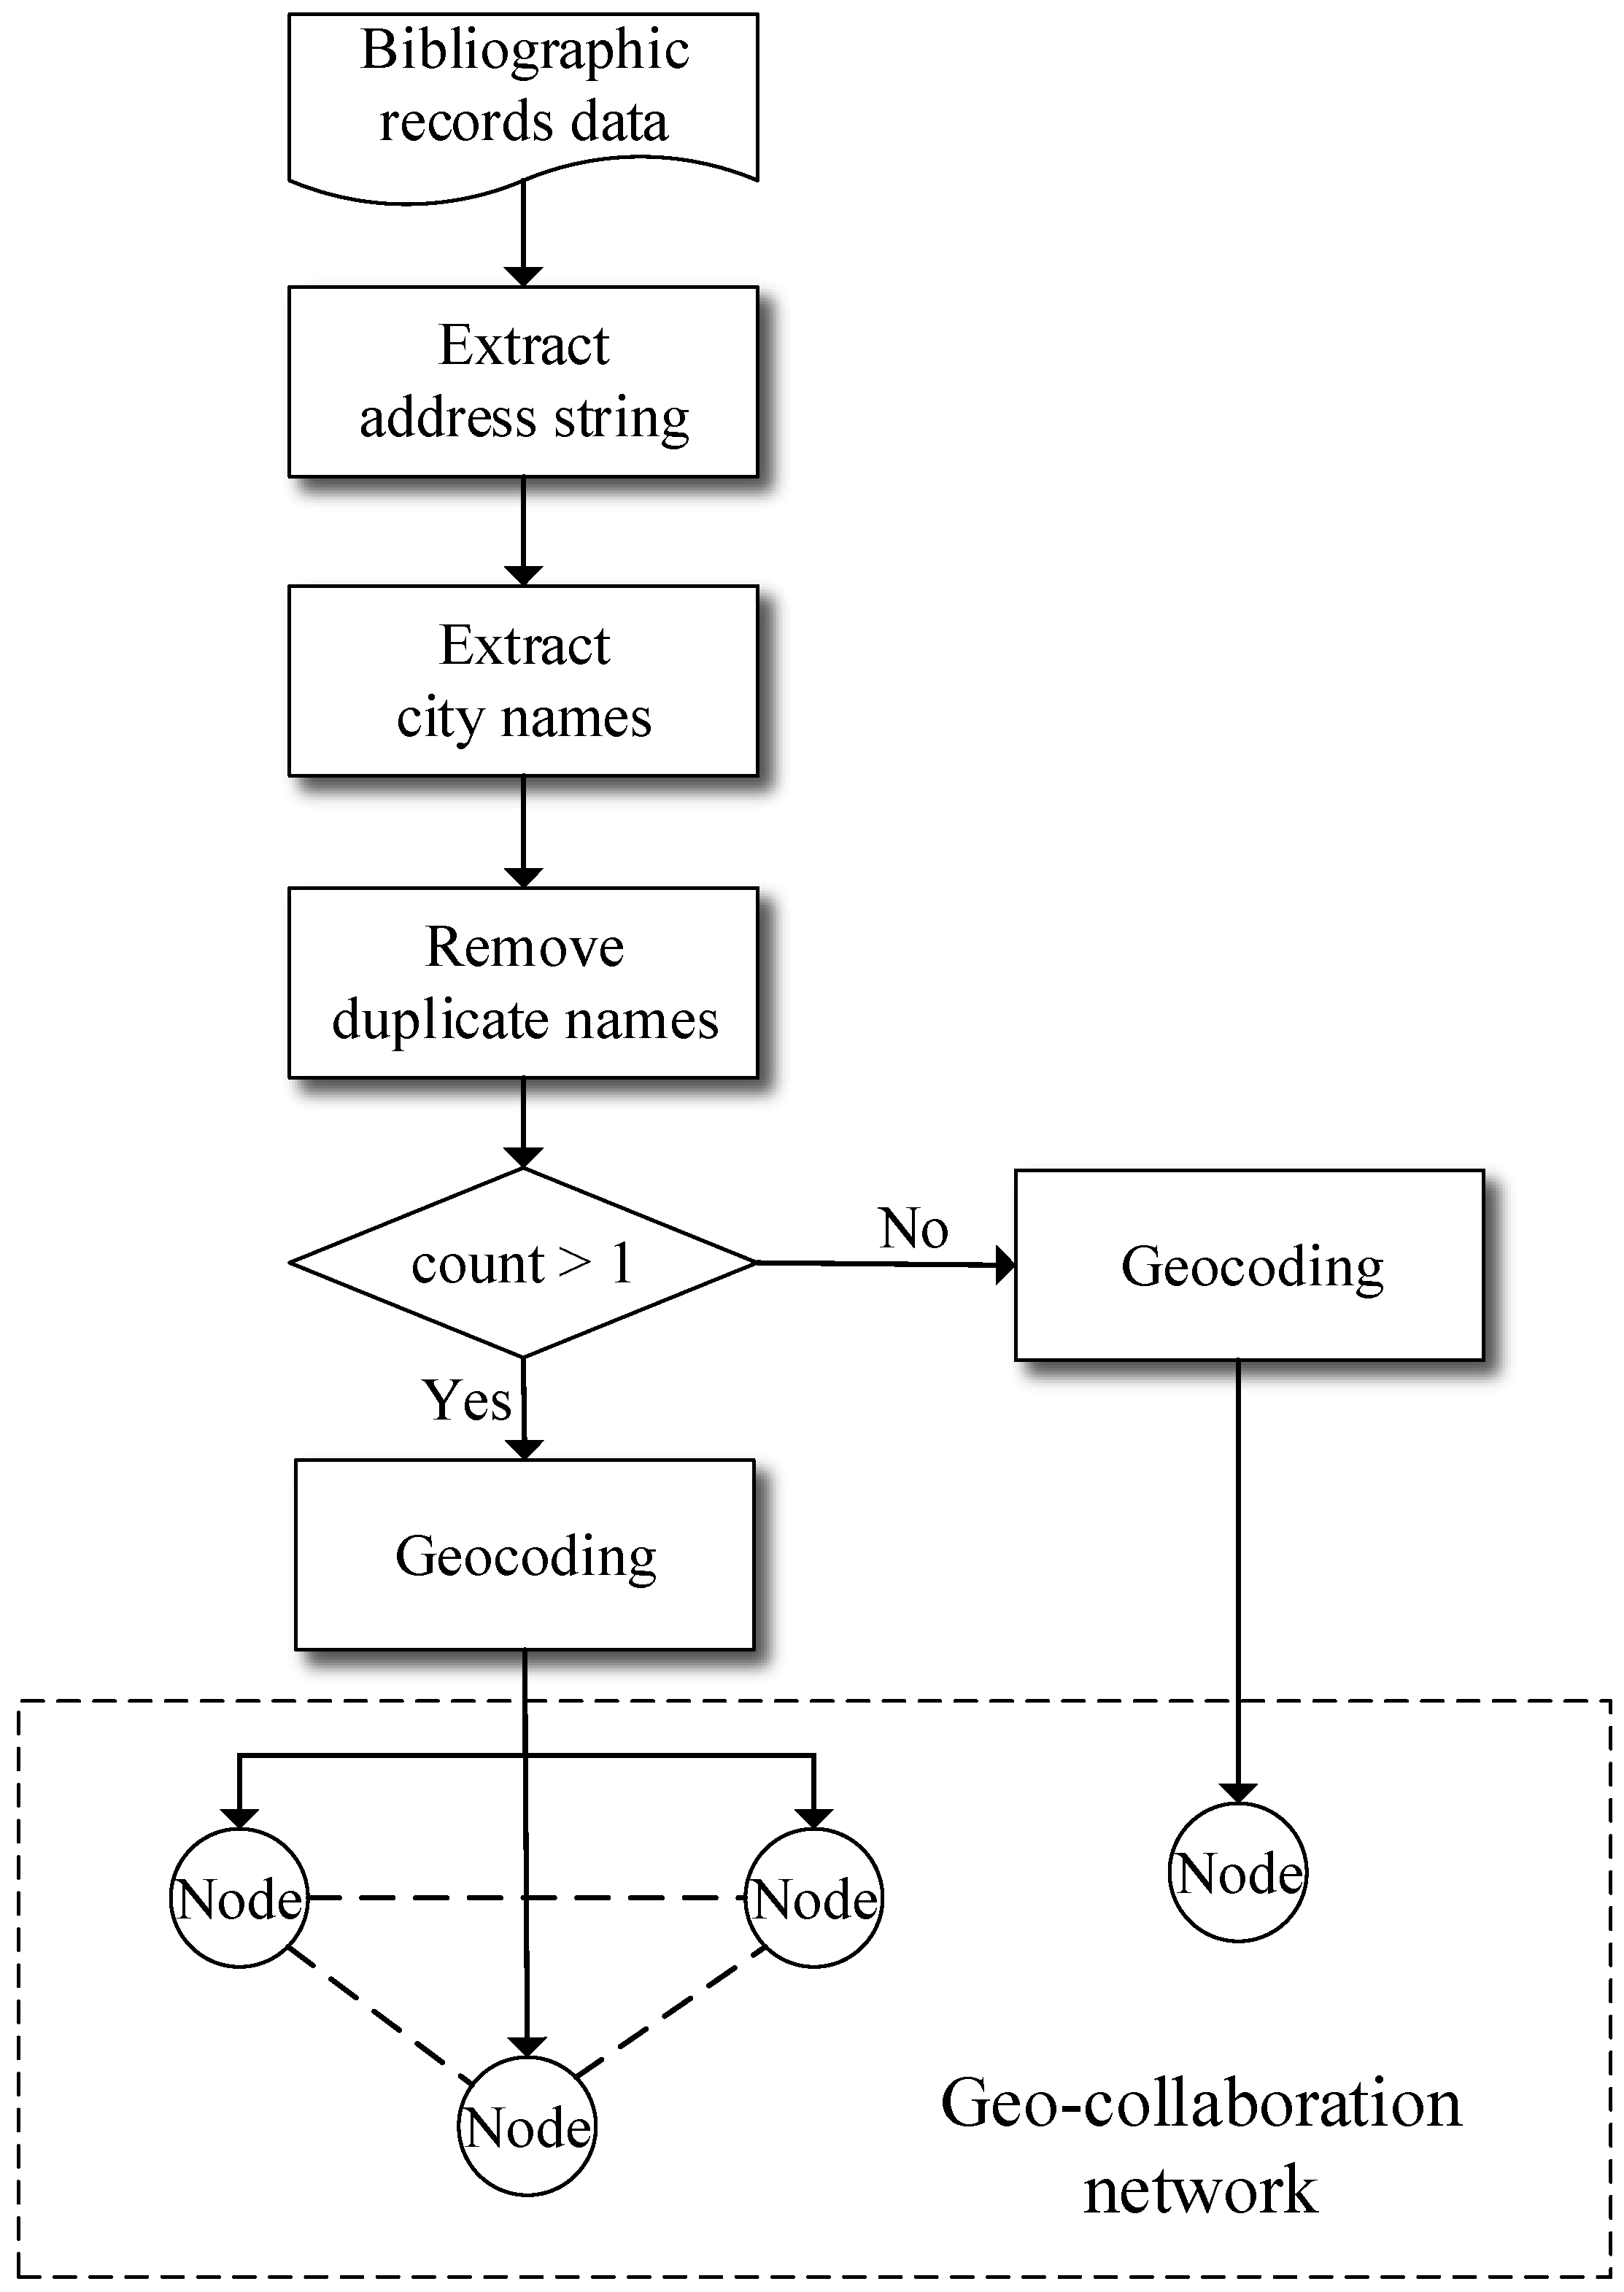
3.2. Workflow
3.3. Visualization Tools
3.3.1. Gephi
3.3.2. CartoDB
4. Results and Analysis
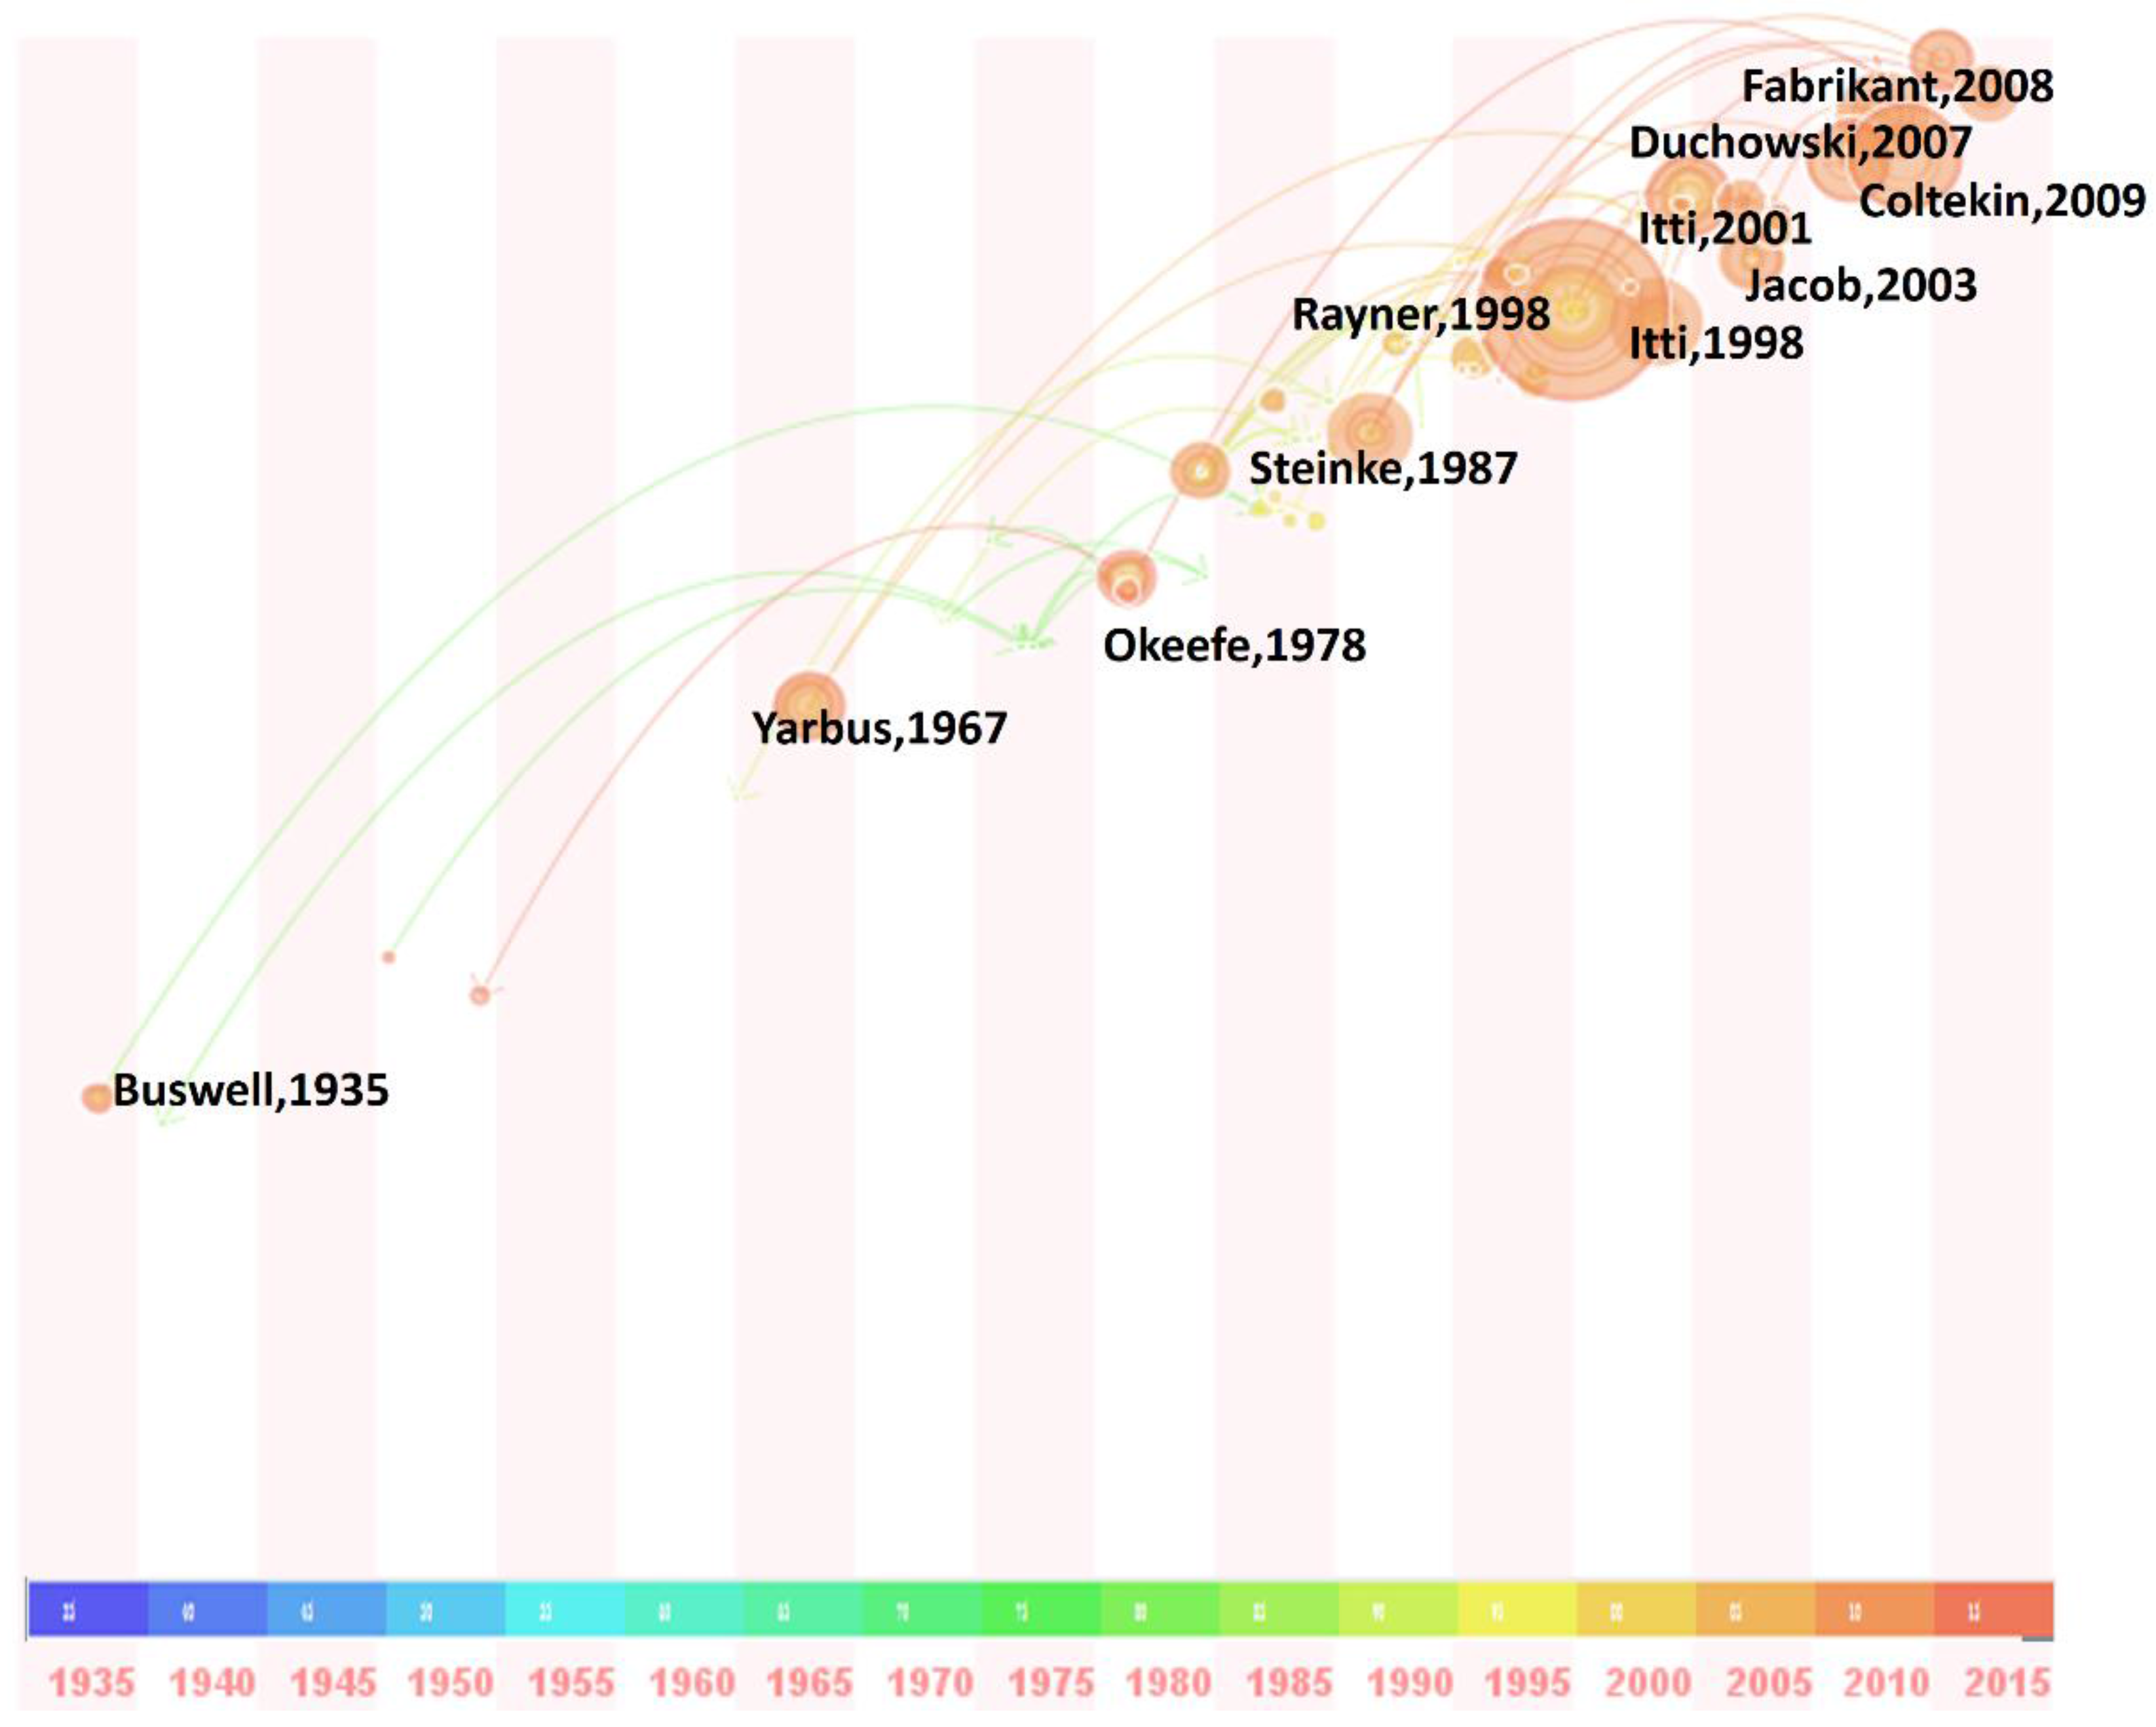
4.1. Classic Literature
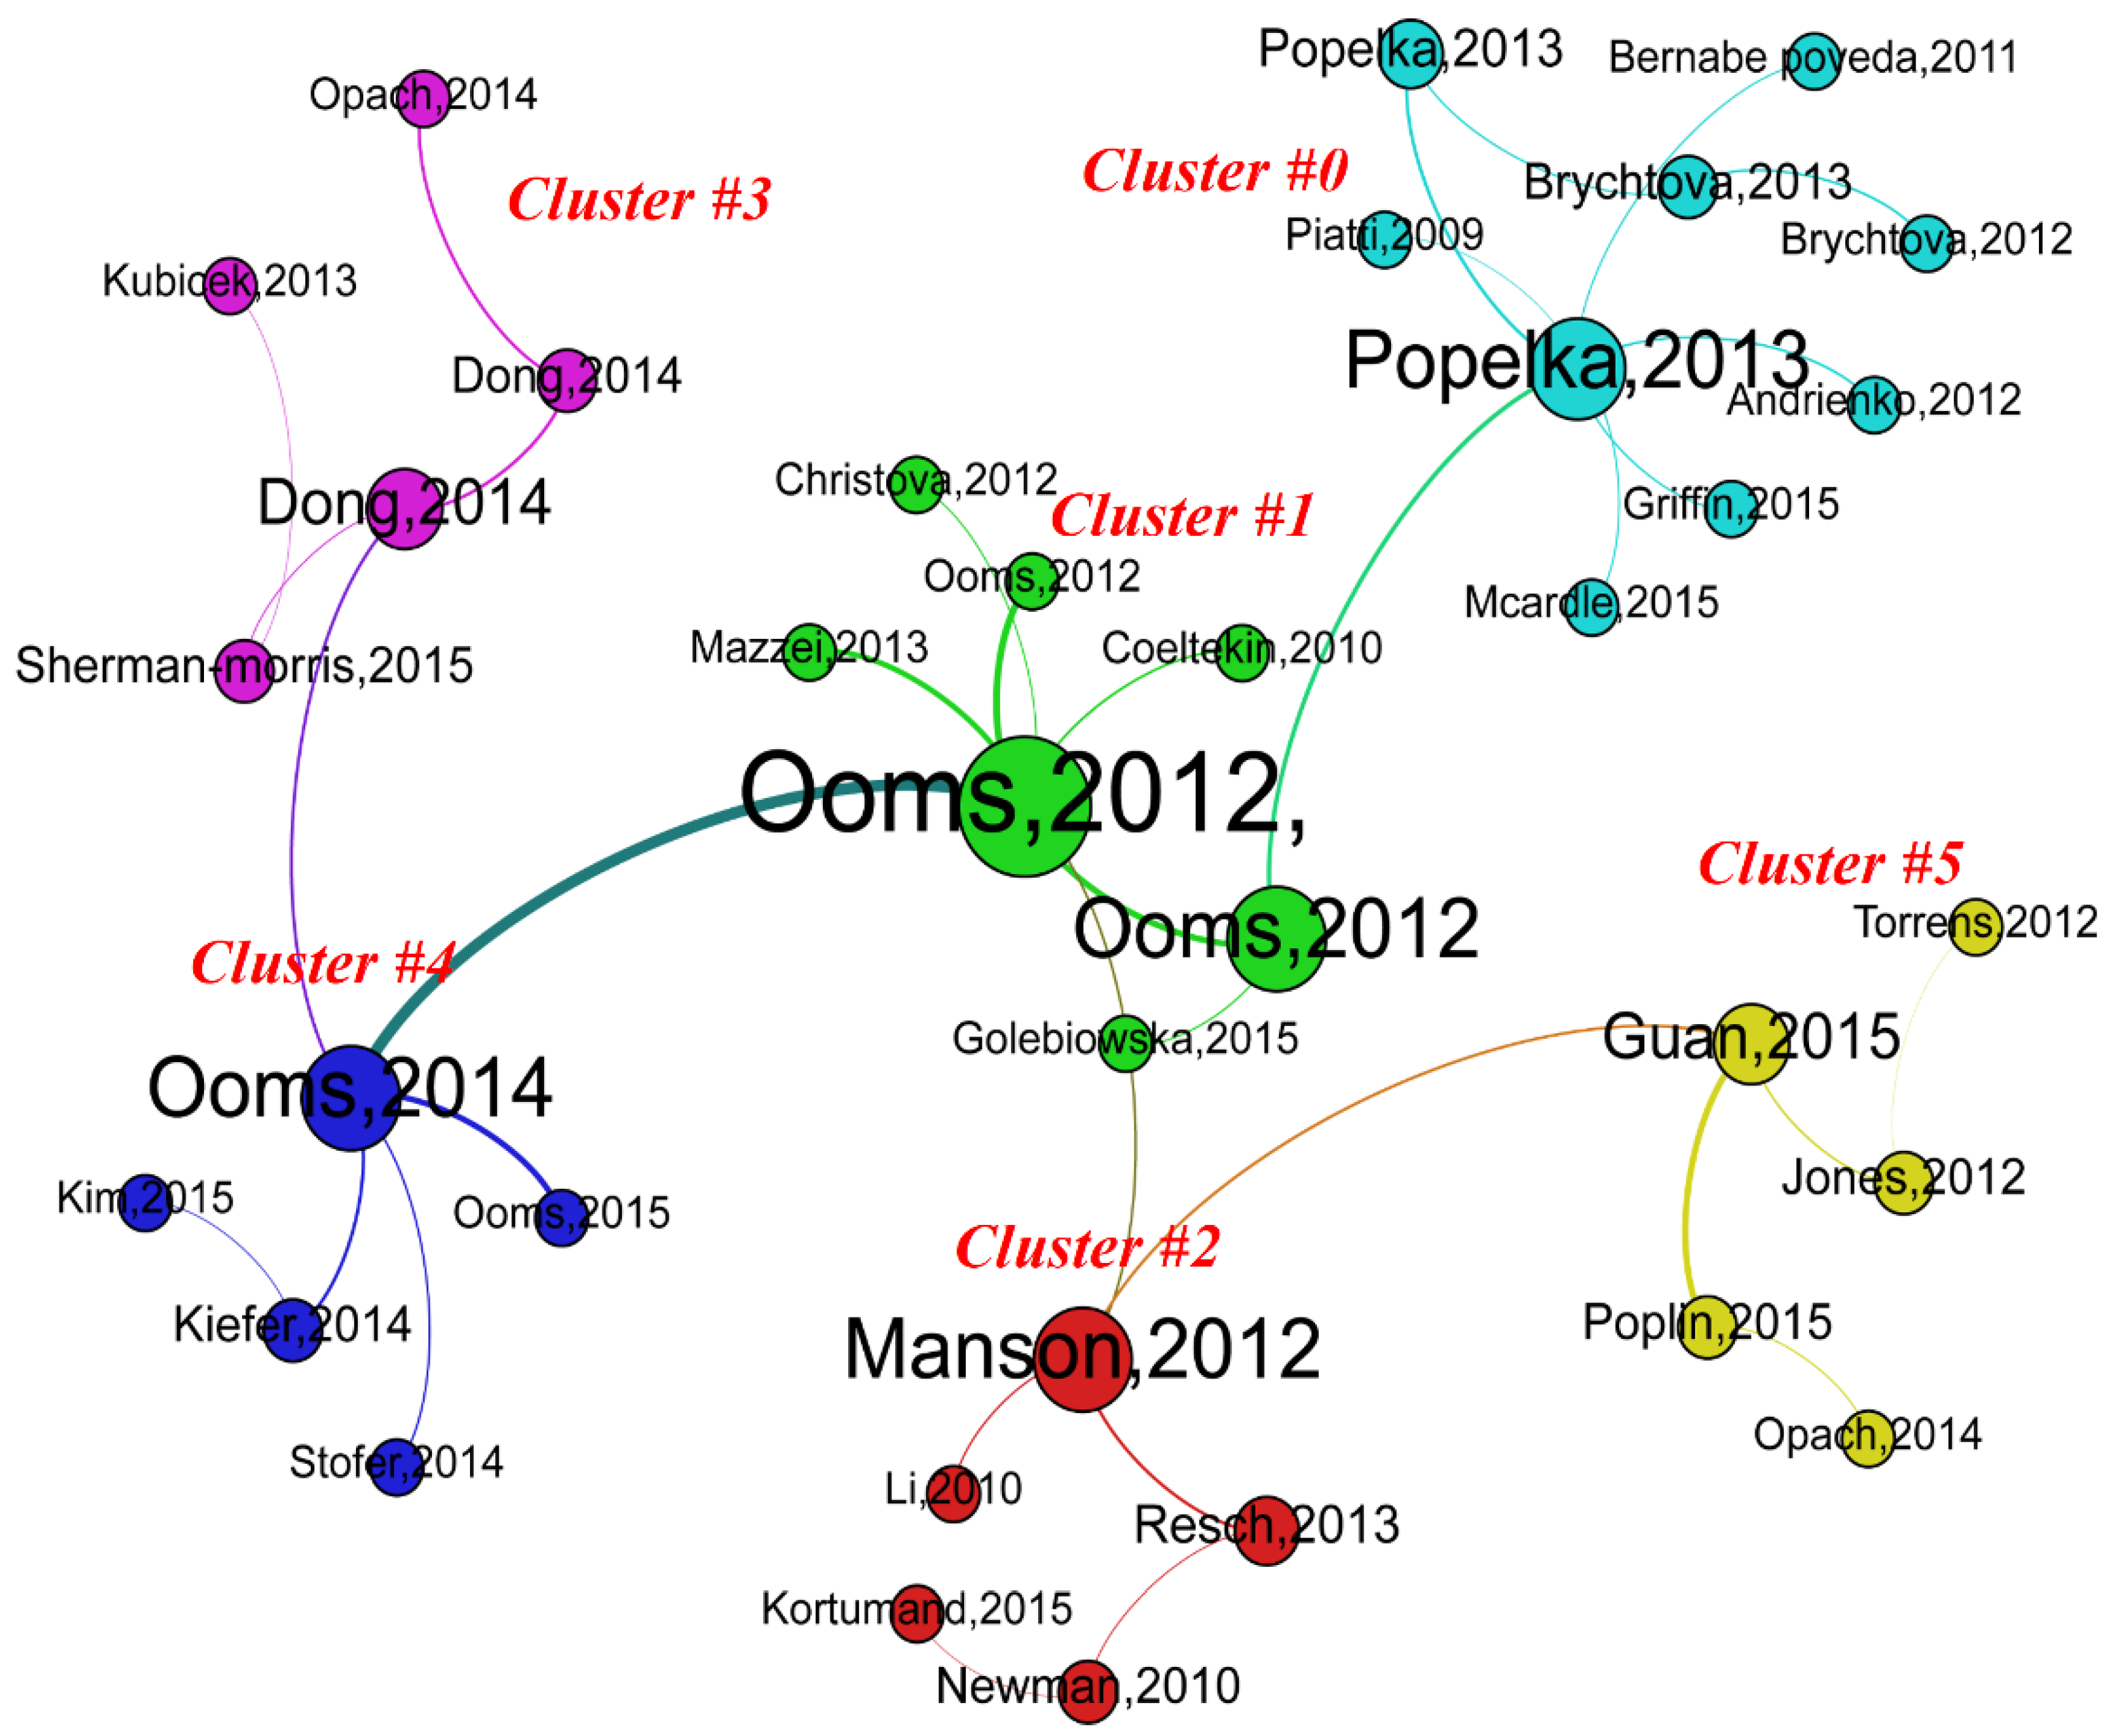
4.2. Research Theme Clusters
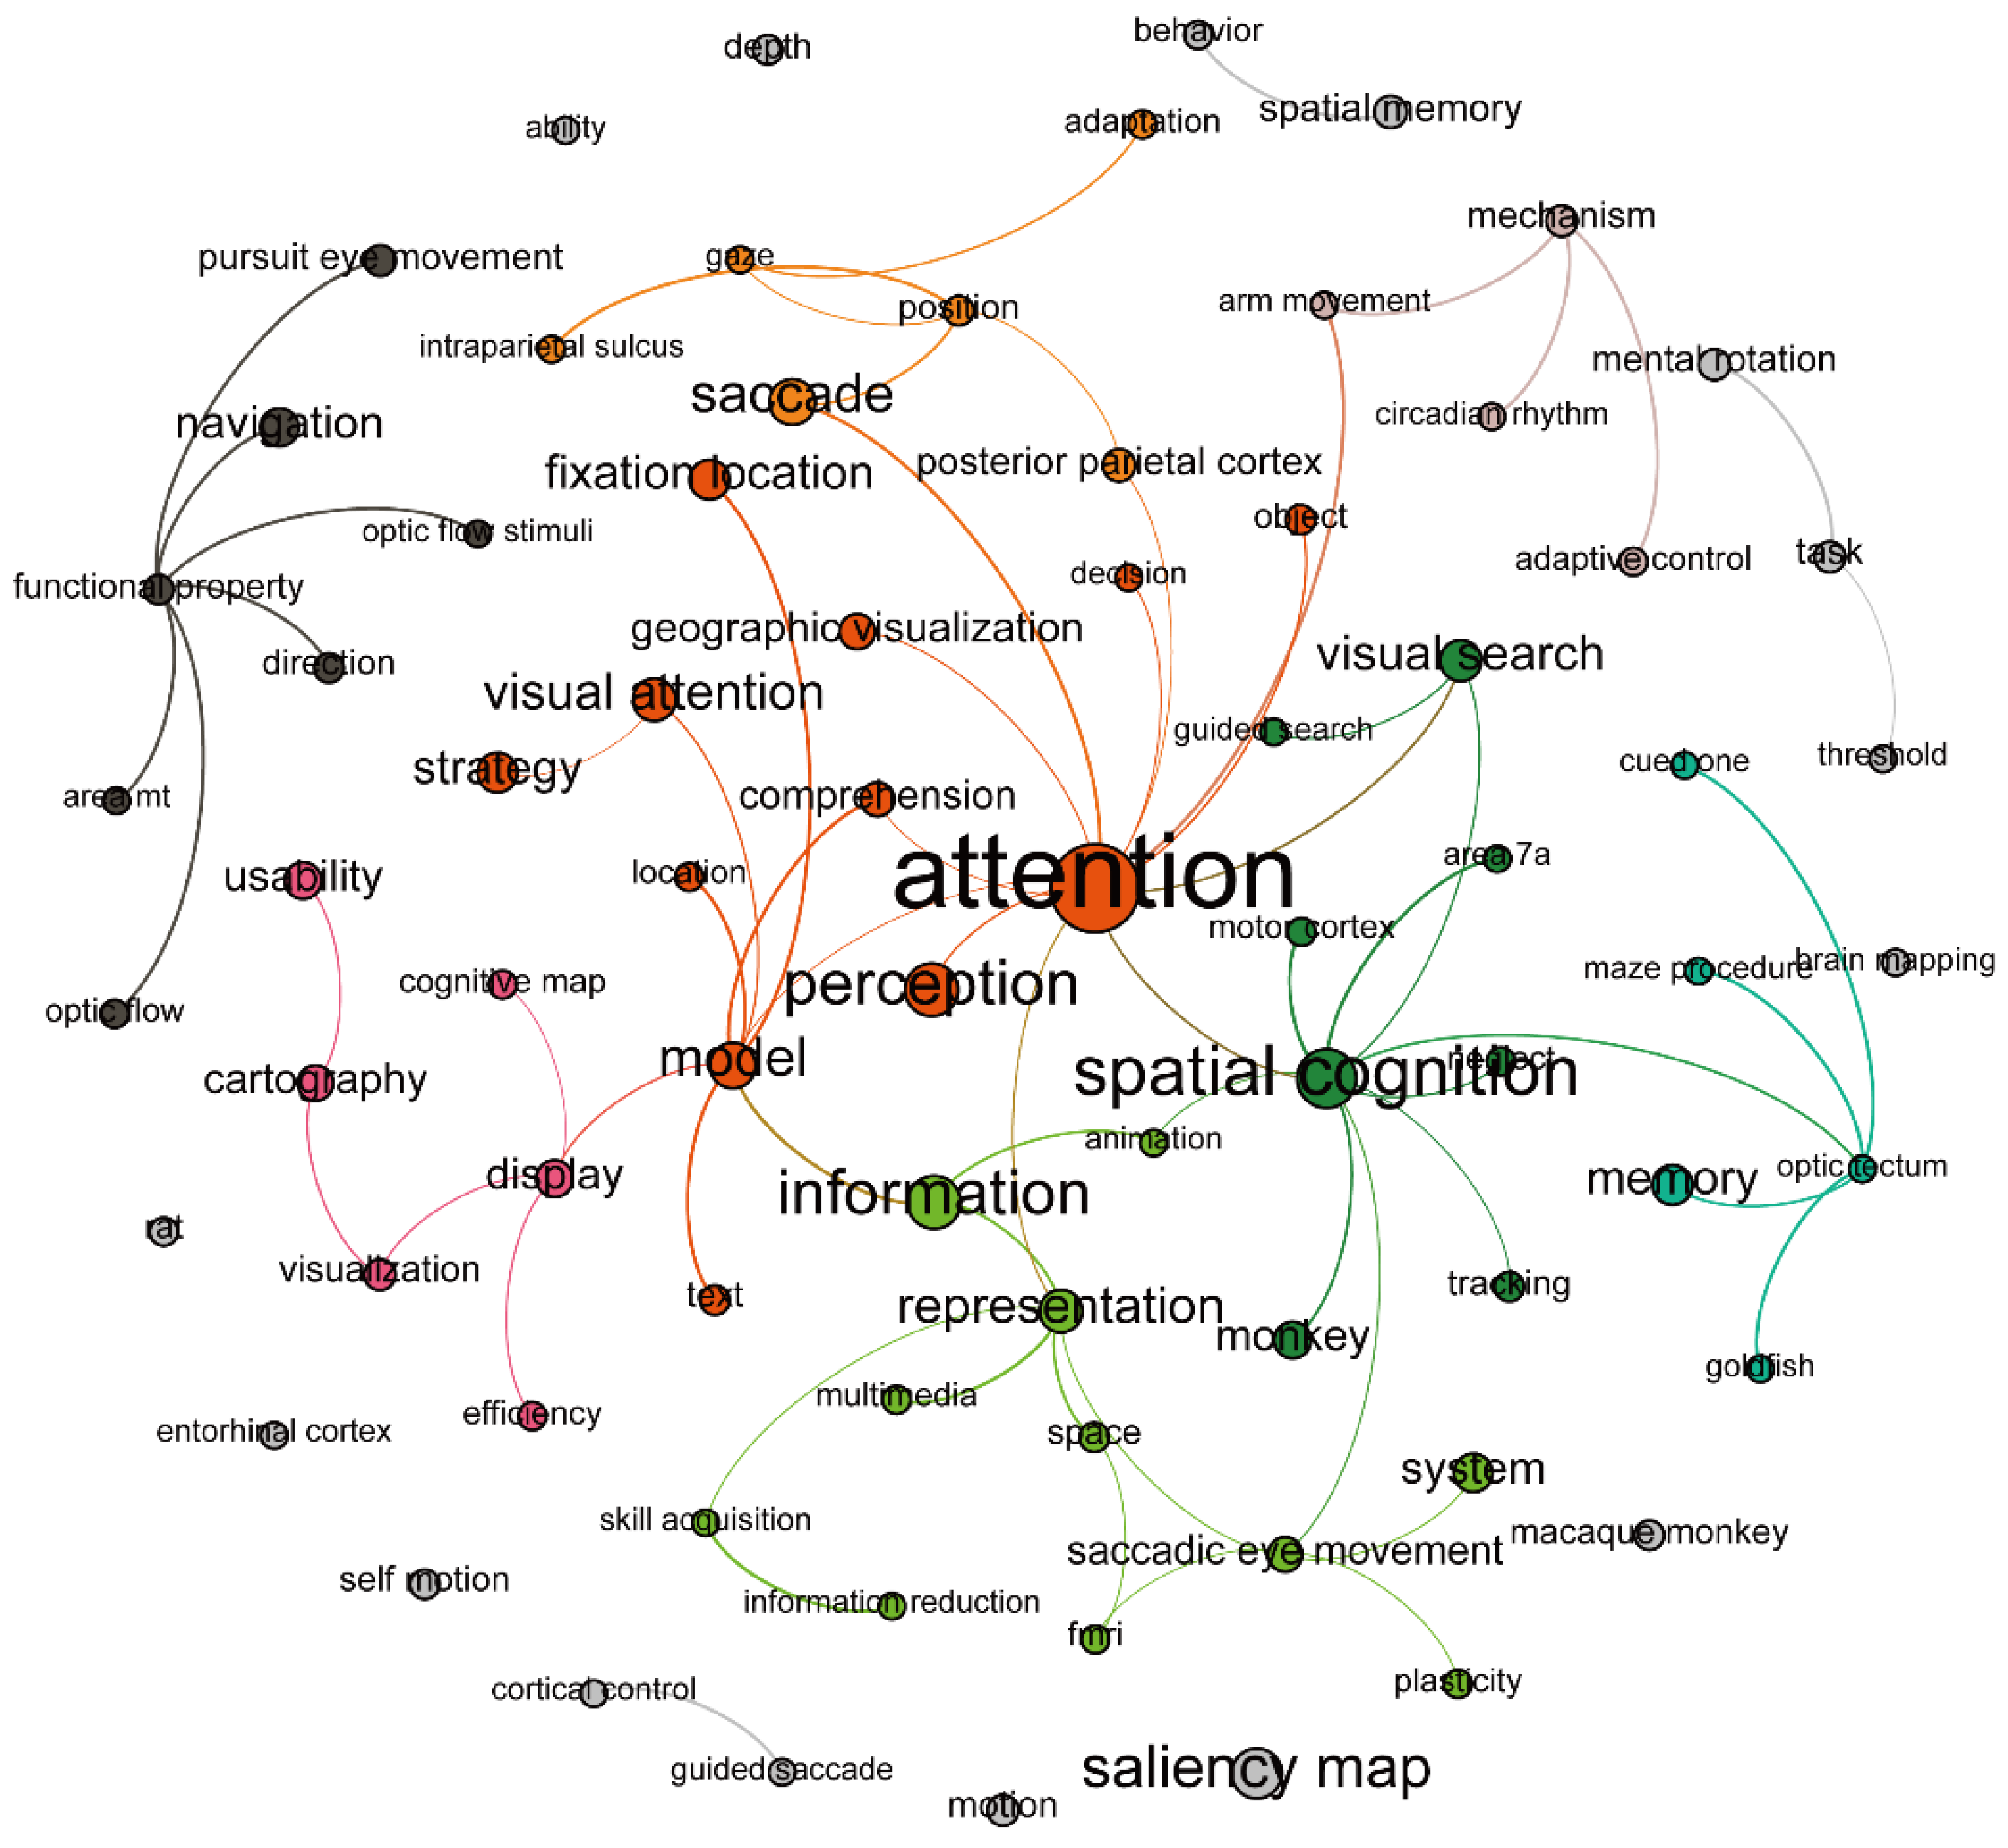
4.3. Research Hotspots
4.4. Collaboration Patterns
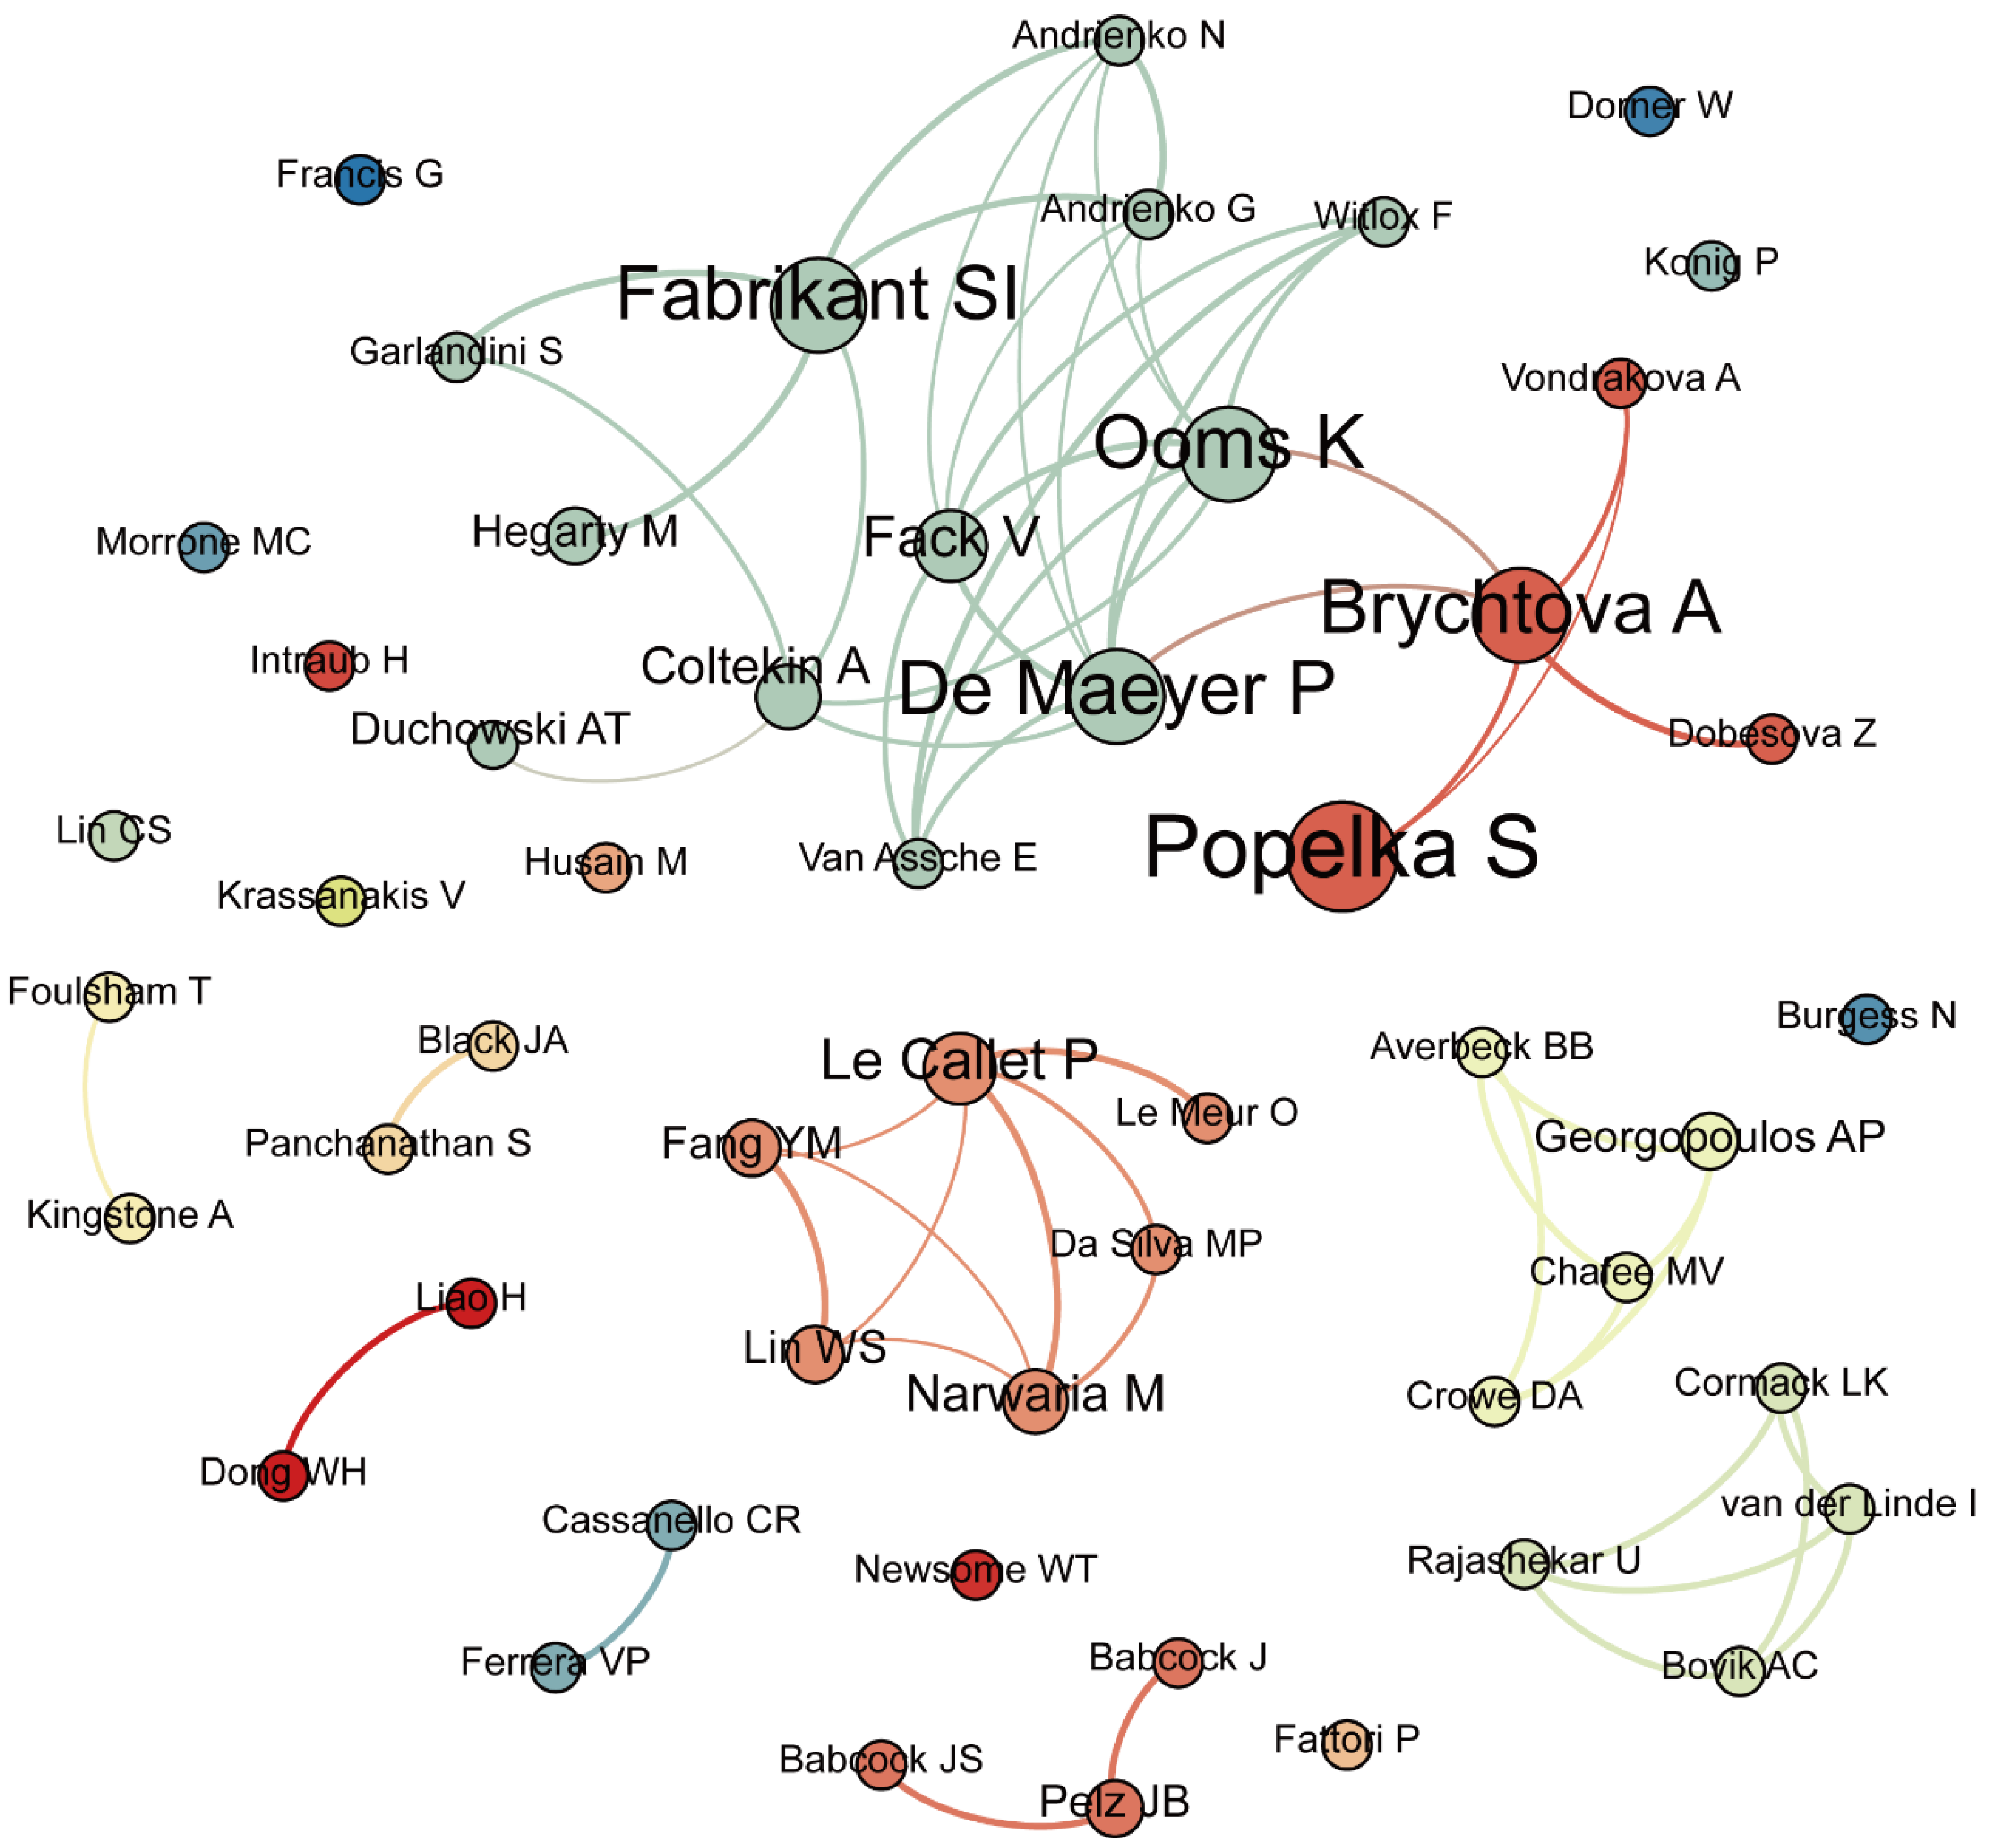
4.4.1. Author Level
4.4.2. Institution Level
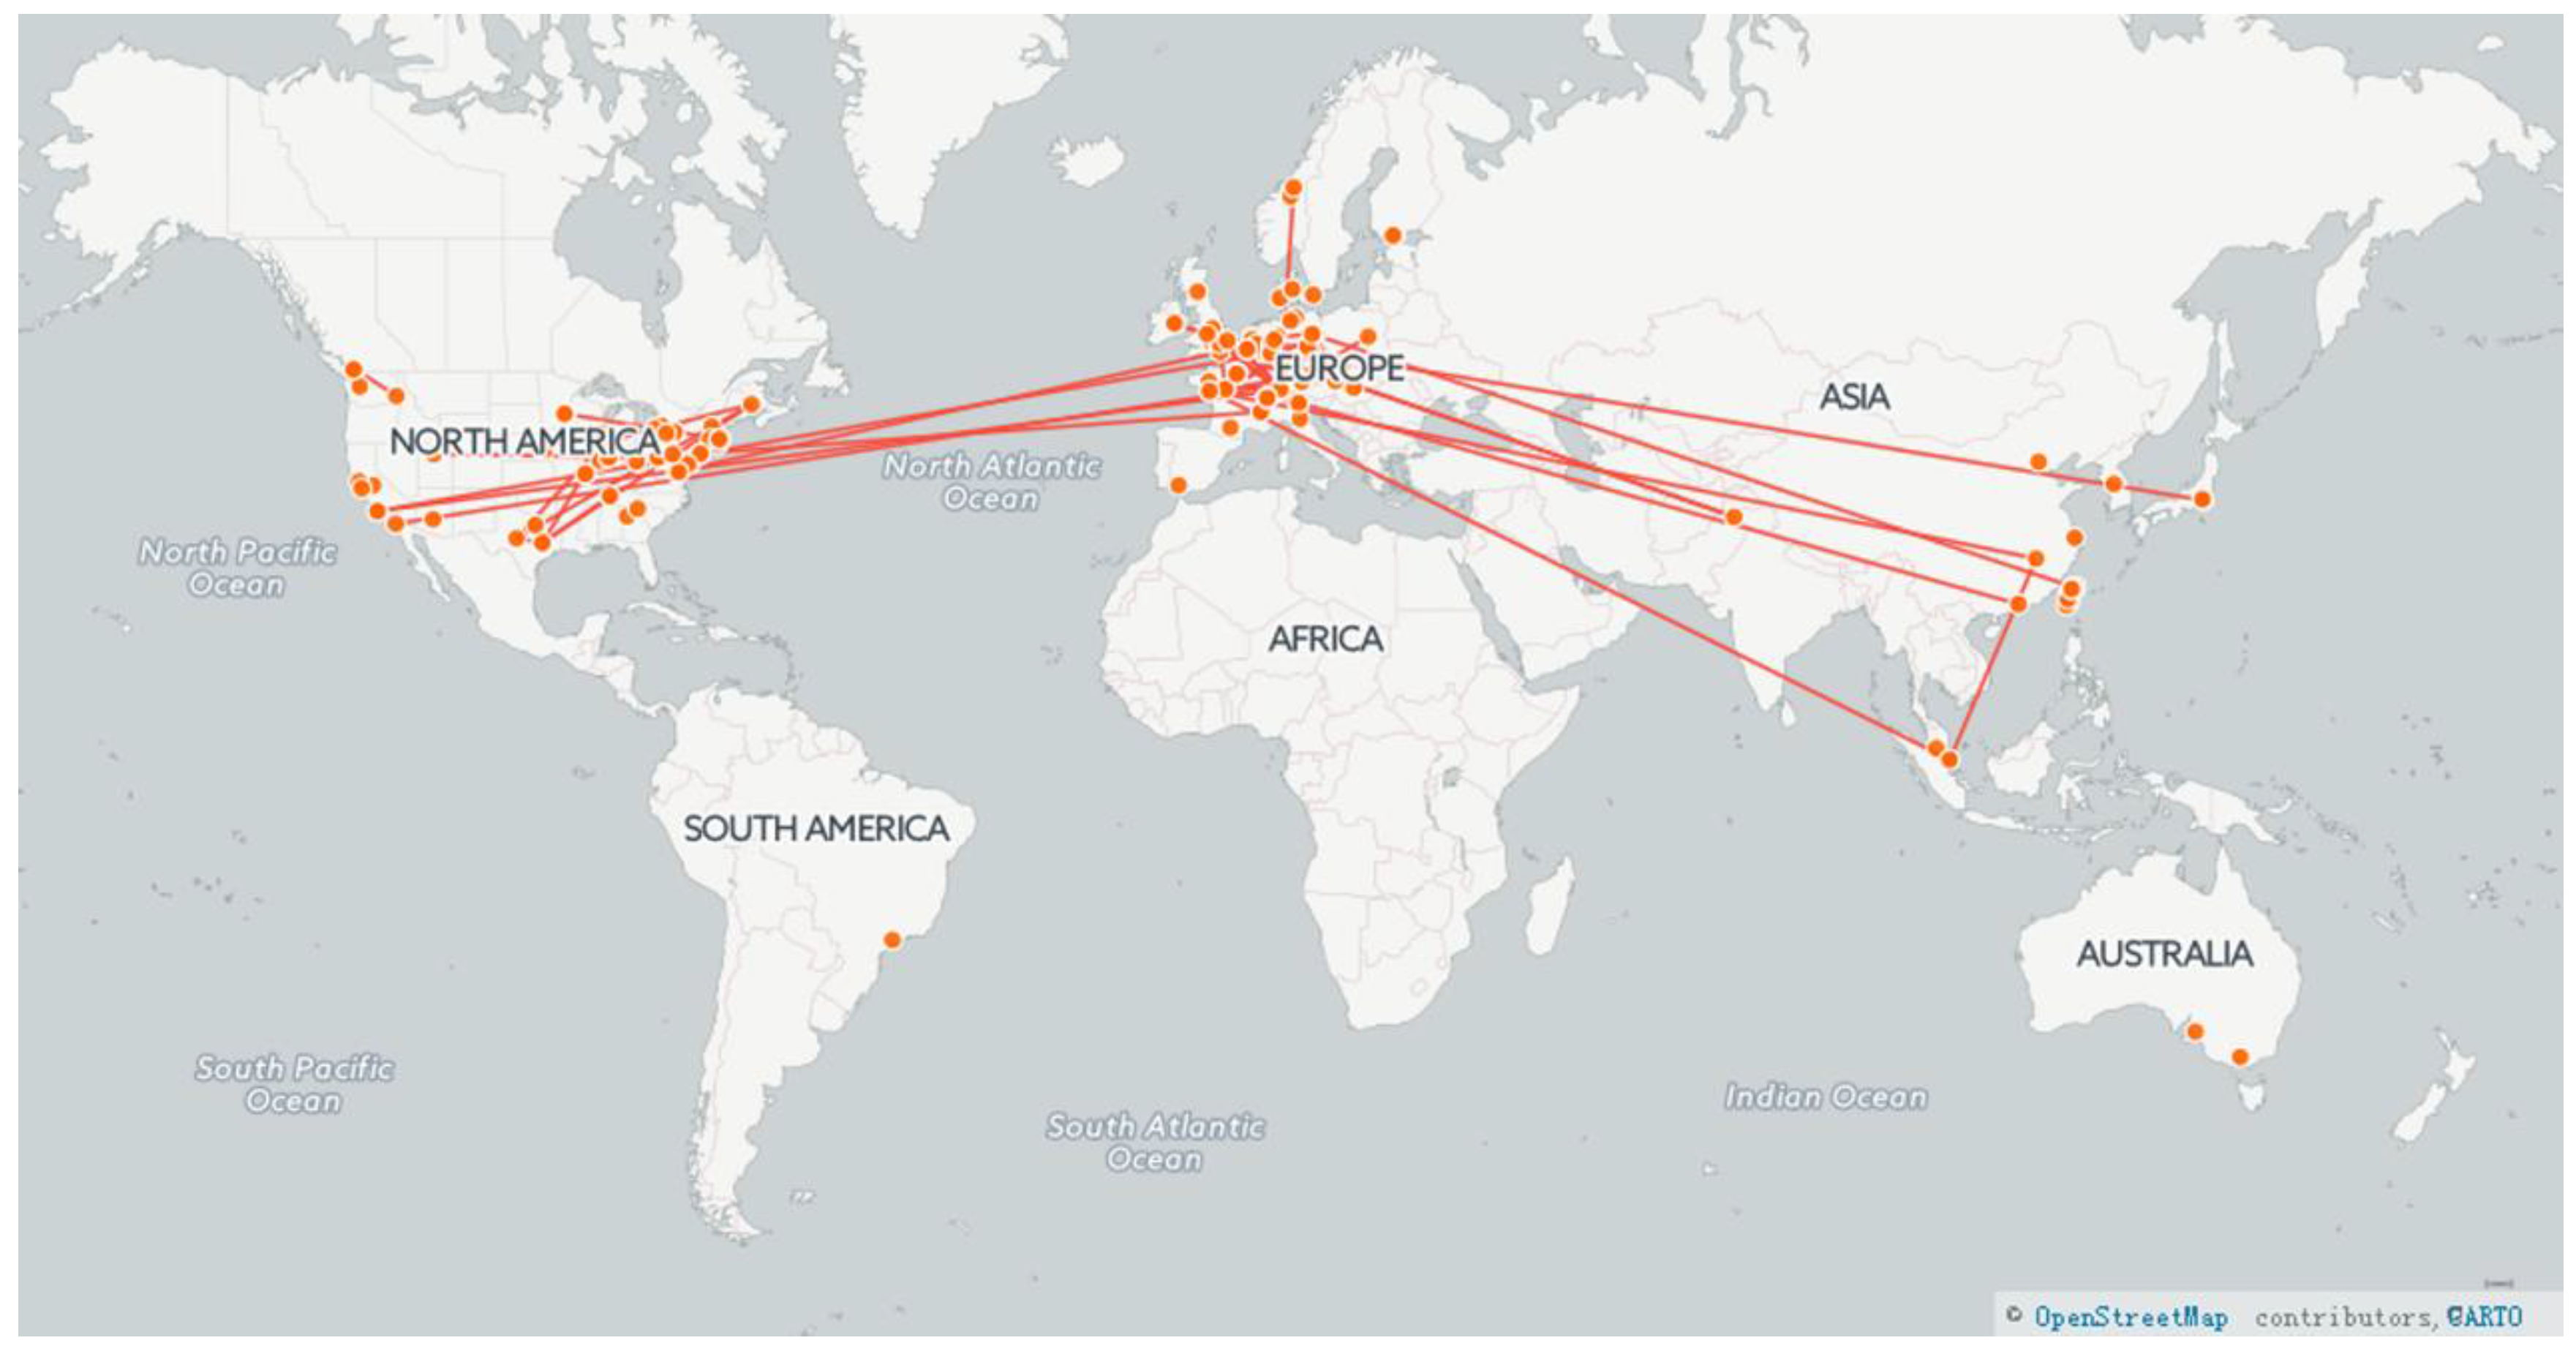
4.4.3. City Level
5. Discussion
5.1. Discussion Related to Analysis Methods
5.2. Discussion Related to Current Trends
6. Conclusions
Acknowledgments
Author Contributions
Conflicts of Interest
Appendix
    Program Geo-collaboration network
    Dim record, addresscontext as String
    Dim i, linenum as Integer
    Dim isFindAddress as Boolean
    //step 1: find the address
    isFindAddress = false
    linenum = the line number of the record
    For i = 1 to linenum
    If the line i of the record is start with ‘C1’ // ’C1’ is the tag of the address for each author in one paper
     addresscontext = the context of the line i of the record
     isFindAddress = true
    End if
    If isFindAddress is true
     Break for
    Else
     Continue
    End if
    End for
    //step 2: find the city names in each address
    Dim addresses, citynames as String list
    Dim address, cityname as String
    Dim j, addressnum as Integer
    addresses = split(addresscontext, ’.’) // The address for each author is segmented by punctuation ‘.’
    addressnum = the number of the addresses
    For j = 1 to addressnum
    address = addresses[j]
    cityname = Second to last of split(address, ‘,’) // The address is composed by state name, street number, city name, post code etc. The city name is the second to last one.
    Add cityname to citynames;
    End for
    //step 3: remove the duplicate in the city names
    Dim k, citynamenum as Integer
    Dim finalcitynames as String list
    citynamenum = the number of the citynames
    For k = 1 to citynamenum
    cityname= citynames [k]
    if cityname is not in finalcitynames
     Add cityname to finalcitynames
    end if
    End for
    //step 4: Geocoding
    Dim m, finalcitynamenum as Integer
    Dim citycoordinate as Coordinate // The longitude and latitude of the city
    Dim citycoordinates as Coordinate list
    finalcitynamenum = the number of the finalcitynames
    For m = 1 to finalcitynamenum
    cityname= finalcitynames [m]
    citycoordinate = GeocodingbyBing(cityname) //Getting the longitude and latitude of the city by geocoding service of Bing
    Add citycoordinate to citycoordinates
    End for
    // step 5: Draw lines
    Dim n as Integer
    For m = 1 to finalcitynamenum
    For n = m+1 to finalcitynamenum
     Drawingline(citycoordinate[m], citycoordinate[n]) //Drawing the line between two citys
    End for
    End for
    End Program
References
- Duchowski, A.T. Eye Tracking Methodology: Theory and Practice; Springer: London, UK, 2007. [Google Scholar]
- Castner, H.W.; Eastman, R.J. Eye-movement parameters and perceived map complexity—I. Am. Cartogr. 1984, 11, 107–117. [Google Scholar] [CrossRef]
- Rayner, K.; Sereno, S.C.; Raney, G.E. Eye movement control in reading: A comparison of two types of models. J. Exp. Psychol. Human Percept. Perform. 1996, 22, 1188–1200. [Google Scholar] [CrossRef]
- Slykhuis, D.A.; Wiebe, E.N.; Annetta, L.A. Eye-tracking students’ attention to powerpoint photographs in a science education setting. J. Sci. Educ. Technol. 2005, 14, 509–520. [Google Scholar] [CrossRef]
- Rayner, K.; Rotello, C.M.; Stewart, A.J.; Keir, J.; Duffy, S.A. Integrating text and pictorial information: Eye movements when looking at print advertisements. J. Exp. Psychol. Appl. 2001, 7, 219–226. [Google Scholar] [CrossRef] [PubMed]
- Gorovaya, A.E.; Korobeinikova, E.Y. Use of eye-tracking technology in sport psychology. Psychol. Sci. Educ. 2013, 1, 1–16. [Google Scholar]
- Victor, T.W.; Harbluk, J.L.; Engström, J.A. Sensitivity of eye-movement measures to in-vehicle task difficulty. Trans. Res. Part F Traffic Psychol. Behav. 2005, 8, 167–190. [Google Scholar] [CrossRef]
- Duchowski, A.T. A breadth-first survey of eye-tracking applications. Comput. J. Psychon. Soc. 2002, 34, 455–470. [Google Scholar] [CrossRef]
- Clifton, C.; Ferreira, F.; Henderson, J.M.; Inhoff, A.W.; Liversedge, S.P.; Reichle, E.D.; Schotter, E.R. Eye movements in reading and information processing: Keith rayner’s 40 year legacy. J. Mem. Lang. 2015, 1–19. [Google Scholar] [CrossRef]
- Brodersen, L.; Andersen, H.H.; Weber, S. Applying Eye-Movement Tracking for the Study of Map Perception and Map Design; Kort & Matrikelstyrelsen: Copenhagen, Denmark, 2002. [Google Scholar]
- Ooms, K.; De Maeyer, P.; Fack, V. Analyzing eye movement patterns to improve map design. In Proceedings of the 18th International Research Symposium on Computer-based Cartography and GIScience: Geospatial Data and Geovisualization for The Environments, Security, and Society, Orlando, FL, USA, 15–19 November 2010.
- Stofer, K.; Che, X. Comparing experts and novices on scaffolded data visualizations using eye-tracking. J. Eye Mov. Res. 2014, 7, 1–15. [Google Scholar]
- Ooms, K.; De Maeyer, P.; Fack, V. Study of the attentive behavior of novice and expert map users using eye tracking. Cartogr. Geogr. Inf. Sci. 2014, 41, 37–54. [Google Scholar] [CrossRef] [Green Version]
- Montello, D.R. Cognitive map-design research in the twentieth century: Theoretical and empirical approaches. Cartogr. Geogr. Inf. Sci. 2002, 29, 283–304. [Google Scholar] [CrossRef]
- Dong, W.H.; Liao, H.; Fang, X.U.; Liu, Z.; Zhang, S.B. Using eye tracking to evaluate the usability of animated maps. Sci. China-Earth Sci. 2014, 57, 512–522. [Google Scholar] [CrossRef]
- Opach, T.; Gołębiowska, I.; Fabrikant, S.I. How do people view multi-component animated maps? Cartogr. J. 2014, 51, 330–342. [Google Scholar] [CrossRef]
- Çöltekin, A.; Heil, B.; Garlandini, S.; Fabrikant, S.I. Evaluating the effectiveness of interactive map interface designs: A case study integrating usability metrics with eye-movement analysis. Cartogr. Geogr. Inf. Sci. 2009, 36, 5–17. [Google Scholar] [CrossRef]
- Ooms, K.; Andrienko, G.; Andrienko, N.; Maeyer, P.D.; Fack, V. Visual analytics on eye movement data reveal search patterns on dynamic and interactive maps. In Proceedings of the GeoCart 2010, CD Proceedings, Auckland, New Zealand, 1–3 September 2010.
- Jones, C.E.; Weber, P. Towards usability engineering for online editors of volunteered geographic information: A perspective on learnability. Trans. GIS 2012, 16, 523–544. [Google Scholar] [CrossRef]
- Manson, S.M.; Kne, L.; Dyke, K.R.; Shannon, J.; Eria, S. Using eye-tracking and mouse metrics to test usability of web mapping navigation. Cartogr. Geogr. Inf. Sci. 2012, 39, 48–60. [Google Scholar] [CrossRef]
- Kiefer, P.; Raubal, M.; Straub, F. Location-aware mobile eye tracking for the explanation of wayfinding behavior. In Proceedings of the Agile 2012 International Conference on Geographic Information Science, Avignon, France, 24–26 April 2012.
- Kiefer, P.; Giannopoulos, I.; Raubal, M. Where am i? Investigating map matching during self-localization with mobile eye tracking in an urban environment. Trans. GIS 2014, 18, 660–686. [Google Scholar] [CrossRef]
- Chen, C.; Hu, Z.; Liu, S.; Tseng, H. Emerging trends in regenerative medicine: A scientometric analysis in citespace. Expert Opin. Biol. Ther. 2012, 12, 593–608. [Google Scholar] [CrossRef] [PubMed]
- Wu, Y.; Duan, Z. Visualization analysis of author collaborations in schizophrenia research. BMC Psychiatr. 2015. [Google Scholar] [CrossRef] [PubMed]
- Kim, M.C.; Chen, C. A scientometric review of emerging trends and new developments in recommendation systems. Scientometrics 2015, 104, 239–263. [Google Scholar] [CrossRef]
- Qian, G.; Fong, M. Scientometrics analysis on the intellectual structure of the research field of bioenergy. J. Biobased Mater. Bioenergy 2013, 7, 305–308. [Google Scholar] [CrossRef]
- Wei, F.; Grubesic, T.H.; Bishop, B.W. Exploring the gis knowledge domain using citespace. Prof. Geogr. 2015, 67, 374–384. [Google Scholar] [CrossRef]
- Backhaus, K.; Kai, L.; Koch, M. The structure and evolution of business-to-business marketing: A citation and co-citation analysis. Ind. Mark. Manag. 2011, 40, 940–951. [Google Scholar] [CrossRef]
- Huang, M.H.; Chiang, L.Y.; Chen, D.Z. Constructing a patent citation map using bibliographic coupling: A study of taiwan’s high-tech companies. Scientometrics 2003, 58, 489–506. [Google Scholar] [CrossRef]
- Yu, Q.; Shao, H.; Duan, Z. Research groups of oncology co-authorship network in china. Scientometrics 2011, 89, 553–567. [Google Scholar] [CrossRef]
- Fan, Z.G.; Zheng, W.L. The analysis of research hotspot of chinese cultural and creative industry-based on co-words method. Adv. Mater. Res. 2013, 798–799, 924–929. [Google Scholar] [CrossRef]
- Small, H. Co-citation in the scientific literature: A new measure of the relationship between two documents. J. Am. Soc. Inf. Sci. 1973, 24, 265–269. [Google Scholar] [CrossRef]
- White, H.D.; Griffith, B.C. Author cocitation: A literature measure of intellectual structure. J. Am. Soc. Inf. Sci. 1981, 32, 163–171. [Google Scholar] [CrossRef]
- Chen, C. Citespace ii: Detecting and visualizing emerging trends and transient patterns in scientific literature. J. Am. Soc. Inf. Sci. Tech. 2006, 57, 359–377. [Google Scholar] [CrossRef]
- Appio, F.P.; Cesaroni, F.; Minin, A.D. Visualizing the structure and bridges of the intellectual property management and strategy literature: A document co-citation analysis. Scientometrics 2014, 101, 623–661. [Google Scholar] [CrossRef]
- Özçınar, H. Mapping teacher education domain: A document co-citation analysis from 1992 to 2012. Teach. Teach. Edu. 2015, 47, 42–61. [Google Scholar] [CrossRef]
- Kessler, M.M. Bibliographic coupling between scientific papers. Am. Doc. 1963, 14, 10–25. [Google Scholar] [CrossRef]
- Boyack, K.W.; Richard, K. Co-citation analysis, bibliographic coupling, and direct citation: Which citation approach represents the research front most accurately? J. Am. Soc. Inf. Sci. Tech. 2010, 61, 2389–2404. [Google Scholar] [CrossRef]
- Kostoff, R.N. Multidisciplinary research thrusts from co-word analysis. In Proceedings of the Technology Management: The New International Language, Portland, OR, USA, 27–31 October 1991.
- He, Q. Knowledge discovery through co-word analysis. Libr. Trends 1999, 48, 133–133. [Google Scholar]
- Liu, Z.; Yin, Y.; Liu, W.; Dunford, M. Visualizing the intellectual structure and evolution of innovation systems research: A bibliometric analysis. Scientometrics 2015, 103, 135–158. [Google Scholar] [CrossRef]
- Cobo, M.J.; López-Herrera, A.G.; Herrera-Viedma, E.; Herrera, F. Science mapping software tools: Review, analysis, and cooperative study among tools. J. Am. Soc. Inf. Sci. Tech. 2011, 62, 1382–1402. [Google Scholar] [CrossRef]
- Chen, C.; Ibekwe-SanJuan, F.; Hou, J. The structure and dynamics of cocitation clusters: A multiple-perspective cocitation analysis. J. Am. Soc. Inf. Sci. Tech. 2010, 61, 1386–1409. [Google Scholar] [CrossRef] [Green Version]
- Aizawa, A. An information-theoretic perspective of tf–idf measures. Inf. Process. Manag. Int. J. 2003, 39, 45–65. [Google Scholar] [CrossRef]
- Dunning, T. Accurate methods for the statistics of surprise and coincidence. Comput. Linguist. 1993, 19, 61–74. [Google Scholar]
- Latham, P.E.; Roudi, Y. Mutual information. Scholarpedia 2009, 125, 85–98. [Google Scholar] [CrossRef]
- MacEachren, A.M.; Kraak, M.J. Research challenges in geovisualization. Cartogr. Geogr. Inf. Sci. 2013, 28, 3–12. [Google Scholar] [CrossRef]
- Bastian, M.; Heymann, S.; Jacomy, M. Gephi: An open source software for exploring and manipulating networks. In Proceedings of the Third International AAAI Conference on Weblogs and Social Media, San Jose, CA, USA, 17–20 May 2009.
- Zastrow, M. Data visualization: Science on the map. Nature 2015, 519, 119–120. [Google Scholar] [CrossRef] [PubMed]
- Olijnyk, N.V. An algorithmic historiography of the ebola research specialty: Mapping the science behind ebola. Scientometrics 2015, 105, 623–643. [Google Scholar] [CrossRef]
- Buswell, G.T. How People Look at Pictures; University of Chicago Press: Chicago, IL, USA, 1935. [Google Scholar]
- Babcock, J.S.; Lipps, M.; Pelz, J.B. How people look at pictures before, during, and after scene capture: Buswell revisited. In Proceedings of the Electronic Imaging 2002, Santa Clara, CA, USA, 21–24 January 2002.
- Steinke, T.R. Eye movement studies in cartography and related fields. Cartogr. Int. J. Geogr. Inf. Geovis. 1987, 24, 40–73. [Google Scholar] [CrossRef]
- Rayner, K. Eye movements in reading and information processing: 20 years of research. Psychol. Bull. 1998, 124, 372–422. [Google Scholar] [CrossRef] [PubMed]
- Jacob, R.; Karn, K.S. Eye tracking in human-computer interaction and usability research: Ready to deliver the promises. Mind 2003, 2, 573–605. [Google Scholar]
- Itti, L.; Koch, C.; Niebur, E. A model of saliency-based visual attention for rapid scene analysis. IEEE Trans. Pattern Anal. Mach. Intell. 1998, 20, 1254–1259. [Google Scholar] [CrossRef]
- Itti, L.; Koch, C. Computational modelling of visual attention. Nat. Rev. Neurosci. 2001, 2, 194–203. [Google Scholar] [CrossRef] [PubMed]
- Fabrikant, S.I.; Rebich-Hespanha, S.; Andrienko, N.; Andrienko, G.; Montello, D.R. Novel method to measure inference affordance in static small-multiple map displays representing dynamic processes. Cartogr. J. 2008, 45, 201–215. [Google Scholar] [CrossRef]
- Yarbus, D. Eye Motion and Vision; Plenum Press: New York, NY, USA, 1967. [Google Scholar]
- O’keefe, J.; Nadel, L. The Hippocampus as a Cognitive Map; Oxford University Press: Oxford, OU, USA, 1978. [Google Scholar]
- Rousseeuw, P.J. Silhouettes: A graphical aid to the interpretation and validation of cluster analysis. J. Comput. Appl. Math. 1987, 20, 53–65. [Google Scholar] [CrossRef]
- Ooms, K.; Maeyer, P.D.; Fack, V.; Assche, E.V.; Witlox, F. Investigating the effectiveness of an efficient label placement method using eye movement data. Cartogr. J. 2012, 49, 234–246. [Google Scholar] [CrossRef]
- Gołębiowska, I. Legend layouts for thematic maps: A case study integrating usability metrics with the thinking aloud method. Cartogr. J. 2015, 52, 28–40. [Google Scholar] [CrossRef]
- Ooms, K.; Andrienko, G.; Andrienko, N.; De Maeyer, P.; Fack, V. Analysing the spatial dimension of eye movement data using a visual analytic approach. Exp. Syst. Appl. 2012, 39, 1324–1332. [Google Scholar] [CrossRef] [Green Version]
- Newman, G.; Zimmerman, D.; Crall, A.; Laituri, M.; Graham, J.; Stapel, L. User-friendly web mapping: Lessons from a citizen science website. Int. J. Geogr. Inf. Sci. 2010, 24, 1851–1869. [Google Scholar] [CrossRef]
- Kortum, P.; Sorber, M. Measuring the usability of mobile applications for phones and tablets. Int. J. Hum. Comput. Int. 2015, 31, 518–529. [Google Scholar] [CrossRef]
- Resch, B.; Zimmer, B. User experience design in professional map-based geo-portals. ISPRS Int. J. Geo-Inf. 2013, 2, 1015–1037. [Google Scholar] [CrossRef]
- Popelka, S.; Brychtova, A. Eye-tracking study on different perception of 2d and 3d terrain visualisation. Cartogr. J. 2013, 50, 240–246. [Google Scholar] [CrossRef]
- Dong, W.H.; Liao, H.; Roth, R.E.; Wang, S.Y. Eye tracking to explore the potential of enhanced imagery basemaps in web mapping. Cartogr. J. 2014, 51, 313–329. [Google Scholar] [CrossRef]
- Katz, J.S.; Martin, B.R. What is research collaboration? Res. Policy 1997, 26, 1–18. [Google Scholar] [CrossRef]
- Price, D.J.; Beaver, D.J. Collaboration in an invisible college. Am. Psychol. 1966, 21, 1011–1018. [Google Scholar] [CrossRef] [PubMed]
- Kiefer, P.; Giannopoulos, I.; Raubal, M. Using eye movements to recognize activities on cartographic maps. In Proceedings of the 21st ACM SIGSPATIAL International Conference on Advances in Geographic Information Systems, Orlando, FL, USA, 5–8 November 2013.
- Opach, T.; Rød, J.K. The Use of GIS Tools for Analyzing Eyemovement Data; TU Dresden: Dresden, Germany, 2013. [Google Scholar]
- Kurzhals, K.; Weiskopf, D. Space-time visual analytics of eye-tracking data for dynamic stimuli. IEEE Trans. Vis. Comput. Graph. 2013, 19, 2129–2138. [Google Scholar] [CrossRef] [PubMed]
- Krassanakis, V.; Nakos, B.; Filippakopoulou, V. Eyemmv toolbox: An eye movement post-analysis tool based on a two-step spatial dispersion threshold for fixation identification. J. Eye Mov. Res. 2014, 7, 1–10. [Google Scholar]
- Itti, L.; Koch, C. A saliency-based search mechanism for overt and covert shifts of visual attention. Vis. Res. 2000, 40, 1489–1506. [Google Scholar] [CrossRef]
- Itti, L.; Koch, C. Comparison of feature combination strategies for saliency-based visual attention systems. Int. Soc. Opt. Eng. 1999, 3644, 473–482. [Google Scholar]
- Lao, J.; Miellet, S.; Pernet, C.; Sokhn, N.; Caldara, R. I map4: An open source toolbox for the statistical fixation mapping of eye movement data with linear mixed modeling. J. Vis. 2015, 15, 1–17. [Google Scholar] [CrossRef]
- Papenmeier, F.; Huff, M. Dynaoi: A tool for matching eye-movement data with dynamic areas of interest in animations and movies. Behav. Res. Meth. 2010, 42, 179–187. [Google Scholar] [CrossRef] [PubMed]
- Schrom-Feiertag, H.; Schinko, C.; Settgast, V.; Seer, S. Evaluation of guidance systems in public infrastructures using eye tracking in an immersive virtual environment. In Proceedings of the International Workshop on Eye Tracking for Spatial Research, Vienna, Austria, 22–27 September 2014.
- Viaene, P.; Ooms, K.; Vansteenkiste, P.; Lenoir, M.; Maeyer, P.D. The use of eye tracking in search of indoor landmarks. In Proceedings of the International Workshop on Eye Tracking for Spatial Research, Vienna, Austria, 22–27 September 2014.
- Afrooz, A.; White, D.; Neuman, M. Way-finding improves visual memory for built environments. In Proceedings of the International Workshop on Eye Tracking for Spatial Research, Vienna, Austria, 22–27 September 2014.
- Ohm, C.; Müller, M.; Ludwig, B.; Bienk, S. Where is the landmark? Eye tracking studies in large-scale indoor environments. In Proceedings of the International Workshop on Eye Tracking for Spatial Research, Vienna, Austria, 22–27 September 2014.
- Dong, W.; Liao, H. Eye tracking to explore the impacts of photorealistic 3d representations in pedstrian navigation performance. ISPRS Int. Arch. Photogramm. Remote. Sens. Spat. Inf. Sci. 2016, 1, 641–645. [Google Scholar] [CrossRef]
- Liao, H.; Dong, W.; Peng, C.; Liu, H. Exploring differences of visual attention in pedestrian navigation when using 2d maps and 3d geo-browsers. Cartogr. Geogr. Inf. Sci. 2016. [Google Scholar] [CrossRef]
- Lei, T.C.; Wu, S.C.; Chao, C.W.; Lee, S.H. Evaluating differences in spatial visual attention in wayfinding strategy when using 2d and 3d electronic maps. Geojournal 2016, 81, 153–167. [Google Scholar] [CrossRef]
- Viaene, P.; Vansteenkiste, P.; Lenoir, M.; Wulf, A.D.; Maeyer, P.D. Examining the validity of the total dwell time of eye fixations to identify landmarks in a building. J. Eye Mov. Res. 2016, 9, 1–11. [Google Scholar]
- Franke, C.; Schweikart, J. Mental representation of landmarks on maps—Investigating cartographic visualization methods with eye tracking technology. Spat. Cognit. Comput. Int. J. 2016. [Google Scholar] [CrossRef]
- Dong, W.; Zhang, S.; Liao, H.; Liu, Z.; Li, Z.; Yang, X. Assessing the effectiveness and efficiency of map colour for colour impairments using an eye-tracking approach. Cartogr. J. 2016. [Google Scholar] [CrossRef]
- Krassanakis, V. Exploring the map reading process with eye movement analysis. In Proceedings of the International Workshop on Eye Tracking for Spatial Research, Scarborough, UK, 2–5 September 2013.
- Krassanakis, V.; Filippakopoulou, V.; Nakos, B. Detection of moving point symbols on cartographic backgrounds. J. Eye Mov. Res. 2016, 9, 1–16. [Google Scholar]
- Ooms, K.; Coltekin, A.; Maeyer, P.D.; Dupont, L.; Fabrikant, S.; Incoul, A.; Kuhn, M.; Slabbinck, H.; Vansteenkiste, P.; Haegen, L.V.D. Combining user logging with eye tracking for interactive and dynamic applications. Behav. Res. Meth. 2015, 47, 1–17. [Google Scholar] [CrossRef] [PubMed] [Green Version]
- Poplin, A. How user-friendly are online interactive maps? Survey based on experiments with heterogeneous users. Cartogr. Geogr. Inf. Sci. 2015, 42, 358–376. [Google Scholar] [CrossRef]
- Kudelka, B.V.; Dobesova, Z. Eye-tracking testing of gis interfaces. In Proceedings of the 15th Internatianal Multidisciplinary Scienfific GeoConference, Sofia, Bulgaria, 16–19 June 2015.
- Balzarini, R.; Murat, M. The effectiveness of panoramic maps design: A preliminary study based on mobile eye-tracking. Int. Arch. Photogramm. Remote. Sens. Spat. Inf. Sci. 2016, 2, 361–368. [Google Scholar] [CrossRef]
- Çöltekin, A.; Lokka, I.; Zahner, M. On the usability and usefulness of 3d (geo)visualizations—A focus on virtual reality environments. Int. Arch.ives Photogramm. Remote Sens. Spat. Inf. Sci. 2016, 2, 387–392. [Google Scholar] [CrossRef]
- Naspetti, S.; Pierdicca, R.; Mandolesi, S.; Paolanti, M.; Frontoni, E.; Zanoli, R. Automatic analysis of eye-tracking data for augmented reality applications: A prospective outlook. In Proceedings of the Third International Conference, AVR 2016, Lecce, Italy, 15–18 June 2016.
- Wall, C.A.; Wang, Q.; Weng, M.; Kim, E.S. Mapping connections between biological-emotional preferences and affective recognition: An eye-tracking interface for passive assessment of emotional competency. In Proceedings of the International Conference on Affective Computing and Intelligent Interaction, Xi’an, China, 21–24 September 2015.
- Cangöz, G. Effects of emotion and perspective on remembering events: An eye-tracking study. J. Eye Mov. Res. 2016, 9, 1–19. [Google Scholar]


| First Author | Year | Title | Local Citation Score | In Citing Paper Collection |
|---|---|---|---|---|
| Rayner | 1998 | Eye movements in reading and information processing: 20 years of research | 27 | No |
| Coltekin | 2009 | Evaluating the effectiveness of interactive map interface designs: A case study integrating usability metrics with eye-movement analysis | 15 | Yes |
| Itti | 1998 | A model of saliency-based visual attention for rapid scene analysis | 13 | No |
| Itti | 2001 | Computational modelling of visual attention | 13 | No |
| Fabrikant | 2008 | Novel method to measure inference affordance in static small-multiple map displays representing dynamic processes | 13 | Yes |
| Steinke | 1987 | Eye movement studies in cartography and related fields | 12 | No |
| Duchowski | 2007 | Eye tracking methodology: Theory and practice | 12 | No |
| Yarbus | 1967 | Eye motion and vision | 11 | No |
| Jacob | 2003 | Eye tracking in human–computer interaction and usability research: ready to deliver the promises | 10 | No |
| Okeefe | 1978 | The hippocampus as a cognitive map | 9 | No |
| Cluster ID | Cluster Size | Silhouette | tf*idf (Weighting) | LLR (log-Likelihood Ratio, p Value) | MI |
|---|---|---|---|---|---|
| 0 | 9 | 0.947 | method (2.87) | technique (38.74, 1.0E−4); highlighting relief (38.74, 1.0E−4); eye movement studies (38.74, 1.0E−4) | eye |
| 1 | 7 | 0.834 | eye movement data (2.87); method (2.87) | exploring small city map (40.0, 1.0E−4); integrating usability metric (40.0, 1.0E−4); thematic map (40.0, 1.0E−4) | eye movement data |
| 2 | 5 | 0.883 | web mapping (2.87); usability (0.52) | usability (64.99, 1.0E−4); user experience design (45, 1.0E−4); lesson (45, 1.0E−4); | eye movement data |
| 3 | 5 | 0.868 | eye tracking (2.87); | people (47.31, 1.0E−4); visualization (47.31, 1.0E−4); web mapping 47.31, 1.0E−4) | using eye tracking |
| 4 | 5 | 0.851 | eye tracking (3.55); expert (2.87); novice (2.87) | novice (81.11, 1.0E−4); dynamic application (41.44, 1.0E−4); transfer (41, 44.0E−4) | using eye tracking |
| 5 | 5 | 0.93 | survey (4.42); understanding (4.42) | heterogeneous user (43.08, 1.0E−4); online interactive map (43.08, 1.0E−4); choropleth map (43.08, 1.0E−4); | ... |
| No. | Keyword | Frequency | No. | Keyword | Frequency |
|---|---|---|---|---|---|
| 1 | attention | 44 | 11 | strategy | 12 |
| 2 | spatial cognition | 24 | 12 | memory | 11 |
| 3 | information | 20 | 13 | fixation location | 11 |
| 4 | perception | 20 | 14 | system | 10 |
| 5 | saliency map | 18 | 15 | navigation | 10 |
| 6 | model | 15 | 16 | usability | 9 |
| 7 | saccade | 15 | 17 | monkey | 9 |
| 8 | visual attention | 13 | 18 | display | 9 |
| 9 | representation | 13 | 19 | geographic visualization | 8 |
| 10 | visual search | 12 | 20 | cartography | 8 |
| No. | Author | Frequency | As First Author Frequency |
|---|---|---|---|
| 1 | Stanislav Popelka | 10 | 8 |
| 2 | Alzbeta Brychtova | 8 | 3 |
| 3 | Kristien Ooms | 8 | 6 |
| 4 | Philippe De Maeyer | 8 | 0 |
| 5 | Sara Irina Fabrikant | 8 | 3 |
| 6 | Veerle Fack | 5 | 0 |
| 7 | Patrick Le Callet | 5 | 0 |
| 8 | Manish Narwaria | 4 | 2 |
| 9 | Arzu Coltekin | 4 | 2 |
| No. | Institution | Frequency |
|---|---|---|
| 1 | Palacky University | 16 |
| 2 | Zurich University | 12 |
| 3 | Ghent University | 8 |
| 4 | Minnesota University | 6 |
| 5 | University College London (UCL) | 5 |
| 6 | Nottingham University | 5 |
| 7 | Tubingen University | 5 |
| 8 | Stanford University | 4 |
| 9 | University of California, Santa Barbara | 4 |
© 2016 by the authors; licensee MDPI, Basel, Switzerland. This article is an open access article distributed under the terms and conditions of the Creative Commons Attribution (CC-BY) license (http://creativecommons.org/licenses/by/4.0/).
Share and Cite
Wang, S.; Chen, Y.; Yuan, Y.; Ye, H.; Zheng, S. Visualizing the Intellectual Structure of Eye Movement Research in Cartography. ISPRS Int. J. Geo-Inf. 2016, 5, 168. https://0-doi-org.brum.beds.ac.uk/10.3390/ijgi5100168
Wang S, Chen Y, Yuan Y, Ye H, Zheng S. Visualizing the Intellectual Structure of Eye Movement Research in Cartography. ISPRS International Journal of Geo-Information. 2016; 5(10):168. https://0-doi-org.brum.beds.ac.uk/10.3390/ijgi5100168
Chicago/Turabian StyleWang, Shuang, Yufen Chen, Yecheng Yuan, Haiyun Ye, and Shulei Zheng. 2016. "Visualizing the Intellectual Structure of Eye Movement Research in Cartography" ISPRS International Journal of Geo-Information 5, no. 10: 168. https://0-doi-org.brum.beds.ac.uk/10.3390/ijgi5100168