Article

Tagging in Volunteered Geographic Information: An Analysis of Tagging Practices for Cities and Urban Regions in OpenStreetMap

1
Faculty of Electronic Engineering, University of Nis, 18000 Nis, Serbia
2
Department of Computer Science, Maynooth University, W23 F2H6 Maynooth, Ireland
3
Department of Civil and Environmental Engineering, Politecnico di Milano, Como Campus, 22100 Como, Italy
*
Author to whom correspondence should be addressed.
Nikola Davidovic and Peter Mooney are the lead authors on this paper.
ISPRS Int. J. Geo-Inf. 2016, 5(12), 232; https://0-doi-org.brum.beds.ac.uk/10.3390/ijgi5120232
Submission received: 5 July 2016 / Revised: 8 November 2016 / Accepted: 24 November 2016 / Published: 5 December 2016
(This article belongs to the Special Issue Volunteered Geographic Information)

Abstract

:
In Volunteered Geographic Information (VGI) projects, the tagging or annotation of objects is usually performed in a flexible and non-constrained manner. Contributors to a VGI project are normally free to choose whatever tags they feel are appropriate to annotate or describe a particular geographic object or place. In OpenStreetMap (OSM), the Map Features part of the OSM Wiki serves as the de-facto rulebook or ontology for the annotation of features in OSM. Within Map Features, suggestions and guidance on what combinations of tags to use for certain geographic objects are outlined. In this paper, we consider these suggestions and recommendations and analyse the OSM database for 40 cities around the world to ascertain if contributors to OSM in these urban areas are using this guidance in their tagging practices. Overall, we find that compliance with the suggestions and guidance in Map Features is generally average or poor. This leads us to conclude that contributors in these areas do not always tag features with the same level of annotation. Our paper also confirms anecdotal evidence that OSM Map Features is less influential in how OSM contributors tag objects.

1. Introduction and Problem Statement

OpenStreetMap (OSM) is probably the best known example of Volunteered Geographic Information (VGI) on the Internet today [1,2]. The OSM database has an easy to understand structure containing three data types: nodes (representing geographic points), ways (representing geographic objects as polygons and polylines), and relations (representing logical collections or groupings of nodes, ways, and other relations). Any object in the OSM database can have tags (key–value pairs) assigned to it. These tags usually describe the attributes of the object, such as the name of a building or the designation of a road object. The tags can also contain thematic and cultural information. OSM uses a folksonomy approach to the tagging of objects within the database. An object must have at minimum one tag, but there is no theoretical limit to the number of tags that can be applied to any one object. When tags are applied to an object, other registered OSM contributors are free to make changes to these tags (e.g., update keys and/or values in the tags or add/remove tags).
However, one of the criticisms of crowdsourced geospatial data such as OSM is that there are no formal rules or ontologies enforced upon tagging [3,4,5]. The closest that OSM comes to a formal “rule-book” or ontology is the OSM Map Features page [4,6] on the OSM Wiki [7]. The OSM Wiki is a vast ecosystem of guides, help documentation, blogs, tutorials, etc. The Map Features page aims to provide those people contributing to OSM with guidance on what keys and tags to apply to particular objects, and what combinations of tags are encouraged. Suppose, for example, we consider a frequently used tag such as amenity=restaurant. This is a tag with key assigned as amenity and value assigned as restaurant. In Figure 1, a screenshot of the Map Features page for amenity=restaurant is shown, where a number of tags—considered as useful or suggested combinations with this tag—are given. For most of the popular tags in OSM, their corresponding Map Features page provides advice and guidance on tags or tag keys which could be used in combination with a specific key or tag. These tagging suggestions have evolved over time within the OSM community [4]. These suggestions incorporate guidance on how to ensure that objects with a given key or tag contain useful and usable attribute data through the appropriate use of additional or co-occurring tags.
However, if one investigates the TagInfo service [8], we can see that these suggestions for tag keys may not be universally adopted amongst contributors to OSM. The TagInfo service lists the number of occurrences of every tag (key–value pair) used in OSM. The TagInfo service also allows us to see what the most frequently used key–value combinations are for a given tag key. Figure 2 shows a screenshot of the TagInfo list for amenity=restaurant. There are a number of important points to note. We see that for the tag amenity=restaurant, TagInfo lists 107 combinations of other tag keys with this tag. We also find that there is no clear usage of a specific subset of tag keys which are used in combination with amenity=restaurant. This brings us directly to the key research question in our paper: do OSM contributors comply to suggested tags and/or combinations of tags as outlined on the Map Features pages, and does this compliance vary spatially? In answering this research question, we also investigate if there are any indications of potential differences in the adoption of these “useful combinations” between cities or regions. In addressing our research question, we will also investigate if the level of adherence to the “useful combinations” also differs between object types.
To address this research question, this paper describes our analysis of 40 cities from all over the world for the tagging patterns and practices around 10 of the most popular tags in OSM. For each of these popular tags, we analyse how well the OSM database in each city adheres to the “Useful combination” suggestions on the corresponding Map Features page for the tag. In this work, we specifically do not analyse the completeness of the values of the tag keys in this work. Our work is specifically focused on considering the actual usage of the tags or tag keys suggested on the OSM Map Features pages. Anecdotally, many OSM researchers believe that contributors to OSM are more focussed on contributing and editing the actual geometry of features rather than comprehensive tagging. Subsequently, tagging of features is often relegated to the position of a lower priority task in the mapping process. In connection with this point, in this study we do not specifically qualitatively investigate how applicable tags or the values for keys are within each individual city. For example, there may be regional variations in the physical infrastructure and management of public car parking spaces (tagged with amenity=parking. London, for example, will most probably have different parking strategies and management infrastructure compared to a small city such as Nis (Serbia). Overall, this paper will provide quantitative evidence on how tagging is performed in the 40 cities. In Section 2, we describe some of the recent related work in the area of tagging in OSM and VGI to situate this work in the current knowledge. In Section 3, we describe our methodology. In Section 4, we describe the analysis that was undertaken and provide some evaluation of the results. Section 5 is the final chapter in the paper. In this section, we draw some conclusions on this work and make some suggestions on the direction of future work in this area.

2. Related Work

Tagging and annotation of features in VGI and OSM has been the subject of a good deal of research attention over the past number of years. In [9], the authors explain that tagging is the term used to describe the voluntary activity of users who are annotating resources with terms (or so-called “tags”) in a free and flexible manner chosen from an unbounded and sometimes uncontrolled vocabulary. In fact, as outlined by the authors in [10], collaborative tagging describes the process by which many users add metadata in the form of keywords to shared content. This type of collaborative tagging is very popular on the web, where users can tag bookmarks, photographs, social media content, and other forms of content. In terms of geospatial content, traditional expert-oriented or professional approaches are supplemented by organically-evolving user-generated approaches known as folksonomies [11]. This flexible approach to tagging and annotation has the potential to harness rich information provided by geo-tagged social data, and may have an impact on many areas, including urban planning, intelligent traffic management, route recommendations, security, and health monitoring. Good and high quality tagging in collaborative environments provides tremendous opportunities to develop effective tools to analyze and exploit very large-scale spatial–temporal data [12]. In the last few years, there have been many efforts—from both academia and industry—in developing such tools. One of them, for example, is the YUMA Map Annotation Tool [13]. It is used for semantic annotation of any kind of digitized maps. Once annotations have been made over some historic or specialized map, they can later be imported and used over the current live maps available on the web. YUMA also provides a mechanism for reporting inaccurate annotations and verification of the inserted data. Another very popular tool is Google Map Maker [14]. Map Maker is a Google project allowing people to add and edit geospatial data (e.g., commercial activities) which are then visualized on the popular Google Maps and Google Earth platforms. While there are many similarities in how Google Map Maker works, it is different to OSM in the way it handles contributed data. In OSM, all data contributed by volunteers are stored in the OSM database, which remains openly available forever and for use by anyone. Data contributed in this way using Google Map Maker becomes the property of Google, whose geospatial database is closed and not available under an open access license. Since OSM allows high flexibility in tagging and annotation, authors such as [15] indicate that OSM data can suffer the problem of “class noise”, where polygon and polyline objects in the OSM database are labelled incorrectly. Manual screening of tagging and annotation can be quite time- and labor-intensive for large OSM datasets, particularly if there are many OSM objects to inspect.
In OSM, users or contributors to the OSM database can add tags to geographic features [16]. There are several well-known software tools that allow users to contribute data and information to OSM. These include JOSM (Java for OSM) and the iD editor, which is a Javascript-based online editor. Both of these tools are very widely used, and users can select appropriate tags to be applied to a given geographic object. The user is free to choose whichever tags or keys they deem appropriate to describe the attributes and characteristics of the object they are working on. While one might speculate that this free and flexible approach to tagging would encourage greater usage and application of tags, authors such as [17] indicate that the average number of tags on objects in OSM is often quite low, at approximately 2–3 tags per object. In [18], the authors consider how extensive the usage of the Mapillary VGI platform data is within OSM, based on the tag information of added or edited features. In this work, the authors considered the 26 primary feature categories from the OSM Map Features Wiki page and then proceeded to consider specific tags from these feature categories.
In [4], the authors consider how the OSM Wiki website supports negotiation over tags, the application of tags, and the development of tag key values. The authors find that very often, the negotiation about tags is driven by a small group of mappers in a context of high contribution inequality. This negotiation keeps unfolding in a tension between alternative representations which are hard to combine and integrate. Amongst the issues that cause disagreement and confusion around tags and tag key usage are ontological understanding, culture and language interpretation, and semantic overload and duplication. A related work [5] argues that most of the analysis on quality in VGI is focused on geometric and positional quality, with only sporadic attention devoted to the interpretation of the data and how such data are annotated. Without a better understanding of how OSM data are tagged and annotated, it can be very difficult to reconstruct the meaning of information intended by its producers. In work by Quinn and Yapa [19], the authors consider the tagging of objects representing food resources in Philadelphia, USA. The authors discuss the lack of tagging of objects for this particular theme. To improve the situation, the authors organised a mapping party to bring together VGI technical experts and food enthusiasts to improve the OSM database in the city. An interactive online web map was then developed using the OSM data. In [20], the authors consider the development of an application for assistive editing of tags in OSM. Their approach seeks to create a recommendation system for tags and make such lists manageable for users. The application reduces and sorts tags according to semantic information about the data of the surrounding area. The tag recommendation application tries to “model common-sense preconceptions about the world, e.g., a ticket machine will always be near a station or a platform”. In this case, we believe that such an application would not necessarily be using the recommendations from the OSM Map Feature Wiki pages.
In other such applications, authors such as [21] consider developing applications to allow users to define and contribute information about landmarks in cities and towns. The authors consider the tags required for this identification task and believe that OSM does not contain a rich enough set of tags to describe landmarks. Therefore, storing tags related to the cultural heritage of a building landmark in OSM might be unsuitable within the OSM tagging and attribution model. In [22], the authors consider the problem of the detection of vandalism in OSM, where contributors deliberately introduce errors into the OSM database. This type of vandalism can depend on the type of changes introduced. Vandalizing a geometry in OSM is probably more easily detected than vandalizing semantic information in tags. Automatic detection of invalid or purposely erroneous tags on objects in OSM is a difficult problem. One of the reasons for this is the fact that the OSM tagging structure is a very flexible and open folksonomy approach. In work by [23], the authors demonstrate a method for analyzing tag frequency using Flickr data obtained for the city of Vancouver, Canada. They argue that tag characteristics depend on the spatial scale of aggregation. At larger areas of aggregation, tag-space is dominated by a few frequent tags that describe large geographies, whereas more place-specific tags emerged at local scales.

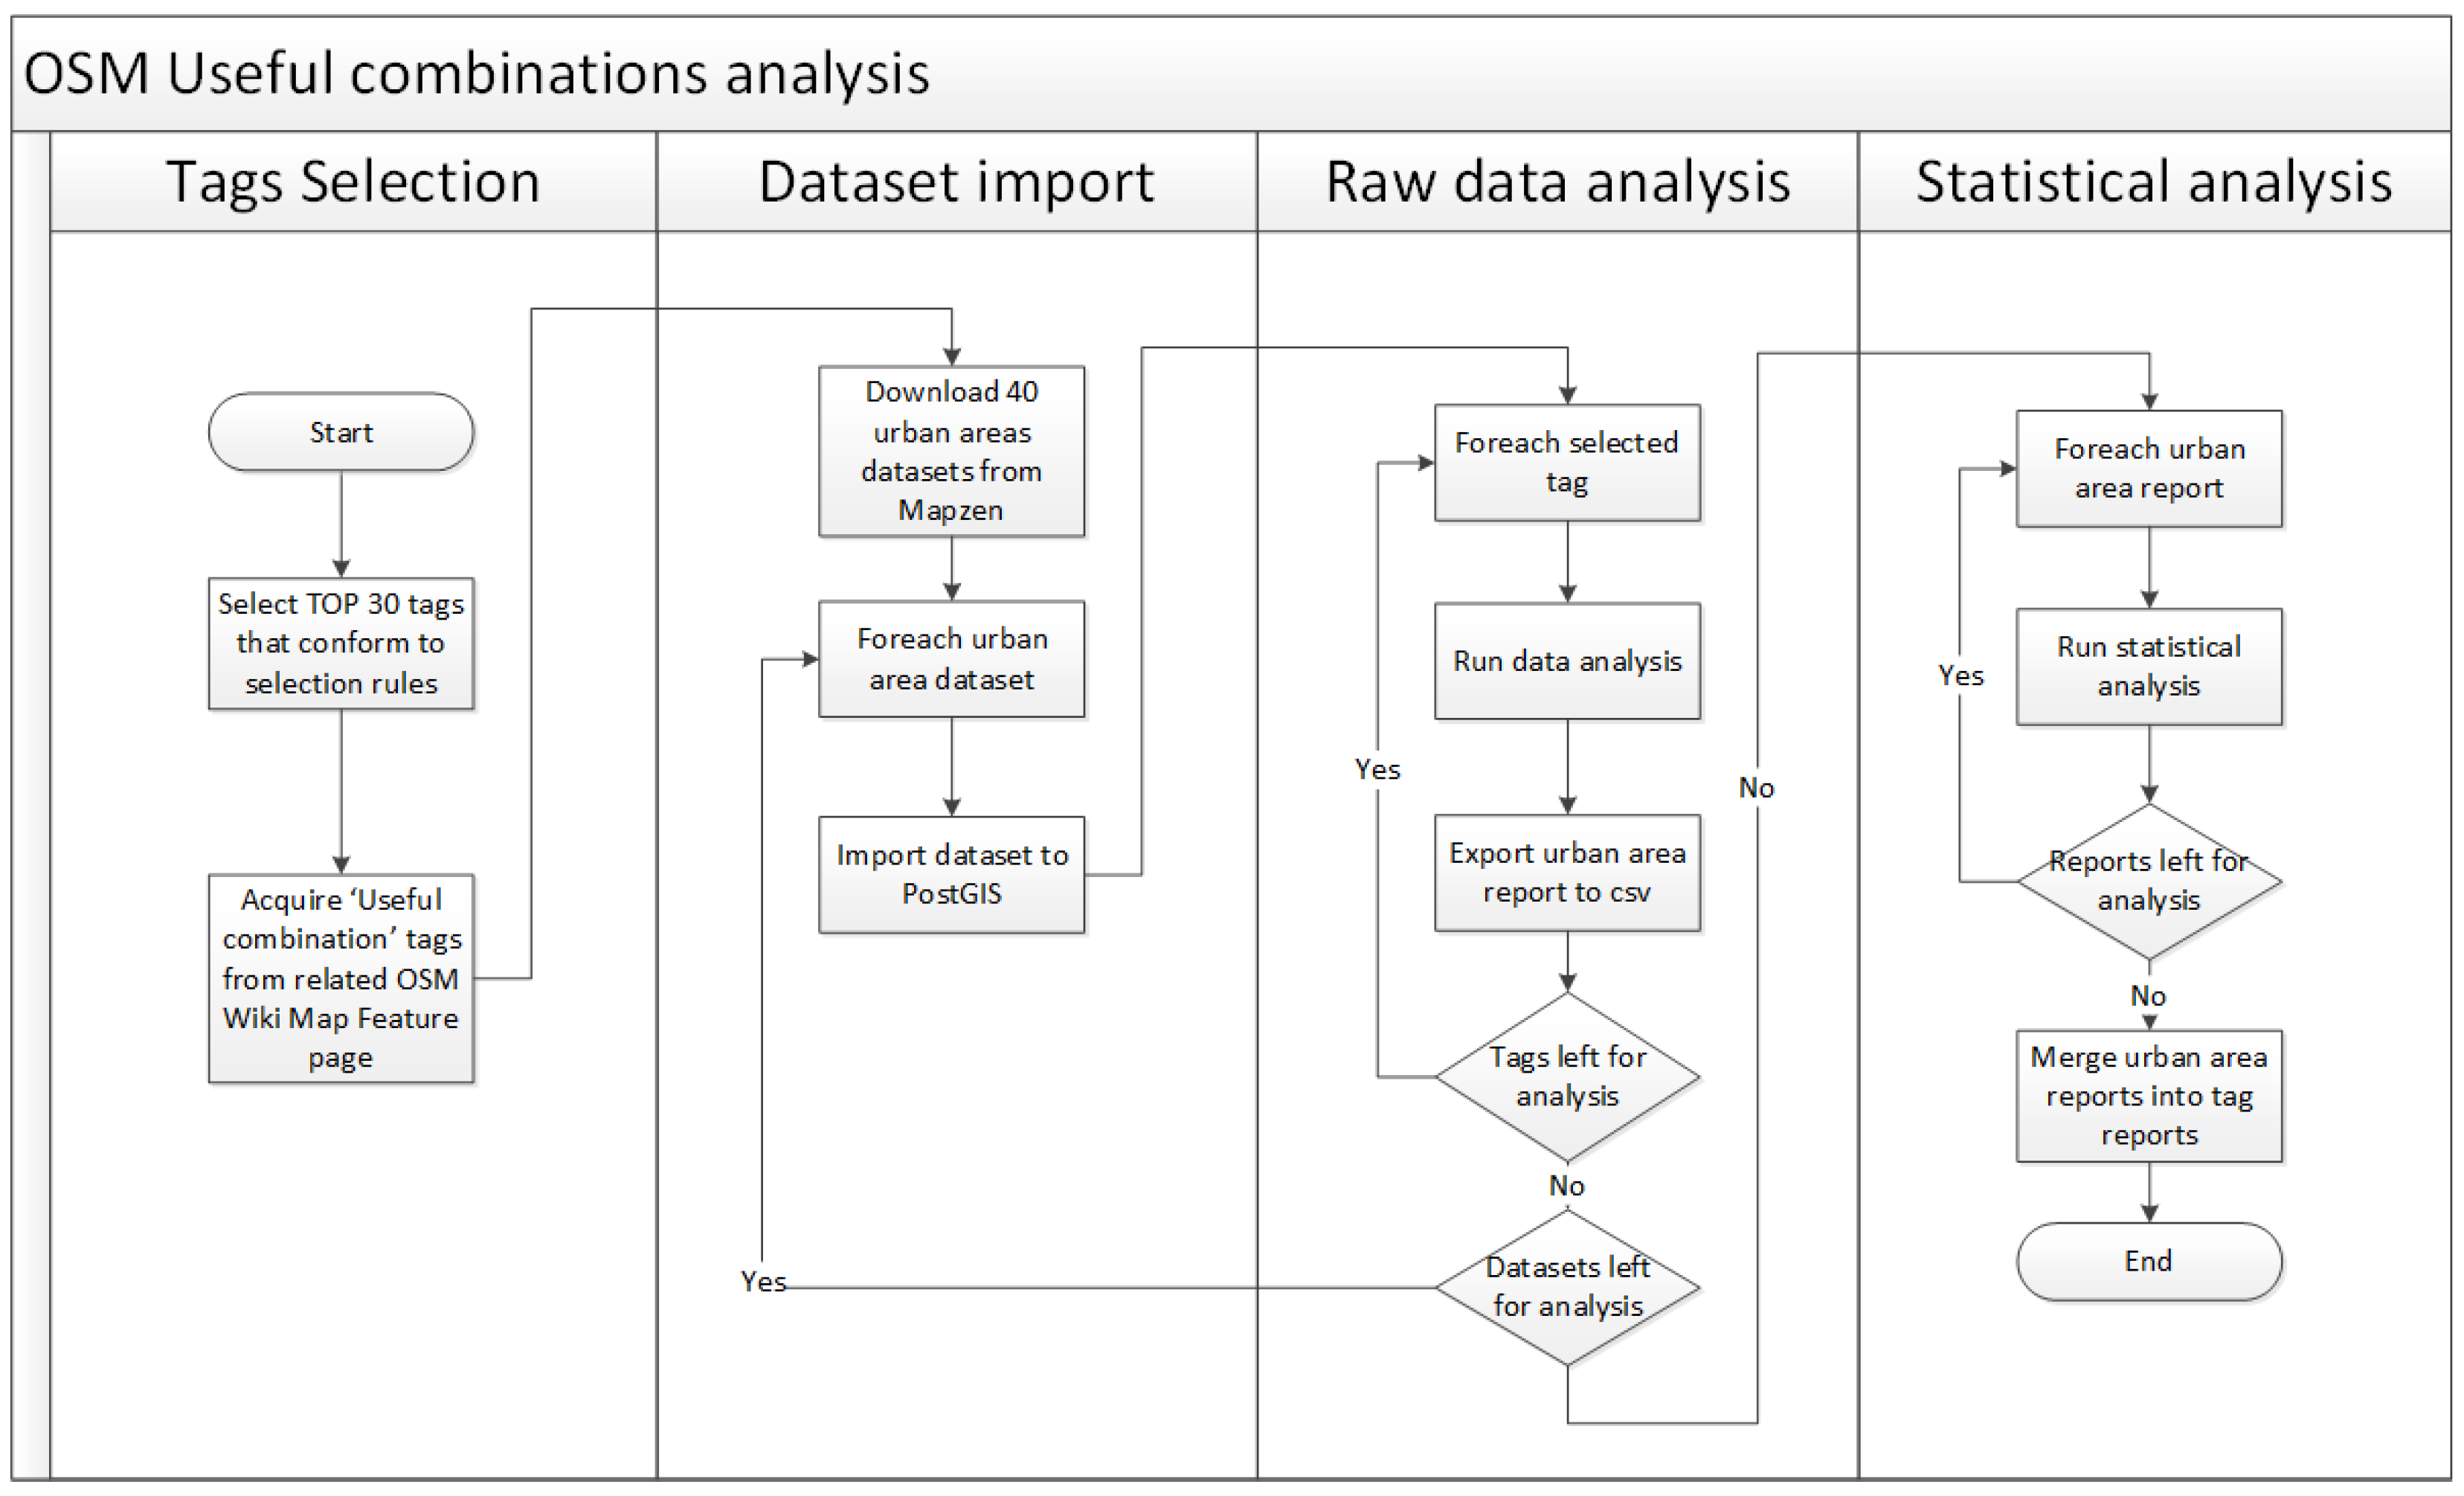
3. Methodology and Experimental Setup

In this section, we shall describe the methodology and experimental setup for our analysis. Figure 3 illustrates an overview of the methodology which we developed to perform the import of OSM data and the analysis of tags for each of the cities and urban regions we imported. There are four components to our methodology, described as follows:
  • Selection of OSM tags for analysis (Section 3.1)
  • Import of raw OSM data for each of the selected cities or regions (Section 3.2)
  • Analysis of the raw OSM data where the patterns of tagging for each of the selected tags are extracted for each of the selected cities or regions (Section 3.3)
  • Final statistical analysis of the output of step 3. This shall be explored in detail in Section 4
In this section, we shall consider items 1, 2, and 3, while item 4 shall be discussed within the Experimental Analysis section in Section 4.

3.1. Selection of OSM Tags for Analysis

There are thousands of potential candidate OSM tags that we could use in this analysis. At the time of writing, TagInfo displays statistics about over 2000 tags [24].
From this information, the most frequently occurring tag in OSM is the building=yes tag, which is assigned to almost 160 million objects ( 4.2 % of all OSM objects). The next most frequently occurring tag in OSM is the highway=residential tag which is assigned to almost 35 million objects, representing just under 1 % of all OSM objects. In the TagInfo listing of the most frequently occurring tags in OSM, the final tag listed—traffic-calming=yes—is found applied to just over 10 , 000 OSM objects. The analysis from TagInfo stops at this threshold. From the TagInfo listing, we chose an initial set of the 30 most frequently occurring tags in the global OSM by using the following criteria for our tag selection:
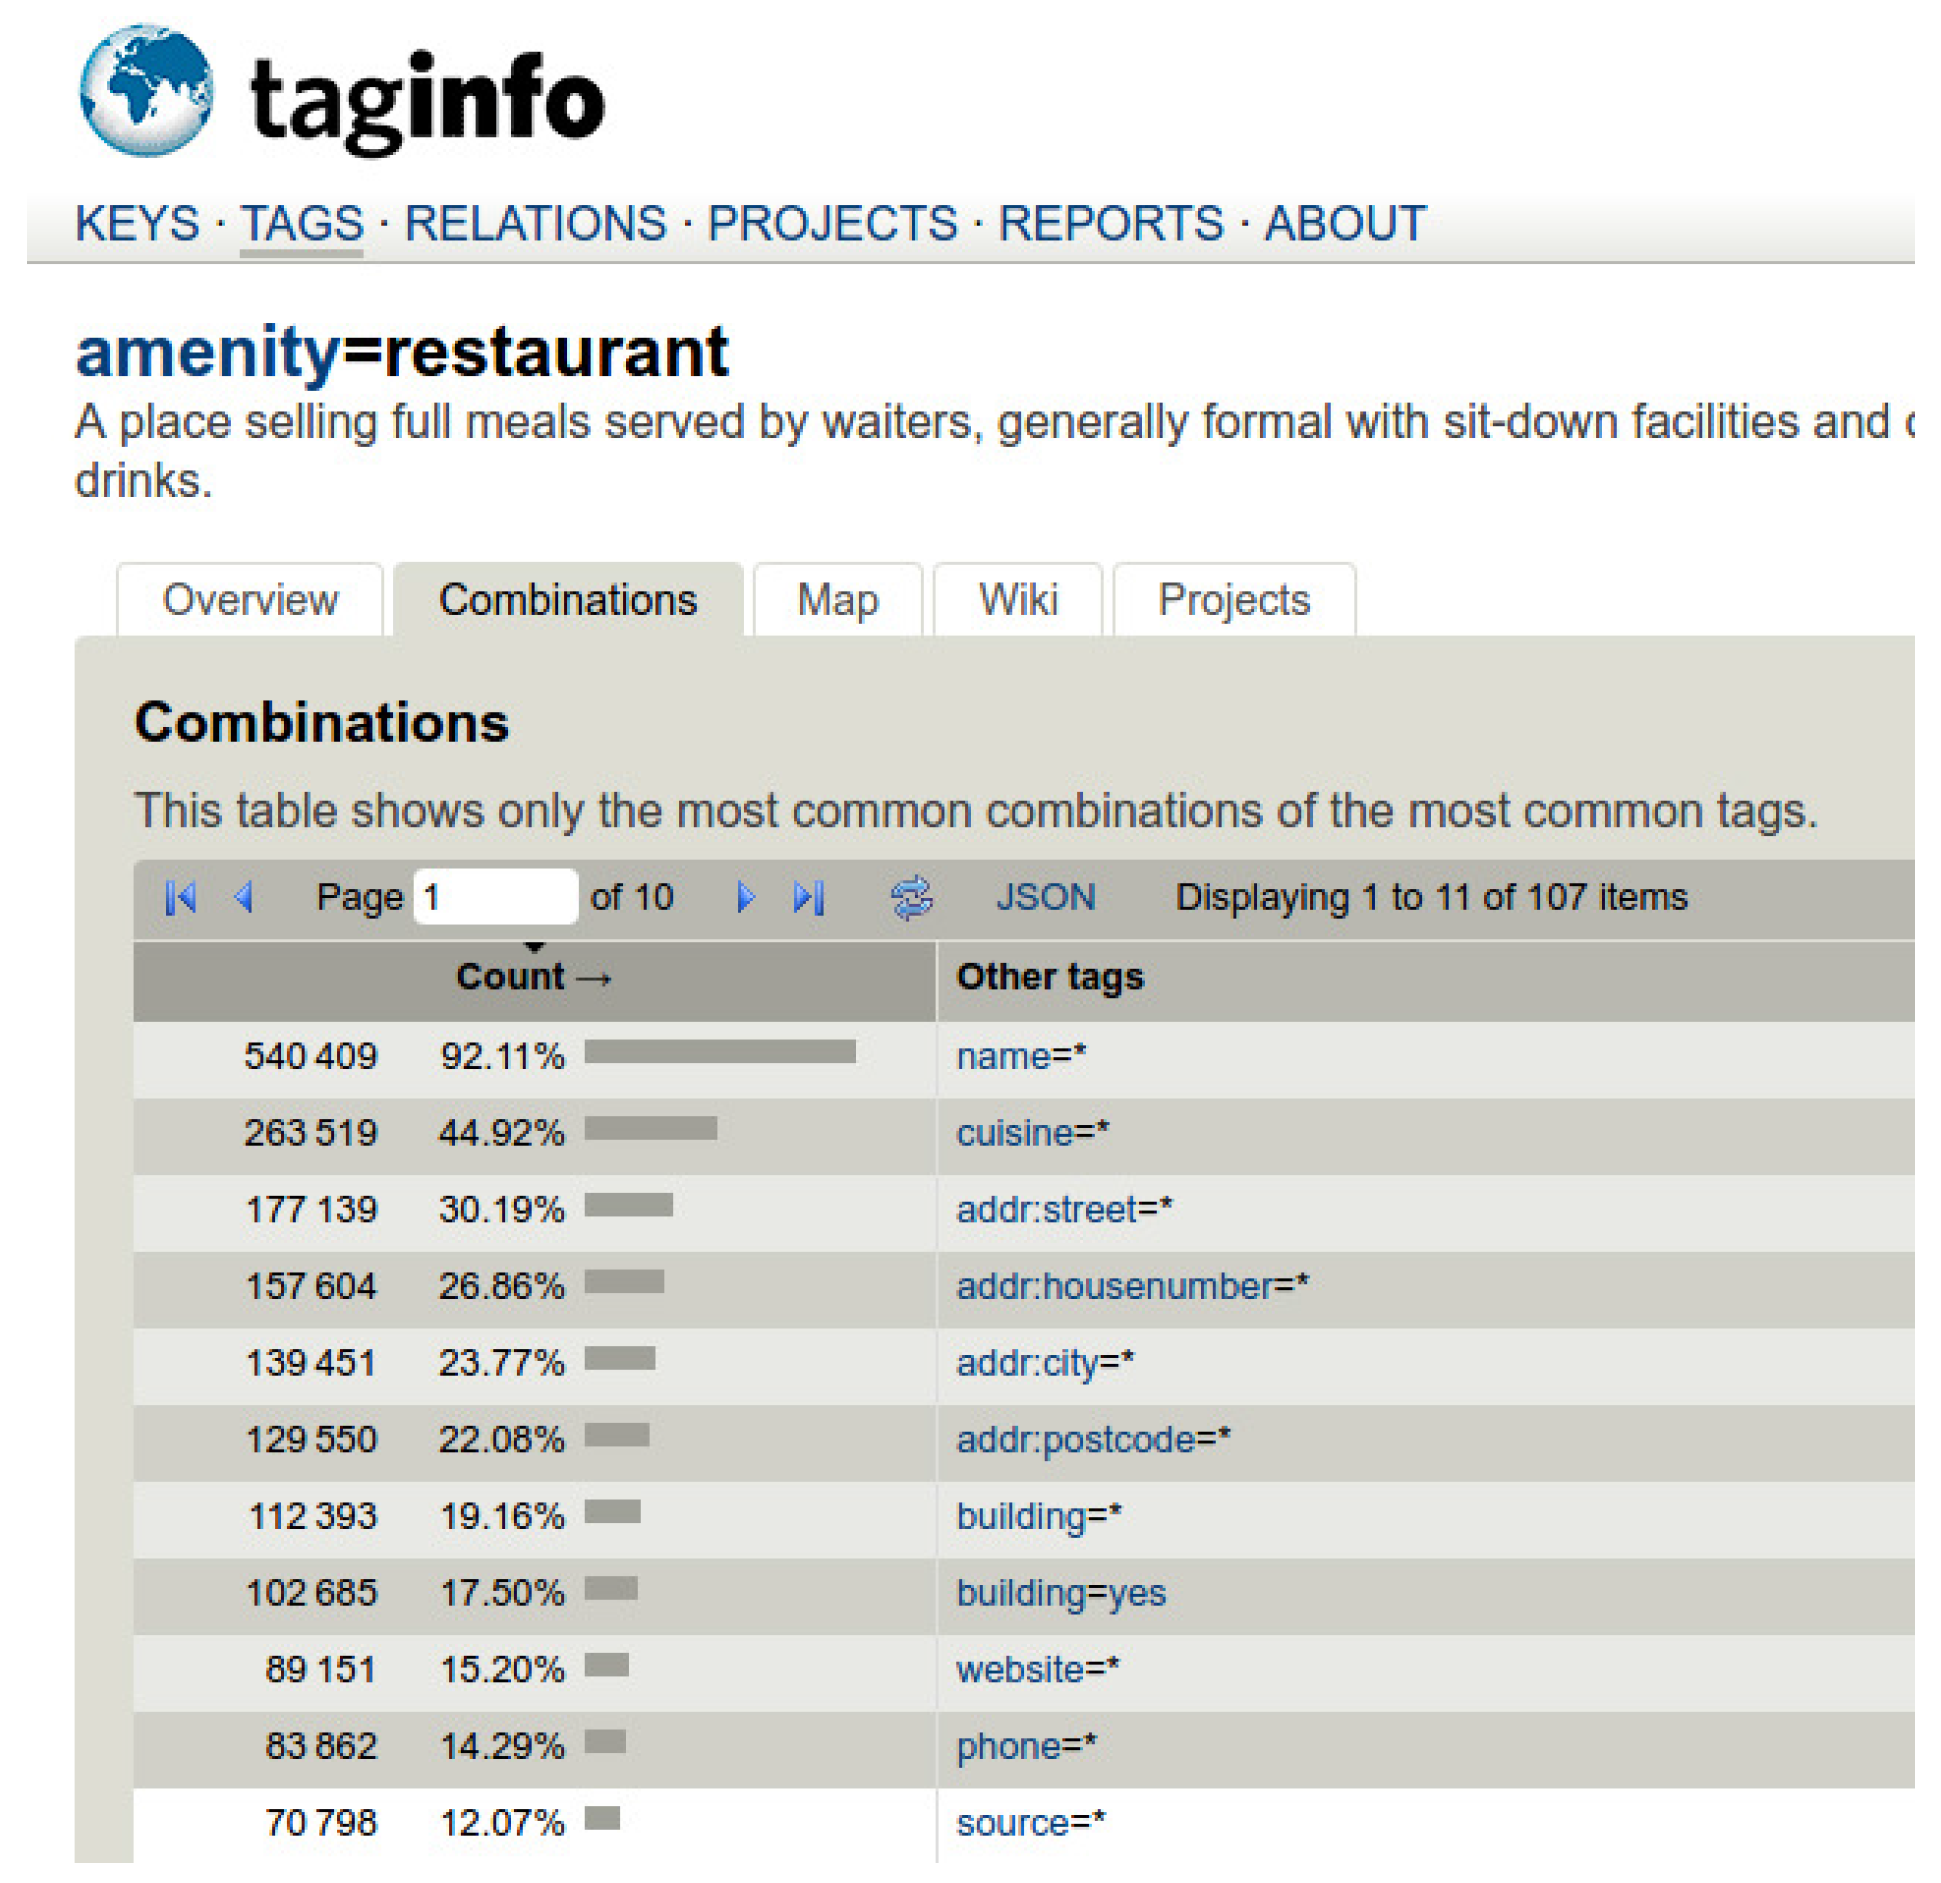
  • The selected tag must have a dedicated Map Features Wiki page [7]. This ensures that the tag is appropriate for our analysis and has OSM community support for its inclusion in OSM. Information about actual usage of the tag in mapping within OSM is provided on each dedicated Map Features Wiki page, which can help us to interpret our results for each selected tag.
  • The selected tag must have at least two suggested tags offered as “Useful Combinations”. If there are not useful combinations with other tags suggested, then this tag is not considered.
  • The value assigned to the key in the selected tag must not be “yes” or “no”. We strictly consider only tags where the key can have some value and does not only state the presence of the attribute described using that same key. While our methodology can easily support tags where the key can have only “yes” or “no” values, such tags can be found in multiple types of features, and it will be more difficult to consider their analysis.
  • The selected tag is not listed as a suggested tag for any of the other selected tags. This ensures that we choose tags with higher importance for our analysis.
Based on this criteria, we selected an initial set of 30 frequently used tags from TagInfo which qualified for analysis. To make the analysis more manageable, we selected 10 tags from this set. Table 1 outlines the 10 tags that we selected. We believe that these 10 tags provide us with a good selection of tags related to different thematic areas (highways, transportation, landcover, amenities). The tags are also applied to OSM nodes and ways. In Table 1, the number of objects in the global OSM database which contain the corresponding tag is shown. The TagInfo ranking of the target tag is provided, which corresponds to the frequency of usage of the target tag in the global OSM database. The information in Table 1 is correct as of the TagInfo service on 28 June 2016.

3.2. Import of Raw OSM Data for Each of the Selected Cities or Regions

Access to the raw spatial data within OSM is under an open access license. There are many different software tools and services which provide access to the data. As a result, there are many different ways in which one can take raw OSM data and insert these data into a spatially enabled database. We chose to use the MapZen service [25] for the source of our OSM data. MapZen offer their “Metro Extracts” service, which provides extracted OSM data based on city and regional administrative boundaries for the entire world. The Metro Extracts service provides updated data on a weekly basis. The OSM data are provided in a variety of formats. We chose to use the OSM XML data format, which is then imported directly into a PostgreSQL PostGIS database using the osm2pgsql tool [26]. This means that we do not have to develop any special or new software tools or routines to perform the data import, as this is a well known and standard way to import OSM data into PostGIS. The raw OSM data used in this paper was downloaded and imported in June 2016.
The following 40 cities were selected for our analysis: Astana, Bamako (Mali), Bangkok, Beijing, Bogotá, Boston, Bucharest, Buenos Aires, Chicago, Christchurch, Dublin, Düsseldorf, Frankfurt, Helsinki, Johannesburg, Kiev, Kyoto, Lagos, London, Lyon, Madrid, Manchester (UK), Mexico City, Milan, Monrovia, Nairobi, New Delhi, Nis (Serbia), Oslo, Ottawa, Prague, Saint Petersburg, San Francisco, Sao Paulo, Singapore, Sydney, Vancouver, Vienna, Vilnius, and Warsaw. To illustrate the spatial distribution of these cities, we provide a map view of our selection in Figure 4. This selection provides sufficient global coverage of cities and regions. It also provides a very good mixture of cities and regions with different official native languages, different cultural composition, and varying degrees of OSM completeness in cities. As [2,15] and other authors have shown, OSM completeness is generally better in first world countries, including cities in North America, Europe, and Australasia. We also selected some cities which have been subject to an import of spatial data from other sources such as industry or open data from national mapping agencies. These cities include Boston, Lyon, Chicago, and Vienna, among others. Our experimental setup and methodology is very flexible, and our software scripts will allow us to add more cities and regions if required.

3.3. Analysis of the Raw OSM Data

When all of the raw OSM data were imported as outlined in Section 3.2, the PostGIS database contains the same set of tables for each city or region. This allows us to perform the analysis of the raw OSM data to extract data and perform computations necessary for the Experimental Analysis, as outlined in the next section (Section 4).
For each of our selected tags in Table 1, we must first manually extract the list of “Useful Combinations” or “Suggested Tags” from the corresponding Map Features page on the OSM wiki. For example, if we consider the amenity=parking tag, it is used to identify a facility for use by the public, by customers, or by other authorized users for the parking of cars, trucks, motorcycles, etc. The Map Features page for amenity=parking [27] indicates the following useful combinations or suggested tag keys: access, capacity, fee, name, maxstay, and operator. Our software must then search each city or region for the amenity=parking tag on nodes and ways and count how many times tags with the keys listed above appear on the same object. A text file is created for each tag. As there are 10 tags in our analysis, there are 10 of these files generated for each of the 40 cities in our analysis. In Section 4, we outline the experimental analysis of the extracted information for the 40 cities selected.

4. Experimental Analysis

In the previous section, we described the preceding parts of our methodology: selection of OSM tags for analysis (Section 3.1), import of raw OSM data for each of the selected cities or regions (Section 3.2), and analysis of the raw OSM data, where the patterns of tagging for each of the selected tags are extracted for each of the selected cities or regions (Section 3.3). We now describe the results of our experimental analysis on the outcome of Section 3.3.
To assess the compliance of each city or region with use of the suggested tags for each target tag, we decided to use a Likert Scale [28,29] ranking. We applied a five part Likert Scale as follows. For a given target tag, we consider the suggested useful combination tags from the corresponding OSM Map Features wiki page. We calculated the relative percentage of objects from the region under analysis which contained both the target tag and a specific key for tags in the set of useful combination tags. The percentage was then mapped to the five part Likert scale where if 0 % 20 % of objects with the target tag also have a specific key, then the compliance is Poor, > 20 % 40 % Fair, > 40 % 60 % Average, > 60 % 80 % Good, and if greater than 80 % , then compliance is Excellent. In the next section, we provide an example on a single city basis of how this Likert scale is calculated and applied. In the final subsections of this section, we outline the overall compliance results for each of the 10 target tags outlined in Table 1. For each target tag, we provide a summary table of compliance results for the list of suggested tags to co-occur with the target tag. We also provide some observations and commentary on the summary table of results.

4.1. Example of Compliance with Suggested Tags in OSM Map Features Wiki Page

As a means of example, consider Table 2, where the compliance of objects with the suggested tagging in the OSM Map Features wiki page for the target tag leisure=pitch is shown [30]. In this case, there are 470 objects. There are two suggested tag keys sport=* and surface=*. For the tag key sport=*, there are 364 objects, or 77.5 % of all objects with target tag leisure=pitch, while only 9 % of objects also have the tag key surface=*. This gives a Likert Scale compliance of GOOD and POOR, respectively. There are 26 different and unique tag keys which are used in combination with the target tag leisure=pitch in Christchurch, New Zealand. In another example, consider Table 3 which outlines the summary of the compliance of all objects in Warsaw, Poland for the target tag railway=rail. Table 3 contains all five parts of the Likert scale. The railway=rail is used for full-sized passenger or freight trains in the standard gauge for the specific country or region. It is the largest railway classification in OSM. We see that there are 9 suggested tag keys. We see variation in the Likert scale of compliance with the use of the suggested tag keys. This is a very interesting example, as the target tag railway=rail contains suggested tag keys with very specific and technical domain information, such as gauge and voltage. It shows that the total number of objects with railway=rail tag in Warsaw is 2922. Out of those, key name=* can be found in 67 objects, which is only 2.3 % . Since this value falls between 0 % 20 % , it is assigned with POOR compliance. Similarly, there are 289 bridge=* keys and 61 tunnel=* keys, which is 9.9 % and 2.1 % , respectively. Therefore, these two have POOR compliance as well. Key usage=* is used in 36.9 % of the objects, which is higher than 20 % and lower or equal to 40 % , and therefore it has FAIR compliance. Similarly, frequency=* and voltage=* are found in 55.4 % and 55.6 % of objects and have AVERAGE compliance. The only tag with GOOD compliance is key service=* with 65.5 % . The only two keys which can be found in more than 80 % of the objects with tag railway=rail are gauge=* and electrified=*, and therefore they have EXCELLENT compliance.

4.2. Compliance for Target Tag highway=residential

In this section, we discuss the compliance to the suggested tag combinations on the OSM Map Features page for the target tag highway=residential. A summary of the compliance for each of the 40 cities in our analysis is shown in Table 4. This tag is used for roads providing access to residential areas or roads within these residential areas. It is generally understood to represent a street or road generally used for local traffic within a residential settlement. As outlined in Table 1, we see that highway=residential is the second-most frequently used tag in the OSM global database. There are two suggested tag key combinations: name=* for the name of the street or residential road, and oneway=* to indicate access restrictions. The OSM Map Features page for oneway [31] indicates that this tag key should only be used if there is an access restriction. There are a number of observations that can be made here, as follows:
  • The name=* tag has excellent compliance in almost half of the cities analysed. One reason for this is that in many cases the name=* tag may have local variations to accommodate the official native language(s) for the corresponding city, such as name:fi for the Finnish name of a street in Helsinki.
  • The overall compliance of oneway=* is not good in all of the cities. We believe this might result from confusion about how to apply the tag correctly. The OSM Map Features page indicates that it should only be used when the street object with the highway=residential tag is actually a one-way street (oneway=yes). If traffic flow movement is bidirectional, then this suggested tag should not be used. However, we feel that it would be interesting to check how many one-way streets are missing this tag. This task would require on-the-ground field verifiability, as this information is not always possible to extract correctly from aerial imagery.
  • The only city that has at least AVERAGE compliance of the oneway key is the city of Milan, which is clearly noticeable by only looking at the OSM map of Milan.

4.3. Compliance for Target Tag natural=tree

In this section, we discuss the compliance to the suggested tag combinations on the OSM Map Features page for the target tag natural=tree. A summary of the compliance for each of the 40 cities in our analysis is shown in Table 5. This tag is intended for use on single trees sometimes standing alone, or trees which have some local significance. What we feel is remarkable about this target tag natural=tree is the frequency of use in OSM. It is ranked 17 t h globally, and is applied to over seven million objects. There are 8 suggested tag key combinations. All of these suggested tags require very specific information about the tree, which we believe means that only local knowledge and on-the-ground survey could yield this information. Our observations are as follows:
  • Compliance for this tag is low because the majority of cities have only small numbers of objects tagged or attributed as single or lone trees. Proper mapping of these features requires field verifiability and special domain knowledge, and usually a lot of time and effort.
  • Very high compliance can be seen in the city of Vienna across all the keys, except for the key genus. In a few other cities, only some of the keys are used. For example, Bucharest has only high compliance for the keys height and species, while the other keys are not used at all. San Francisco shows high compliance of the taxon key, used with 3537 mapped trees.
  • Vienna was subject to an open data import of trees, and contains over 133 , 000 trees.
  • In summary, only in the cities Bucharest, Duesseldorf, London, Lyon, Vienna, San Francisco, and Warsaw is there any real usage of the suggested tag key combinations for the target tag natural=tree.

4.4. Compliance for Target Tag highway=footway

In this section, we discuss the compliance to the suggested tag combinations on the OSM Map Features page for the target tag highway=footway. A summary of the compliance for each of the 40 cities in our analysis is shown in Table 6. The tag highway=footway is used for mapping minor pathways, which are used mainly or exclusively by pedestrians. For multi-use or unspecified paths and trails used by a variety of non-motorised traffic, the tag highway=path (see Section 4.5) may be better suited. Overall, use of the suggested tag key combinations for the target tag highway=footway is very poor across all of the cities under analysis. There are a number of observations we can make, as follows:
  • The OSM Map Features Wiki page [32] does indicate that there are different customs, rules, and signs in use in different countries for several kinds of ways available to pedestrian, bicycle, and horse users. Tagging them varied even before the introduction of highway=path, and has led to different conceptions of what each of the current tags actually mean.
  • None of the cities in our analysis display EXCELLENT or GOOD compliance for any of the suggested tags.
  • The low compliance of the keys is mostly coming from the need for field verifiability in order to properly map the suggested tags. The best compliance relates to the tag key surface, which is still low, but most probably only because mappers know the surface of footways in their neighborhood or can determine them from the aerial imagery.
  • It is noticeable that most of the objects have poor compliance for the name key, which is expected since footways do not usually have proper naming. Only the city of Bogotá has higher compliance for the name key, since some the streets are actually being mapped using highway=footway.
  • The footway key has low compliance, but its usual values are either sidewalk or crossing, which should not be applied to all objects tagged with highway=footway.

4.5. Compliance for Target Tag highway=path

In this section, we discuss the compliance to the suggested tag combinations on the OSM Map Features page for the target tag highway=path. A summary of the compliance for each of the 40 cities in our analysis is shown in Table 7. This tag represents a generic path—either multi-use or unspecified usage—which is open to all non-motorized vehicles. The path may have any type of surface, and can include walking and hiking trails, bike trails, and paths, horse, and stock trails, mountain bike trails, as well as combinations of the above. The tag should be applied to paths for which tags such as highway=footway and highway=cycleway would be inappropriate. There are a number of observations we can make here, as follows:
  • None of the cities in our analysis display EXCELLENT or GOOD compliance for any of the suggested tags.
  • sac_scale and trail_visibility are part of a classification scheme for hiking trails regarding trail difficulty and trail visibility/orientation, respectively. These tag keys draw their values on the Klassifikation des Swiss Alpine Club (SAC) (de), since there is no internationally standardized classification schema. Only Oslo (trail_visibility) and Christchurch (sac_scale) display FAIR compliance for these two tag keys. The domain-specific nature of these tag keys might be difficult for non specialists to understand and subsequently apply as tags.
  • Boston, Christchurch, Frankfurt, Johannesburg, Milan, Nis, and Sydney have AVERAGE compliance for the surface key. We were not able to find any relation among these cities in this context, which points out that mapping of the surface in these situations may be down to the tagging practice of the local communities.

4.6. Compliance for Target Tag highway=tertiary

In this section, we discuss the compliance for the suggested tag combinations on the OSM Map Features page for the target tag highway=tertiary. A summary of the compliance for each of the 40 cities in our analysis is shown in Table 8. The highway=tertiary tag is used for roads connecting smaller residential settlements and within large settlements for roads connecting local centres. In terms of a transportation network, highway=tertiary roads commonly also connect minor streets or roads to more major roads. Outside of urban areas, tertiary roads are those with low-to-moderate traffic which link smaller settlements such as villages or small towns. There are a number of observations we can make, which are outlined as follows:
  • Buenos Aires, Lagos, Madrid, Mexico City, Sao Paulo, and Vancouver have GOOD compliance for the oneway key, which indicates that if this tag has been correctly applied, the majority of the highway=tertiary objects in these cities are actually one-way roads. Since 16 cities have FAIR compliance with oneway while 12 cities have AVERAGE compliance for this key, we believe that the objects with tag highway=tertiary are the result of different local tagging practices in these cities.
  • Only Ottawa and Boston score EXCELLENT for lanes=*. We think that this is because tertiary roads in the USA and Canada usually have more than one lane. This does not typically happen in other parts of the world or in Europe for instance.
  • Only Lyon and Prague have at least GOOD compliance.
  • New Delhi is the only city to score POOR on the name=*

4.7. Compliance for Target Tag amenity=parking

In this section, we discuss the compliance to the suggested tag combinations on the OSM Map Features page for the target tag amenity=parking. A summary of the compliance for each of the 40 cities in our analysis is shown in Table 9. The amenity=parking tag is used to identify a facility or building for use by the public or by customers or other authorised users for the parking of cars, trucks, motorcycles, etc. This includes parking facilities which charge a fee to access these facilities. There are over two million objects with the amenity=parking tag, according to TagInfo in Table 1. There are some observations, as follows:
  • From the data, it can be seen that fee key is usually applied with values yes or no, while these tags are rarely applied. We believe that this omission does not mean that parking fees do not apply, but probably requires a mapper to posses local knowledge.
  • For the tag amenity=parking, none of our 40 cities display EXCELLENT compliance for any of the suggested tags.
  • The name=* tag is surprisingly under-used. Singapore shows AVERAGE compliance of use of this suggested tag, while Dublin and Kyoto show FAIR compliance. Based on this, it would appear that OSM contributors have difficulty in providing names for car parking spaces.
  • The higher availability of parking-related data could help for better navigation and automatic parking suggestions based on the parameters of the stay and payment options, based on the operator. Even for residential parking places, information about operator or the lack of it could indicate availability for visitor parking. While mapping maxstay or operator tags can require field verifiability, some authors have suggested mapping these directly from online imagery such as Mapillary ([18])

4.8. Compliance for Target Tag highway=primary

In this section, we discuss the compliance to the suggested tag combinations on the OSM Map Features page for the target tag highway=primary. A summary of the compliance for each of the 40 cities in our analysis is shown in Table 10. This tag represents roads which represent a major highway or road, linking large towns or cities. In most situations, a highway=primary will have at least two lanes with a central barrier separating these lanes. In areas with less developed infrastructure, road quality may vary. In these cases, the traffic for both directions is usually not separated by a central barrier. While highway=primary is only ranked 59 t h in TagInfo (Table 1), it is arguably one of the most well-known tags in OSM [4]. The road network for most countries in OSM is very well developed [33]. There are some observations from the information in Table 10, as follows:
  • The only two cities that have FAIR compliance for the name key are Bamako and Lagos. If we closely check data in Bamako, we can conclude that the reason for this low compliance of the name key comes from the mapping practice where highway=primary objects are actually made out of multiple disjoint polylines, out of which only some are tagged with name tag. This can be deduced from the values of the ref tag.
  • The high difference between the level of compliance of the keys co-occurring with the highway=primary tag, as well as the number of different tags applied and the number of objects—compared to the city size—suggests that very different tagging practices exist throughout the world for this particular tag. Since these objects are usually mapped in the beginning of the mapping in urban areas [34], it might be expected that these features are mapped in various stages of the OSM development. Therefore, observed practices are very heterogeneous, since some of the data were probably mapped before the OSM community agreed on the approach for tagging these objects. Given the importance of these objects and their possible usage in various applications highway=primary, tags could be revisited to check their tagging and annotation.
  • Cities with POOR compliance for lanes=* include Oslo, Lyon, Manchester, Dublin, and Mexico City. The cities which display POOR compliance with the ref=* tag key include Astana, Bogotá, Nairobi, Sao Paolo, Singapore, and Sydney.

4.9. Compliance for Target Tag highway=bus-stop

In this section, we discuss the compliance to the suggested tag combinations on the OSM Map Features page for the target tag highway=bus-stop. A summary of the compliance for each of the 40 cities in our analysis is shown in Table 11. A highway=bus-stop tag indicates a bus stop, representing a place where passengers can board or alight from a bus or coach. The physical position of a bus stop is usually marked by a shelter, pole, bus lay-by, or road markings. In non-urban areas and regions with less well-developed public transport infrastructure, these locations may not be physically marked. There are a number of observations which we will outline:
  • Only three cities have POOR compliance with use of the name=* tag, and more than half of the cities have EXCELLENT compliance with the use of this tag. The cities that have POOR compliance of this tag are Christchurch, Monrovia, and Sao-Paulo.
  • The suggested tags operator=* and public_transport are not well used, with only 6 cities showing EXCELLENT compliance with usage of these tags with highway=bus_stop, namely: Beijing, Boston, Chicago, Madrid, Ottawa, and Vienna.
  • The operator key has POOR compliance in 28 cities, but, based on the explanation on empirical evidence, this might be because the bus stops are operated by one common public or private company. In such cases, the OSM Map Features Wiki pages indicate that only transport operators that are not common to that urban area should be mapped.
  • The bus_stop name mapping requires field verifiability and local knowledge, unless there is a detailed open-licensed transportation map from which this information can be derived.

4.10. Compliance for Target Tag railway=rail

In this section, we discuss the compliance to the suggested tag combinations on the OSM Map Features page for the target tag railway=rail. A summary of the compliance for each of the 40 cities in our analysis is shown in Table 12. In Section 4.1, we discussed a specific example of this target tag for Warsaw in Poland. There are some general observations we can make here, as follows:
  • Key tunnel has POOR compliance, while the key bridge has POOR compliance in most the cities. This does not mean that the overall compliance is actually POOR, since the omission of these tags actually means that particular part of the rail is not on a bridge nor inside of a tunnel.
  • The POOR compliance of the gauge key in some cities may come from the lack of domain knowledge from the mappers. Usually, gauge size does not change across the urban area or even a country, so there is the potential that the gauge tag could be updated automatically, based on the standard gauge in use.
  • The gauge=* tag is POOR in Beijing, Bucharest, Mexico, and Ottawa, while Sydney is the only city to score EXCELLENT on voltage=* and frequency=*.
  • Similar commentary can be given for the other domain-specific keys (such as frequency or voltage) that can be applied based on existing tag values or by applying the values that are country or regional standards.

4.11. Compliance for Target Tag leisure=pitch

In this section, we discuss the compliance to the suggested tag combinations on the OSM Map Features page for the target tag leisure=pitch. A summary of the compliance for each of the 40 cities in our analysis is shown in Table 13. The leisure=pitch tag is used to annotate areas designed for playing a particular sport, normally designated with appropriate markings. Examples include: tennis courts, basketball courts, baseball parks, football pitches, etc. There are some interesting observations here:
  • The surface tag is hardly used at all, and all cities show POOR compliance. The surface key can take values of grass, earth, astro-turf, asphalt, etc.
  • The sport tag shows very good application in over 30 of the cities. This tag will indicate which sport is played on this pitch. We speculate that the reason for the high compliance for this tag key arises from the ability to derive the sport played on a pitch from aerial imagery, as the markings on the surface would indicate the sport played there.
  • The sport=* tag is POOR in Astana and Kyoto.
  • The sport=* tag is AVERAGE in Beijing, Helsinki, Kyiv, Vilnius, Saint Petersberg, Oslo, and Warsaw.

4.12. Overall Summary of Results Tables

In order to summarise the results from this section and present a global overview, we have computed a summary table in Table 14. This table lists all of the target tags and the number of suggested keys for each target tag on the OSM Map Features Wiki pages. The column “Total LV” is the number of keys multiplied by the number of cities (40). Then, for each step on the Likert Scale (Poor, Fair, Average, Good, and Excellent), we calculated the overall percentage of each step. Each column represents a percentage value. This summary table highlights a number of important observations. Firstly, we see that the target tags amenity=parking, highway=path, natural=tree, and highway=footway have overall greater than 90 % POOR compliance. Indeed, the poor performance of highway=path and highway=footway may have roots in what is known in the OSM Wiki as the Path Controversy [32]. The corresponding OSM Wiki page indicates that there are different customs, rules, and signs in use in different countries for different types of paths or roads available to pedestrian, bicycle, and horse users, etc. Tagging these in OSM has been somewhat inconsistent. The introduction of highway=path to attempt to solve these problems has lead to different conceptions of what tags should be used. The highway tags primary, tertiary and bus-stop perform the best, with a good overall performance distributed across all of the steps of the Likert Scale used. These are amongst the most frequently contributed tags in OSM. The target tags railway=rail and leisure=pitch perform reasonably well in a global sense, perhaps due to the fact that their suggested combinations of tag keys require specific domain knowledge or on-the-ground knowledge or survey.

5. Conclusions and Future Work

In this paper, we have investigated if the suggested tagging structures outlined in the OSM Map Features Wiki website were being followed or implemented by OSM contributors for 40 cities and urban areas around the world. We selected 10 frequently occurring tags from the global OSM database (see Table 1) using the TagInfo service. For each of these tags (referred to as our target tags), we consulted the OSM Map Features Wiki website for information and guidance on the suggested tags or tag keys contributors should use with these target tags when annotating objects in OSM. By using a five-part Likert Scale, we assessed the compliance of each city for each target tag and the use of the suggested tags or tag keys from the OSM Wiki. OSM data were downloaded from the MapZen data service in June 2016. We asked the following research question: Do OSM contributors comply to suggested tags and/or combinations of tags as outlined on the Map Features pages, and does this compliance vary spatially?
In answer to this research question, we found that compliance or usage of the suggested tags or tag keys from the OSM Map Features Wiki website, for many of the target tags in Table 1, to be disappointingly poor. Target tags such as amenity=parking (see Section 4.7) or highway=path (see Section 4.5) are examples of where there is very poor compliance across all 40 cities. On the other hand, target tags such as railway=rail (See Section 4.10), highway=primary (see Section 4.8), and highway=bus-stop (see Section 4.9) display better rates of compliance and usage of the suggested tags. We believe that this is not always a case of contributors ignoring these suggested tags or recommendations. Rather, it is potentially a case of many contributors placing more emphasis on the geometric aspects of mapping features and adding a minimal set of attributes to these features. It is possible that some contributors may not understand the importance of attributes in terms of describing the function or characteristics of a feature. Seeing a relatively small number of tags being applied by other contributors to similar objects or features may have an influence on their tagging behaviours. A summary table of our analysis is presented in Table 14. As Ballatore and Zipf [4] remind us, VGI communities produce datasets and their schemas in an open-ended and flexible way. This means that classes, instances, and their attributes are often fluid and mutable. Indeed, in the analysis provided in their paper, the authors provide visualisations of the amount of non-compliant tags in a given area/region. This information can then be used by contributors to fix tagging problems. While the lack of compliance to suggestions on the OSM Wiki and Map Features might not be an issue for feature classes such as Highways, authors such as Hecht et al. [35] have found poor use of tagging and attribution in feature classes such as buildings and urban structures. While the authors in [36] do not strictly talk about compliance of tagging, they find that attribute data or semantic information is only completed for OSM points of interest (POI) or polygon features which are rendered by popular map production applications. They conclude that geographical objects and attribute information not visible on OSM maps are neglected by OSM contributors. In addition to this, “existing semantic information cannot be used due to contradicting tag combinations or typing errors. Tagging errors may also appear due to different interpretations of OSM tags by various OSM mappers or due to incorrect spelling” [36] (page 15).
Trying to understand the approaches that contributors to OSM take when tagging or annotating objects is a complex problem [37]. We can state with certainty that, while the target tags in Table 1 are certainly very widely used, they do not always co-occur with the tags or tag keys suggested as useful combinations in the OSM Map Features Wiki website. The OSM Map Features Wiki website is considered the de-facto rulebook or guidebook to mapping in OSM [6], with some authors considering it as the OSM ontology [4]. Our analysis indicates that tagging or annotation of objects in OSM, on a global scale, paints an inhomogeneous picture of tag application. This obviously has implications for data quality and the development of software applications which rely on the tags on objects as input to their internal algorithms and decision making. Using the OSM Map Features Wiki pages as guidance may physically require contributors to refer to these pages when mapping in OSM, or at least be very familiar with their content. This might introduce extra cognitive steps into the mapping process. In this situation, we believe that contributors will use the guidance and suggestions provided by the OSM editing software in order to choose tags and tag keys. Otherwise, we are relying on contributors being very familiar with the information and advice on OSM Map Features, which we believe is not the case for a large majority of contributors.
During our research, we also investigated how the selected tags were applied in different cities and regions to understand if some of the suggested tags or keys were being used extensively, sparingly, or were not used at all. From our observations, we can conclude that the application of tags and their overall compliance certainly does vary between cities and regions, but we were unable to quantitatively identify any distinctive patterns from which conclusions could be drawn. For certain cities and regions, we found that some keys co-occurred with suggested tags in the majority of mapped objects. Indeed, we have been considering this problem of regional patterns of tagging in OSM in other research work we are involved in. In our paper [38], using a different methodology, we have considered the frequency of co-occurrence of other sets of tag keys, with specific target tags, for some of the cities and regions also studied in this paper. In Table 15, we show the most frequently occurring tag keys for the target tag natural=tree in three cities—namely, Vienna, Düsseldorf, and London. The percentage of objects in those cities, in which these combinations are occurring, is given in the third column. Vienna has been subject to a large mass import of geographical data about tree locations. For other target tags in this paper, we found that there was very often a very low number of tag keys used, with a mean of less than 2 (approximately 1.33 ) additional tags per object. Another example is for the highway=footway target tag, where we also see some regional variation. For example, in Helsinki, the three most popular co-occurring tag keys are l i t , s n o w p l o u g h i n g , s u r f a c e , Frankfurt ( s m o o t h n e s s , s u r f a c e , w i d t h ), and San Francisco ( n a m e , t i g e r : c f c c , t i g e r : c o u n t y ). In the San Francisco case, the bulk import of TIGER data is a major influence on which tags and tag keys are available. We speculate that such keys, which can be found co-occurring with suggested keys or tags in a majority of the objects analysed, can influence future tagging practices in some regions. However, more quantitative research is required to investigate these regional variations in more detail.
As we mentioned above, considering tagging of objects in OSM or VGI as part of a data quality analysis remains challenging. Overall, the issue of data quality is a complex problem in the case of considering volunteer contributions in the production of an annotated map database. Indeed, the issue of data quality related to annotations is not simply a matter of considering if the annotations exist and are correctly used compared to some agreed-upon ontology. Rather, a broader consideration of data quality will need to include aspects of contributor reputation, reliability, and trust of the correctness of the annotations. As outlined by [39], the actual target task or use case for which the data will be used can be very helpful in applying an appropriate—clearly motivated—method for data quality assessment.

Future Work

There are a number of directions for future work which can use the work described in this paper as a basis. These directions are summarised as follows:
  • What is the influence on tagging patterns from major contributors to OSM in cities and urban areas? In work by [2,17,40] and others, we see that in OSM, there is a small percentage of all contributors (between 5 % and 10 % ) who perform almost all (between 80 % and 90 % ) of the tagging in the OSM database. Future work will identify these major contributors in a selection of cities and urban areas. By considering the edits from these major contributors, it would be very useful to analyse what tagging patterns or structures they are using. Are they following advice from the OSM Map Features pages? Are they using the default tags as suggested by OSM editing software (such as JOSM and the web-based iD editor)? Perhaps they are tagging objects based on their own conceptual idea of how a particular object in a given geographical context should be tagged and annotated?
  • Using a cluster-based analysis, could we detect and identify emerging regional-based tagging practices. With the OSM Map Features Wiki pages, there is an idea that all objects in OSM should and could be annotated and tagged in a homogeneous fashion. There is flexibility in the tagging structure in OSM to allow for local variations based on language and alphabets used and cultural influences. This future work could help to identify if specific objects are tagged differently in different regions of the world. For example, are parking areas (amenity=parking) tagged and annotated differently in Europe in comparison to North America?
  • In some of our previous work [33,41], we performed an analysis of the OSM History data. In future work from this paper, we will investigate if it is possible to detect the historical evolution of tagging patterns or practices over time, using the OSM History data. If on a regional scale some key was specifically co-occurring with some specific tag, could we conclude what induced such behaviour? Was it a preference tag of some major influencer (mapper with high contribution to OSM), a newly agreed key within the OSM community, or a new feature like “electric car plug”? If there is a possibility to detect such patterns, could it influence changes of the “useful combinations” section of OSM Map Features Wiki page or even induce the development of regional variations of “useful combinations” sections?
  • At the conclusion of this work, we can say that the quantitative analysis of potential spatial variation in the compliance with suggested tags and/or combinations of tags is a difficult problem. While the results in this paper indicate that there is noticeable variance in the overall compliance with suggested tags and/or combinations of tags, we were not able to quantitatively indicate any distinctive patterns. There are a number of possible pathways to further investigation for this problem. In [42], the authors considered comparing social tags and subject terms in the domain of information science between Chinese and English sources. The authors used traditional methods such as the Jaccard similarity coefficient and the Spearman correlation coefficients of the two ranked sets to compare these tag sets. In [43], the authors analysed the application of over 1200 tags on StackOverflow for different topics and conversations. The authors evaluated the performance of their method using the standard information retrieval measures of precision, recall, and F 1 (F-score or F-measure). In works by [44,45], the authors use an overlap coefficient lexical similarity measure between sets of terms of tags. The overlap coefficient is a metric that describes how much of the smaller of the vocabulary is included in the larger and is not sensitive to the relative sizes of the two vocabularies. An earlier work [46] suggests that for the analysis of tagsets, one should consider splitting up the sets into smaller chunks for a more fine-grained analysis. In [5], the authors propose six dimensions of conceptual quality for VGI. The dimension I c m compliance is the most applicable to our work here, where this dimension considers the adherence of an attribute, feature, or set of features to some given source. I c m is easily calculated, and can be implemented into our analysis software. We believe that future work that considers these approaches may be able to provide quantitative evidence of differences in compliance between different cities and regions.
  • Analysis of the correctness of tags used in combination with target tags is required. In Section 4, we provided the results of the testing of usage or compliance of cities with suggested tag key combinations with a given target tag. An object in a city is deemed compliant if a given target tag is accompanied by a suggested tag key. In this paper, we do not check or analyse the value of the suggested tag keys. Our methodology is flexible and will allow us to integrate this type of checking in future work. Such checking of the correctness or validity of the values assigned to suggested tag keys could allow us to make more informed statements about the quality of the tagging on objects for specific target tags. The correctness of tag application must also be considered within the applicability of the Map Features Wiki suggestions for each city. We did not consider these variations in this work. Each city or region may exhibit differences in how applicable a given suggestion is. For example, sac:scale or mtb:scale for the highway=path may not always be generally applicable to every urban area. These local variations must be taken into consideration in any assessment of overall tag compliance. A further suggestion here would be to consider how this type of checking could be performed efficiently in real-time, given that OSM can legitimately be considered as geographic Big Data [47]. Our approach outlined in this paper has been developed as an offline process. The implementation of our methodology as a component of an online stream processing engine [48] will require additional software development.

Acknowledgments

This work and the authors have been supported by the COST Action TD1202 Mapping and the Citizen Sensor. This COST Action supported two Short Term Scientific Missions involving the authors which greatly contributed to the work. This support is greatly appreciated and acknowledged. We also acknowledge the contributions of the three anonymous reviewers of this paper who challenged us with many excellent suggestions for improvements to our original draft of the paper. We also acknowledge the contributions of hundreds of thousands of OpenStreetMap contributors to the OpenStreetMap project.

Author Contributions

Nikola Davidovic and Peter Mooney conceived and designed the experiments; Nikola Davidovic performed the experiments; Nikola Davidovic and Peter Mooney analyzed the data and then wrote the paper. Leonid Stoimenov and Marco Minghini contributed to the writing and structuring of the paper.

Conflicts of Interest

The authors declare no conflict of interest.

References

  1. See, L.; Mooney, P.; Foody, G.; Bastin, L.; Comber, A.; Estima, J.; Fritz, S.; Kerle, N.; Jiang, B.; Laakso, M.; et al. Crowdsourcing, citizen science or volunteered geographic information? The current state of crowdsourced geographic information. ISPRS Int. J. Geo-Inf. 2016, 5, 55. [Google Scholar] [CrossRef]
  2. Neis, P.; Zielstra, D. Recent developments and future trends in volunteered geographic information research: The case of OpenStreetMap. Future Int. 2014, 6, 76–106. [Google Scholar] [CrossRef] [Green Version]
  3. Barron, C.; Neis, P.; Zipf, A. A comprehensive framework for intrinsic OpenStreetMap quality analysis. Trans. GIS 2013. [Google Scholar] [CrossRef]
  4. Ballatore, A.; Mooney, P. Conceptualising the geographic world: The dimensions of negotiation in crowdsourced cartography. Int. J. Geogr. Inf. Sci. 2015, 29, 2310–2327. [Google Scholar] [CrossRef]
  5. Ballatore, A.; Zipf, A. A conceptual quality framework for Volunteered Geographic Information. In Spatial Information Theory; Springer International Publishing: New York, NY, USA, 2015; pp. 89–107. [Google Scholar]
  6. Mooney, P.; Corcoran, P. The annotation process in OpenStreetMap. Trans. GIS 2012, 16, 561–579. [Google Scholar] [CrossRef]
  7. OpenStreetMapWiki. The OpenStreetMap Map Features Wiki. Available online: http://wiki.openstreetmap.org/wiki/Map_Features (accessed on 29 August 2016).
  8. TagInfo. TagInfo: An OSM Service to Showing Statistics about which Tags are Actually in the OSM Database. Available online: https://taginfo.openstreetmap.org/ (accessed on 29 August 2016).
  9. Strohmaier, M.; Körner, C.; Kern, R. Understanding why users tag: A survey of tagging motivation literature and results from an empirical study. Web Semant. 2012, 17, 1–11. [Google Scholar] [CrossRef] [PubMed]
  10. Golder, S.A.; Huberman, B.A. Usage patterns of collaborative tagging systems. J. Inform. Sci. 2006, 32, 198–208. [Google Scholar] [CrossRef]
  11. Špiranec, S.; Ivanjko, T. Experts vs. novices tagging behavior: An exploratory analysis. Procedia Soc. Behav. Sci. 2013, 73, 456–459. [Google Scholar] [CrossRef]
  12. Comito, C.; Falcone, D.; Talia, D. Mining human mobility patterns from social geo-tagged data. Pervasive Mob. Comput. 2016, in press. [Google Scholar] [CrossRef]
  13. Simon, R.; Haslhofer, B.; Jung, J. Annotations, tags and linked data. Metadata enrichment in online map collections through Volunteer-Contributed Information. e-Perimetron 2011, 6, 129–137. [Google Scholar]
  14. Google Inc. Google Map Maker. Available online: https://www.google.com/mapmaker/ (accessed on 29 August 2016).
  15. Johnson, B.A.; Iizuka, K. Integrating OpenStreetMap crowdsourced data and Landsat time-series imagery for rapid land use/land cover (LULC) mapping: Case study of the Laguna de Bay area of the Philippines. Appl. Geogr. 2016, 67, 140–149. [Google Scholar] [CrossRef]
  16. Arsanjani, J.J.; Zipf, A.; Mooney, P.; Helbich, M. An introduction to OpenStreetMap in geographic information science: Experiences, research, and applications. In OpenStreetMap in GIScience; Arsanjani, J.J., Zipf, A., Mooney, P., Helbich, M., Eds.; Springer International Publishing: New York, NY, USA, 2015; pp. 1–15. [Google Scholar]
  17. Mooney, P.; Corcoran, P. Characteristics of heavily edited objects in OpenStreetMap. Future Int. 2012, 4, 285–305. [Google Scholar] [CrossRef]
  18. Juhasz, L.; Hochmair, H. Cross linkage between mapillary street level photos and OSM edits. In Geospatial Data in a Changing World: Selected Papers of the 19th AGILE Conference on Geographic Information Science; Sarjakoski, T., Santos, M.Y., Sarjakoski, T., Eds.; Springer: Helsinki, Finland, 2016; pp. 141–156. [Google Scholar]
  19. Quinn, S.; Yapa, L. OpenStreetMap and food security: A case study in the city of Philadelphia. Prof. Geogr. 2016, 68, 271–280. [Google Scholar] [CrossRef]
  20. El-Safty, A.; Schmitz, B.; Ertl, T. An OpenStreetMap editing interface for visually impaired users based on Geo-semantic information. In Computers Helping People with Special Needs; Miesenberger, K., Fels, D., Archambault, D., Peňáz, P., Zagler, W., Eds.; Springer International Publishing: New York, NY, USA, 2014; pp. 116–119. [Google Scholar]
  21. Wolfensberger, M.; Richter, K.F. A mobile application for a user-generated collection of Landmarks. In Web and Wireless Geographical Information Systems; Gensel, J., Tomko, M., Eds.; Springer International Publishing: New York, NY, USA, 2015; pp. 3–19. [Google Scholar]
  22. Neis, P.; Goetz, M.; Zipf, A. Towards automatic vandalism detection in OpenStreetMap. ISPRS Int. J. Geo-Inf. 2012, 1, 315–332. [Google Scholar] [CrossRef]
  23. Feick, R.; Robertson, C. A multi-scale approach to exploring urban places in geotagged photographs. Comput. Environ. Urban Syst. 2015, 53, 96–109. [Google Scholar] [CrossRef]
  24. TagInfo - The List of the Most Common Tags in the Database. Available online: https://taginfo.openstreetmap.org/tags (accessed on 1 December 2016).
  25. MapZen - Extracts of OpenStreetMap Data. Available online: https://mapzen.com/data/metro-extracts/ (accessed on 29 August 2016).
  26. osm2pgsql is a Command-Line Based Program that Converts OpenStreetMap Data to postGIS-enabled PostgreSQL Databases. Available online: http://wiki.openstreetmap.org/wiki/Osm2pgsql (accessed on 29 August 2016).
  27. OSM Wiki Page for Tag Amenity=Restaurant. Available online: http://wiki.openstreetmap.org/wiki/Tag:amenity=parking (accessed on 1 December 2016).
  28. Wikipedia. Likert Scale—Wikipedia, The Free Encyclopedia, 2016. Available online: https://en.wikipedia.org/wiki/Likertscale (accessed on 12 August 2016).
  29. Harpe, S.E. How to analyze Likert and other rating scale data. Curr. Pharm. Teach. Learn. 2015, 7, 836–850. [Google Scholar] [CrossRef]
  30. OSM Map Features. The OSM Map Features Wiki Page Leisure=Pitch, 2016. Available online: http://wiki.openstreetmap.org/wiki/Tag:leisure=pitch (accessed on 29 August 2016).
  31. OSM Wiki Page for Key Oneway. Available online: http://wiki.openstreetmap.org/wiki/Key:oneway (accessed on 1 December 2016).
  32. OpenStreetMapWiki. The Path Controversy. Available online: http://wiki.openstreetmap.org/wiki/Pathcontroversy (accessed on 29 August 2016).
  33. Corcoran, P.; Mooney, P.; Bertolotto, M. Analysing the growth of OpenStreetMap networks. Spat. Stat. 2013, 3, 21–32. [Google Scholar] [CrossRef]
  34. Mooney, P.; Minghini, M.; Stanley-Jones, F. Observations on an OpenStreetMap mapping party organised as a social event during an open source GIS conference. Int. J. Spat. Data Infrastruct. Res. 2015, 10, 138–150. [Google Scholar]
  35. Hecht, R.; Kunze, C.; Hahmann, S. Measuring completeness of building footprints in OpenStreetMap over space and time. ISPRS Int. J. Geo-Inf. 2013, 2, 1066–1091. [Google Scholar] [CrossRef]
  36. Kunze, C.; Hecht, R. Semantic enrichment of building data with volunteered geographic information to improve mappings of dwelling units and population. Comput. Environ. Urban Syst. 2015, 53, 4–18. [Google Scholar] [CrossRef]
  37. Zielstra, D.; Hochmair, H.H.; Neis, P.; Tonini, F. Areal delineation of home regions from contribution and editing patterns in OpenStreetMap. ISPRS Int. J. Geo-Inf. 2014, 3, 1211–1233. [Google Scholar] [CrossRef]
  38. Davidovic, N.; Mooney, P. Patterns of tagging in OpenStreetMap data in urban areas. In Proceedings of GISRUK 2016; Warboys, M., Wood, Z., Eds.; University of Greenwich: London, UK, 2016; pp. 30–35. Available online: http://www.cs.nuim.ie/~pmooney/websitePapers/GISRUK2016-patterns-tagging-openstreetmap.pdf (accessed on 29 August 2016).
  39. Jonietz, D.; Zipf, A. Defining fitness-for-use for crowdsourced points of interest (POI). ISPRS Int. J. Geo-Inf. 2016. [Google Scholar] [CrossRef]
  40. Gröchenig, S.; Brunauer, R.; Rehrl, K. Digging into the history of VGI data-sets: Results from a worldwide study on OpenStreetMap mapping activity. J. Locat. Based Serv. 2014, 8, 198–210. [Google Scholar] [CrossRef]
  41. Mooney, P.; Corcoran, P. Analysis of interaction and co-editing patterns amongst OpenStreetMap contributors. Trans. GIS 2014, 18, 633–659. [Google Scholar] [CrossRef]
  42. Wu, D.; He, D.; Qiu, J.; Lin, R.; Liu, Y. Comparing social tags with subject headings on annotating books: A study comparing the information science domain in English and Chinese. J. Inform. Sci. 2013, 39, 169–187. [Google Scholar] [CrossRef]
  43. Joorabchi, A.; English, M.; Mahdi, A.E. Automatic mapping of user tags to Wikipedia concepts: The case of a Q&A website—StackOverflow. J. Inform. Sci. 2015, 41, 570–583. [Google Scholar]
  44. Carman, M.J.; Baillie, M.; Gwadera, R.; Crestani, F. A Statistical Comparison of Tag and Query Logs. In Proceedings of the 32nd International ACM SIGIR Conference on Research and Development in Information Retrieval (SIGIR ’09), Boston, MA, USA, 19–23 July 2009; ACM: New York, NY, USA, 2009; pp. 123–130. [Google Scholar]
  45. Harvey, M.; Carman, M.; Elsweiler, D. Comparing tweets and tags for URLs. In Advances in Information Retrieval; Baeza-Yates, R., Vries, A.P.D., Zaragoza, H., Cambazoglu, B.B., Murdock, V., Lempel, R., Silvestri, F., Eds.; Springer: Berlin, Germany, 2012; pp. 73–84. [Google Scholar]
  46. Muller, M.J. Comparing tagging vocabularies among four enterprise tag-based services. In Proceedings of the 2007 International ACM Conference on Supporting Group Work (GROUP ’07), Sanibel Island, FL, USA, 4–7 November 2007.
  47. Graham, M.; Shelton, T. Geography and the future of big data, big data and the future of geography. Dialogues Hum. Geogr. 2013, 3, 255–261. [Google Scholar] [CrossRef]
  48. Stonebraker, M.; Çetintemel, U.; Zdonik, S. The 8 requirements of real-time stream processing. SIGMOD Rec. 2005, 34, 42–47. [Google Scholar] [CrossRef]
Figure 1. In this screenshot from the Map Features page for amenity=restaurant, a number of suggested tag keys which could be combined with this tag are provided.
Ijgi 05 00232 g001
Figure 2. In this screenshot from the TagInfo page for amenity=restaurant, a number of co-occurring keys that are combined with this tag are provided.
Ijgi 05 00232 g002
Figure 3. A flowchart of the methodology used to process the OpenStreetMap (OSM) data for candidate cities and urban areas for the selected tags.
Ijgi 05 00232 g003
Figure 4. A map showing the locations of the 40 cities and urban areas that were used in the analysis for this paper.
Ijgi 05 00232 g004
Table 1. This table displays the 10 tags which we selected from 30 of the most frequently occurring OSM tags according to TagInfo. The selected tags in the table qualify under the selection criteria outlined in Section 3.1. The overall TagInfo ranking is provided with the number of objects in the global OSM database, which contains the corresponding target tag.
Target TagTagInfo RankingNumber of Objects
highway=residential234,688,039
natural=tree177,019,552
highway=footway186,126,861
highway=path244,506,593
highway=tertiary254,328,513
amenity=parking522,061,012
highway=primary591,869,021
highway=bus_stop661,677,724
railway=rail691,584,142
leisure=pitch93977,983
Table 2. The compliance of objects with the suggested tagging in the OSM Map Features wiki page for the target tag leisure=pitch is shown for Christchurch, New Zealand.
Report for Tag: leisure=pitch
Total number of objects: 470
sport36477.5%GOOD
surface429.0%POOR
Total number of different tags used: 26
Table 3. The compliance of objects with the suggested tagging in the OSM Map Features wiki page for the target tag railway=rail is shown for Warsaw, Poland.
Report for Tag: railway=rail
Total number of objects: 2922
name67 2.3 % POOR
gauge2510 86.0 % EXCELLENT
electrified2445 83.7 % EXCELLENT
frequency1619 55.4 % AVERAGE
voltage1623 55.6 % AVERAGE
usage1076 36.9 % FAIR
service1913 65.5 % GOOD
bridge289 9.9 % POOR
tunnel61 2.1 % POOR
Total number of different tags used: 30
Table 4. Summary of compliance of all cities with suggested tag key combinations for the target tag highway=residential.
KEYPoorFairAverageGoodExcellent
name817519
oneway345100
Table 5. Summary of compliance of all cities with suggested tag key combinations for the target tag natural=tree.
KEYPoorFairAverageGoodExcellent
circumference380101
taxon380002
leaf_type342211
start_date390010
height370102
denotation361201
genus381100
species351202
Table 6. Summary of compliance of all cities with suggested tag key combinations for the target tag highway=footway.
KEYPoorFairAverageGoodExcellent
lit391000
name391000
footway372100
wheelchair400000
surface327100
access400000
Table 7. Summary of compliance of all cities with suggested tag key combinations for the target tag highway=path.
KEYPoorFairAverageGoodExcellent
sac_scale391000
mtb:scale400000
access400000
width400000
surface1914700
trail_visibility391000
smoothness400000
Table 8. Summary of the compliance of all cities with suggested tag key combinations for the target tag highway=tertiary.
KEYPoorFairAverageGoodExcellent
lanes267322
ref315220
name1451317
oneway6161260
Table 9. Summary of compliance of all cities with suggested tag key combinations for the target tag amenity=parking.
KEYPoorFairAverageGoodExcellent
fee373000
capacity400000
name372100
access2411500
maxstay400000
operator400000
Table 10. Summary of compliance of all cities with suggested tag key combinations for the target tag highway=primary.
KEYPoorFairAverageGoodExcellent
lanes1010668
ref8106214
name0241024
Table 11. Summary of compliance of all cities with suggested tag key combinations for the target tag highway=bus-stop.
KEYPoorFairAverageGoodExcellent
operator284233
public_transport217534
name343921
Table 12. Summary of compliance of all cities with suggested tag key combinations for the target tag railway=rail.
KEYPoorFairAverageGoodExcellent
bridge2911000
name2110630
service7151170
tunnel400000
electrified588514
frequency224581
gauge445522
voltage224581
usage1711660
Table 13. Summary of compliance of all cities with suggested tag key combinations for the target tag leisure=pitch.
KEYPoorFairAverageGoodExcellent
sport0271615
surface400000
Table 14. Summary of all 40 cities in terms of the Likert Scale value for all target tags and suggested keys. “Total LV” is the number of keys multiplied by the number of cities.
TagKeysTotal LVPoorFairAverageGoodExcellent
highway=primary312015.0018.3313.3315.0038.33
highway=tertiary416040.0020.0013.7514.3811.88
highway=bus-stop312043.3312.508.3312.5023.33
railway=rail936046.3918.6112.7811.6710.56
leisure=pitch28050.002.508.7520.0018.75
highway=residential28052.507.5010.006.2523.75
amenity=parking624090.836.672.500.000.00
highway=path728091.785.712.500.000.00
natural=tree832092.191.562.810.622.81
highway=footway624094.584.580.830.000.00
Table 15. The most frequently occurring tag keys with the natural=tree target tag for three cities.
CityCo-Occurring Tag KeysPercentage of Objects
Viennadenotation, species, species:de, taxon, tree:ref 90 %
Dusseldorfdenotation, genus, genus:de, object:street 33 %
Londonleaf-cycle, leaf-type, note, species 23 %

