1. Introduction
Over the past 30 years, a global warming of 0.2 °C per decade has been detected [
1]. The significant increase in temperature in the Arctic and Antarctic regions is contributing to global sea level rise, which greatly influences the living environment and socioeconomic settings of human beings living near the current mean sea level [
2]. According to Mitrovica
et al. [
3], the melting of the Greenland ice complex is equivalent to 0.6 mm·year
−1 of sea level rise over the last century. More recently, Shepherd
et al. [
4] reported that the total contribution of the polar ice sheets to sea level rise has been 0.59 ± 0.20 mm·year
−1 on average since 1992 using satellite altimetry, interferometry, and gravimetry datasets, with the current rate being about 1 mm·year
−1. As a consequence, it is important to measure the surface velocity, mass and surface elevation of the Arctic and Antarctic ice sheets in order to model and simulate how they will respond to a warming climate, and to predict their contribution to sea level rise [
5].
The Center for Remote Sensing of Ice Sheets (CReSIS), with the mission of developing new technologies and computer models to measure and predict the response of sea level change to the mass balance of ice sheets in the Arctic and Antarctic, collects much-needed data relevant to ice sheets and the rapid changes they are undergoing. Large amounts of geospatial data have been collected or generated from remote sensors for the advanced monitoring and investigation of the polar environment at CReSIS. Since 1993, CReSIS, or precursor groups to CReSIS, have collected over 1000 TB of raw data in the Arctic and Antarctic using a suite of radars developed at the center. The delivery of this dataset is one of the core duties of CReSIS. As a distributor of such an important dataset to the cryosphere community, and to the broader field of climate research, simplifying the process of data retrieval for data users and streamlining the process of data creation for the scientists and staff at CReSIS are two important and unresolved goals.
Over the last few decades, the implementation of spatial data infrastructure (SDI) has facilitated access to geospatial data for a large number of users [
6]. The SDI offers an environment which enables a wide range of potential users to acquire and maintain geographic datasets easily in a secure, consistent, and complete manner [
7]. It provides the opportunity to disseminate and share rich geo-information over the web, and to rapidly integrate and use geospatial datasets [
8]. In the GIS (geographic information system) community, standards and free and open source software (FOSS) development falls under the umbrella of open GIS, which was initially promoted by the Open GIS Consortium [
6,
9,
10].
Open source software tools, however, do not always work well in highly demanding systems because of the lack of official support and debugging issues [
11], which makes it so that open source web GIS applications sometimes only serve as experiments. As a result, it is important to develop and test open source web GIS applications with real-world large geospatial data. Recently, several such infrastructures have been implemented. Gkatzoflias
et al. [
11] examined the development of an open source web GIS application which generates and distributes maps and files as part of an emission inventory system. Delipetrev
et al. [
12] developed a web application to manage, present, store, model and optimize geospatial water resources based on open source software. Zavala-Romero
et al. [
13] implemented the open source Open Web GIS (OWGIS) that can display multi-dimensional geospatial data from distinct map servers. Those web GIS applications showed the success of open source software tools in different research fields. Our research presents yet another example which shows that open source software and technologies could be used to develop a robust and integrative web application serving diverse geospatial data for the cryosphere research community based on the previous studies.
In the cryosphere community, there are two primary data access systems: PolarGrid Cloud GIS (
http://www.polargrid.org/cloud-gis-service.html) and the National Snow and Ice Data Center (NSIDC) Operation Ice Bridge (OIB,
http://nsidc.org/icebridge/portal/). However, the PolarGrid Cloud GIS is not open to public. The NSIDC OIB portal is mainly used to browse the polar data products, including flight reports and flight geometries, and users can use the File Transfer Protocol (FTP) site, OGC services and encodings such as WMS, WFS, GML, and KML to access NSIDC data products.
In this work, the authors present a new system, Open Polar Server (OPS), which offers a resolution to the unresolved goals. The primary goal of this work is to develop a free and open source infrastructure capable of storing, managing, creating, analyzing, and distributing the dataset collected by CReSIS in a way that provides an improved experience for both the users and primary producers of the data. A secondary goal is to design the OPS in a way that allows the entire cryosphere community to provide new datasets for inclusion in the system. To achieve the secondary goal, special attention was paid to standardization and generalization of the custom OPS components.
The motivation for this research, including the geospatial datasets and the data storage and distribution issues, is described in
Section 2. The open-source architecture and development is discussed in
Section 3. An evaluation on OPS is presented in
Section 4. An example application of the data provided by the OPS is presented in
Section 5. A summary of the research and possible future work is provided in
Section 6.
2. Research Motivation for the OPS Project
CReSIS has been collecting, storing, managing, and distributing polar data since 1993. Several data management systems existed prior to the OPS. This section describes data storage and distribution systems of the pre-OPS and discusses issues with these systems, and then presents the research objectives of this article.
2.1. Data
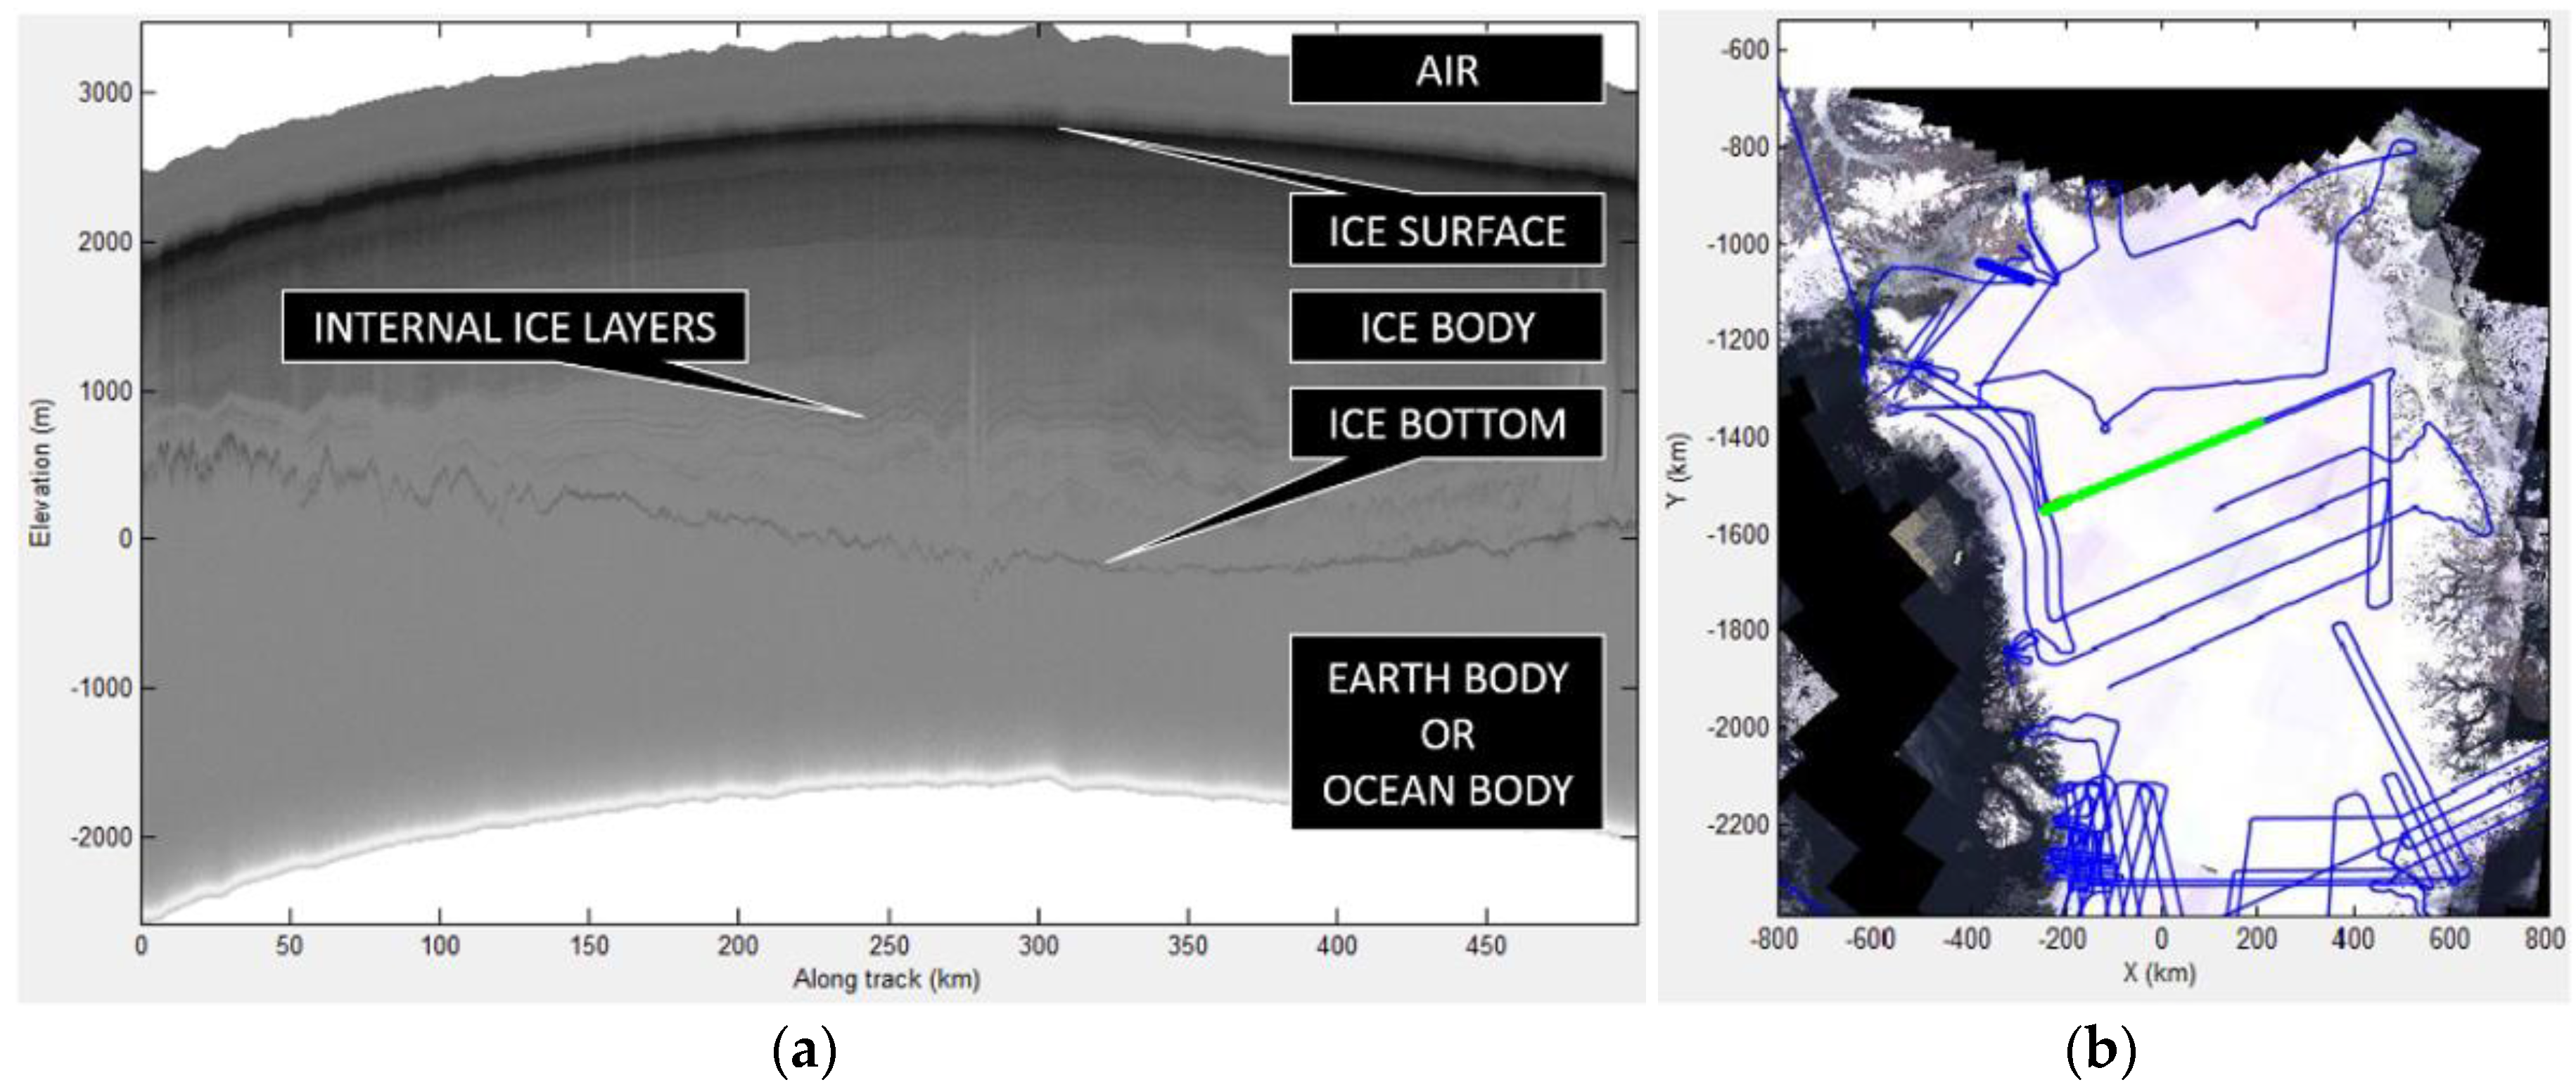
CReSIS is the primary data contributor to the OPS. Most of the CReSIS datasets are in the form of radar echograms showing 2-D cross sections of the Arctic and Antarctic ice sheets. Radar echograms are designated as Level 1B (L1B) data defined by NASA as “data that have been processed to sensor units”. They offer a data product from which usable information can be extracted, including the position of the ice surface, ice bottom and, optionally, internal ice layers (
Figure 1). The extraction process (digitization) is completed using the Data Picker application, a custom MATLAB software package developed at CReSIS for manual and automatic extraction of the ice layers. The Data Picker application existed prior to the development of the OPS and was originally built to support the extraction of only ice surface and bottom layers with data stored in flat files: MATLAB files loaded directly over a local network at CReSIS. The version presented here is a major redesign of the application which allows the extraction of any layers and performs CRUD (create, read, update, and delete) services on the OPS
via the OPS MATLAB API. The OPS MATLAB API will be further illustrated in
Section 3. The application generates a dataset of points, each with a set of attributes. These points are designated as Level 2 (L2) data defined by NASA as “derived geophysical variables at the same resolution and location as Level 1 source data”. The primary L2 data products from CReSIS are the ice surface, ice bottom, and the resulting ice thickness extracted from radar echograms.
A major community contribution to the dataset that is supported by the OPS is the digitization of internal ice layers from CReSIS radar echograms. Prior to the development of the OPS, only the digitized ice surface and ice bottom were natively supported within the CReSIS systems. With the transition to the OPS, any digitized layer (including multiple versions of the same layer) can be included. This allows any member of the cryosphere community to include their own layers derived from CReSIS radar echograms. Using a single infrastructure to store, manage, analyze, and distribute community derived data allows for simplified comparison and fosters collaboration between previously disconnected research groups.
In addition to the datasets derived from radar echograms, the OPS also maintains a collection of vector and raster reference data. The reference datasets include imagery, velocity data, bedrock elevation models, and coastline data.
2.2. Data Storage and Issues
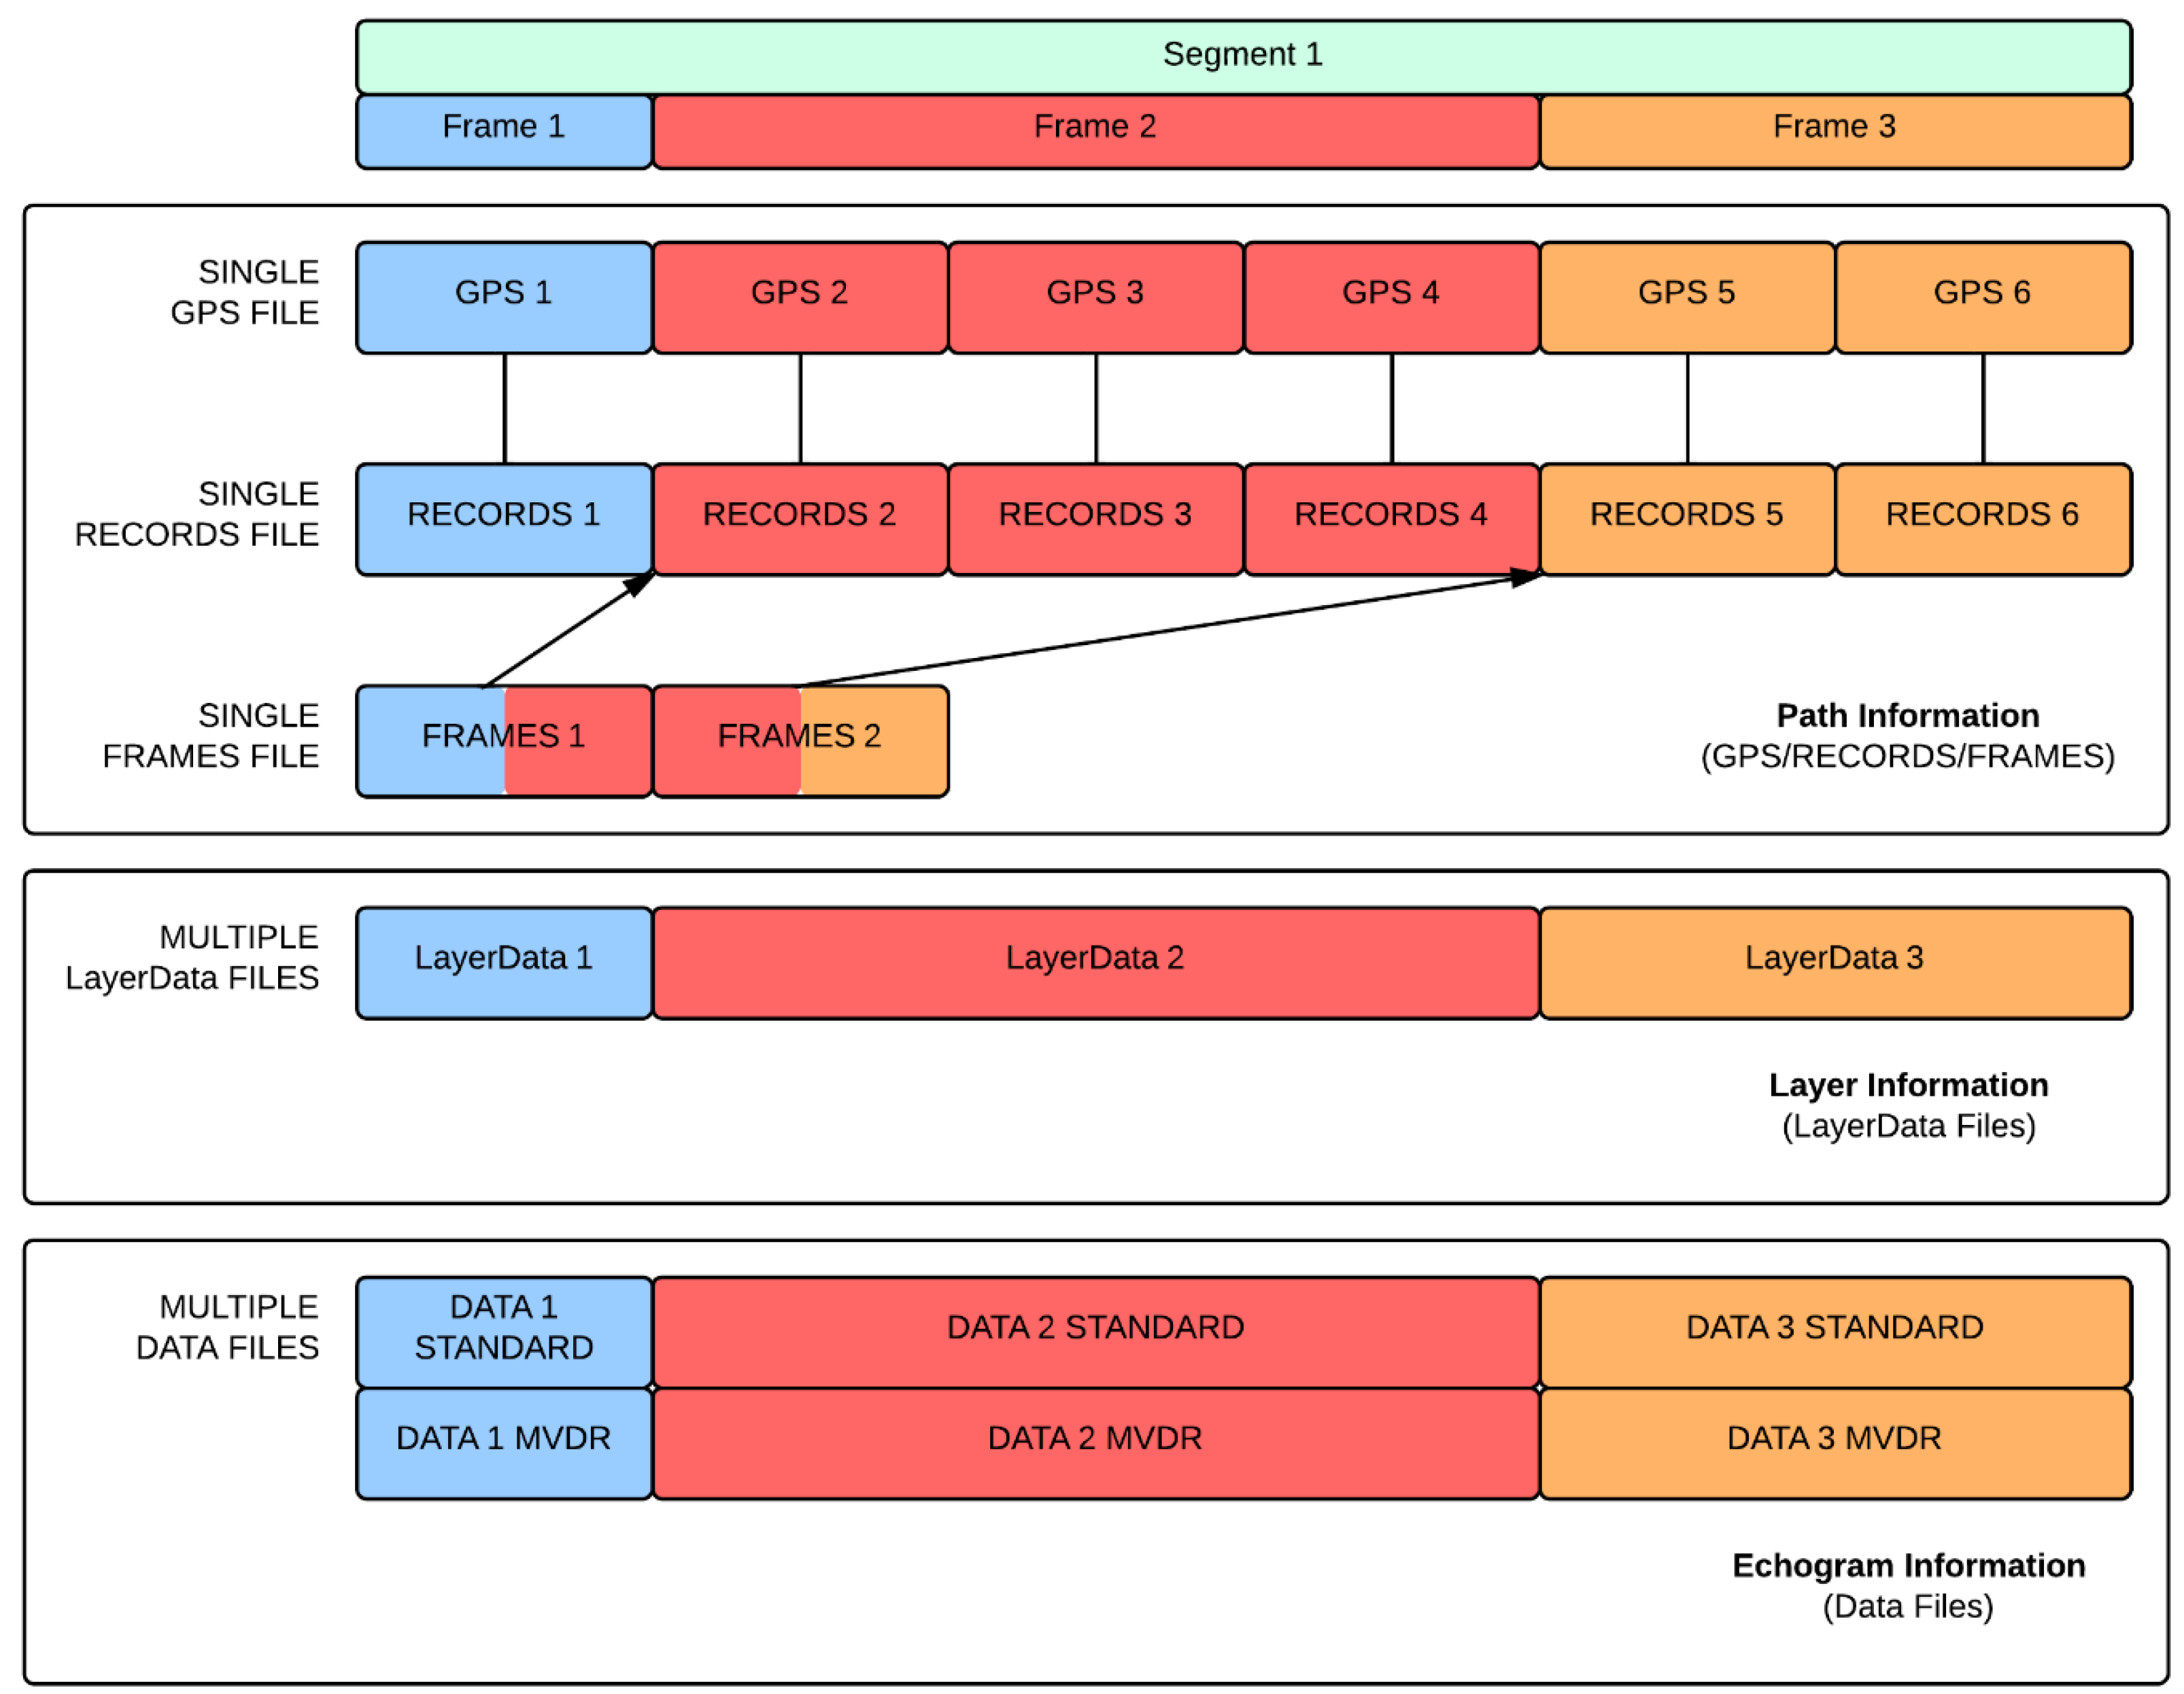
The primary data storage format for CReSIS L1B and L2 datasets is the MATLAB binary file format commonly referred to as a MAT file because of their .mat extension. CReSIS chose this format as its primary data storage container because all of the data processing, digitization (picking), and analysis is performed using MATLAB. CReSIS designates two primary types of MAT files: DATA files and LayerData files. The DATA files store the L1B radar echogram values and the LayerData files store the L2 ice surface and bottom layers. Data collected at CReSIS is organized by days and then each day is divided into segments. Each segment is further divided into frames. There is a minimum of one LayerData file per frame, but there can be more if additional layers are extracted from radar echograms. In addition to the two primary files, CReSIS also stores additional information about the data collection path geometries in the MAT file format. The data collection paths or tracks are referred to as flightlines and are stored in MAT files called GPS, RECORDS, and FRAMES files. There is a single GPS file per flight or mission and a single RECORDS file and a single FRAMES file per data segment. A data segment is defined as a track of continuously collected data, and there may be multiple data segments per mission. GPS files store time and position data from the onboard GPS instruments. RECORDS files store time and position data synchronized to the sensor. FRAMES files store the indices of data in records files marking the subdivision of segments into frames.
Figure 2 shows a graphical representation of the GPS, RECORDS, FRAMES, DATA, and LayerData files for a single segment of data.
Each frame (the smallest along-track division of CReSIS data) is stored on-disk as a collection of two or more MAT files. These files stored positional information of the aircraft during collection, the digitized layer points, raw radar echogram data, and more. For a typical field campaign (there are generally a few campaigns per year), there would be approximately 1500 frames, resulting in at least 3000 files on disk. In addition to these MAT files, a number of other data output formats, including CSV, JPEG, OGC KML Version 2.2 [
14], OGC NetCDF Version 1.0 [
15] and others, are required by data users. These output files are generally created per frame meaning an output dataset from CReSIS would contain approximately 10,000 files. This collection of files results in several hundred gigabytes (GB) on disk (excluding raw data) for a typical mission.
While file-based storage is good for small datasets stored locally, it has many disadvantages, some of which are: (1) additional libraries/code are required to load, process, and analyze each file format; (2) related data stored in separate files must be loaded to make comparisons; (3) files require additional software to manage data access and record data edits; (4) one file cannot be used and modified by more than one user at a time; (5) most file formats do not support data indexing which can improve data access and analysis performance; and (6) data must be replicated in order to store different file formats.
2.3. Data Distribution and Issues
Prior to the OPS, the distribution of the CReSIS file-based dataset was handled using a site supported by the FTP. Two FTP sites allowed users access to the data: the CReSIS FTP and the NSIDC data archive. The FTP sites offer a simple web-based exposure of the on-disk, file-based dataset. While the CReSIS FTP is just an exposure of the CReSIS on-disk storage, the NSIDC data archive site includes catalog pages and a more advanced navigational schema.
The issue of retrieving data directly from an FTP website is worth examining. Let us imagine the following common data access task: using the CReSIS FTP site to download all ice thickness data in a specified region. If a user were to follow the KML search approach to download CReSIS data from 1993–2013 in the Petermann glacier region, they would first need to download approximately 170 GB of posted KML files, then find approximately 360 unique segment IDs and finally navigate to approximately 10 different directories on the FTP site to download the 360 unique files in one of the formats provided (e.g., MAT, CSV, NetCDF). Following the download they would need to merge all of the downloaded data and subset the resulting dataset to their specific study area. As a consequence, it is both time-consuming and tedious for researchers to retrieve such large datasets for further scientific research using the FTP data distribution site.
2.4. Project Objectives
It should now be clear what problems were faced by CReSIS prior to the development of the OPS infrastructure. Given the inadequacy of the systems readily available to CReSIS for data storage and distribution, the primary goal of the OPS project is to develop a free and open source infrastructure capable of storing, managing, creating, analyzing, and distributing the datasets collected by CReSIS in a way that provides an improved experience for both end users and the primary producers of polar remote sensing data. From this goal, a set of clear objectives are identified for the OPS: (1) develop a database to replace file-based storage; (2) develop a web-based data retrieval system (geoportal); (3) develop an API for interaction between MATLAB and the new system to streamline data processing; (4) make the infrastructure public and include community-derived datasets; and (5) share the free and open source software with the community.
3. Architecture and Implementation of the OPS Infrastructure
The definition of a SDI and the components a SDI should contain have been explored and discussed many times [
6,
16,
17]. A SDI can be defined more simply as the collection of software, hardware, and custom code needed to provide basic data services such as storage, management, analysis, and distribution to both data users and data producers. The software, hardware, and code that is needed varies based on the data, management, and distribution requirements of an organization. The following sections outline the required and custom components of the OPS infrastructure. It should be noted here that all of the components created or used in the OPS, except for MATLAB, are free and open source according to the Open Geospatial Consortium (OGC) [
18] community services and standards [
18,
19,
20]. In the selection of open source SDI components an attempt was made to follow the guide presented by Steiniger and Hunter [
6]. However, it often becomes clear that specific software packages are the obvious (and sometimes only) choice in their respective categories.
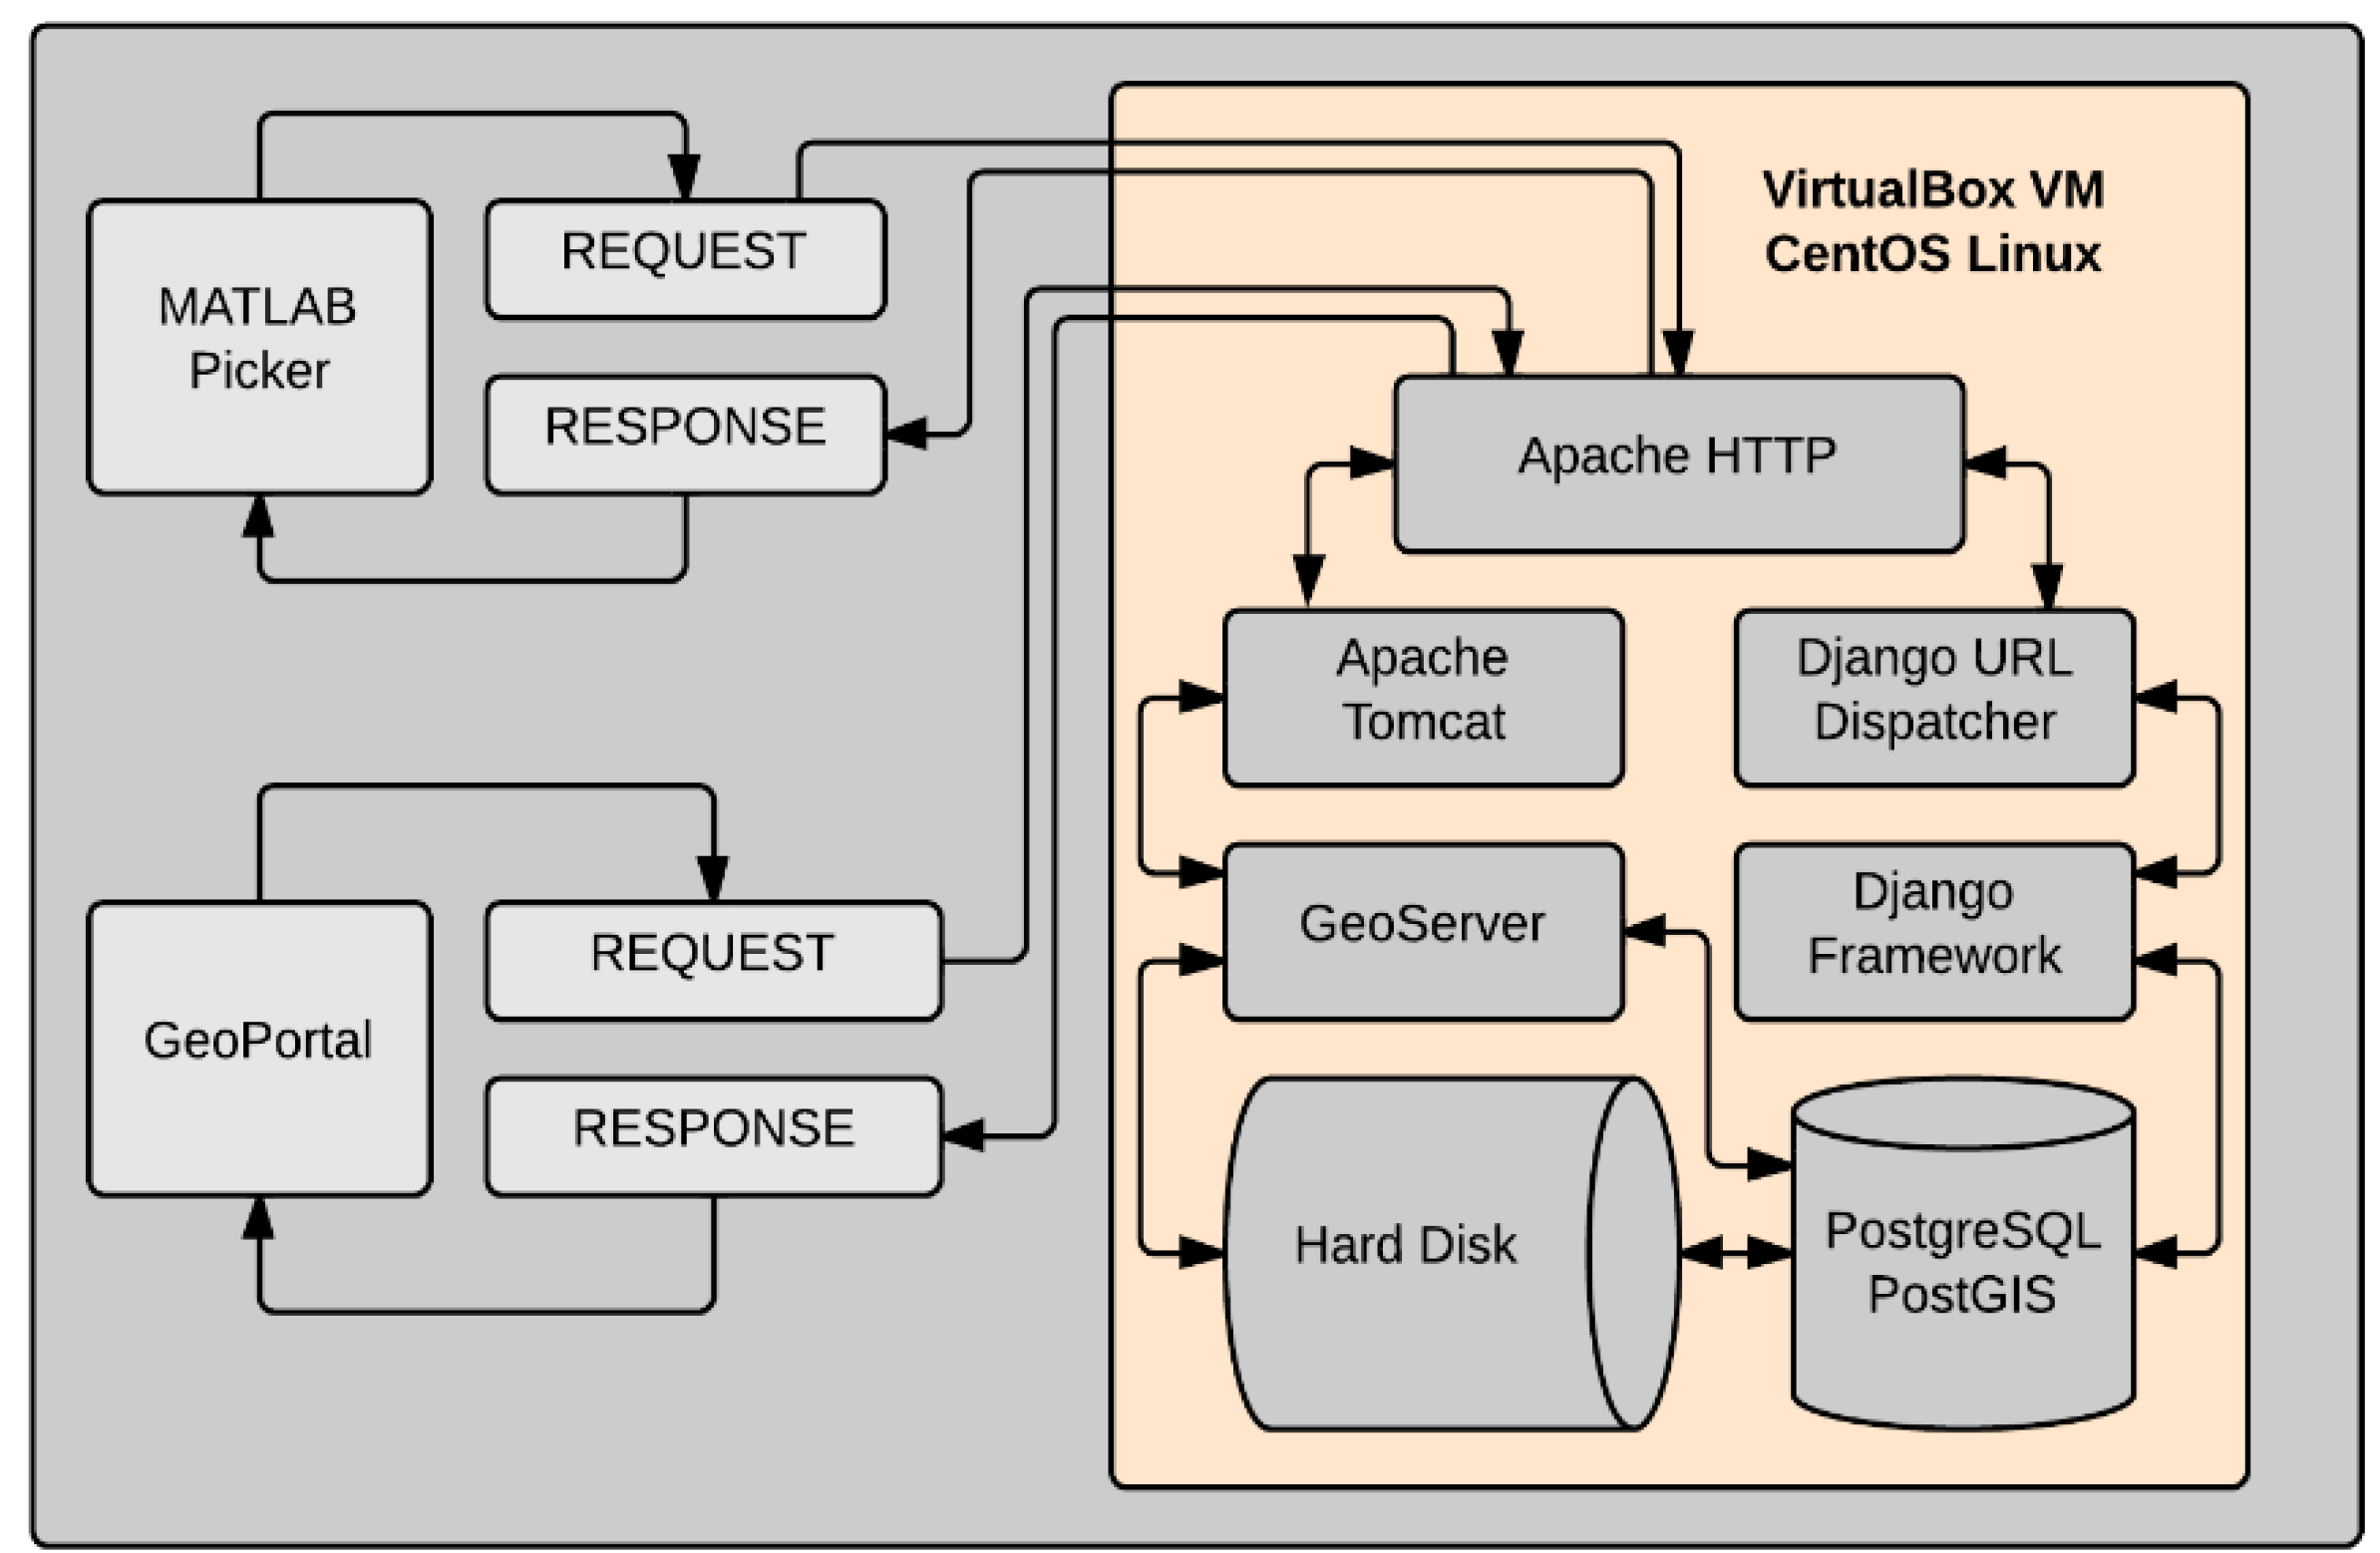
Figure 3 shows the conceptual structure of the OPS, and
Figure 4 presents the actual software chosen to fill the roles of the components in
Figure 3. The arrows demonstrate the communication and interaction among the various components of the OPS.
Table 1 summarizes the specific software and its corresponding version.
3.1. Schema Design
A relational database management system (RDBMS) provides solutions to all of the disadvantages of file based storage. With data from many files stored in a database, the power of the structured query language (SQL) can be used to simplify data access and analysis. Data in a database can take advantage of various indexing methods which allow SQL to quickly search for and find data, resulting in a significant performance gain. The combination of PostgreSQL [
21] and PostGIS [
22] is chosen to build a database named OPS to store both spatial and non-spatial data. PostgreSQL is a powerful, open source object-relational database system. PostGIS is chosen as the spatial database extender for PostgreSQL and adds support for spatial indexing and queries in SQL.
The complete OPS database schema is shown in the form of an entity-relationship (ER) diagram in
Figure 5. The major goal of the database design process is to improve query efficiency while minimizing data redundancy in the database. When the OPS was developed, there were four different radar systems at CReSIS: radar depth sounders (rds), accumulation radar (accum), snow radar (snow), and kuband radar (kuband). In
Figure 5, “sys” in the table name represents one of the four different radar systems. The table sys_locations includes two records, “Arctic” and “Antarctic”. The table sys_radars records the specific radars used for data collection such as “mcrds”, “mcords”, and “wise” for the rds radar system. The table sys_seasons records the different data collection season names, such as “2014_Greenland_P3”, “2013_Antarctica_Basler”, and so forth. The table sys_layers records the different layers of the ice sheets, including “surface”, “bottom”, and other internal ice layers. The table sys_point_paths stores the points along the flight lines with their geographic locations and a variety of attributes. The table sys_layer_points records the attributes of the points in different layers along specific point paths in the sys_point_paths table. The table sys_crossovers stores the geographic location of points where flight lines cross each other, and the two nearest point paths to the crossover point. The table sys_landmarks records the location and attributes of a variety of important features such as buried lakes, data artifacts, and points of interest. The table sys_segments and sys_frames store the basic information of segments and frames. Furthermore, four tables, opsuser_userprofile_sys_season_groups, opsuser_userprofile_sys_layer_groups, opsuser_userprofile, and auth_user, are created to manage the authentication of different users for the Data Picker to execute the CRUD tasks.
3.2. Mapping Server
The mapping server is designed to generate a variety of georeferenced spatial data formats for return via standard web services. The mapping server serves geospatial data from both the hard drive and database to the Internet (via the WAS) through different standard services such as Web Map Service (WMS), Web Feature Service (WFS), Web Map Tile Service (WMTS), and others. The OPS map server primarily uses the WMS, which is a protocol that defines request and response structures. A quality open source mapping server typically implements OGC-compliant services because most web clients will expect a response in the OGC standard. GeoServer [
23] is chosen for the OPS because it is free and open source and is the reference implementation for the OGC web services standards. The role of GeoServer in the OPS is to take geospatial data from the server hard drive and database and generate georeferenced map images.
3.3. Web Data Portal (Geoportal)
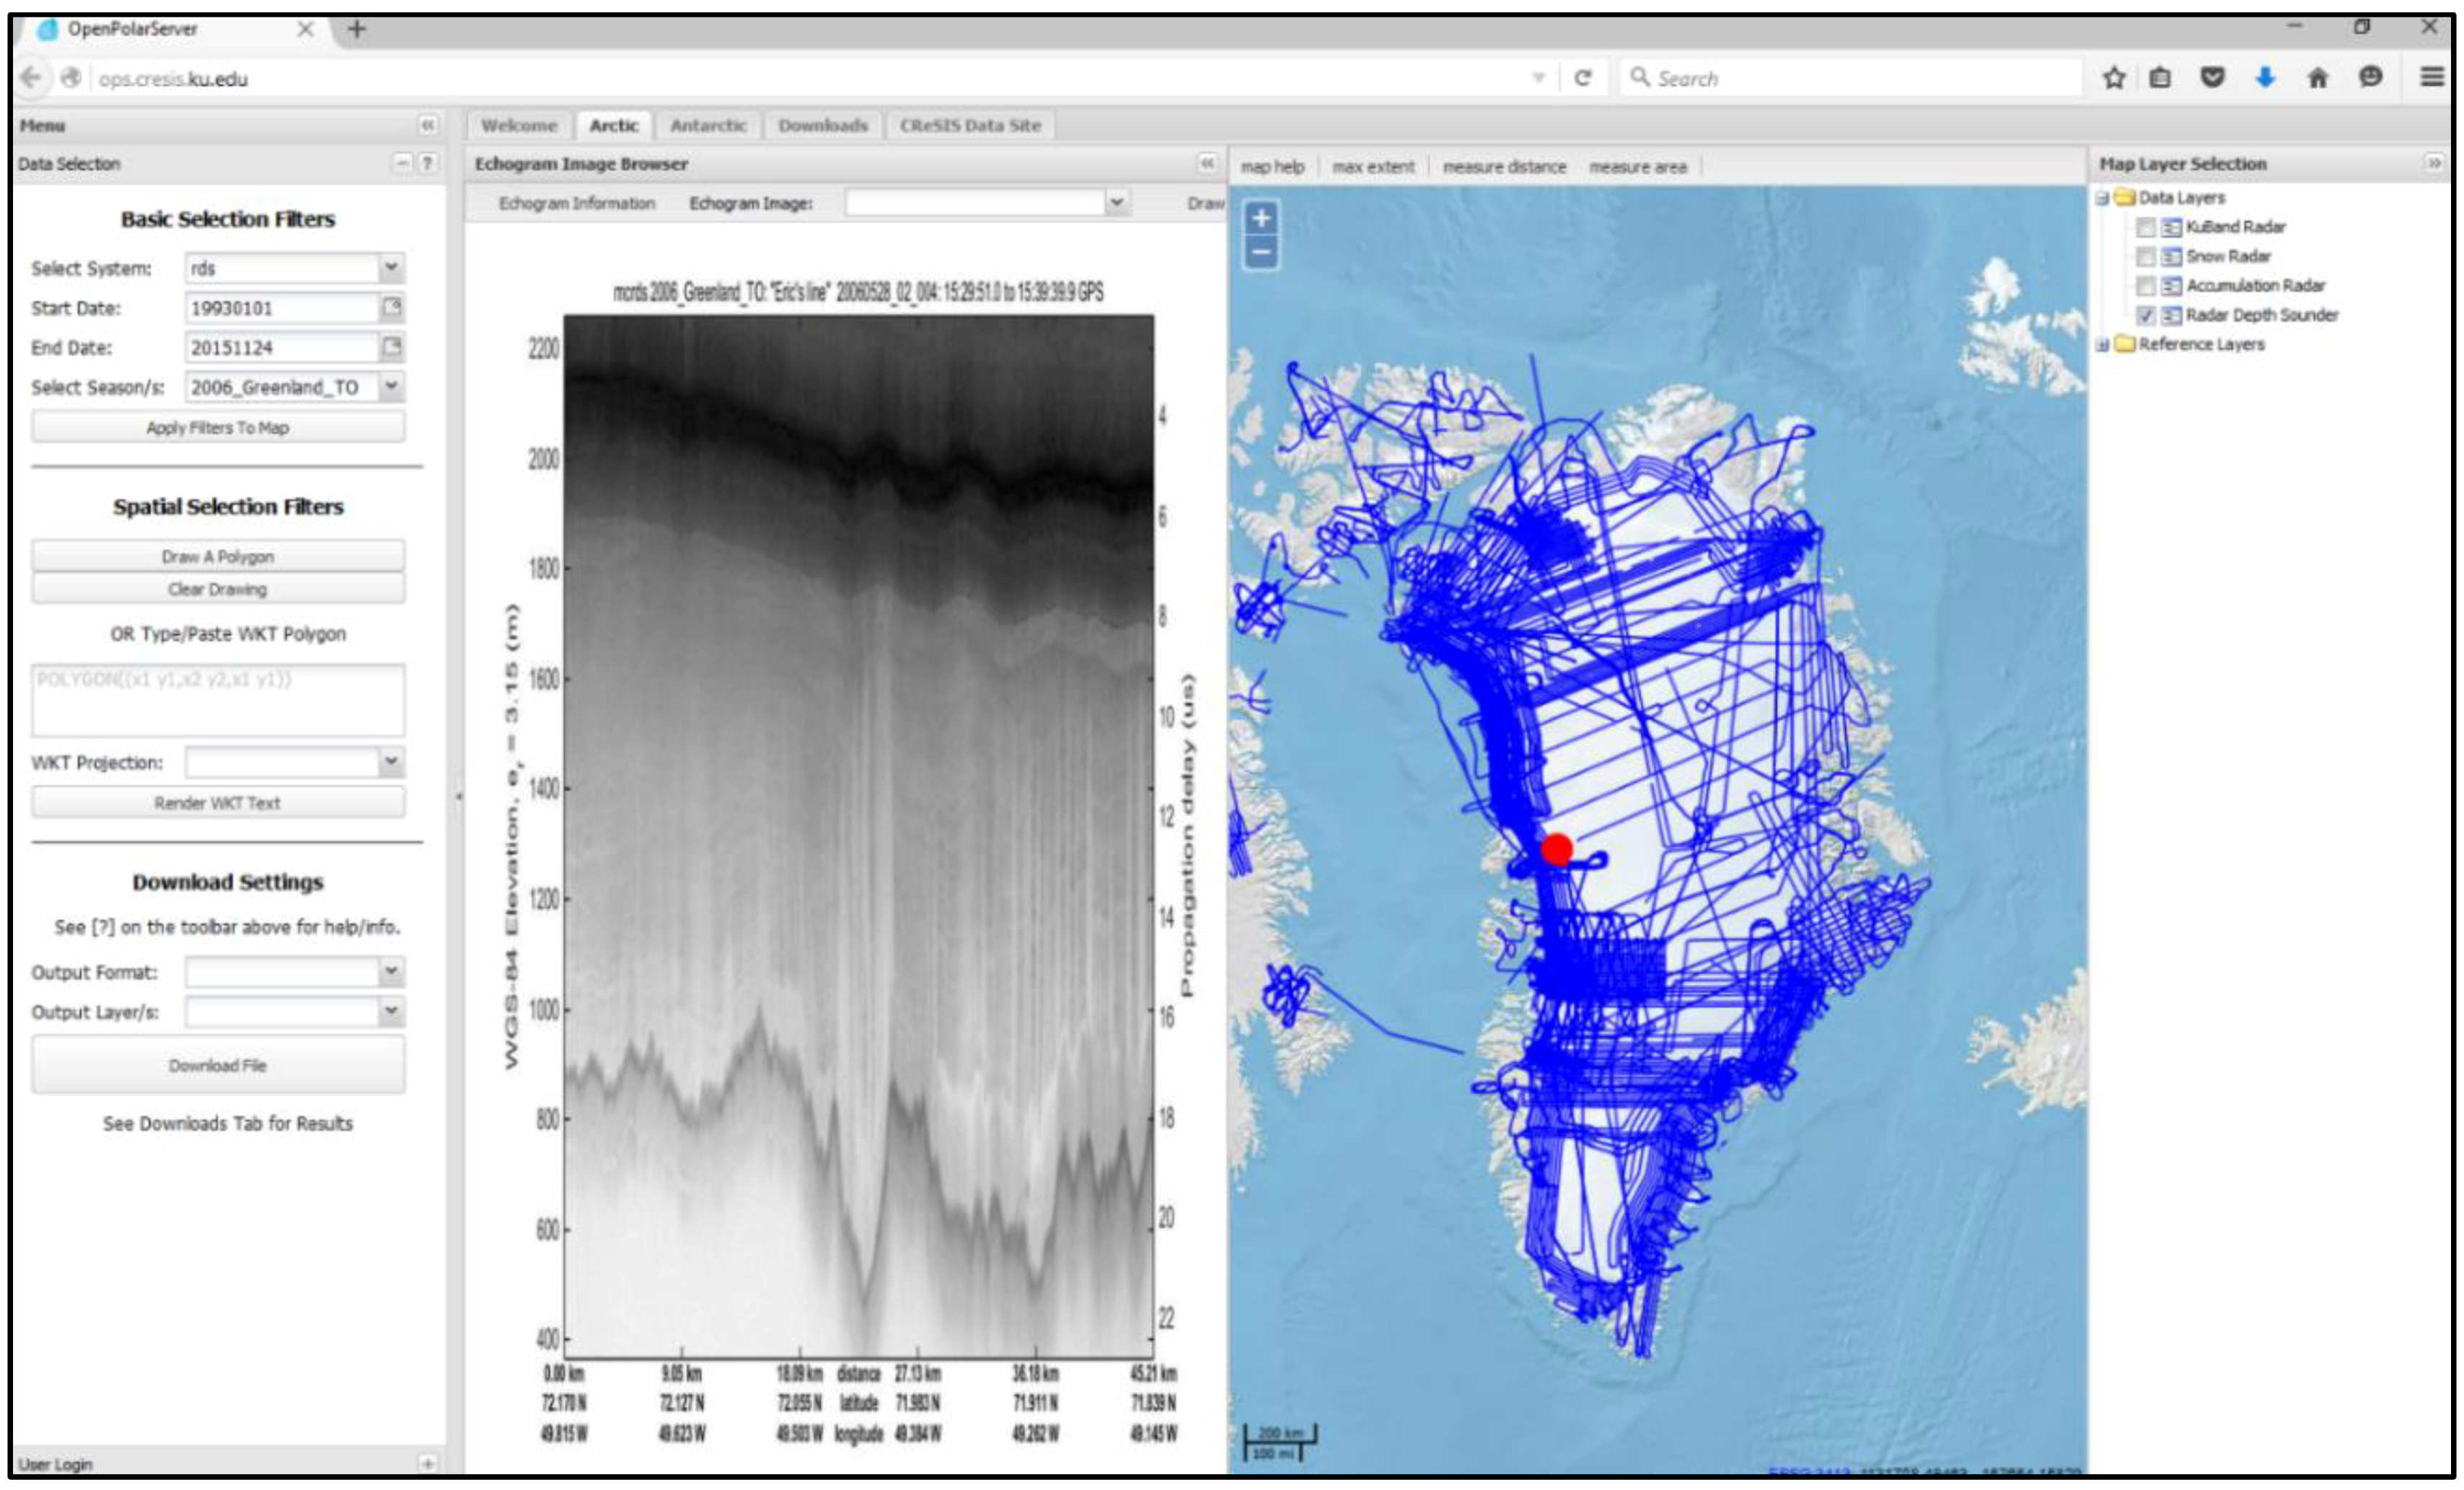
The OPS geoportal (
Figure 6) is a JavaScript web application that is designed with the discovery and download of CReSIS data as its primary function. The discovery of geographic content is the primary role of a geoportal [
24]. The OPS geoportal is a complete MVC (Model View Controller) application developed using the Sencha ExtJS framework [
25], which is an application development platform with cross-browser compatibility, advanced MVC architecture, and a sleek modern user interface (UI). ExtJS is distributed freely for applications that are FOSS, which means commercial developers must purchase ExtJS but open source developers can use it free of charge. While the ExtJS library contains a vast number of tools and methods it does not contain a native solution for map based content. An additional open source library, GeoExt [
26], is used to add this functionality to ExtJS. GeoExt is a JavaScript framework which extends the base classes of the ExtJS framework using the OpenLayers (OL) [
27] JavaScript mapping library, an actively developed and popular open source web mapping library.
In addition to the discovery and download of CReSIS data, the geoportal offers some basic data browsing functionality that is aimed at making data exploration an easy task. This secondary functionality includes the ability for users to spatially browse CReSIS radar echograms simply by clicking on the map interface.
The OPS geoportal does not need a custom JavaScript OPS API because the client can make requests directly to the OPS Django web framework using asynchronous JavaScript and XML (AJAX). AJAX is used to submit API requests to the OPS server including JSON (JavaScript Object Notation) serialized data. These requests are made directly to the Django views, allowing the geoportal to leverage the logic defined in Django.
3.4. MATLAB Data Picker Client
The OPS infrastructure supports a wide variety of clients and request types. The primary OPS clients include a web geoportal (introduced in
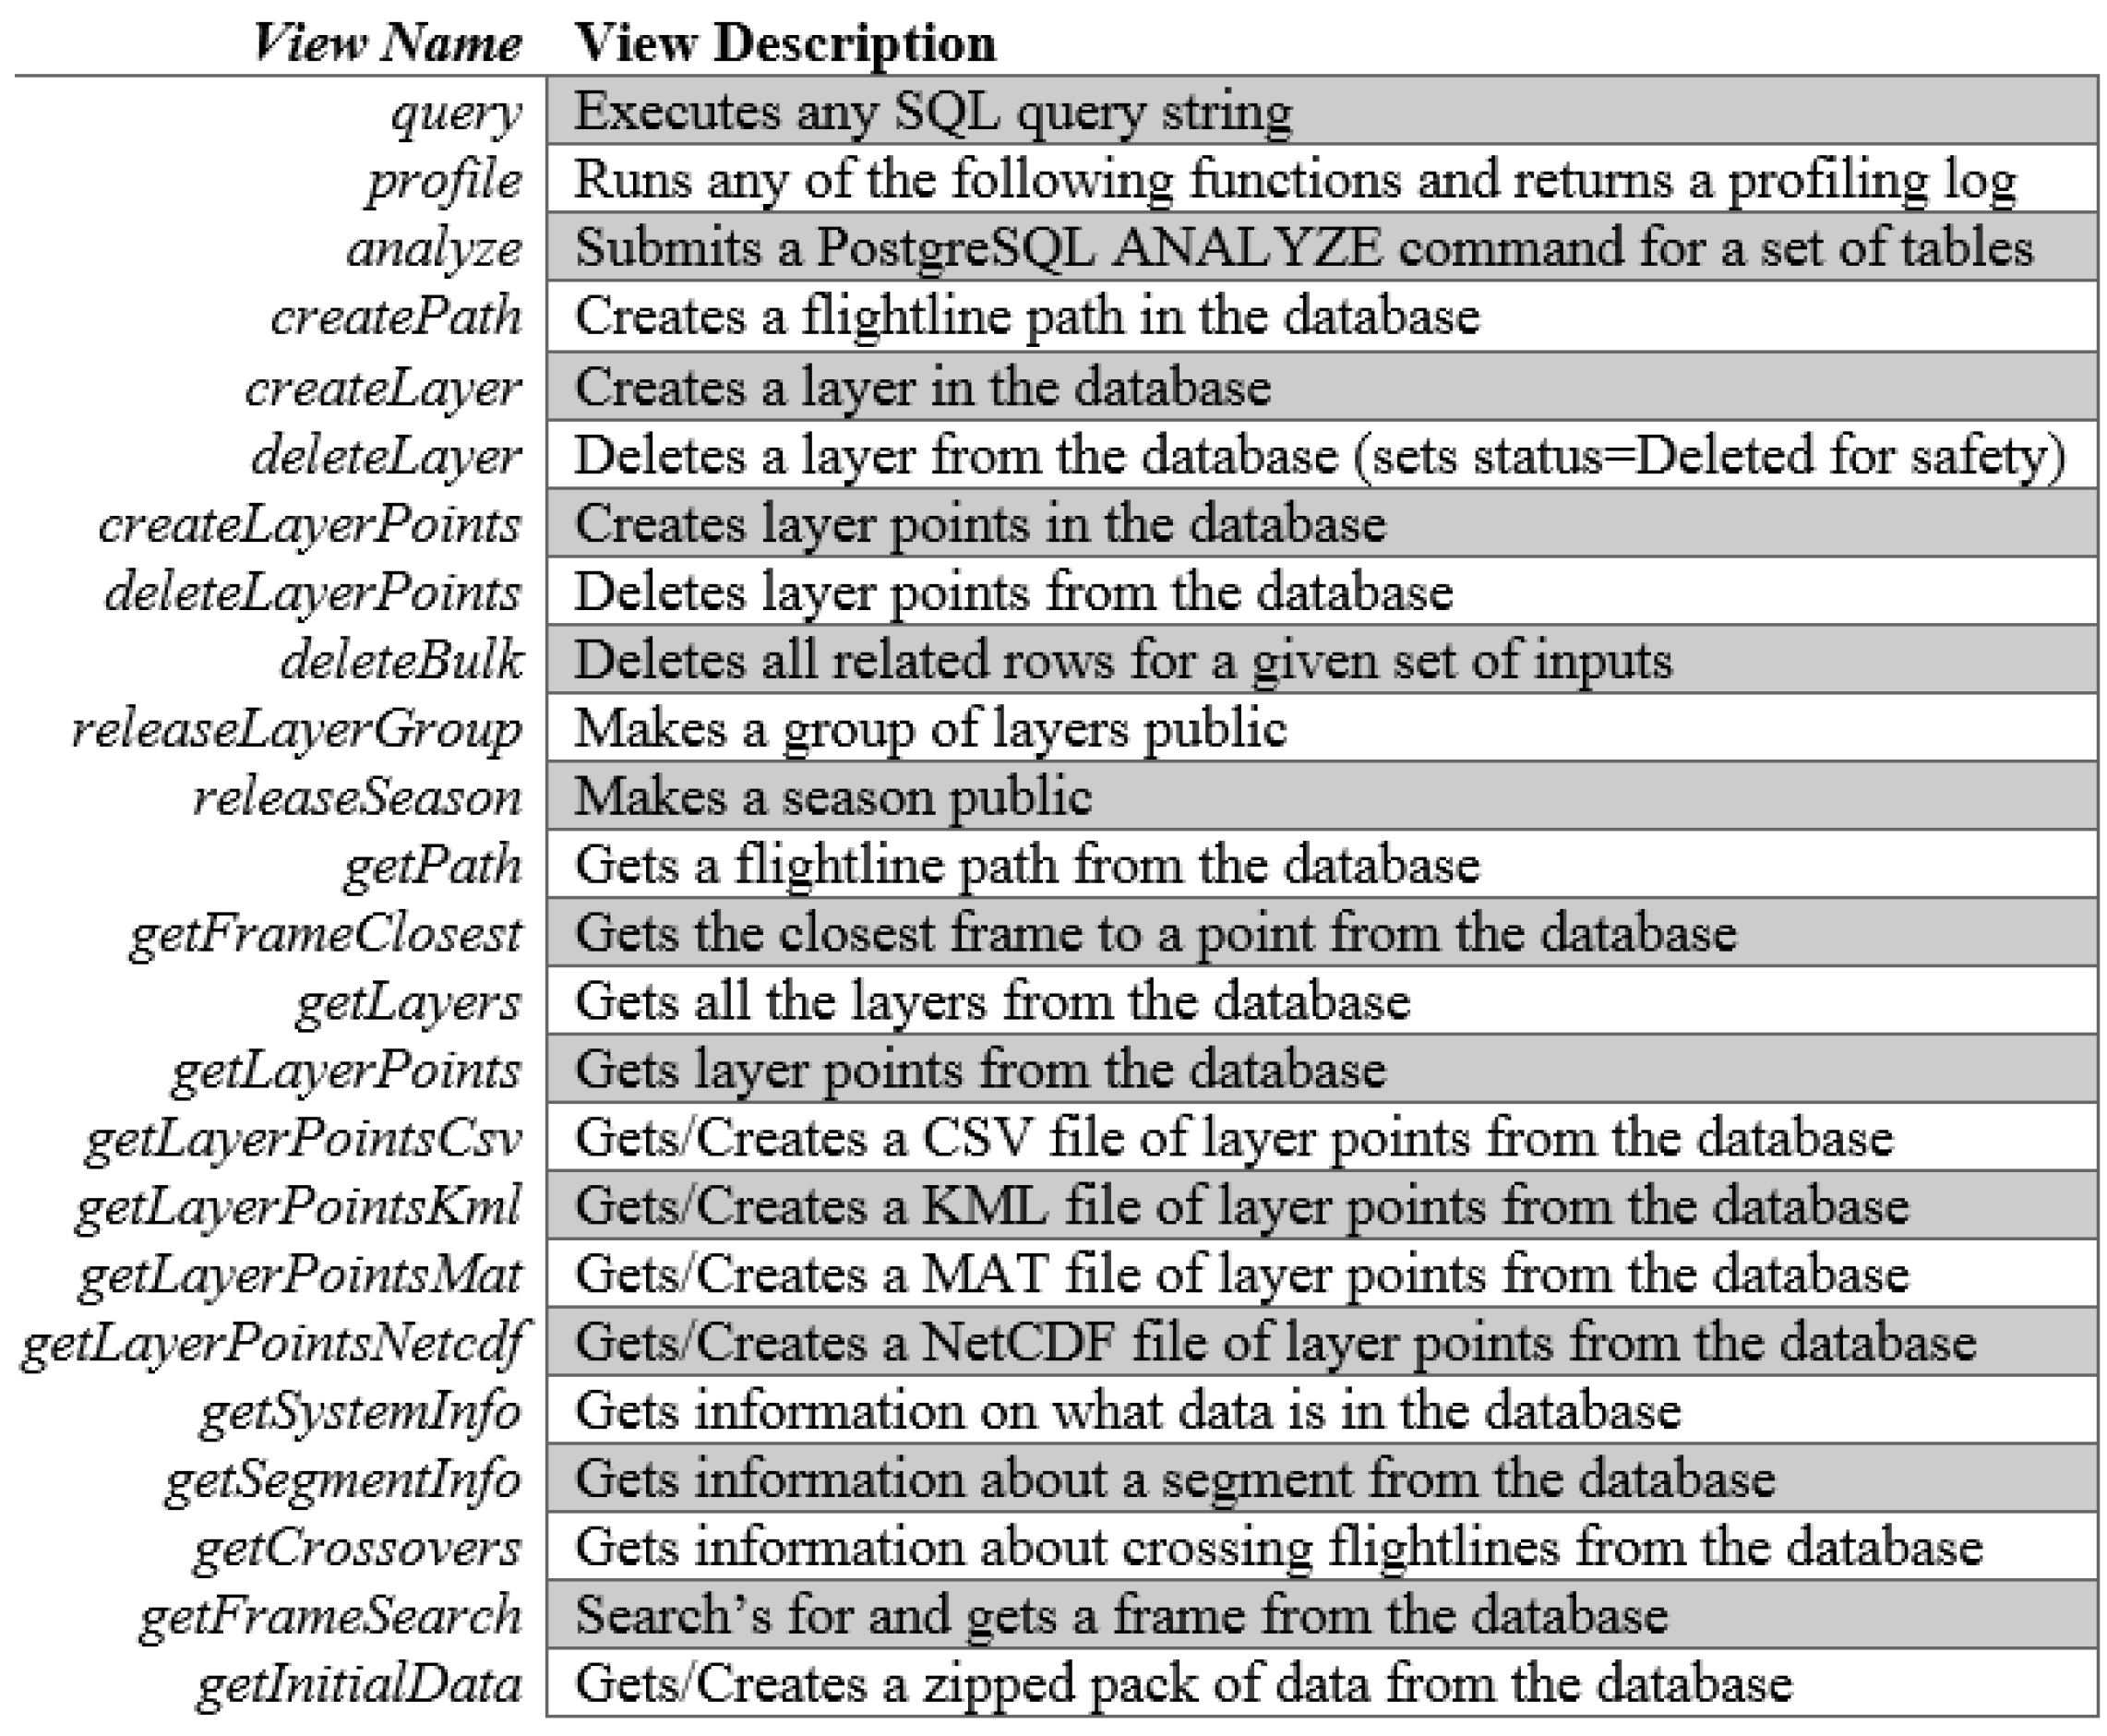
Section 3.3) and a MATLAB application. For a client to include data in an HTTP request for use in a Django view, JSON is used to encode variables in a structured string object. JSON is a standard notation and has libraries in most programming languages for encoding and decoding. Python, JavaScript, and MATLAB all support the JSON format, which covers all of the languages used in the OPS. MATLAB is the primary programming language used by CReSIS for data processing, data management, and creation of data products for distribution. The OPS project has therefore developed an API for MATLAB which allows communication between the Django API on the server and any local MATLAB client. The MATLAB API is a collection of MATLAB scripts that allow communication between the OPS Django API and the MATLAB programming language. The primary role of the MATLAB API is to facilitate communication between the MATLAB Data Picker and the OPS, but it also allows for the execution of OPS CRUD tasks from MATLAB. Each Django view (
Figure 7) has a corresponding MATLAB function in the MATLAB API. The role of the MATLAB function is to take MATLAB input (usually a structure), convert it to a JSON string, send it as an HTTP request to the Apache HTTP web server, wait for the HTTP response, and finally decode the response back into a MATLAB structure. The MATLAB API functions do not perform any of the logic of the task they represent. All of the logic is handled by the Django views on the server.
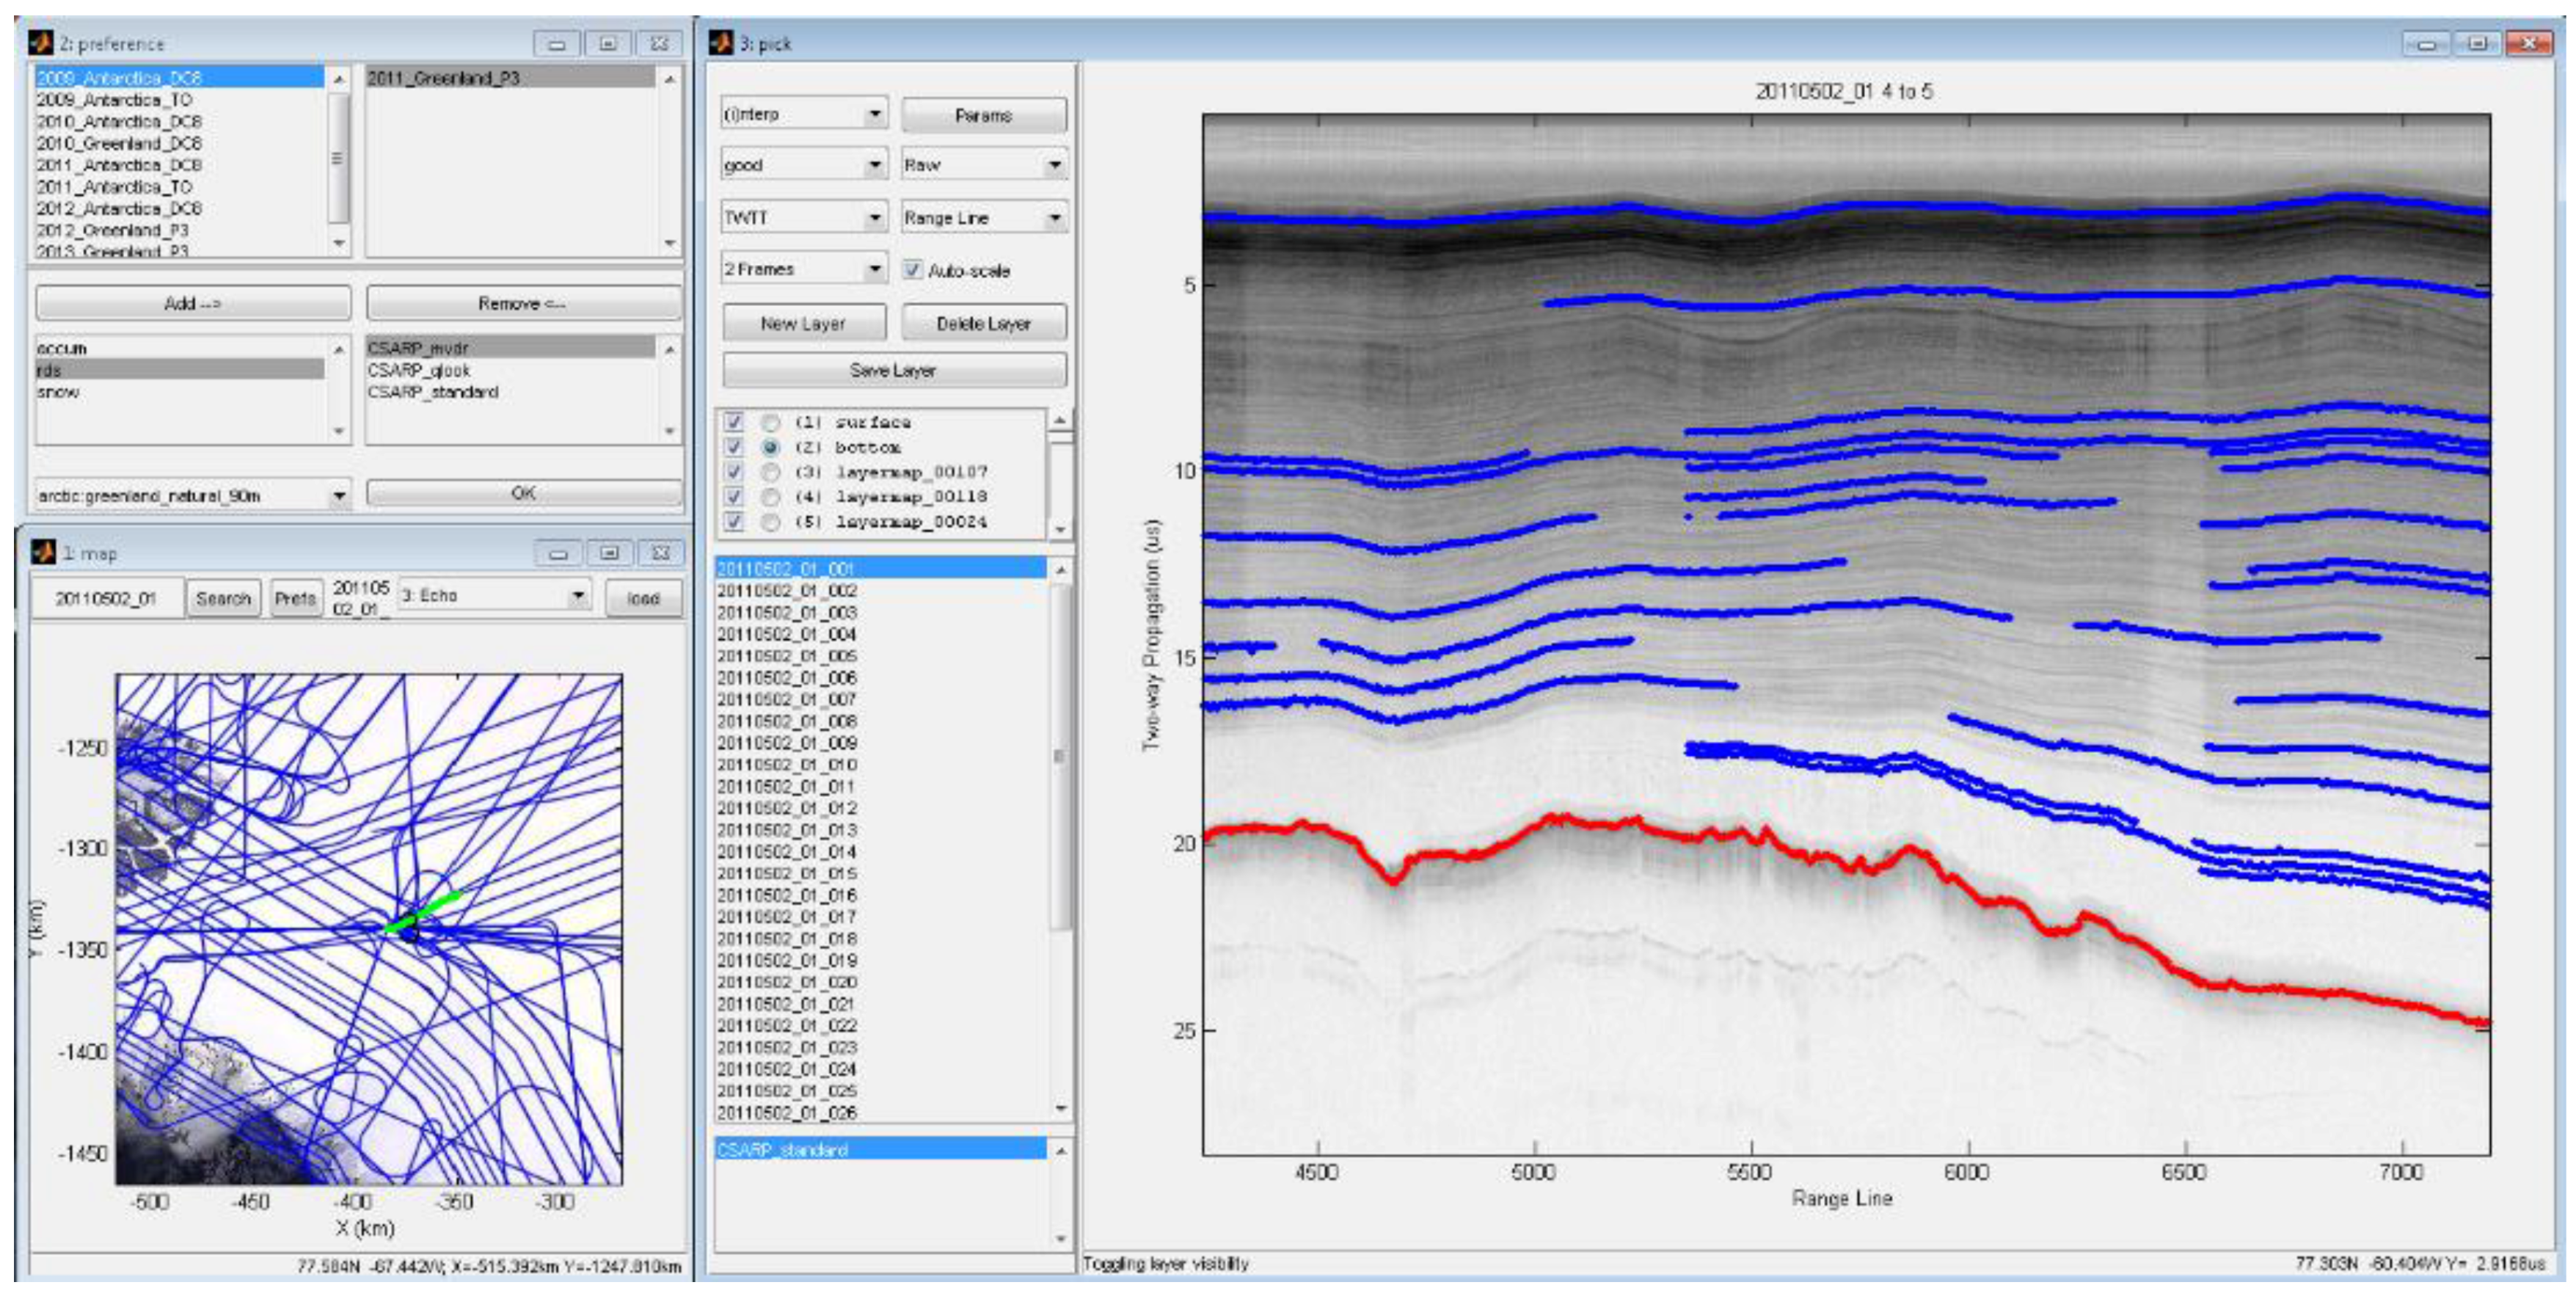
While the MATLAB API can be used as a standalone library and its functions included in any MATLAB script, the primary role of the API is to facilitate the operation of the custom MATLAB DATA Picker developed by CReSIS. Although the design of the Data Picker itself is not a direct part of this project, the development of the OPS and the new Data Picker is synchronous and the Data Picker would not function without the OPS MATLAB API and the backend data storage the OPS database provides.
Figure 8 shows the graphical user interface (GUI) of the Data Picker. The GUI consists of three primary windows, the preference window (top left), the map window (bottom left), and the picking window (right). Each of these windows gets data from the OPS server. The preference window includes options for choosing which data to view in the picking window. Information on available data for each radar system is provided, including the names of available data collection seasons, the specific radars used during each season, and the location (Arctic and Antarctic) for each season. The preference window communicates with GeoServer using the MATLAB mapping toolbox to get a list of available WMS images for viewing in the selected region. After making a selection in the preference window, the map window is launched. The data in the map window is completely driven by the OPS GeoServer and accessed via the WMS request tool in the MATLAB mapping toolbox. A flight line’s frame is selected by clicking on the map window. When a selection is made in the map window, the picking window is loaded. The radar echogram of the selected data frame is returned and loaded from server file system, but all of the layer points, layer information, and the list of frames in the segment are pulled from the OPS server using the MATLAB API. Radar echogram data is not stored on the OPS database because of its data volume and raster data type. Then the Data Picker users pick the points in different layers, and finally save these points into the OPS spatial database.
4. System Evaluation
In order to verify that the OPS has, in fact, achieved the goal of providing an improved experience for end users of polar remote sensing data, the OPS was compared with three existing systems (old geographic search GUI at CReSIS, CReSIS FTP, and NSIDC OIB Data portal). The server machine on which the OPS is currently running has a Dual Intel Xeon E5-2643 CPU and 128 GB RAM.
The major objective of this evaluation is to demonstrate the robustness of the OPS and explore the advantages and disadvantages compared to other data distribution systems when completing a typical task. In the evaluation, a user is asked to complete the same task on each system which downloads CReSIS L2 data in the CSV format over a northeast Greenland outlet glacier (79 N), including only data from 2010 and 2011. There were a total of 10 users that participated in the evaluation. Participants were instructed on how to use these systems and assigned the above task using all the systems. We used three quantitative metrics, i.e., processing time, number of keystrokes, and number of mouse clicks to evaluate the systems.
The mean values of the metrics are shown in
Figure 9, which shows that the OPS has the fastest processing time, the smallest number of mouse clicks, and the second least number of keystrokes, indicating that the OPS has achieved the goal of providing an improved experience. Mouse clicks and keystrokes indicate the simplicity of a system’s user interface. A system which requires the lowest number of each is generally simpler to use. Note that while the CReSIS FTP recorded the least number of keystrokes, they were likely offset by mouse clicks, which is the second highest number in that category. In fact, when the number of clicks and keystrokes are combined the OPS recorded the lowest total number, indicating the OPS system is simpler to use than the other systems. The most important improvement in the OPS is the efficiency of the processing time compared with the complex steps described in
Section 2.3. This is because the OPS can restrict spatiotemporal parameters at the beginning of data downloading, and database indices greatly speed up data access.
The main conclusion drawn from the evaluation is that the OPS is more efficient and simpler for downloading desired data when compared to the other three systems. It is worth noting that these results represent the ideal case, i.e., perfect use of each system where the users are already familiar with the systems through tutorials and help documentation. The OPS does include interactive help documentation that should make it very easy for new users to familiarize themselves with the system quickly.
5. An Application of CReSIS Data Served on the OPS
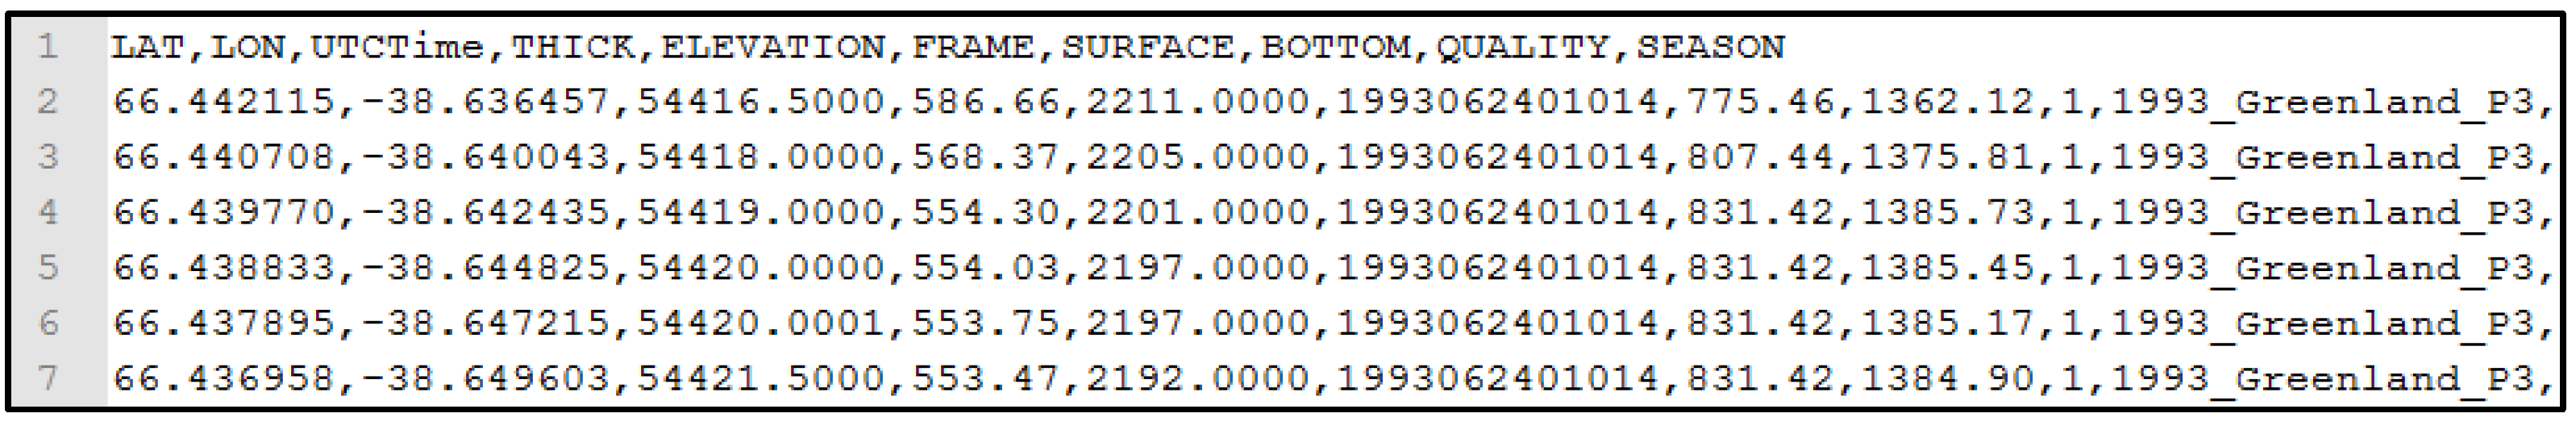
Previous sections introduce the architecture and implementation of the OPS system. Researchers in the cryosphere community can download the data from OPS geoportal and apply that data to different areas of scientific research, including questions about sea level rise, climate change, and so on. Here, we present an application of CReSIS data downloaded from OPS geoportal to interpolate glacier topography. When CReSIS data is downloaded from the OPS geoportal, it is first necessary to specify the radar system, start date, end date, seasons, a polygon defining the study area, and an output format for the data (CSV, KML, MAT, and NetCDF). The content of a CSV formatted file is shown in
Figure 10. This file contains the following information for the flight path: latitude, longitude, UTC Time, thickness, elevation, frame information, surface layer elevation, bottom layer elevation, picking quality (1 represents
good; 2 represents
moderate; 3 represents
derived; and null represents
unpicked), and season information.
For this application,
good quality data is used to interpolate standardized ice surface and bottom elevation grids, and to calculate a thickness grid. The major outputs are three raster layers for the ice surface, ice thickness, and ice bottom. The interpolation process is implemented in ArcGIS’s [
28] ModelBuilder environment to organize the tools and data used, and to create an easy-to-use tool.
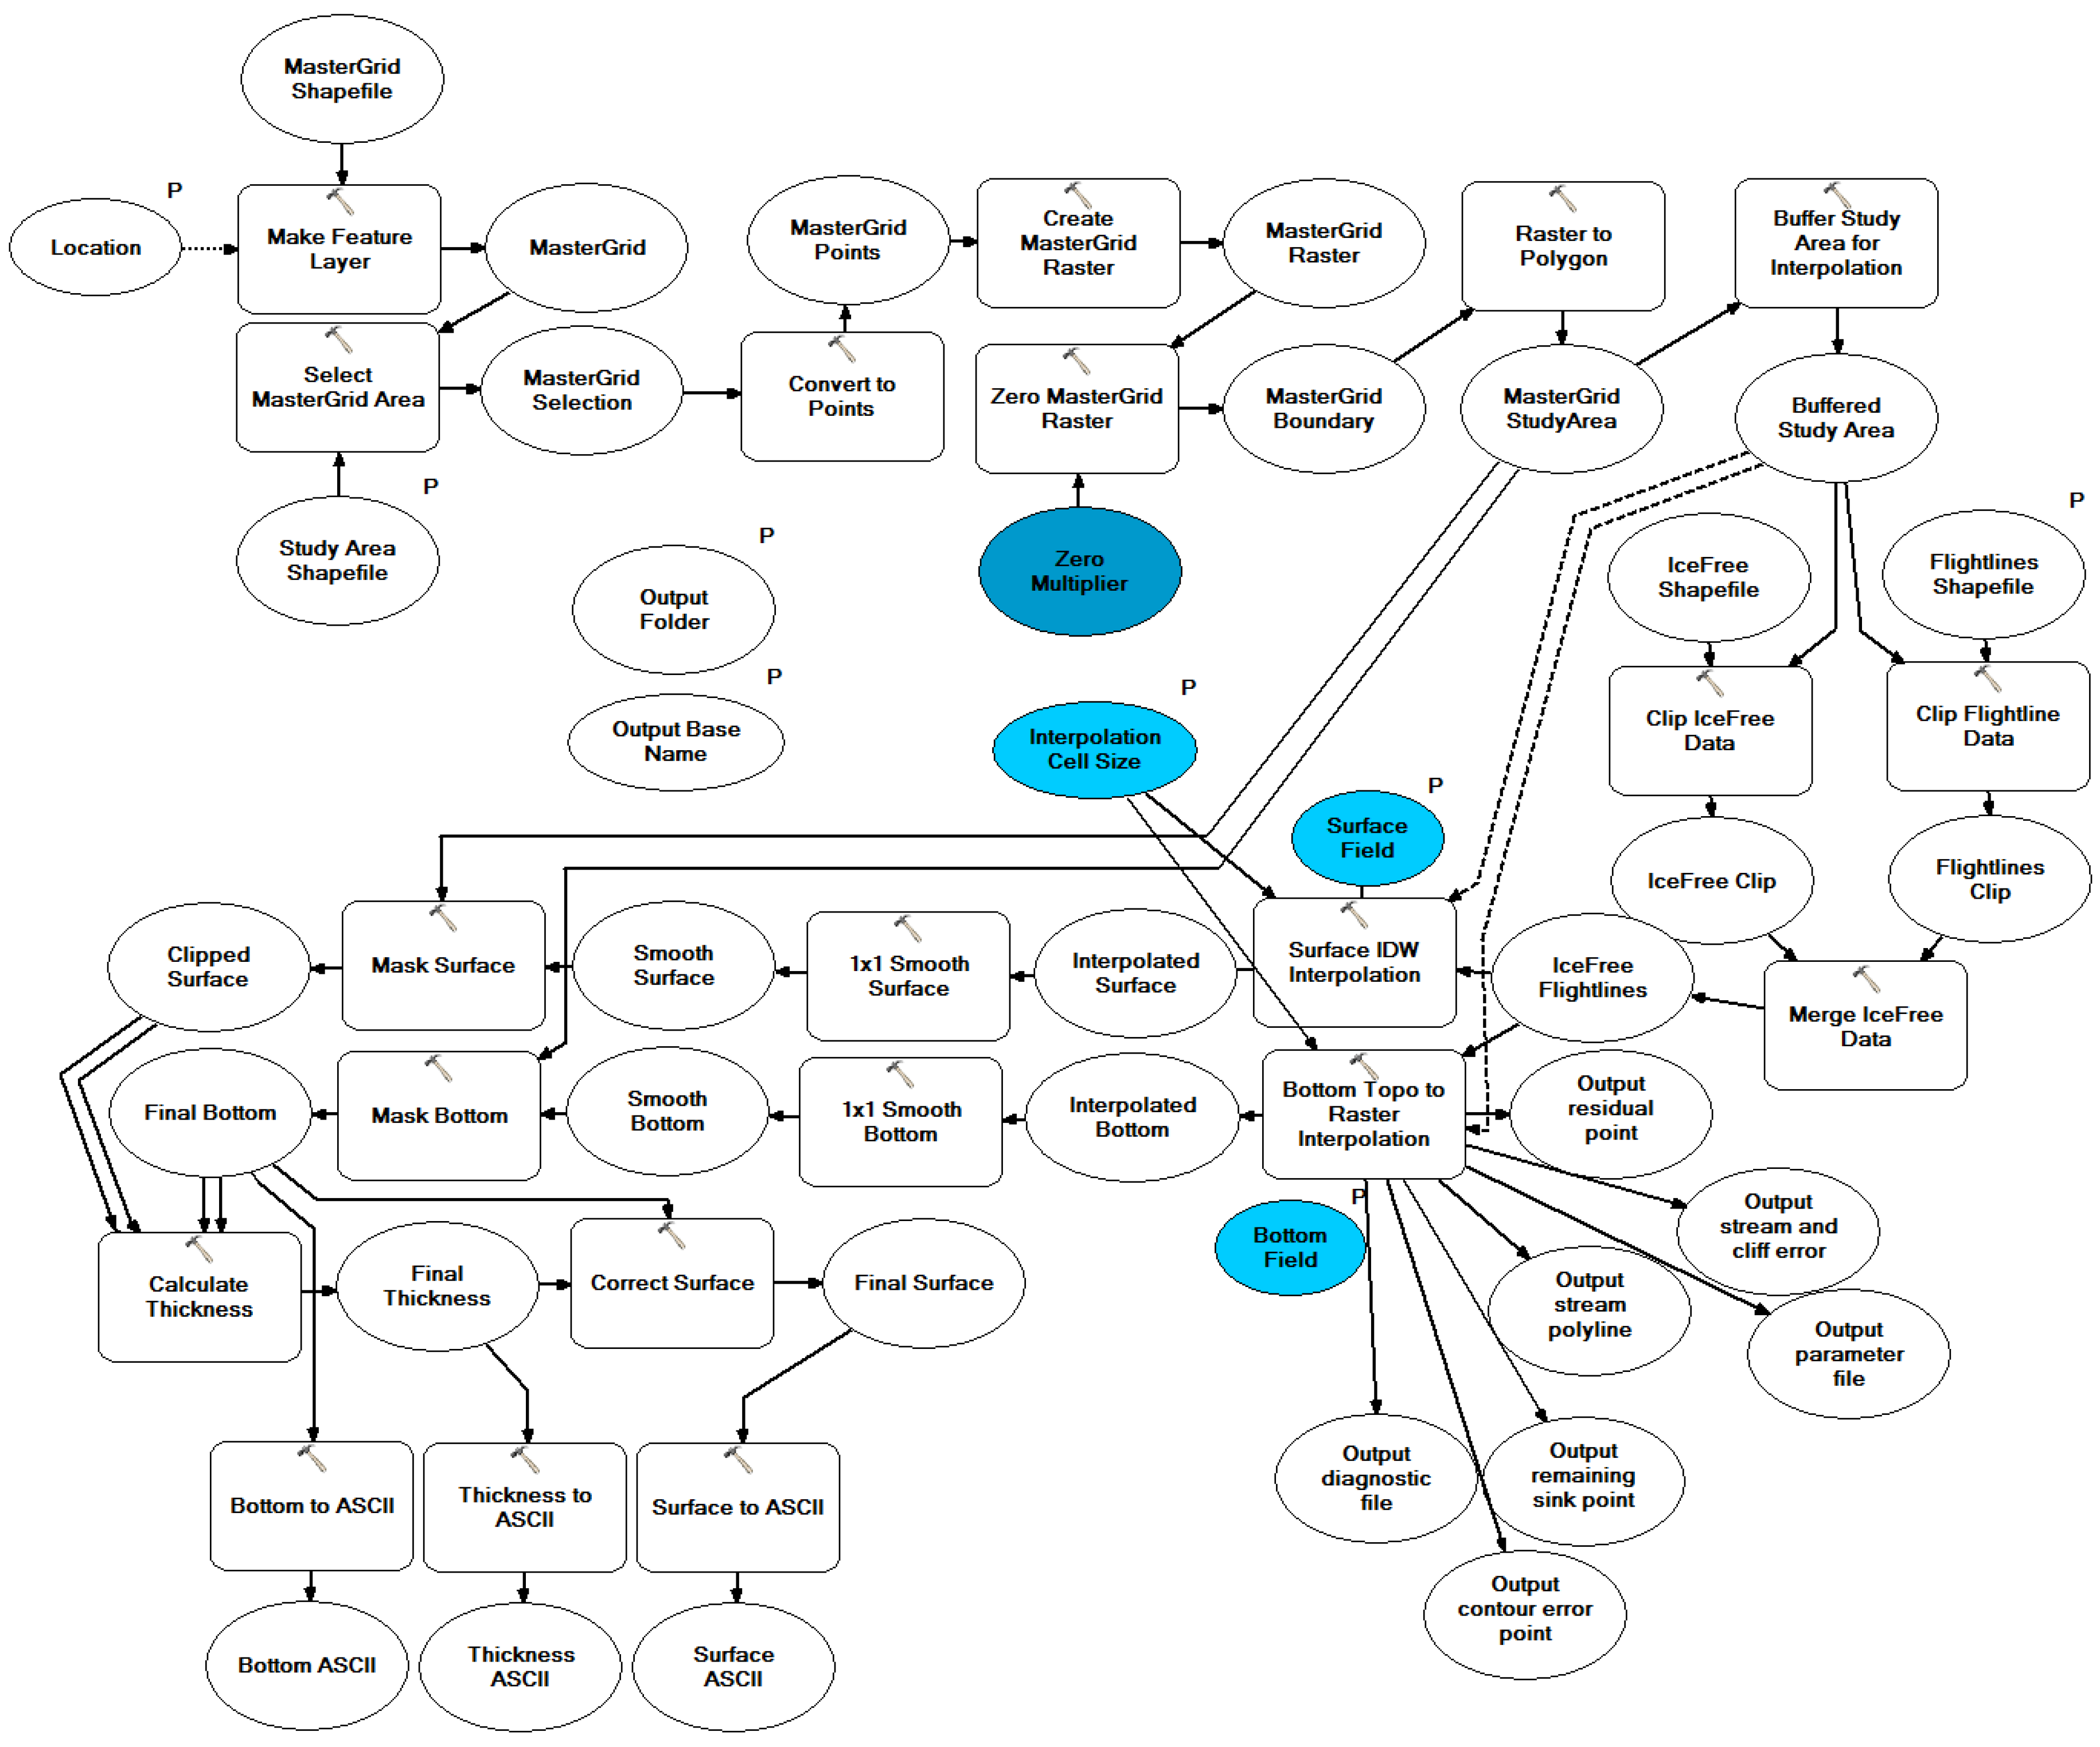
Figure 11 shows the model for the interpolation tool of CReSIS data. After downloading the CReSIS data from the OPS geoportal, the CSV file should first be converted into a point shapefile and entered into the tool as the “Flightlines Shapefile” with the projection definition. Furthermore, a polygon shapefile representing the study area (“Study Area Shapefile”) should be prepared, which defines the area to be interpolated over. Some preprocessing procedures, such as format conversion, buffering the study area, and so on, are implemented. The “Surface Field” and “Bottom Field” are the ice surface elevation and bottom elevation in the “Flightlines Shapefile”. For the ice surface layer interpolation, the inverse distance weighted (IDW) technique is used. For the ice bottom layer interpolation, the “Topo to Raster” tool in the ArcGIS toolbox is used to generate hydrologically correct bottom elevation. The “Interpolation Cell Size” should be specified, if a different size than the 500 m default is desired. The smoothing of the ice surface and bottom layers is applied to the interpolation results. Finally, we obtain three major layers (Surface, Bottom, and Thickness) as ASCII format and other outputs. To test and validate the capability and accuracy of this tool, the Helheim Glacier in Greenland and Byrd Glacier in Antarctic were interpolated and shown in
Figure 12. The final gridding products for the glaciers in the Arctic and Antarctic can be downloaded from
https://data.cresis.ku.edu/.
6. Conclusions
This work presented the development of a free and open source infrastructure, i.e., the OPS, to store, manage, analyze, and distribute the data collected by CReSIS in an effort to replace its current data storage and distribution approaches. In the system, PostgreSQL, PostGIS, and Django were used to develop and deploy a database management system. ExtJS, GeoExt, and OpenLayers were used to develop and deploy a geoportal. Custom MATLAB scripts and the Django Python web framework were used to deploy an API for the interaction between MATLAB and the OPS. The evaluation of the OPS indicated a much improved user experience to retrieve data collected by CReSIS. The system will allow and encourage scientists to explore the data and potentially provide new scientific knowledge in an effort to understand the cryosphere, ice sheets, and future sea level rise. As an example, a gridding application using the CReSIS data accessed from the OPS geoportal was also presented. Researchers can make use of these gridding products and L2 CReSIS data to answer various scientific research questions.
The OPS has been developed using all FOSS and conforms to practical data and coding standards. The system is available to the public at
http://ops.cresis.ku.edu/ and many cryosphere community data providers have included or are preparing to include their datasets in the OPS. The code for the OPS is open source and provided free of charge or restriction on GitHub at
https://github.com/CReSIS. As an open source project the OPS will only be successful if the community contributes to its growth. Some possibilities for future exploration and development of the OPS are:
Cloud-based hosting of the OPS on systems such as RACKSPACE or Amazon EC2.
An interactive (web-based) data picking system build in JavaScript to replace the MATLAB Data Picker.
An interactive JavaScript echogram browser that loads dynamic data instead of static images.
A web-based data loading system so that community members can load their own data into a cloud system without CReSIS intervention.
Explore the potential collaboration between an Arctic SDI (
http://arctic-sdi.org/) and the OPS such as by sharing the data between the systems and using the OPS as the front end of the Arctic SDI.
In addition, the maintenance and continuous software upgrades for the OPS is also a task that must be accounted for. It is the authors’ hope that the cryosphere community accepts the system, uses it, and contributes to its future development.


