
Investigating “Locality” of Intra-Urban Spatial Interactions in New York City Using Foursquare Data


Abstract
:1. Introduction
1.1. Brief Overview of the Previous Research on Intra-Urban Mobility and Spatial Interactions
1.2. Motivation for This Study
2. Methodology
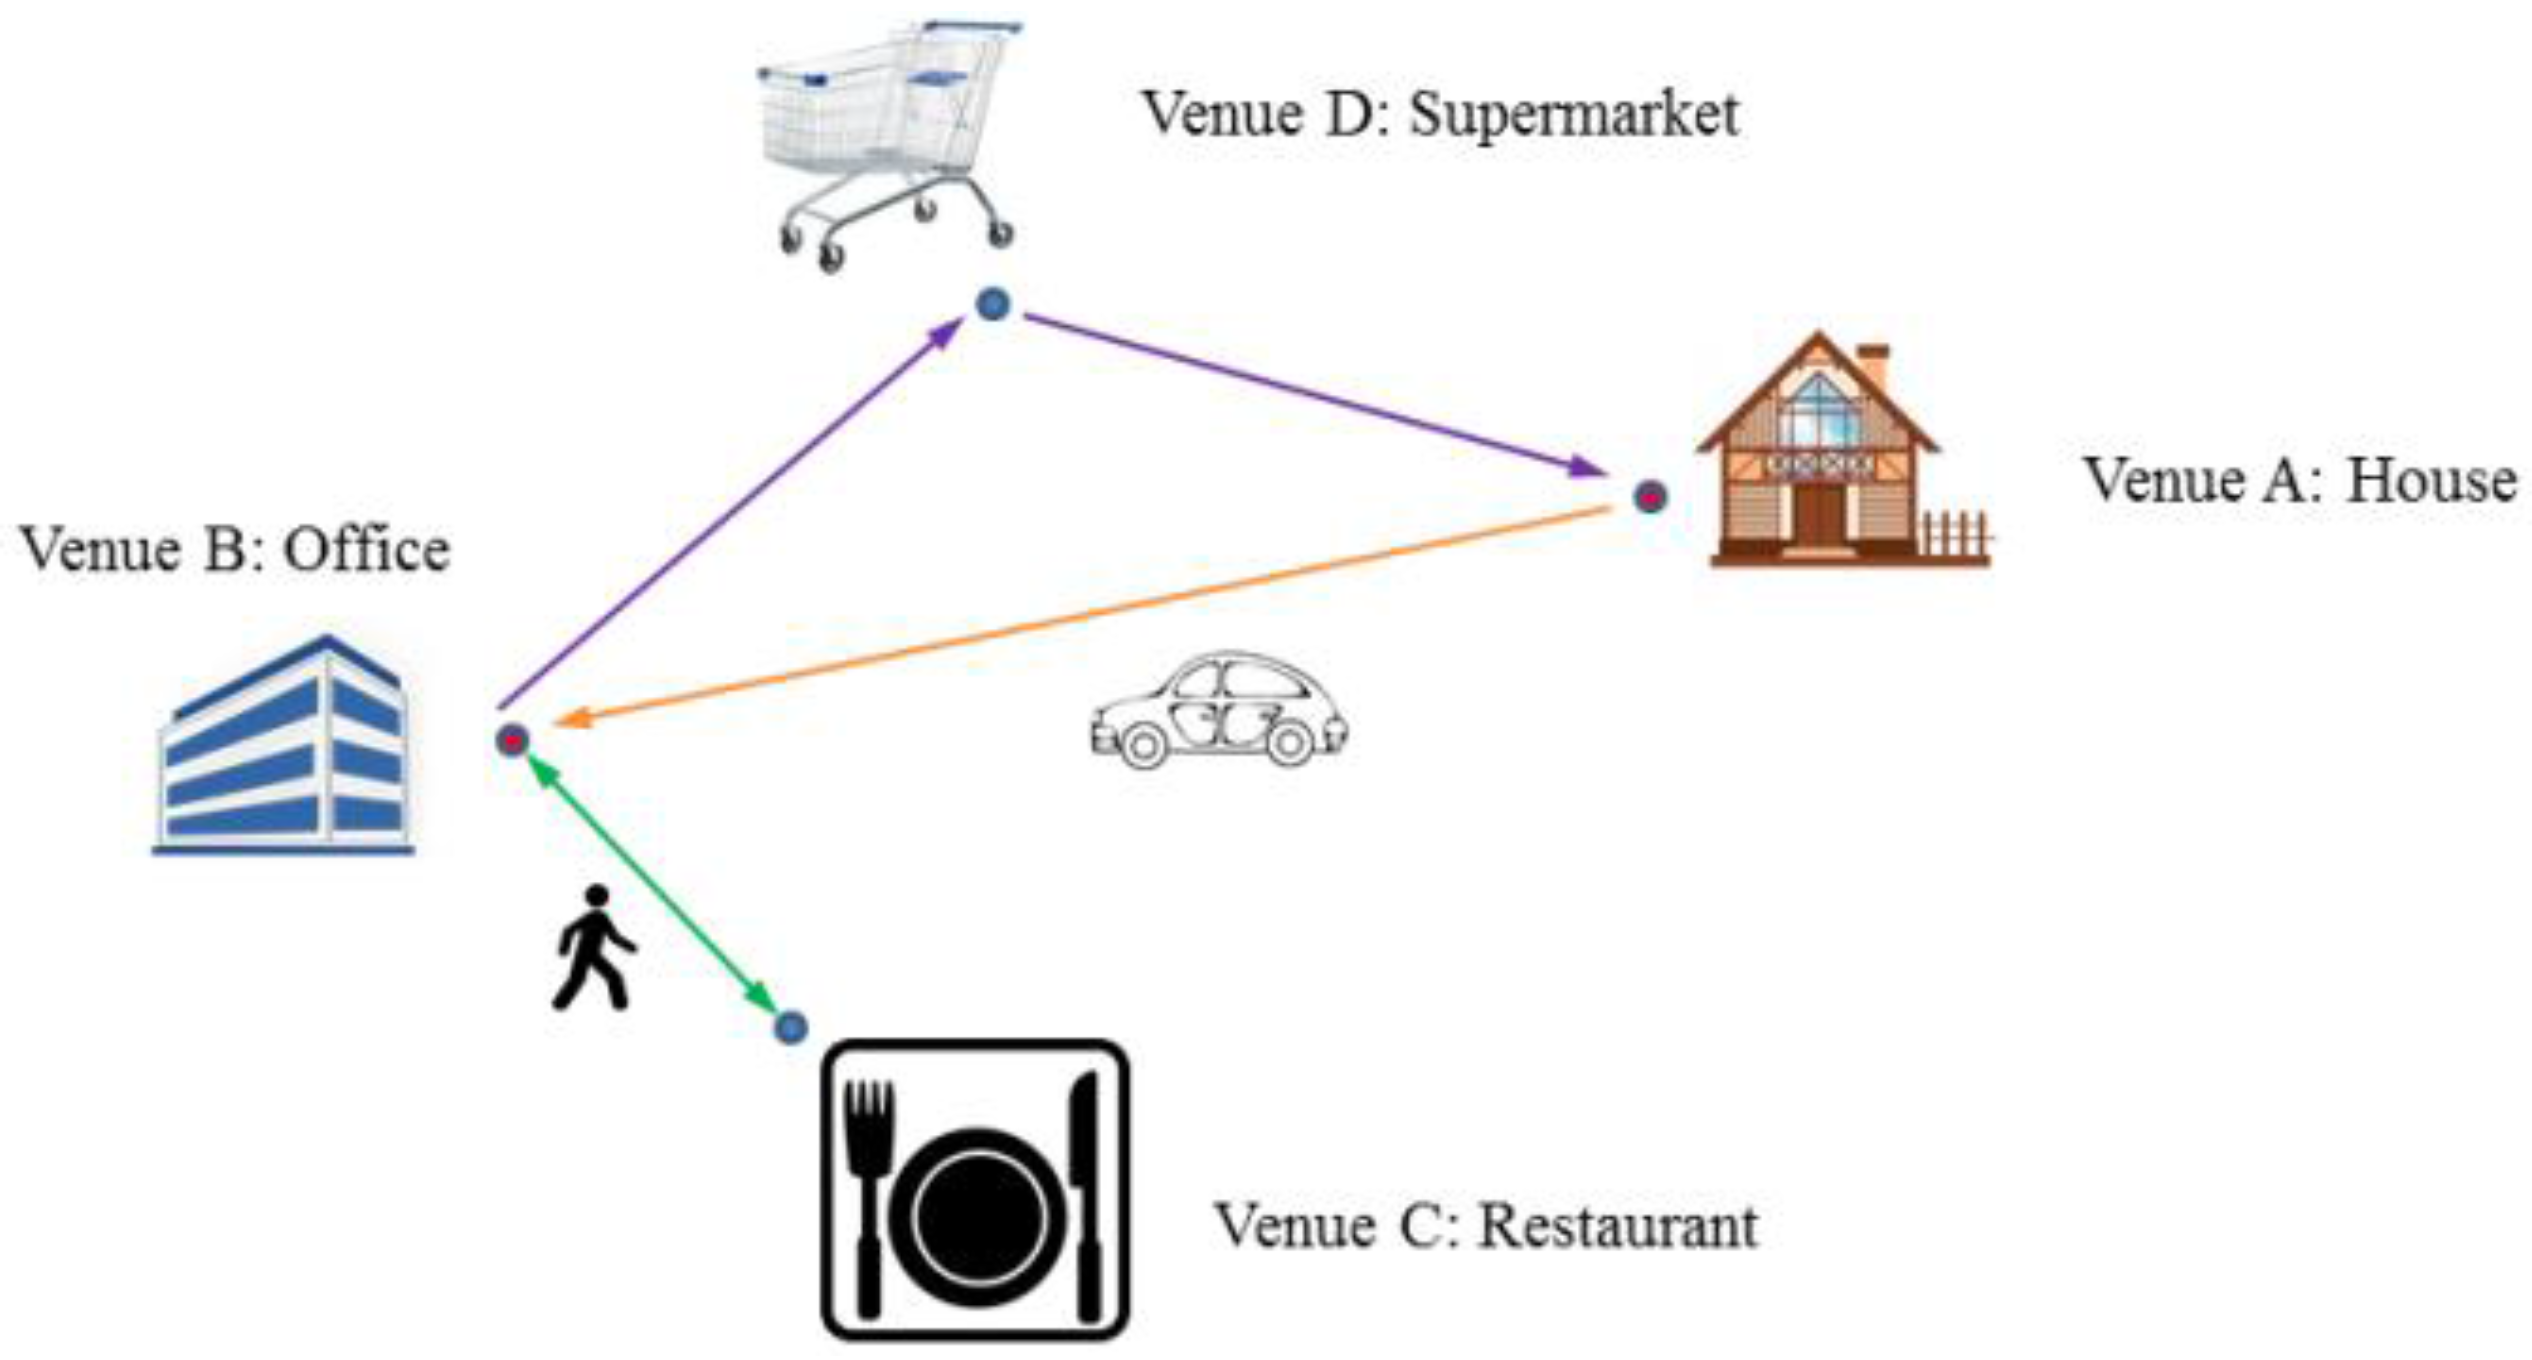
2.1. Depiction of Spatial Interactions
2.2. Length and Strength of Spatial Interactions
2.3. “Locality” of Spatial Interactions
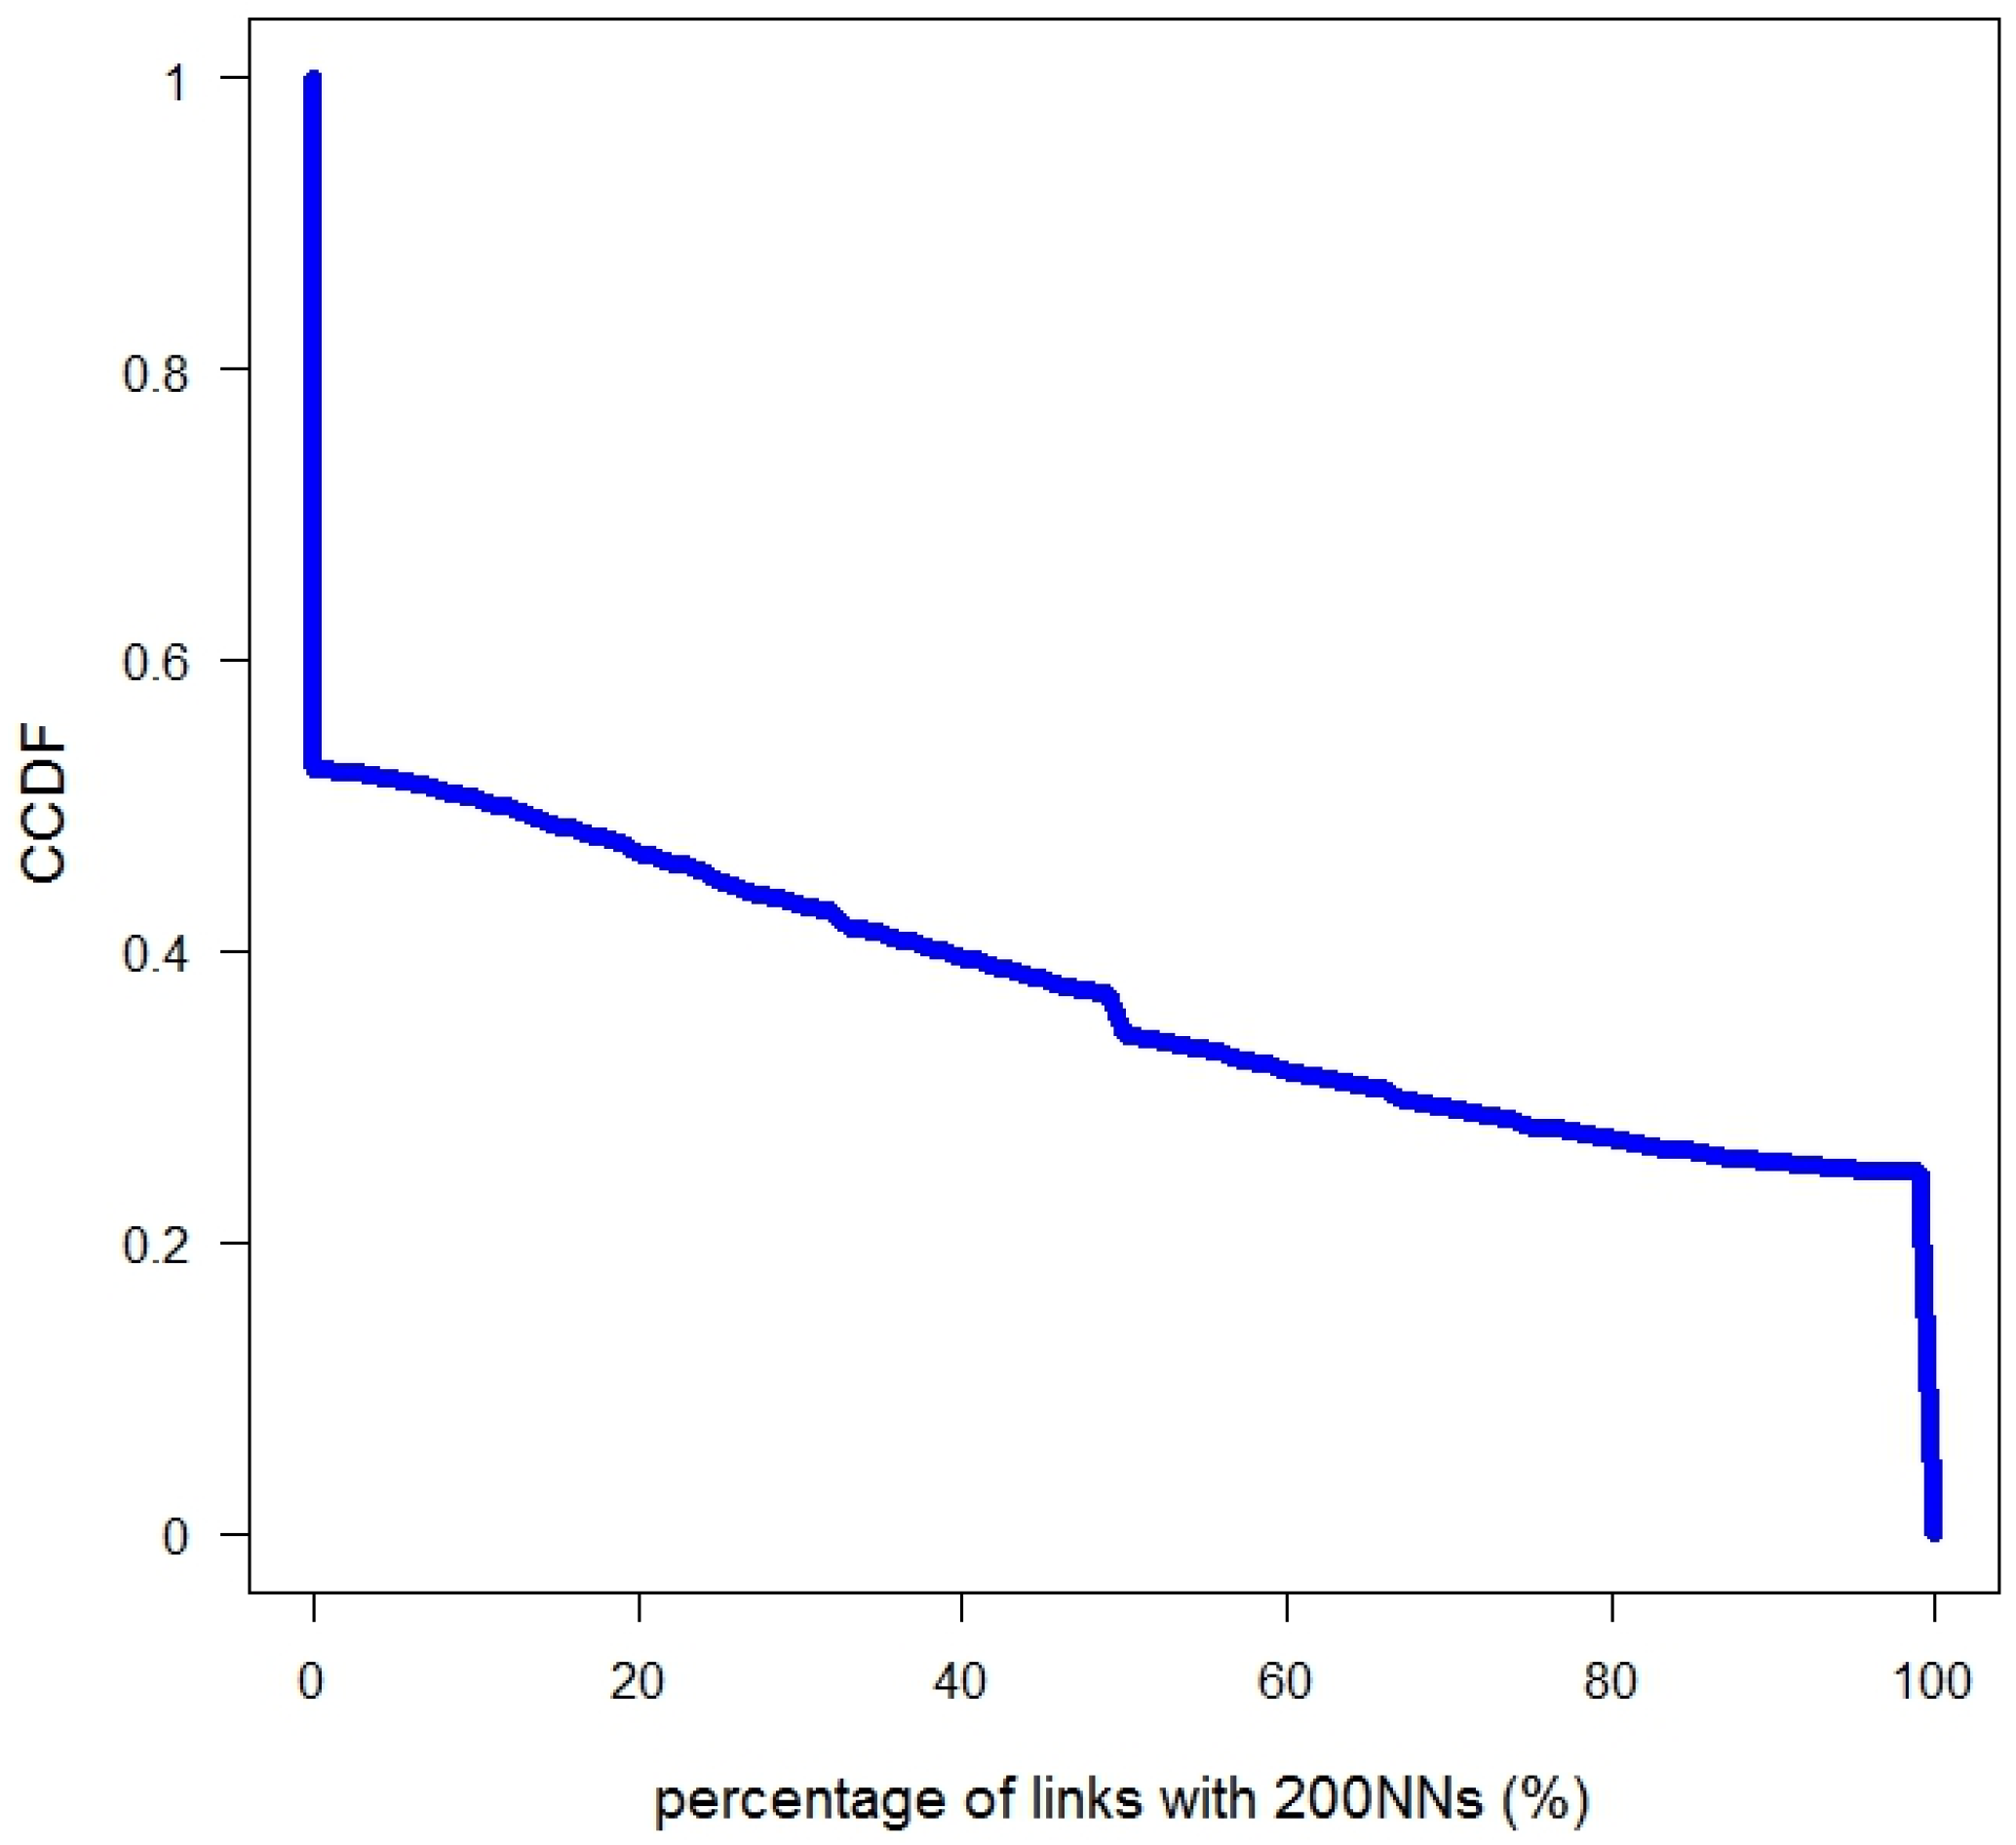
- (1)
- The percentage of links a venue has with KNNs is used to measure the relative possibility of a venue being linked (interacted) with its neighbors. This value is used to measure the “locality” range of the interactions that take place. The higher the value is, the more the venue is likely to be interacted with neighboring venues than with distant venues. This value can be defined as:where the is the number of links venue has with its , and is the number of links venue has.
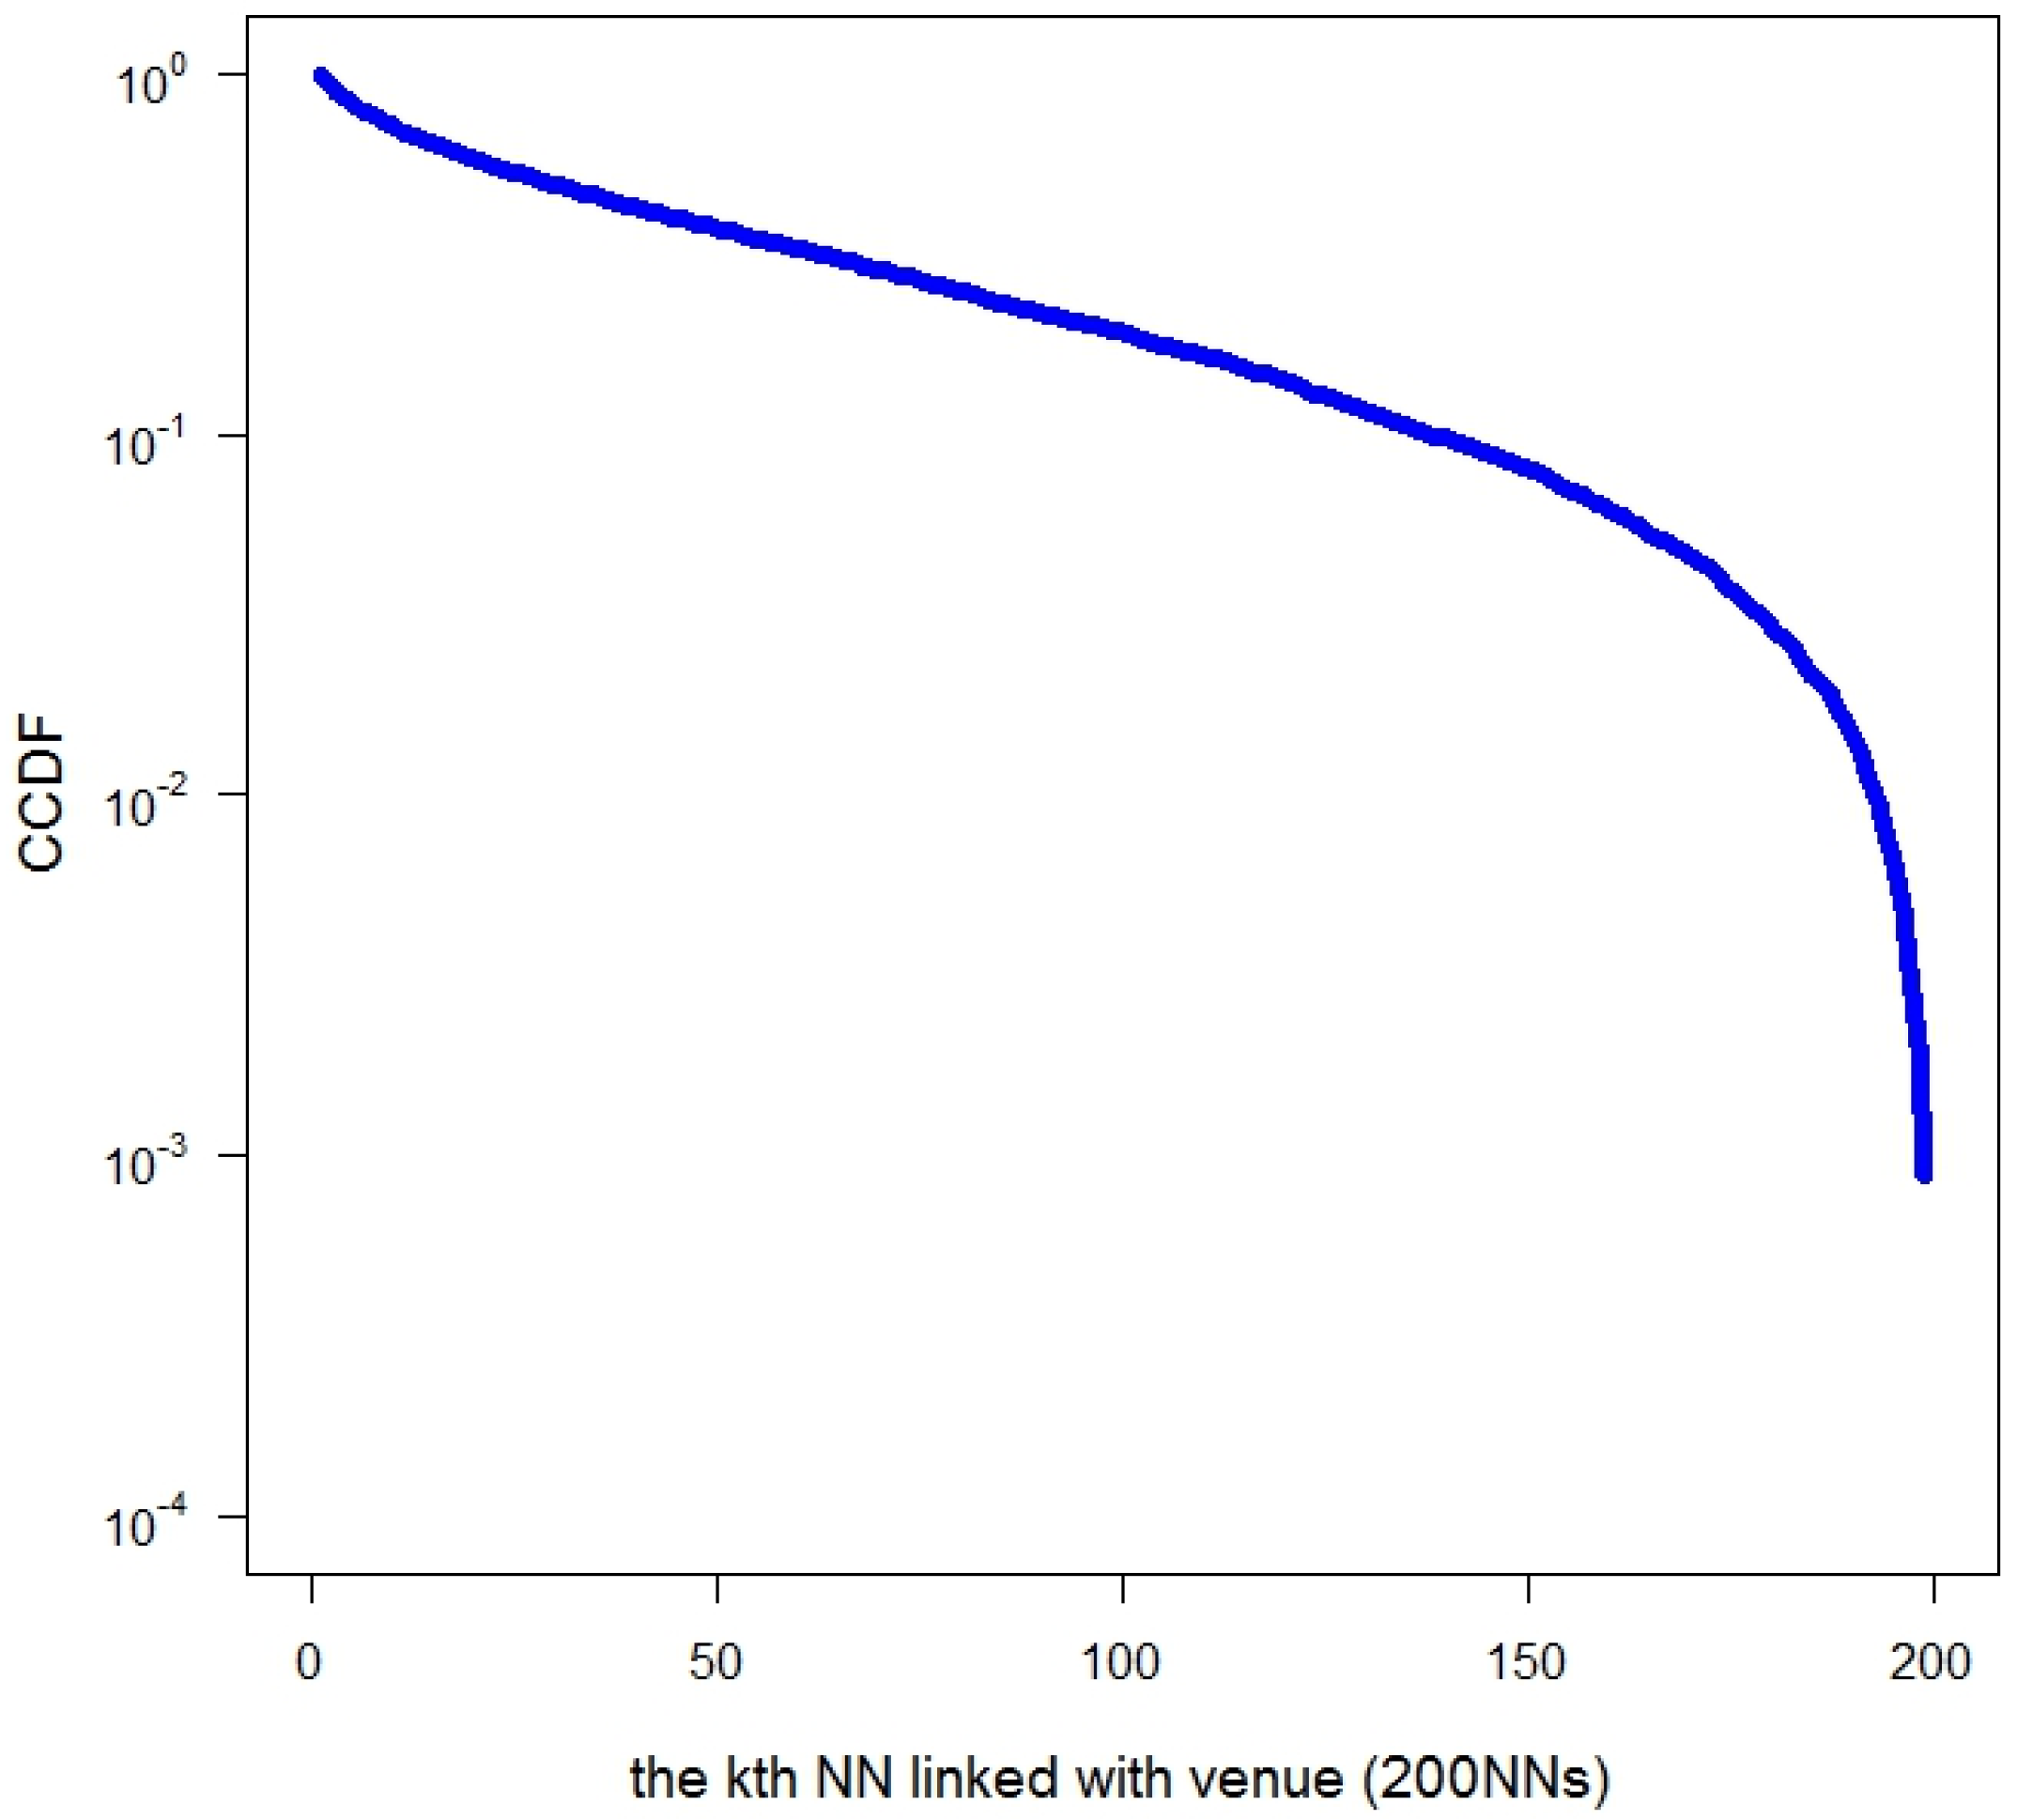
- (2)
- The kth NN linked with a venue value is used to represent that a venue is interacted with the kth nearest venue among its KNNs. This value is used to measure the “locality” strength of interactions between venues.
2.4. Interaction Network
2.4.1. Nodes and Edges
2.4.2. Network Structure and Community Analysis
3. Empirical Analysis
3.1. Study Case and Empirical Data
3.2. Locality of Spatial Interactions
3.3. Impact of Gender on “Locality”
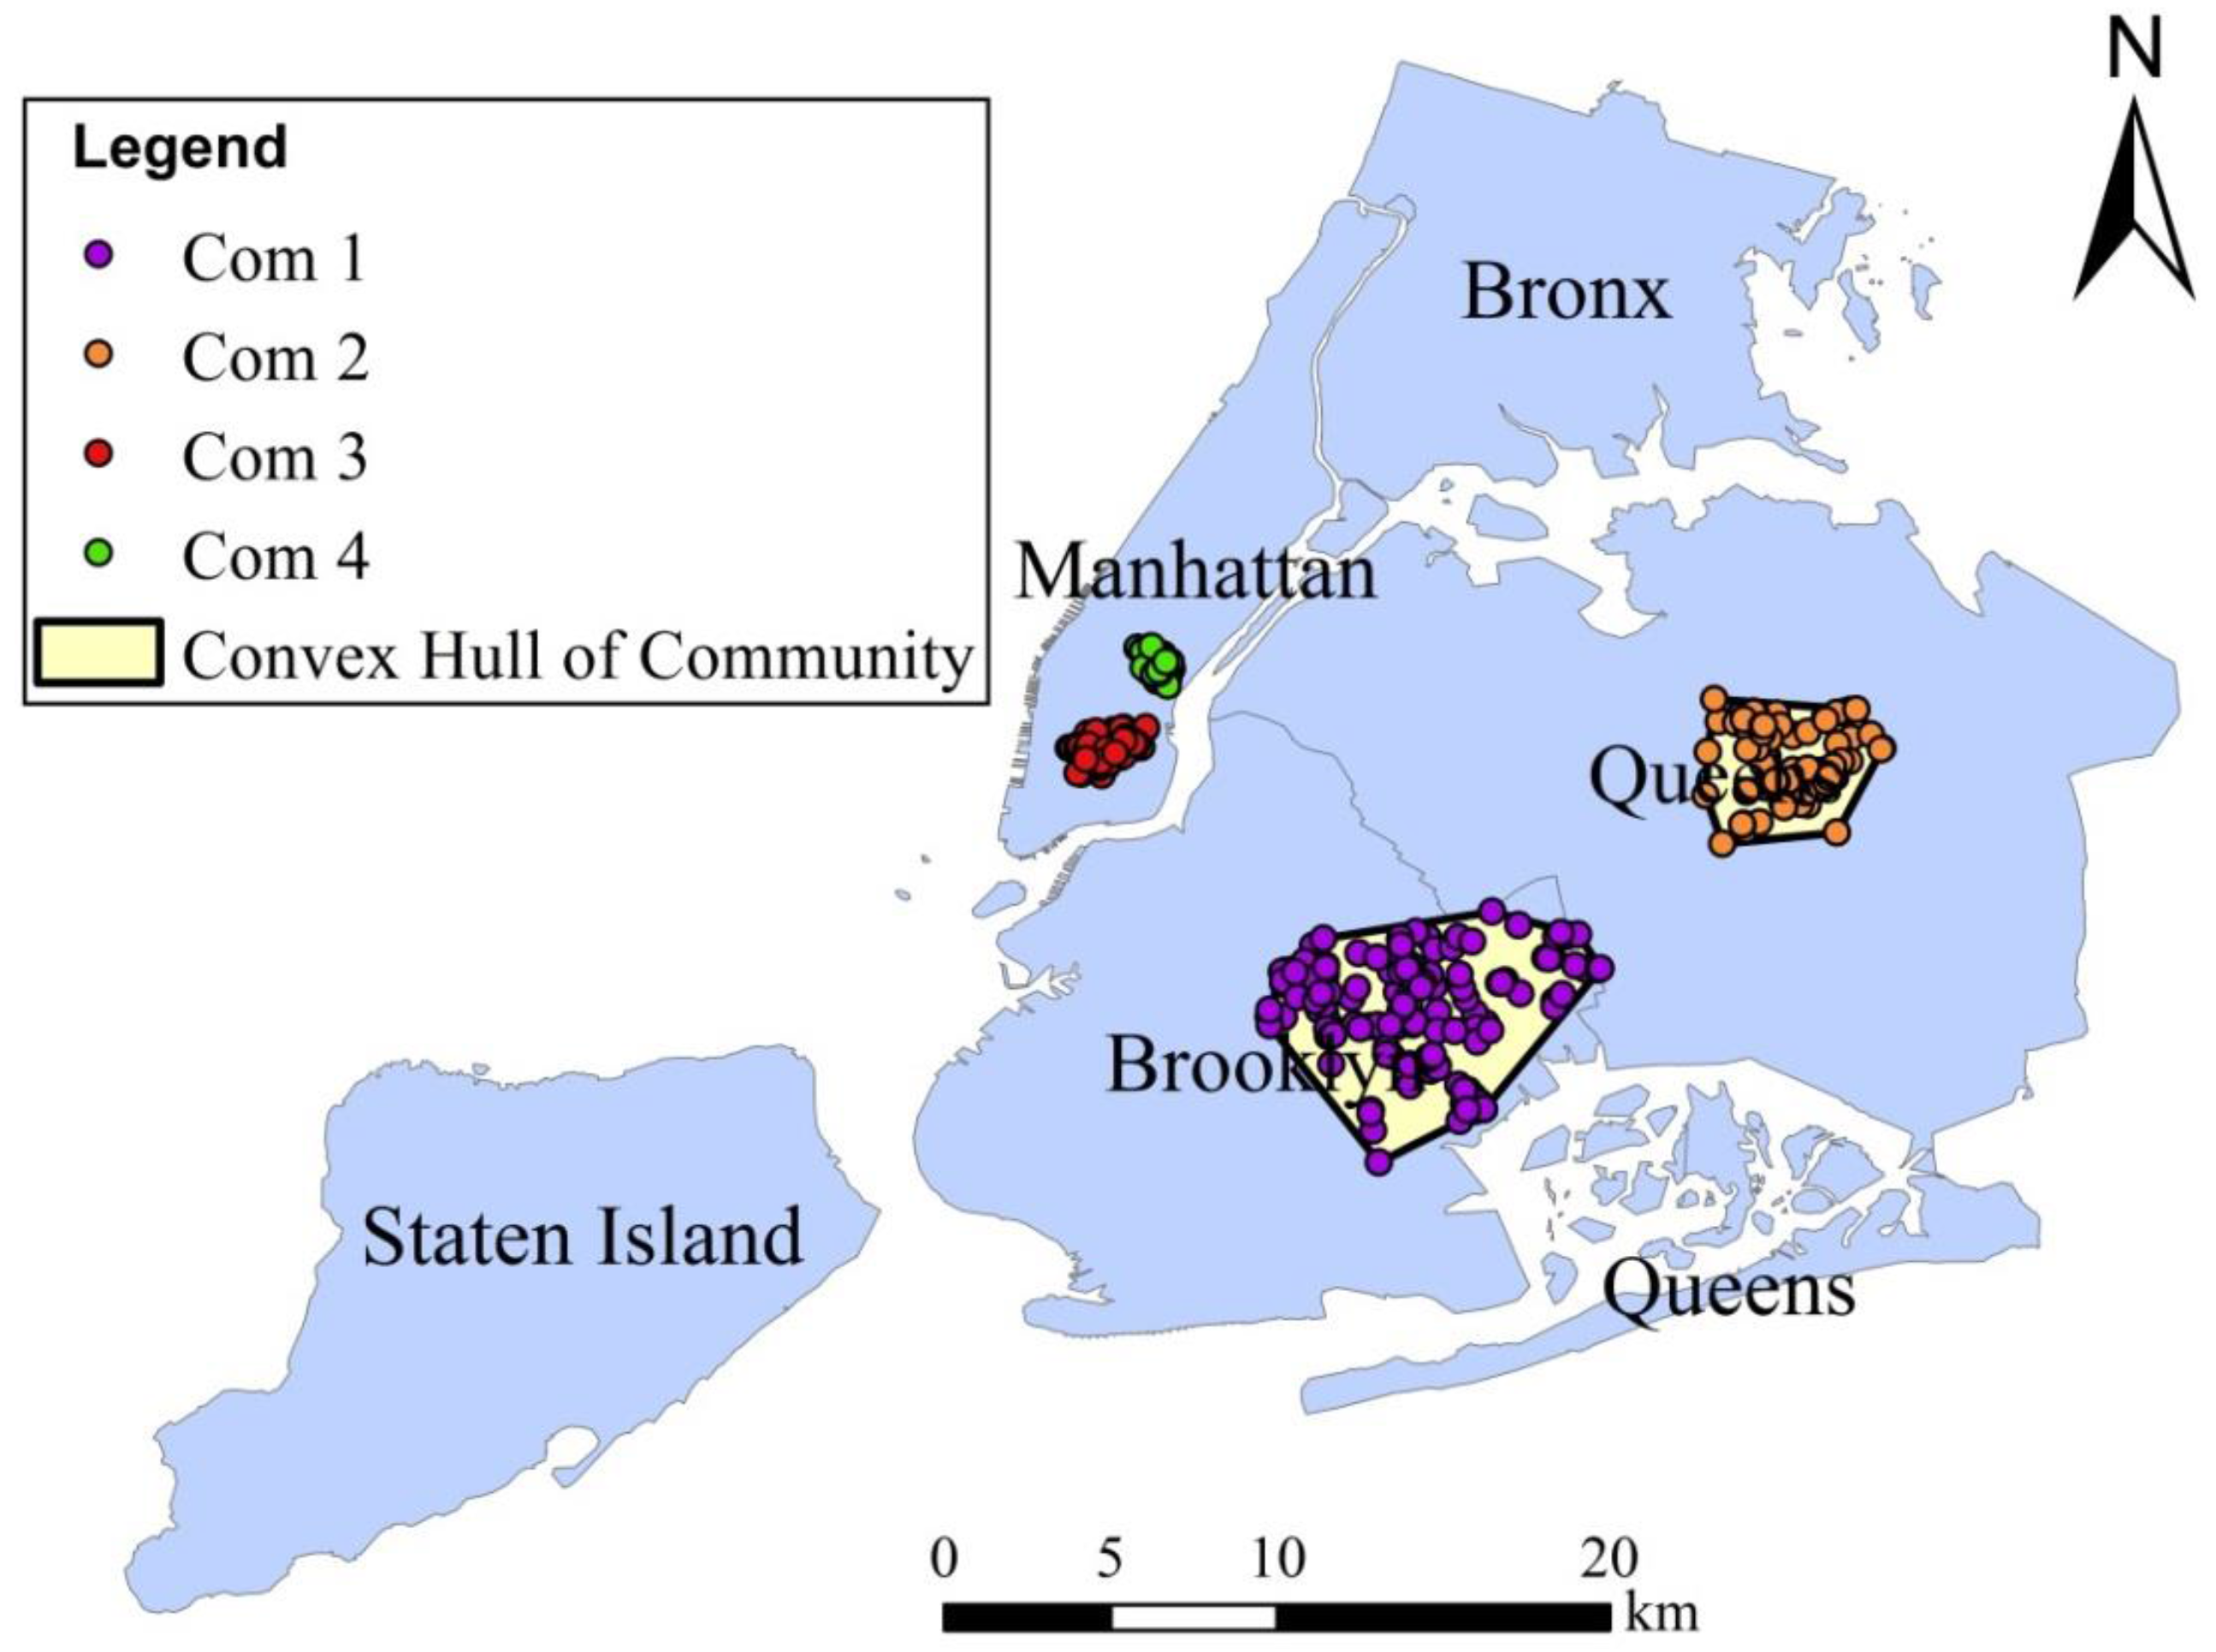
3.4. Clustering of Local Interactions
4. Conclusions and Future Work
Acknowledgments
Conflicts of Interest
References
- Foursquare: Foursquare Category Hierarchy. Available online: https://developer.foursquare.com/categorytree (accessed on 1 January 2016).
- Foursquare: About Us. Available online: https://foursquare.com/about (accessed on 1 January 2015).
- Cheng, Z.; Caverlee, J.; Lee, K.; Sui, D. Exploring millions of footprints in location sharing services. In Proceedings of the Fifth International Conference on Weblogs and Social Media, Barcelona, Spain, 17–21 July 2011.
- Wu, L.; Zhi, Y.; Sui, Z.; Liu, Y. Intra-urban human mobility and activity transition: Evidence from social media check-in data. PLoS ONE 2014, 9, e97010. [Google Scholar] [CrossRef] [PubMed]
- Cho, E.; Myers, S.A.; Leskovec, J. Friendship and mobility: User movement in location-based social networks. In Proceedings of the 17th ACM SIGKDD International Conference on Knowledge Discovery and Data Mining, San Diego, CA, USA, 21–24 August 2011; pp. 1082–1090.
- Noulas, A.; Scellato, S.; Mascolo, C.; Pontil, M. An empirical study of geographic user activity patterns in foursquare. In Proceedings of Fifth International AAAI Conference on Weblogs and Social Media, Palo Alto, CA, USA, 17–21 July 2011; pp. 570–573.
- Scellato, S.; Noulas, A.; Mascolo, C. Exploiting place features in link prediction on location-based social networks. In Proceedings of the 17th ACM SIGKDD International Conference on Knowledge Discovery and Data Mining, New York, NY, USA, 21–24 August 2011; pp. 1046–1054.
- Noulas, A.; Scellato, S.; Lambiotte, R.; Pontil, M.; Mascolo, C. A tale of many cities: Universal patterns in human urban mobility. PLoS ONE 2012, 7, e37027. [Google Scholar] [CrossRef]
- Wei, L.Y.; Zheng, Y.; Peng, W.C. Constructing popular routes from uncertain trajectories. In Proceedings of the 18th ACM SIGKDD International Conference on Knowledge Discovery and Data Mining, Beijing, China, 12–16 August 2012; pp. 195–203.
- Bao, J.; Zheng, Y.; Mokbel, M.F. Location-based and preference-aware recommendation using sparse geo-social networking data. In Proceedings of the 20th International Conference on Advances in Geographic Information Systems, Redondo Beach, CA, USA, 7–9 November 2012; pp. 199–208.
- Sun, Y.; Li, M. Investigation of travel and activity patterns using location-based social network data: A case study of active mobile social media users. ISPRS Int. J. Geo-Inf. 2015, 4, 1512–1529. [Google Scholar] [CrossRef]
- Liu, Y.; Kang, C.; Gao, S.; Xiao, Y.; Tian, Y. Understanding intra-urban trip patterns from taxi trajectory data. J. Geogr. Syst. 2012, 14, 463–483. [Google Scholar] [CrossRef]
- Stathopoulos, A.; Karlaftis, M. Temporal and spatial variations of real-time traffic data in urban areas. Transp. Res. Rec. J. Transp. Res. Board 2001, 1768, 135–140. [Google Scholar] [CrossRef]
- Stathopoulos, A.; Karlaftis, M. A multivariate state space approach for urban traffic flow modeling and prediction. Transp. Res. Part C Emerg. Technol. 2003, 11, 121–135. [Google Scholar] [CrossRef]
- Jiang, B.; Yin, Y.; Zhao, S. Characterizing the human mobility pattern in a large street network. Phys. Rev. E 2009, 80. [Google Scholar] [CrossRef] [PubMed]
- González, M.C.; Hidalgo, C.; Barabási, A.L. Understanding individual human mobility patterns. Nature 2008, 453, 779–782. [Google Scholar] [CrossRef] [PubMed]
- Song, C.; Qu, Z.; Blumm, N.; Barabási, A.L. Limits of predictability in human mobility. Science 2010, 327, 1018–1021. [Google Scholar] [CrossRef] [PubMed]
- Song, C.; Koren, T.; Wang, P.; Barabási, A.L. Modelling the scaling properties of human mobility. Nat. Phys. 2010, 6, 818–823. [Google Scholar] [CrossRef]
- Bazzani, A.; Giorgini, B.; Rambaldi, S.; Gallotti, R.; Giovannini, L. Statistical laws in urban mobility from microscopic GPS data in the area of Florence. J. Stat. Mech. Theory Exp. 2010, 5. [Google Scholar] [CrossRef]
- Kang, C.; Ma, X.; Tong, D.; Liu, Y. Intra-urban human mobility patterns: An urban morphology perspective. Phys. A: Stat. Mech. Its Appl. 2012, 391, 1702–1717. [Google Scholar] [CrossRef]
- Liang, X.; Zheng, X.; Lu, W.; Zhu, T.; Xu, K. The scaling of human mobility by taxis is exponential. Phys. A: Stat. Mech. Its Appl. 2012, 391, 2135–2144. [Google Scholar] [CrossRef]
- Liang, X.; Zhao, J.; Dong, L.; Xu, K. Unraveling the origin of exponential law in intra-urban human mobility. Sci. Rep. 2013, 3. [Google Scholar] [CrossRef] [PubMed]
- Zipf, G.K. The P1P2/D hypothesis: On the intercity movement of persons. Am. Sociol. Rev. 1946, 11, 677–686. [Google Scholar] [CrossRef]
- Frank, L.; Pivo, G. Impacts of mixed use and density on utilization of three modes of travel: Single-occupant vehicle, transit, and walking. Transp. Res. Rec. 1994, 1466, 44–52. [Google Scholar]
- Van Acker, V.; Witlox, F. Commuting trips within tours: How is commuting related to land use? Transportation 2011, 38, 465–486. [Google Scholar] [CrossRef]
- Yuan, J.; Zheng, Y.; Xie, X. Discovering regions of different functions in a city using human mobility and POIs. In Proceedings of the 18th ACM SIGKDD International Conference on Knowledge Discovery and Data Mining, Beijing, China, 12–16 August 2012.
- Gainza, X.; Livert, F. Urban form and the environmental impact of commuting in a segregated city, Santiago de Chile. Environ. Plan. B Plan. Des. 2013, 40, 507–522. [Google Scholar] [CrossRef]
- Chowell, G.; Hyman, J.M.; Eubank, S.; Castillo-Chavez, C. Scaling laws for the movement of people between locations in a large city. Phys. Rev. E 2003, 68, 661021–661027. [Google Scholar] [CrossRef] [PubMed]
- Kang, C.; Liu, Y.; Wu, L. Delineating intra-urban spatial connectivity patterns by travel-activities: A case study of Beijing, China. In Proceedings of 23rd International Conference on Geoinformatics, Wuhan, China, 19–21 June 2015.
- Batty, M. Cities as small worlds. Environ. Plan. B Plan. Des. 2001, 28, 637–638. [Google Scholar] [CrossRef]
- Noulas, A.; Blake, S.; Renaud, L.; Mascolo, C. Topological properties and temporal dynamics of place networks in urban environments. In Proceedings of the 24th International Conference on World Wide Web Companion, Florence, Italy, 18–22 May 2015; pp. 431–441.
- Fu, Y.; Liu, G.; Papadimitriou, S.; Xiong, H.; Ge, Y.; Zhu, H.; Zhu, C. Real estate ranking via mixed land-use latent models. In Proceedings of the 21th ACM SIGKDD International Conference on Knowledge Discovery and Data Mining, Sydney, NSW, Australia, 10–13 August 2015; pp. 299–308.
- Karamshuk, D.; Noulas, A.; Scellato, S.; Nicosia, V.; Mascolo, C. Geo-spotting: mining online location-based services for optimal retail store placement. In Proceedings of the 19th ACM SIGKDD International Conference on Knowledge Discovery and Data Mining, Chicago, IL, USA, 11–14 August 2013.
- Georgiev, P.; Noulas, A.; Mascolo, C. Where businesses thrive: Predicting the impact of the Olympic Games on local retailers through location-based services data. In Proceedings of 8th AAAI International Conference on Weblogs and Social Media, Ann Arbor, MI, USA, 2–4 June 2014.
- Cranshaw, J.; Schwartz, R.; Hong, J.; Sadeh, N. The Livehoods project: Utilizing social media to understand the dynamics of a city. In Proceedings of the 6th International AAAI Conference on Weblogs and Social Media (ICWSM-12), Dublin, Ireland, 4–7 June 2012; pp. 58–65.
- Liu, Y.; Sui, Z.; Kang, C.; Gao, Y. Uncovering patterns of inter-urban trip and spatial interaction from social media check-in data. PLoS ONE 2014, 9, e86026. [Google Scholar] [CrossRef] [PubMed]
- Balcan, D.; Colizza, V.; Goncalves, B.; Hu, H.; Ramasco, J.J.; Vespignani, A. Multiscale mobility networks and the spatial spreading of infectious diseases. Proc. Natl. Acad. Sci. USA 2009, 106, 21484–21489. [Google Scholar] [CrossRef] [PubMed]
- Thiemann, C.; Theis, F.; Grady, D.; Brune, R.; Brockmann, D. The structure of borders in a small world. PLoS ONE 2010, 5, e15422. [Google Scholar] [CrossRef] [PubMed]
- Funk, S.; Salathé, M.; Jansen, V.A.A. Modelling the influence of human behaviour on the spread of infectious diseases: A review. R. Soc. 2010, 7, 1247–1256. [Google Scholar] [CrossRef] [PubMed]
- Belik, V.V.; Geisel, T.; Brockmann, D. The impact of human mobility on spatial disease dynamics. In Proceedings of 2009 IEEE International Conference on Computational Science and Engineering, Vancouver, BC, Canada, 29–31 August 2009; pp. 932–935.
- Wesolowski, A.; Eagle, N.; Tatem, A.J.; Smith, D.L.; Noor, A.M.; Snow, R.W.; Buckee, C.O. Quantifying the impact of human mobility on Malaria. Science 2012, 338, 267–270. [Google Scholar] [CrossRef] [PubMed]
- Miller, H.J. Tobler’s first law and spatial analysis. Ann. Assoc. Am. Geogr. 2004, 94, 284–289. [Google Scholar] [CrossRef]
- Toole, J.; Ulm, M.; González, M.; Bauer, D. Inferring land use from mobile phone activity. In Proceedings of the ACM SIGKDD International Workshop on Urban Computing, Beijing, China, 12 August 2012; pp. 1–8.
- Pan, G.; Qi, G.; Wu, Z.; Zhang, D.; Li, S. Land-use classification using taxi GPS traces. IEEE Trans. Intell. Transp. Syst. 2013, 14, 113–123. [Google Scholar] [CrossRef]
- Yuan, Y.; Raubal, M.; Liu, Y. Correlating mobile phone usage and travel behavior—A case study of Harbin, China. Comput. Environ. Urban Syst. 2012, 36, 118–130. [Google Scholar] [CrossRef]
- Guimerà, R.; Amaral, L.A.N. Cartography of complex networks: Modules and universal roles. J. Stat. Mech. Theory Exp. 2005. [Google Scholar] [CrossRef]
- Guimerà, R.; Mossa, S.; Turtschi, A.; Amaral, L.A.N. The worldwide air transportation network: Anomalous centrality, community structure, and cities’ global roles. Proc. Natl. Acad. Sci. USA 2004, 102, 7794–7799. [Google Scholar] [CrossRef] [PubMed]
- Newman, M. Fast algorithm for detecting community structure in networks. Phys. Rev. E 2004, 69. [Google Scholar] [CrossRef] [PubMed]
- Reichardt, J.; Bornholdt, S. Statistical mechanics of community detection. Phys. Rev. E 2006, 74. [Google Scholar] [CrossRef] [PubMed]
- Pons, P.; Latapy, M. Computing communities in large networks using random walks. J. Graph Algorithms Appl. 2006, 10, 191–218. [Google Scholar] [CrossRef]
- Rosvall, M.; Bergstrom, C.T. Maps of random walks on complex networks reveal community structure. Proc. Natl. Acad. Sci. USA 2007, 105, 1118–1123. [Google Scholar] [CrossRef] [PubMed]
- Department of City Planning (DCP). City of New York: MapPLUTO. Available online: http://www.nyc.gov/html/dcp/ (accessed on 1 January 2016).
- Clauset, A.; Shalizi, C.R.; Newman, M.E.J. Power-law distributions in empirical data. SIAM Rev. 2009, 51, 661–703. [Google Scholar] [CrossRef]
- Factbrowser: The Research Discovery Engine. Available online: http://www.factbrowser.com/tags/foursquare/ (accessed on 7 July 2010).


| Locality Characteristics | Male | Female | Wilcoxon Test p-Value |
|---|---|---|---|
| Percentage of links a venue has with 200NNs | 0.36 | 0.36 | >0.05 |
| The kth NN linked with a venue | 52 | 51 | >0.05 |
| Community | Node Count | Number of Intra-com Trips | Ratio * | Predominant Link Category | ||
|---|---|---|---|---|---|---|
| Start Category | End Category | Per (%) * | ||||
| 1 | 224 | 1900 | 633 | Eating | Eating | 14 |
| Shopping | Eating | 9 | ||||
| Eating | Shopping | 9 | ||||
| Shopping | Shopping | 8 | ||||
| Services | Services | 7 | ||||
| 2 | 134 | 729 | 243 | University | University | 16 |
| University | Office | 8 | ||||
| Office | University | 7 | ||||
| University | Eating | 7 | ||||
| Eating | University | 5 | ||||
| 3 | 309 | 581 | 22 | Shopping | University | 6 |
| Eating | Eating | 6 | ||||
| Nightlife | Eating | 6 | ||||
| Shopping | Eating | 6 | ||||
| Eating | Nightlife | 6 | ||||
| 4 | 123 | 568 | 568 | Office | Office | 19 |
| Office | Shopping | 10 | ||||
| Eating | Office | 7 | ||||
| Public Transport | Public Transport | 5 | ||||
| Shopping | Services | 5 | ||||
| Community | Predominant Land Use Category | Percentage (%) |
|---|---|---|
| 1 | One & Two Family Buildings | 34 |
| Multi-Family Walk-Up Buildings | 14 | |
| Multi-Family Elevator Buildings | 8 | |
| Public Facilities & Institutions | 8 | |
| Open Space & Outdoor Recreation | 7 | |
| 2 | One & Two Family Buildings | 49 |
| Public Facilities & Institutions | 15 | |
| Multi-Family Walk-Up Buildings | 12 | |
| Multi-Family Elevator Buildings | 9 | |
| Open Space & Outdoor Recreation | 6 | |
| 3 | Mixed Residential & Commercial Buildings | 28 |
| Public Facilities & Institutions | 20 | |
| Multi-Family Elevator Buildings | 15 | |
| Commercial & Office Buildings | 14 | |
| Multi-Family Walk-Up Buildings | 11 | |
| 4 | Commercial & Office Buildings | 74 |
| Transportation & Utility | 10 | |
| Mixed Residential & Commercial Buildings | 6 | |
| Multi-Family Elevator Buildings | 4 | |
| Public Facilities & Institutions | 2 |
© 2016 by the author; licensee MDPI, Basel, Switzerland. This article is an open access article distributed under the terms and conditions of the Creative Commons by Attribution (CC-BY) license (http://creativecommons.org/licenses/by/4.0/).
Share and Cite
Sun, Y. Investigating “Locality” of Intra-Urban Spatial Interactions in New York City Using Foursquare Data. ISPRS Int. J. Geo-Inf. 2016, 5, 43. https://0-doi-org.brum.beds.ac.uk/10.3390/ijgi5040043
Sun Y. Investigating “Locality” of Intra-Urban Spatial Interactions in New York City Using Foursquare Data. ISPRS International Journal of Geo-Information. 2016; 5(4):43. https://0-doi-org.brum.beds.ac.uk/10.3390/ijgi5040043
Chicago/Turabian StyleSun, Yeran. 2016. "Investigating “Locality” of Intra-Urban Spatial Interactions in New York City Using Foursquare Data" ISPRS International Journal of Geo-Information 5, no. 4: 43. https://0-doi-org.brum.beds.ac.uk/10.3390/ijgi5040043