Article

Assessment on the Impact of Arable Land Protection Policies in a Rapidly Developing Region

1
Institute of Rural Development and Information, Ningbo Academy of Agricultural Sciences, Ningbo 315040, China
2
Ningbo Institute of Land Planning and Surveying, Ningbo 315042, China
3
College of Resource and Environment Sciences, Xinjiang University, Urumqi 830046, China
4
Institute of Digital Agriculture, Zhejiang Academy of Agricultural Sciences, Hangzhou 310021, China
5
Institution of Remote Sensing and Information System Application, Zhejiang University, Hangzhou 310058, China
*
Author to whom correspondence should be addressed.
ISPRS Int. J. Geo-Inf. 2016, 5(5), 69; https://0-doi-org.brum.beds.ac.uk/10.3390/ijgi5050069
Submission received: 24 March 2016 / Revised: 9 May 2016 / Accepted: 10 May 2016 / Published: 16 May 2016

Abstract

:
To investigate the effect of arable land protection policies in China, a practical framework that integrates geographic information systems (GIS), soil quality assessment and landscape metrics analysis was employed to track and analyze arable land transformations and landscape changes in response to rampant urbanization within the Ningbo region (China) from 2005 to 2013. The results showed that arable land loss and degradation have continued, despite the development of a comprehensive legal framework for arable land protection. The implementation of arable land protection policies is judged to be effective, but not entirely successful, because it guarantees the overall amount of arable land but does not consider soil quality and spatial distribution. In addition, there are distinct variations in arable land change dynamics between two temporal intervals. From 2005–2009, the transformation of arable land was diversified, with intensified conversion among arable land, built-up land, water and orchards. Moreover, many new arable land parcels were adjacent to built-up land, and are in danger of being occupied again through urban sprawl. By 2009–2013, most of the arable land was occupied by urban expansion, whereas a majority of newly increased arable land was reclaimed from coastal tideland. Although the newly increased arable land was contiguous and far from the urban area, it is of poor quality and has limited use. The permanent loss of high-quality arable land due to intensified urban sprawl may threaten sustainable development and food security on a larger scale.

1. Introduction

Urbanization is occurring at an unprecedented pace around the world, especially in developing countries. The encroachment of arable land by built-up land sprawl has placed a tremendous pressure on already limited arable land resources and food security in China. This is particularly true in the southeastern provinces, where land is relatively fertile and the multiple cropping index is high [1]. Moreover, the combined effect of population growth, national food security imperatives and the scarcity of land for development has led to an increasing demand for arable land protection [2].
The Chinese government has implemented a series of land management solutions to preserve the limited arable resources [3]. These solutions include (1) controlling the sealing intensity by setting a long-term plan for converting arable land to land used for construction, such as the “General Land Use Plan”, which went into effect in 1999 [4]; (2) zoning highly productive arable land for special and stringent protection, such as the “Basic Arable Land Protection Regulation” promulgated in 1994 and 1998 [5],where prime arable land requires national approval to be used for non-arable purposes; and (3) supplementing arable land with land management, including land exploitation, consolidation or rehabilitation, such as the “Arable Land Balance Programs” that have been in place since the late 1990s [3].Among these solutions, the arable land supplementation project has been viewed as a direct and crucial attempt by the Chinese government to preserve arable land. It requires local governments to reclaim a certain amount of land (mainly rehabilitating damaged land and reusing deserted land) to offset their loss through land development.
Arable land has thus experienced significant transformations during the past decades. Nevertheless, these strict arable land protection policies are still inefficient, considering the increasing economic development demands [6]. Consequently, a systematic analysis of the trajectory of arable land transformations, accompanied by systematic evidence regarding the causes, rate and distribution, is critical for arable land management and preservation. Considerable efforts have been made to discuss those arable land protection strategies [3,7], giving rise to intense public interest. Empirically, assessing the overall impact and function of these strategies remains a challenge, considering that accurate historical observation data are unobtainable and field surveys are very expensive.
Moreover, rampant urbanization in the absence of scientific land planning led to increasingly fragmented, instable, and irregular arable patches [8,9]. This hinders the ability to increase the productivity and the sustainability of arable land resources in developing countries. During the past two decades, the Chinese government was struggling with how to effectively address arable land loss and associated problems [10]. However, the spatiotemporal dynamics of arable landscapes during the implementation of arable land protection strategies have not been examined, and there is a lack of adequate quantitative measurements for assessing land use planning and management with regard to sustainability.
The Ningbo region is a sub-provincial-level metropolis. It is also the second largest city in Zhejiang Province and a major city in the southern branches of the Yangtze River Delta. This region was selected as the study area to gain an in-depth estimate of the impacts of arable land protection policies. With ongoing pressure to create economic growth, the scarcity of land and resources has been an increasingly critical concern for local governments. Land use maps and soil survey maps are combined to explore the arable land transformations during the past decade and to evaluate the arable land protection policies regarding the prospects of soil quality and spatial patterns. We specifically attempt to (1) characterize the transformations of arable land due to rapid urbanization during different temporal intervals; (2) quantitatively assess and compare soil quality and landscape patterns of arable land; and (3) evaluate the arable land protection policies from the perspectives of sustainable urbanization and food security.

2. Study Area and Database
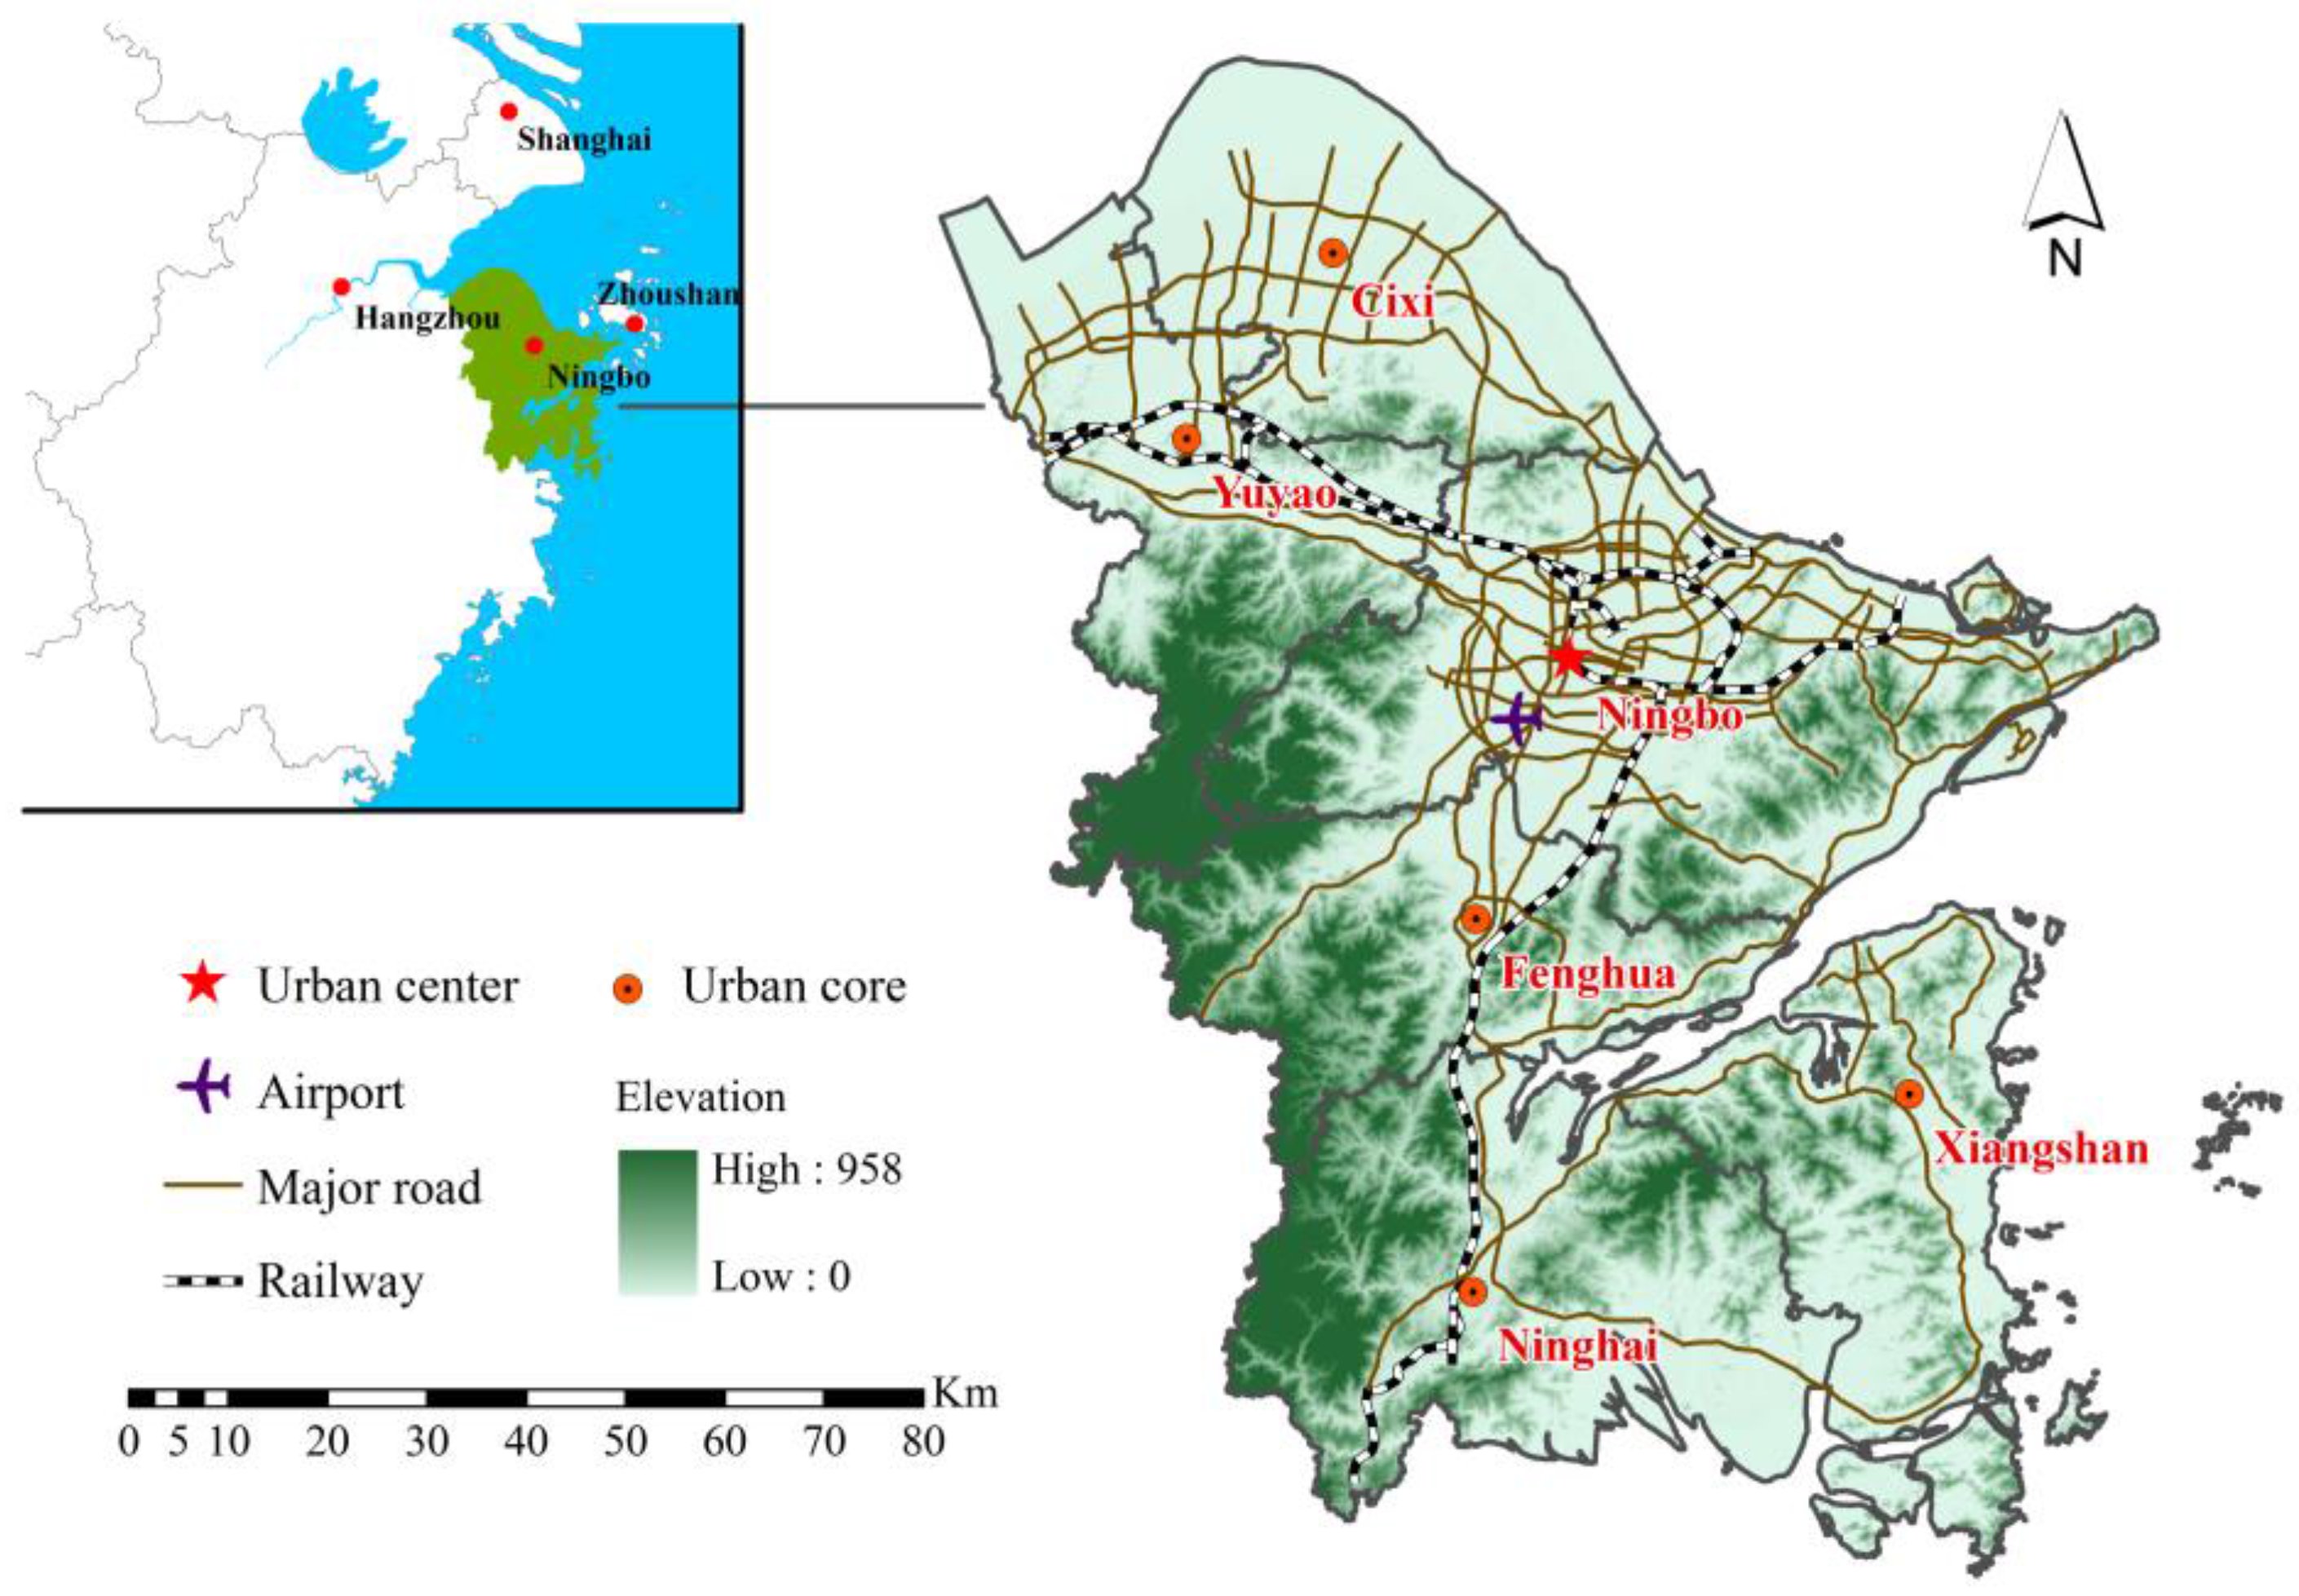
2.1. Study Area

Ningbo is the second largest city in Zhejiang Province and has been nominated as a sub-provincial-level metropolis by the central government. It is situated on the eastern seaboard of China and the south branch of the Yangtze River Delta (Figure 1). This study was conducted in the administrative boundaries of the Ningbo region, which covers one urban area (Ningbo) and five counties (namely Yuyao, Cixi, Fenghua, Xiangshan and Ninghai), with a total area of 9816 km2. At the end of 2013, there were 5.8 million registered permanent residents, and the local Gross Domestic Product (GDP) per capita was 123,139 RMB Yuan (equivalent to 19,578 US dollars). As one of the richest regions in China, it has experienced significant economic development and population growth during the past decades. The opening of the Hangzhou Bay Cross-sea Bridge in 2008 reduced the distance between Ningbo and Shanghai by almost 120 kilometers. This has significantly accelerated the local economic and cultural development of Ningbo.

2.2. Data and Preprocessing

Four main datasets were used in this study. First, digital land use maps for the years 2005, 2009 and 2013 were provided by the Ningbo Municipal Bureau of National Land and Resources. The dataset was interpreted from aerial photographs acquired in 2005, 2009 and 2013, with 1 m spatial resolution. Professional interpreters with the local land resources department used the binocular vision method, accompanied by field surveys, to classify aerial photographs. The validated overall accuracy exceeded 98%. In this study, the land use types were aggregated into six categories for analysis: grass land, water (mainly rivers, ponds, and reservoirs), forest, barren land (abandoned land and coastal tideland), built-up land (impervious surface, such as roads, residences) and orchards. Second, a Digital Elevation Model (DEM) with 30 m resolution, downloaded from the U.S. Geological Survey (USGS) website, was used for topographic calculation. Third, a soil survey database of the Ningbo region with a scale of 1:250,000 was derived from the Second National Soil Survey of China, which was conducted in 1979–1982. It includes a number of variables describing the structure of surveyed soil types and their physical and chemical characteristics. Finally, demographic and other socio-economic data were obtained from the Ningbo Statistical Yearbooks.

3. Method

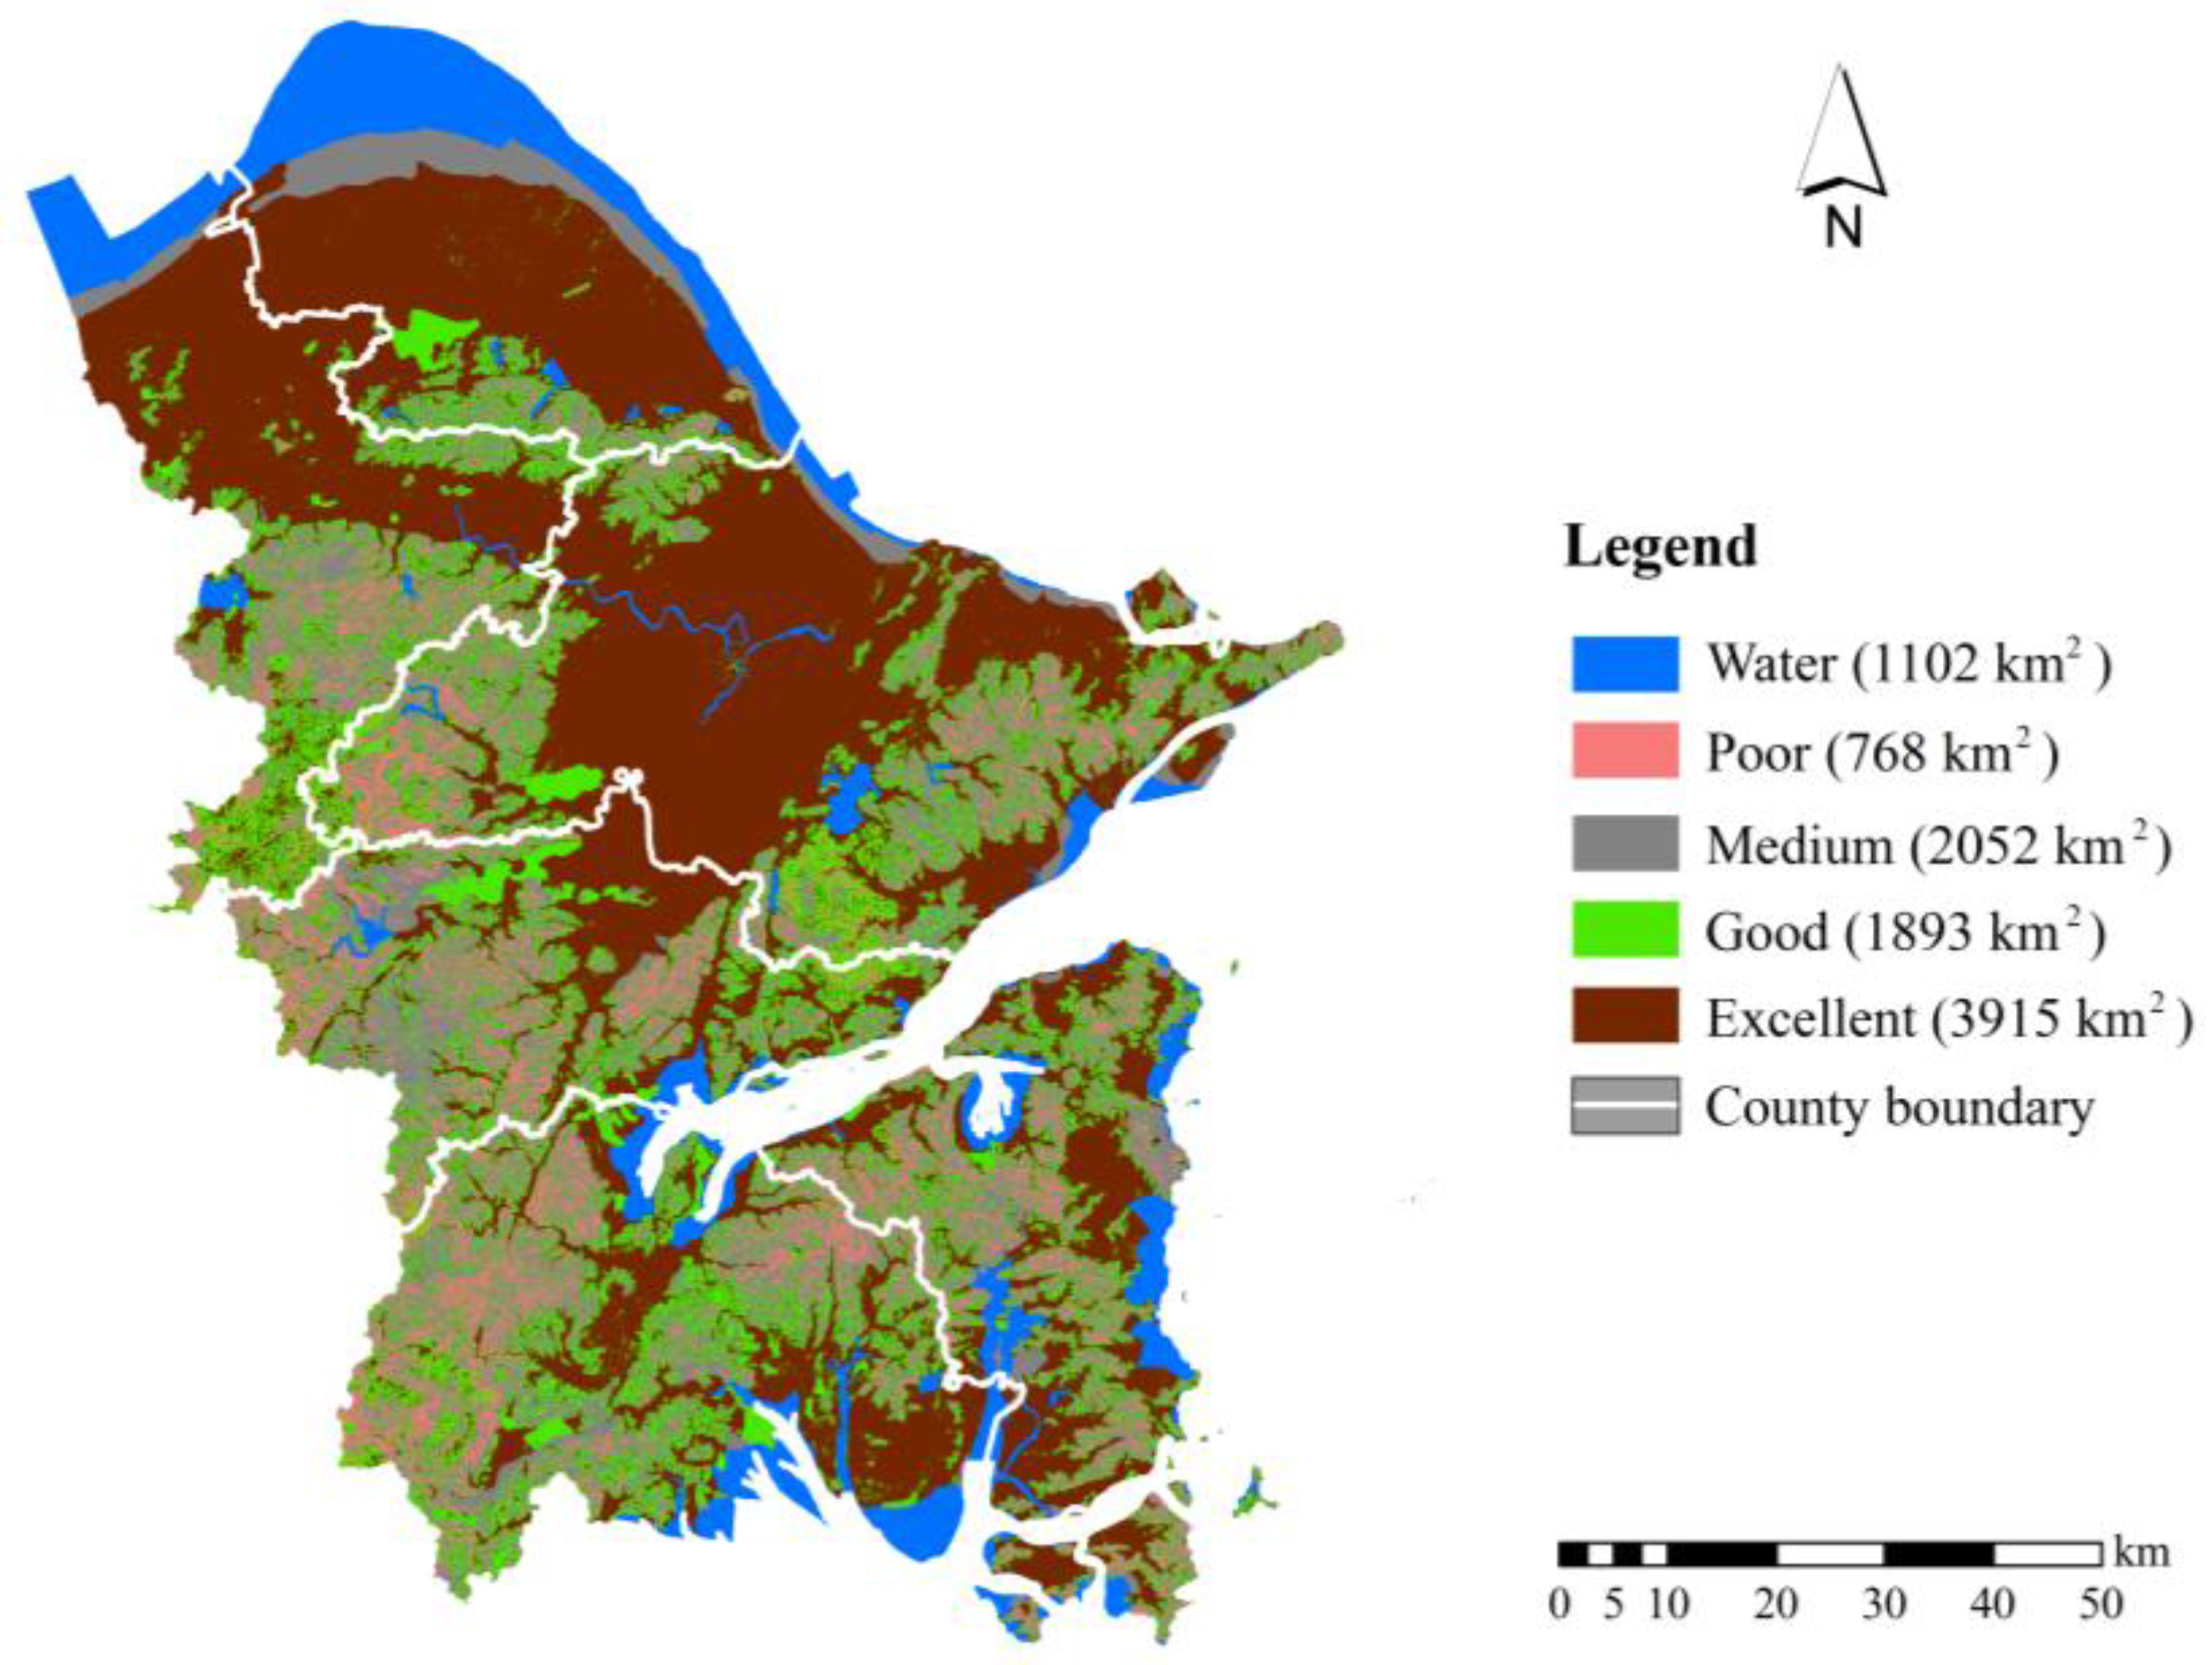
3.1. Soil Quality Assessment

To estimate the soil quality of the lost/increased arable lands, the spatial transition of arable land maps was laid over the field soil quality map, which was derived from the field soil survey map. Briefly, eight variables (soil texture, soil depth, soil organic matter (SOM), total nitrogen (TN), available phosphorus (AP), available potassium (AK), pH and slope) were selected and aggregated into an integrated soil quality index (Appendix A) to describe the potential for soil productivity and cultivation suitability. The detailed procedure can be found in Li et al. [11]. Water accounted for 11.3% of the entire Ningbo administrative region. Four soil quality categories were identified based on the calculated soil quality values: Excellent (soil quality value ranges from 0.66 to 0.82, accounting for 40.2% of the entire Ningbo region), Good (soil quality: 0.5~0.66; presence: 19.5%), Medium (soil quality: 0.34~0.5; presence: 21.1%) and Poor (soil quality: 0.18~0.34; presence: 7.9%). Figure 2 shows the spatial distribution of soil quality categories. The Excellent soils, which offer the best guarantee for stable production using organic, low-input agriculture, are mainly distributed in the central plain region of Ningbo, Yuyao County and Cixi County. The Poor soils are distributed in the surrounding mountain region where the slope exceeds 25°. This type of soil is not suitable for arable production.

3.2. Landscape Metric Analysis

Landscape metrics effectively externalize complex spatial landscape characteristics into identifiable patterns. A great many landscape metrics have been developed and are widely used [12,13]. In this study, we selected several common landscape metrics to quantize the spatial patterns of lost and newly reclaimed arable land: patch density (PD), mean patch size (MPS), and mean shape index (MSI). In addition to these three indices, two additional indices were proposed to describe the spatial contiguity of converted arable land. The indices include: adjacency of arable patch with surrounding arable patch (abbreviated as Ca), and adjacency of arable patch with surrounding built-up patch (abbreviated as Cb). Table 1 provides the computational equations along with their ecological characteristics.
Contiguity is a key measure of fragmentation. When arable parcels connect to other existing arable parcels, it creates a large agglomeration of land available for farming [8]. In contrast, isolated arable parcels that are not contiguous with the other arable parcels often experience negative impacts, and small parcels are gradually abandoned. Previous studies also suggest that arable parcels in close proximity to built-up land, cities or transportation systems are the first victims of settlement expansion, especially in those developing countries experiencing rapid urbanization [14,15]. Figure 3a shows the spatial distribution of lost arable plots between 2005 and 2009. The calculated Ca and Cb are 78.3 and 21.7 for Patch A, and 72.3 and 41.5 for Patch B, respectively. Figure 3b shows the newly increased arable plots between 2005 and 2009. The calculated values of Ca and Cb are 40.4 and 0 for Patch C, and 41.7 and 31.9 for Patch D, respectively.

4. Results

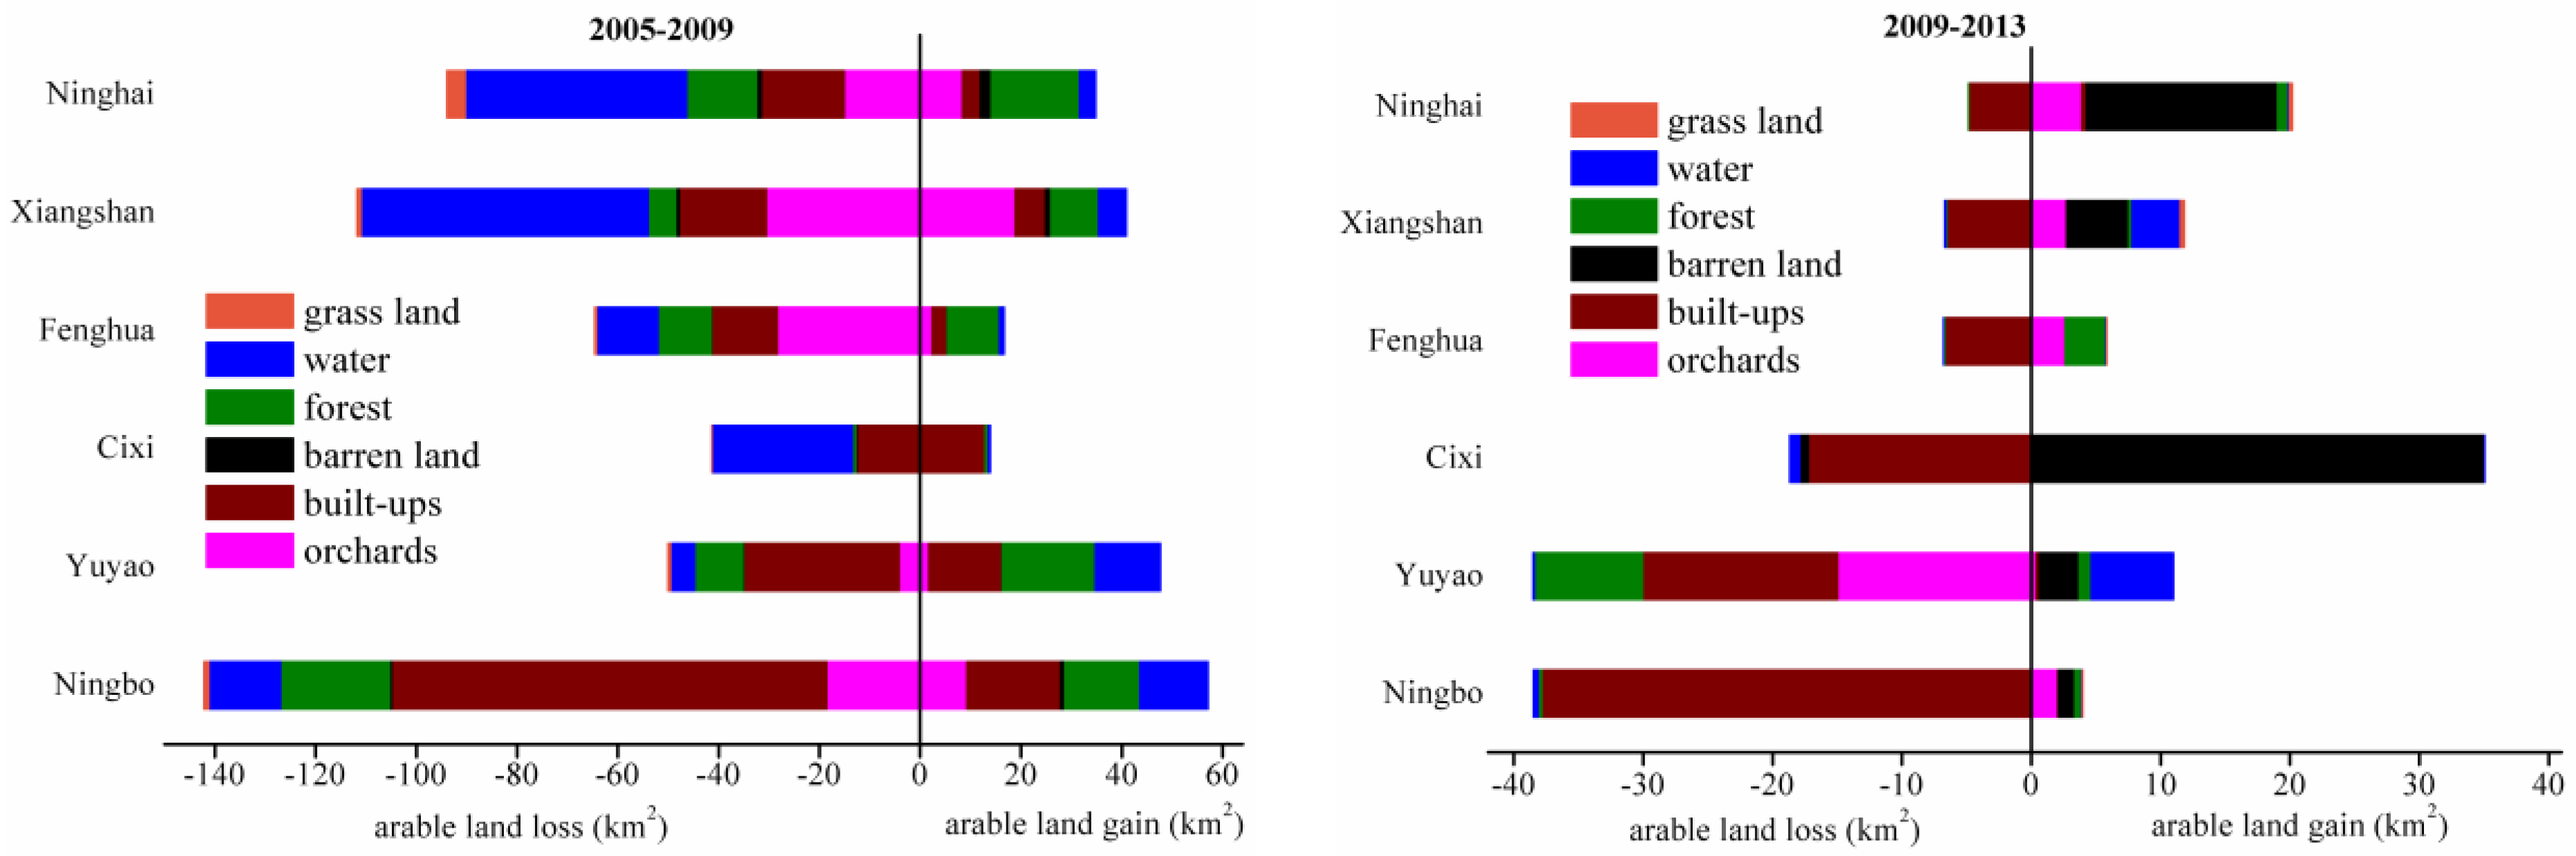
4.1. General Characteristics of Arable Land Changes

During the entire study period, a total area of 617.9 km2 of arable land was lost, whereas another 299 km2 of land became supplementally increased. However, there is a clear distinction between two temporal intervals. During 2005–2009, there was a more intense arable land loss, at an area of 503.9 km2, which was more than four times higher than during 2009–2013. Two cities, namely Ningbo City and Xiangshan County, experienced significant loss of arable land. In contrast, the area of newly increased arable land was 211 km2 during 2005–2009 and 87.9 during 2009–2013.
Moreover, there were significant variations in arable land transitions during the two temporal intervals. As Figure 4 shows, from 2005 to 2009, 35% of the lost arable land was converted to built-up land, and 31.8% was converted to water. An in-depth investigation revealed that the majority of the increased water area was in the form of artificial ponds for fish aquaculture. In contrast, from 2009 to 2013,the majority (77.4%) of the lost arable land was converted to built-up land. In addition, the newly increased arable land from 2005 to 2009 was mainly reclaimed from forest (33.8%) and built-up land (27.5%).The large amounts of conversion from built-up land to arable land during this period are quite remarkable, and are discussed later in this paper. From 2009–2013, 67% of the increased arable land was reclaimed from barren land; nearly all of this land was in the form of enclosed coastal mud flats in Cixi and Ninghai Counties.

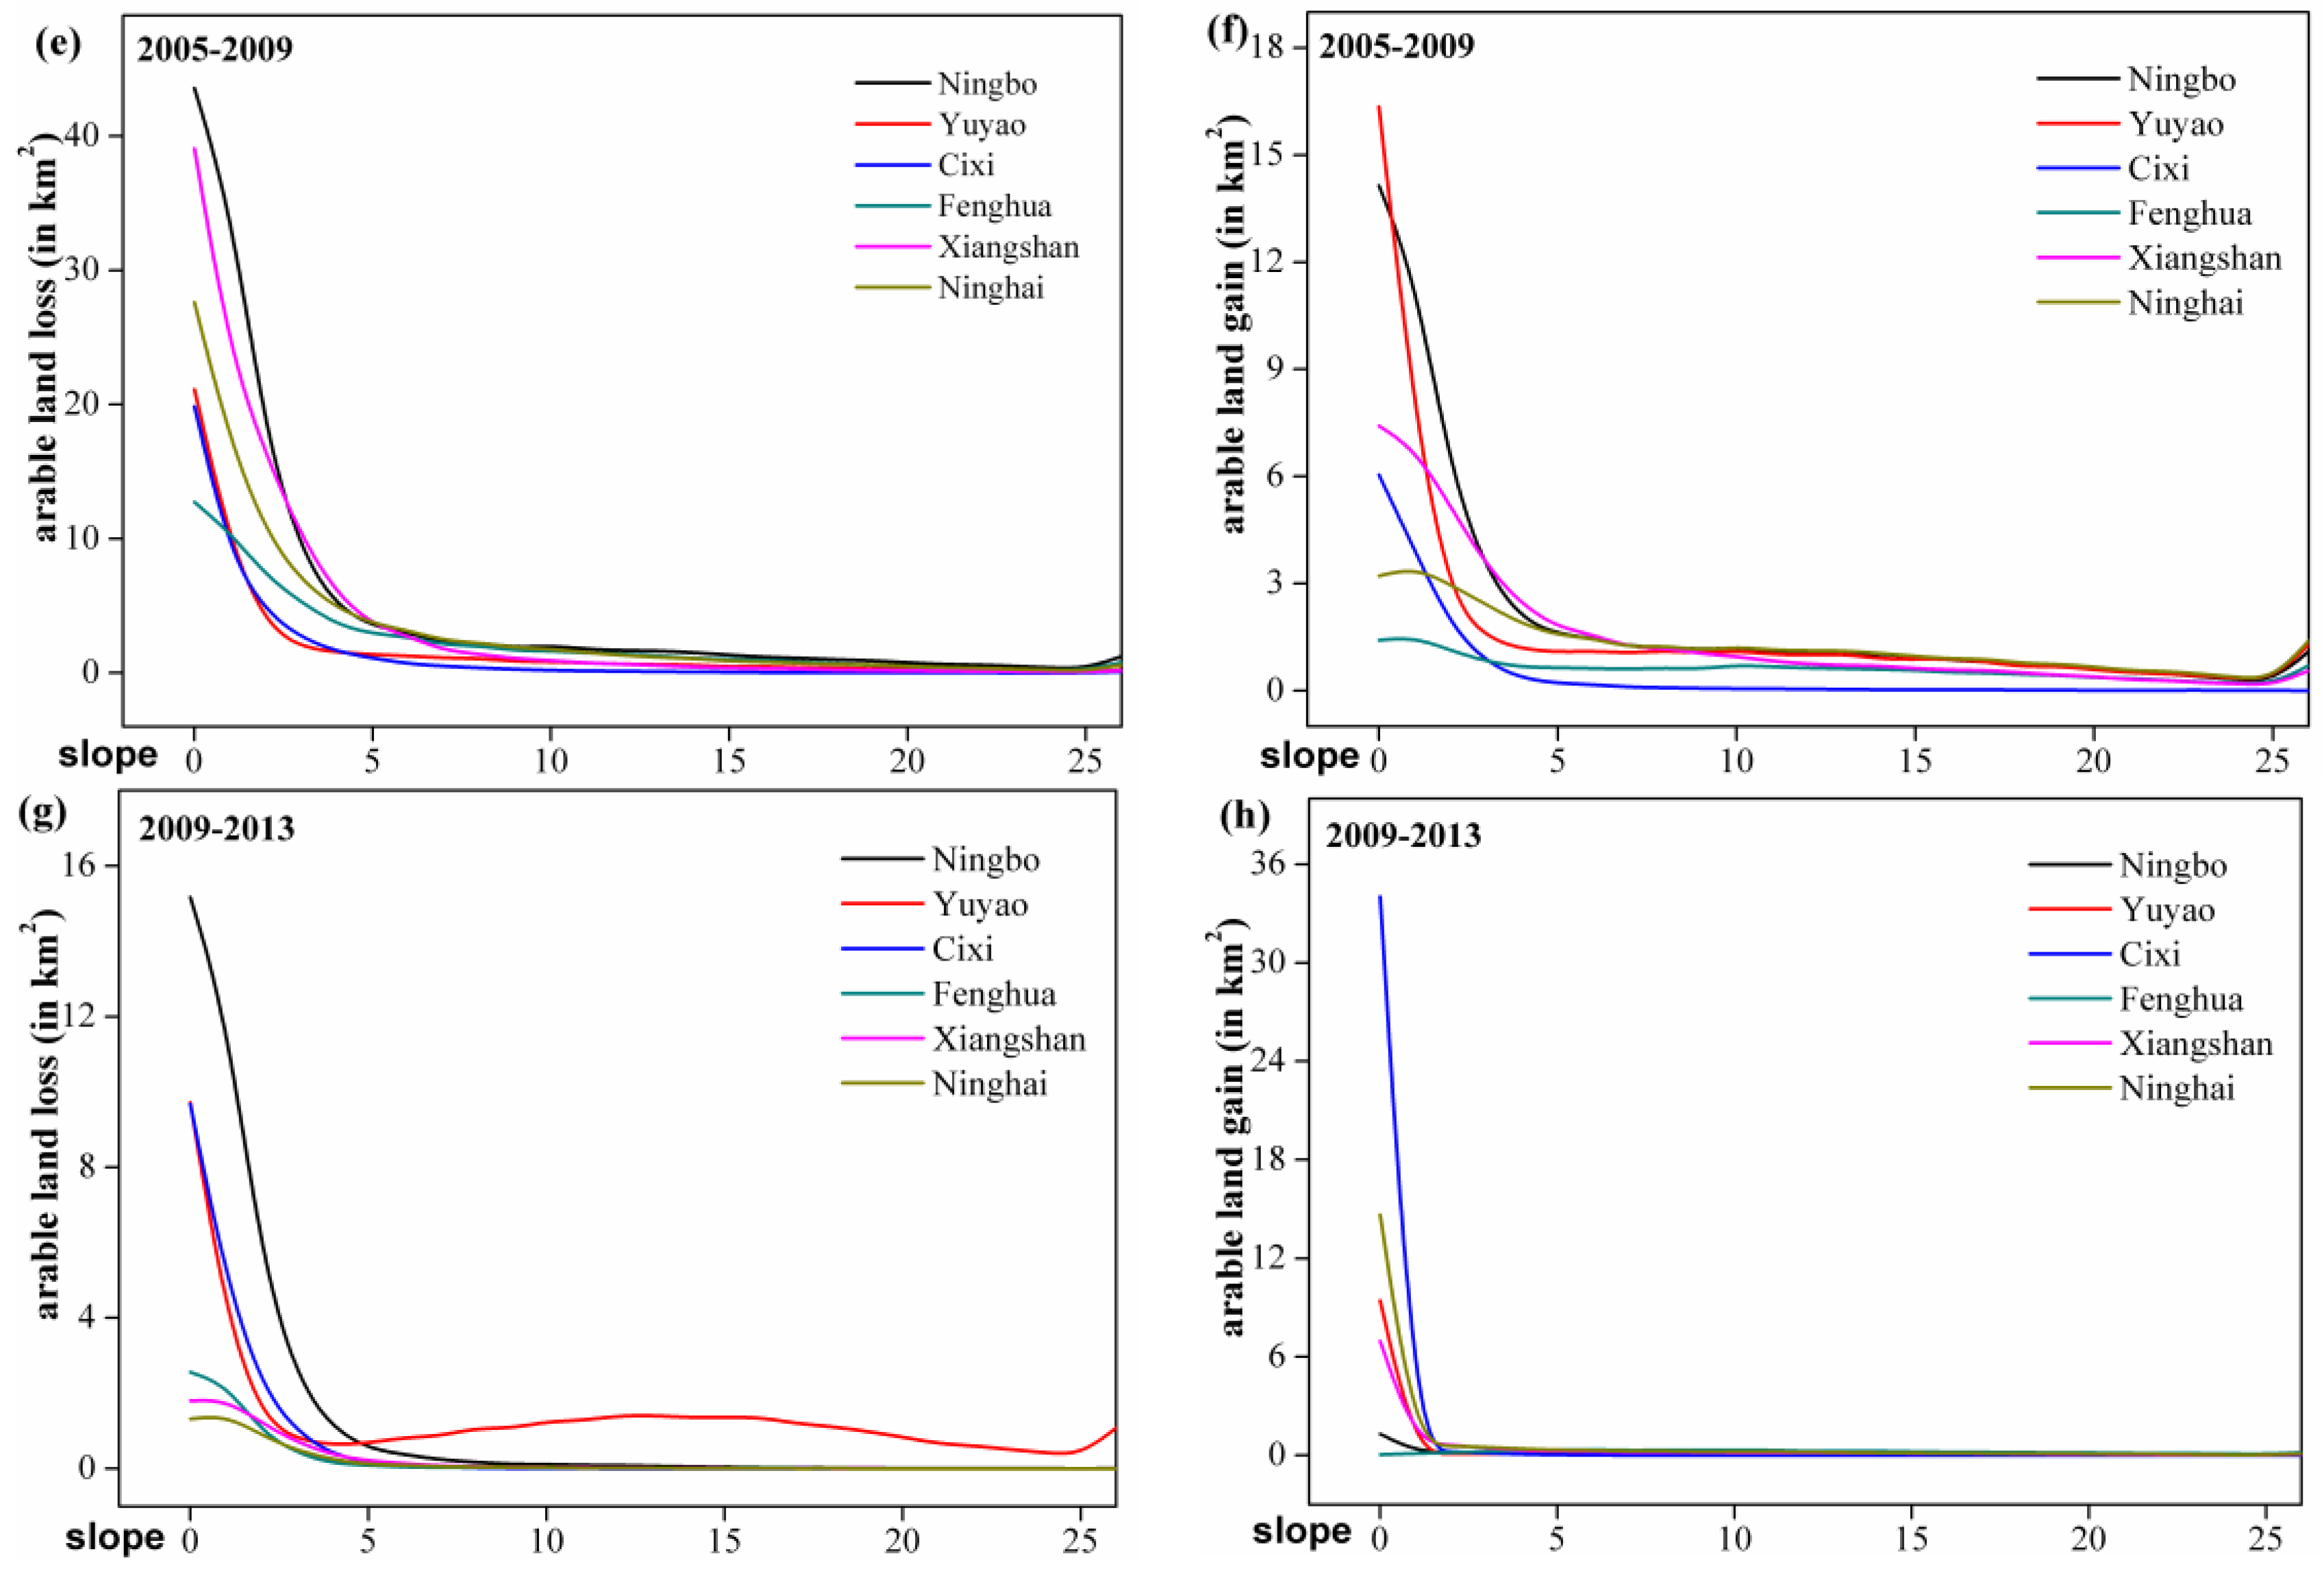
4.2. Terrain Comparison between Lost and Increased Arable Land

The spatial topography analysis indicated that from 2005 to 2009, a large amount of arable land located at low elevation was lost. The new arable land was mainly concentrated in areas with elevations of 5 or 6 m. Slope assessments revealed that flat arable lands were vulnerable to being occupied. As estimated in Figure 5e,f, 80.2% of the lost arable lands from 2005 to 2009 were in regions with a slope less than 5°.In contrast, this accounts for only 62.1% for the new arable land. Furthermore, an area of 5.1 km2 with slopes greater than 25° was reclaimed to offset the land loss through land development over the study period.

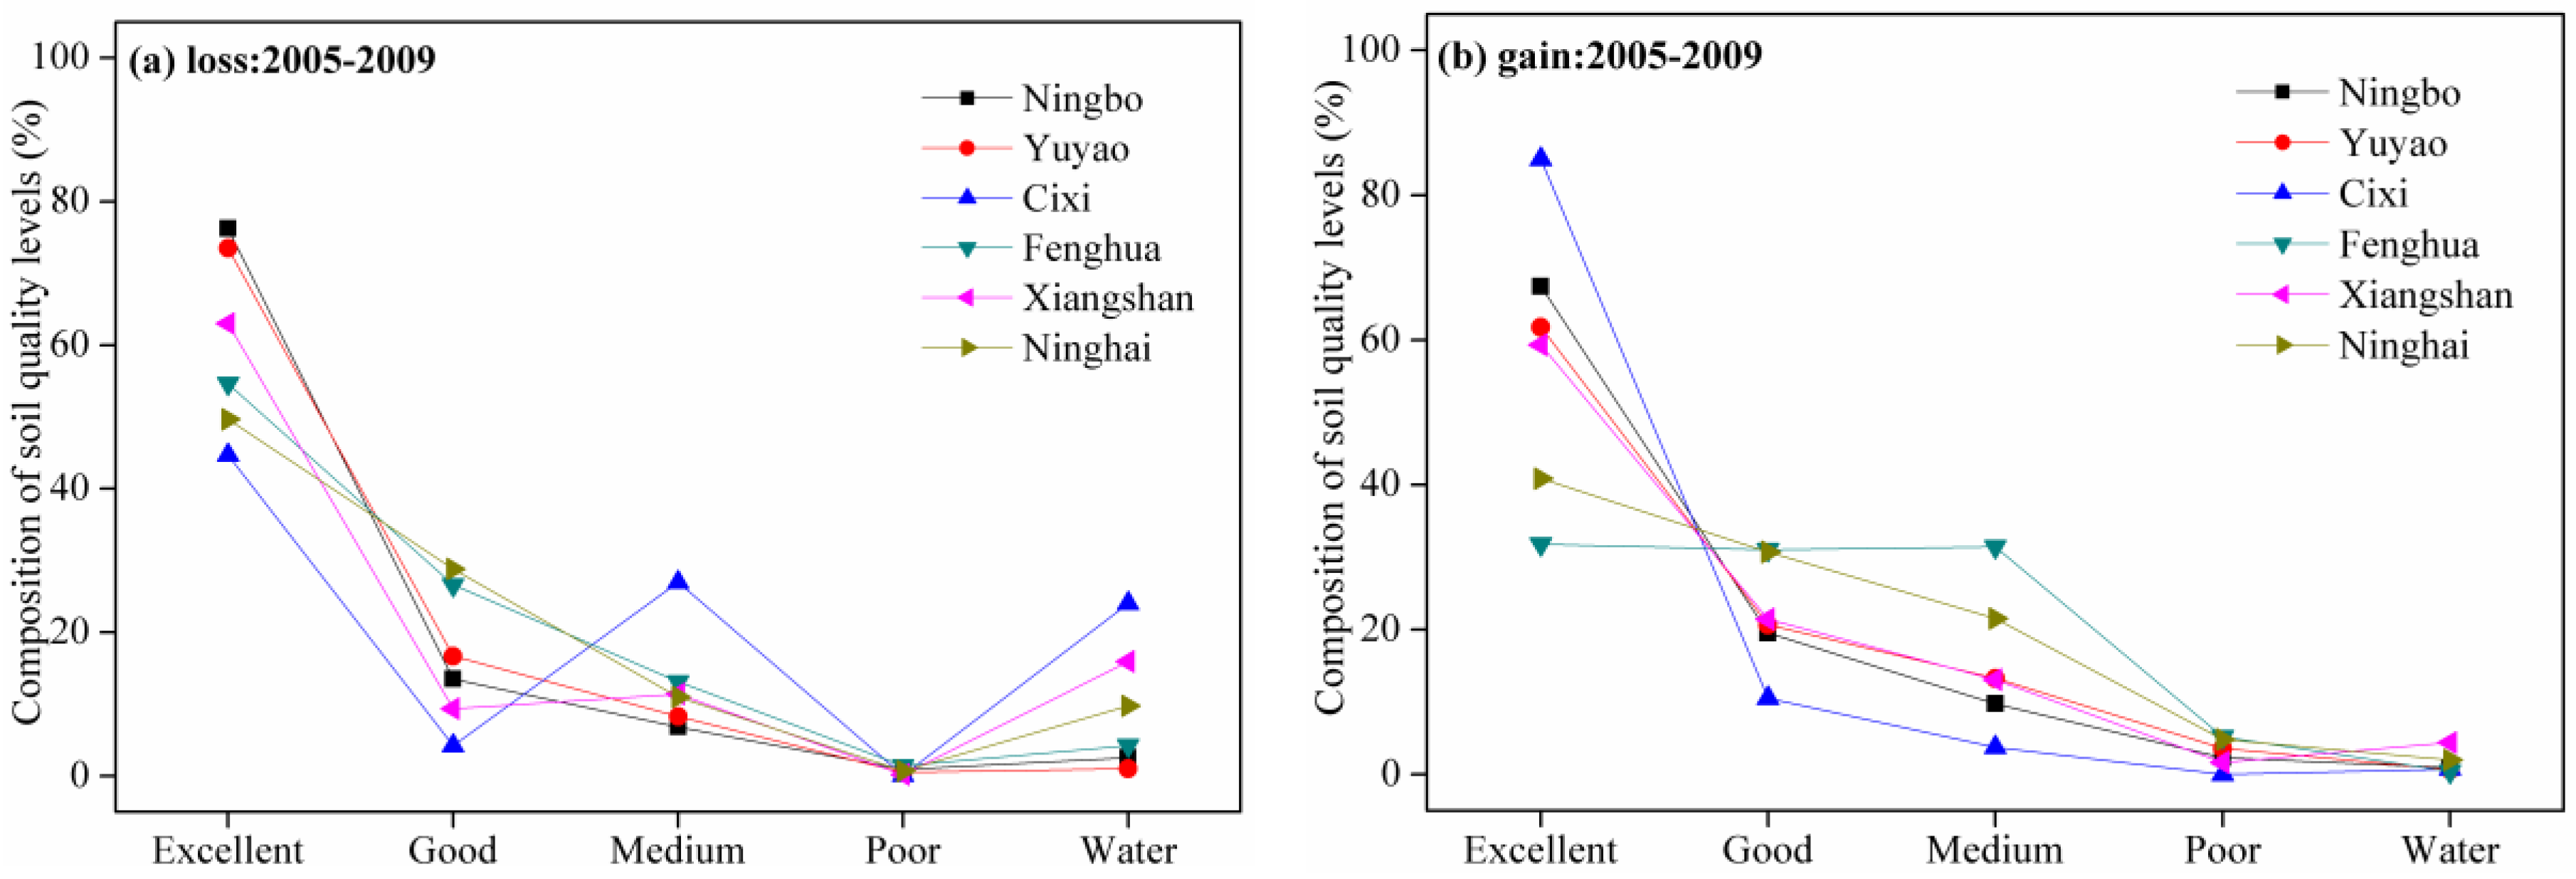
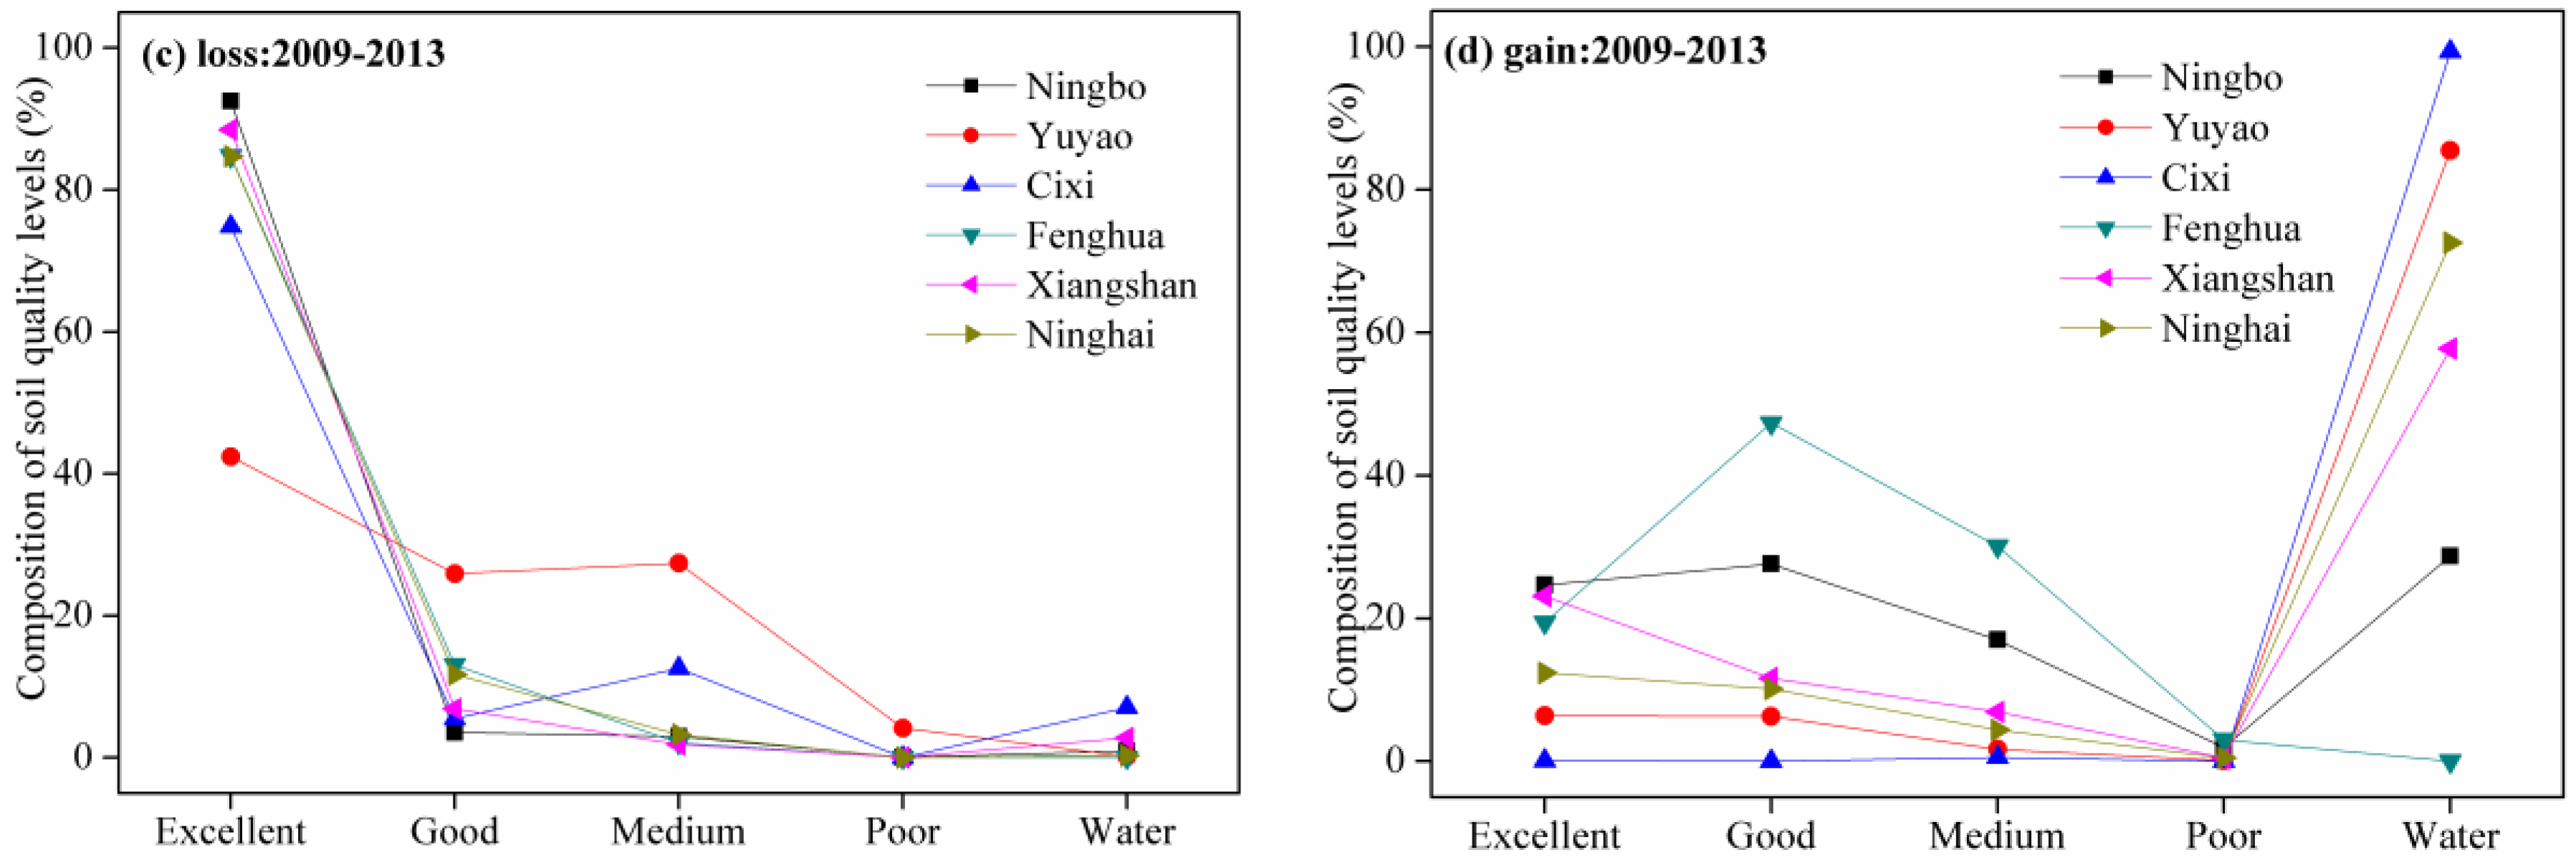
4.3. Soil Quality Comparison between Lost and Increased Arable Lands

From 2005 to 2009, the soil quality of newly reclaimed arable lands was slightly lower than the quality of lost arable lands in the individual cities. The exception was Cixi County, where the percentage of Excellent soils for the lost and increased arable land was 44.7% and 84.9%, respectively (Figure 6a,b). However, in 2009–2013, water was the dominant composition of the newly reclaimed arable lands in the other five counties, except for Fenghua County. Land reclamation from the sea became a characteristic and important phenomenon for the Ningbo region starting in the 2010s. This is in sharp contrast with the abundant loss of arable land with Excellent soils. In Cixi County, for example, almost all of the increased arable land (99.3%) was reclaimed from enclosed coastal tidelands from 2009 to 2013, followed by Yuyao County (85.5%) and Ninghai County (72.6%). Those reclaimed regions were still sea water during the latest national soil survey conducted in the 1980s.

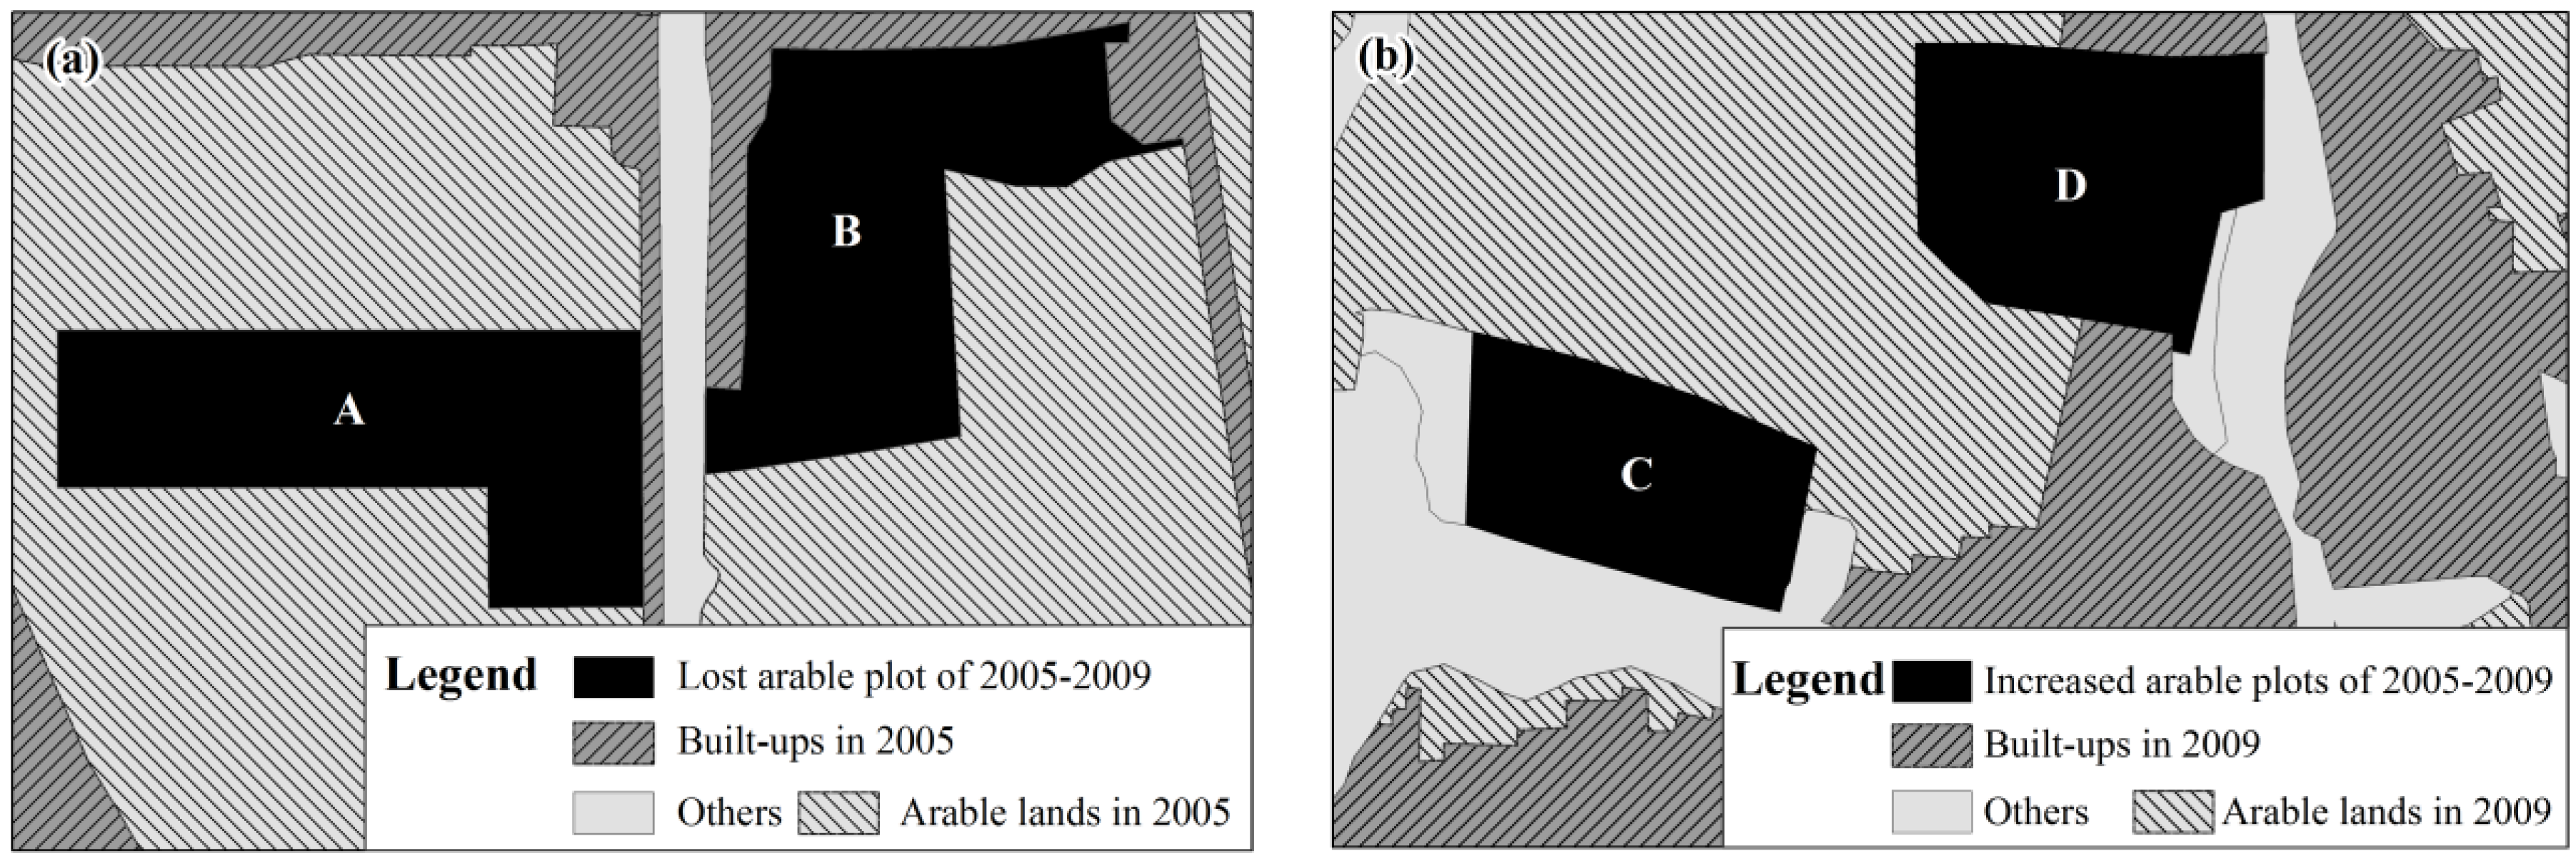
4.4. Spatio-Temporal Pattern Comparison between Lost and Increased Arable Lands

Table 2 shows a distinction in the spatial patterns of lost and newly increased arable land patches among the different cities during the two temporal intervals. Generally, large tracks of arable land patches were occupied with contiguous farmland. The newly increased arable land is more scattered and irregular.
From 2005 to 2009, the average scale of lost arable patches was larger than those of newly increased ones (declines in MPS). Also, most of the arable land was occupied with a large mass of contiguous farmland, with approximately 70% of its border connecting to arable lands. In Cixi County, the Ca value reached 92.2%, revealing that originally contiguous arable lands were broken up by other land use types. In contrast, the newly increased arable land during this period was less connected to existing arable land. Moreover, a large portion of increased arable land was in close proximity to built-up land. The majority of the newly increased arable land in Cixi County was surrounded by built-up land, with a Cb of 87.9%. There is a high risk that the land will be urbanized in the near future, which would be a waste of significant reclamation fees. However, during 2009–2013, the scale of lost arable land decreased compared with 2005–2009, whereas the newly increased arable land was larger in scale, more adjacent to existing farmland, and less connected to built-up land.

5. Discussion

5.1. Critical Issue of Arable Land Loss

As urbanization intensified in the Ningbo region during the past decade, a large amount of farmland was lost to urban sprawl; similar transitions are taking place nationwide [16]. Official statistics showed that 3340 km2 of arable land was occupied by urbanization between 1986 and 2003 [17]. Agricultural land is always the first choice for conversion when faced with increasing concentrations of economy and population, because there are few obstacles to human activities expected across the space [6]. The loss of arable land is more significant in the economically developing eastern coastal region of China, such as the Jing-Jin-Ji region [5] and the Su-Xi-Chang region [18], where fertile and productive arable land is mainly distributed [15]. Development demands have placed immense pressure on already limited arable land resources. Declines in the total area of arable land would result in a lower ability to self-supply and could threaten regional food security.
Lost arable land can become occupied by construction occupations, its arable structure may be adjusted, or the land may be abandoned due to disasters [1,5]. Regarding the economically developing eastern coastal region of China, anthropogenic factors are the main cause of the sharp decline in arable land. Our study supports this argument, as the majority of the lost arable land in the Ningbo region during the past decade was converted to built-up land, water (aquaculture ponds), and orchards. Profitability from aquaculture and nursery orchards is much higher than from crop production. This difference motivates many farmers to change their planting structure. As a result, a large amount of farmland has been converted into economic orchards in northern China or to aquaculture ponds in the south [19,20]. The “Grain for Green” project also contributes to the conversion from arable land to forest, as farmers are required to return farmland to forest in steep slope hilly areas to prevent soil erosion, flooding and water shortages [21]. However, along with the stricter controls over farmland conversion in recent years, built-up land has become the preferred way to meet increasing demands for living and working space as the population grows.

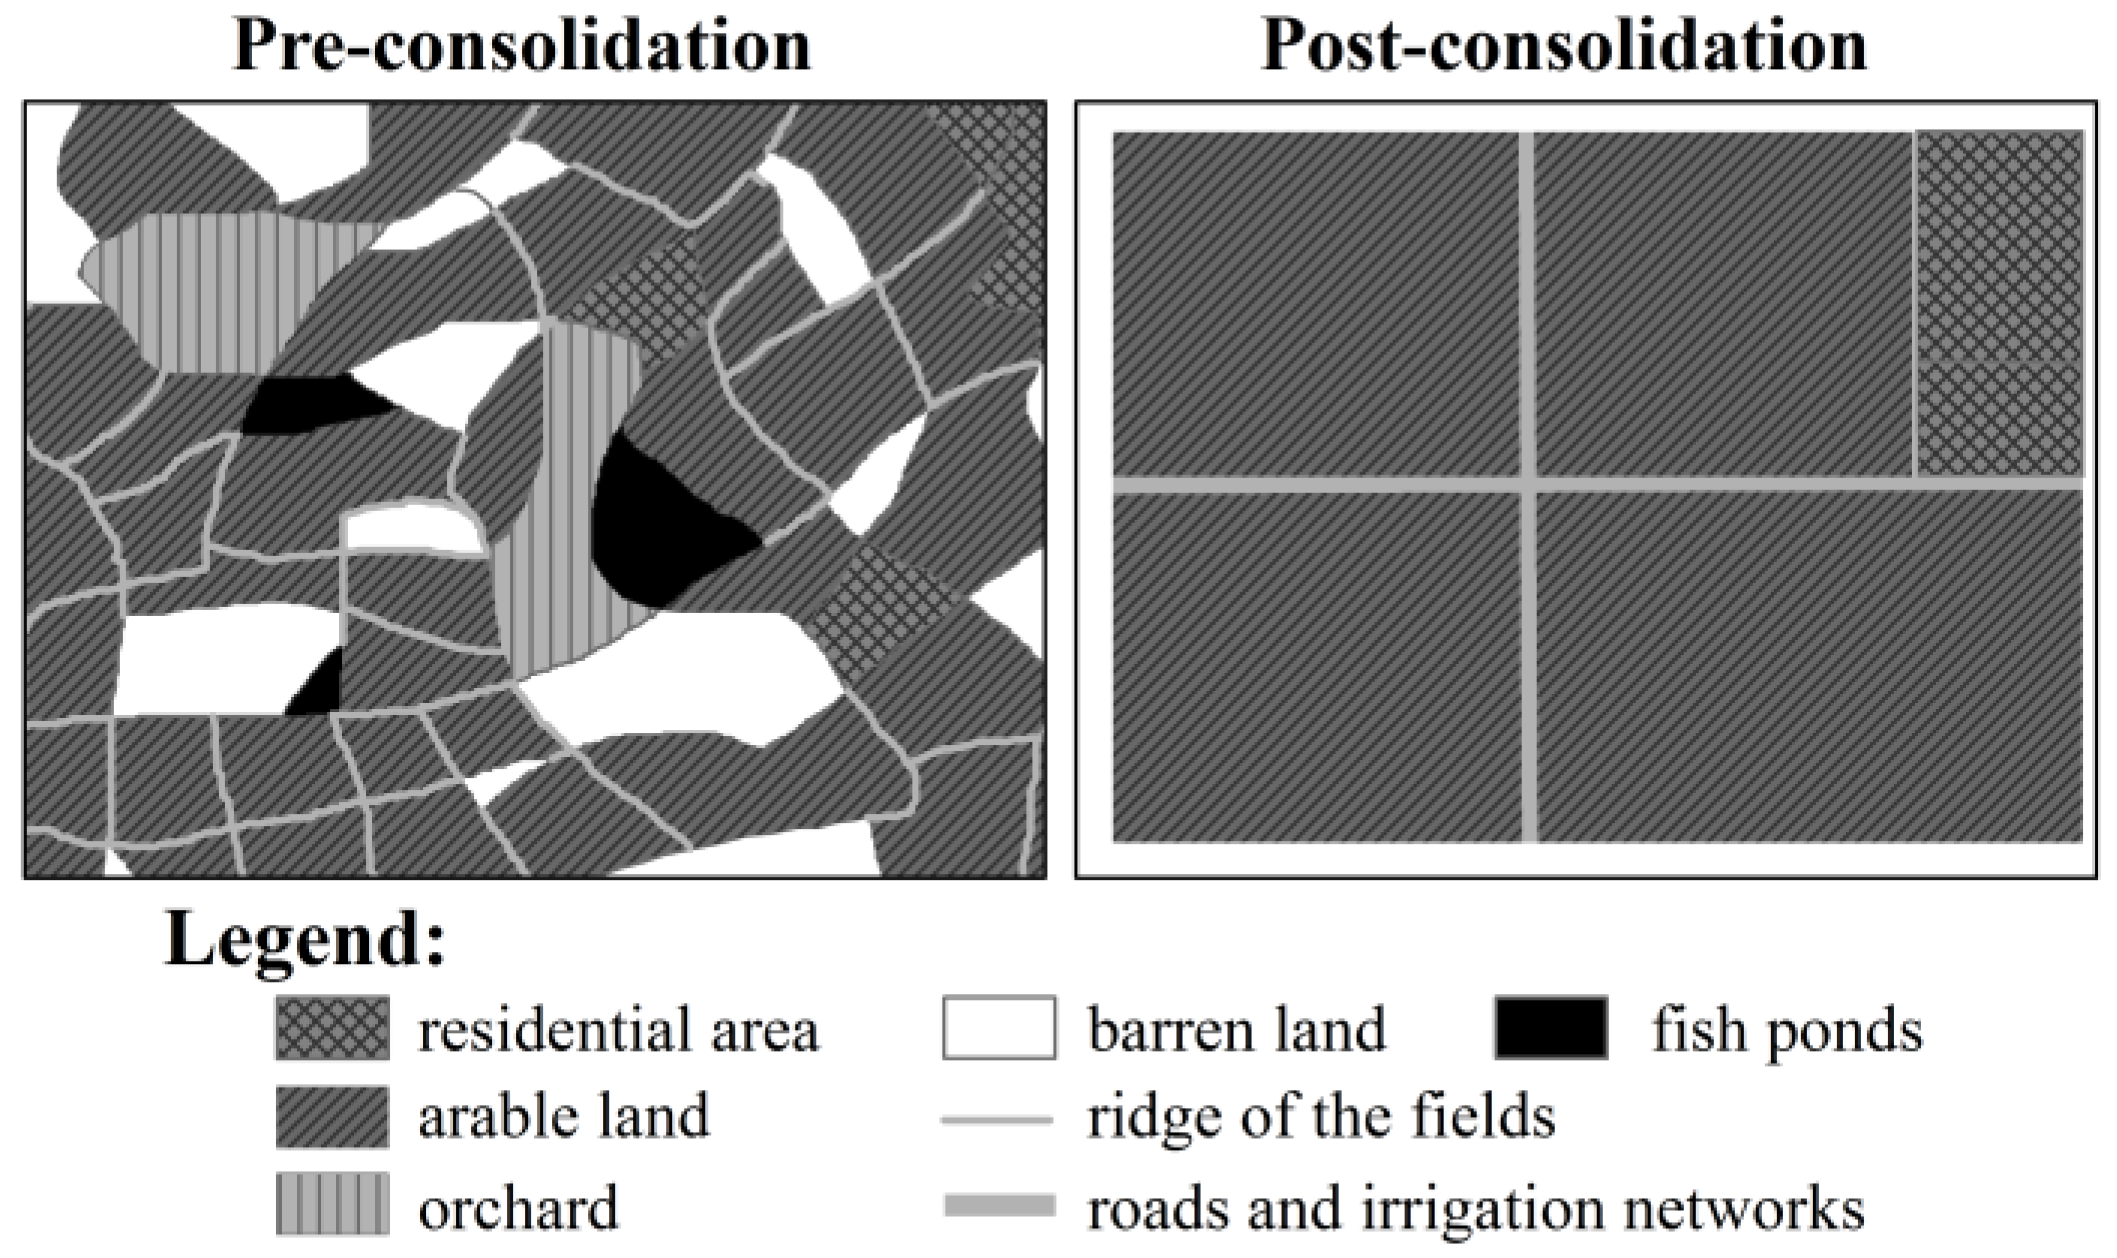
5.2. Source of Arable Land Increases

There was an increase in new arable land of almost 300 km2 increased in the Ningbo region during our study period. This abundant increase in farmland began at the start of the 21st century. In the study’s earlier period, the major sources of increased arable land included forest and built-up land; barren land came to be the dominant source of the increase in arable land during 2009–2013.
In summary, reclamation of barren land and forest is the primary source of increased arable land for southeastern China. The contract of the Land Administration Law suggested that unused land be reclaimed on the basis of scientific confirmation and evaluation, instead of by destroying forests or grasslands at the expense of the ecological environment. However, many local governments set their sights on low hilly regions or coastal tidelands to expand available arable land. These projects create potential risks to the ecological environment, such as aggravating regional soil erosion and threatening coastline ecology [22,23].
Additionally, the conversion of built-up land to arable land that took place in the late 2000s can also be attributed to land consolidation in rural areas, which is another fundamental initiative that leads to increased arable land. This is referred to as the comprehensive consolidation of fields, water surfaces, roads, woods and villages, and is done in accordance with the land use plan to raise the quality of arable land, increase areas for effective cultivation, improve the arable production conditions, and improve the ecological environment [24]. In Western Europe, this is part of a wider regional development program for rural areas. The program also includes improvements to arable production, employment, taxation policy, infrastructure, public facilities, housing, and the protection of natural resources [25]. In China, land consolidation is often combined with New Countryside Projects, as shown in Figure 7. Land consolidation in rural areas paves the way for gradual consolidation of small, fragmented arable land and ultimately the commercialization of agriculture. This is an effective way to improve land use efficiency and formalize land management.

5.3. Estimation of the Quality of Arable Land Change

Strict arable land protection policies have prevented persistent arable land loss, and have supported the overall goal of arable acreage. However, for some economically advanced regions, e.g., Hangzhou and Ningbo, arable land reclamation and consolidation have been associated with gaining more land conversion for construction use [26]. Our results revealed that the quality of the increased arable land is inferior to the lost arable land for the Ningbo region, especially during 2009–2013, during which the enclosure of coastal tideland flats was the dominant source of increased arable land. Physicochemical analyses showed that these saline soils were characterized by high electrical conductivity and low organic matter. The land needs repetitive cultivation for several years to achieve the desired arable productivity [27].
Thus, we argue that the current practical application of arable land management is lacking in scientific and feasible planning procedures. Although previous studies indicate the quantitative balance of the arable implementation policy has been achieved [3], they ignored soil quality, resulting in the decline of high-quality arable land on a larger scale. According to the investigation, the productivity of the majority of the increased arable land is 10%–30% that of the lost arable land [28]. The permanent reduction in arable productivity may ultimately threaten food security. Thus, a soil quality database to guide the implementation of arable land protection policies should be established.

5.4. Spatial Pattern Characteristics of Arable Land Transformations

In addition to the arable land’s terrain and soil quality, its spatial pattern is also a key factor in developing an arable land protection strategy. Landscape analysis is an analytical method to quantitatively explore the spatiotemporal dynamics of land use/land cover [13]. Large tracks of arable land patches were occupied from a large mass of contiguous farmland in the study area during the past decade, giving rise to arable land fragmentation. This fragmentation hinders growths in productivity and sustainability of land resources worldwide [9,29]. Previous research indicated that fragmentation can potentially constrain the development of agricultural infrastructure [30]; decrease operational efficiencies, such as those associated with pest control and land supervision [31]; and even affect scenic qualities at a larger scale [8].
Moreover, the contiguity of newly increased arable land with existing arable land can also be an important factor in sustainable long-term farming [8]. Those new arable lands that are adjacent to built-up land are quite unstable and are prone to further occupation by urban sprawl. Such a conversion of lands would waste reclamation fees. Especially for Cixi County, the increased arable land during 2005–2009 was small-sized and mostly surrounded by constructed land. These scattered and irregular arable lands not only affect urban scenic quality, but they also increase risks to food security in these areas, due to factors such as heavy metal contamination according to the latest estimation by experts from the Chinese Academy of Sciences [32].

6. Conclusions

This initial investigation into the effects of arable land protection under rapid urbanization in a metropolitan area identified several serious problems. The introduction of several agricultural land protection policies significantly constrained land conversion from arable land to non-arable land. However, large amounts of high-quality arable land in the flat region have been occupied, replaced by the reclamation of low-quality uncured land to offset the arable land loss. Moreover, the investigation into the earlier period (2005–2009) revealed that the increased arable land was usually adjacent to constructed land, which introduced the high possibility it would be urbanized again, or contaminated due to pollution by agricultural products. In contrast, from 2009 to 2013, reclamation from enclosed coastal tideland became the major method of increasing arable land.
The extensive execution of arable land protection strategies without considering the quality and landscape pattern could lead to food insecurity crises and environmental deterioration. From a policy perspective, arable land transformations should be monitored, while considering soil quality and landscape patterns, to better protect arable land. Also, it is critical to establish an up-to-date national database, including terrain, soil type, and soil quality to guide urbanization planning and to effectively implement arable land protection policies. Given the importance of preserving high-quality arable land, attention should be paid to maintaining arable land continuity at the landscape level for sustainable arable development. Applying this framework could easily be integrated into policy-making; the goal would be to balance the inevitable consequences of urbanization with the preservation of high-quality arable land. Further studies will focus on soil investigations in the newly increased arable land along with different tillage periods, especially for the enclosed coastal tidelands. Further, remote sensing and laboratory hyper-spectral techniques may also be used to dynamically monitor the utilization conditions and estimate the physicochemical characteristics of these reclaimed saline soils over a longer time span.

Acknowledgments

We thank Editor Bella Zhi and three reviewers for providing valuable suggestions that pronouncedly improved our original manuscript. This research was funded by the scientific Project of Ningbo Academy of Agricultural Sciences and the Humanity and Youth Training Project of Zhejiang Academy of Agricultural Sciences (No.2015R28R08E05).

Author Contributions

Jiadan Li and Ke Wang had the original idea for the study and all co-authors conceived and designed the methodology. Jiadan Li, Zhongchu Zhang and Qing Gu were responsible for the processing and analysis of the data. Jiadan Li drafted the manuscript, which was revised by Ligang Ma and Zhihao Xu. All authors read and approved the final manuscript.

Conflicts of Interest

The authors declare no conflict of interest.

Abbreviations

The following abbreviations are used in this manuscript:
PDPatch density
MPSMean patch size
AWMSIArea-weighted mean shape index
GISgeographic information systems
USGSU.S. Geological Survey
CaAdjacency of arable patch with surrounding arable patch
CbAdjacency of arable patch with surrounding built-up patch

Appendix

Table A1. Soil landscape metrics and their ecological characteristics.
IndicatorScoreWeight
1234
Thickness (cm)<5050–7575–100>1000.1
TextureHeavy clay/sandLight clay/sand clayClay loam/sand loamLoam0.15
SOM (g·kg−1)<1.41.4–2.52.5–3.4>3.40.15
TN (g·kg−1)<0.080.08–0.120.12–0.18>0.180.1
AP (mg·kg−1)<55–77–9>90.1
AK (mg·kg−1)<6161–8484–106>1060.1
pH>7.8≤5.55.5–6.5;7.5–7.86.5–7.50.1
Slope (degree)15–2510–155–10<50.2

References

  1. Yang, H.; Li, X. Cultivated land and food supply in China. Land Use Policy 2000, 17, 73–88. [Google Scholar] [CrossRef]
  2. Skinner, M.W.; Kuhn, R.G.; Joseph, A.E. Agricultural land protection in China: A case study of local governance in zhejiang province. Land Use Policy 2001, 18, 329–340. [Google Scholar] [CrossRef]
  3. Song, W.; Pijanowski, B.C. The effects of China’s cultivated land balance program on potential land productivity at a national scale. Appl. Geogr. 2014, 46, 158–170. [Google Scholar] [CrossRef]
  4. Zhong, T.; Mitchell, B.; Huang, X. Success or failure: Evaluating the implementation of China’s national general land use plan (1997–2010). Habitat Int. 2014, 44, 93–101. [Google Scholar] [CrossRef]
  5. Tan, M.; Li, X.; Xie, H.; Lu, C. Urban land expansion and arable land loss in China—A case study of Beijing-Tianjin-Hebei region. Land Use Policy 2005, 22, 187–196. [Google Scholar] [CrossRef]
  6. Su, S.; Ma, X.; Xiao, R. Agricultural landscape pattern changes in response to urbanization at ecoregional scale. Ecol. Indic. 2014, 40, 10–18. [Google Scholar] [CrossRef]
  7. Zhong, T.; Huang, X.; Zhang, X.; Scott, S.; Wang, K. The effects of basic arable land protection planning in Fuyang County, Zhejiang Province, China. Appl. Geogr. 2012, 35, 422–438. [Google Scholar] [CrossRef]
  8. Brabec, E.; Smith, C. Agricultural land fragmentation: The spatial effects of three land protection strategies in the eastern United States. Landsc. Urban Plan. 2002, 58, 255–268. [Google Scholar] [CrossRef]
  9. Su, S.; Jiang, Z.; Zhang, Q.; Zhang, Y. Transformation of agricultural landscapes under rapid urbanization: A threat to sustainability in Hang-Jia-Hu region, China. Appl. Geogr. 2011, 31, 439–449. [Google Scholar] [CrossRef]
  10. Tan, R.; Beckmann, V.; van den Berg, L.; Qu, F. Governing farmland conversion: Comparing China with the netherlands and germany. Land Use Policy 2009, 26, 961–974. [Google Scholar] [CrossRef]
  11. Li, J.; Deng, J.; Gu, Q.; Wang, K.; Ye, F.; Xu, Z.; Jin, S. The accelerated urbanization process: A threat to soil resources in eastern China. Sustainability 2015, 7, 7137–7155. [Google Scholar] [CrossRef]
  12. McGarigal, K. Landscape pattern metrics. Encycl. Environ. 2002. [Google Scholar] [CrossRef]
  13. Urban, D.L. Landscape ecology. Encycl. Environ. 2006. [Google Scholar] [CrossRef]
  14. Pan, X.-Z.; Zhao, Q.-G. Measurement of urbanization process and the paddy soil loss in Yixing City, China between 1949 and 2000. Catena 2007, 69, 65–73. [Google Scholar] [CrossRef]
  15. Su, S.; Zhang, Q.; Zhang, Z.; Zhi, J.; Wu, J. Rural settlement expansion and paddy soil loss across an ex-urbanizing watershed in eastern coastal China during market transition. Reg. Environ. Chang. 2011, 11, 651–662. [Google Scholar] [CrossRef]
  16. Xiao, R.; Su, S.; Zhang, Z.; Qi, J.; Jiang, D.; Wu, J. Dynamics of soil sealing and soil landscape patterns under rapid urbanization. Catena 2013, 109, 1–12. [Google Scholar] [CrossRef]
  17. Chen, J. Rapid urbanization in China: A real challenge to soil protection and food security. Catena 2007, 69, 1–15. [Google Scholar] [CrossRef]
  18. Gibbs, H.K.; Ruesch, A.; Achard, F.; Clayton, M.; Holmgren, P.; Ramankutty, N.; Foley, J. Tropical forests were the primary sources of new agricultural land in the 1980s and 1990s. Proc. Natl. Acad. Sci. USA 2010, 107, 16732–16737. [Google Scholar] [CrossRef] [PubMed]
  19. Liu, Y.; Wang, L.; Long, H. Spatio-temporal analysis of land-use conversion in the eastern coastal China during 1996–2005. J. Geogr. Sci. 2008, 18, 274–282. [Google Scholar] [CrossRef]
  20. Su, S.; Xiao, R. Spatially varying determinants of farmland conversion across Qiantang watershed, China. Environ. Manag. 2013, 52, 907–916. [Google Scholar] [CrossRef] [PubMed]
  21. Bennett, M.T. China’s sloping land conversion program: Institutional innovation or business as usual? Ecol. Econ. 2008, 65, 699–711. [Google Scholar] [CrossRef]
  22. Shi, Z.; Wang, R.; Huang, M.X.; Landgraf, D. Detection of coastal saline land uses with multi-temporal landsat images in Shangyu city, China. Environ. Manag. 2002, 30, 142–150. [Google Scholar] [CrossRef] [PubMed]
  23. Zhang, H.; Li, J.; Niu, D. Study on spatial optimization allocation of land use in the typical red soil hilly region in south China. Acta Geogr. Sin. Chin. Ed. 2003, 58, 668–676. [Google Scholar]
  24. Standing Committee of the National People’s Congress. Land administration law of the People’s Republic of China. In Proceedings of the 5th Meeting of the Standing Committee of the Seventh National People’s Congress, Beijing, China, 29 December 1998.
  25. Pašakarnis, G.; Maliene, V. Towards sustainable rural development in central and eastern Europe: Applying land consolidation. Land Use Policy 2010, 27, 545–549. [Google Scholar] [CrossRef]
  26. Zhang, W.; Wang, W.; Li, X.; Ye, F. Economic development and farmland protection: An assessment of rewarded land conversion quotas trading in Zhejiang, China. Land Use Policy 2014, 38, 467–476. [Google Scholar] [CrossRef]
  27. Zhou, S.; Cheng, J.-L.; Huang, M.-X.; Lian-Qing, Z. Assessing reclamation levels of coastal saline lands with integrated stepwise discriminant analysis and laboratory hyperspectral data. Pedosphere 2006, 16, 154–160. [Google Scholar]
  28. Hu, G.; Chen, D.; Huang, X.; Zhou, C.; Yu, G.; Pan, J. The research about balance system of farmland in occupation and supplement: An demonstration from Lin’an city. J. Agric. 2014, 4, 112–115. [Google Scholar]
  29. Shrestha, M.K.; York, A.M.; Boone, C.G.; Zhang, S. Land fragmentation due to rapid urbanization in the phoenix metropolitan area: Analyzing the spatiotemporal patterns and drivers. Appl. Geogr. 2012, 32, 522–531. [Google Scholar] [CrossRef]
  30. Niroula, G.S.; Thapa, G.B. Impacts and causes of land fragmentation, and lessons learned from land consolidation in South Asia. Land Use Policy 2005, 22, 358–372. [Google Scholar] [CrossRef]
  31. Long, H.; Liu, Y.; Wu, X.; Dong, G. Spatio-temporal dynamic patterns of farmland and rural settlements in Su-Xi-Chang region: Implications for building a new countryside in coastal China. Land Use Policy 2009, 26, 322–333. [Google Scholar] [CrossRef]
  32. Wei, B.; Yang, L. A review of heavy metal contaminations in urban soils, urban road dusts and agricultural soils from China. Microchem. J. 2010, 94, 99–107. [Google Scholar] [CrossRef]
Figure 1. Location and administrative divisions of the Ningbo region.
Ijgi 05 00069 g001
Figure 2. Distribution of soil quality levels in the Ningbo region.
Ijgi 05 00069 g002
Figure 3. Example patches of lost/increased arable land for calculating Ca and Cb: (a) lost arable land patches from 2005-2009; (b) newly increased arable land patches from 2005-2009).
Ijgi 05 00069 g003
Figure 4. Arable land transformations from 2005 to 2009 and 2009 to 2013.
Ijgi 05 00069 g004
Figure 5. Topographic features of lost/increased arable lands from 2005 to 2009 and 2009 to 2013: (a) elevation of lost arable land from 2005–2009; (b) elevation of increased arable land from 2005–2009; (c) elevation of lost arable land from 2009–2013; (d) elevation of increased arable land from 2009–2013; (e) slope of lost arable land from 2005–2009; (f) slope of increased arable land from 2005–2009; (g) slope of lost arable land from 2009–2013; (h) slope of increased arable land from 2009–2013.
Ijgi 05 00069 g005aIjgi 05 00069 g005b
Figure 6. Composition of soil quality levels for lost/increased arable lands among individual cities from 2005 to 2009 and 2009 to 2013: (a) composition of soil quality levels for lost arable land from 2005–2009; (b) composition of soil quality levels for increased arable land from 2005–2009; (c) composition of soil quality levels for lost arable land from 2009–2013; (d) composition of soil quality levels for increased arable land from 2009-2013.
Ijgi 05 00069 g006aIjgi 05 00069 g006b
Figure 7. Comparison before and after land consolidation.
Ijgi 05 00069 g007
Table 1. Spatial landscape metrics and their ecological characteristics.
MetricsEquationsDescription
PD P D = N A × 1000000
where N represents the total number of arable land patches; A is the total area.
Represents the number of patches per 1 km2. PD > 0; higher values indicate greater spatial fragmentation.
MPS M P S = A ( a r a b l e ) N
where A(arable) represents the total area of arable patches.
Represents the mean size of the lost or increased arable patch of a city. MPS > 0; higher values indicate greater patch size.
AWMSI A W M S I = 1 N i = 1 N ( 0.25 P i a i )
where Pi and ai represent the parameter and area of patch i.
Represents the complexity and irregularity of lost or increased arable patches. MSI ≥ 1; higher values indicate greater irregularity.
Ca C a = i = 1 N [ L ( a ) i L i × a i A ] × 100 %
where L(a)i is the connected parameter between arable patch i and the surrounding arable patch; Li represents the parameter of patch i.
Reflects the contiguity, or the degree to which the arable parcels connect to other surrounding arable parcels(percent). 0 ≤ Ca ≤ 100; higher valuesindicategreater spatial stability.
Cb C i a - b = i = 1 N [ L ( b ) i L i × a i A ] × 100 %
where L(b)i is the connected parameter between arable patch iand the surrounding built-up patch; Li represents the parameter of patch i.
Reflects the contiguity, or the degree to which the arable parcels connect to built-up parcels(percent). 0 ≤ Cia-ea ≤ 100; higher values indicate a greater level of isolation.
Table 2. Statistics of landscape metrics for lost and increased arable land.
CityLost Arable LandIncreased Arable Land
PDMPS*MSICaCbPDMPS*MSICaCb
2005–2009Ningbo3.6515.771.4768.2310.681.9511.851.517.2338.68
Yuyao3.699.351.3774.546.094.028.181.4110.3234.36
Cixi2.7311.441.4292.184.611.397.561.370.2387.89
Fenghua3.3215.181.5469.824.641.339.791.5310.3616.07
Xiangshan2.8128.371.5570.476.392.3712.311.6924.5520.84
Ninghai2.1323.911.4272.386.811.6711.291.524.3011.73
2009–2013Ningbo1.3511.521.5143.7245.880.0529.981.5420.2111.65
Yuyao2.4710.771.4844.7244.790.1262.181.9111.6316.22
Cixi1.0613.241.3354.1837.560.89581.811.697.179.13
Fenghua0.413.361.3958.6634.610.1824.781.5511.061.54
Xiangshan0.687.041.4351.9733.050.1750.621.4724.596.32
Ninghai0.377.221.3361.7827.380.1859.671.4728.879.10
*Unit for MPS: 103 m2.

