Article

Understanding Public Opinions from Geosocial Media

1
Department of Geography and Environment Management, University of Waterloo, Waterloo, ON N2L 3G1, Canada
2
School of Planning, University of Waterloo, Waterloo, ON N2L 3G1, Canada
*
Author to whom correspondence should be addressed.
ISPRS Int. J. Geo-Inf. 2016, 5(6), 74; https://0-doi-org.brum.beds.ac.uk/10.3390/ijgi5060074
Submission received: 30 January 2016 / Revised: 9 May 2016 / Accepted: 13 May 2016 / Published: 24 May 2016
(This article belongs to the Special Issue Bridging the Gap between Geospatial Theory and Technology)

Abstract

:
Increasingly, social media data are linked to locations through embedded GPS coordinates. Many local governments are showing interest in the potential to repurpose these firsthand geo-data to gauge spatial and temporal dynamics of public opinions in ways that complement information collected through traditional public engagement methods. Using these geosocial data is not without challenges since they are usually unstructured, vary in quality, and often require considerable effort to extract information that is relevant to local governments’ needs from large data volumes. Understanding local relevance requires development of both data processing methods and their use in empirical studies. This paper addresses this latter need through a case study that demonstrates how spatially-referenced Twitter data can shed light on citizens’ transportation and planning concerns. A web-based toolkit that integrates text processing methods is used to model Twitter data collected for the Region of Waterloo (Ontario, Canada) between March 2014 and July 2015 and assess citizens’ concerns related to the planning and construction of a new light rail transit line. The study suggests that geosocial media can help identify geographies of public perceptions concerning public facilities and services and have potential to complement other methods of gauging public sentiment.

1. Introduction

Engaging citizens and other stakeholders is considered as an essential step in government decision-making [1]. While public input has been collected traditionally through in-person techniques such as public meetings, workshops, and interviews, computer-aided technology has been used to supplement traditional methods [2,3]. More recent developments in Web 2.0 and mobile technologies have drawn attention from public agencies and research communities seeking easier and less expensive methods of citizen engagement [4]. Increasingly, local governments have been using social media platforms as additional communication channels to publish news and interact with citizens [5]. In addition, social media often contain information about public opinions and perceptions that is comparable to public comments collected through traditional public participation approaches [6]. It may potentially become a more convenient form of public participation as people are able to contribute information at any time from any location [7,8]. Geotagged social media, also referred to as geosocial media [9,10], contain both descriptive comments and location information and thus may assist in understanding what the public needs are and where solutions need to be developed [11,12]. However, unlike citizen surveys or interviews, social media data are the outputs of users’ communication. Hence, these data are unstructured, vary in quality, and often of unknown relevance to local governments’ need [13]. Further complications arise from the fact that only a small portion of social media are tagged with explicit geographic coordinates and that these data vary widely in their geographic representativeness within and across urban areas [14]. Their effectiveness to supporting public engagement thus needs to be examined critically through empirical studies [6].
This paper aims to empirically examine the usability of geosocial media for local governments through a case study carried out in the Region of Waterloo (Ontario, Canada). We modeled the text content of geosocial media to identify commonly expressed topics and explored the spatial patterns of these identified concerns and interests. We believe that the insights drawn from the case study has the value in advancing our understandings of potential opportunities and challenges of using geosocial media for citizen engagement. To facilitate the empirical study, a web-based Text Filtering and Analysis (TFA) toolkit that integrates several text analysis methods into an easy-to-use package was developed to ease the technical challenges of filtering irrelevant information from geosocial media and analyzing text content [15].
The next section begins with a review of current studies related to geosocial media use for public engagement and opinion mining in local governments. We then introduce the methods included in a toolkit designed for harvesting and analyzing text messages from geosocial media (Section 3), followed by a case study (Section 4). We conclude the paper with suggestions for future research opportunities (Section 5).

2. Literature Review

2.1. Use of Geosocial Media in Local Governments

Public participation is recognized as important since it can aid transparency and accountability in government and empower citizens in decision-making processes [1,16,17]. However, public participation has also been recognized as being a complex and contested process [18,19,20]. In particular, concerns have been centered upon issues including marginalized groups, effectiveness of participation approaches, and to what extent citizens are empowered in the participation process [21,22,23,24]. The introduction of computer-based systems such as public participation GIS (PPGIS) was intended to address some of these challenges by providing integrated platforms for informing, creating, and sharing spatial knowledge [25,26]. Considerable effort has been made to develop mapping and visualization techniques that facilitate collecting and contextualizing spatial knowledge, identifying ways of enhancing collaborations among stakeholders, and engaging with marginalized populations using digital and Internet tools [27,28]. In some instances, however, these systems are criticized for their over-reliance on technical skills and high cost for development and maintenance [29].
Social media have been increasingly used by local governments in recent years because they provide an easy and inexpensive method of communication, and expand social networks through which governments can potentially reach large numbers of citizens [5,30,31]. Although some governments use social media primarily to publish news and information, there is a trend of governments interacting with citizen through social media [32]. According to Johannessen et al. [33], local governments ranked social media in terms of preferred communication methods after email and websites. A growing body of literature has further examined how sentiments expressed in social media can help improve communication between local governments and citizens [34,35,36,37]. Zavattaro [38], for example, suggested that social media sentiment is an effective indicator of successful interaction between local governments and citizens. Schweitzer [39], similarly, identified strategies for transportation agencies to enhance their communication with the public through the analysis of transport planning-related tweets.
In addition to their communication functions, social media are also considered as platforms of recording lived experiences of their users [40]. That is, the way people tag place and events, check-in at venues, and comment leaves digital traces of their physical activities and reflect their personal opinions and sentiments [41,42]. Another line of studies has thus focused on mining geosocial media data that are spontaneously contributed by users. Several spatial analysis and visualization methods have been developed to derive public perception toward local environment and planning issues from social media. Dunkel [12], for example, developed a visualization tool to help planners explore perceived environment from geolocated Flickr data. Feick and Robertson [43] proposed a multi-scale approach to identify commonality in how people define and delimit urban places in geotagged photo tags. Successful empirical studies of using geosocial media data for gauging public perceptions of disaster response, identifying events, and investigating human activities have also been documented [44,45,46]. In addition to the primary focus of mining spatial patterns, others suggested the need to further incorporate qualitative social media content [13]. Afzalan and Muller [47], for example, found that informative dialogues are developed within online groups regarding local green infrastructure planning issues. Gal-Tzur et al. [11], similarly, suggested that useful information about transportation policy can be harvested from social media. The combination of qualitative and spatiotemporal analysis may, as suggested by Campagna [13], provide more insights into the geographies of public needs.

2.2. Challenges of Utilizing Geosocial Media
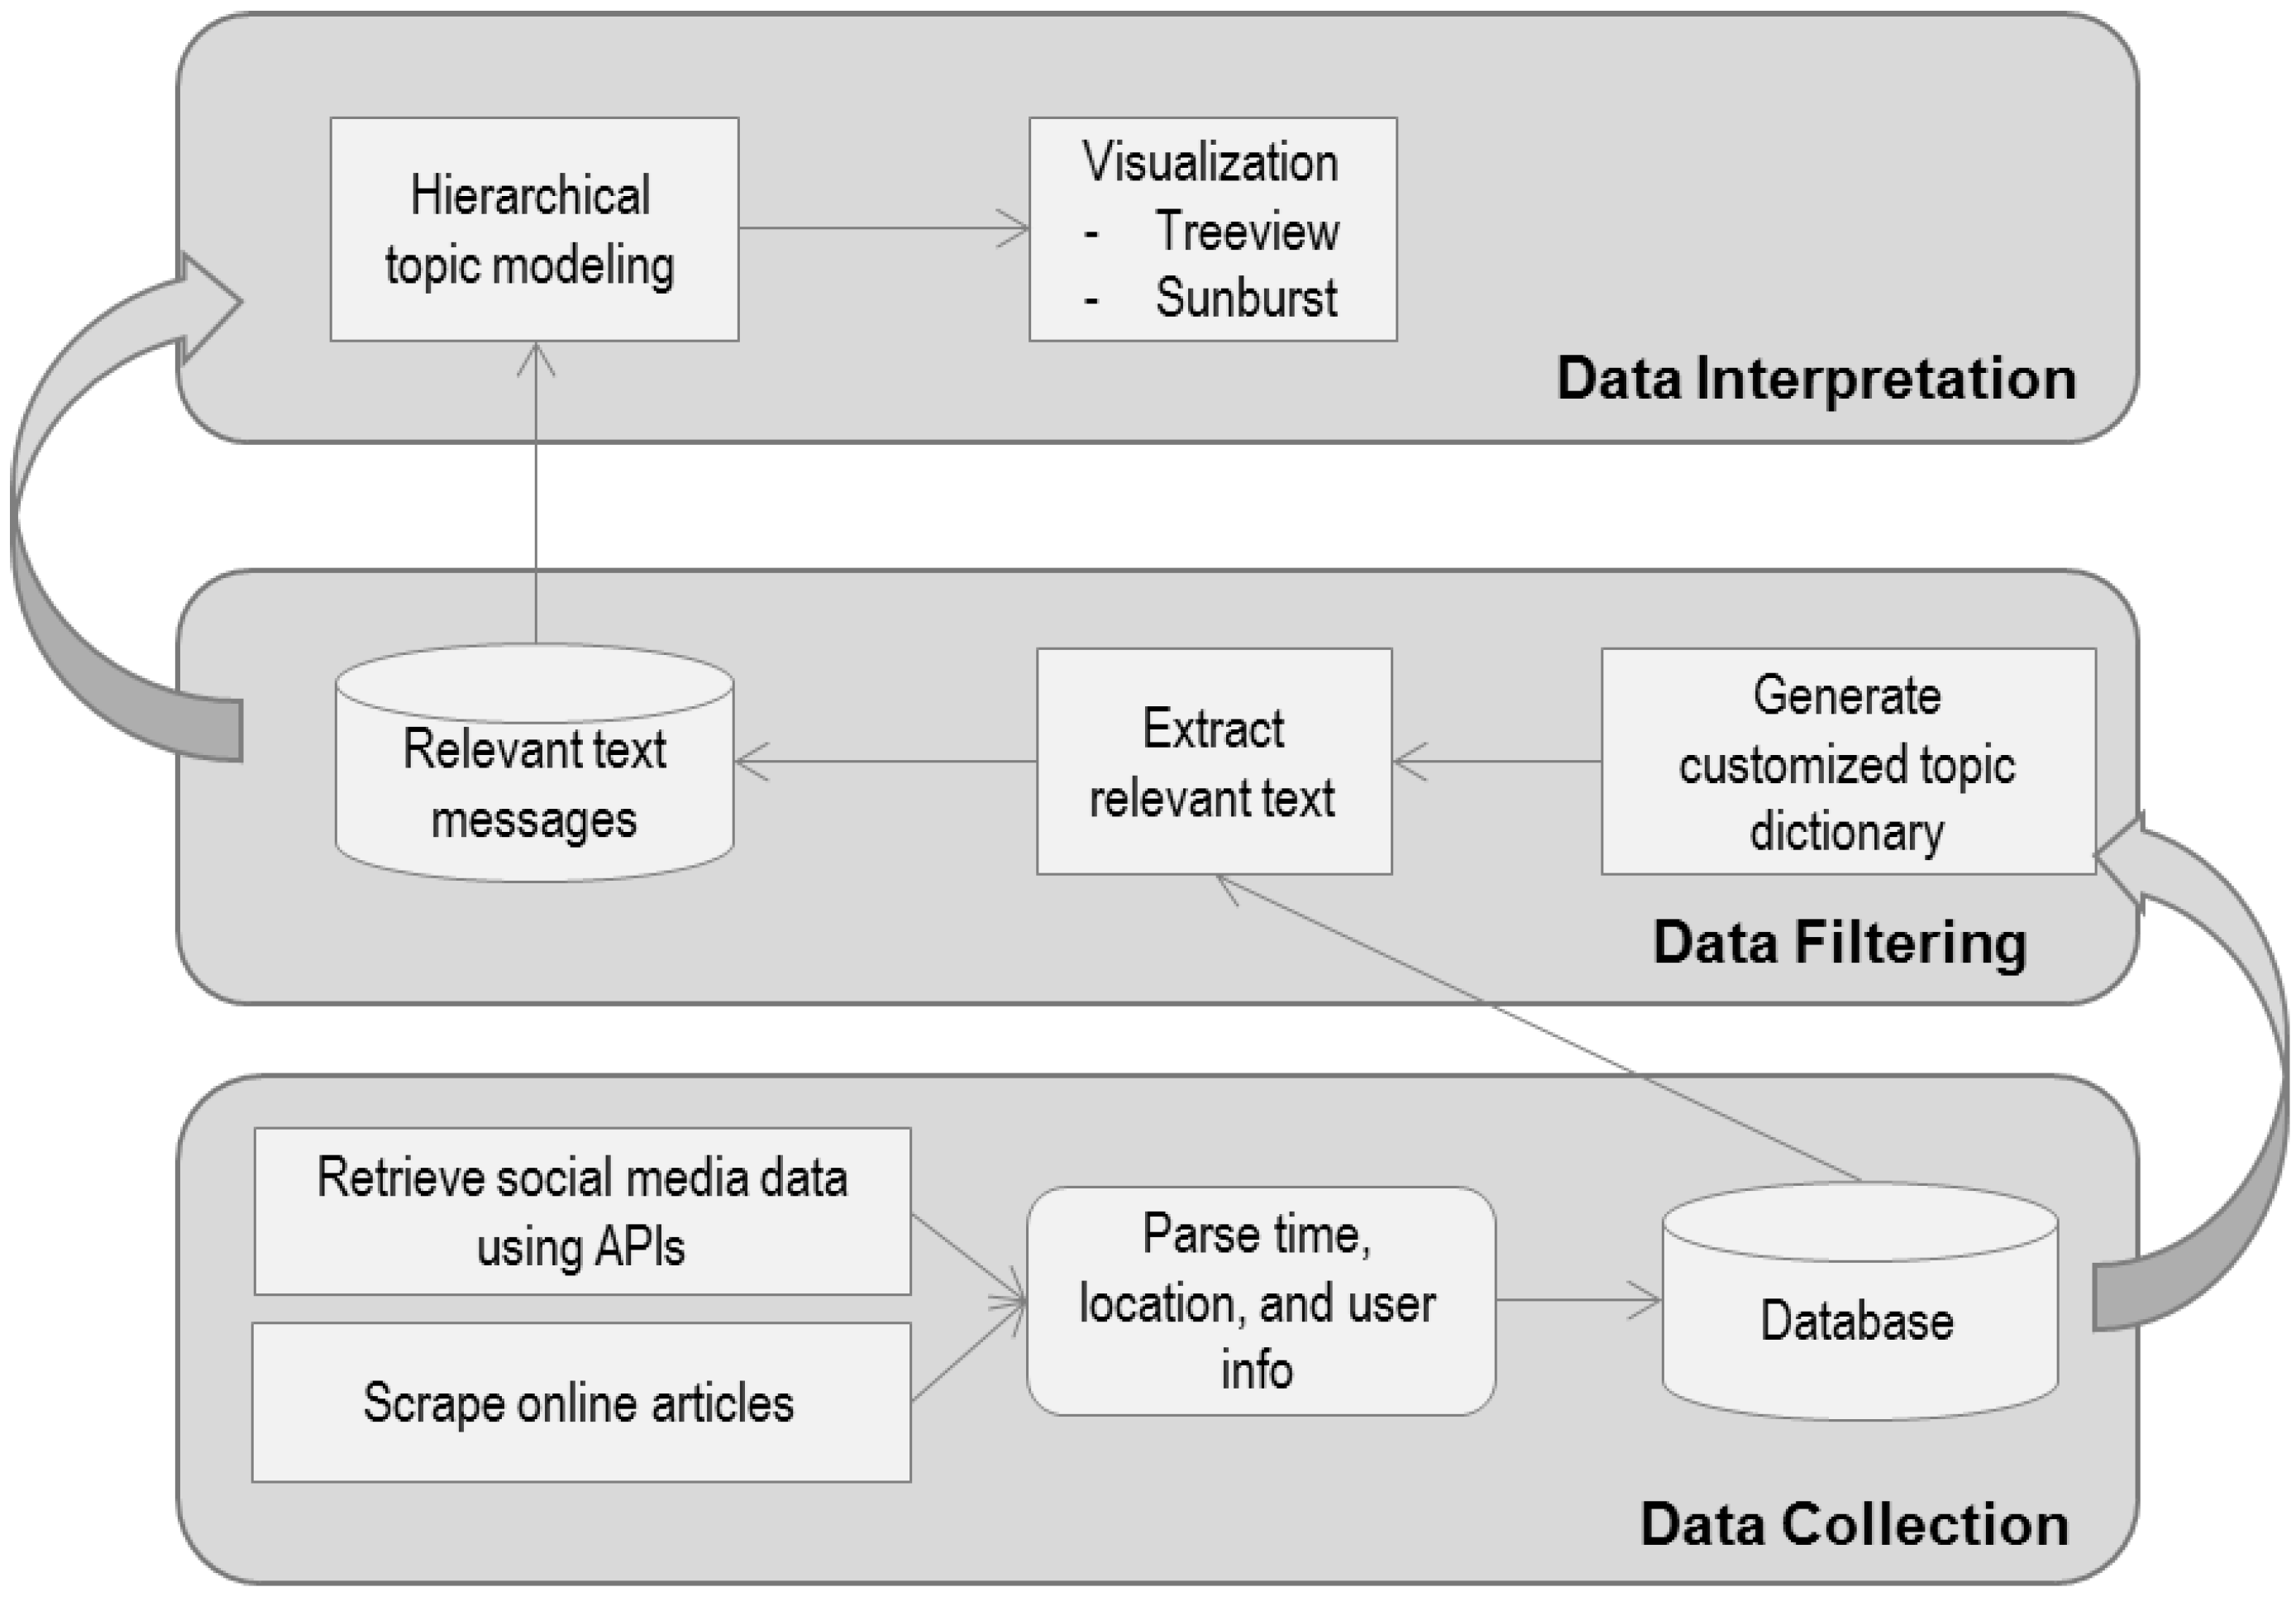
Incorporating qualitative analysis of geosocial media content presents several challenges. As argued by Afzalan and Evans-Cowley [48], the relatively large volume of social media data may increase the time and human costs of analyzing the data and thus make the new data source less valuable [48]. As a result, a number of scholars have explored the use of computer-aided methods to harvest and analyze information related to local government decision-making from social media [13,39]. Gal-Tzur et al. [11], for example, suggested that text analysis methods can improve the efficiency of harvesting transportation planning-related information from social media text. Campagna [13], similarly, integrated basic text analysis functions such as generating tag clouds with spatiotemporal analysis to explore the use of location-based social media for spatial planning.
Notwithstanding these efforts, several challenges related to harvesting and analyzing locally specific social media remain [7]. First, ontology-based information retrieval (IR) methods, which use concepts and their corresponding relationships to define domain-specific terminology and to recognize relevant text content, are used frequently to determine the relevance of a text message to topic [49]. However, they are not entirely suitable for identifying locally relevant geosocial media messages, because: (1) there are few universal ontologies available for local government or even more defined fields such as planning [50], and (2) many topics are location specific and center on content that is relevant for a particular development plan or community. Although developing an ontology based on local knowledge is possible, such an ontology will be limited to a specific local context. Other commonly used IR methods such as machine-learning approaches have similarly been criticized for not being generic because of their need for large and good quality training datasets [51]. Second, individual social media messages need to be aggregated so that major needs or concerns can be identified and be further used for decision-making [15]. Despite the growing use of computational methods, such as topic modeling methods, to automate interpretation of text data [52,53,54], manual work is still often employed to understand and categorize public input [39,47]. Moreover, the reliance on computational knowledge to use these analytical methods can be a barrier to government adoption of social media as it may increase both financial and human cost [55].
Additionally, there are concerns about whether geosocial media data can meet local governments’ needs. Because social media are networking and communication platforms at the core, their users are mostly contributing information without being aware that it might be used for other purposes [56]. Although this may result in less guarded recordings of user sentiment [12], much of the data may be irrelevant to local government needs. Further empirical studies of the nature and value of information that can be harvested from social media is therefore needed [11]. Moreover, the geographic representativeness of geosocial media vary widely both among different cities and within cities [14]. Several studies have reported the geographical unevenness of volunteered geographic information, in that some areas may be represented by large amounts of data, while other areas very few [57,58,59]. Varying demographic profiles across geographic areas may also contribute to the geographical unevenness of user-generated content. As noted by Cavallo et al. [60], certain population groups may opt out of using new digital technologies. Although this unevenness should not mitigate the value of user-generated geographic information, the use of these data needs to be critically examined through context-specific analysis [60].
In this regard, local government adoption of geosocial media need solutions to alleviate technical challenges of utilizing the data as well as further recognitions of the local relevance and potential limitations of the data through critical examinations.

3. Methodology

Based upon previous sections, three components are essential for local government staff to harvest and analyze relevant information from social media (Figure 1). A web-based toolkit was developed to: (1) harvest geosocial media data from online sources; (2) identify text-based geosocial media messages that relate to local spatial planning issues; and (3) semi-automatically summarize the text content and explore main themes that appear from public input. These themes are delivered through an interactive visual design to help local authorities understand the data.

3.1. Data Collection

We chose Twitter as an exemplar social media service as it is one of the most popular micro-blogging services for users to post text messages, share images, tag locations, and interact with others. Twitter has a large user base—one in every ten American adults get news from Twitter [39], and while its user community is skewed toward affluent and educated individuals, it is reportedly more diverse than is found on other social media platforms [61]. Twitter data were collected using Twitter’s Application Programming Interfaces (APIs) and an associated Python library Tweepy (http://www.tweepy.org/). Only data that contain valid geographic coordinates were collected for a local study area and were stored in PostgreSQL database after parsing time, spatial, and user information. For other sources of user-generated content such as online articles and citizen letters, Python scripts built with the scrapy library (http://scrapy.org/) were used to extract information directly from web pages. These text documents were also stored in the database with ancillary information such as the source and time.

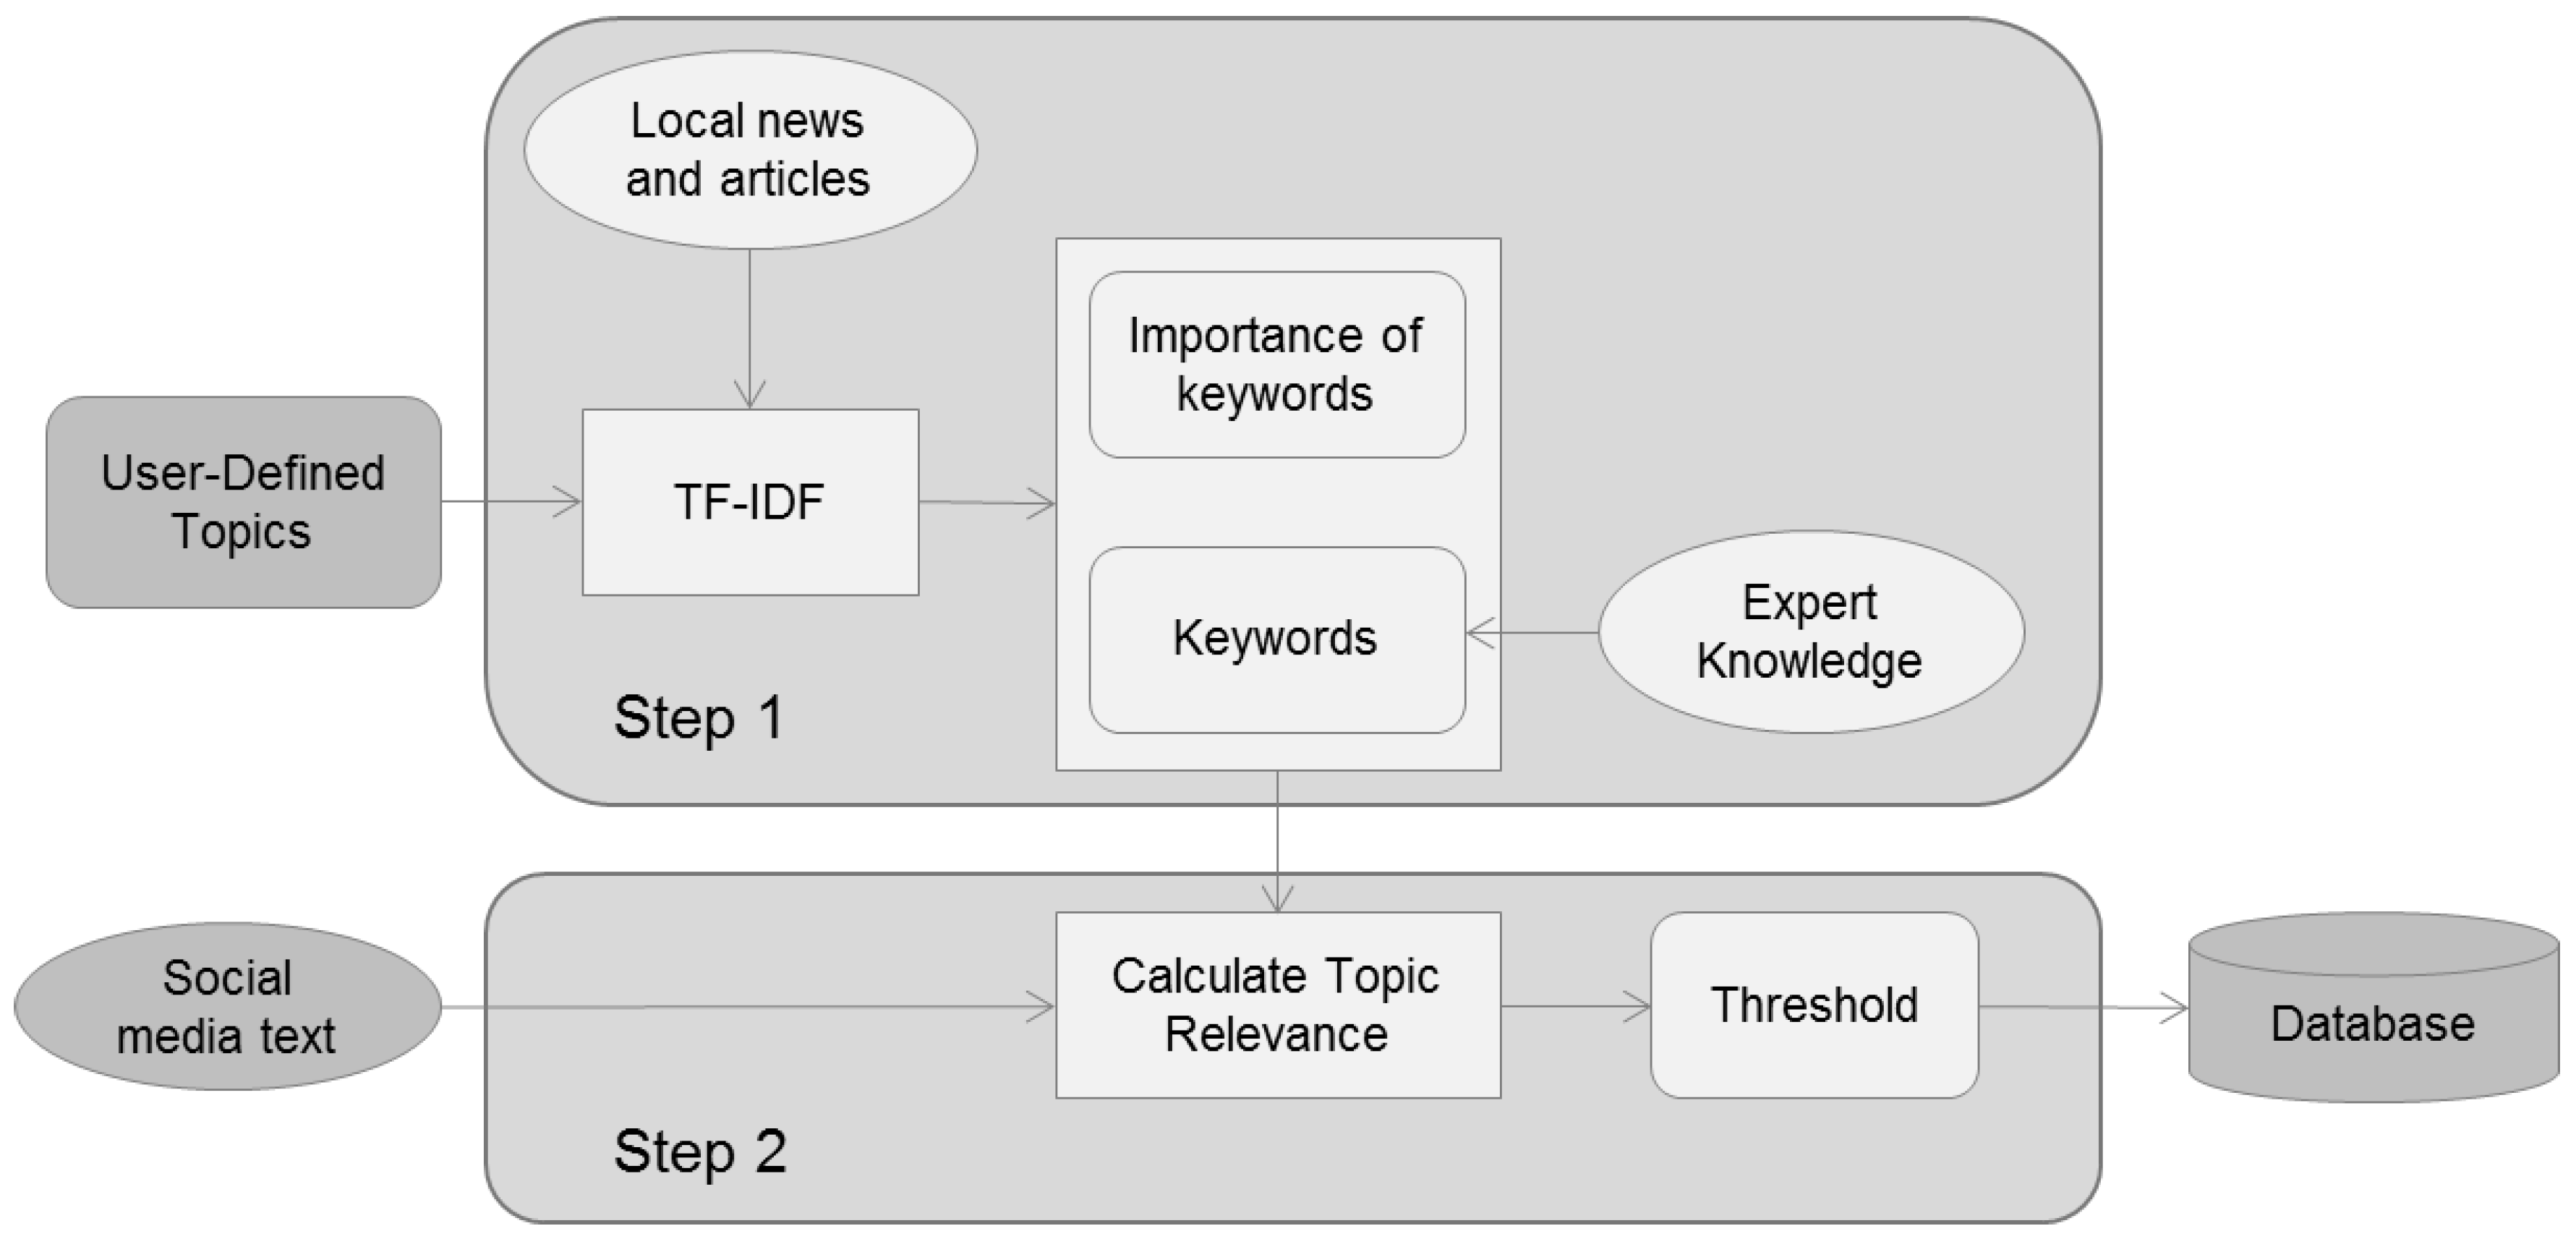
3.2. Extraction of Relevant Geosocial Media Text Messages

A two-step approach is used to identify social media messages that relate to local topics (Figure 2). As discussed in Section 2, one challenge associated with extracting text messages relevant to a local planning context is the need of locally specific resources (e.g., ontology, training datasets, etc.). A more generic approach is used here to build a local lexicon from local news, municipal reports, and articles based on the widely used tf − idf metric. This lexicon is then used as input to evaluate the relevance of the text messages based on a language modeling approach that is found to be effective for identifying relevant short text messages from social media [62].

3.2.1. Constructing Local Lexicon

A local lexicon composed of domain- and context- specific terms is built based on news postings, government documents, and articles that relate to a topic or issue of interest to a local government (e.g., public transportation, infrastructure, construction, etc.). In particular, the tf − idf measurement is applied to identify the most important words from collected articles. The method considers both the occurrence of a word in a document and the uniqueness of a word according to the number of documents it occurs within so that it can reduce the effect of common words, which are words that generally occur more often than others in a language [63]. For each word in the corpus, a tf − idf value is calculated using Equation (1):
t f i d f = c o u n t ( w , d ) s i z e ( d ) × l o g ( n d o c s ( w , D ) )
where a term frequency (tf) is first calculated using the number of times a word w occurs in a document d (count(w,d)) and the total number of words the document d contains (size(d)). This tf value is then multiplied by an inverse document frequency (idf) value, which is an inverse fraction of the total number of documents n and the number of documents that contain word w (docs(w,D)), to get the tf − idf value for the word w. The higher the tf − idf score is, the more important the word w is.
A list of important words with high tf − idf scores is then used to generate a customized local lexicon based on the assumption that important words identified from planning-related documents are more likely to be related to planning topics [11]. In addition to keywords derived from local documents (e.g., “parking”), their semantic variants (e.g., “parking lot”, “parked”, “parking garage”) can be included in the lexicon to improve the accuracy of the IR [64]. Government professionals can thus use their expert knowledge to supplement or alter the auto-generated local lexicon.

3.2.2. Calculating Topic Relevance

We then evaluate the relevance of geosocial media messages based on the language model. According to Zhai and Lafferty [65], the relevance of a short message t to a query term k can be calculated using a Bayes likelihood estimate (Equation (2)):
R ( t | k ) = C ( k , t ) + u P ( k | θ L ) l e n ( t ) + u
In the equation, the text message is considered as a probability distribution over the words it contains. The maximum likelihood probability of a message t relating to query term k is then calculated based on the times the query k occurs in the message C ( k , t ) , the probability of the query term k occurs in the whole corpus P ( k | θ L ) , the length of the message len ( t ) , together with a smoothing parameter u.
To evaluate the relevance of a text message to a topic, we consider each topic as a collection of query terms, which correspond to the keyword and its semantic variants as derived from the previous step. Therefore, a topic T can be represented as: T = < k 1 , k 2 , k 3 , , k n >, where n is the total number of keywords identified for topic T. The relevance of a text message to a topic can then be evaluated using Equation (3):
R ( t | T ) = i = 0 n W ( k i | T ) C ( k i , t ) + u P ( k i | θ L ) l e n ( t ) + u
Here, the relevance of a message to a topic is considered as a sum of the message’s relevance to each word in the topic dictionary. Each word is weighted using its tf − idf score to decrease the effect of less important or common words in the dictionary. Using this method, each message will receive a relevance score indicating its relevance to a topic T, with a higher score suggesting a higher possibility of being relevant.
A threshold is then determined to differentiate relevant messages from irrelevant ones by reviewing a sample of messages and their according scores. As shown in Table 1, although all the selected text messages refer to parking expressions, the first four with higher scores are potentially of more interest to planners, whereas the latter two relate more to personal feelings. A larger sample of Twitter tweets can be reviewed using the same method to determine the appropriate threshold for identifying parking-related text messages. Although somewhat subjective, reviewing a relatively small sample of the data allows local government staff to view more details about the data and bring in expert knowledge to the categorization procedure.

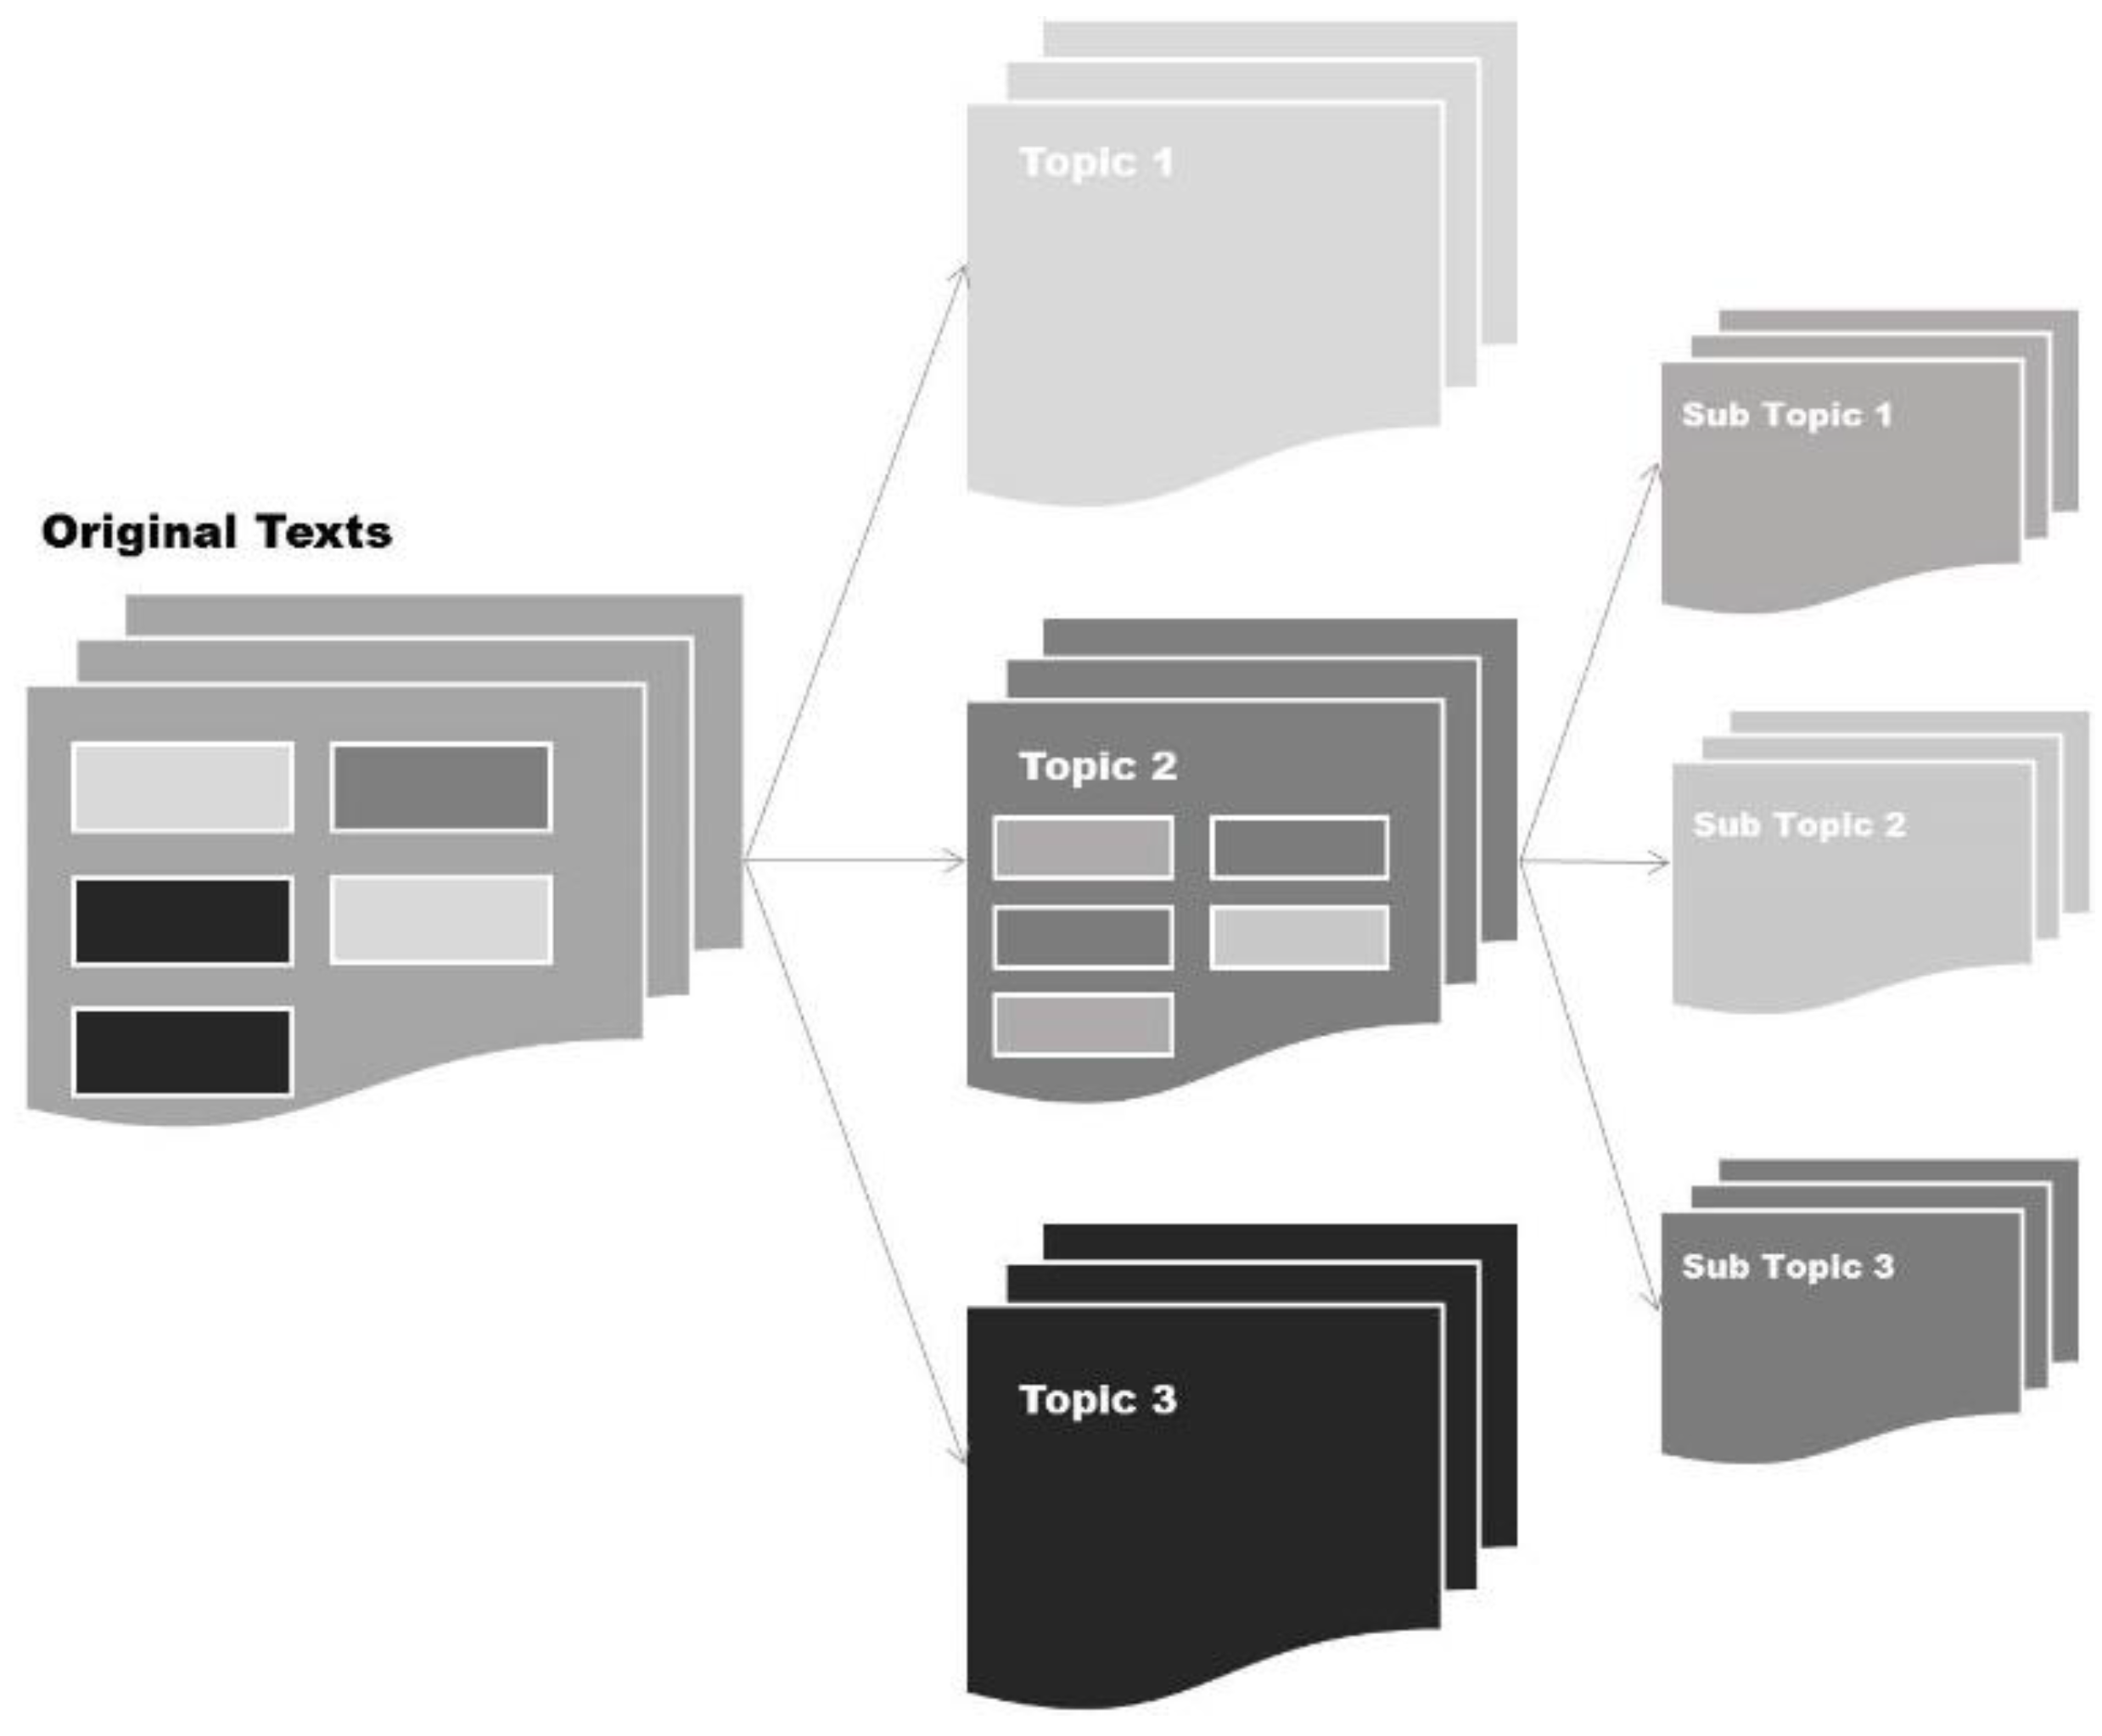
3.3. Understanding Public Input Using Hierarchical Topic Modeling

Having identified relevant geosocial media messages, a topic modeling approach is used to recognize latent sub-topics within message collections. Topic modeling is a suite of text mining methods for identifying semantic patterns within collections of natural language documents [66]. The Latent Dirichlet Allocation (LDA) was selected because of its simple yet powerful nature [52,66,67]. Each topic is associated with a list of keywords, based on which meanings of topics can be interpreted.
Within the context of this work, geosocial media messages related to a topic T are considered as a corpus, which the LDA method divides into a collection of sub-corpora. Assume topic T is “cycling”, the above method would allow us to identify what aspects (e.g., cycling trails, shared-use path, and safety concerns) of “cycling” people are talking about. The same procedure can be repeated for these sub-topics to reveal more details from the text. Python scripting is used to automate this recursive procedure following the logic as shown in Figure 3. Topic models are first generated for the entire corpus. The words in the corpus are then reassigned to a set of new corpora based on their relationship with the topics. The procedure is repeated for each new corpus until the number of messages the corpus contains is less than a minimum threshold. As a result, texts are modeled as a topic hierarchy that is composed of various topic paths, which represents how one topic is broken down into several sub-topics.

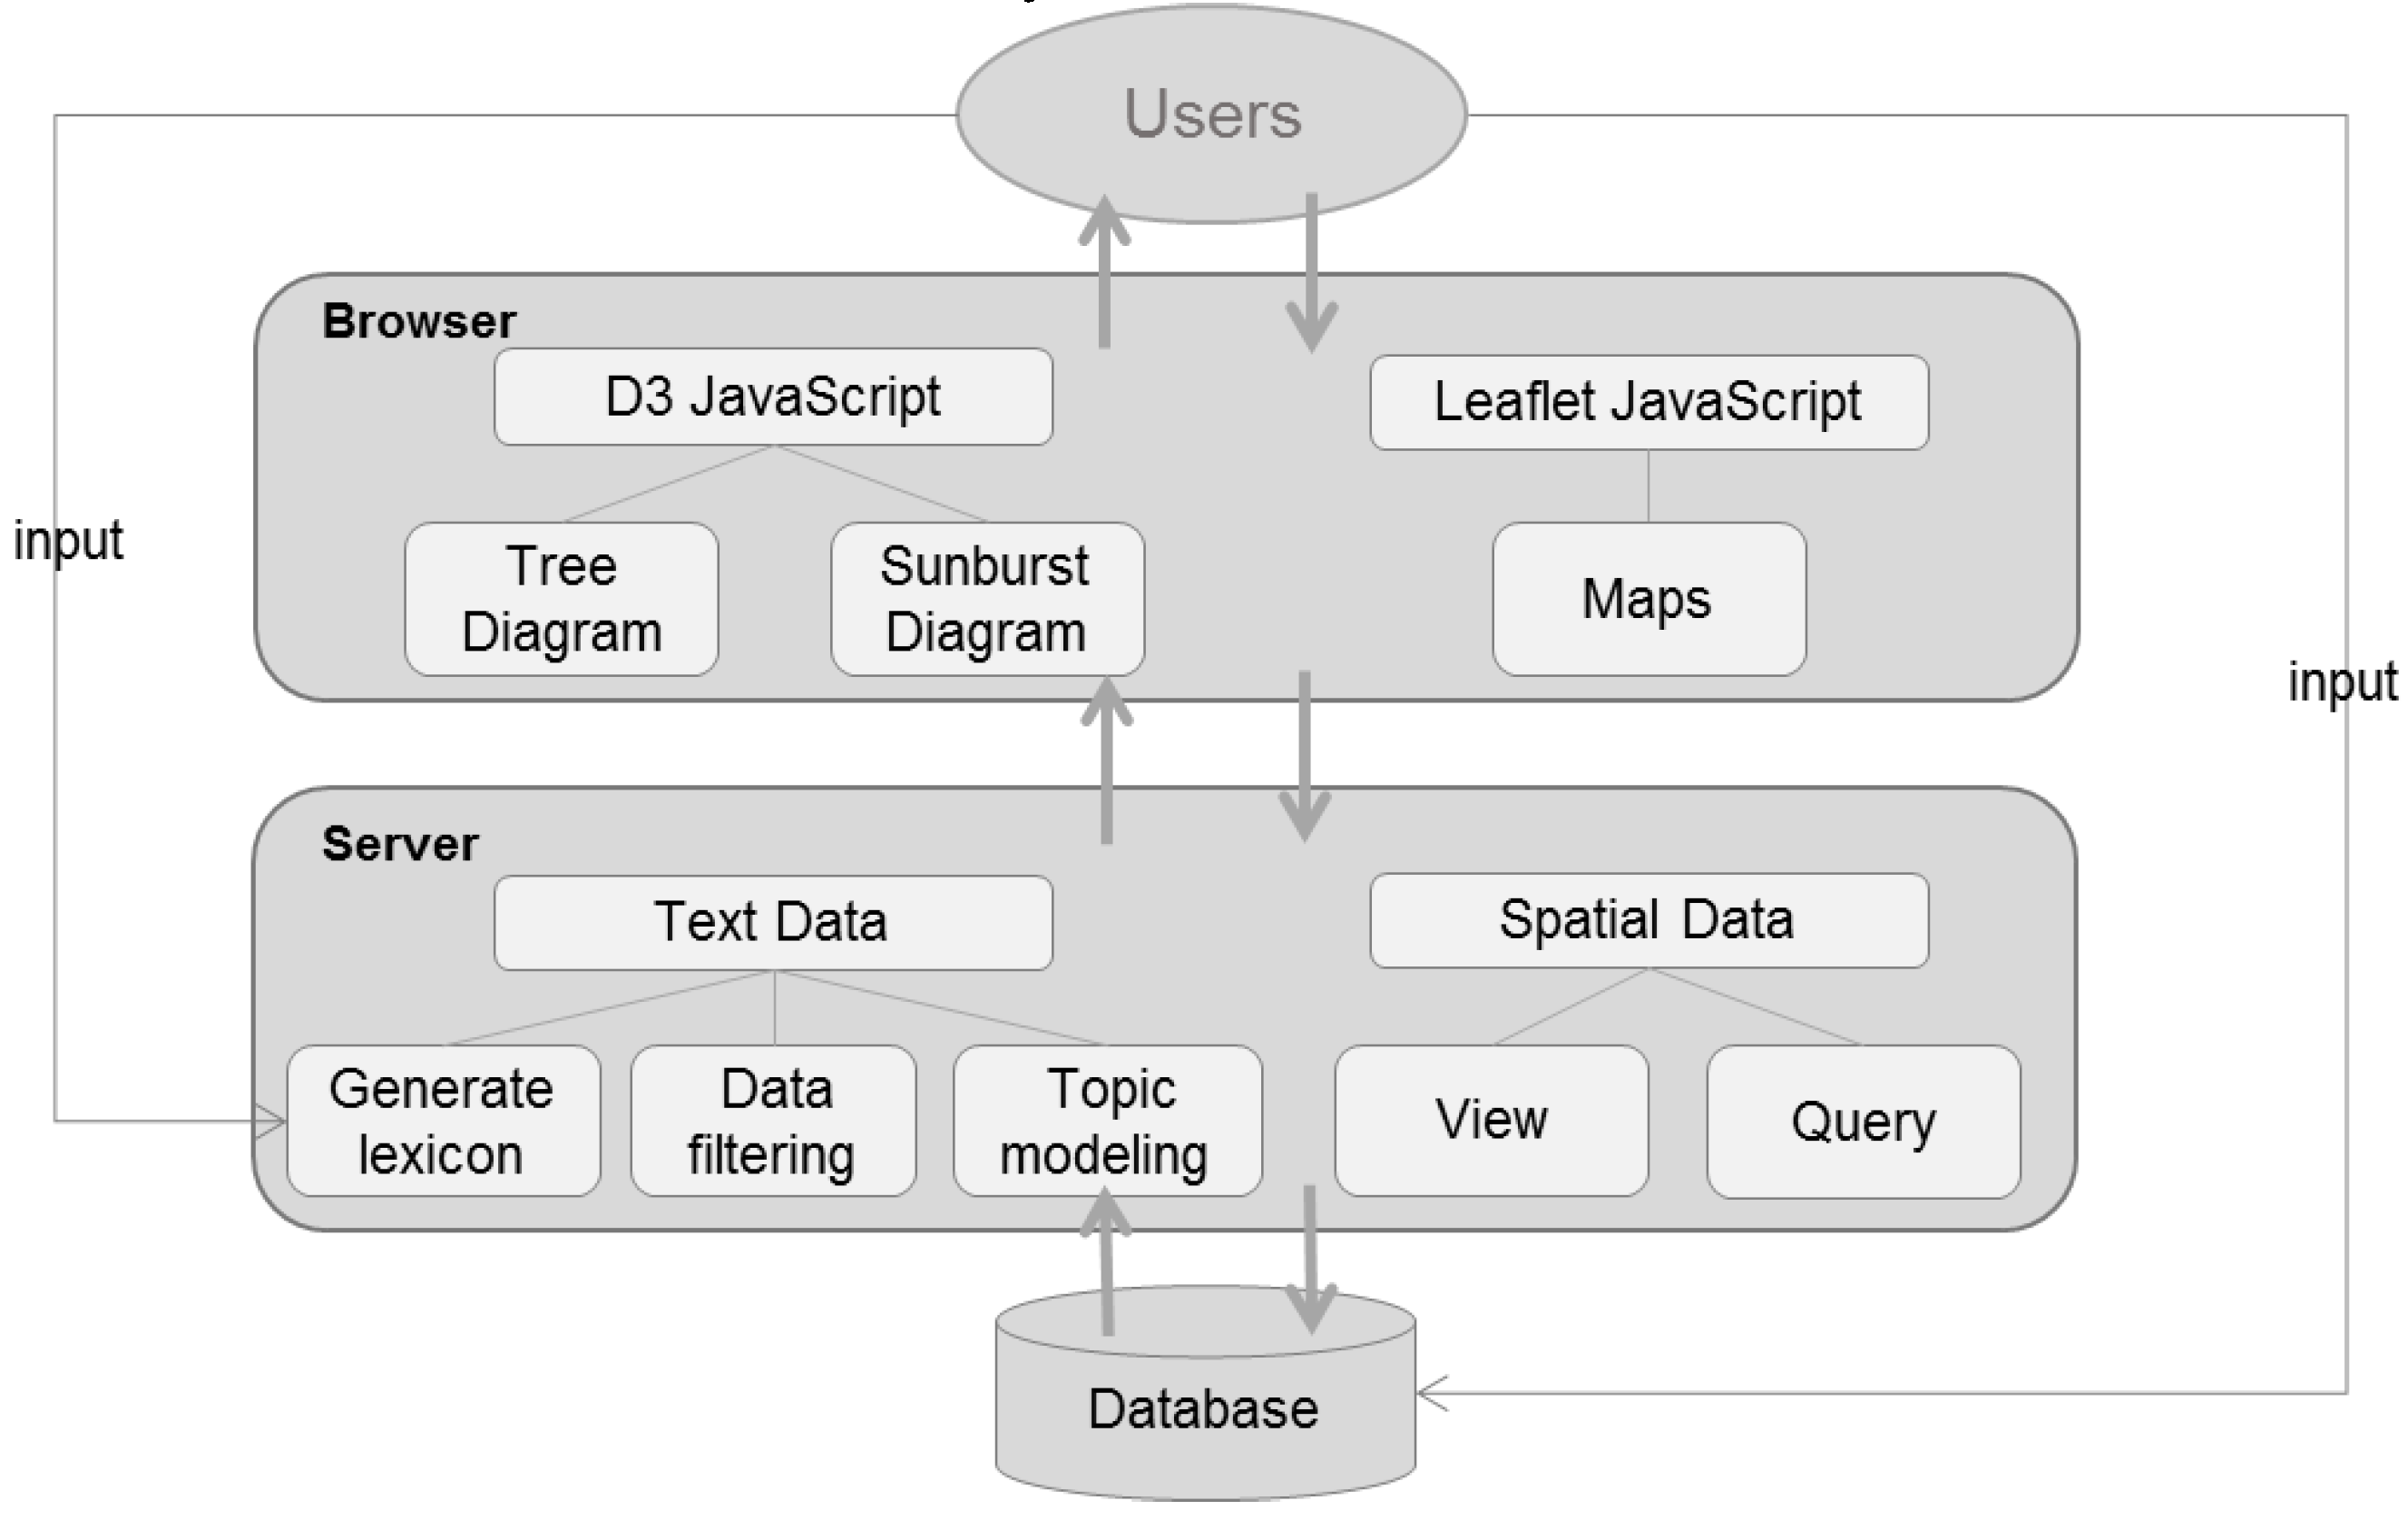
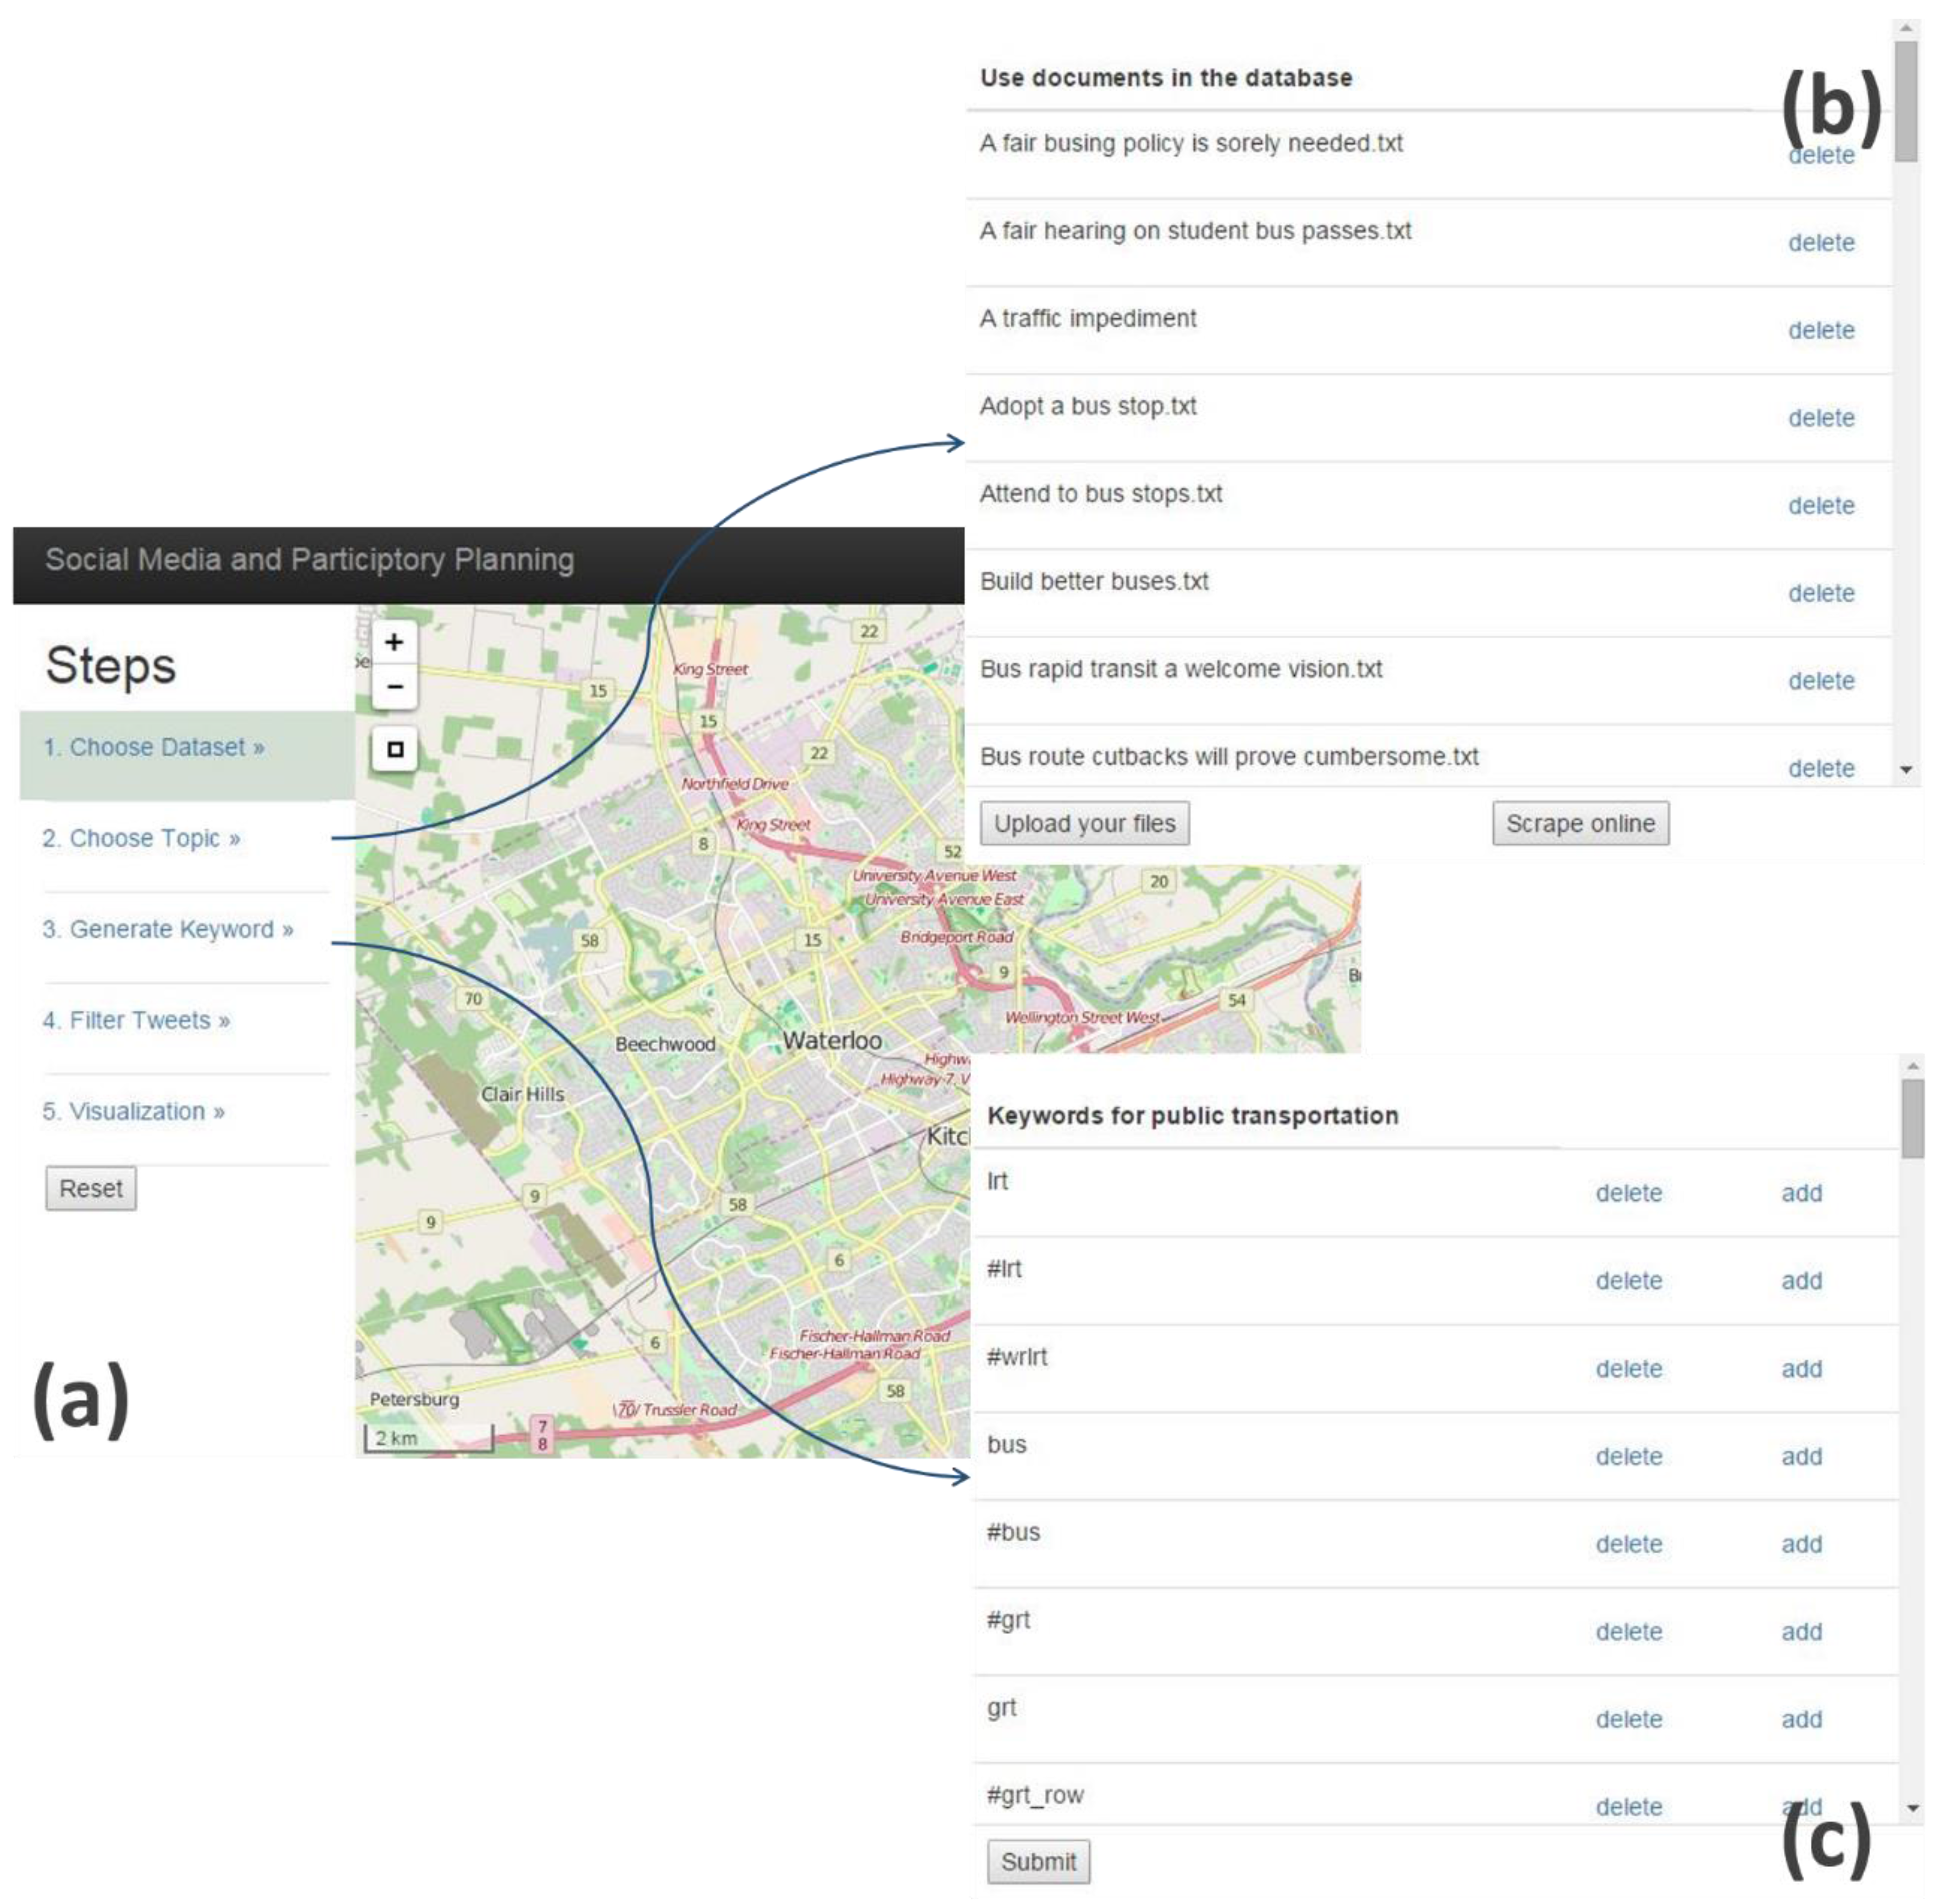
3.4. Design and Implementation of a Web-Based Tool
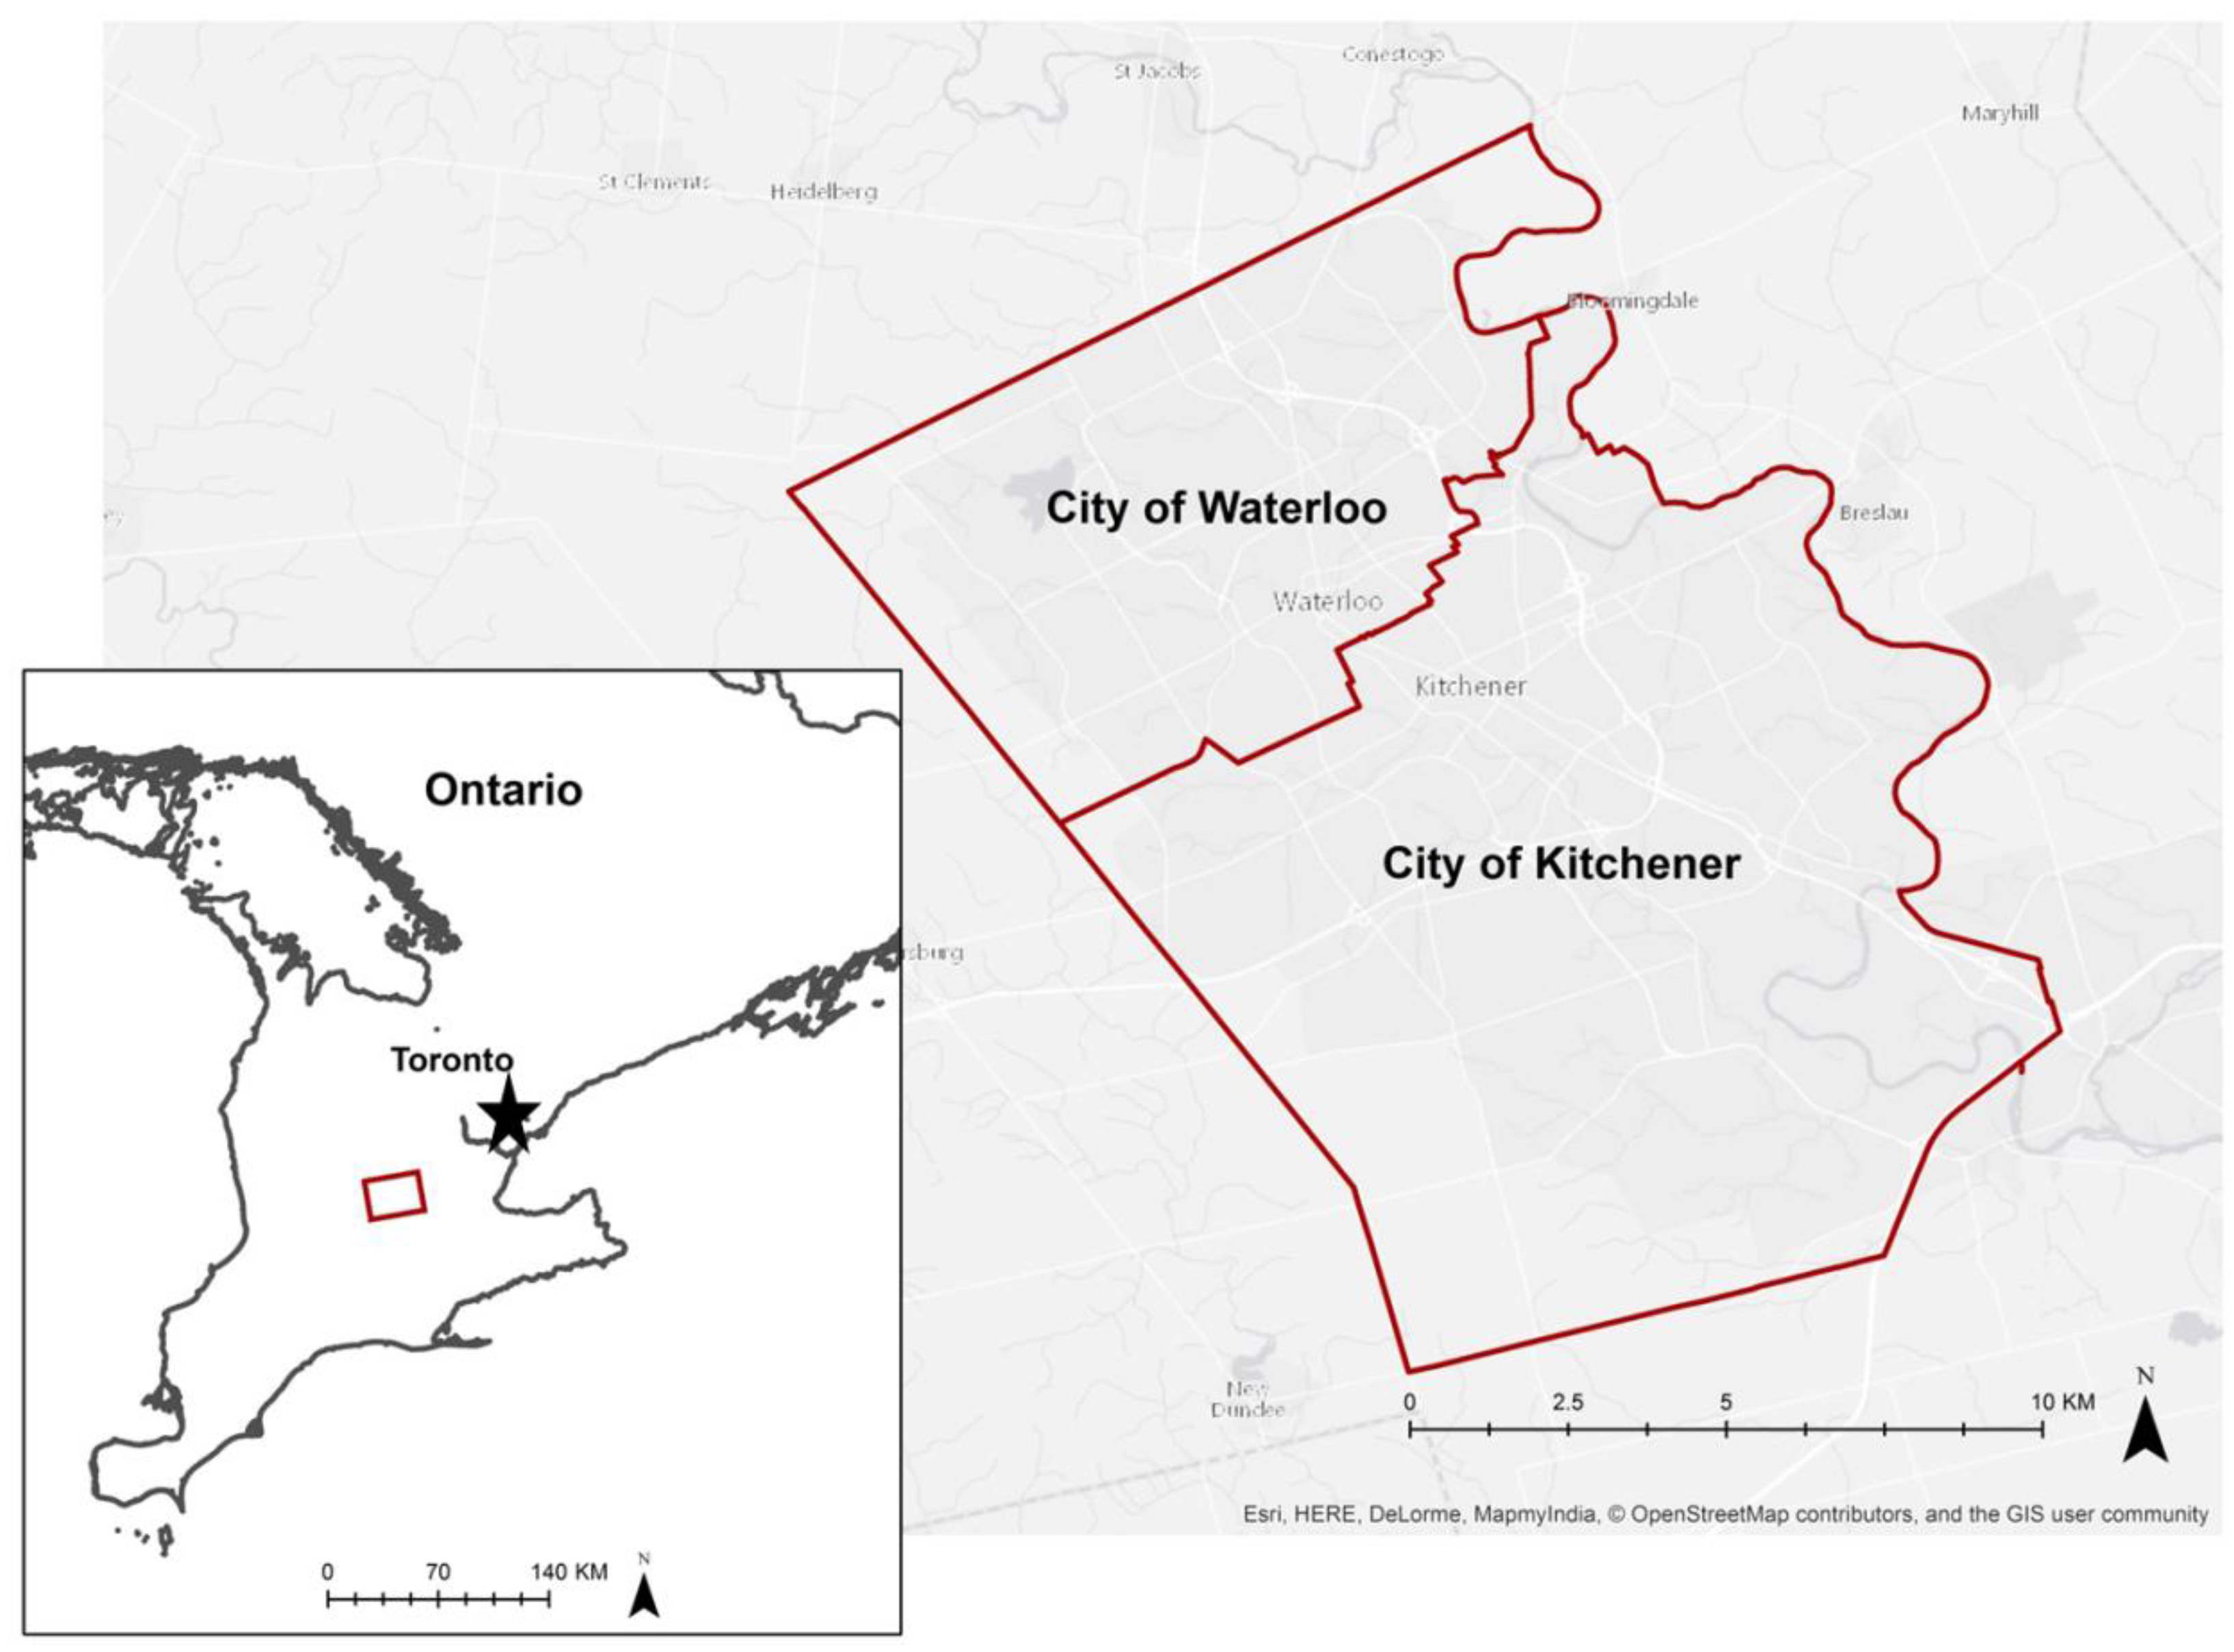
The Django-based TFA toolkit was developed to provide an easy-to-use graphical interface that integrates IR and the topic modeling method. Django is a free and open source framework for web development [69]. Figure 4 shows the system architecture of the application. On the backend, a PostgreSQL database is used to store parsed text messages as well as spatial and temporal information. On the server side, a series of models that process and analyze text data is developed using python scripts built from the open-source natural language processing (NLP) python library NLTK. GeoDjango handles the reading and storage of spatial data including locations of social media messages. On the browser side, map visualizations are generated using Leaflet and topic modeling results are visualized with the popular JavaScript-based D3 visualization library (see the D3 Gallery, https://github.com/mbostock/d3/wiki/Gallery).
Figure 5 shows several screenshots of the toolkit. Users can follow the steps on the left panel of the main interface to harvest and analyze text input (Figure 5a). Customized local lexicons can be created by selecting topic-related documents or by specifying online sources to scrape articles from (Figure 5b). Amendments can then be made to the auto-generated keyword list for identifying relevant text messages (Figure 5c). Clusters of relevant tweets are represented on the map using the Leaflet markercluster library (https://github.com/Leaflet/Leaflet.markercluster). Topic modeling results are then displayed as shown in Section 4.

4. Case Study

To demonstrate the possible value of topic modeling and mapping of geosocial media data, the toolkit described above was applied in the cities of Waterloo and Kitchener within the Region of Waterloo, Canada (Figure 6). The Region of Waterloo has consistently been ranked as one of the fastest growing communities in Canada and is forecast to increase in population from its current level of 568,500 to 729,000 by 2031 [70]. Consulting stakeholders is and will continuing to be an important function for local governments as the development unfolds. The ongoing construction of a new light rail transit (LRT) started in August 2014, has promoted public debate concerning issues such as congestion, urban intensification, and disruptions to existing neighborhoods. During the preparation of the project, both the regional and the city governments held public meetings to collect public opinions toward the transit plan at different stages of the project. Discussions about the project are continuing as the impacts of the LRT construction and associated intensification of urban forms become more apparent to local residents.

4.1. Data

Twitter data with valid geographic coordinates were obtained in real time from March 2014 to July 2015, the time period when the Region started constructing the first stage of LRT, based on a fixed boundary for cities of Waterloo Kitchener. It is important to note that although only some one percent of tweets can be obtained using public streaming API, the absolute quantity of the sample is still relatively large [71]. In the following analysis, we focus on transportation-related topics given the ongoing LRT project has elevated the issue of transportation within the Region and the general importance of transportation in many other locales [72].
A topic dictionary based on a purposely restrictive keyword set (LRT, light rail, bus, public transportation, GRT) was developed by scraping news and commentary articles from local media (“The Record” newspaper, http://www.therecord.com/waterlooregion/). Over 200,000 Twitter tweets with valid geographic coordinates were collected during the 16-month period. In total, 2777 and 2112 tweets were found to be relevant to the topics “public transportation” and “walking”, respectively. This volume is similar to that was found in de Albuquerque et al. [46], where over 99% of Twitter tweets were found to be “off-topic”.
To test the accuracy of the results, we manually classified a random sample (sample size = 120) for each topic and compared the results with computer-coded ones. We found 82.5% and 67.5% precision respectively for public transportation and walking. Interestingly, some messages about the TV show “The Walking Dead” were mistakenly classified as walking-related because the term “walking” has the highest weight in the lexicon. To improve this result, we adjusted the weight of the word “walking” and the relevance threshold of the topic accordingly. Testing of another randomly generated sample suggested that the precision of classification results increased to 80.83%, which is reasonable for IR of short text messages [62]. We further examined the spatial distributions of these messages to draw insights into their locational context (Figure 7 and Figure 8). The maps shown here were reproduced in ArcGIS to add map elements such as legends, scales, and better-quality graphs. In addition to mapping individual locations of messages, clustering circles are also mapped with the size indicating the counts of tweets within the area. As expected, most tweets were posted nearby two universities (University of Waterloo and Wilfrid Laurier University), and the cores of Waterloo and Kitchener, as those are the busiest areas where most students and business are located.
To further investigate the content of these messages, the topic modeling method was applied to find major topics of interest to Twitter users. The keyword list originally produced by LDA is shown in Table 2. While the relevance of some topics is evident, other terms shown in italics were less helpful and were removed from the topic hierarchy (Table 2).

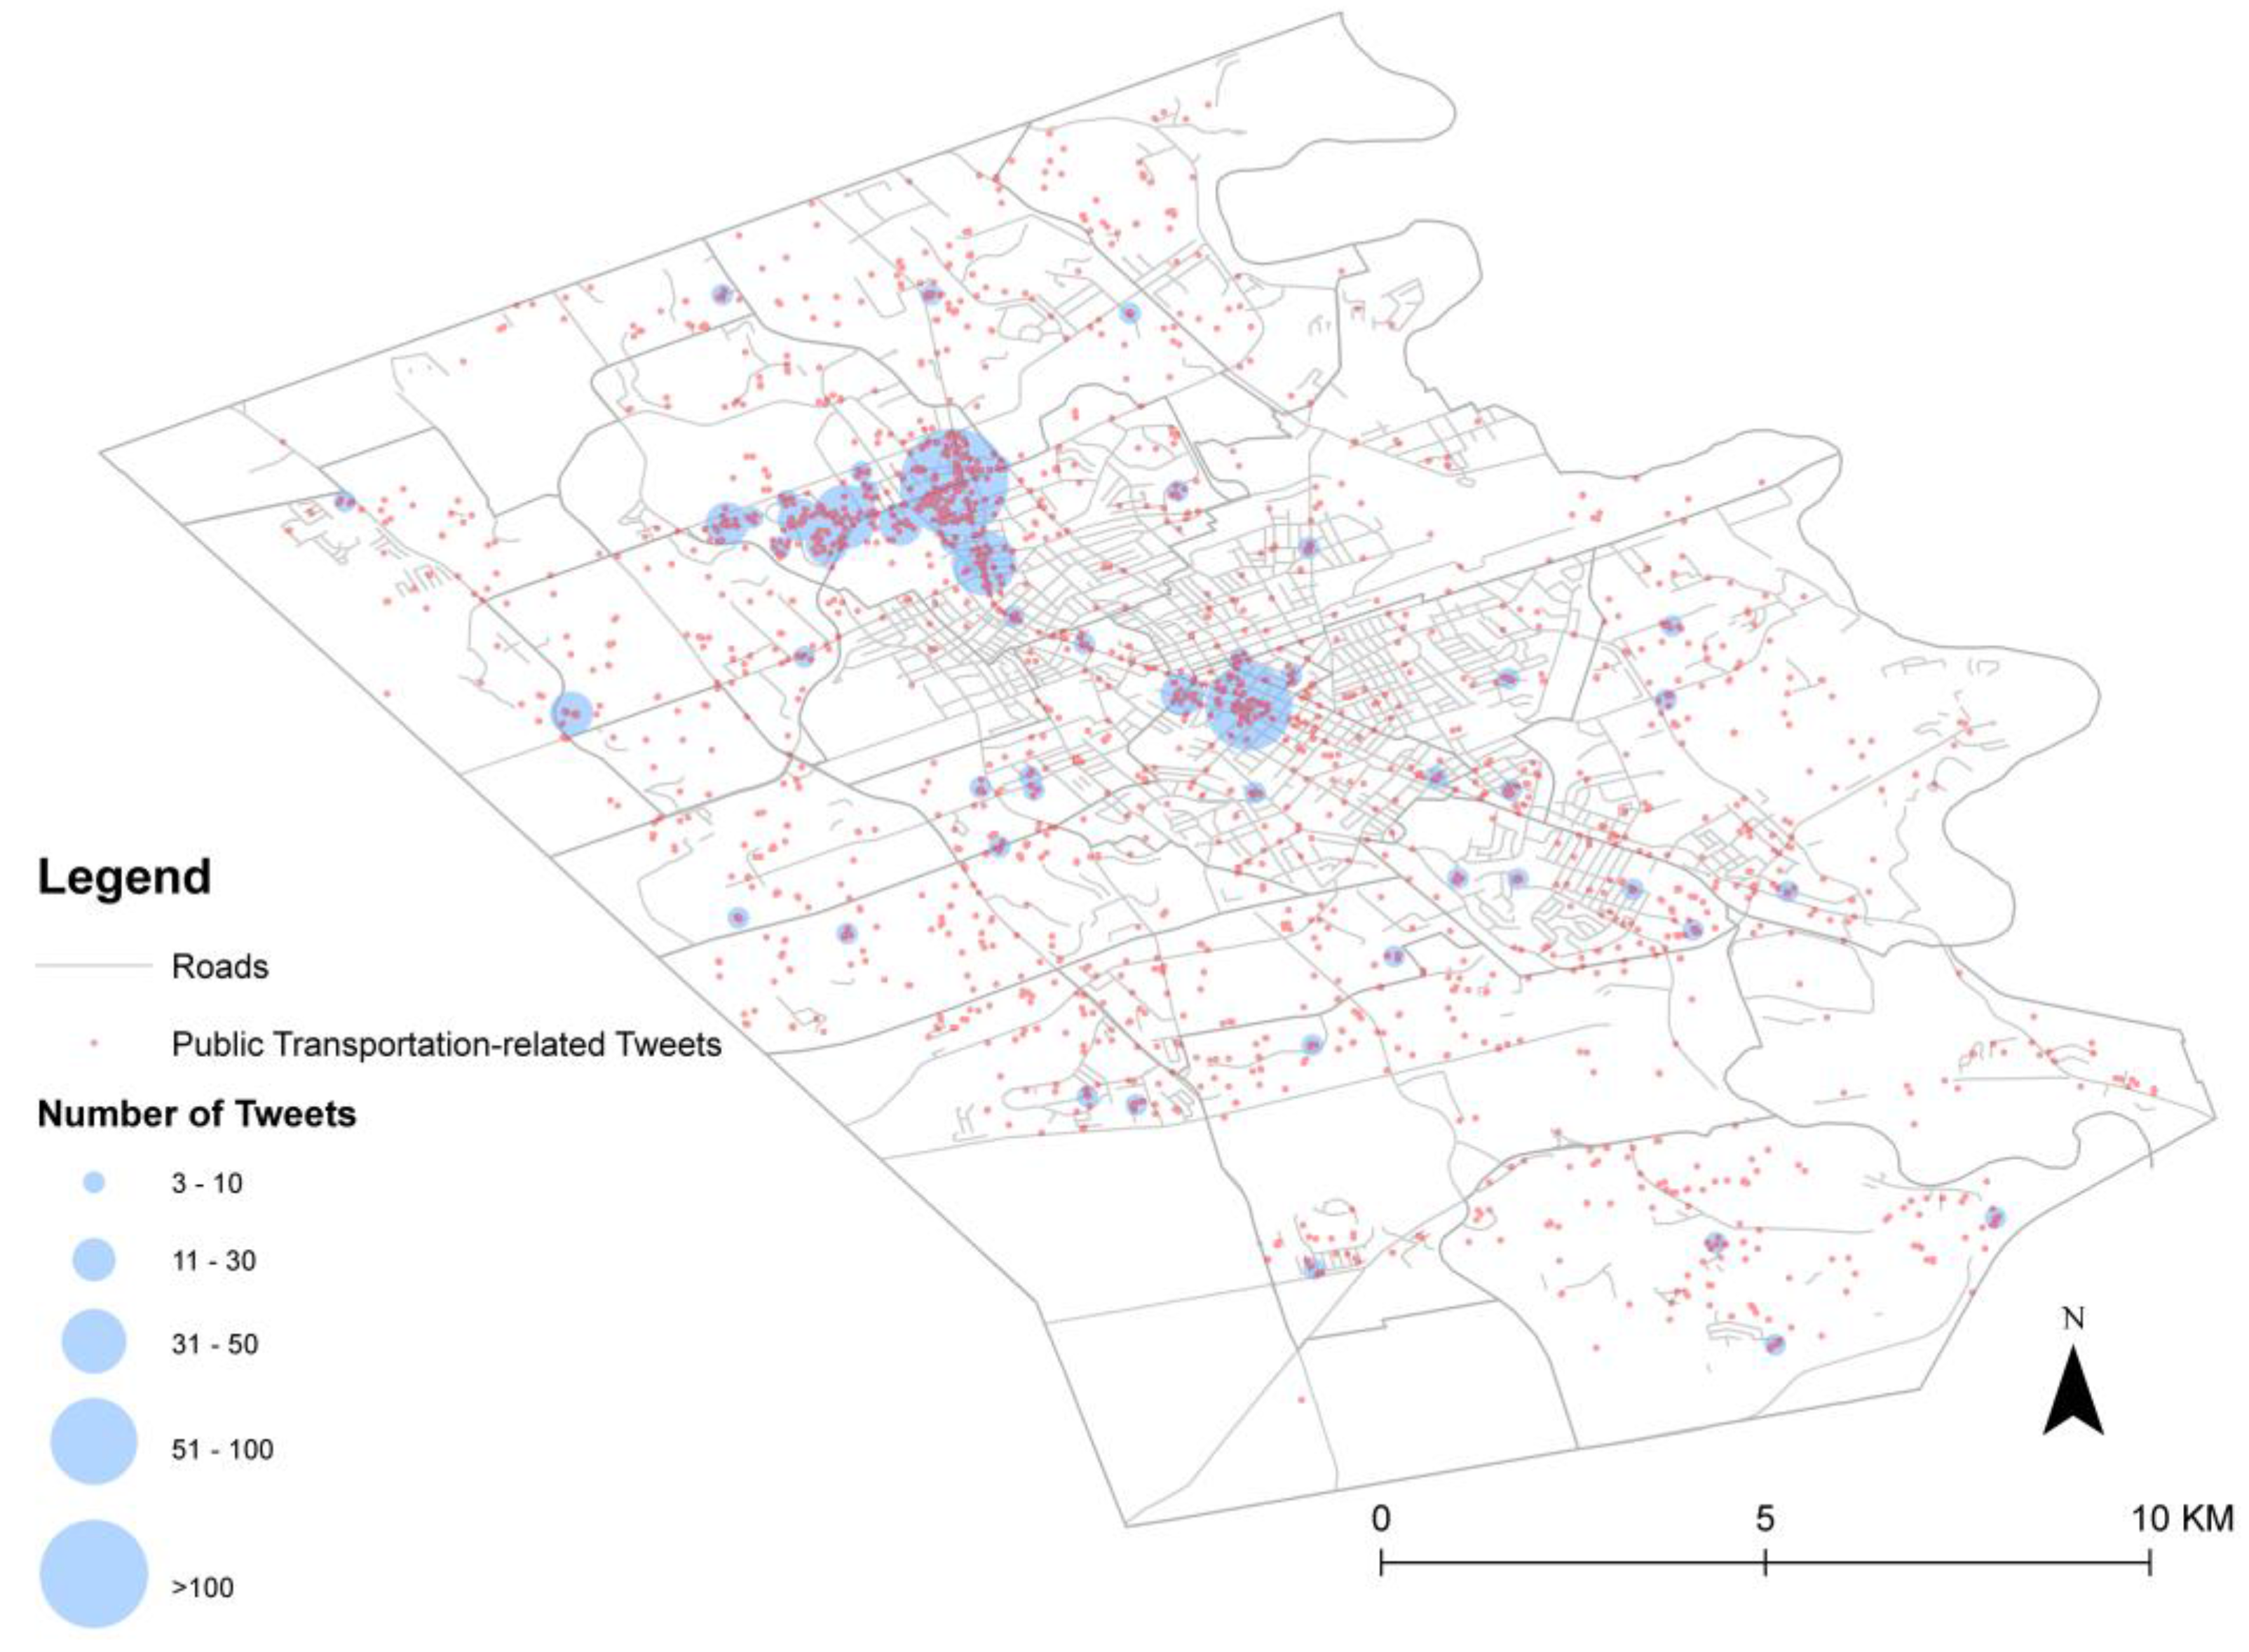
4.2. Understanding Public Perception from Geosocial Media

Figure 9 shows a sunburst diagram generated based on topic modeling results of public transportation related messages. Five topics, including trains, bus services, Uptown Waterloo, Charles Terminal (shortened from Charles Street Bus Terminal), and LRT, are found at the top of the hierarchy (the second inner-most ring in Figure 9). Among these five topics, three are associated with public transportation modes (trains, bus, and LRT), the other two relate to two transit hub locations (Uptown Waterloo, Charles Terminal).
While these topics generally provide a high-level overview of public transportation messages, more details are revealed at the next levels of the hierarchy. For example, the topic “bus service”, located in the lower left of Figure 9, is split into “bus delay” and “bus drivers” topics. Given that a few studies have suggested that social media comments are more negative rather than positive [39] and that “bus delay” itself is not a positive expression, it is reasonable to speculate that “bus delay” is the aspect that people have the most complaints about. In other instances, topics may occur multiple times in the hierarchy yet indicate different contexts. For example, “winter” appears under both “Charles Terminal” and” Uptown Waterloo” and relates to the infrastructure. Near Charles Terminal, people mentioned concerns with sidewalks in the surrounding area, largely because of ongoing construction (e.g., “@CityKitchener can you please fix sidewalk bricks queen at King to Charles. I'm tired of twisting my ankles on missing bricks.”). In Uptown Waterloo, “winter” was used more frequently to register a complaint about the lack of shelters at some bus stops (e.g., “we need a shelter at bus stop #1908”). This type of information is typical of what is reported through various open 311 applications that permit citizens to report concerns with city infrastructure and public services [73].
Text analysis results can also be combined with geolocations to examine where concerns or interests are expressed. Figure 10 shows major locations where tweets related to the topic “bus service” are posted. Spatial clusters were mapped using the proportion of bus service-related tweets to the total amounts of public transportation tweets within the same location in order to mitigate the effect of varying numbers of tweets in different locations. Not surprisingly, messages under this category are mostly concentrated around the University area as well as King Street, the central transit corridor in the Region. Several residential areas with concentrated rental housing in the northern Waterloo and southern Kitchener also appear to be significant, indicating high usages of bus service. General insights can be drawn from the map on where common concerns and needs are. For example, messages about bus drivers are consistently seen around Downtown Kitchener, indicating some pertinent traffic issues such as narrow road lanes and busy traffic in the area.
Other locations may not appear to be significant using the data collected for the entire sixteen months, but become more visible within certain time periods. For example, Figure 11 illustrates how road closures and changes in bus routes in June 2015 are reflected in bus service-related Tweets before and after June 2015. These changes were required at this time to permit a new LRT station to be constructed near the two tweet clusters close to the Parkside/Northfield intersection. While this is a specific example, it provides some indications of how geosocial media may help identify the dynamics of public opinions. Local governments can potentially use this data to examine the effects of planning and development projects on local people in a timelier manner.
Yet public opinions expressed through geosocial media mostly relate to public sentiment and perceptions toward their immediate environment. For example, although there is a growing trend of LRT-related tweets (from an average of 8% of all public transportation-related messages in 2014 to an average of 12% in 2015) because of the ongoing construction, the discussion of LRT mainly reflects users’ experience with current traffic situation (e.g., “On a jam-packed express bus—a good harbinger of ridership for the ION light rail line! Another reminder of how excited I am.”). This also indicates the difference between geosocial media and traditional participation methods, which will be further examined in the next section.

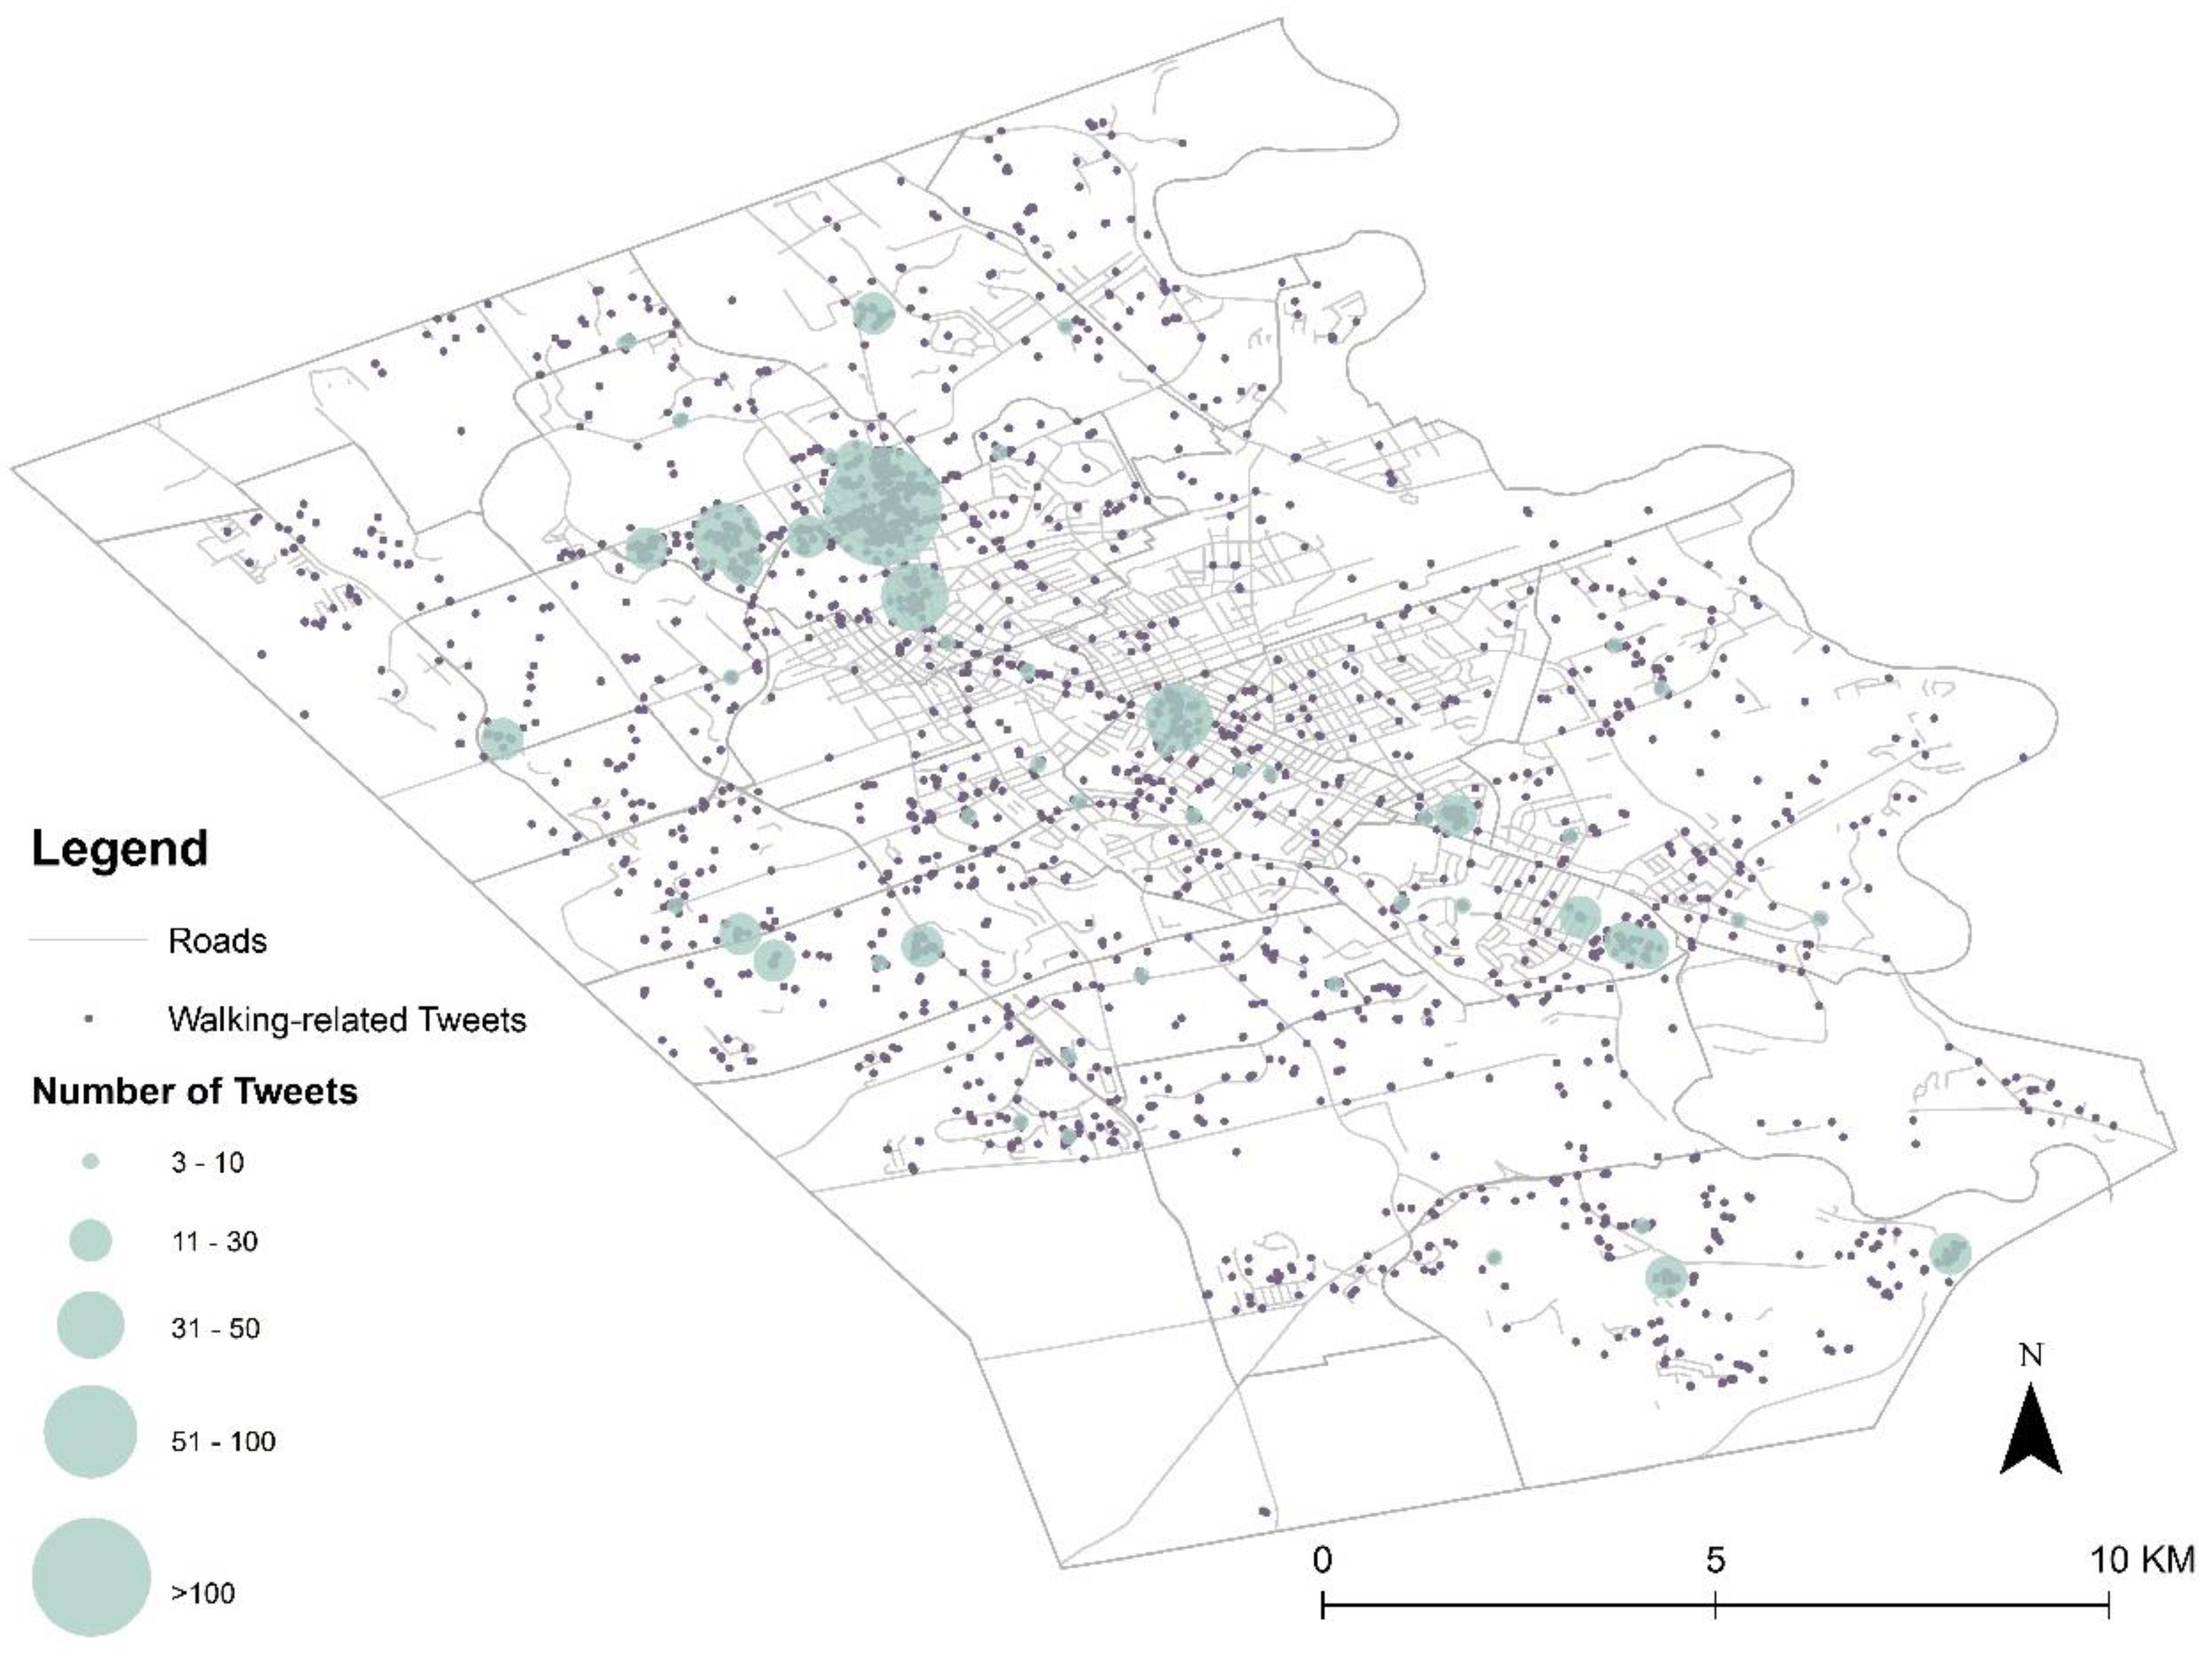
4.3. Comparing Different forms of Citizen Input

In addition to geosocial media, many traditional public participation methods, such as open house events, workshops, citizen letters, and surveys, also collect text and often geographically referenced input from citizens. This input can be analyzed in the same way as what was done for geosocial media messages. On a regular basis, The Record publishes citizen letters and comments that relate to public concerns. In total, 478 transportation-related citizen letters were obtained during the same time period as Twitter data were collected. These letters were processed following same procedure as shown in Figure 3. Figure 12 shows an overview of topics that emerged from the content of citizen letters.
An initial examination of topic categories demonstrates marked differences between geosocial media messages and citizen letters. Some topics, such as roundabout, traffic lights, and disabled passengers, do not occur in social media messages, whereas social media messages have other unique topics which mostly are place-based (e.g., Fairview Park Mall, Ainslie Terminal, and Beertown—a restaurant) and event-oriented. Although both citizen letters and Twitter messages mention certain places, places mentioned in citizen letters more refer to general areas, such as school zones, university, etc., whereas more specific place names are mentioned in Twitter messages. This general versus specific distinction is comparable to what others found in comparison of walking and sedentary interviews [74]. Similar to walking interviews, Twitter messages can better capture the dynamics of urban landscape as people often send messages when they are moving around the city. Citizen letters, analogous to sedentary interviews, serve as a more productive mode for narratives and an incubator of critical and deeper discussions on issues such as safety, urban design, and policy. Another unique characteristic of Twitter, or social media in general, is its capability to capture events and activities. In the topic hierarchy generated from Twitter messages, photo-posting activities appear to be associated with Uptown Waterloo and trains. Many messages in this category relates to an “IONUptown” challenge that was launched by Uptown Waterloo business improvement area (BIA) office (http://uptownwaterloobia.com/ionuptown-challenge/#). Many people, incentivized by the possibility of winning a prize, were willing to participate in the challenge by posting photos on Twitter about their work, play, or shopping activities around the Uptown area using hashtag #ionuptown and had a chance to win a prize. Methods demonstrated by Dunkel [12] to examine the photo content in addition to the text tags are beyond the scope of this study, but could be used in future analysis to learn more about citizens’ place perceptions and preferences.
Moreover, even topics that occur in both datasets may have completely different foci. While social media users mostly talked about bus delays and bus drivers regarding bus service, citizen letters demonstrate a quite divergent range of issues related to students, walking, and costs. These differences most likely can be traced to the different nature of the two input methods, one more temporally immediate and place-specific, the other favouring more contemplative and geographically generic, as discussed above [11]. On the other hand, it provides an interesting lens to compare different public input, especially on the potential of social media in reaching younger demographics which are often under-represented in traditional public participation methods [31].

4.4. Implications for Using Geosocial Media to Understand Public Opinions

Public opinions that can be retrieved from social media relate to what Corburn [75] considered as reflections of “actual sights, smells, and tastes, along with the tactil(e) and emotional experiences encountered in everyday life” (P.421). Knowledge of this kind is often not effectively captured by other data collection methods [76] and thus makes geosocial media a potentially valuable source. The case study presented here suggests that geosocial media can help identify public concerns and needs about physical facilities and the quality of public services, and potentially be used as an additional citizen reporting mechanism. Moreover, as illustrated in the case study, messages about the LRT project appear shortly after the start of the construction, suggesting a potential use of geosocial media to capture the dynamics of public perception over space and time. In addition, public perception expressed through Twitter is often a reflection of people sensing and responding to their immediate environments and differs from public input collected from formal public participation procedures, which is usually given based on more considered thought and rational choice [11].
With regard to spatial bias in geosocial media, the uneven geographic distributions of tweets were not surprisingly found to be concentrated within university areas, city core areas, and the major transit corridor, while data points in other areas were relatively sparse. As suggested in other studies [77,78], this unevenness may limit the use of geosocial media to certain areas. However, we were able to identify places outside high-interaction areas that were associated with particular topics or emerged at specific time periods. To understand spatial bias in data of this type, some attention should be directed to exploring qualitative analysis at different spatial and temporal scales.
The comparison between geosocial media and citizen letters further investigates the differences between geosocial media and other methods of monitoring public sentiment. Although geosocial media may be limited in providing more in-depth discussion and comments in response to local government initiatives, they illustrate some potential of complementing other public engagement methods as well as fostering new virtual interactions between government and citizens through online activities. These findings have several implications for citizen-government interactions. First, geosocial media may assist the study of “the relationship between what people say and where they say it” [74], which is found to be a challenging task because of the difficulty in identifying locational information from interviews [79]. While people are found to mention general areas more often in formally written comments such as citizen letters, whether geosocial media could supplement other methods by identifying where certain issues may worth further exploration. Second, the response to the IONUptown challenge suggests that there is a good potential to boost citizen contributions through entertaining place-based activities.
However, local government professionals’ perspectives will be critical to evaluate these identified possibilities and challenges. In practice, government adoption of social media as a monitoring mechanism depends not only on whether valuable information can be identified from social media, but also various factors such as the trustworthiness of data contributors and the organization’s culture with respect to adapting to new technologies [8,15]. Future work will examine the case study findings further by interviewing local government professionals.

5. Conclusions

This paper was intended to address challenges of utilizing geosocial media and assess the potential of these data sources as a new channel for gathering place-based public opinions. The potential uses and challenges identified from the case study contribute to an emerging body of literature on local governments’ adoption of social media. The empirical study illustrates how geosocial media can provide topic- and location-specific types of public input that differ subtly from what might be found in complementary data sources. Second, based on the inevitable geographic unevenness of geosocial media data, our study suggests that such an unevenness should be explored further by incorporating qualitative analysis at different spatial and temporal scales. Additionally, different from many geosocial media studies focusing on metropolitan cities, we purposefully chose cities of Waterloo and Kitchener to shed light on whether perceived opportunities of geosocial media are applicable to medium-sized cities. Finally, the TFA toolkit facilitated the study by alleviating technical challenges for harvesting and analyzing social media content. Designed for social media messages, this toolkit can be used for other text-based public input, such as that collected from surveys, public meetings, online forums, and different social media platforms. Further user study is needed to test the functionality and user-friendliness of the toolkit in order to broaden its usage.
There are several ways where the use of geosocial media in local government context can be further explored. First, our analysis focuses on Twitter, which is only one of the most popular social media platforms. It will be worthwhile to examine whether an integration of various types of social media would allow different subpopulations to be represented and different aspects of behavior and interaction to be captured. Second, a relatively small proportion of social media have encoded geographic coordinates. Georeferencing implicit spatial information such as place names may enrich data volume and increase the potential to glean useful information from social media. Finally, future work should further combine spatiotemporal analysis with ancillary information such as user profiles to uncover the representativeness of geosocial media and advance our understanding of how geosocial media may complement other participation methods.

Acknowledgments

The authors gratefully acknowledge funding provided by Canada’s Social Sciences and Humanities Research Council (SSHRC) through the grant “How the geospatial Web 2.0 is reshaping government-citizen interactions” to support this research. The authors also thank three anonymous reviewers for their valuable comments to improve an earlier version of this paper.

Author Contributions

Shanqi Zhang designed the research, implemented coding, collected and analyzed data, and prepared the manuscript. Rob Feick aided with the preparation of the manuscript with substantial comments, edits, and advice on the content.

Conflicts of Interest

The authors declare no conflict of interest.

References

  1. Innes, J.E.; Booher, D.E. Reframing public participation: Strategies for the 21st century. Plan. Theory Pract. 2004, 5, 419–436. [Google Scholar] [CrossRef]
  2. Cinderby, S. How to reach the “hard-to-reach”: The development of Participatory Geographic Information Systems (P-GIS) for inclusive urban design in UK cities. Area 2010, 42, 239–251. [Google Scholar] [CrossRef]
  3. Brown, G. Engaging the wisdom of crowds and public judgement for land use planning using public participation geographic information systems. Aust. Plan. 2015, 52, 199–209. [Google Scholar] [CrossRef]
  4. Lin, W. When web2.0 meets public participation GIS (PPGIS): VGI and spaces of participatory mapping in China. In Crowdsourcing Geographic Knowledge: Volunteered Geographic Information (VGI) in Theory and Practice; Sui, D., Elwood, S., Goodchild, M., Eds.; Springer Science + Business Media B.V.: Dordrecht, The Netherlands, 2013; pp. 83–103. [Google Scholar]
  5. Reddick, C.G.; Norris, D.F. Social media adoption at the American grass roots: Web 2.0 or 1.5? Gov. Inf. Q. 2013, 30, 498–507. [Google Scholar] [CrossRef]
  6. Massa, P.; Campagna, M. Social media geographic information: Recent findings and opportunities for smart spatial planning. TeMA J. Land Use Mobil. Environ. 2014. [Google Scholar] [CrossRef]
  7. Massa, P. Social Media Geographic Information (SMGI): Opportunities for Spatial Planning and Governance. Ph.D. Thesis, Università Degli Studi Di Cagliari Scuola, Cagliari, Italy, 2016. [Google Scholar]
  8. Wukich, C.; Mergel, I. Reusing social media information in government. Gov. Inf. Q. 2016. [Google Scholar] [CrossRef]
  9. Croitoru, A.; Wayant, N.; Crooks, A.; Radzikowski, J.; Stefanidis, A. Linking cyber and physical spaces through community detection and clustering in social media feeds. Comput. Environ. Urban Syst. 2014, 53, 47–64. [Google Scholar] [CrossRef]
  10. Kim, K.-S.; Kojima, I.; Ogawa, H. Discovery of local topics by using latent spatio-temporal relationships in geo-social media. Int. J. Geogr. Inf. Sci. 2016. [Google Scholar] [CrossRef]
  11. Gal-Tzur, A.; Grant-Muller, S.M.; Kuflik, T.; Minkov, E.; Nocera, S.; Shoor, I. The potential of social media in delivering transport policy goals. Transp. Policy 2014, 32, 115–123. [Google Scholar] [CrossRef]
  12. Dunkel, A. Visualizing the perceived environment using crowdsourced photo geodata. Landsc. Urban Plan. 2015, 142, 173–186. [Google Scholar] [CrossRef]
  13. Campagna, M.; Floris, R.; Massa, P. The role of social media geographic information (SMGI) in spatial planning. In Planning Support Systems and Smart Cities; Lecture Notes in Geoinformation and Cartography; Geertman, S., Ed.; Springer International Publishing: Basel, Switzerland, 2015; pp. 41–60. [Google Scholar]
  14. Robertson, C.; Feick, R. Bumps and bruises in the digital skins of cities: Unevenly distributed user-generated content across US urban areas. Cartogr. Geogr. Inf. Sci. 2015, 0406, 1–18. [Google Scholar] [CrossRef]
  15. Grant-Muller, S.M.; Gal-Tzur, A.; Minkov, E.; Kuflik, T.; Nocera, S.; Shoor, I. Transport policy: Social media and user-generated content in a changing information paradigm. In Social Media for Government Services; Nepal, S., Ed.; Springer International Publishing: Basel, Switzerland, 2015; pp. 325–366. [Google Scholar]
  16. Carver, S.; Evans, A.; Kingston, R.; Turton, I. Public participation, GIS, and cyberdemocracy: Evaluating on-line spatial decision support systems. Environ. Plan. B Plan. Des. 2001, 28, 907–921. [Google Scholar] [CrossRef]
  17. Rowe, G. A typology of public engagement mechanisms. Sci. Technol. Hum. Values 2005, 30, 251–290. [Google Scholar] [CrossRef]
  18. Day, D. Citizen participation in the planning process: An essentially contested concept? J. Plan. Lit. 1997, 11, 421–434. [Google Scholar] [CrossRef]
  19. Higgs, G.; Berry, R.; Kidner, D.; Langford, M. Using IT approaches to promote public participation in renewable energy planning: Prospects and challenges. Land Use Policy 2008, 25, 596–607. [Google Scholar] [CrossRef]
  20. Lowndes, V.; Pratchett, L.; Stoker, G. Trends in public participation: Part 1—Local government perspectives. Public Adm. 2001, 79, 205–222. [Google Scholar] [CrossRef]
  21. Ghose, R. The complexities of citizen participation through collaborative governance. Space Polity 2005, 9, 61–75. [Google Scholar] [CrossRef]
  22. Irvin, R.A.; Stansbury, J. Citizen participation in decision making: Is it worth the effort? Public Adm. Rev. 2004, 64, 55–65. [Google Scholar] [CrossRef]
  23. King, C.S.; Feltey, K.M.; Susel, B.O. The question of participation: Toward authentic public participation in public administration. Public Adm. Rev. 1998, 58, 317–326. [Google Scholar] [CrossRef]
  24. Ghose, R. Use of information technology for community empowerment: Transforming geographic information systems into community information systems. Trans. GIS 2001, 5, 141–163. [Google Scholar] [CrossRef]
  25. Sieber, R. Public participation geographic information systems: A literature review and framework. Ann. Assoc. Am. Geogr. 2006, 96, 491–507. [Google Scholar] [CrossRef]
  26. Hall, G.B.; Chipeniuk, R.; Feick, R.D.; Leahy, M.G.; Deparday, V. Community-based production of geographic information using open source software and Web 2.0. Int. J. Geogr. Inf. Sci. 2010, 24, 761–781. [Google Scholar] [CrossRef]
  27. Pocewicz, A.; Nielsen-Pincus, M.; Brown, G.; Schnitzer, R. An evaluation of Internet versus paper-based methods for Public Participation Geographic Information Systems (PPGIS). Trans. GIS 2012, 16, 39–53. [Google Scholar] [CrossRef]
  28. Brown, G.; Weber, D.; de Bie, K. Assessing the value of public lands using public participation GIS (PPGIS) and social landscape metrics. Appl. Geogr. 2014, 53, 77–89. [Google Scholar] [CrossRef]
  29. Slotterback, C.S. Planners’ perspectives on using technology in participatory processes. Environ. Plan. B Plan. Des. 2011, 38, 468–485. [Google Scholar] [CrossRef]
  30. Vicente, M.R.; Novo, A. An empirical analysis of e-participation. The role of social networks and e-government over citizens’ online engagement. Gov. Inf. Q. 2014, 31, 379–387. [Google Scholar] [CrossRef]
  31. Evans-Cowley, J.S.; Griffin, G. Micro-participation: The role of microblogging in planning. SSRN Electron. J. 2011. [Google Scholar] [CrossRef]
  32. Khan, G.F.; Yoon, H.Y.; Kim, J.; Park, H.W. From e-government to social government: Twitter use by Korea’s central government. Online Inf. Rev. 2013, 38, 95–113. [Google Scholar] [CrossRef]
  33. Johannessen, M.R.; Flak, L.S.; Sæbø, Ø. Choosing the right medium for municipal eParticipation based on stakeholder expectations. In Electronic Participation; Tambouris, E., Macintosh, A., Sæbø, Ø., Eds.; Springer: Berlin/Heidelberg, Germany, 2012; pp. 25–36. [Google Scholar]
  34. Sandoval-Almazan, R.; Ramon Gil-Garcia, J. Towards cyberactivism 2.0? Understanding the use of social media and other information technologies for political activism and social movements. Gov. Inf. Q. 2014, 31, 365–378. [Google Scholar] [CrossRef]
  35. Bonsón, E.; Royo, S.; Ratkai, M. Citizens’ engagement on local governments’ Facebook sites. An empirical analysis: The impact of different media and content types in Western Europe. Gov. Inf. Q. 2015, 32, 52–62. [Google Scholar] [CrossRef]
  36. Mossberger, K.; Wu, Y.; Crawford, J. Connecting citizens and local governments? Social media and interactivity in major U.S. cities. Gov. Inf. Q. 2013, 30, 351–358. [Google Scholar] [CrossRef]
  37. Panagiotopoulos, P.; Bigdeli, A.Z.; Sams, S. Citizen–government collaboration on social media: The case of Twitter in the 2011 riots in England. Gov. Inf. Q. 2014, 31, 349–357. [Google Scholar] [CrossRef]
  38. Zavattaro, S.M.; French, P.E.; Mohanty, S.D. A sentiment analysis of U.S. local government tweets: The connection between tone and citizen involvement. Gov. Inf. Q. 2015, 32, 333–341. [Google Scholar] [CrossRef]
  39. Schweitzer, L. Planning and social media: A case study of public transit and stigma on Twitter. J. Am. Plan. Assoc. 2014, 80, 218–238. [Google Scholar] [CrossRef]
  40. Silva, T.H.; Vaz De Melo, P.O.S.; Almeida, J.M.; Loureiro, A.A.F. Social media as a source of sensing to study city dynamics and urban social behavior: Approaches, models, and opportunities. In Ubiquitous Social Media Analysis; Lecture Notes in Computer Science; Atzmueller, M., Ed.; Springer-Verlag: Berlin/Heidelberg, Germany, 2013; pp. 63–87. [Google Scholar]
  41. Li, L.; Goodchild, M.F. Constructing places from spatial footprints. In Proceedings of the 1st ACM SIGSPATIAL International Workshop on Crowdsourced and Volunteered Geographic Information, Redondo Beach, CA, USA, 7–9 November 2012; pp. 15–21.
  42. Thelwall, M.; Buckley, K.; Paltoglou, G. Sentiment strength detection for the social web. J. Am. Soc. Inf. Sci. Technol. 2012, 63, 163–173. [Google Scholar] [CrossRef]
  43. Feick, R.; Robertson, C. A multi-scale approach to exploring urban places in geotagged photographs. Comput. Environ. Urban Syst. 2015, 53, 96–109. [Google Scholar] [CrossRef]
  44. Panteras, G.; Wise, S.; Lu, X.; Croitor, A.; Crooks, A.; Stefanidis, A. Triangulating social multimedia content for event localization using Flickr and Twitter. Trans. GIS 2014, 19, 694–715. [Google Scholar] [CrossRef]
  45. Yin, J.; Lampert, A.; Cameron, M.; Robinson, B.; Power, R. Using social media to enhance emergency situation awareness. IEEE Intell. Syst. 2012, 27, 52–59. [Google Scholar] [CrossRef]
  46. De Albuquerque, J.P.; Herfort, B.; Brenning, A.; Zipf, A. A geographic approach for combining social media and authoritative data towards identifying useful information for disaster management. Int. J. Geogr. Inf. Sci. 2015, 29, 667–689. [Google Scholar] [CrossRef]
  47. Afzalan, N.; Muller, B. The role of social media in green infrastructure planning: A case study of neighborhood participation in park siting. J. Urban Technol. 2014, 21, 67–83. [Google Scholar] [CrossRef]
  48. Afzalan, N.; Evans-Cowley, J. Planning and social media: Facebook for planning at the neighbourhood scale. Plan. Pract. Res. 2015, 30, 270–285. [Google Scholar] [CrossRef]
  49. Wang, W.; Stewart, K. Spatiotemporal and semantic information extraction from Web news reports about natural hazards. Comput. Environ. Urban Syst. 2015, 50, 30–40. [Google Scholar] [CrossRef]
  50. El-Diraby, T.E.; Osman, H. A domain ontology for construction concepts in urban infrastructure products. Autom. Constr. 2011, 20, 1120–1132. [Google Scholar] [CrossRef]
  51. Kergosien, E.; Laval, B.; Roche, M.; Teisseire, M. Are opinions expressed in land-use planning documents? Int. J. Geogr. Inf. Sci. 2014, 28, 739–762. [Google Scholar] [CrossRef]
  52. Adams, B.; McKenzie, G. Inferring thematic places from spatially referenced natural language descriptions. In Crowdsourcing Geographic Knowledge: Volunteered Geographic Information (VGI) in Theory and Practice; Sui, D.Z., Elwood, S., Goodchild, M.F., Eds.; Springer: Houten, The Netherlands, 2013; pp. 201–221. [Google Scholar]
  53. Dou, W.; Wang, X.; Skau, D.; Ribarsky, W.; Zhou, M.X. LeadLine: Interactive visual analysis of text data through event identification and exploration. In Proceedings of the IEEE Conference on Visual Analytics Science and Technology 2012 (VAST 2012), Seattle, WA, USA, 14–19 October 2012; pp. 93–102.
  54. Ríos, S.; Muñoz, R. Content patterns in topic-based overlapping communities. Sci. World J. 2014, 2014, 1–11. [Google Scholar] [CrossRef] [PubMed]
  55. Johnson, P.A.; Sieber, R.E. Situating the adoption of VGI by government. In Crowdsourcing Geographic Knowledge: Volunteered Geographic Information (VGI) in Theory and Practice; Sui, D., Elwood, S., Goodchild, M., Eds.; Springer: Houten, The Netherlands, 2013; pp. 65–81. [Google Scholar]
  56. Stefanidis, A.; Crooks, A.; Radzikowski, J. Harvesting ambient geospatial information from social media feeds. GeoJournal 2013, 78, 319–338. [Google Scholar] [CrossRef]
  57. Hardy, D. The geographic nature of Wikipedia authorship. In Crowdsourcing Geographic Knowledge: Volunteered Geographic Information (VGI) in Theory and Practice; Sui, D., Elwood, S., Goodchild, M., Eds.; Springer: Houten, The Netherlands, 2013; pp. 175–200. [Google Scholar]
  58. Graham, M.; Straumann, R.K.; Hogan, B. Digital divisions of labor and informational magnetism: Mapping participation in Wikipedia. Ann. Assoc. Am. Geogr. 2015, 5608, 1–21. [Google Scholar] [CrossRef]
  59. Hollenstein, L.; Purves, R. Exploring place through user-generated content: Using Flickr to describe city cores. J. Spat. Inf. Sci. 2010, 1, 21–48. [Google Scholar]
  60. Cavallo, S.; Lynch, J.; Scull, P. The digital divide in citizen-initiated government contacts: A GIS approach. J. Urban Technol. 2014, 21, 77–93. [Google Scholar] [CrossRef]
  61. Lenhart, A.; Fox, S. Twitter and Status Updating; Pew Internet & American Life Project: Washington, DC, USA, 2009. [Google Scholar]
  62. Tao, K.; Abel, F.; Hauff, C.; Houben, G. What makes a tweet relevant for a topic? CEUR Workshop Proc. 2012, 838, 49–56. [Google Scholar]
  63. Rattenbury, T.; Naaman, M. Methods for extracting place semantics from Flickr tags. ACM Trans. Web 2009, 3, 1–30. [Google Scholar] [CrossRef]
  64. Abel, F.; Celik, I.; Houben, G.J.; Siehndel, P. Leveraging the semantics of tweets for adaptive faceted search on twitter. In Proceedings of the 10th International Semantic Web Conference, Bonn, Germany, 23–27 October 2011; pp. 1–17.
  65. Zhai, C.; Lafferty, J. A study of smoothing methods for language models applied to Ad Hoc information retrieval. In Proceedings of the 24th Annual International ACM SIGIR Conference on Research and Development in Information Retrieval, New Orleans, LA, USA, 9–12 September 2001; pp. 334–342.
  66. Blei, D.M. Introduction to probabilistic topic modeling. Commun. ACM 2012, 55, 77–84. [Google Scholar] [CrossRef]
  67. Adams, B.; Janowicz, K. Thematic signatures for cleansing and enriching place-related linked data. Int. J. Geogr. Inf. Sci. 2015, 29, 556–579. [Google Scholar] [CrossRef]
  68. Smith, A.; Hawes, T.; Myers, M. Hierarchie: Interactive visualization for hierarchical topic models. In Proceedings of the Workshop on Interactive Language Learning, Visualization, and Interfaces, Baltimore, MD, USA, 27 June 2014; pp. 71–78.
  69. Django The Overview of Django Framework. Available online: https://www.djangoproject.com/start/overview/ (accessed on 9 January 2016).
  70. Region of Waterloo. A Blueprint for Shaping Growth in Waterloo Region. Available online: http://www.regionofwaterloo.ca/en/doingBusiness/resources/BlueprintShapingGrowth.pdf (accessed on 16 May 2016).
  71. Leetaru, K.H.; Wang, S.; Cao, G.; Padmanabhan, A.; Shook, E. Mapping the global Twitter heartbeat: The geography of Twitter. First Monday 2013, 18, 1–12. [Google Scholar] [CrossRef]
  72. Gal-Tzur, A.; Grant-Muller, S.M.; Minkov, E.; Nocera, S. The impact of social media usage on transport policy: Issues, challenges and recommendations. Procedia Soc. Behav. Sci. 2014, 111, 937–946. [Google Scholar] [CrossRef]
  73. Sieber, R.E.; Johnson, P.A. Civic open data at a crossroads: Dominant models and current challenges. Gov. Inf. Q. 2015, 32, 308–315. [Google Scholar] [CrossRef]
  74. Evans, J.; Jones, P. The walking interview: Methodology, mobility and place. Appl. Geogr. 2011, 31, 849–858. [Google Scholar] [CrossRef]
  75. Corburn, J. Bringing local knowledge into environmental decision making. J. Plan. Educ. Res. 2003, 22, 420–433. [Google Scholar] [CrossRef]
  76. McCall, M.K.; Dunn, C.E. Geo-information tools for participatory spatial planning: Fulfilling the criteria for “good” governance? Geoforum 2012, 43, 81–94. [Google Scholar] [CrossRef]
  77. Lawrence, H.; Robertson, C.; Feick, R.; Nelson, T. Identifying optimal study areas and apatial aggregation units for point-based VGI from multiple sources. In Advances in Spatial Data Handling and Analysis; Harvey, F., Leung, Y., Eds.; Springer International Publishing: Basel, Switzerland, 2015; pp. 65–84. [Google Scholar]
  78. Shelton, T.; Poorthuis, A.; Zook, M. Social media and the city: Rethinking urban socio-spatial inequality using user-generated geographic information. Landsc. Urban Plan. 2015, 142, 198–211. [Google Scholar] [CrossRef]
  79. Elwood, S.A.; Martin, D.G. “Placing” interviews: Location and scales of power in qualitative research. Prof. Geogr. 2000, 52, 649–657. [Google Scholar] [CrossRef]
Figure 1. The workflow of collecting and analyzing social media data.
Ijgi 05 00074 g001
Figure 2. A two-step procedure to automatically identify relevant social media messages.
Ijgi 05 00074 g002
Figure 3. The logic of hierarchical LDA (hLDA) (adapted from [68]).
Ijgi 05 00074 g003
Figure 4. System design of TFA toolkit.
Ijgi 05 00074 g004
Figure 5. (a) the main interface of the TFA toolkit; (b) selecting documents for generating a customized topic lexicon; and (c) reviewing and modifying the auto-generated keyword list.
Ijgi 05 00074 g005
Figure 6. Study Area.
Ijgi 05 00074 g006
Figure 7. Spatial distributions of public transportation related tweets.
Ijgi 05 00074 g007
Figure 8. Spatial distributions of walking related tweets.
Ijgi 05 00074 g008
Figure 9. An overview of topic hierarchy generated from Twitter Tweets.
Ijgi 05 00074 g009
Figure 10. Spatial clustering of bus service-related tweets.
Ijgi 05 00074 g010
Figure 11. The comparisons of bus service-related tweets before and after June 2015.
Ijgi 05 00074 g011
Figure 12. An overview of topic hierarchy generated from citizen letters.
Ijgi 05 00074 g012
Table 1. Evaluating the relevance of a message to topic “parking”.
TextScoreCategory
“This mcdonalds parking lot is so unnecessarily massive.”0.247Relevant
“why does Waterloo parking charge so much for parking lots that are OBVIOUSLY over capacity everyday. open rim parking lots for f*** sake”0.173Relevant
“The freshco parking lots so d*** complicated. I’m almost prone to get into an accident”0.132Relevant
“Feels like the entire population of Waterloo is in this parking lot. can’t find a place to park”0.105Relevant
“@570News turkey on the loose at Canadian Tire Weber Street parking lot! http://t.co/rXlmjXQvOZ0.076Irrelevant
“I don’t know why, but I always feel more comfortable parking next to other BMWs. So I’ve turned it into a game. I search them out”0.036Irrelevant
Table 2. Examples of keyword list generated from LDA.
TopicPersonal FeelingsLong DistanceSchools and KidsSchools and KidsIrrelevantIrrelevant
Keywordsafetywalkoffschoolnicenice
comfortfarschoolwalkloverespect
walkingschoolkidsdontimlike
watchawaysnowicegetdont
likecampusfarfriendlyplacessoccer
lightsfriendlykitchenerbackhomepeople
catchminutestrafficillhateS***
dogclasshatelightsturninggot
goodsnowmomwaterlooguysone
timecaricecoldtonightweather

