Article

Implementation of Geographical Conditions Monitoring in Beijing-Tianjin-Hebei, China

Chinese Academy of Surveying and Mapping, Beijing 100830, China
*
Authors to whom correspondence should be addressed.
ISPRS Int. J. Geo-Inf. 2016, 5(6), 89; https://0-doi-org.brum.beds.ac.uk/10.3390/ijgi5060089
Submission received: 7 March 2016 / Revised: 21 May 2016 / Accepted: 26 May 2016 / Published: 8 June 2016

Abstract

:
Increasingly accelerated urbanization and socio-economic development can cause a series of environmental problems. Accurate and efficient monitoring of the geographical conditions is important for achieving sustainable development. This paper presents the first results of the project “Geographical Conditions Monitoring (GCM)” in an exemplified area “Beijing-Tianjin-Hebei (BTH)” in China over the last three decades. It focuses on four hot issues in BTH: distribution of dust surfaces and pollution industries, vegetation coverage, urban sprawl, and ground subsidence. The aim of this project is the detection of geographical condition changes and for the description of this development by indicators, as well as the analysis and evaluation of the effects of such processes on selected environmental perspectives. The results have shown that the contributions of the applied GCM in making the plan of urban design and nature conservation. Valuable experience gained from this project would be useful for further developing and applying GCM at the national level.

1. Introduction

In 2013 China launched the “Geographical Conditions Monitoring (GCM)” national project. The GCM is a dynamic monitoring of the territory of the country. It mainly contains two steps: the first is to identify the status and spatial distribution of natural and cultural geographical features, such as rivers and lakes, forest, grassland, road network, urban layout, etc. The second is a statistical analysis of their changes in the quantity and frequency, distribution characteristics, regional differences, and trends [1]. It aims to transfer the data collected from the Earth’s surface into information and knowledge which will support sustainable development and evidence-based decision-making. In terms of application, GCM can be divided into three categories: fundamental monitoring, thematic monitoring, and disaster monitoring [1]. Fundamental monitoring focuses on all geographical features from the Earth’s surface. It provides the databases for thematic and disaster monitoring. Thematic monitoring is a higher level of geo-information which focuses on issues that would arouse public and governmental concern, such as environmental protection and natural resource management. Disaster monitoring is not regularly conducted. It is often following the disaster events, e.g., earthquakes, floods, mudslides, fires, and droughts. Such monitoring programs are designed to ensure a flow of benefits, or to control the severity and distribution of anticipated or especially unanticipated negative effects as they occur, and possibly to ensure due compensation where it is required [2]. It is usually of interest in geographic regions where rapid industrial or urban development and/or dramatic socio-economic change is taking place. In China, GCM has been considered as a component of “Digital China”, a framework for geographic information needed by the nation. The outcome of GCM can be applied in the public service platform of “Digital China” to enrich its content.
Similar projects have been initialized and conducted at the national level among other countries, even at the global level. In the late 20th century, the idea of establishing a National Ecological Observatory Network (NEON) has been formulated by the scientists in United States. In 2006 the initial plan for NEON has been completed and funded by the National Science Foundation (NSF) of US. It is currently in the construction phase, in which it will establish a national network for data and metadata gathering, field sampling, data processing, and information delivering. The aim is to manage large-scale ecological observing systems and experiments, and provide open, continental-scale data that characterize and quantify complex, rapidly-changing ecological processes [3]. To link existing and diverse observing systems around the world, the Global Earth Observation System of Systems (GEOSS) was established to provide comprehensive environmental data, information and analyses. It covers nine so called “Societal Benefit Areas”: agriculture, biodiversity, climate, disasters, ecosystems, energy, health, water, and meteorology [4], and will support the development of new systems where gaps currently exist. In Europe, a monitoring program “European environment information and observation network” (EIONET) was established in 1994 under the frame of European Environment Agency (EEA) and cooperating countries has increased consistently [5]. It aims to provide timely and quality-assured data, information and expertise for assessing the state of the environment in Europe and the pressures acting upon it. A broad issues related to environment protection are covered by EIONET, such as air pollution, climate change, transport, water stress, agriculture, biodiversity, natural risks, etc. In 2003, the European Union (EU) has launched another program “Global Monitoring for Environment and Security” (GMES), which mainly contains two kinds of services: monitoring of Earth systems (including land, marine, and atmosphere) and horizontal applications (including security, emergency, and climate change). This program is designed for supporting the EU as a global actor. For example, GMES is Europe’s main contributor to the global ten-year implementation plan of the GEOSS. GMES has also been highlighted in the EU’s dialogues with USA, Russia, China, and India [6]. In addition to the above mentioned programs, there are monitoring projects focusing on specific topics, such as the Famine Early Warning Systems Network (FEW NET) created by the US Agency for International Development, Global Drought Monitoring Network [7], and the natural disasters and crustal deformation monitoring implemented by Geospatial Information Authority of Japan.
In this paper, a brief description and application of China’s Geographical Conditions Monitoring program are presented in the exemplified Beijing-Tianjin-Hebei region. Four important issues, i.e., distribution of dust surfaces and pollution industries, urban sprawl, vegetation coverage, and land subsidence, are monitored from a spatial perspective. An important aim of GCM is to support the decision-making process of nature conservation and spatial planning. In this case, further comprehensive analyses are necessary to understand the monitoring results, especially the impact of pollution sources on populations and land subsidence on infrastructures. Additionally, a cumulative analysis of the change pattern of urban sprawl and vegetation coverage is conducted to gain more insights of the anthropogenic impact on the Earth’s surface.

2. Methodological Basis for Thematic Monitoring at a Regional Scale

2.1. Monitoring Area

The Beijing-Tianjin-Hebei (BTH) region is an urban agglomeration located in Northern China, including the mega-cities of Beijing and Tianjin, and several cities from Hebei province, e.g., Shijiazhuang, Baoding, Tangshan, etc. (Figure 1). It has a population of approximately 110 million and covers 218,000 km2. In 2014, the BTH region’s annual GDP was about 6.65 trillion yuan, ranking third in China’s 20 urban agglomerations. As the political, economic, and cultural center of China, integrative development of BTH was set as a national strategy. Currently, the BTH region is experiencing rapid urbanization with an annual growth ca. 1.38% [8]. According to the historical data and future policy, a foreseeable increase of urbanization and economic growth will continue in this region and, correspondingly, the need for space and resources would put great pressure on the environment. Against this background, we have implemented a monitoring program in this region focusing on four themes: distribution of dust surfaces and pollution industries, vegetation coverage, urban sprawl, and land subsidence. The monitoring period covers from 1990 to 2014, depending on the data availability for each monitoring theme.

2.2. Approaches of Thematic Monitoring

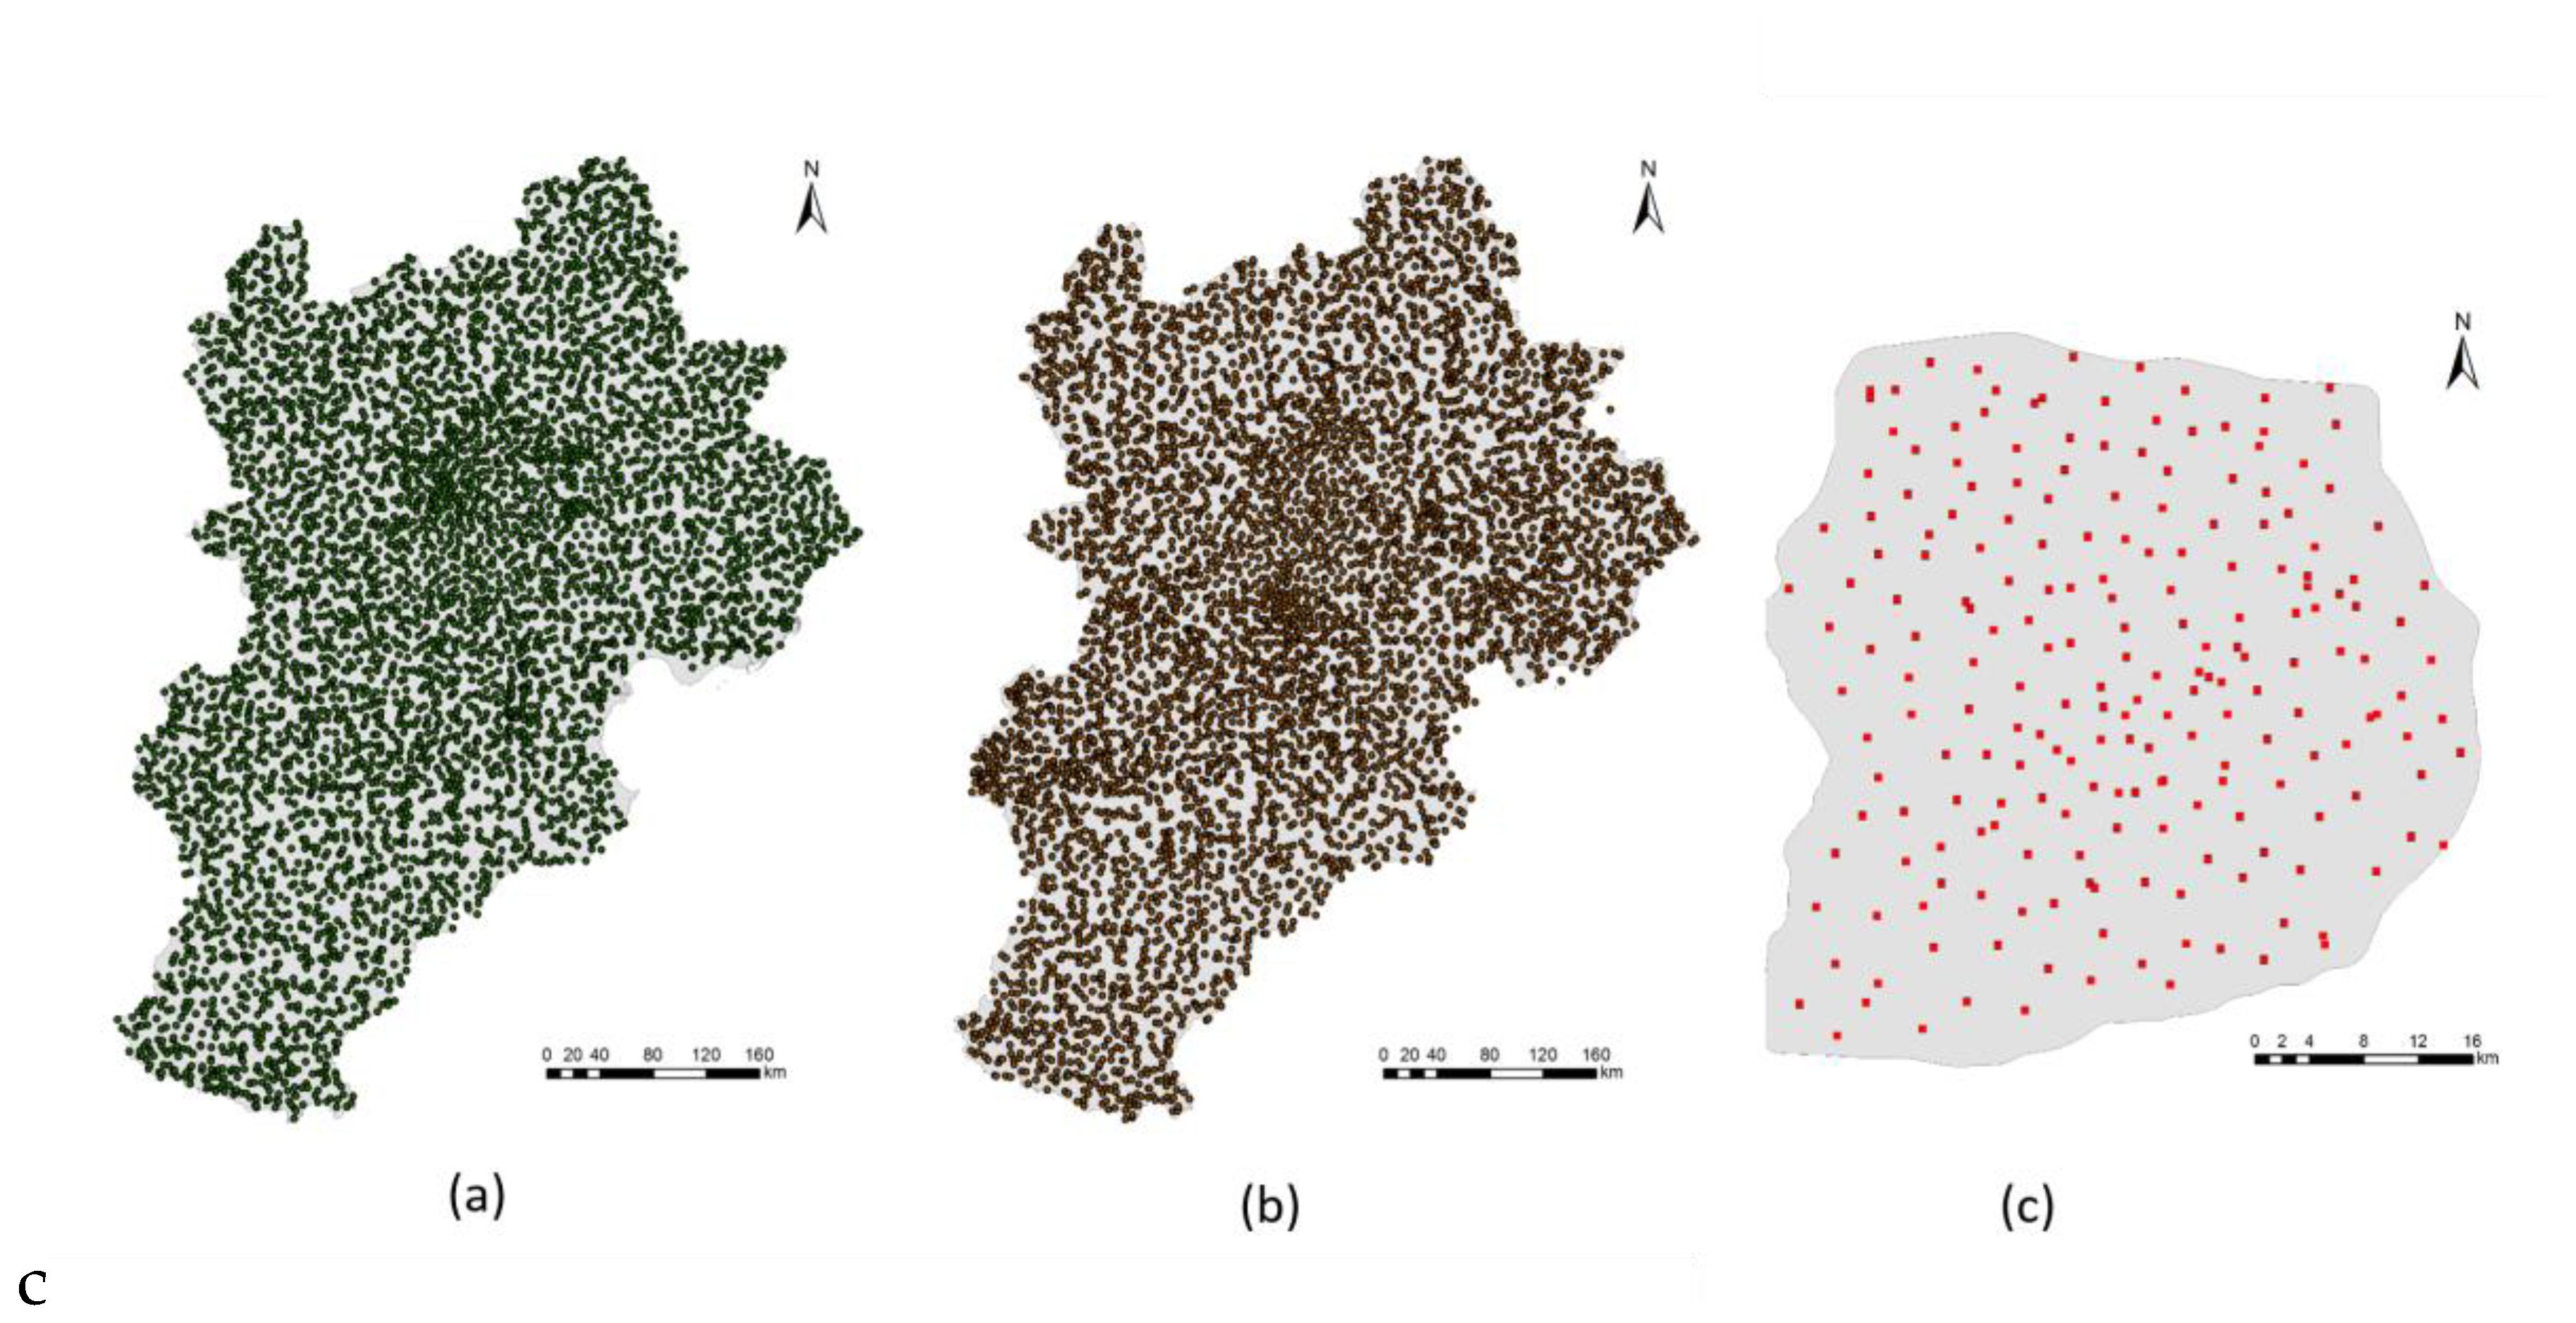
2.2.1. Dust Surfaces and Pollution Industries Monitoring

The rapid urbanization and industrialization result in popping up of industrial pollution sources and construction in the whole of China [9], especially in the region of BTH. Dust surfaces and pollution industries, which have often been recognized as the primary sources of fine particulate matter (e.g., PM2.5) [10,11,12,13], attract both attention from the government and public. In this monitoring program, dust surfaces are considered as the land cover types which can produce ground dust into the atmosphere driven by wind or other man-made effects, including open mining field, piling surface, construction surface, bare surfaces, rolling trample surfaces, and other dust surfaces. Pollution industries include steel smelting, thermal-power plants, cement, petrochemical factories, non-ferrous metals enterprises, coal mining, papermaking, and pharmaceutical manufacturing enterprises.
The address information of pollution industries is registered in the business entity database, but not spatialized. What we have done is located each address of pollution industries on the map based on the basic geographical information data, and represented as points. The dust surfaces are manually identified from high-resolution images in 2007 and 2013. The minimum mapping unit of dust surfaces is 1600 m2. Aerial photos are used as the data sources in Beijing and Tianjin; SPOT5 multi-spectral data and Resources III images are used for Hebei province. The results of 2013 are verified by on-site investigation with no less than 5% samples for both dust surface and pollution industries. The results of 2007 are verified by higher resolution images of the same period and existing geographic information data. At the end, the distribution maps of dust surfaces and pollution industries in BTH are produced for the year of 2007 and 2013 (polygons for dust surfaces, and points for pollution industries). The area ratio of dust surface and density of pollution industries are simply adopted as the indicators for describing the spatial distribution of the two types of pollution sources (see detail in Table 1).

2.2.2. Urban Sprawl Monitoring

Differing from the administrative region of the cities, urban area is specifically defined based on the functional composition of urban patterns in our designed GCM. In this program, the term urban is considered as the area which is located inside the administrative border, and formed from the city center to the rural-urban continuum through margin extension, axis extension, or multicenter extension. Urban sprawl can be defined under several perspectives [18,19]. Jaeger, et al. [20] define it as a (negative) status of the built-up area and its dispersion in the landscape. In our case, urban sprawl simply means the expansion process of the urban area. For the year of 1990 Landsat images are chosen as the basic data and high-resolution (<1 m) aerial photos are used for the years 2002 and 2013. Then, the urban area is delineated by visual interpretation with the help of additional supplementary materials, including basic geo-information data, such as existing land-use maps, urban planning maps, cadastral surveying and mapping data. The data preparation is time-consuming, since 153 cities in BTH will be individually processed, including municipalities, provincial capital, prefecture-level cities, and county-level cities. The resulted urban borders can be used to analyze the spatial pattern of the cities in BTH and the process of urban sprawl from 1990, 2002, to 2013. The morphologic characteristic of a cities’ border is the basis for analyzing many problems in city development, such as traffic planning, infrastructure construction, and so on [21]. The Index of Urban Fractal Dimension (UFD) is adopted for charactering the spatial form of urban area [22]. Furthermore, a coefficient indicator (Urban Expansion Coordination Coefficient, UECC) is employed for evaluating the degree of coordination between urban land expansion and population growth. Detailed definitions of indicators for quantitatively analyzing urban sprawl can be found in Table 1.

2.2.3. Vegetation Coverage Monitoring

Remote sensing is an effective tool for observing the abundance, distribution, and evolution of the biophysical characteristics of vegetation, which can be considered as an indicator of the land degradation [23,24]. Fraction vegetation cover (FVC), the ratio of vegetation occupying a unit area, as a significant parameter for describing energy and mass fluxes at the Earth’s surface, enables assessment and monitoring of changes in canopy biophysical properties [25]. For vegetation monitoring, 30-m resolution Landsat images for the years 2002, 2006, 2010, and 2013 are adopted as the main data sources in the BTH region. In order to avoid phenological shift, all images are collected during July to October. Within the extent of sixth ring of Beijing 10-m resolution SPOT images acquired during August to September are used. Necessary pre-processing operations have been applied to the images. For example, SPOT images are geometrically corrected by using ground-control points and topographic maps under the scale 1:50,000, and all images have been projected using the same coordination system (CGCS2000). Atmospheric correction is applied to Landsat images based on the FLAASH model in ENvironment for Visualizing Images (ENVI, Boulder, Colorado, USA). Then, they are mosaicked and clipped by the outline of the BTH region to form the full image of the study area. The estimation of FVC is based on the Dimidiate Pixel Model by using the long term series images [26,27]. The parameters used in this model are reconciled by on-site investigation, typically by the samples of rural settlements, corn and wheat field, orchards, saline soil, and vegetable farmland. A number of 5950 vegetation samples are chosen form the sites with 100% vegetation coverage and 6183 bare soil samples are chosen for the BTH region (see Figure 2a,b). Within the sixth ring of Beijing, a total number of 413 samples are collected in size of 6 m × 6 m (Figure 2c). Some of the samples are later used for the precision validation. For historical validation higher resolution images of the same period and existing basic geographic information data are adopted for sampling and verification. To further evaluate the change pattern of FVC in BTH, the slope of FVC values for the time series images are used to characterize the change trend of vegetation coverage. For detailed definitions of indicators used for vegetation monitoring, see Table 1.

2.2.4. Ground Subsidence Monitoring

Ground subsidence is a gradual settling or sudden sinking of the Earth's surface owing to subsurface movement of earth materials. The common causes are aquifer-system compaction, drainage of organic soils, and underground mining [28,29,30]. Areas affected by rapid differential subsidence suffer from damage to infrastructures. Indirect consequences also include a decrease in water resources, an increase in flood risk, and water contamination, all which endanger human lives and result in heavy financial burdens for local government administrations [31].
For measuring ground subsidence, the relatively high-resolution Synthetic Aperture Radar (SAR) data are adopted and processed by self-designed software “Ground DEformation Mapping System with InSAR (GDEMSI)”. Fusion of SAR/InSAR images has been proved to be effective in monitoring of ground deformation [32,33]. ERS-1/2 SAR and ENVISAT ASAR images of 20 m resolution are used to monitor the ground subsidence in key area of BTH region from the period 1992–2010, including the plain areas of Beijing, Tianjin, Baoding, Langfang, and Tangshan, ca. 50,000 km2. RadarSAT-2 SAR Images of 30 m resolution are used to monitor the major area in BTH, including plain areas of Beijing and Hebei province, and the city Tianjin, covering the period from 2011 to 2014. High-resolution TerraSAR-X, COSMO-SkyMed SAR Images with 3 m resolution are especially used for the subsidence monitoring in four main cities (i.e., Beijing, Tianjin, Tangshan, Langfang) from 2011 to 2014. The monitoring accuracy of land subsidence rate (Table 1) is verified by the geodetic leveling data from local mapping bureau. The accuracy for BTH region is better than 5–10 mm/year; and the accuracy for four main cities is better than 3–5 mm/year.

3. Results of Thematic Monitoring

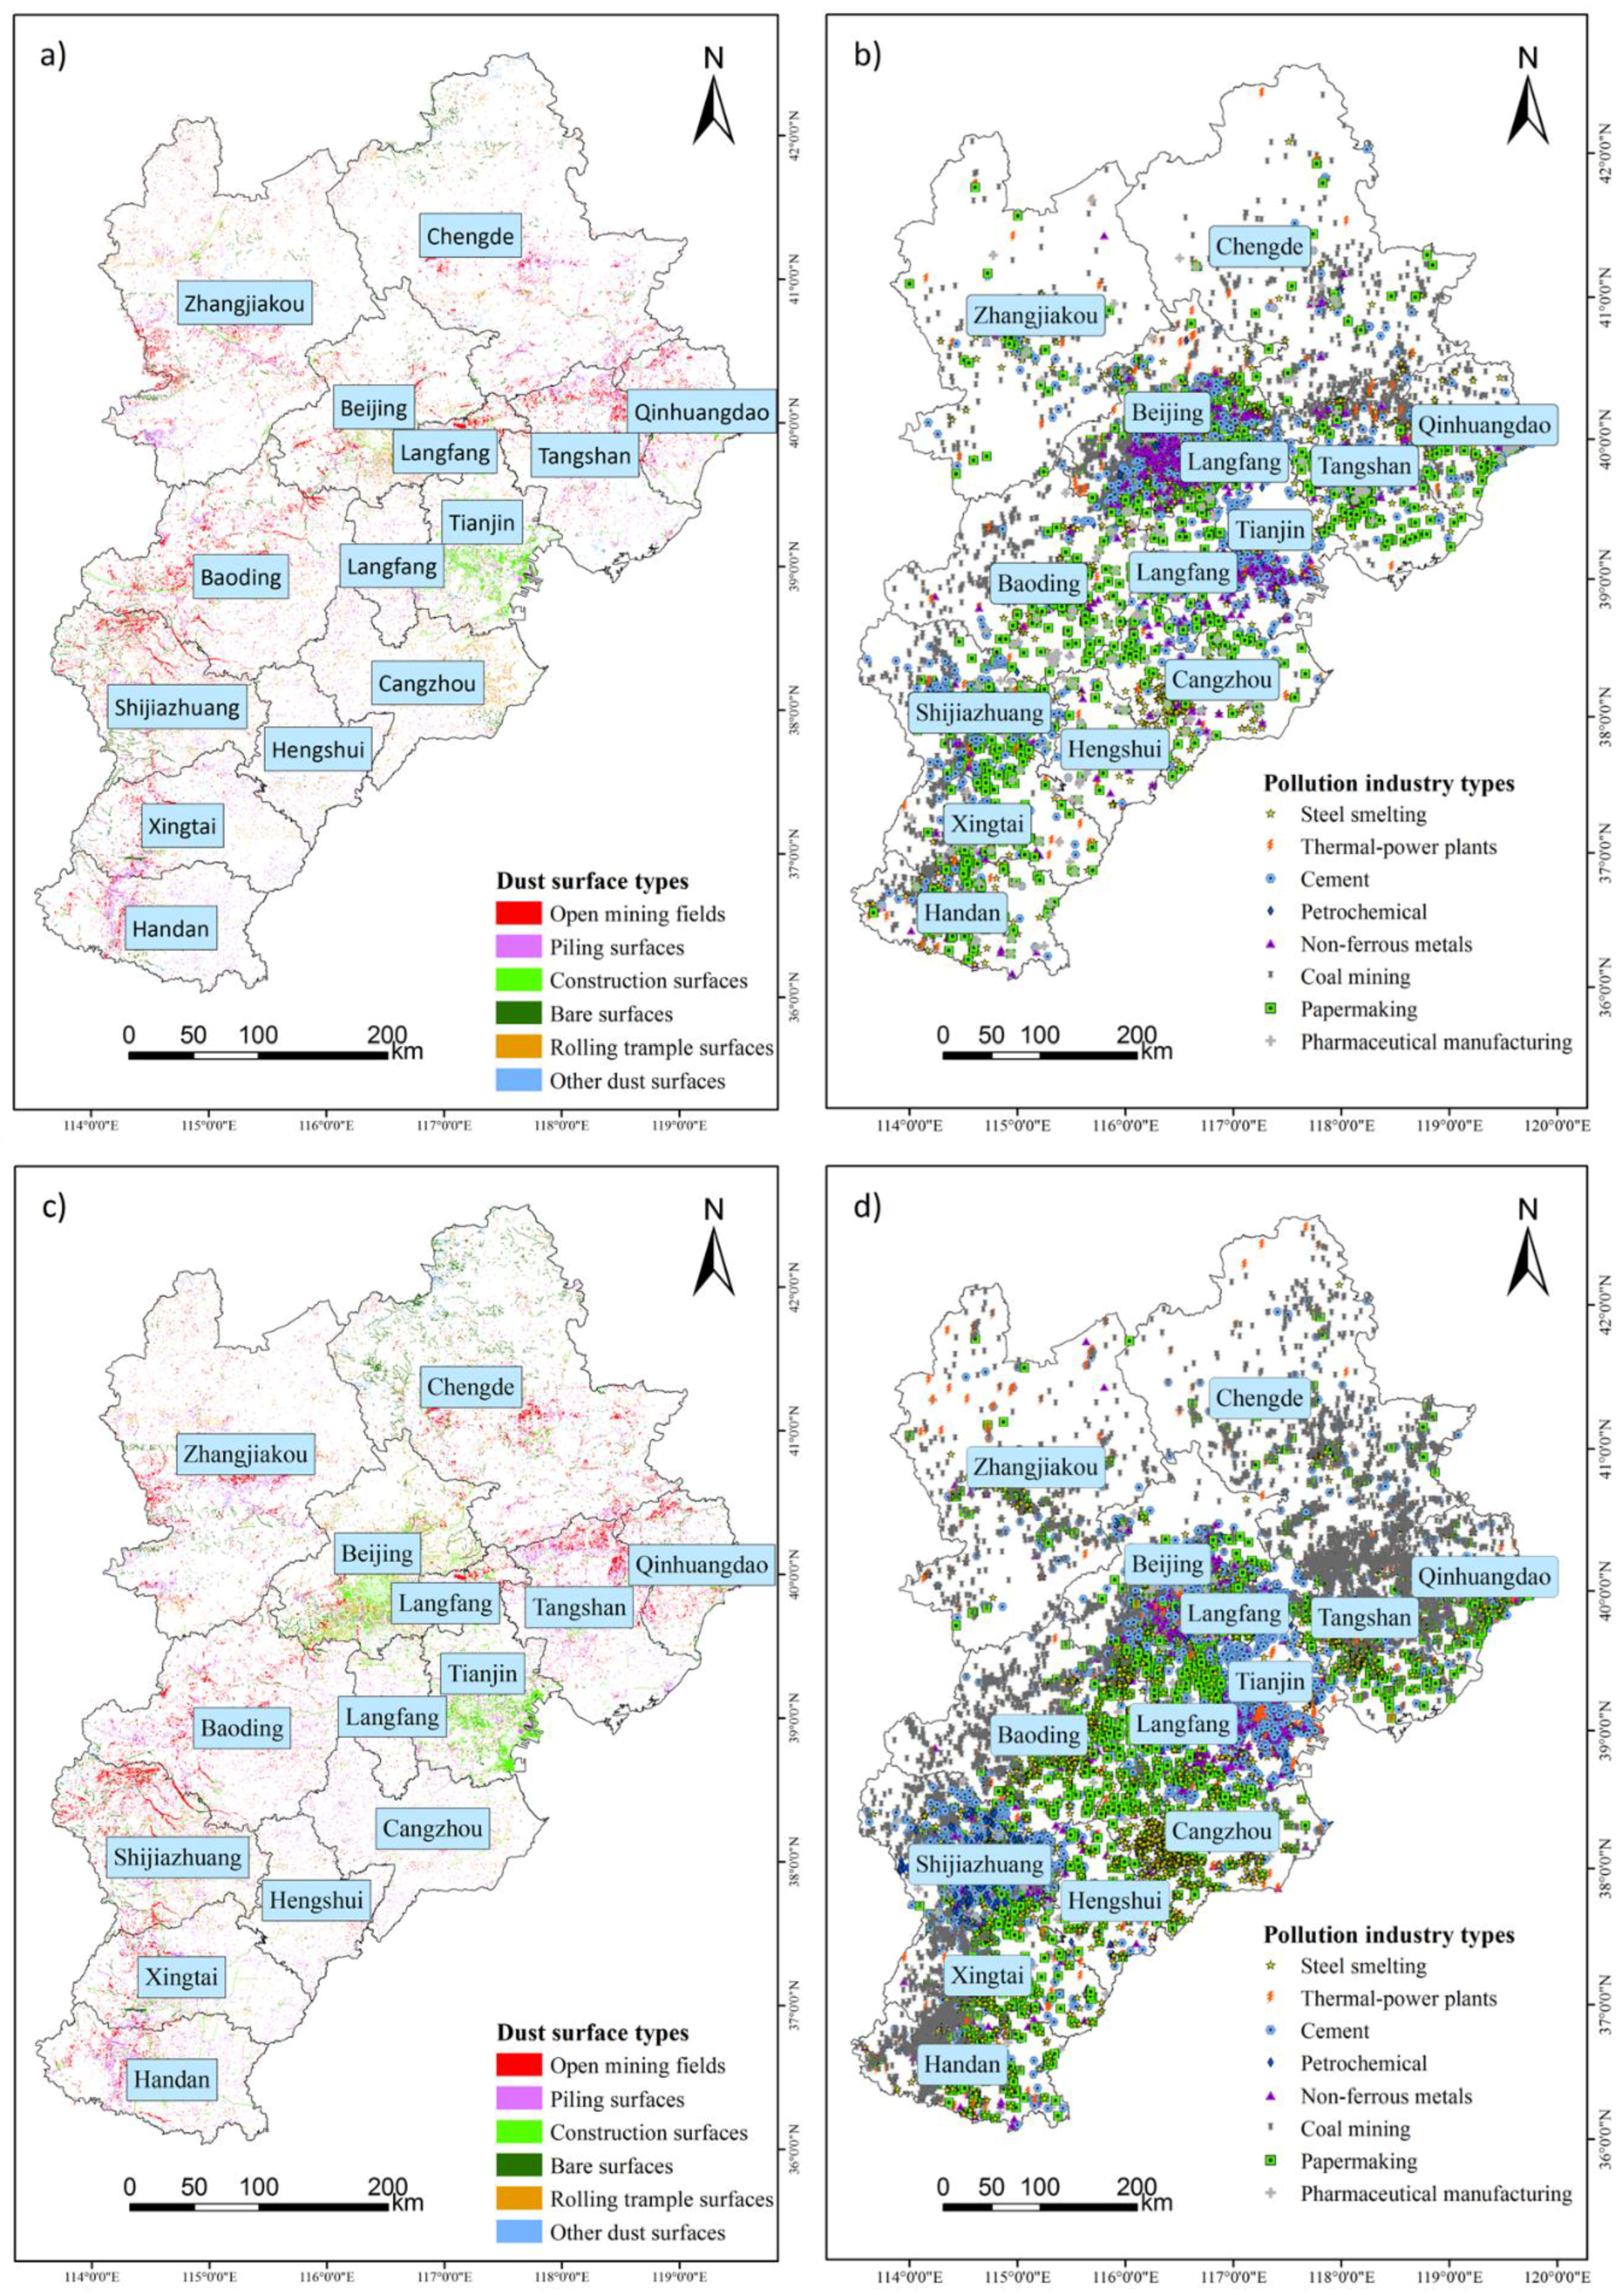
3.1. Distribution of Dust Surfaces and Pollution Industries in BTH Region

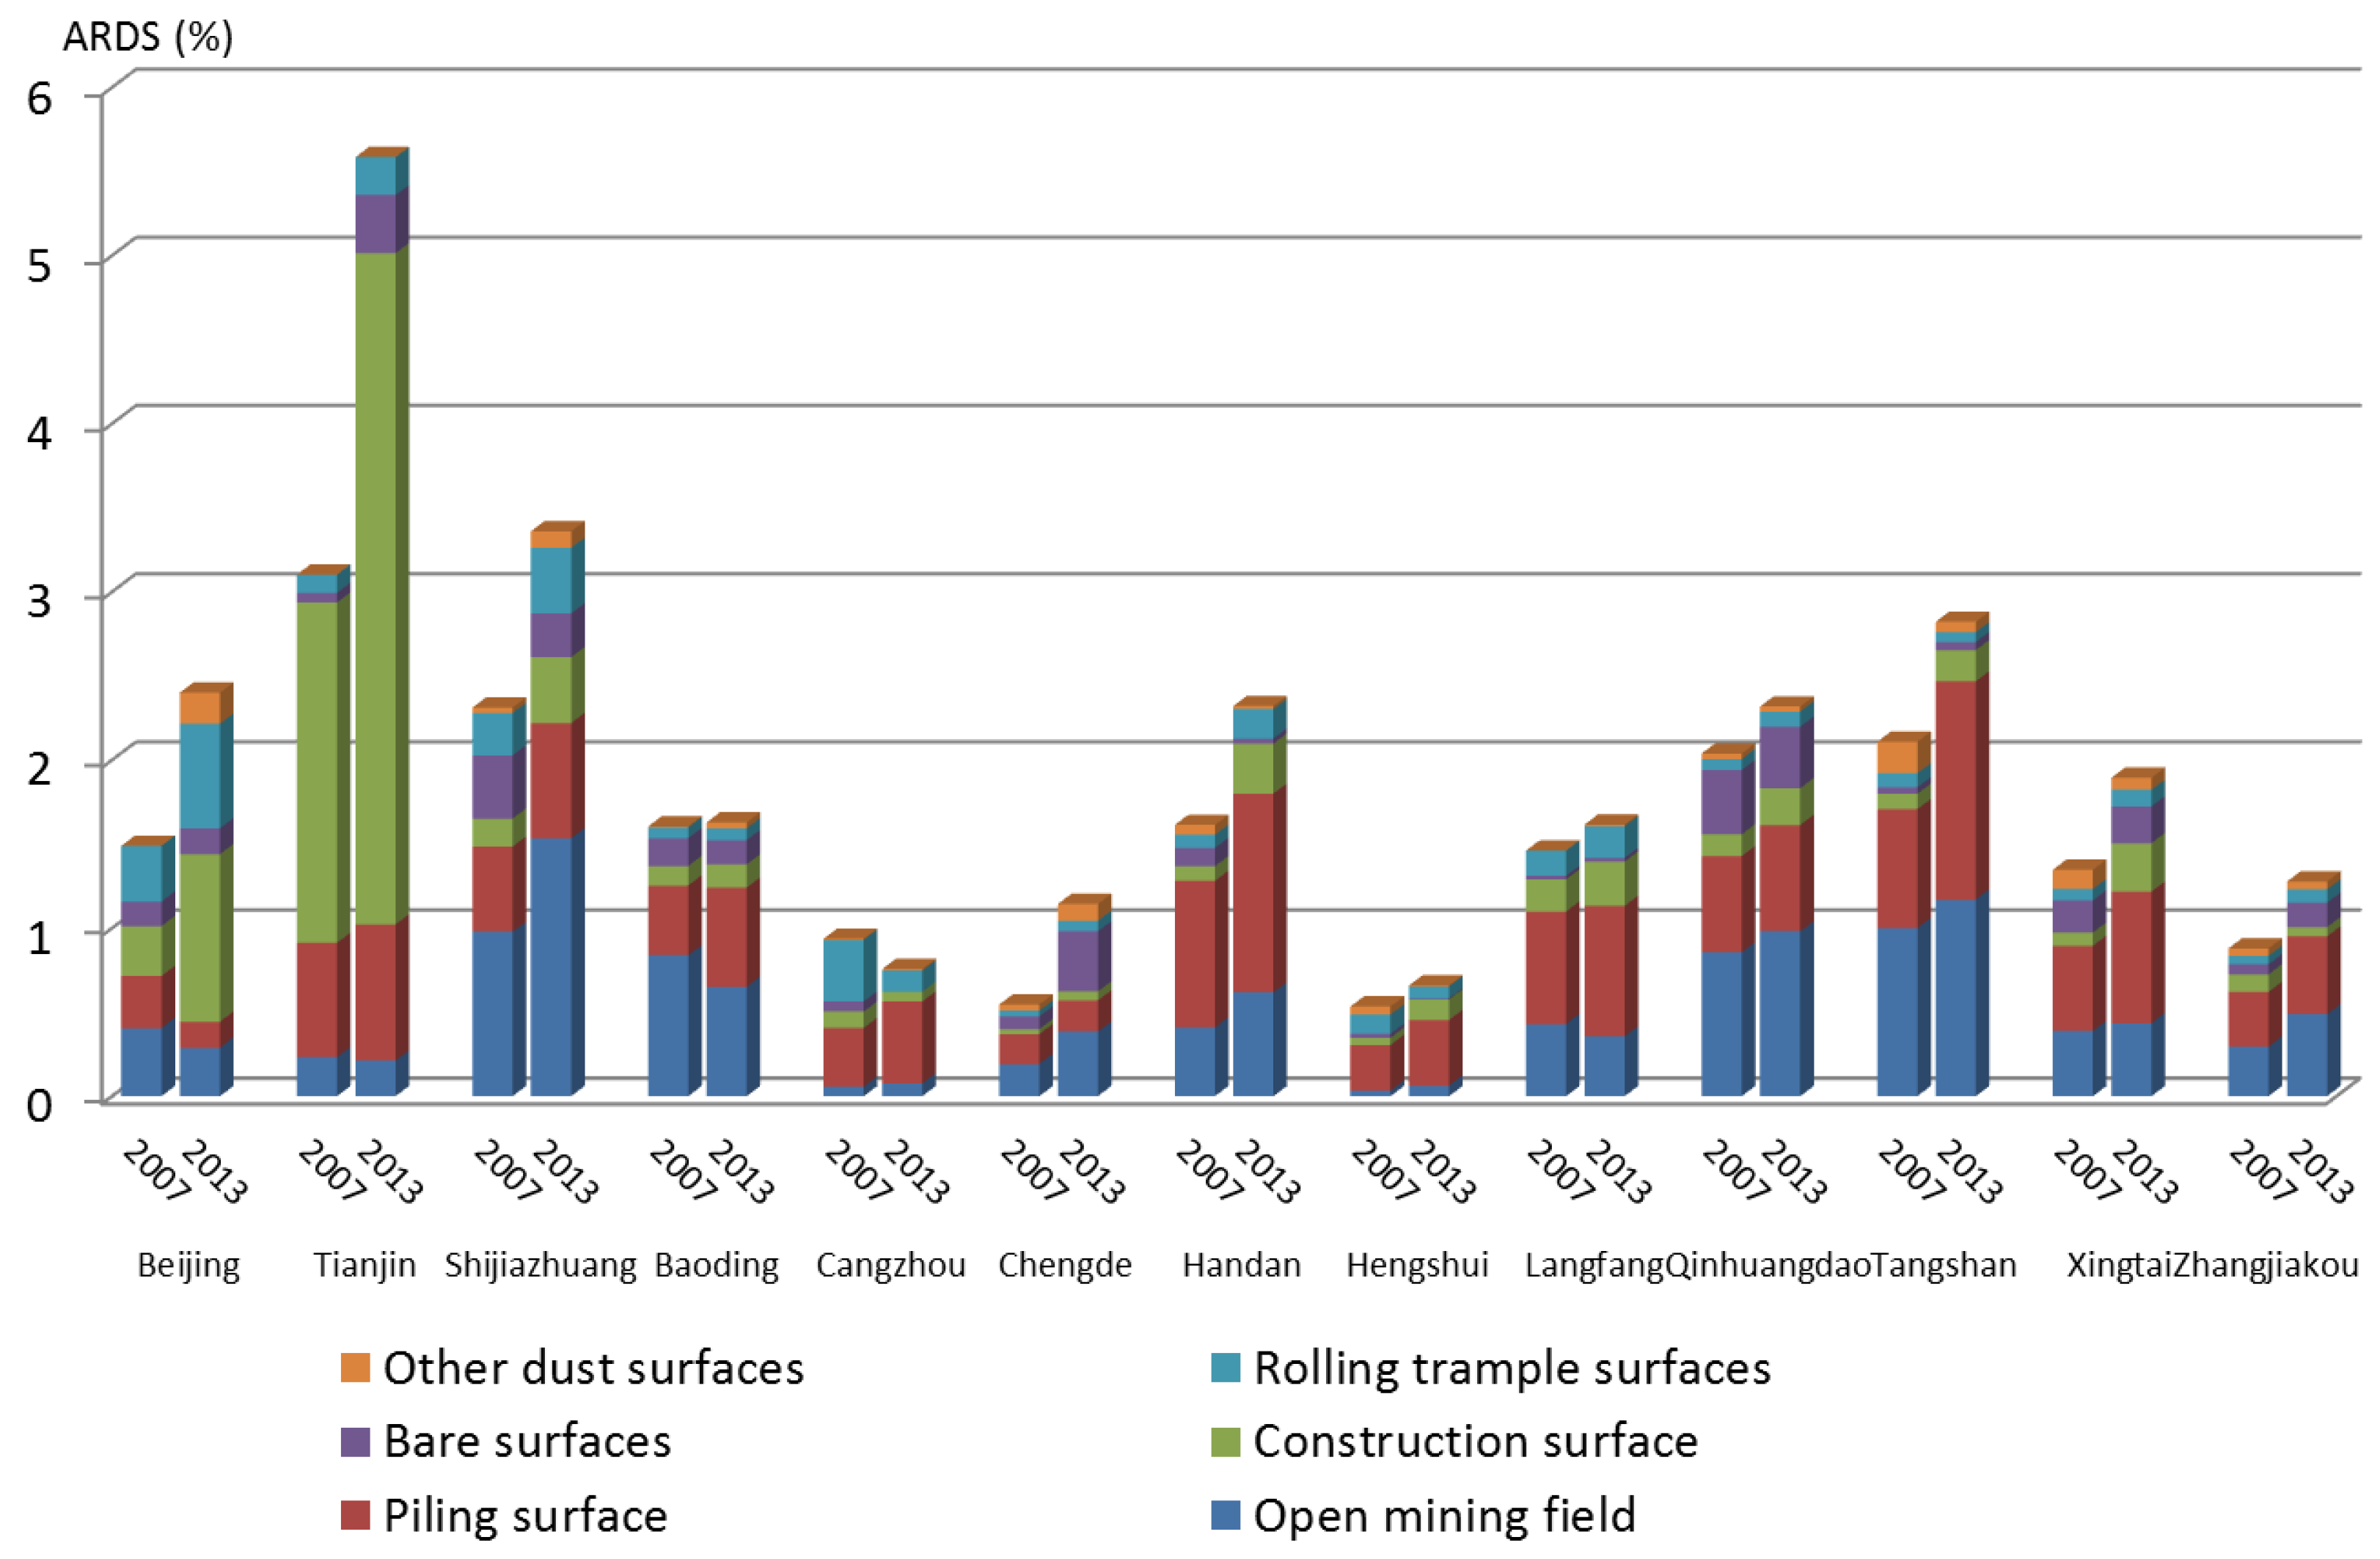
3.1.1. Change Pattern of Dust Surfaces from 2007 to 2013

Figure 3a,c shows the spatial distribution of dust surfaces in BTH region in 2007 and 2013, respectively. A significant increase of the dust surface area during this period can be observed from Figure 3, especially in Beijing and Tianjin. Interestingly, the dust surfaces are mostly located along the foot of the Taihang Mountains. The increasing trend of dust surfaces can be further confirmed by our statistics. In 2007 the total area of dust surfaces is 2929.65 km2, and this value reaches 4182.47 km2 in 2013. All types of dust surfaces have expanded during the observed period. The open mining fields, piling surfaces, and construction surfaces expand dramatically, and account for 78.84% of the total amount of expansion. Specifically, the area of construction surfaces has doubled, while the open mining fields and piling surfaces have increased about 30% from 2007 to 2013.
At the administrative level, Cangzhou is the only city where dust surfaces shrink from 2007 to 2013 among the 13 cities in BTH region. The largest increase of dust surface occurs in Tianjin, mainly due to the fast expansion of construction areas. The construction areas account for 79.28% among the total expanded area (296.6 km2) in Tianjin. Consequently, the expanded area of dust surfaces of Chengde (236.01 km2), Beijing (149.43 km2), Shijiazhuang (147.65 km2), Zhangjiakou (146.37 km2), and Tangshan (100.79 km2) rank second to sixth. The other seven cities face relatively lower increases of dust surfaces, with an area expansion less than 100 km2 for each city. Taking the area differences of the cities into account, the Area Ratio of Dust Surface (ARDS) for each city is calculated. As shown in Figure 4, Tianjin, Beijing, and Shijiazhuang are the most significant cities in terms of the increase rate of ARDS, and the city Tianjin shows the highest value of ARDS in 2007 and 2013.

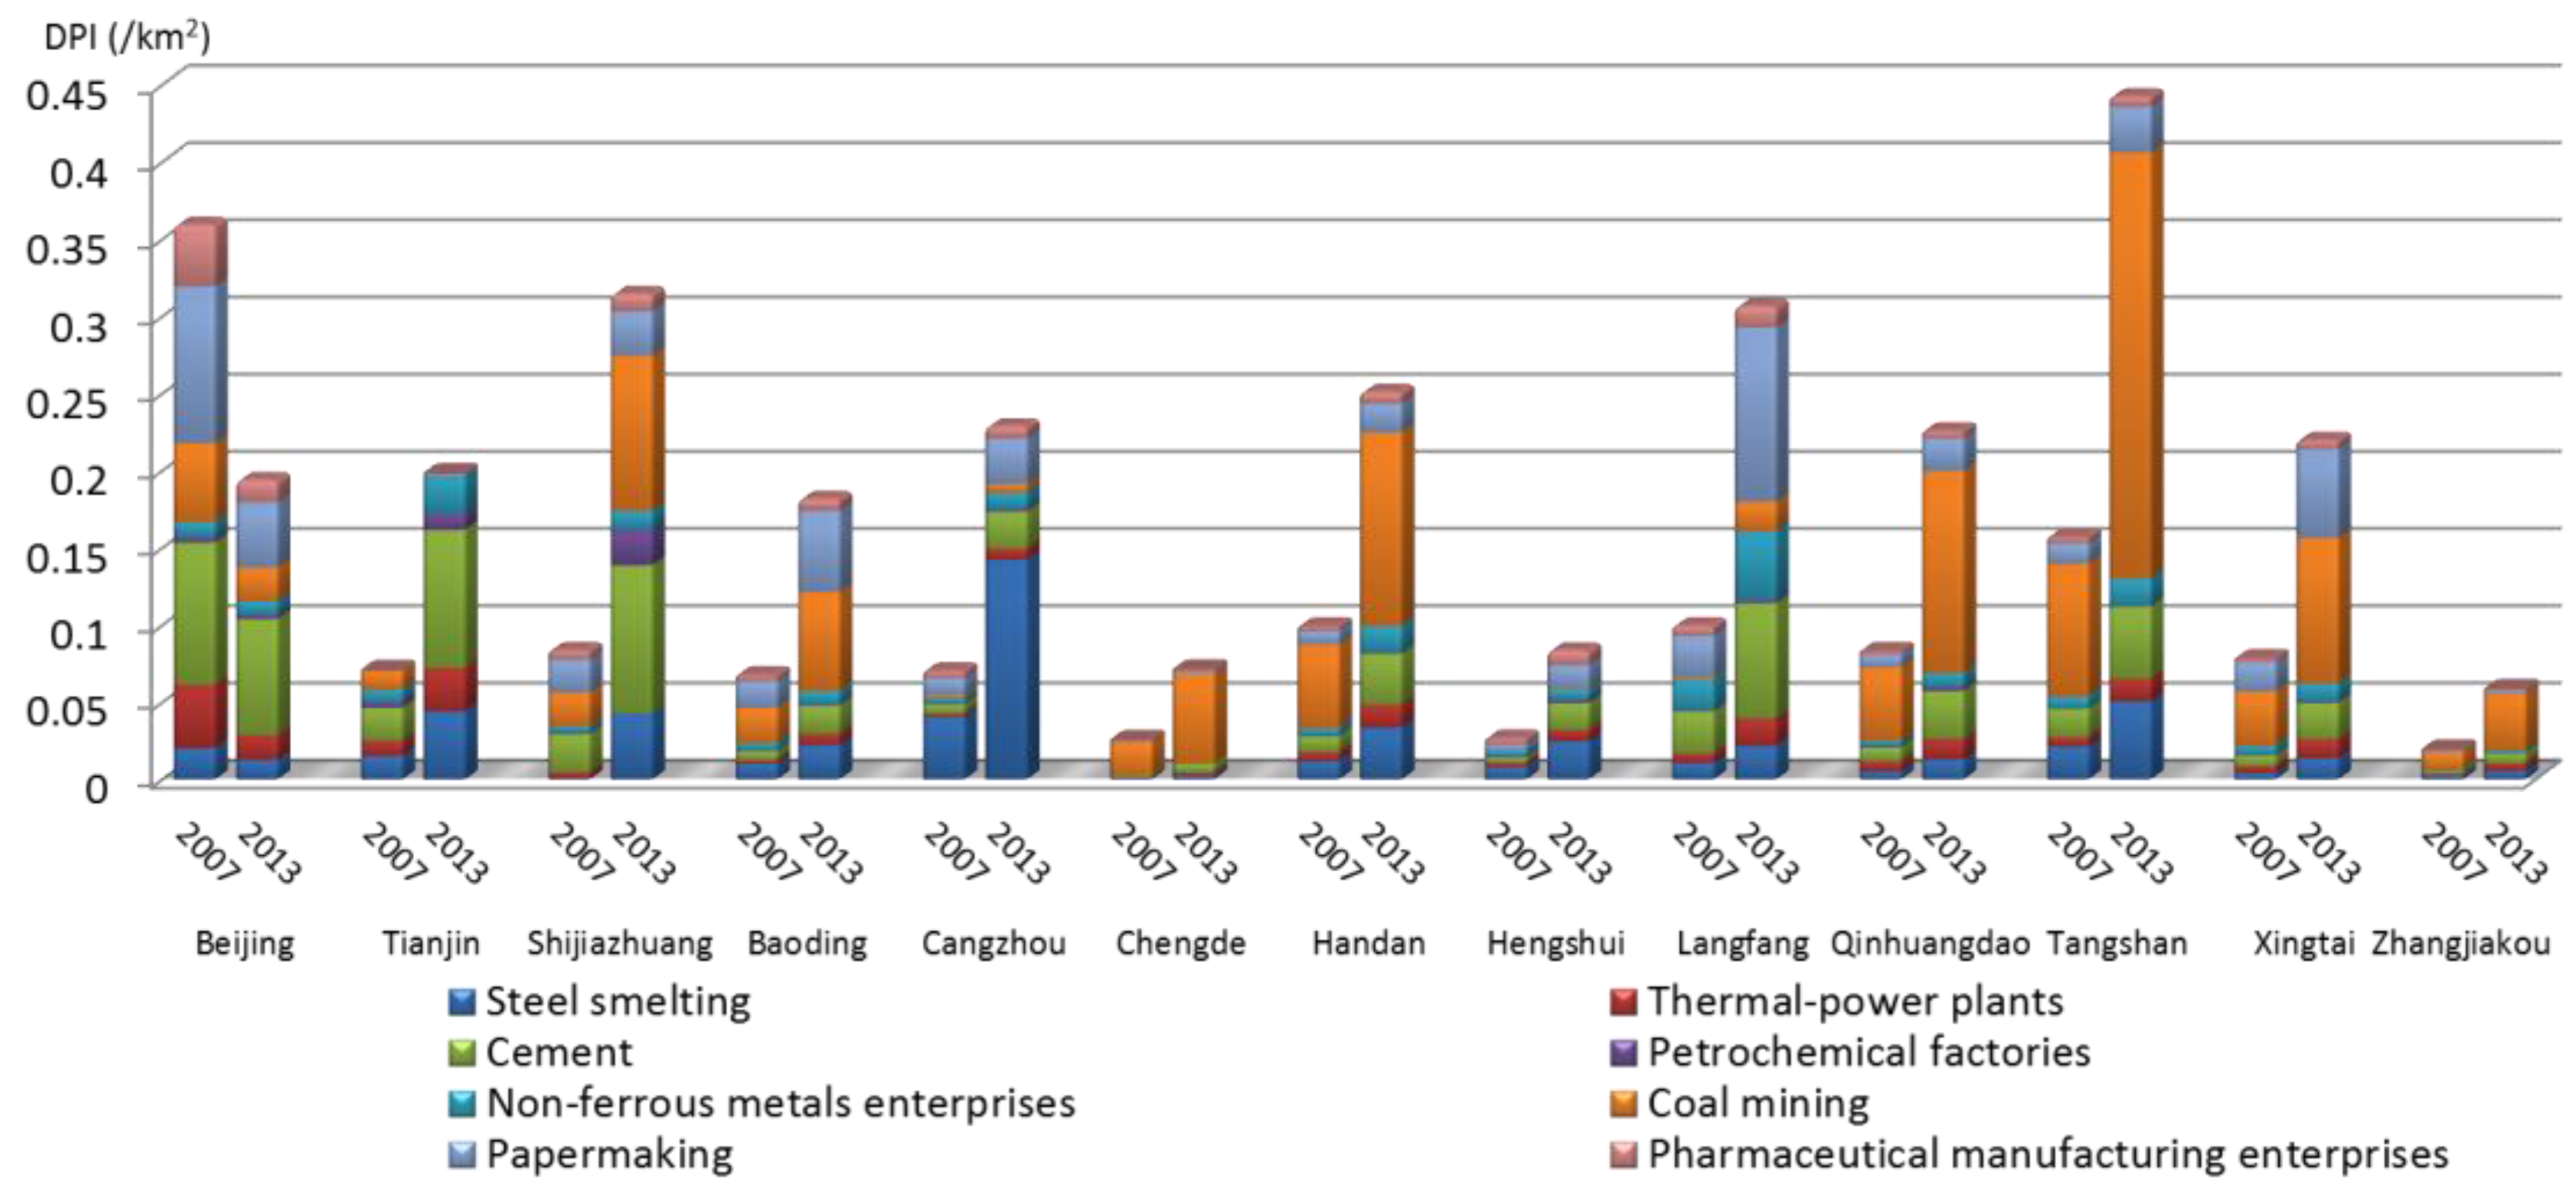
3.1.2. Change Pattern of Pollution Industries from 2007 to 2013 in the BTH Region

In 2007 there were 18,039 pollution industries distributed in the BTH area. The amount of coal mining, papermaking, and cement enterprises are, respectively, 5776, 3359, and 3184, which account for 68.29% of the total. In 2013 the amount of pollution industries is 38,735, which has increased 115% compared to 2007 (see also Figure 3b,d). The coal mining and cement enterprises together accounted for most (ca. 55.93%) of the total pollution industries. From 2007 to 2013, the fastest increasing type of enterprises are coal and mining, cement, and steel smelting. The increased amount of the three types of enterprises comprise 80% of the total rise. The most significant change happens to coal and mining enterprise, which has increased from 5776 to 14,658. It comprises 42.65% of the total increased enterprises, and the cement and steel smelting enterprises account for about 18.70% and 18.15%, respectively. In contrast, papermaking and non-ferrous metals enterprises show a moderately increasing rate. Thermal power plants, petrochemical factories, and pharmaceutical manufacturing enterprises have increased relatively less than the others and the increased numbers are 627, 468, and 63, respectively.
Figure 5 shows the statistical results of density of pollution industries at the administrative level in BTH area. In 2007 Beijing has the most pollution industries with a number of 5896, which takes 32.68% of the total. In 2013 Tangshan replacing Beijing shows the most pollution industries with a number of 6246, which takes 16.07% of the total. From 2007 to 2013, Beijing is the only city showing a decreasing number of pollution industries, especially the papermaking factories and thermal power plants, which reduce by a number of 975 and 410, respectively. During this period, 2713 industries have been moved out from Beijing. The number of coal mining enterprises in Tianjin has also declined to only four, which means 142 coal mining enterprises have been removed in seven years. However, the other types of pollution industries in Tianjin have increased, typically the cement enterprises. Among the other cities, Tangshan exhibits the most significant increase of the pollution industries. In seven years 4031 more pollution industries were founded in Tangshan, of which coal and mining industries account for 66.51%. Shijiazhuang takes second place with an increasing number of 3253 industries. In 2013 the amount of pollution industries of Shijiazhuang is almost three times that of 2007.

3.2. Urban Sprawl Monitoring

3.2.1. Urban Area Expansion from 1990 to 2013 in the BTH Region

In 1990, 2002, and 2013, the total urban area in the BTH region was 1650.55 km2, 2483.78 km2, 3747.47 km2 which, respectively, account for 0.76%, 1.15%, and 1.73% of the total territory (Figure 6). From the first monitoring stage (1990–2002), the urban areas of Beijing and Baoding have increased more than the others, but the variation of urban expansion is not significant. From the second stage (2002–2013), with the rapid growth of population and economy in Beijing and Tianjin their urban expansion speed (UES) reach 35.18 km2/year and 37.67 km2/year, which are much higher than the others. The direction of the city development can also be identified in this monitoring. For example, development in Beijing are concentrated in the direction of north, northwest, and southwest, and the expansion area of the city in three directions accounted for about 54% of the total. The main direction of city development of Tianjin is southeast (as shown in Figure 6). Absorbing nearby rural area and farmland is the main form of urban expansion in the BTH region. From 1990 to 2013, 1138.19 km2 of farmland and 814.62 km2 of rural settlements are taken up by urban expansion, which together account for about 93% of the total expanded urban area.

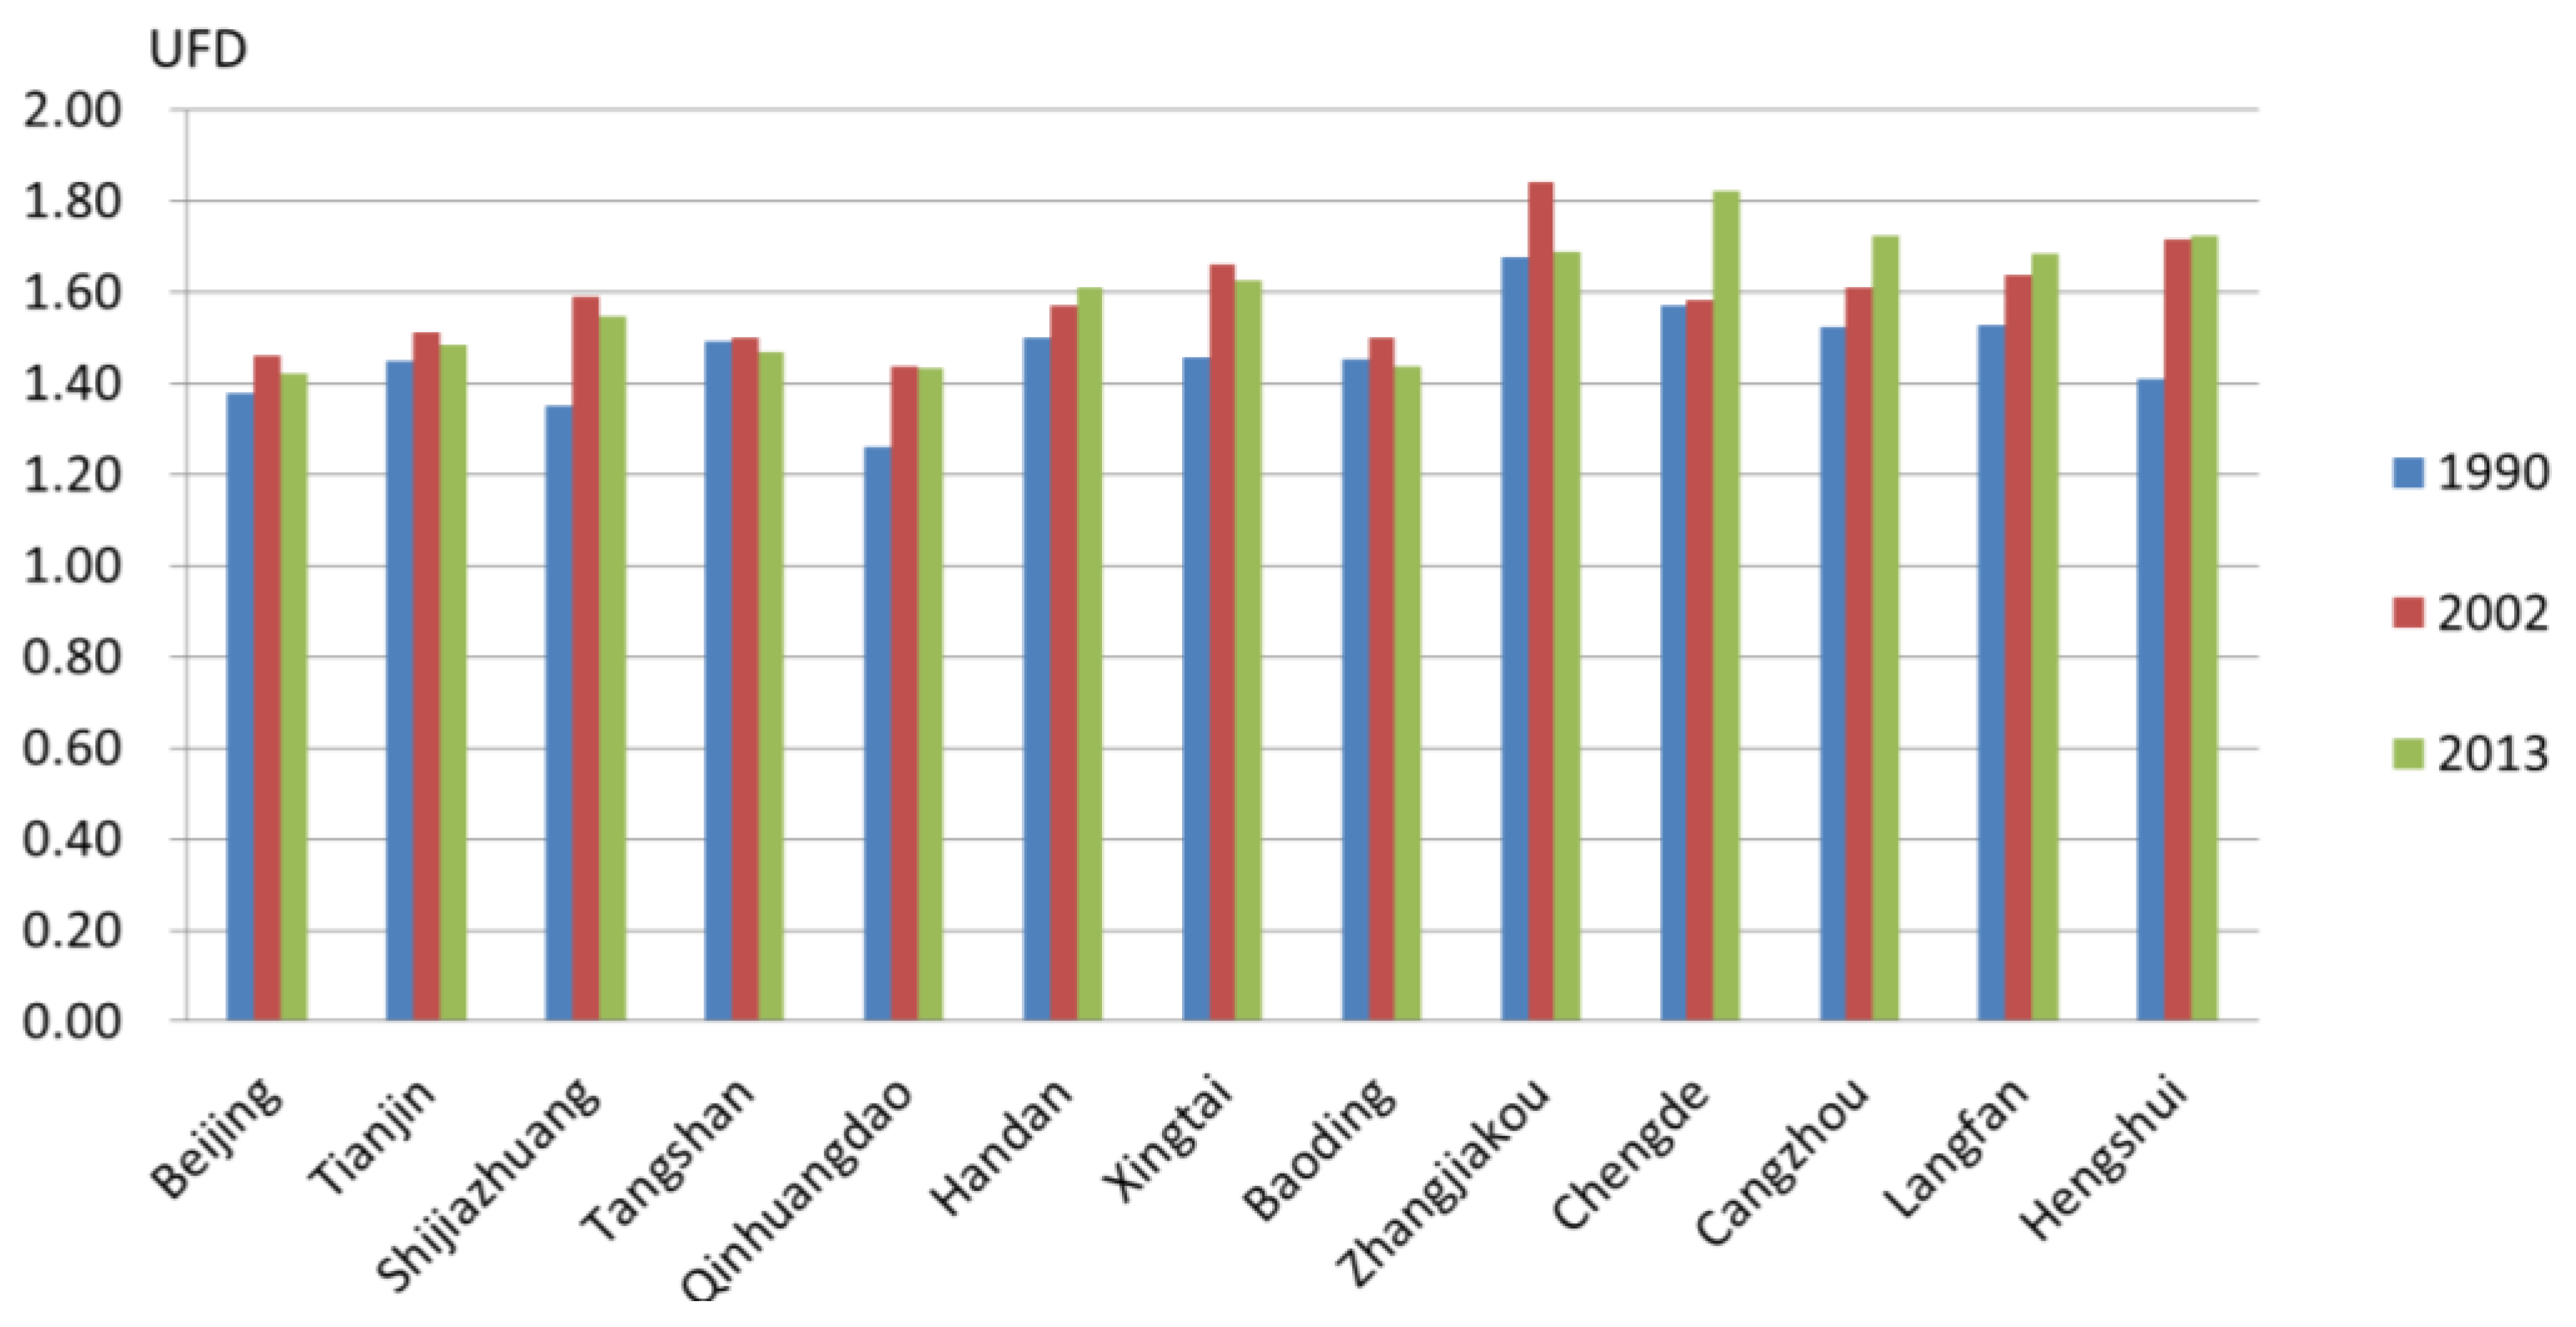
3.2.2. Characteristics of Urban Development from 1990 to 2013 in the BTH Region

From 1990 to 2013 the average value of Urban Fractal Dimension (UFD) in the BTH region has increased from 1.47 to 1.59, which means the cities’ borders are becoming broken and more irregular. Among the 13 cities in the BTH region, only Tangshan show decreasing values of UFD during this period. However, the highest values of UFD mostly happen to the year of 2002 (Figure 7). Therefore, most cities’ borders are actually becoming relatively compact during the period from 2002 to 2013.
On the other hand, the urban expansion and population growth in BTH region is uncoordinated (Table 2). From 1990 to 2002, the Urban Sprawl Expansion Coefficient (UECC) index of several cities, such as Langfang (3.36), Tangshan (2.07), Handan (2.07), etc., are higher than the optimal value 1.12. The speed of urban expansion is faster than their population growth. However, Beijing (0.93), Tianjin (0.96), and other cities’ UECC values are lower than 1.12, which means a rapid influx of population during this period. This may increase traffic pressure and reduce the living conditions. From 2002 to 2013, the UECC values of Tianjin (8.66), Langfang (3.28) and Beijing (2.55) are much higher than the optimal value of 1.12. This indicates the rapid urbanizing processes in these cities lead somewhat to a “waste” of urban land use.

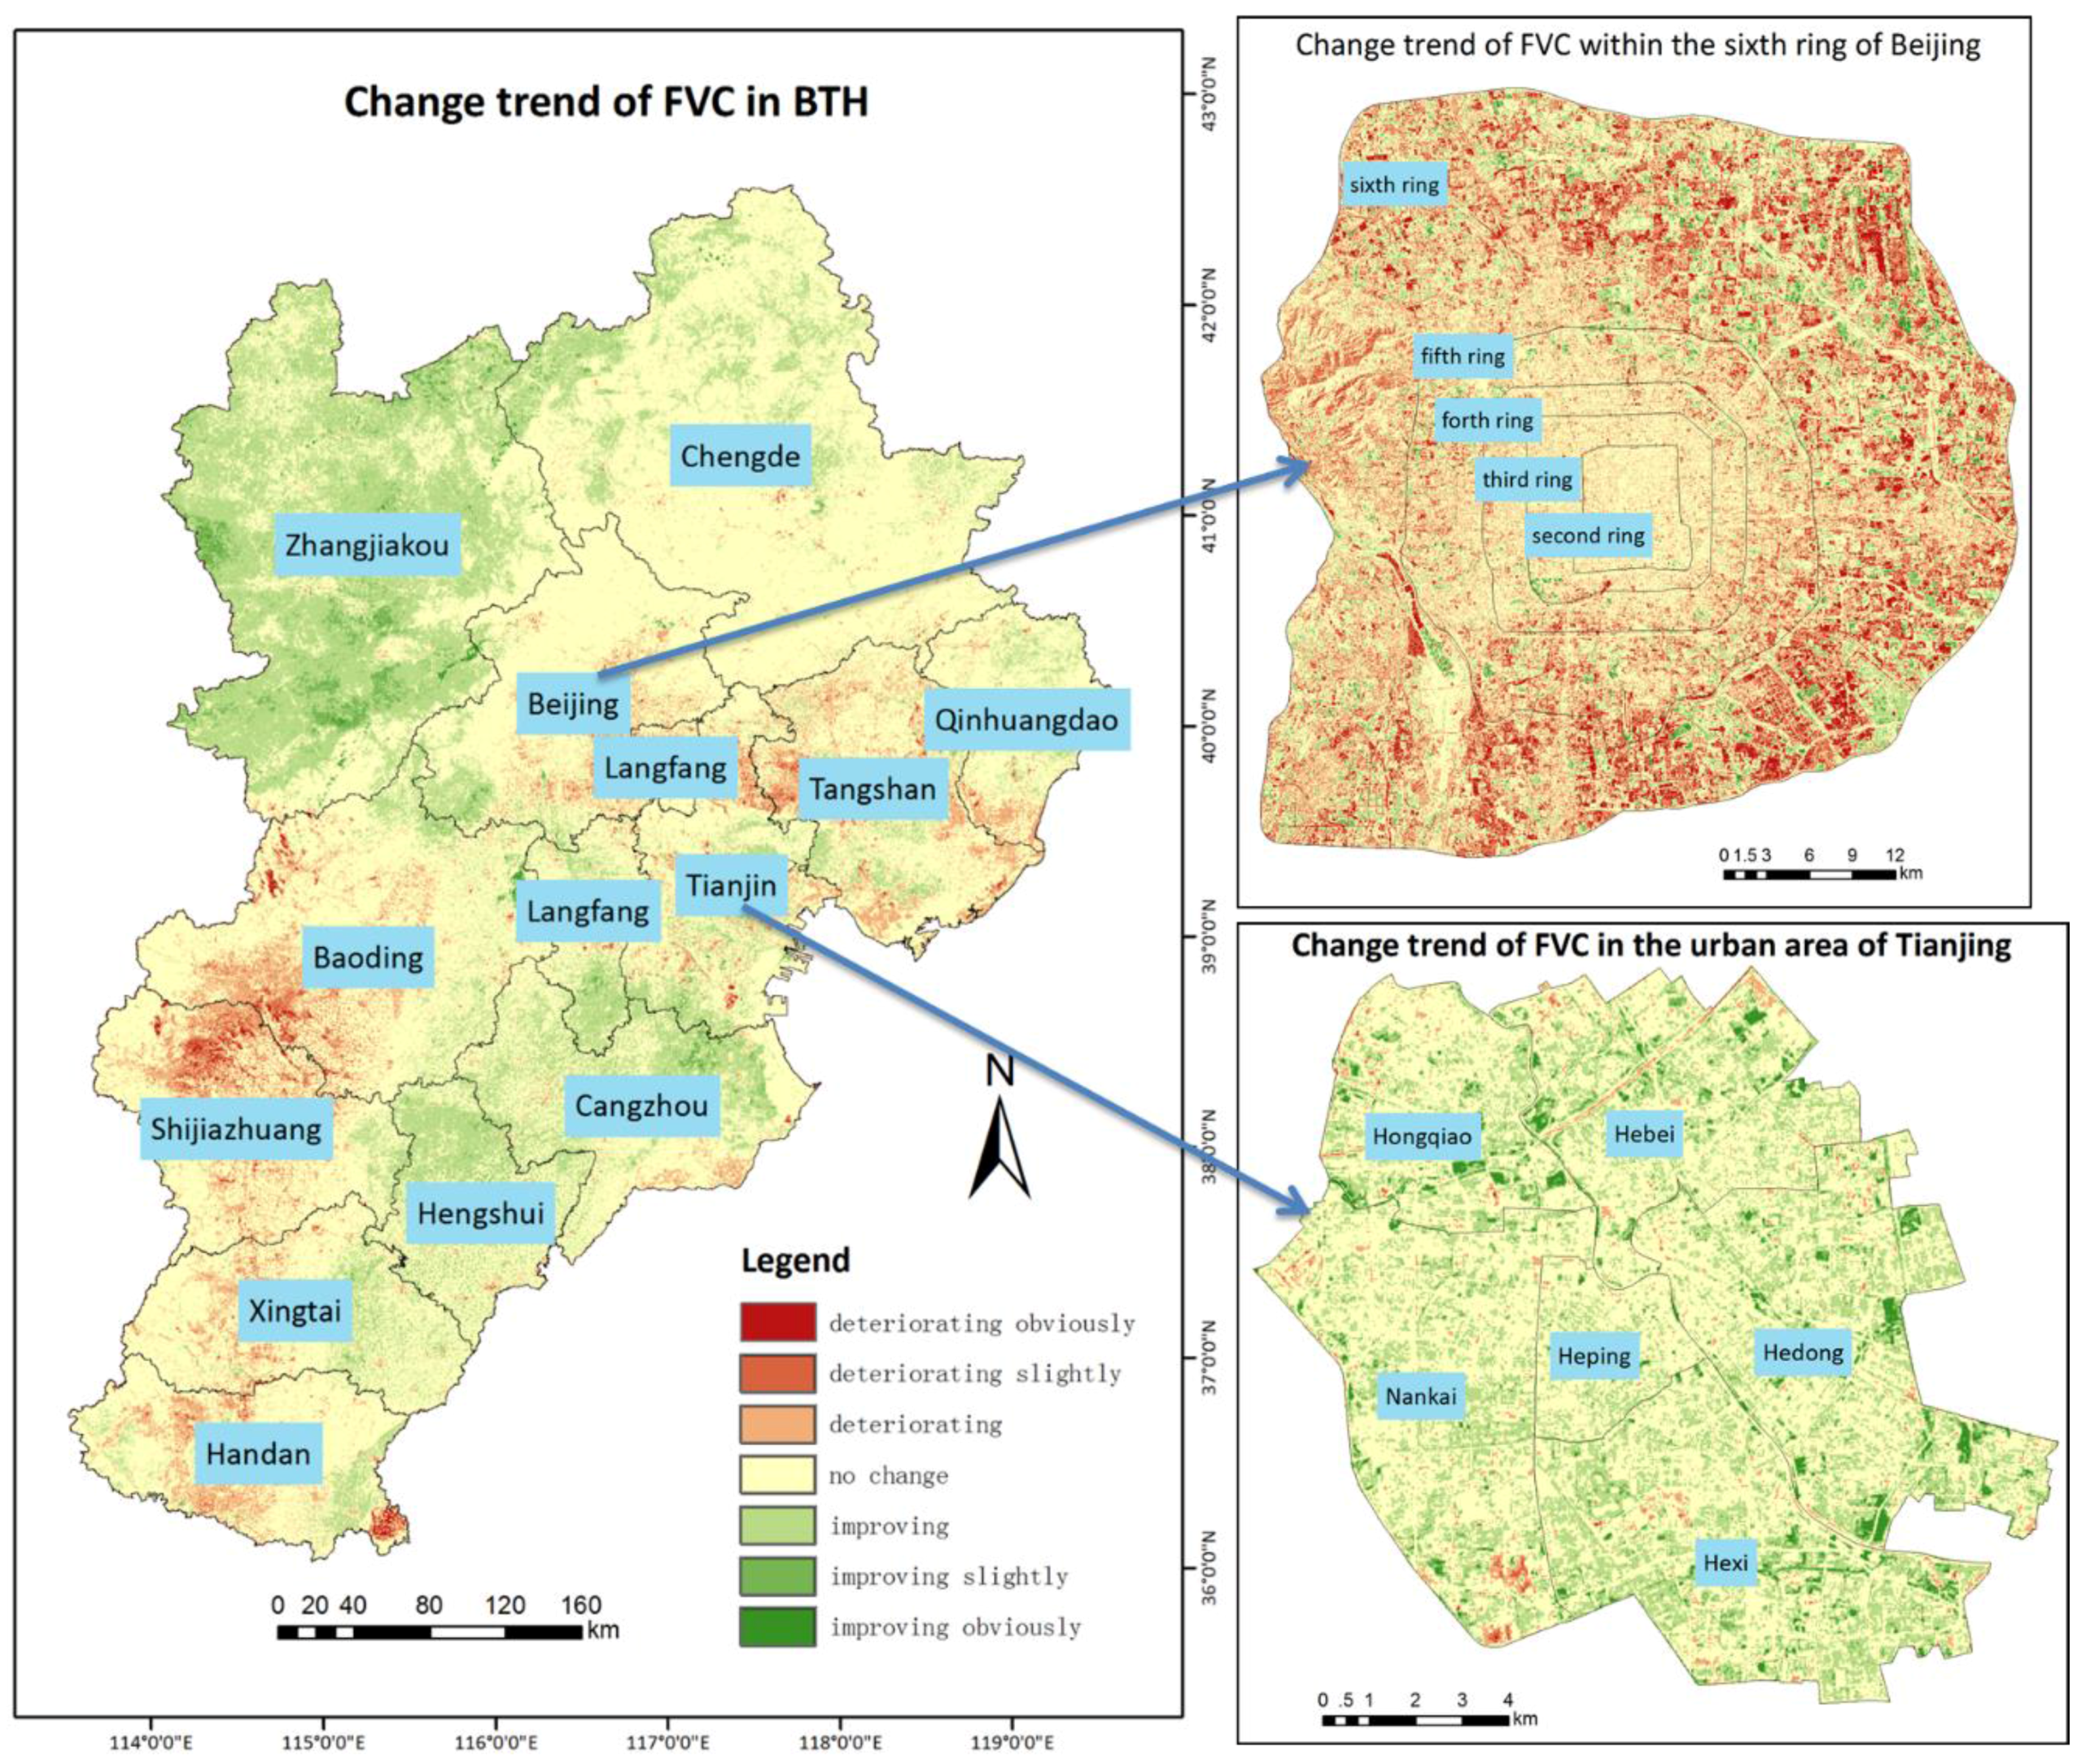
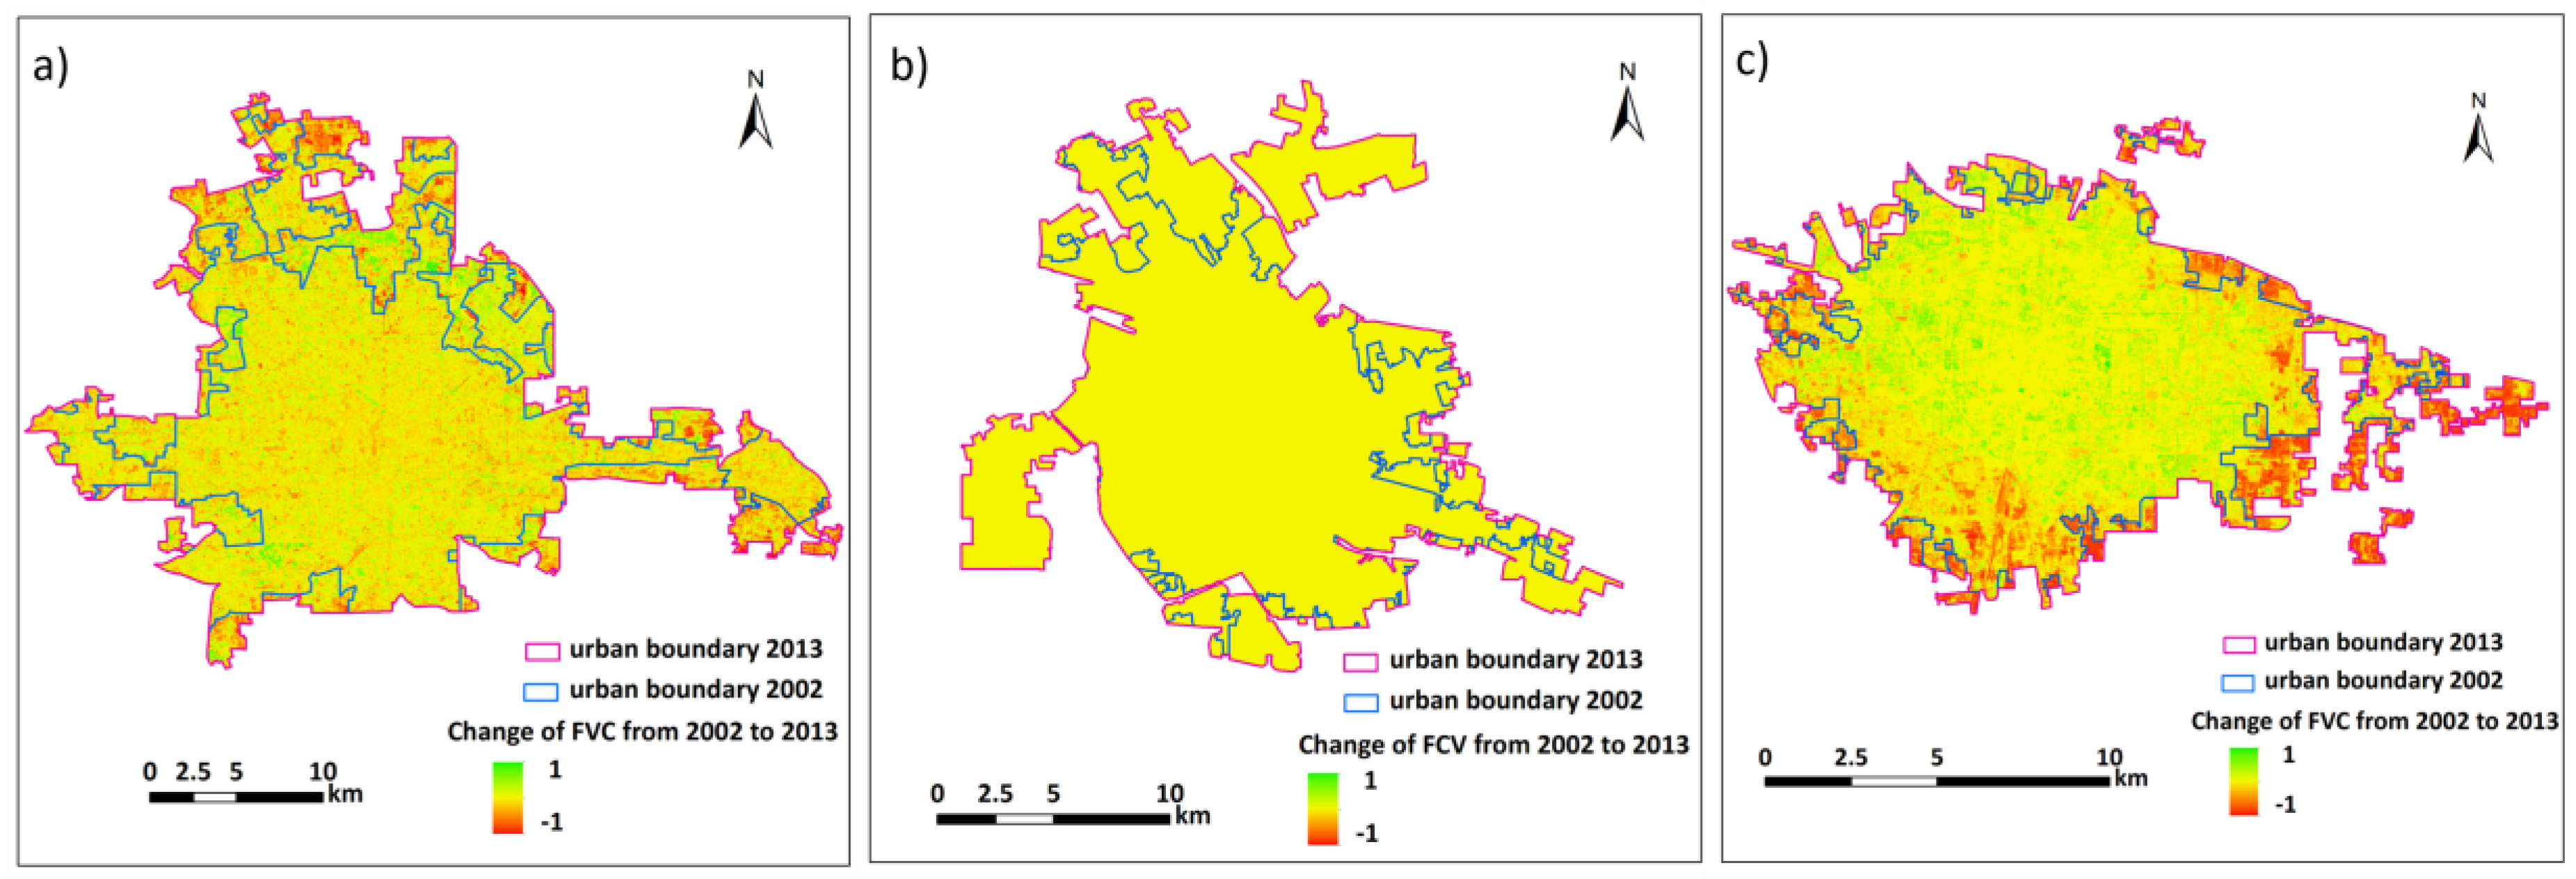
3.3. Vegetation Coverage Monitoring

Based on our selected samples, the calculation accuracy of FVC in BTH region during the monitoring period is generally above 80%. In 2013 the overall accuracy of FVC in BTH is 82.62% and in the urban area of Beijing is 86.44%. From 2002 to 2013 the overall FVC value in BTH shows a slight increasing trend, but with significant regional variation (Figure 8), e.g., the average FVC value in Beijing has decreased. According to the statistical results of θ s l o p e (change trend of FVC), the FVC in most areas (about 71.82%) of Beijing show no difference during the monitoring period. However, the total area under worse vegetation coverage is larger than those which get better, especially within the sixth ring of Beijing. Comparing to 2002, the average FVC value within the sixth ring has decreased 15.95% in 2013. The main cause is that some areas with moderate or low vegetation coverage has changed to very low vegetation coverage. In the urban area of Tianjin, the vegetation coverage shows an improving trend during this period (Figure 9). This is mainly due to a substantial increase in high vegetation coverage area in this region. In Hebei province, about 61.65% of the total area shows stable FVC value from 2002 to 2013. From Figure 9 we see that the vegetation coverage in Zhangjiakou shows a significant increase; while the vegetation coverage’s conditions in Baoding, Shijiazhuang, and Handan (the south part of Hebei) are getting worse.

3.4. Ground Subsidence Monitoring

3.4.1. Ground Subsidence in Beijing

From 1992 to 2002 marks the initial stage of ground subsidence in Beijing. There are several subsidence centers of small size distributed in Longquan town, which has experienced −48.3 mm/year as a maximum rate of subsidence. From 2003 to 2010 the situation of ground subsidence has further developed. This leads to a subsidence belt in Chaoyang-Tongzhou area (eastern part of Beijing). In the northern part of Beijing, there are five scattered subsidence centers, among which Dongba town has experienced −143.34 cm/year of the maximum rate of subsidence, and the area of subsidence exceeding −50 mm/year reaches 265.41 km2. During the period from 2012 to 2014 the subsidence belt in eastern Beijing has further developed and a new subsidence belt located at Haidian-Changping-Shunyi has emerged. Dongba town still shows the highest subsidence rate of −151.68 mm/year. The area of subsidence exceeding −50 mm/year reaches 433.25 km2. In general, the result shows a constantly increasing trend of ground subsidence in Beijing.

3.4.2. Ground Subsidence in Tianjin

During the period from 1992 to 2002 the subsidence area had already emerged in the whole city except for the northern part of Tianjin. The maximum subsidence rate reached −80.74 mm/year in Hangu district and the total area of subsidence exceeding −50 mm/year is more than 85.73 km2. From 2003 to 2010 the rapid development of subsidence results in three subsidence belts, which are located in the western, southern, and southeastern parts of Tianjin. The maximum subsidence rate −134.89 mm/year) happens to the northeastern part of Jinghai District. The total area of subsidence exceeding −50 mm/year expanded to 2749.1 km2. From 2012 to 2014, the ground subsidence shows an increasing trend in the north of Tianjin. In contrast, the south shows a decreasing trend. The maximum subsidence rate −134.89 mm/year) happens in Wuqing district. The total area of subsidence exceeding −50 mm/year has shrunk to 1117.55 km2. In general, the subsiding trend in Tianjin has slowed down in recent years.

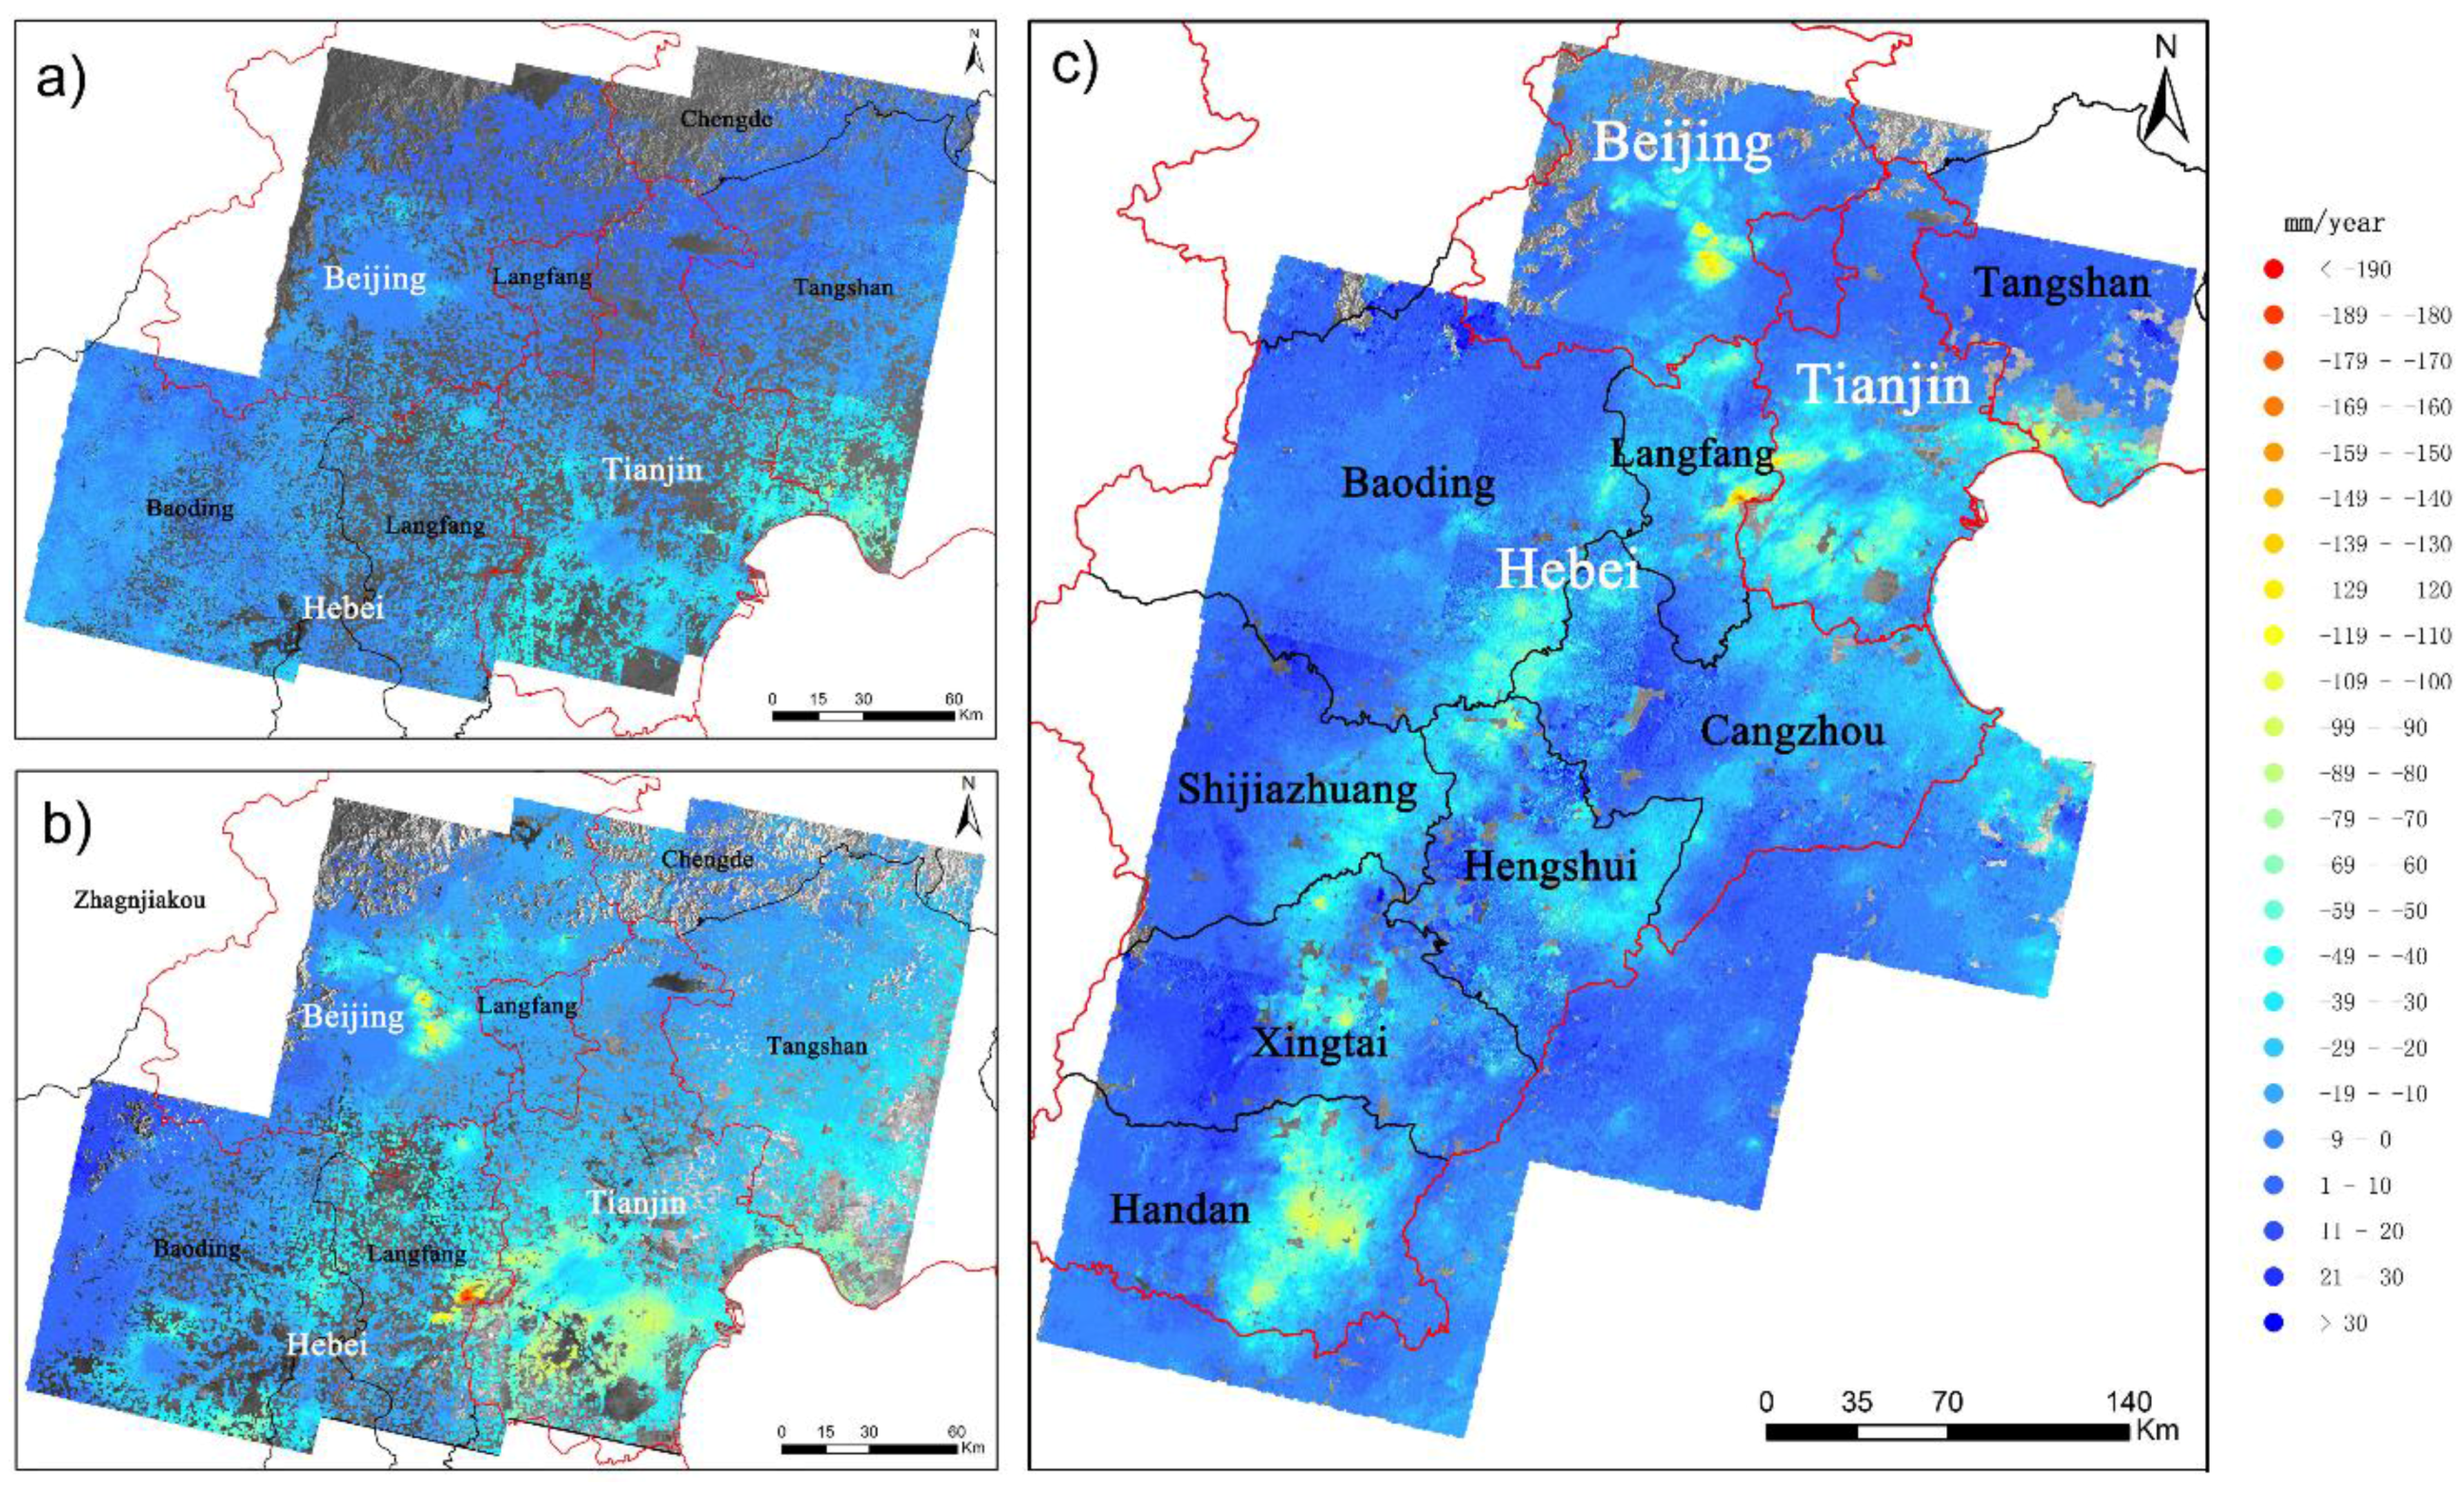
3.4.3. Ground Subsidence in Hebei Province

Due to the limited image availability, we only monitor the north part of Hebei province, including the city of Langfang, Tangshan, Baoding. From 1992 to 2002, the subsidence area in Tangshan mainly located in the southern part including Fengnan and Caofeidian district with a maximum rate of −108.32 mm/year. From 2003 to 2010, Langfang shows a rapid development of ground subsidence. The subsidence center locates in Shengfang town with a maximum rate of −214.3 mm/year. During the same time, the subsidence area in Langfang and Baoding are gradually connecting. From 2012 to 2014, a large subsidence belt is formed from north to south in Hebei province. The rate from several subsidence centers in this region is more than −100 mm/year and the maximum rate reaches up to −212.72 mm/year. The results exhibit that several subsidence funnels are gradually connected from Beijing, Tianjin, and Hebei (Figure 10).

4. Cumulative Impact Analysis from Monitoring Results

4.1. The Impact of Dust Surfaces and Pollution Industries

According to the “Report of Environmental Exposure Related Activity Patterns Research of Chinese Population (Adults)” published by EPD (Environmental Protection Department) [34], the affecting ranges by pollution industries and dust surfaces have been set at 1 km and 300 m. Then, the buffer analyses have been applied on two major pollution sources, and the buffered areas stand for their directly-affected ranges. In 2007, the area affected by all pollution industries accounts for 8.66% of the total area of BTH, and this area ratio reaches 13.73% in 2013. The area affected by dust surface in 2007 takes 16.26% of the total area of BTH in 2007, and this area ratio reaches 19.93% in 2013.
In order to analyze the affected population by the pollution sources, we assume that the people are evenly distributed in built-up areas within cities. Since these pollution sources are mostly located in high-population density areas, the proportion of affected population is much higher than the proportion of affected area in BTH. From 2007 to 2013, the amount of people affected by pollution industries has increased more than 5%; and the amount of people affected by dust surfaces has increased roughly 12%. Both the spatial extent and population affected by the two pollution sources have dramatically increased from 2007 to 2013.

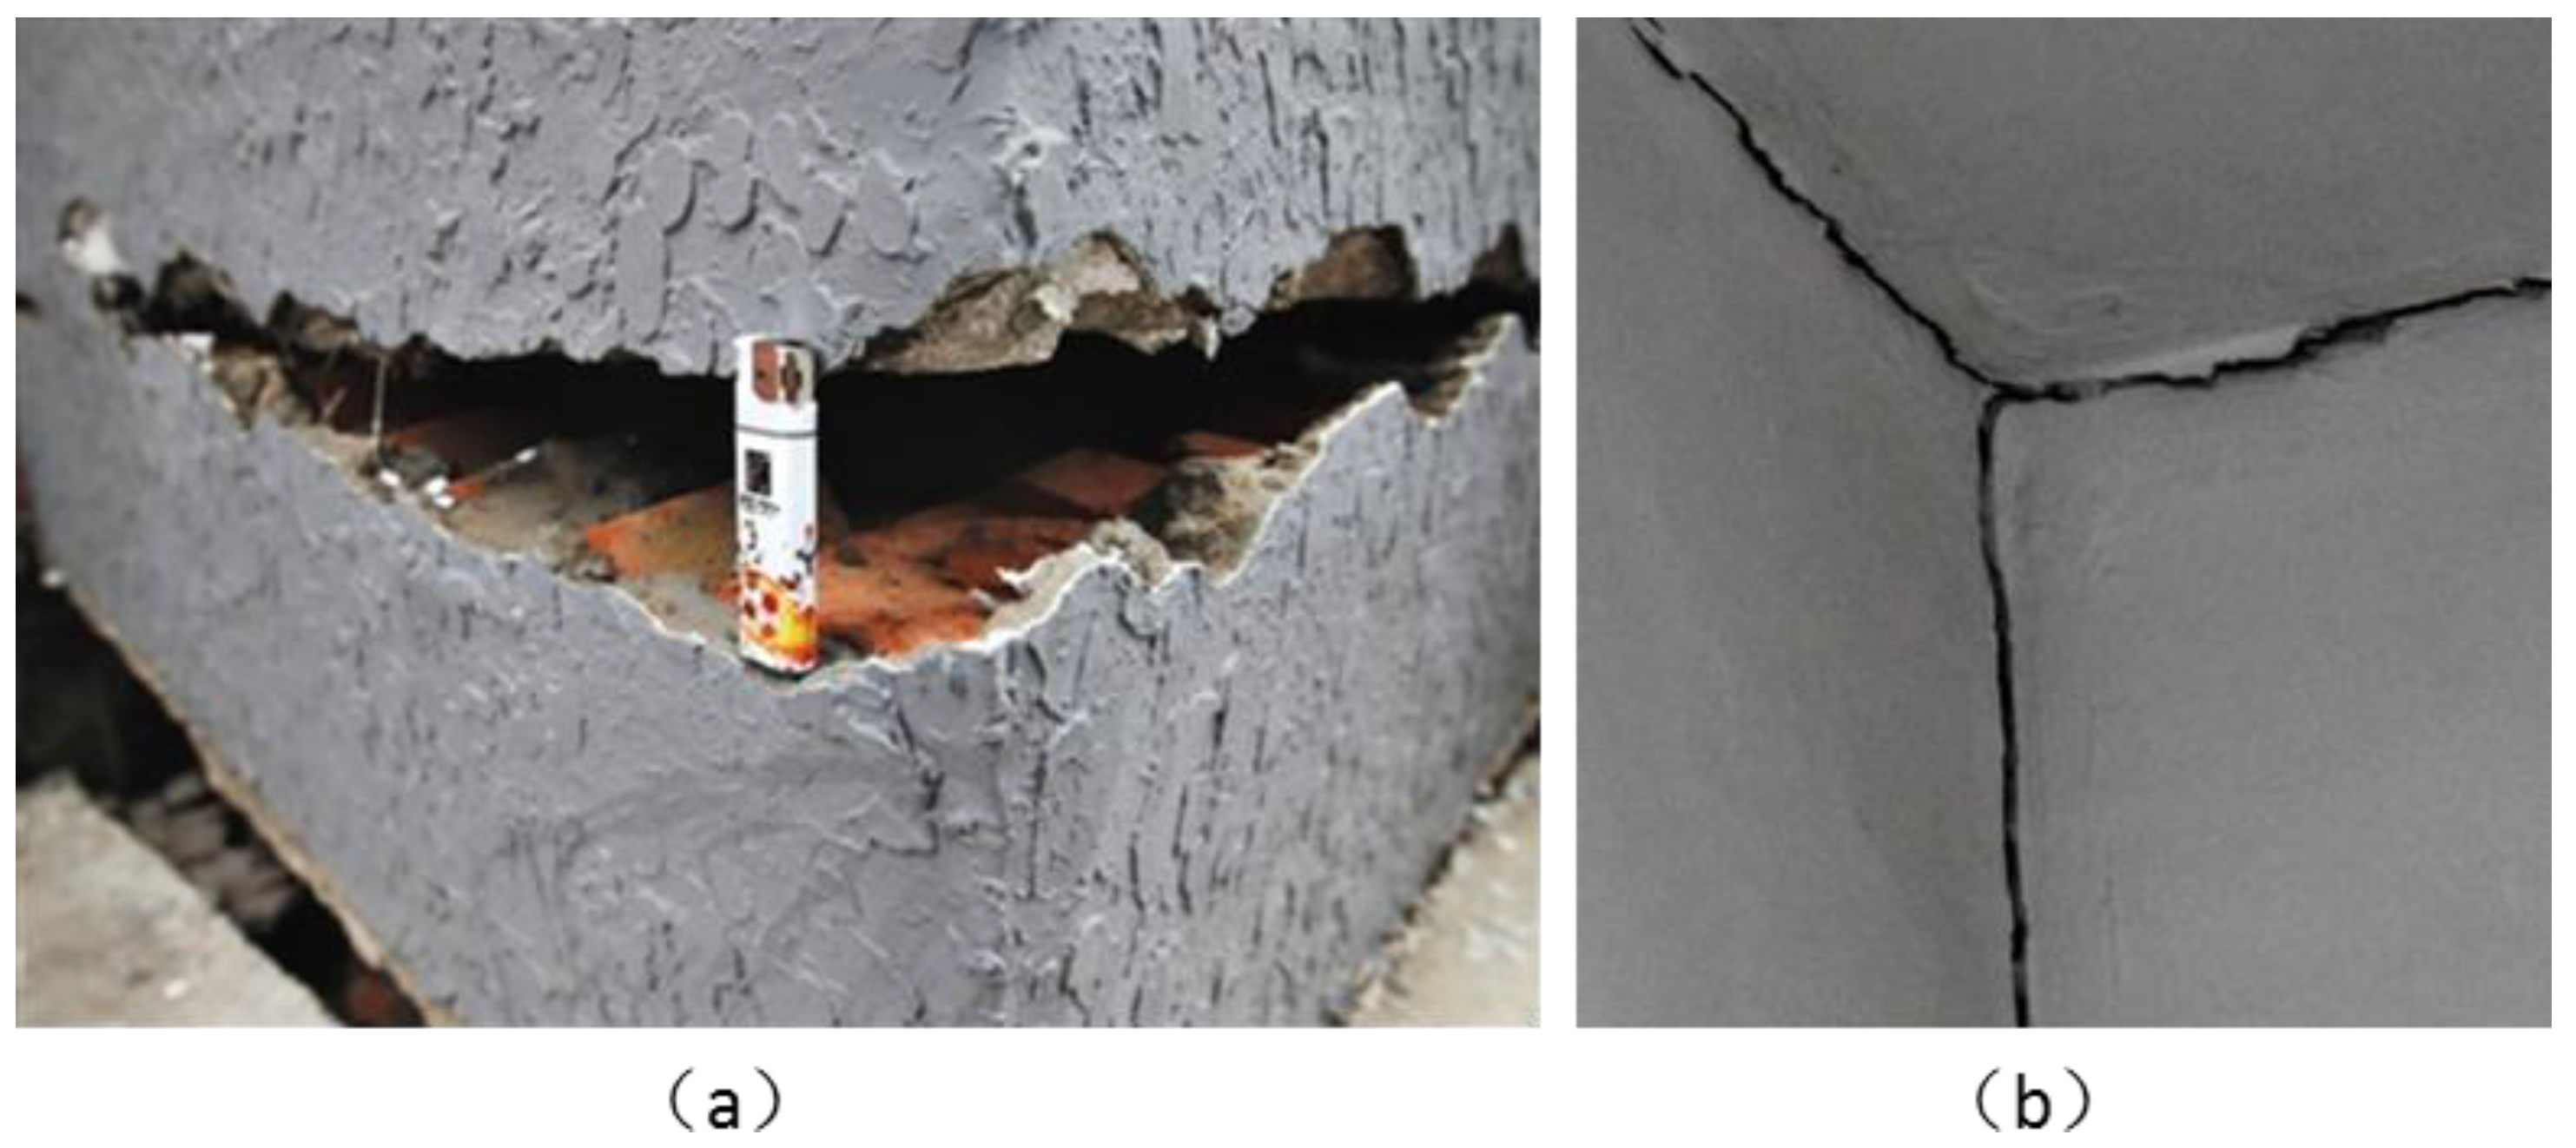
4.2. The Impact of Ground Subsidence

Uneven ground subsidence poses a great threat to the safety of transportation network, buildings, and other infrastructures [35,36,37,38,39]. In the BTH region, the main transport routes, e.g., subway, high-speed railway, and highway, all pass through the area with serious ground subsidence. There are 14 metro lines which pass through the significant uneven subsidence area in Beijing. The length of metros overlaid with the area of serious subsidence is 60.81 km, which is about 13.25% of the total. In addition, there are three high-speed railways and several highways which are located in the significant subsidence area. The length of affected highways by significant uneven subsidence is about 758.34 km. Not only traffic lines, construction in the BTH are also threatened by the uneven subsidence. For example, the terminal 1 and terminal 2 of the capital airport are located in the subsidence area with an average subsidence rate up to −52.49 mm/year. The planned second capital airport will be built in the area with a subsidence rate from −5 to −70 mm/year. This should be fully noticed by the relevant authorities at the initial planning stage.
Ground subsidence can also bring serious impacts to the residents’ lives. Ground subsidence can lead to house or road cracking and collapse, water and natural gas pipeline breaks, and so on. Figure 11 shows the scene photos of damaged houses in the subsidence centers in Beijing and Tianjin, respectively. According to our statistics, in Beijing roughly 3 million people live in the area where the subsidence rate is more than −30 mm/year; and more than 300,000 people live in serious subsidence areas where the subsidence rate is more than −100 mm/year.

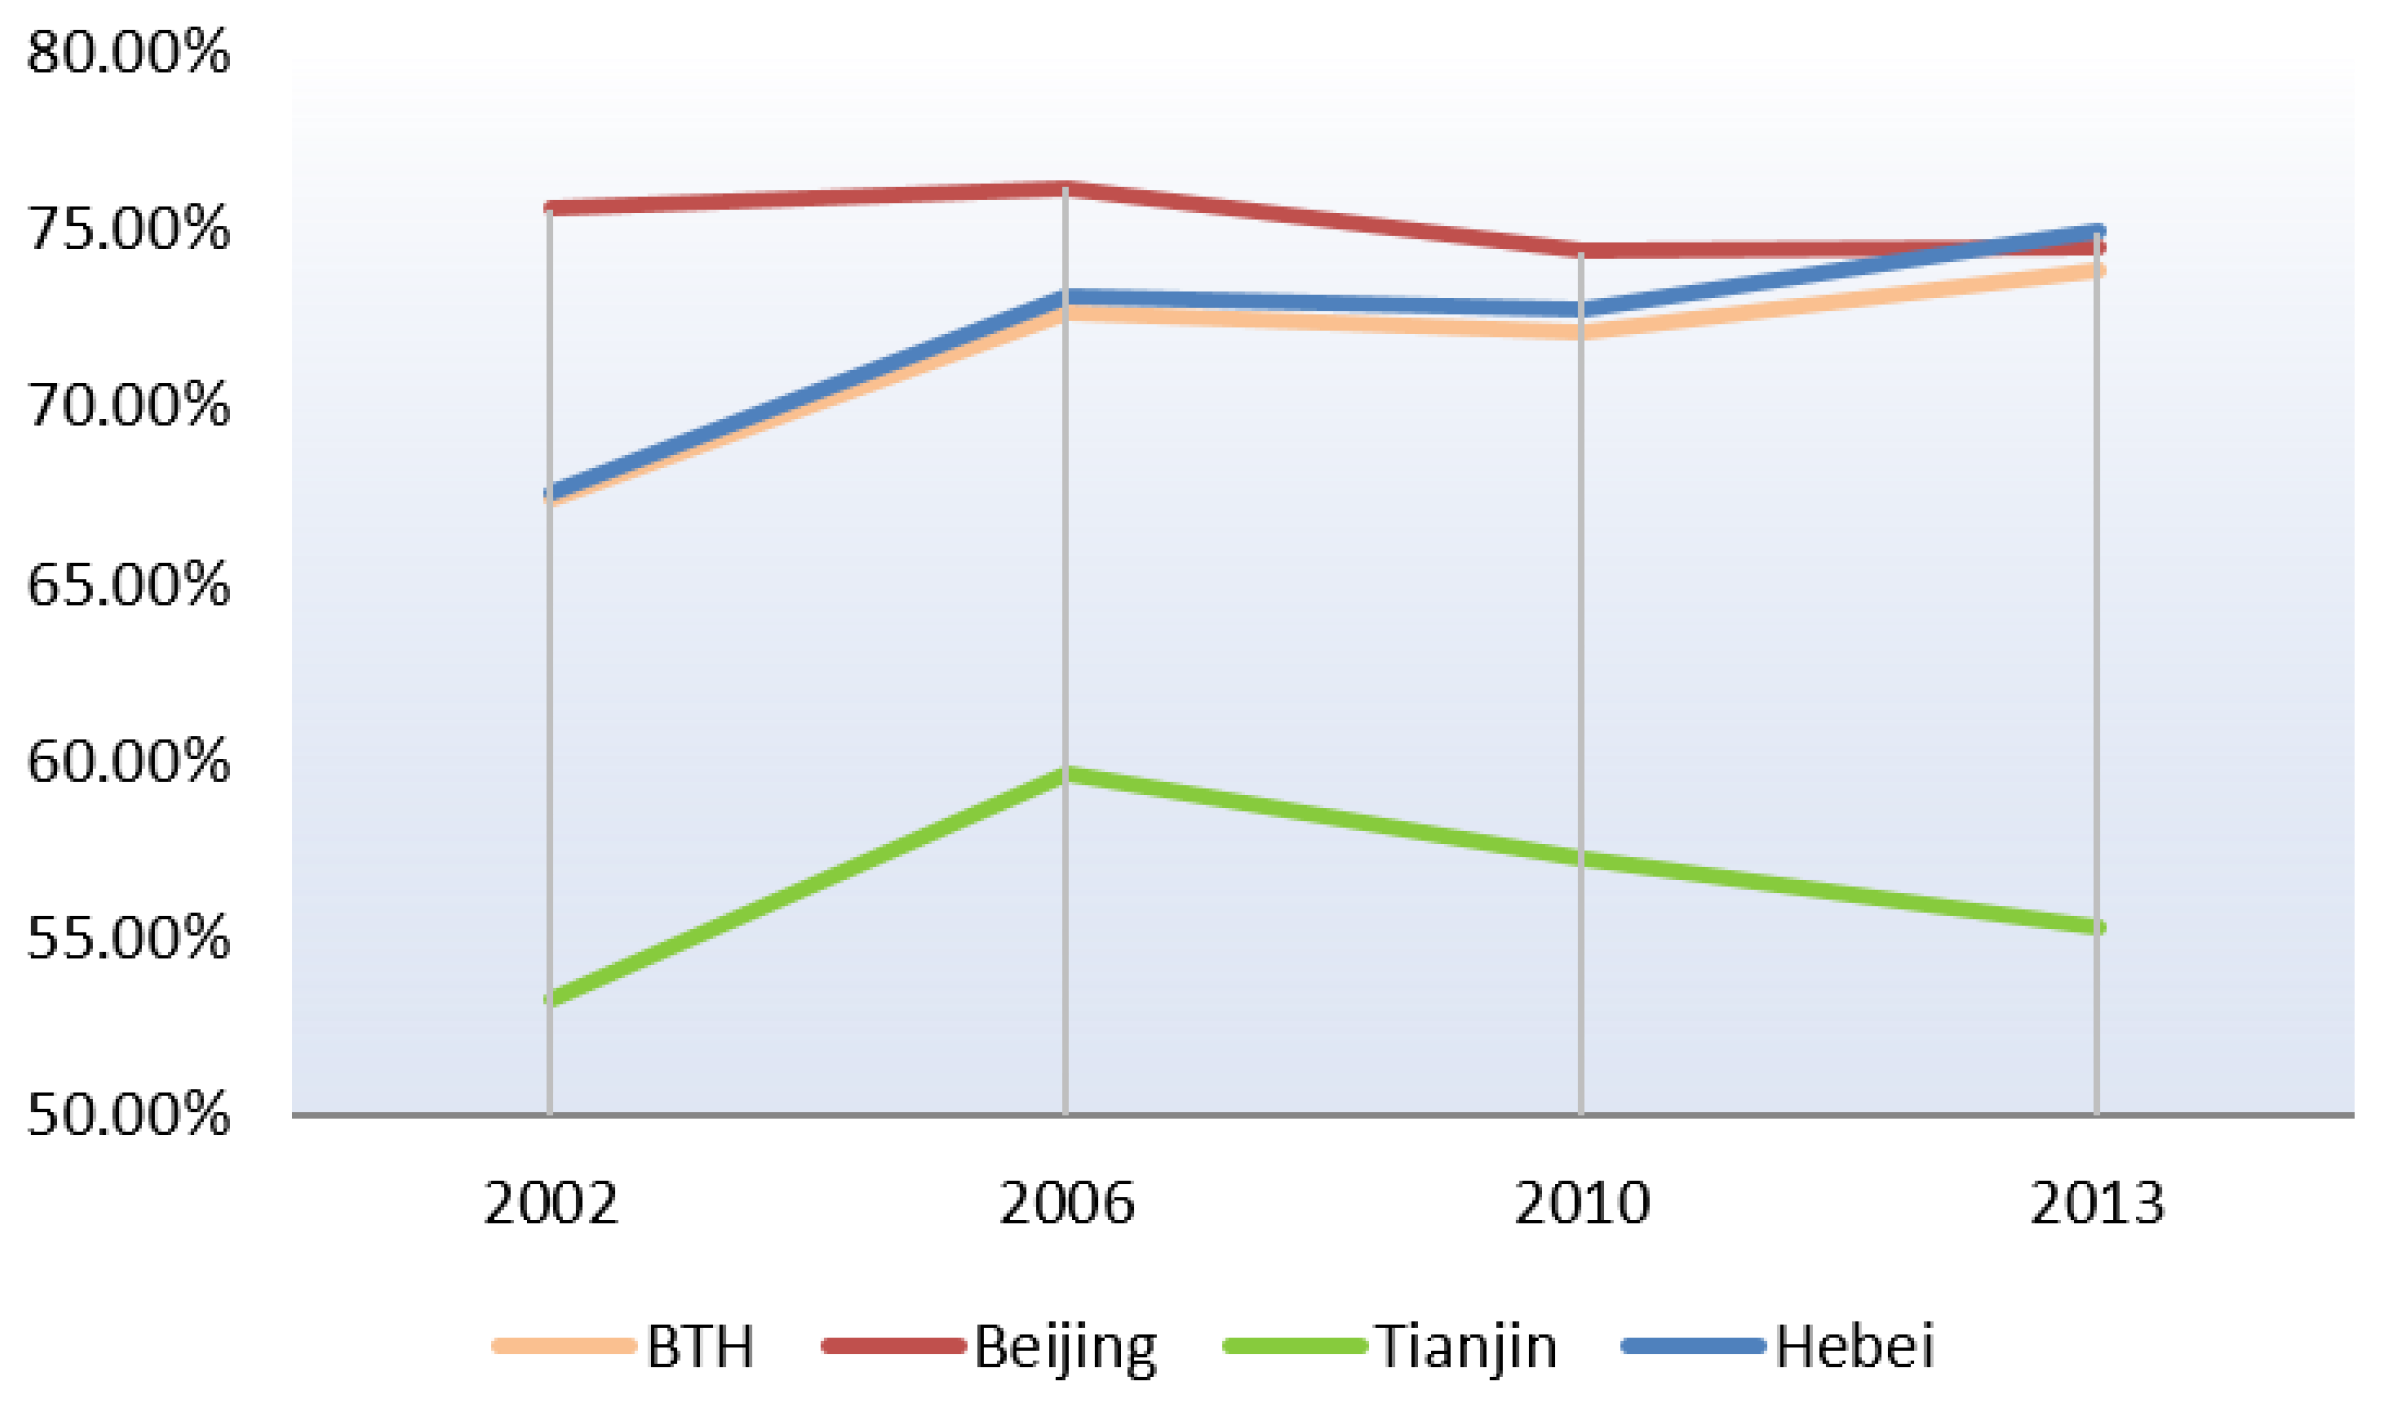
4.3. Comparative Analysis of Urban Sprawl and Vegetation Coverage

As the overlaid monitoring period of urban sprawl and vegetation fraction is from 2002 to 2013, we further did a comparative analysis to show the changing process of both vegetation coverage and urban sprawl during this time. Figure 12 shows the overlaid results of change trend of vegetation coverage ( θ s l o p e ) and the delineated urban border in the year 2002 and 2013 for three major cities in BTH. Having a look at the change trend of vegetation coverage within the urban border of 2002, Beijing and Shijiazhuang generally show a downward trend of vegetation coverage. This indicates that the construction inside the urban area of the two cities have occupied urban green spaces. As shown in Figure 12a, the increases of vegetation coverage in Beijing mainly distribute along the urban border of 2002; and most of the seriously declined areas are located close to the urban border of 2013, especially in the northern part of city. Most part of Tianjin show an increase trend of vegetation coverage (Figure 12b), and the increased vegetation covers mainly distribute in the urban interior. The significantly declined areas are mainly located in the expanded region after 2002, like the northern and western parts of the city. Similarly, for the city Shijiazhuang, significant vegetation decline can be observed between the urban border of 2002 and 2013 (Figure 12c). Generally speaking, a decline of vegetation coverage mainly happens in the expanded urban area.

5. Conclusions and Lessons from Monitoring

Based on the statistical analysis, different thematic monitoring maps were constructed and compared. From the comparisons the following conclusions arise:
  • Due to the intensive distribution of pollution sources, the concentration of atmospheric particulate matter is potentially high in plain area of BTH. According to our statistics, the amount of people exposed to two pollution sources in BTH have dramatically increased from 2007 to 2013.
  • The ground subsidence is overall in a severe trend in BTH. The situations in Beijing and Hebei province have worsened. From 1992 to 2014, the area of subsidence exceeding −50 mm/year has increased 167.84 km2 in Beijing; and the maximum subsidence rate has increased from −108.32 mm/year to more than −200 mm/year in Hebei. In Tianjin the area of subsidence exceeding −50 mm/year has shrunk from 2749.1 km2 to 1117.55 km2 since 2003. The uneven ground subsidence poses a threat to the safe of the constructions, transportations, and other infrastructures; and
  • During the monitoring period, the spatial expansion of urban area can be clearly identified in BTH. However, the urban area expansions in some cities (e.g., Beijing, Tianjin, Langfang, etc.) are not coordinated with their population growth. This indicates excessive expansion of urban area in these cities. Absorbing farmlands and nearby rural areas is the main form of urban expansion. This has severely affected the vegetation coverage in BTH.
The well-being of the society and environment has raised great attention from both the government and public in China. To fill the gap between nature and human society, GCM will play a key role in these efforts providing the capabilities to process big data and deliver information from various scientific disciplines. The first results of implementation of GCM have shown us that the knowledge derived from the spatial data could be helpful in making the plan of urban design and nature conservation. For example, the land subsidence map could be used in urban infrastructure planning, which would guide the direction of the city development. This monitoring approach can also be applied in other cities which have a similar subsidence problem. Vegetation coverage and pollution sources have adverse effects on urban environment. Regular monitoring on a regional or national scale can supply a general evaluation of the ecological environment. To explore the deeper relationship between geographical conditions with social and economic development, further research is necessary, such as the correlation analysis between air pollutants and pollution sources’ distribution; the impact of mining activities on the severity of ground subsidence; and the relationship between urbanization and eco-environment. In addition, a follow-up project has been proposed in this region which will focus on a broader range of issues, such as the traffic network, ecological network, etc.
This paper has presented a pilot thematic monitoring focusing on the major issues in the BTH region. The designed GCM is running in a pre-operational phase. Valuable experience gained from this project would be useful for further developing and applying GCM at the national level. It is the first step towards a concrete monitoring program and could contribute to the GEOSS from the perspective of China.

Acknowledgments

This work was supported by the National Geographical Conditions Monitoring Project (grant number B1605); Program for the Young Academic and Technological Leaders of NASG, funded by Key Laboratory of Geo-informatics of NASG (grant number E1604); Beijing Key Laboratory of Urban Spatial Information Engineering; National Natural Science Foundation of China (grant numbers 41501192 and 41371406); Basic Research Funding in CASM (grant number 7771508). The authors would like to thank Xiaogang Ning, Chengfeng Luo, Yonghong Zhang for their excellent work for implementation of GCM and highlight the contributions from Huiyong Sang, Hao Wang, Hongan Wu, Fang An, Fan Liu and Qianqian Qiu. We would also like to acknowledge every member of the BTH GCM group from Beijing Institute of Surveying and Mapping, Tianjin Institute of Surveying and Mapping, and Hebei Bureau of Geoinformation. We thank the anonymous reviewers for their helpful comments.

Author Contributions

Jixian Zhang, Jiping Liu, and Liang Zhai designed the monitoring project; Jixian Zhang, Jiping Liu, Liang Zhai and Wei Hou provided technical support to this article and wrote the paper. Wei Hou polished the language and submitted the paper.

Conflicts of Interest

The authors declare no conflict of interest.

Abbreviations

The following abbreviations are mainly used in this manuscript:
ARDSArea Ratio of Dust Surface
BTHBeijing-Tianjin-Hebei
DPIDensity of Pollution Industries
FVCFraction vegetation cover
GCMGeographical Conditions Monitoring
GSRGround Subsidence Rate
UECCUrban Expansion Coordination Coefficient
UESUrban Expansion Speed
UFDUrban Fractal Dimension

References

  1. Zhang, J.; Li, W.; Zhai, L. Understanding geographical conditions monitoring: A perspective from China. Int. J. Digit. Earth 2013, 8, 38–57. [Google Scholar] [CrossRef]
  2. Carley, M.J. Monitoring as an extension of the impact assessment process for large projects. Proj. Apprais. 1986, 1, 88–95. [Google Scholar] [CrossRef]
  3. SanClements, M.D.; Metzger, S.; Luo, H.; Pingintha-Durden, N.; Zulueta, R.; Loescher, H.W. The national ecological observatory network (NEON): Providing free long-term ecological data on a continental scale. Available online: http://www.coopeus.eu/wp-content/uploads/2014/11/iLEAPS-Newsletter-Special_issue-on-RIs.pdf (accessed on 7 June 2016).
  4. Lautenbacher, C.C. The global earth observation system of systems: Science serving society. Space Policy 2006, 22, 8–11. [Google Scholar] [CrossRef]
  5. EEA. Eionet Connects-Sharing Environmental Information in Europe. Available online: http://www.eea.europa.eu/publications/eionet-connects (accessed on 9 May 2016).
  6. EEA. Gmes Briefing. Available online: http://www.eea.europa.eu/about-us/what/seis-initiatives/gmes-briefing (accessed on 7 June 2016).
  7. Hao, Z.; AghaKouchak, A.; Nakhjiri, N.; Farahmand, A. Global integrated drought monitoring and prediction system. Sci. Data 2014, 1. [Google Scholar] [CrossRef] [PubMed]
  8. Wang, S.; Ma, H.; Zhao, Y. Exploring the relationship between urbanization and the eco-environment—A case study of Beijing–Tianjin–Hebei region. Ecol. Indic. 2014, 45, 171–183. [Google Scholar] [CrossRef]
  9. Tie, X.; Cao, J. Aerosol pollution in China: Present and future impact on environment. Particuology 2009, 7, 426–431. [Google Scholar] [CrossRef]
  10. Chan, C.K.; Yao, X. Air pollution in mega cities in China. Atmos. Environ. 2008, 42, 1–42. [Google Scholar] [CrossRef]
  11. Song, Y.; Xie, S.; Zhang, Y.; Zeng, L.; Salmon, L.G.; Zheng, M. Source apportionment of PM2.5 in Beijing using principal component analysis/absolute principal component scores and unmix. Sci. Total Environ. 2006, 372, 278–286. [Google Scholar] [CrossRef] [PubMed]
  12. Zheng, M.; Salmon, L.G.; Schauer, J.J.; Zeng, L.; Kiang, C.S.; Zhang, Y.; Cass, G.R. Seasonal trends in PM2.5 source contributions in Beijing, China. Atmos. Environ. 2005, 39, 3967–3976. [Google Scholar] [CrossRef]
  13. Bi, X.; Feng, Y.; Wu, J.; Wang, Y.; Zhu, T. Source apportionment of PM10 in six cities of northern China. Atmos. Environ. 2007, 41, 903–912. [Google Scholar] [CrossRef]
  14. Xiao, D. Urbanization process and the sustainable utilization of land resources. Yunnan Geogr. Environ. Res. 1997, 9, 34–39. (In Chinese) [Google Scholar]
  15. Yang, Y.; Feng, Z.; Zhao, Y.; You, Z. Coordination between urban land expansion and population growth in China. Geogr. Res. 2013, 32, 1668–1678. (In Chinese) [Google Scholar]
  16. China Academy of Urban Planning and Design (CAUPD). Forecasting Urban Land Use in 2000; CAUPD: Beijing, China, 1989. (In Chinese) [Google Scholar]
  17. An, Q.; Li, X.; Lv, K. A research on the spatial structure and efficiency of china’s expansion of urban built-up area (1990–2009). Econ. Geogr. 2012, 32, 37–45. (In Chinese) [Google Scholar]
  18. Ewing, R. Is LOS angeles-style sprawl desirable? J. Am. Plan. Assoc. 1997, 63, 107–126. [Google Scholar] [CrossRef]
  19. Davis, C.; Schaub, T. A transboundary study of urban sprawl in the pacific coast region of North America: The benefits of multiple measurement methods. Int. J. Appl. Earth Obs. Geoinf. 2005, 7, 268–283. [Google Scholar] [CrossRef]
  20. Jaeger, J.A.G.; Bertiller, R.; Schwick, C.; Cavens, D.; Kienast, F. Urban permeation of landscapes and sprawl per capita: New measures of urban sprawl. Ecol. Indic. 2010, 10, 427–441. [Google Scholar] [CrossRef]
  21. Stathakis, D.; Tsilimigkas, G. Measuring the compactness of European medium-sized cities by spatial metrics based on fused data sets. Int. J. Image Data Fusion 2015, 6, 42–64. [Google Scholar] [CrossRef]
  22. Ma, R.; Gu, C.; Pu, Y.; Ma, X. Mining the urban sprawl pattern: A case study on Sunan, China. Sensors 2008, 8, 6371–6395. [Google Scholar] [CrossRef]
  23. Purevdorj, T.S.; Tateishi, R.; Ishiyama, T.; Honda, Y. Relationships between percent vegetation cover and vegetation indices. Int. J. Remote Sens. 1998, 19, 3519–3535. [Google Scholar] [CrossRef]
  24. Xiao, J.; Moody, A. A comparison of methods for estimating fractional green vegetation cover within a desert-to-upland transition zone in central New Mexico, USA. Remote Sens. Environ. 2005, 98, 237–250. [Google Scholar] [CrossRef]
  25. Gitelson, A.A.; Kaufman, Y.J.; Stark, R.; Rundquist, D. Novel algorithms for remote estimation of vegetation fraction. Remote Sens. Environ. 2002, 80, 76–87. [Google Scholar] [CrossRef]
  26. Gutman, G.; Ignatov, A. The derivation of the green vegetation fraction from NOAA/AVHRR data for use in numerical weather prediction models. Int. J. Remote Sens. 1998, 19, 1533–1543. [Google Scholar] [CrossRef]
  27. Jing, X.; Yao, W.-Q.; Wang, J.-H.; Song, X.-Y. A study on the relationship between dynamic change of vegetation coverage and precipitation in Beijing’s mountainous areas during the last 20 years. Math. Comput. Model. 2011, 54, 1079–1085. [Google Scholar] [CrossRef]
  28. Chen, F.; Lin, H.; Zhou, W.; Hong, T.; Wang, G. Surface deformation detected by ALOS PALSAR small baseline SAR interferometry over permafrost environment of beiluhe section, Tibet Plateau, China. Remote Sens. Environ. 2013, 138, 10–18. [Google Scholar] [CrossRef]
  29. Fan, H.; Deng, K.; Ju, C.; Zhu, C.; Xue, J. Land subsidence monitoring by D-InSAR technique. Min. Sci. Technol. (China) 2011, 21, 869–872. [Google Scholar] [CrossRef]
  30. Zhu, L.; Gong, H.; Li, X.; Wang, R.; Chen, B.; Dai, Z.; Teatini, P. Land subsidence due to groundwater withdrawal in the northern Beijing plain, China. Eng. Geol. 2015, 193, 243–255. [Google Scholar] [CrossRef]
  31. Chaussard, E.; Wdowinski, S.; Cabral-Cano, E.; Amelung, F. Land subsidence in central Mexico detected by ALOS InSAR time-series. Remote Sens. Environ. 2014, 140, 94–106. [Google Scholar] [CrossRef]
  32. Zhang, L.; Ding, X.; Lu, Z. Ground deformation mapping by fusion of multi-temporal interferometric synthetic aperture radar images: A review. Int. J. Image Data Fusion 2015, 6, 289–313. [Google Scholar] [CrossRef]
  33. Lu, Z.; Dzurisin, D.; Jung, H.-S.; Zhang, J.; Zhang, Y. Radar image and data fusion for natural hazards characterisation. Int. J. Image Data Fusion 2010, 1, 217–242. [Google Scholar] [CrossRef]
  34. Environmental Protection Department (EPD). Report of Environmental Exposure Related Activity Patterns Research of Chinese Population (Adults); China Environmental Science Press: Beijing, China, 2013; p. 59. (In Chinese) [Google Scholar]
  35. Chen, B.; Gong, H.; Li, X.; Lei, K.; Ke, Y.; Duan, G.; Zhou, C. Spatial correlation between land subsidence and urbanization in Beijing, China. Nat. Hazards 2015, 75, 2637–2652. [Google Scholar] [CrossRef]
  36. Feng, Q.; Liu, G.; Meng, L.; Fu, E.; Zhang, H.; Zhang, K. Land subsidence induced by groundwater extraction and building damage level assessment—A case study of Datun, China. J. China Univ. Min. Technol. 2008, 18, 556–560. [Google Scholar] [CrossRef]
  37. Kontogianni, V.; Pytharouli, S.; Stiros, S. Ground subsidence, quaternary faults and vulnerability of utilities and transportation networks in Thessaly, Greece. Environ. Geol. 2007, 52, 1085–1095. [Google Scholar] [CrossRef]
  38. Maliva, R.; Missimer, T. Compaction and land subsidence. In Arid Lands Water Evaluation and Management; Springer: Berlin, Germany, 2012; pp. 343–363. [Google Scholar]
  39. Ortega-Guerrero, M.A.; Carrillo-Rivera, J.J. Land subsidence in urban environment. In Encyclopedia of Sustainability Science and Technology; Meyers, R., Ed.; Springer: New York, NY, USA, 2012; pp. 5712–5720. [Google Scholar]
Figure 1. Location and range of the BTH region, China.
Ijgi 05 00089 g001
Figure 2. Location of samples selected in the BTH region, (a) vegetation samples; (b) bare soil samples; and (c) samples within the extent of the sixth ring of Beijing.
Ijgi 05 00089 g002
Figure 3. Distribution patterns of dust surfaces and pollution industries in BTH: (a) distribution of dust surface in 2007; (b) distribution of pollution industries in 2007; (c) distribution of dust surface in 2013; and (d) distribution of pollution industries in 2013.
Ijgi 05 00089 g003
Figure 4. Statistical results of Area Ratio of Dust Surface (ARDS) according to the administrative units (municipalities) from the years 2007 and 2013 in BTH.
Ijgi 05 00089 g004
Figure 5. Statistical results of Density of Pollution Industries (DPI) according to the administrative units (municipalities) from the year of 2007 and 2013 in BTH.
Ijgi 05 00089 g005
Figure 6. Urban area expansions from 1990 to 2013 in BTH.
Ijgi 05 00089 g006
Figure 7. Changes of Urban Fractal Dimension (UFD) from 1990 to 2003 in BTH.
Ijgi 05 00089 g007
Figure 8. The curve of FVC in BTH Region from 2002 to 2013.
Ijgi 05 00089 g008
Figure 9. Change trend of FVC in BTH region from 2002 to 2013.
Ijgi 05 00089 g009
Figure 10. Ground subsidence rate in the key area of BTH: (a) ground subsidence during 1992 to 2002; (b) ground subsidence during 2003 to 2010; and (c) ground subsidence during 2012 to 2014.
Ijgi 05 00089 g010
Figure 11. Scene photos of damaged houses in the subsidence centers in (a) Beijing and (b) Tianjin.
Ijgi 05 00089 g011
Figure 12. Change pattern of FVC from 2002 to 2013 in (a) Beijing, (b) Tianjin and (c) Shijiazhuang.
Ijgi 05 00089 g012
Table 1. Thematic monitoring indicators used in BTH region.
IndicatorFormulaDescription
Pollution sources
Area Ratio of Dust Surface (ARDS) ARDS = a r e a d s a r e a u n i t × 100 %    
areads: the area of dust surface within a reporting unit, such as city unit (km2);
areaunit: the area of the reporting unit (km2); range: 0 ARDS 100 %
ARDS is proposed to measure the proportion of the dust surface located in a reporting unit.
Density of Pollution Industries (DPI) DPI = n u m p i a r e a u n i t
numpi: number of pollution industries in report unit;
areaunit: the area of the reporting unit (km2); Range: 0 DPI
DPI is proposed to measure the density of the pollution industries within a reporting unit.
Urban sprawl
Urban Expansion Speed (UES) UES i = Δ U ij Δ t j × 100 %
Δ U ij : the urban expansion area at the reporting unit i during the period j (km2);
Δ t j : the time span during the period j (year);
Range: normally the UES should be bigger than 0, but the urban area may also shrink.
The annual growth rate of urban area in a period. It indicates absolute difference (area) of urban area in a certain time.
Urban Fractal Dimension (UFD) UFD = 2 ln ( P / 4 ) ln ( A )
A: area of urban patch (km2);
P: perimeter of urban patch (km);
Range: 1 UFD 2
UFD approaches 1 for shapes with very simple perimeters such as squares; and approaches 2 for shapes with highly convoluted, plane-filling perimeters. Generally, when UFD < 1.5, the urban border tends to be simple; when UFD > 1.5, the urban border is more complex.
Fractal dimension is an important index of urban spatial morphology which expresses the space filling ability of urban border and the complexity of the irregular border. The greater the fractal dimension, the more irregular and complex the urban spatial morphology is.
Urban Expansion Coordination Coefficient (UECC) UECC = U R P R × 100 %
UR = A t / A 0 Δ t 1 × 100 %
PR: the average annual growth rate of non-agricultural population in urban area;
UR: the annual growth rate of urban area; A t : the urban area at the end of a time period (km2).
A 0 : the urban area at the beginning of a time period (km2).
Δt: time span in year.
When UECC > 1.12, it indicates large-scale expansion of urban area; while UECC < 1.12, indicates an insufficient expanded urban area, and other problems may appear, such as traffic congestion, insufficient infrastructure and poor living comfort.
UECC refers to the ratio of the growth rate of urban land and that of urban population for a certain period. The hypothetical value 1.12 of this indicator is set based on the research from China Academy of Urban Planning and Design and other literatures [14,15,16,17].
Vegetation coverage
Fraction of Vegetation Coverage (FVC) NDVI = n i r r e d n i r + r e d
FVC = ( N D V I N D V I s o i l ) ( N D V I v e g N D V I s o i l ) × 100 %
NDVI: Normalized Difference Vegetation Index which is calculated based on near infrared (nir) and red spectral bands;
NDVIveg: the NDVI value for a surface with a fractional vegetation cover of 100%;
NDVIsoil: the NDVI value for bare soil;
Range: 0 FVC 100 %
FVC indicates the state of regional vegetation coverage and is important for evaluating the regional environment.
Change trend of vegetation coverage θ s l o p e = n × i = 1 n i × M f c , i i = 1 n i i = 1 n M f c , i n × i = 1 n i 2 ( i = 1 n i ) 2
θ s l o p e : the slope of a linear regression equation for FVC values during a certain period; n: number of years in FVC time serial analysis; M fc , i : the FVC value for the i th year.
When θ s l o p e 0.1 , FVC improving obviously during the study period;
θ s l o p e 0.06 , FVC improving slightly;
0.06 > θ s l o p e 0.02 , FVC improving;
0.02 > θ s l o p e 0.02 , FVC no change;
0.02 > θ s l o p e 0.06 , FVC deteriorating;
0.06 > θ s l o p e 0.1 , FVC deteriorating slightly;
0.1 θ s l o p e , FVC deteriorating obviously.
This indicator describes the change trend of vegetation coverage for certain time span in the study area. The absolute value of θ s l o p e indicates the change range of FVC. The criteria for evaluating slope are based on field investigation and expert estimation in GCM.
Ground subsidence
Ground Subsidence Rate (GSR) GSR = Δ S j Δ t j  
Δ S j : the surface subsidence during the period j (mm);
Δ t j : time span during period j.
This indicator describes the speed of land subsidence.
Table 2. Urban Sprawl Coordination Coefficient (UECC) from 1990 to 2013 in BTH.
City1990–20022002–2013
UR (%) *PR (%)UECCGR (%)PR (%)UECC
Beijing2.793.010.934.691.842.55
Tianjin2.202.290.966.910.808.66
Shijiazhuang2.473.460.721.502.160.70
Tangshan2.181.052.072.925.610.52
Qinhuangdao3.723.021.233.512.021.74
Handan3.721.802.072.480.902.76
Xingtai2.702.561.062.382.710.88
Baoding2.863.050.940.951.780.53
Zhangjiakou2.981.821.642.030.583.51
Chengde1.011.850.542.442.690.91
Cangzhou2.792.820.991.131.350.84
Langfang6.611.973.363.591.093.28
* UR: the annual growth rate of urban area; PR: the average annual growth rate of non-agricultural population in urban area.

