1. Introduction
Heading estimation is one of the key problems in the algorithm of pedestrian dead reckoning, and the accuracy of orientation estimation generates direct impact on the results of position calculation. It is considered as a difficult problem in indoor positioning to obtain accurate information from the IMU sensors with low cost and low precision [
1,
2].
Essentially, error accumulation of heading is the inherent defect of any pedestrian dead reckoning (PDR) algorithm based on MEMS IMU, which can be reduced by high-precision IMU. However, MEMS is often the only choice from the perspective of energy consumption, price, weight and so on. A variety of solutions were put forward by researchers, in order to reduce the accumulated error of MEMS during positioning. Afzal
et al. [
3] used Multiple Magnetometer Platform (MMP) to remove magnetic anomalies which caused by electronic devices and ferrous materials, thereby gaining reliable heading data. Wang
et al. [
4] used particle filter and map aiding method, thereby gaining meter level positioning accuracy. Zhang
et al. [
5] integrated visual and inertial data to realize localization, the visual data was captured from mobile phone camera and used image matching to achieve positioning. Gusenbauer
et al. [
6] collected pedestrian movement data for machine learning, so as to analyze the corresponding gait and step length, experiments showed that accumulated error was only 2.76% after walking 233 meters. Robertson
et al. [
7] established the pedestrian movement model through tying IMU to the feet of pedestrian to detect the movement state of IMU, and conducted estimation and feedback compensation to the error of navigation parameters and device based on EKF, so as to improve the accuracy and stability of positioning algorithm.
Although most existing methods may get good positioning results, they need additional information such as magnetic field and image, which can not only be easily influenced by external environment, but also increase the power consumption and volume of the system. For example, geomagnetic fingerprint information needs to be collected by a mobile phone in advance in the positioning condition, and then used for positioning. Meanwhile, most positioning algorithms need large data calculation, which is only suitable for post processing analysis, for example, the processing algorithms after map matching is conducted by particle filter, etc.
Orientation constitutes a key link in the positioning system. A number of fusion orientation estimation methods have been developed based on accelerometer, gyroscope and magnetometer [
8,
9,
10]. These methods can improve the accuracy of the direction of walk to some extent, but with the accumulation of time, the direction error will become larger. In this paper, a real-time orientation correction algorithm is proposed. The orientation will be revised after each turn based on Kalman filter in the regular building environment. The map is measured in advance, rather than generated by simultaneous localization and mapping (SLAM). Our algorithm should be used in the premise that a precise indoor map has already been obtained. Comparing with some other methods based on the pure map constraint [
11], this method can more accurately reflect the small changes in the direction of pedestrian gait, thereby achieving better positioning accuracy in the application of PDR algorithm. Detailed analysis and research on this method were conducted below. First of all, a unified heading error model is established for various errors of magnetic compass in application of pedestrian navigation. Gyroscope data is used to judge whether it is straight line movement or making a turn. Five parameters of heading error model are calculated by building geometric information through Kalman filtering method. Then, the five parameters are substituted into the model to calculate the predictable heading error of magnetic compass, thereby calculating the real-time heading information after error compensation. Experiments show that the proposed method of calculating real-time heading compensation can achieve accurate error model parameters training in indoor environment with regular structure, here regular structure refers to a number of straight corridors in the indoor structure. The direction of walk in the corridor basically remains stable, so that the direction of walk can be subject to filtering constraint by using the known direction of a corridor. This method effectively improves the original heading information, inhibits the accumulation effect of positioning error, and meets the needs of real-time pedestrian navigation.
This paper is organized as follows: In
Section 2, the construction process of heading error model is described. In
Section 3, a real-time heading compensation algorithm based on Kalman filter is proposed; meanwhile, the real-time heading correction algorithms based on assistance with building geometry information and least square are given, in order to facilitate comparative analysis. Subsequently, several experiments are analyzed in
Section 4, and
Section 5 concludes the paper.
2. Error Analysis of Orientation Sensing Data
Data of magnetic compass is likely to be influenced by many factors, such as human activities, materials of indoor space and peripheral electronic equipment. In stationary state, the magnetic compass has a probability of 90% generating the error of up to 15° [
12]. The disadvantage of magnetic compass lies in that the magnetic induction axis will detect any interference magnetic field superimposed on geomagnetic field. Such interference is derived from the environment and platform itself, which can generate various errors. These errors can be divided into two major categories: predictable error and unpredictable error. The predictable error is mainly derived from the behaviors of carrying platform and pedestrians, such as soft or hard iron effect, platform tilt, installation misalignment and shaking when the user walks. The unpredictable error is mainly derived from the magnetic interference in the environment, especially in indoor environment. Most of the predictable errors can be eliminated by static calibration process and real-time dynamic compensation algorithm. However, it is difficult to avoid the unpredictable error, so that in the indoor environment with a large number of ferromagnetic materials, reading data of magnetic compass is unavailable because of much magnetic interference, which seriously hampers the application of magnetic compass in personal navigation.
Literature [
13] conducted detailed analysis of the definition, modeling and impact characteristics on magnetic compass readings of various predictable errors, including seven kinds of errors such as magnetic declination, hard and soft iron effect, scale factor, fixed bias, platform tilt, installation misalignment and shaking when the user walks. Meanwhile, corresponding methods to reduce the error for each predictable error were put forward.
Magnetic declination means the angle between magnetic north and geographic north pole, positive for declining to the east and negative for declining to the west. The corresponding magnetic declination is different at different places or different time at the same place. In most parts of China, magnetic declination is between [−10, +2] degree. In the application of indoor positioning, the geomagnetic declination was set to be a constant λ according to the region located, by which the geomagnetic declination of Xuzhou was calculated to be 4°35´ in 2015.
The hard iron effect is caused by the permanent magnets and magnetic objects in the vicinity of the magnetic compass. It can be approximated as a constant component in a certain time because of its slow change. That is equivalent to that a constant component is superposed on the magnetic flux reading in the direction of the magnetic compass. This type of error is usually regarded as a fixed bias . In general, hard iron effect should be eliminated by the built-in calibration procedure of the compass, and little residual effect is kept after calibration.
Soft iron effect results from the interaction between geomagnetic field and ferromagnetic materials around the compass. The difference with the hard iron effect lies in that the magnetic field generated by soft iron effect is different in different directions, which is equivalent to that a changing magnetic field is superimposed on the magnetic field. Such kind of error can be modeled into the combination of scale factor and rotation angle, which is expressed as follows:
The terms refer to the effective soft iron coefficients. They are the constants of proportionality between the magnetic field applied to a soft iron and the resulting induced magnetic field.
Errors of scale factor and fixed bias belong to the instrument error of sensor, which were classified as soft iron and hard iron effect respectively due to similar characteristics [
14].
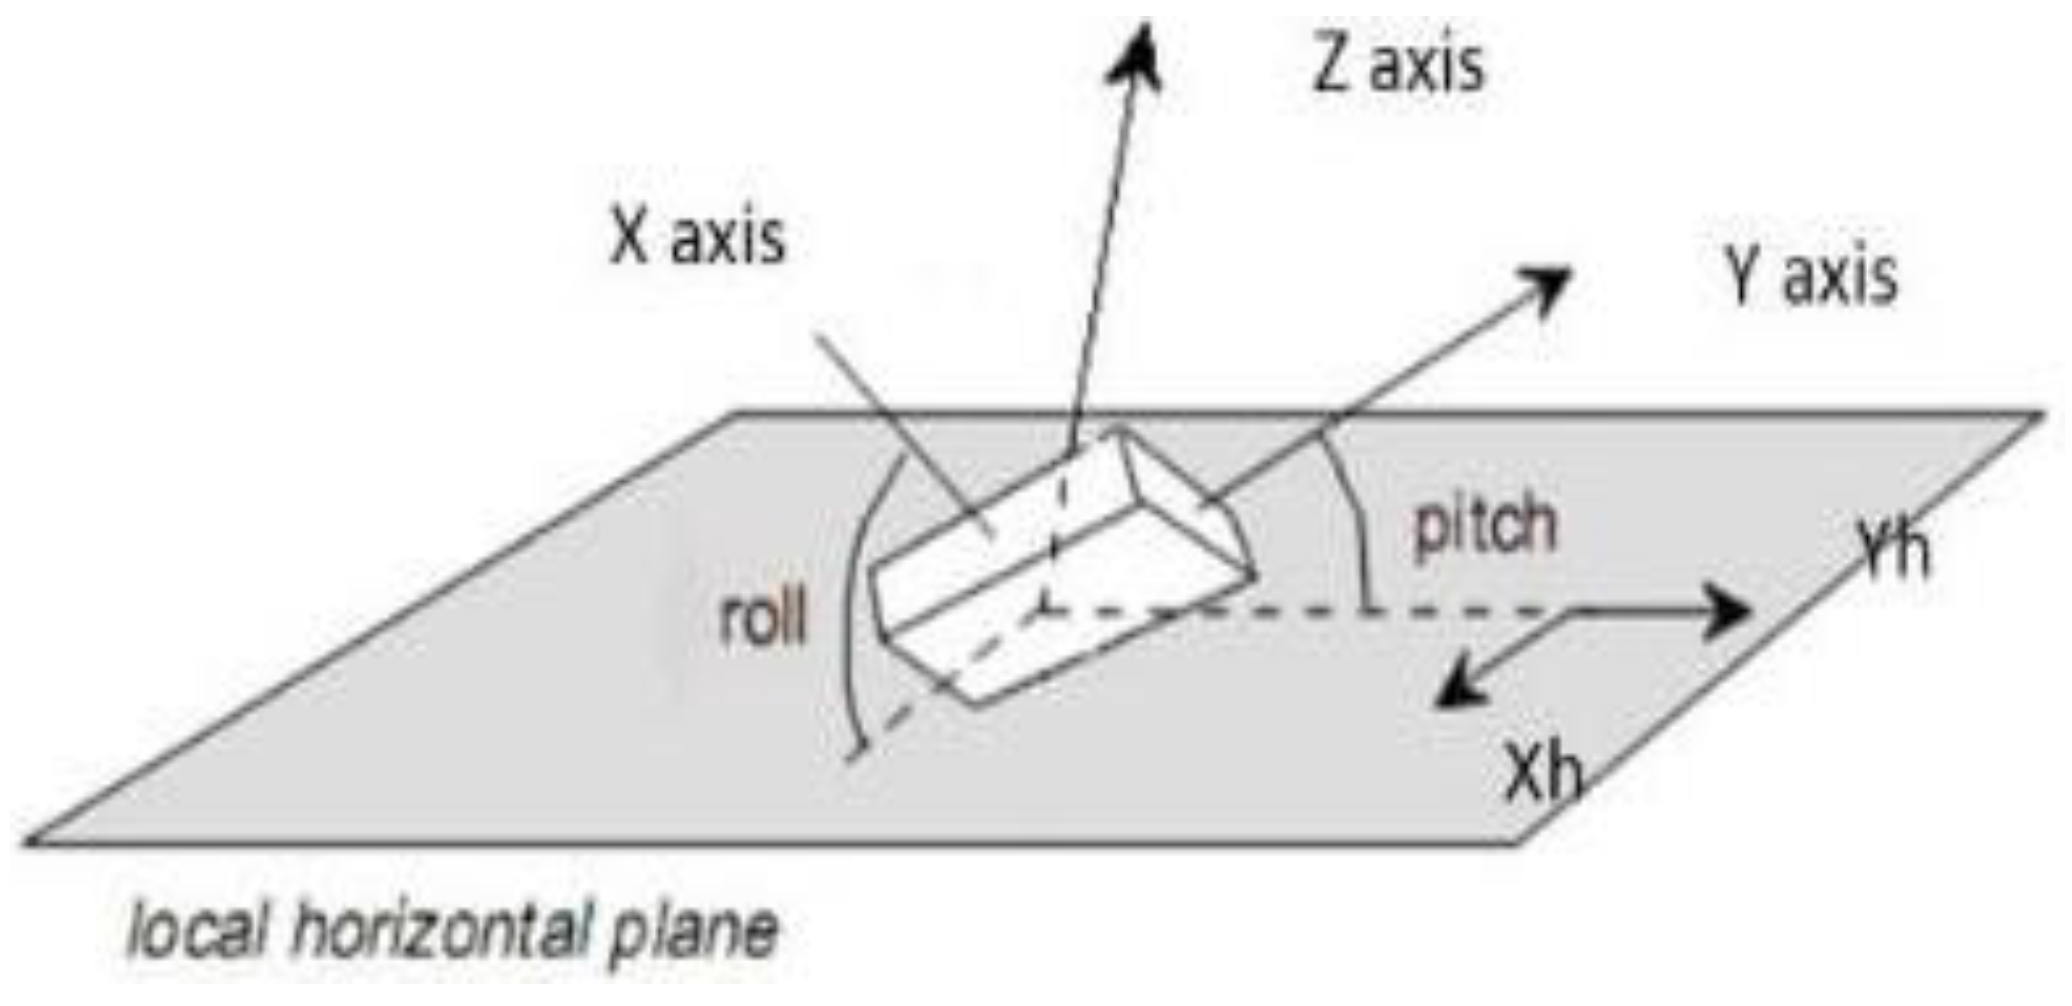
The heading is calculated by magnetic compass through measuring the horizontal component of the geomagnetic field. When the platform is tilted, the vertical component of the geomagnetic field will be projected to the induction axis of the compass, which will cause large deflection error. Therefore, platform tilt error modeling aims to achieve rotation from horizontal coordinate system to platform coordinate system:
Where,
refers to the platform's angle of pitch;
refers to the platform's roll angle, as shown in
Figure 1.
Installation misalignment error refers to the deviation in the forward direction of vehicle coordinate system and the true walking direction of the pedestrian in the process of installing navigation system. Such kind of error is modeled as a constant .
Finally, it is difficult to avoid and predict the moving pedestrian’s jitter error. In the process of movement, the device will inevitably present a certain vibration along with the jitter of the user’s body. Given the randomness of the error, it is usually modeled as , of which size of is related to the pedestrian’s movement speed, movement habits and other characteristics.
Combined modeling was conducted for the above-mentioned error models. The actual observed value
of magnetic compass in vehicle coordinate system can be expressed as [
15]:
where,
refers to the vector of local geomagnetic field;
refers to the error factor of soft iron effect;
refers to the error factor of hard iron effect;
refers to the tilt error matrix from horizontal coordinate system to vehicle coordinate system.
The error models are substituted into formula (3), thereby obtaining the reading expression of magnetic compass induction axis; a unified model containing all predictable errors can be obtained through formula conversion. Literature [
15] simplified the complex error calibration method based on magnetic field domain as the solution of five parameters based on heading domain, in order to simplify the complexity of algorithm. The simplified expression below was derived to make an approximate determination of the heading error, which is defined as follows:
where,
refers to the deviation in direction,
refers to the Gauss noise of gait direction,
refers to the heading value output from the magnetic compass;
A~
E represent the coefficients of the model needing to be calibrated.
3. Real-Time Heading Correction Algorithm
In order to verify the performance of real-time heading compensation algorithm based on Kalman filtering, the real-time heading compensation algorithms based on assistance with building geometry information and least square are given to facilitate comparative analysis.
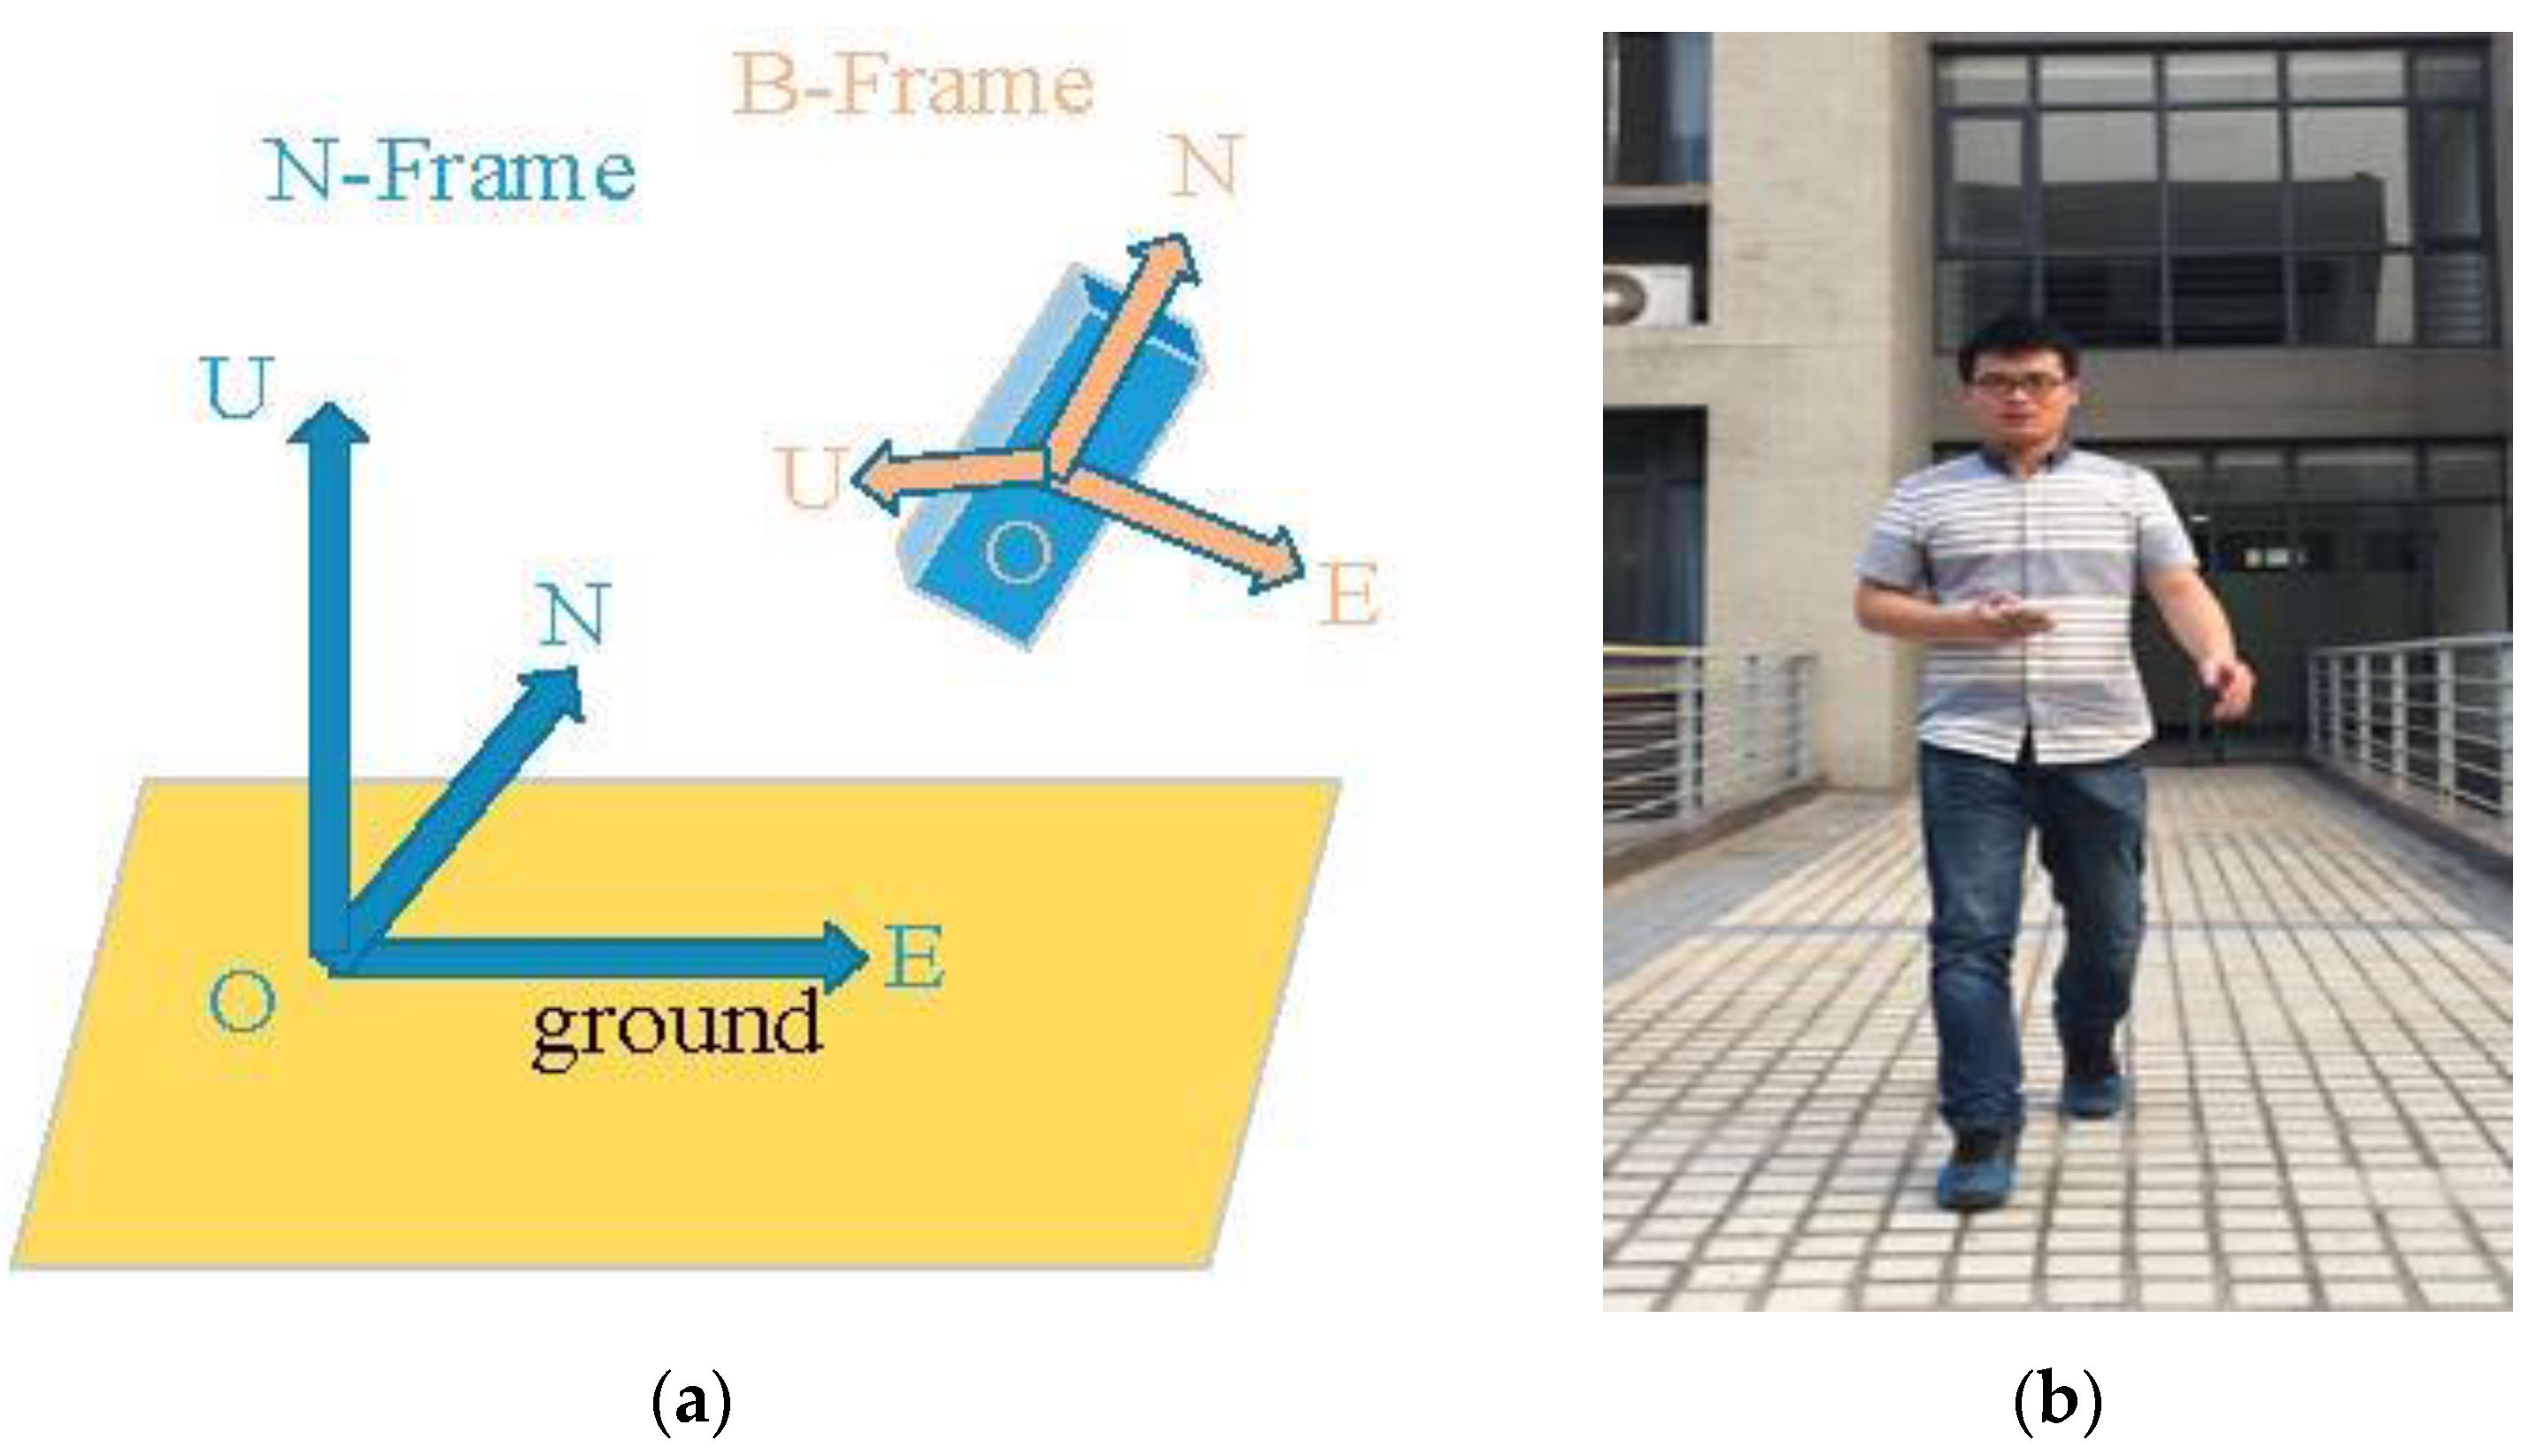
PDR algorithm is mainly composed of the following three steps: gait detection, step length evaluation, direction calculation. The process is as follows: The accelerations
acci captured form phone are transformed from the Body frame (B) into the Navigation frame (N) using the rotation matrix:
, as the
Figure 2 shows, the coordinate system of the pedestrian's mobile phone is B-frame, and the coordinate system of the pedestrian's walking plane is Navigation frame; then, computing the accelerometer magnitude:
, where
accX,
accY and
accZ are the tri-axis acceleration in the navigation frame after removing the influence of gravity. And then the value of
is used as the gait detection. The FIR filter algorithm [
16] is utilized to implement the low-pass filter-based gait detection method according to the peaks and valleys. The step length calculation formula is
[
17], where
is the the
step length. The coefficient
K can be calibrated for different walking styles.
and
are the minimum and maximum amplitudes of the acceleration. The direction of walk can be calculated through the fusion of magnetic meter, accelerometer and gyroscope. Finally, the pedestrians can be positioned by formula (5),
where
α indicates the heading angle,
SL refers to the step length and (
X,
Y) donates the coordinates of the position.
3.1. Map-Aided Heading Correction
The walking direction of pedestrian may be known through the gyroscope or magnetometer in our mobile phones. However, the angle acquired by gyroscope has a large accumulated error, and the angle acquired by magnetometer is susceptible to interference from external magnetic fields. In view of this, Kang
et al. [
8] presented a positioning method in the weighted fusion of gyroscope and magnetometer as detailed in Formula (6) below:
In this Formula,
and
represents the direction value in the fusion calculation of the current moment and the previous moment;
W represents the weight;
represents the angular velocity acquired by gyroscope at the current moment;
represents the direction value acquired by magnetometer at the current moment. Although fusion calculation improves the accuracy of direction to certain extent, the increase in direction error is still inevitable as time goes on. As the map information is known in advance when conducting positioning, it is natural to constrain the heading by using map geometry information.
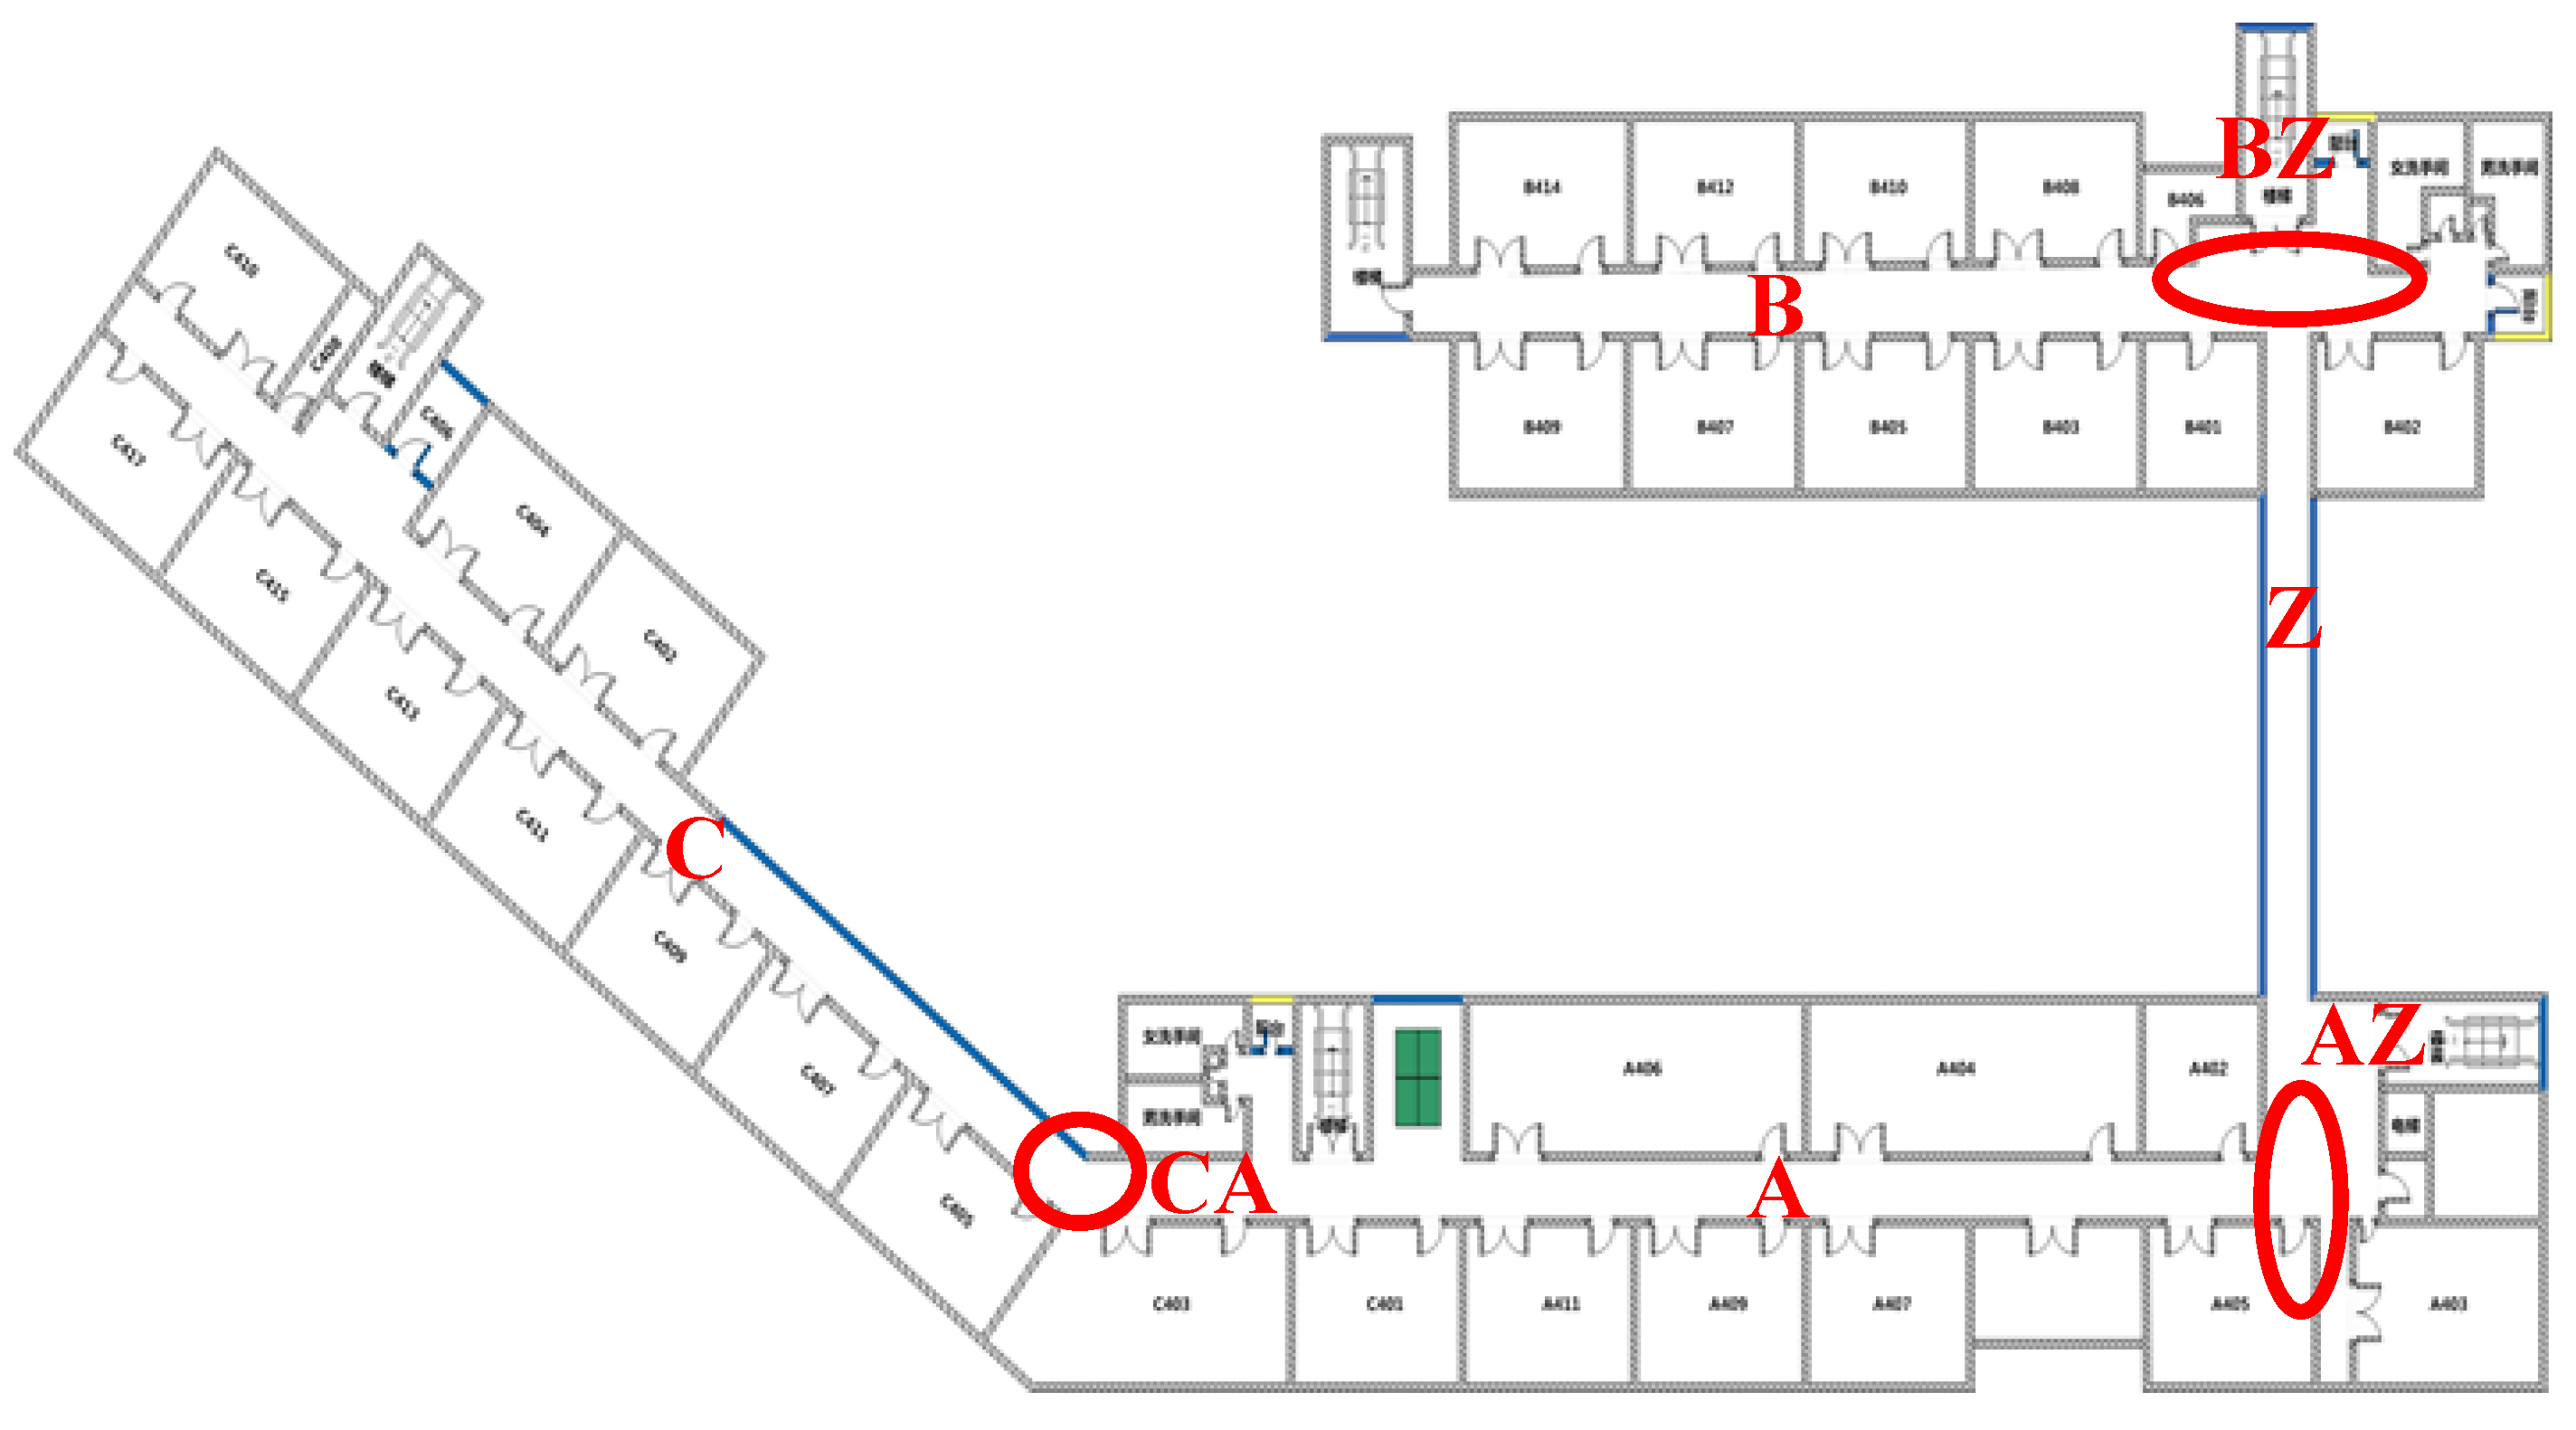
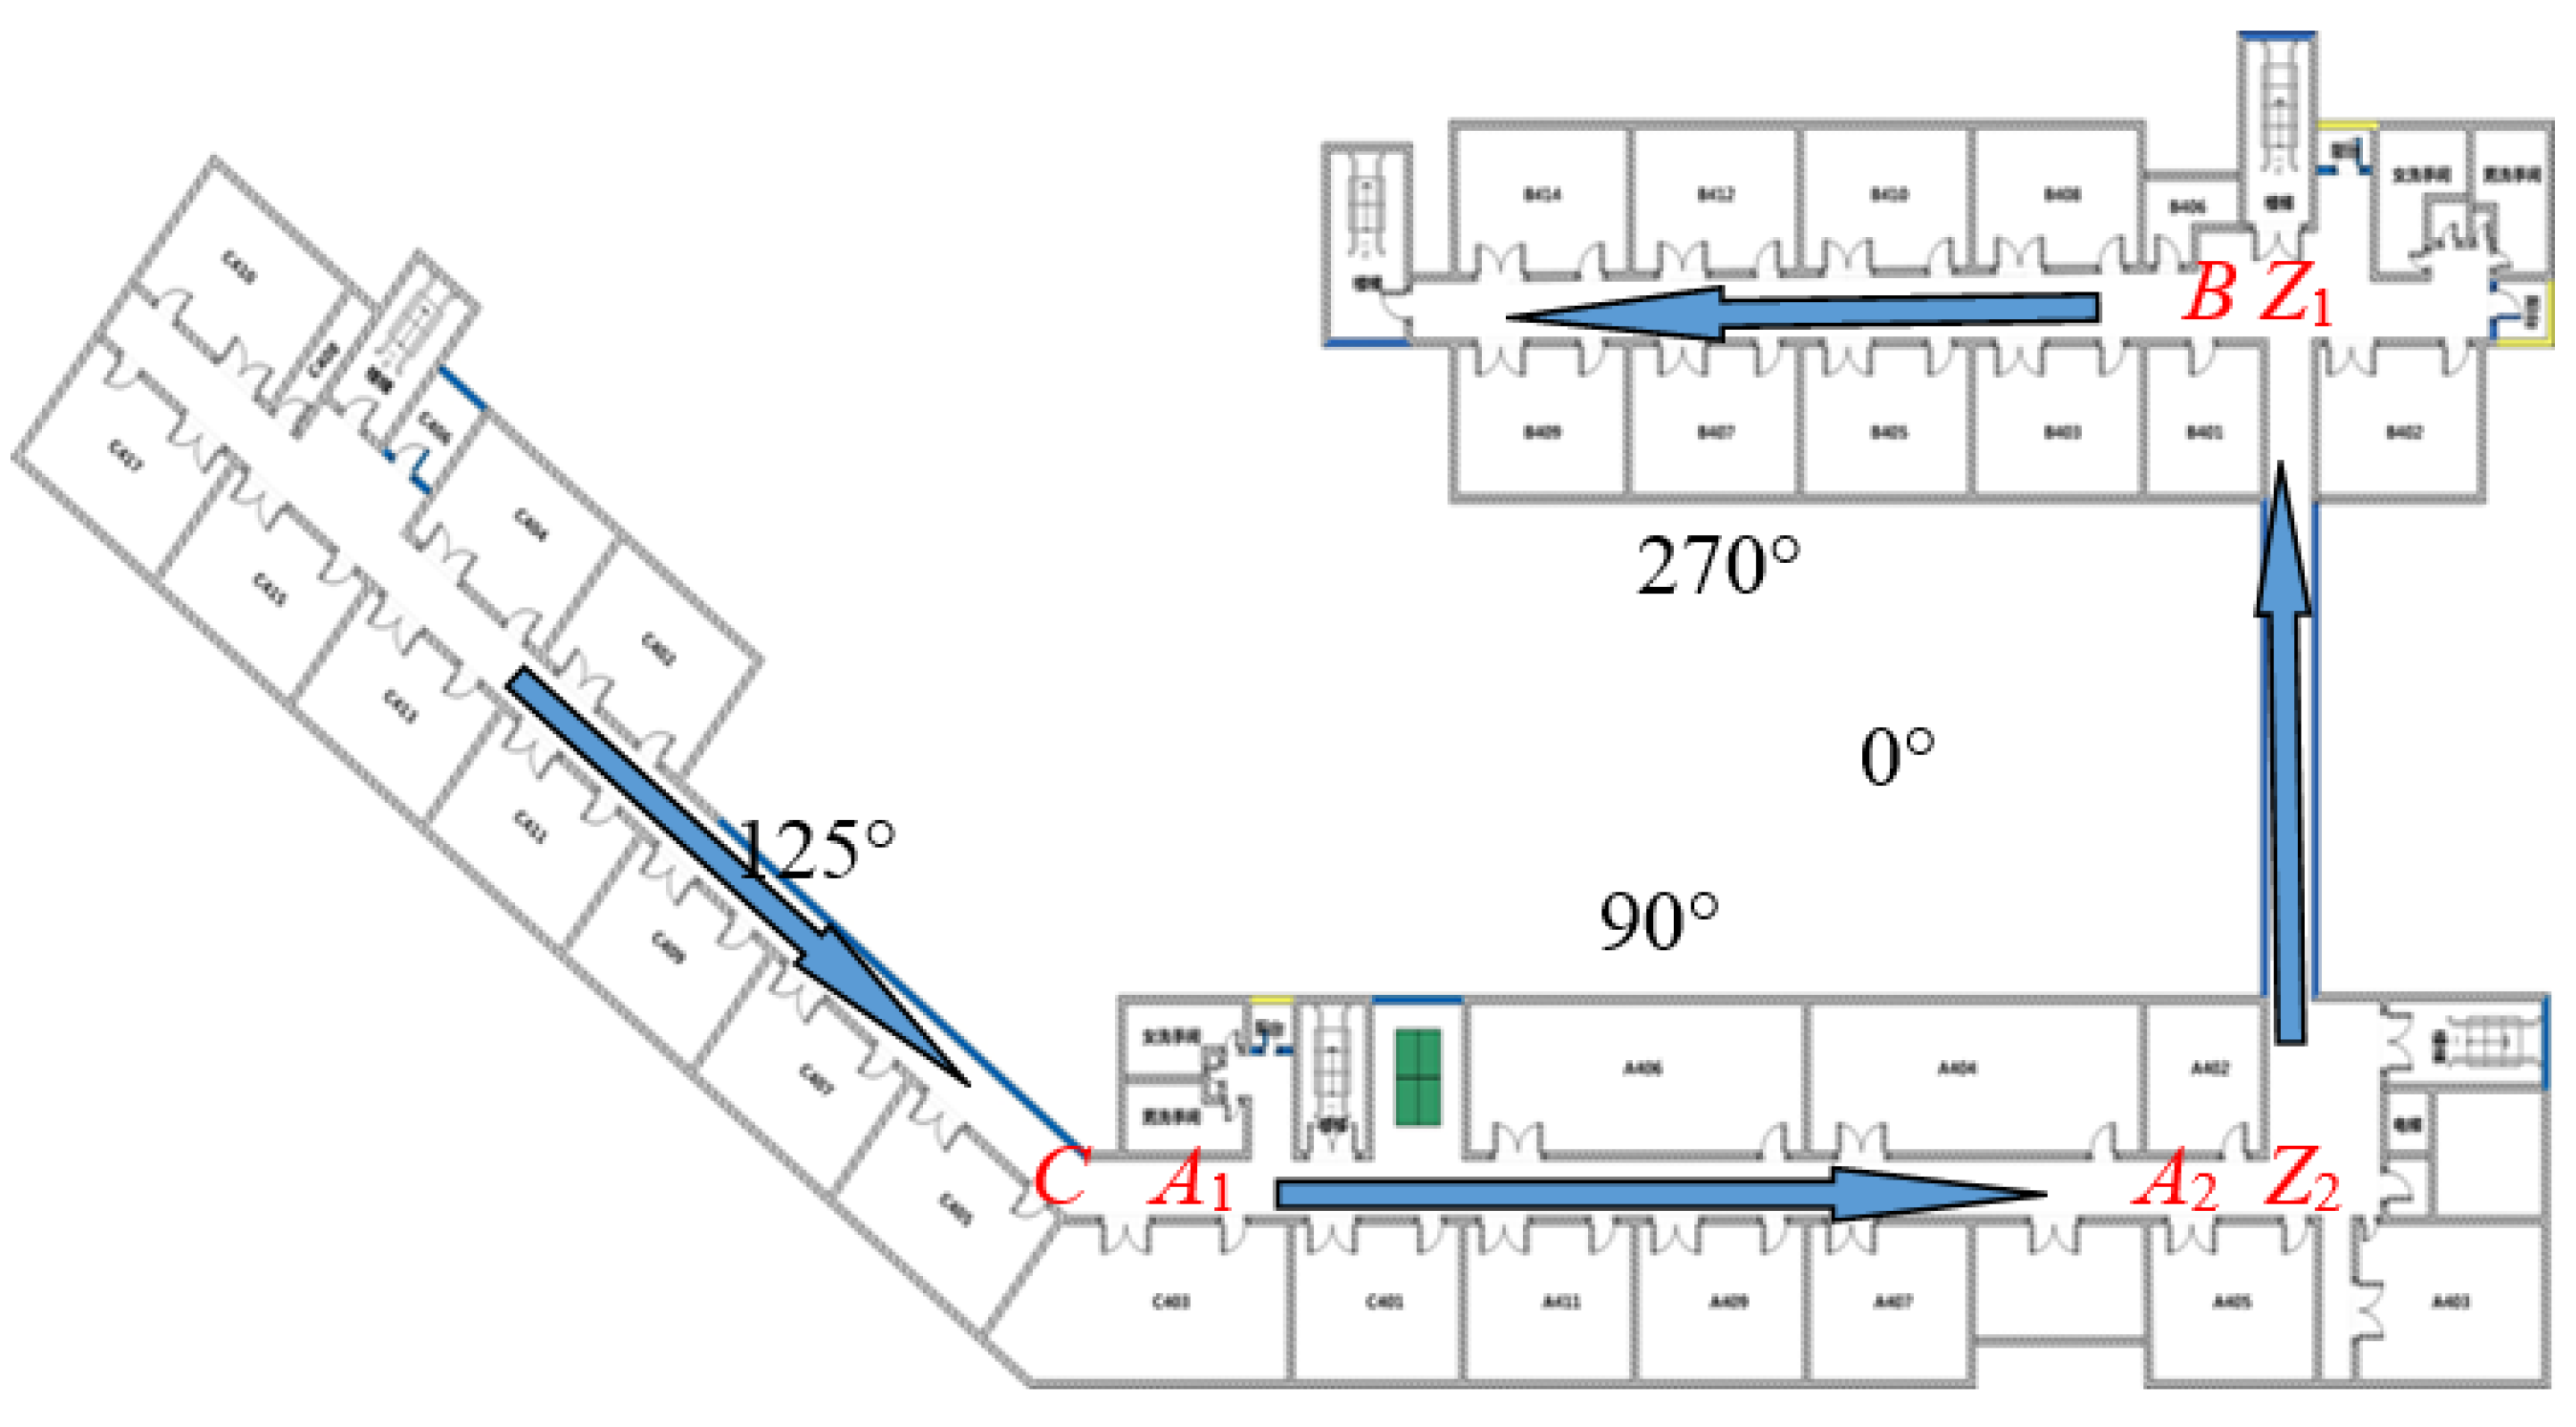
As shown in
Figure 3, the three regions marked with red circles are non-linear regions, namely BZ, AZ and CA. Within such regions, users generally turn to walk or move around. In the three linear regions labeled as C, B and A in the corridor, users usually walk in a straight line.
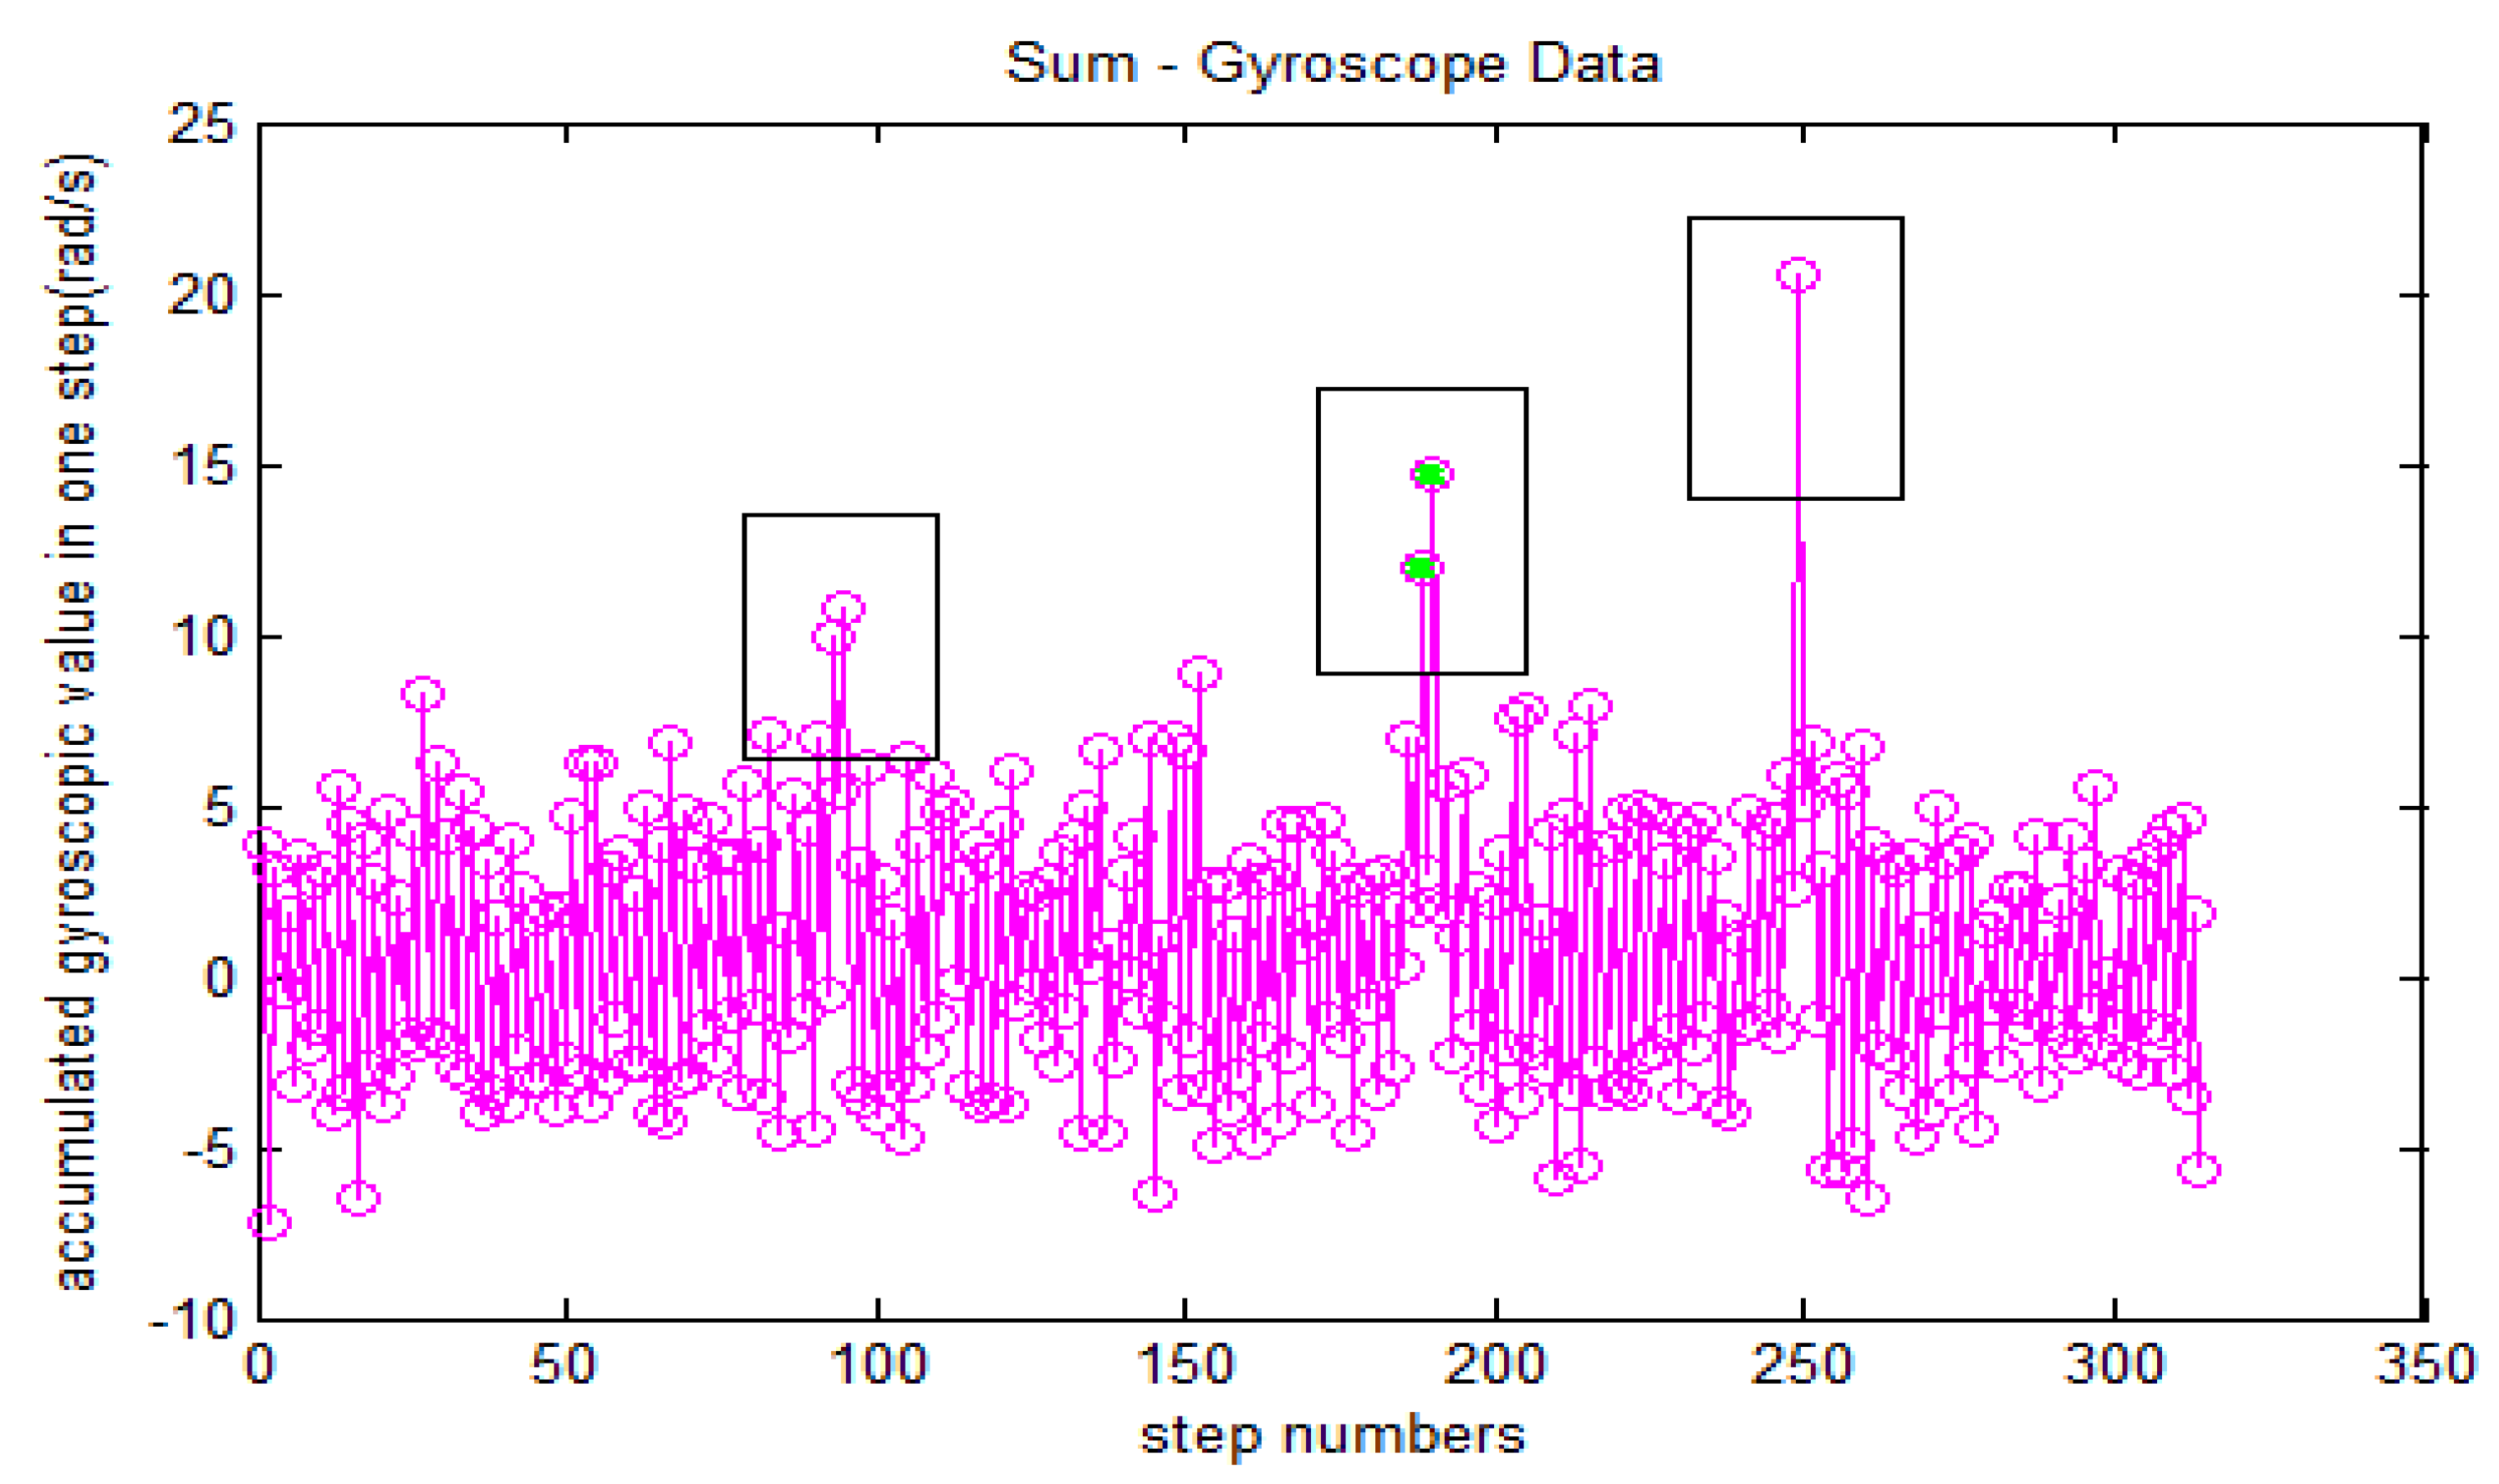
The cumulated value
of gyro data is used to judge the movement attributes of the users who are moving, including turning a corner and walking in a straight line. The judgment condition for turning a corner is:
and
refer to the cumulative values of gyro for the current step and previous step, respectively.
Figure 4 shows the cumulated value of the gyro corresponding to each step during the movement. The three extreme points within rectangular boxes represent three turning movements, as shown in
Figure 5. Therefore, when the accumulated value of the gyro does not meet formula (7), the user can be basically identified as walking in a straight line.
There are usually three acceleration extreme values in a gait, including two troughs and one peak. The direction value of such gait is the mean direction value of such three acceleration extreme values. During the gait detection, additive value of gyro angle variables can be used to determine the user's movement properties (turn or straight). If the user is within the linear region (such as C, A, B and Z), direction angle of the region can be determined according to the self-adaptation of the mobile phone's direction data (such as 125°, 90°, 0° and 270°), and the geometric direction angle is used as the heading; otherwise it indicates that the user is within the nonlinear region (such as CA, AZ and BZ), the direction average in the complete gait is directly used as the heading angle.
3.2. Heading Error Correction Based on Least Square
Literature [
15] used the outdoor GPS data to solve the parameters of heading error model by virtue of online training mode. However, this method requires the user to be outdoors, and the navigation system must be started in the open area to obtain good GPS observed value, otherwise the relatively accurate error model parameters cannot be obtained. Given the randomness of the user's adoption of navigation system, the indoor navigation system can be started freely in the indoor environment. Because the geometric information of the indoor building is known, this paper presents a new method of real-time heading compensation based on least square by virtue of such information.
The five calibration parameters in formula (4) can be solved after obtaining the reference heading from the map geometry information as well as obtaining the original heading data from the magnetic compass. Theoretically, the five calibration parameters in formula (4) can be solved as long as more than 5 sets of heading data are obtained. In this paper, 10 sets of gait heading data are used to seek the parameters of the error model at each walking in a straight line, and then the model parameters will be sought again for every turning a corner. The solving process is as follows:
Assume that in the process of the calibration, the original heading of the magnetic compass is: where refers to the direction value obtained from the sensor for each time. Specific to PDR, it refers to the direction value of each step obtained from the sensor.
The corresponding reference heading is:
Specific to PDR, refers to the reference direction value of each step, and it refers to the direction value of the actual corresponding corridor in this experiment.
These parameters can be determined by following formula:
where
After the completion of the calibration, the real-time heading error can be estimated and eliminated. However, the estimated residuals are mostly derived from the Gauss noise caused by the pedestrian's jitter, which can be reduced by Kalman filter and so on, namely the method proposed in
Section 3.3.
3.3. Real Time Heading Compensation Based on Kalman Filter
Similar to the heading compensation principle described in
Section 3.2, this section proposes a kind of heading estimation method based on Kalman filter real-time compensation. This method designs the Kalman filter by taking coefficients (
A,
B,
C,
D,
E) in heading error model (4) as the state variables of the system and taking the heading error value as the measured vector of the system, conducting real-time estimation of the heading error. Based on the analysis above, complete real-time heading error compensation course based on Kalman filter algorithm was given in
Appendix.
Several key variables of Kalman filter is designed as follows,the state vector is defined as the five calibration coefficients in formula (4):
The equation of state is defined as:
The measurement vector is defined as:
The
FPH represents the actual heading obtained from the building geometric direction and the
OriH is the original heading value coming from the cellphone reading. State vector coefficient is defined as:
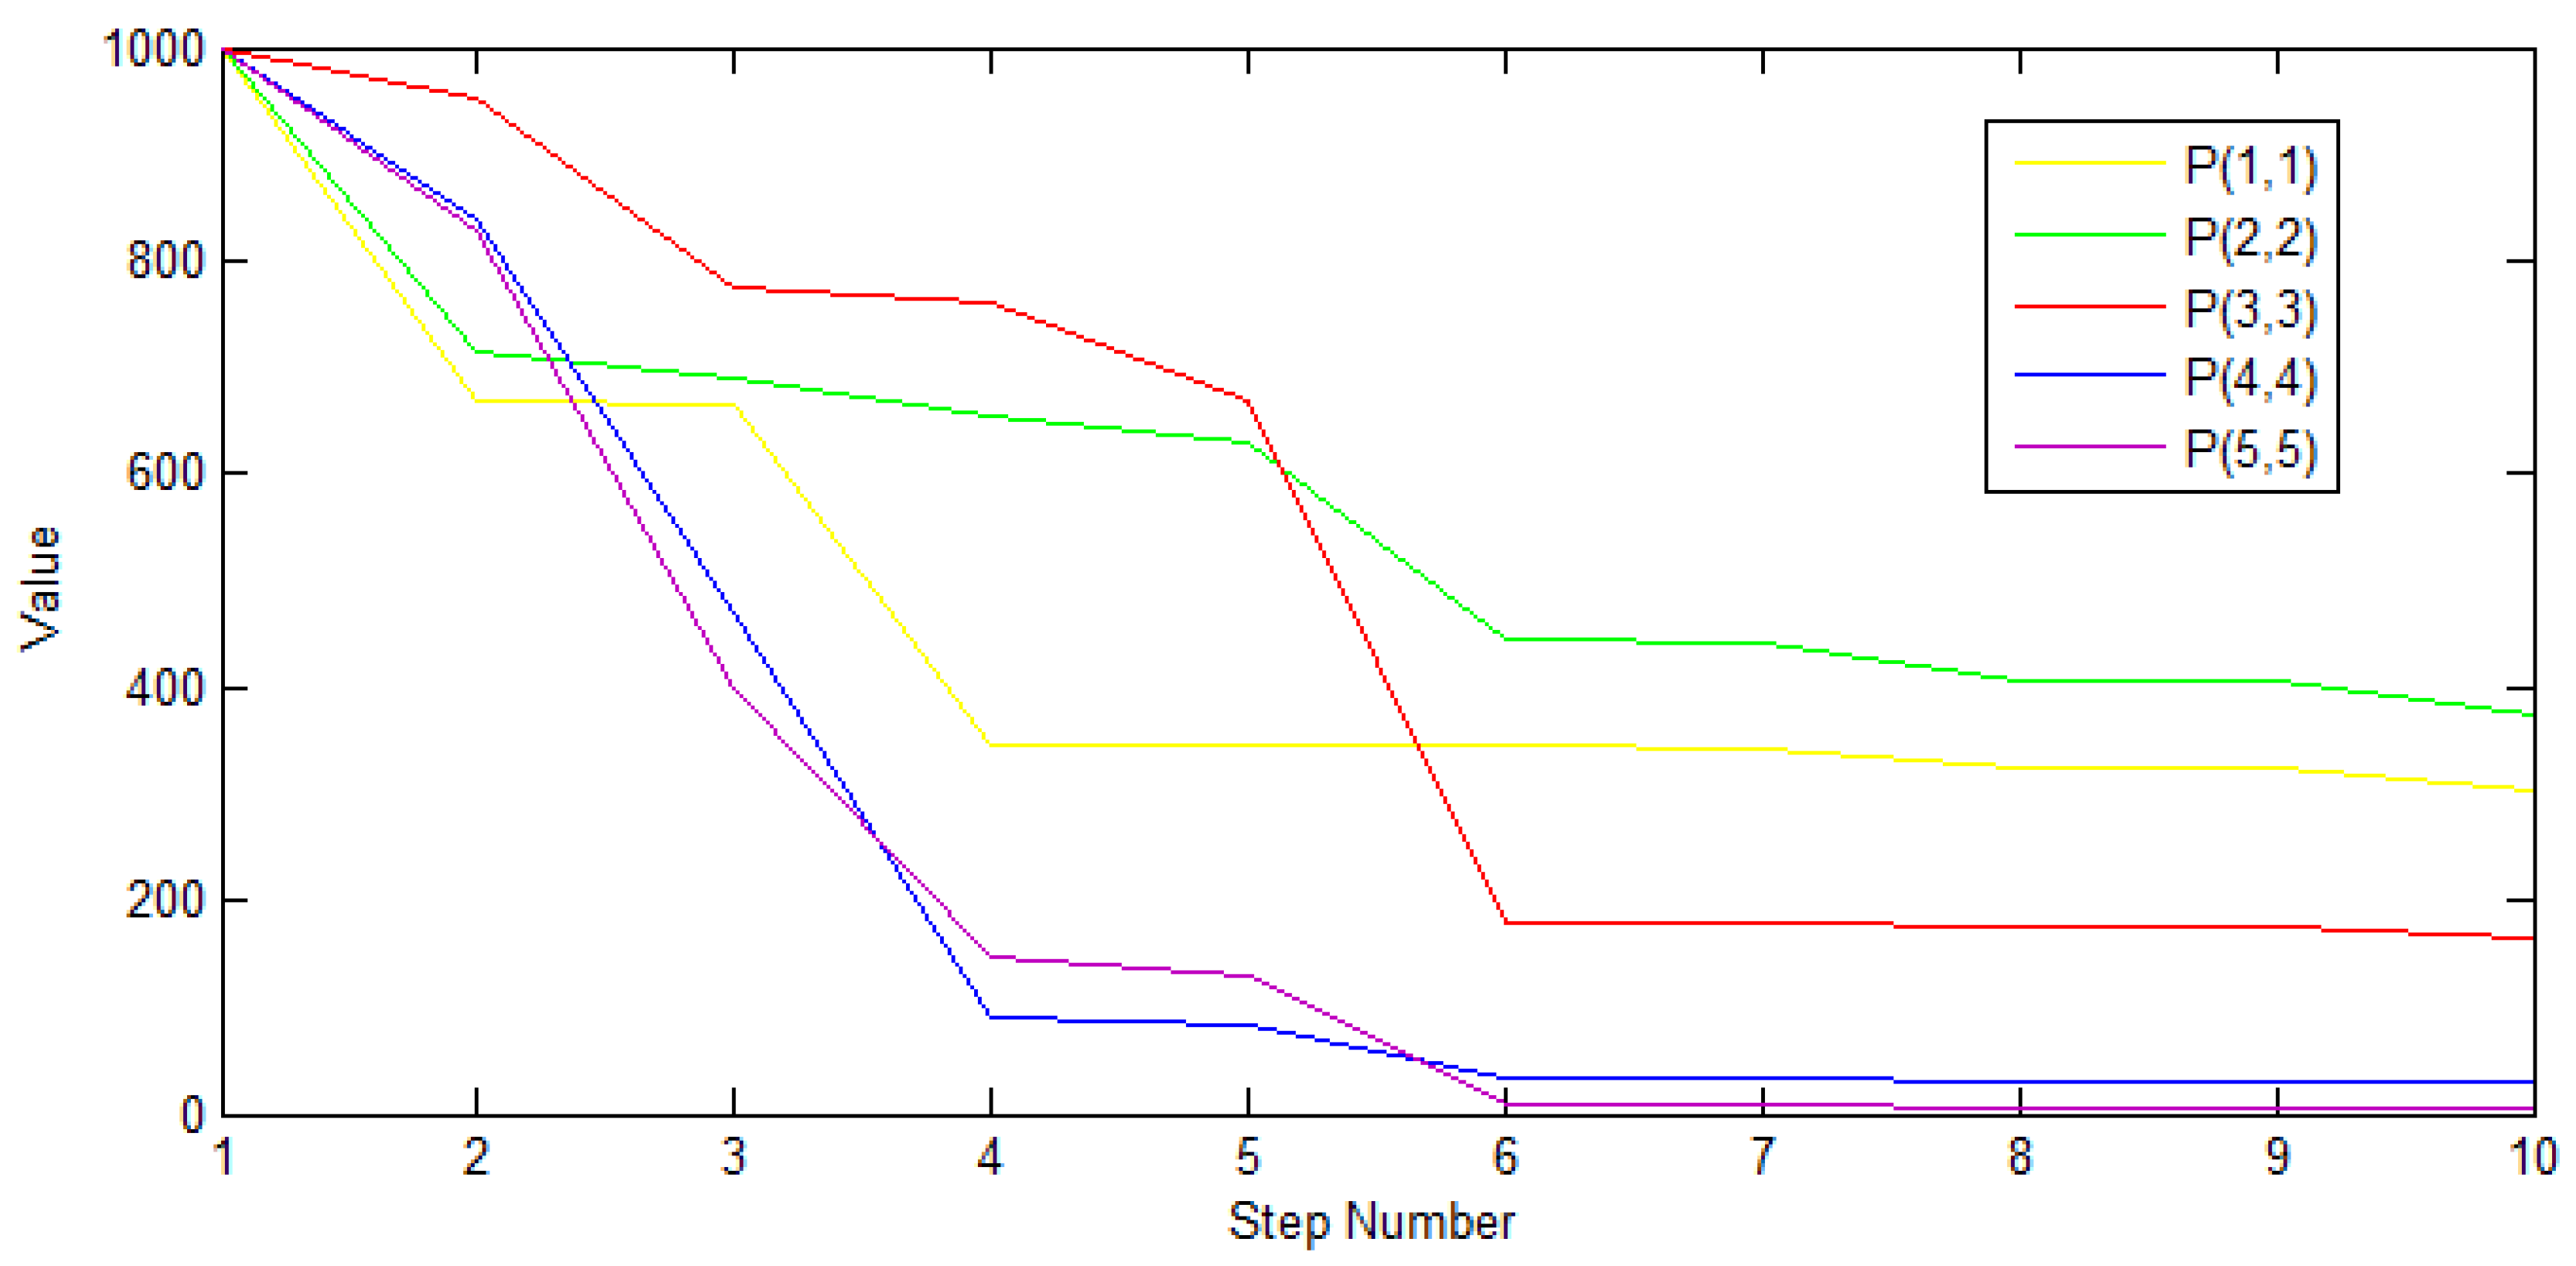
Actually, H is the extraction matrix. Selection of initial state vector:; state vector estimation variance matrix P is set to be the diagonal matrix with the value for the diagonal elements of 1000; dynamic noise matrix Q is set to be the diagonal matrix with the value for the diagonal elements of 0.0001; measurement noise matrix R is set to be the diagonal matrix with the value for the diagonal elements of 0.0001. Basically, training of the first 10~15 gait heading data for straight line motion meets the convergence requirements.
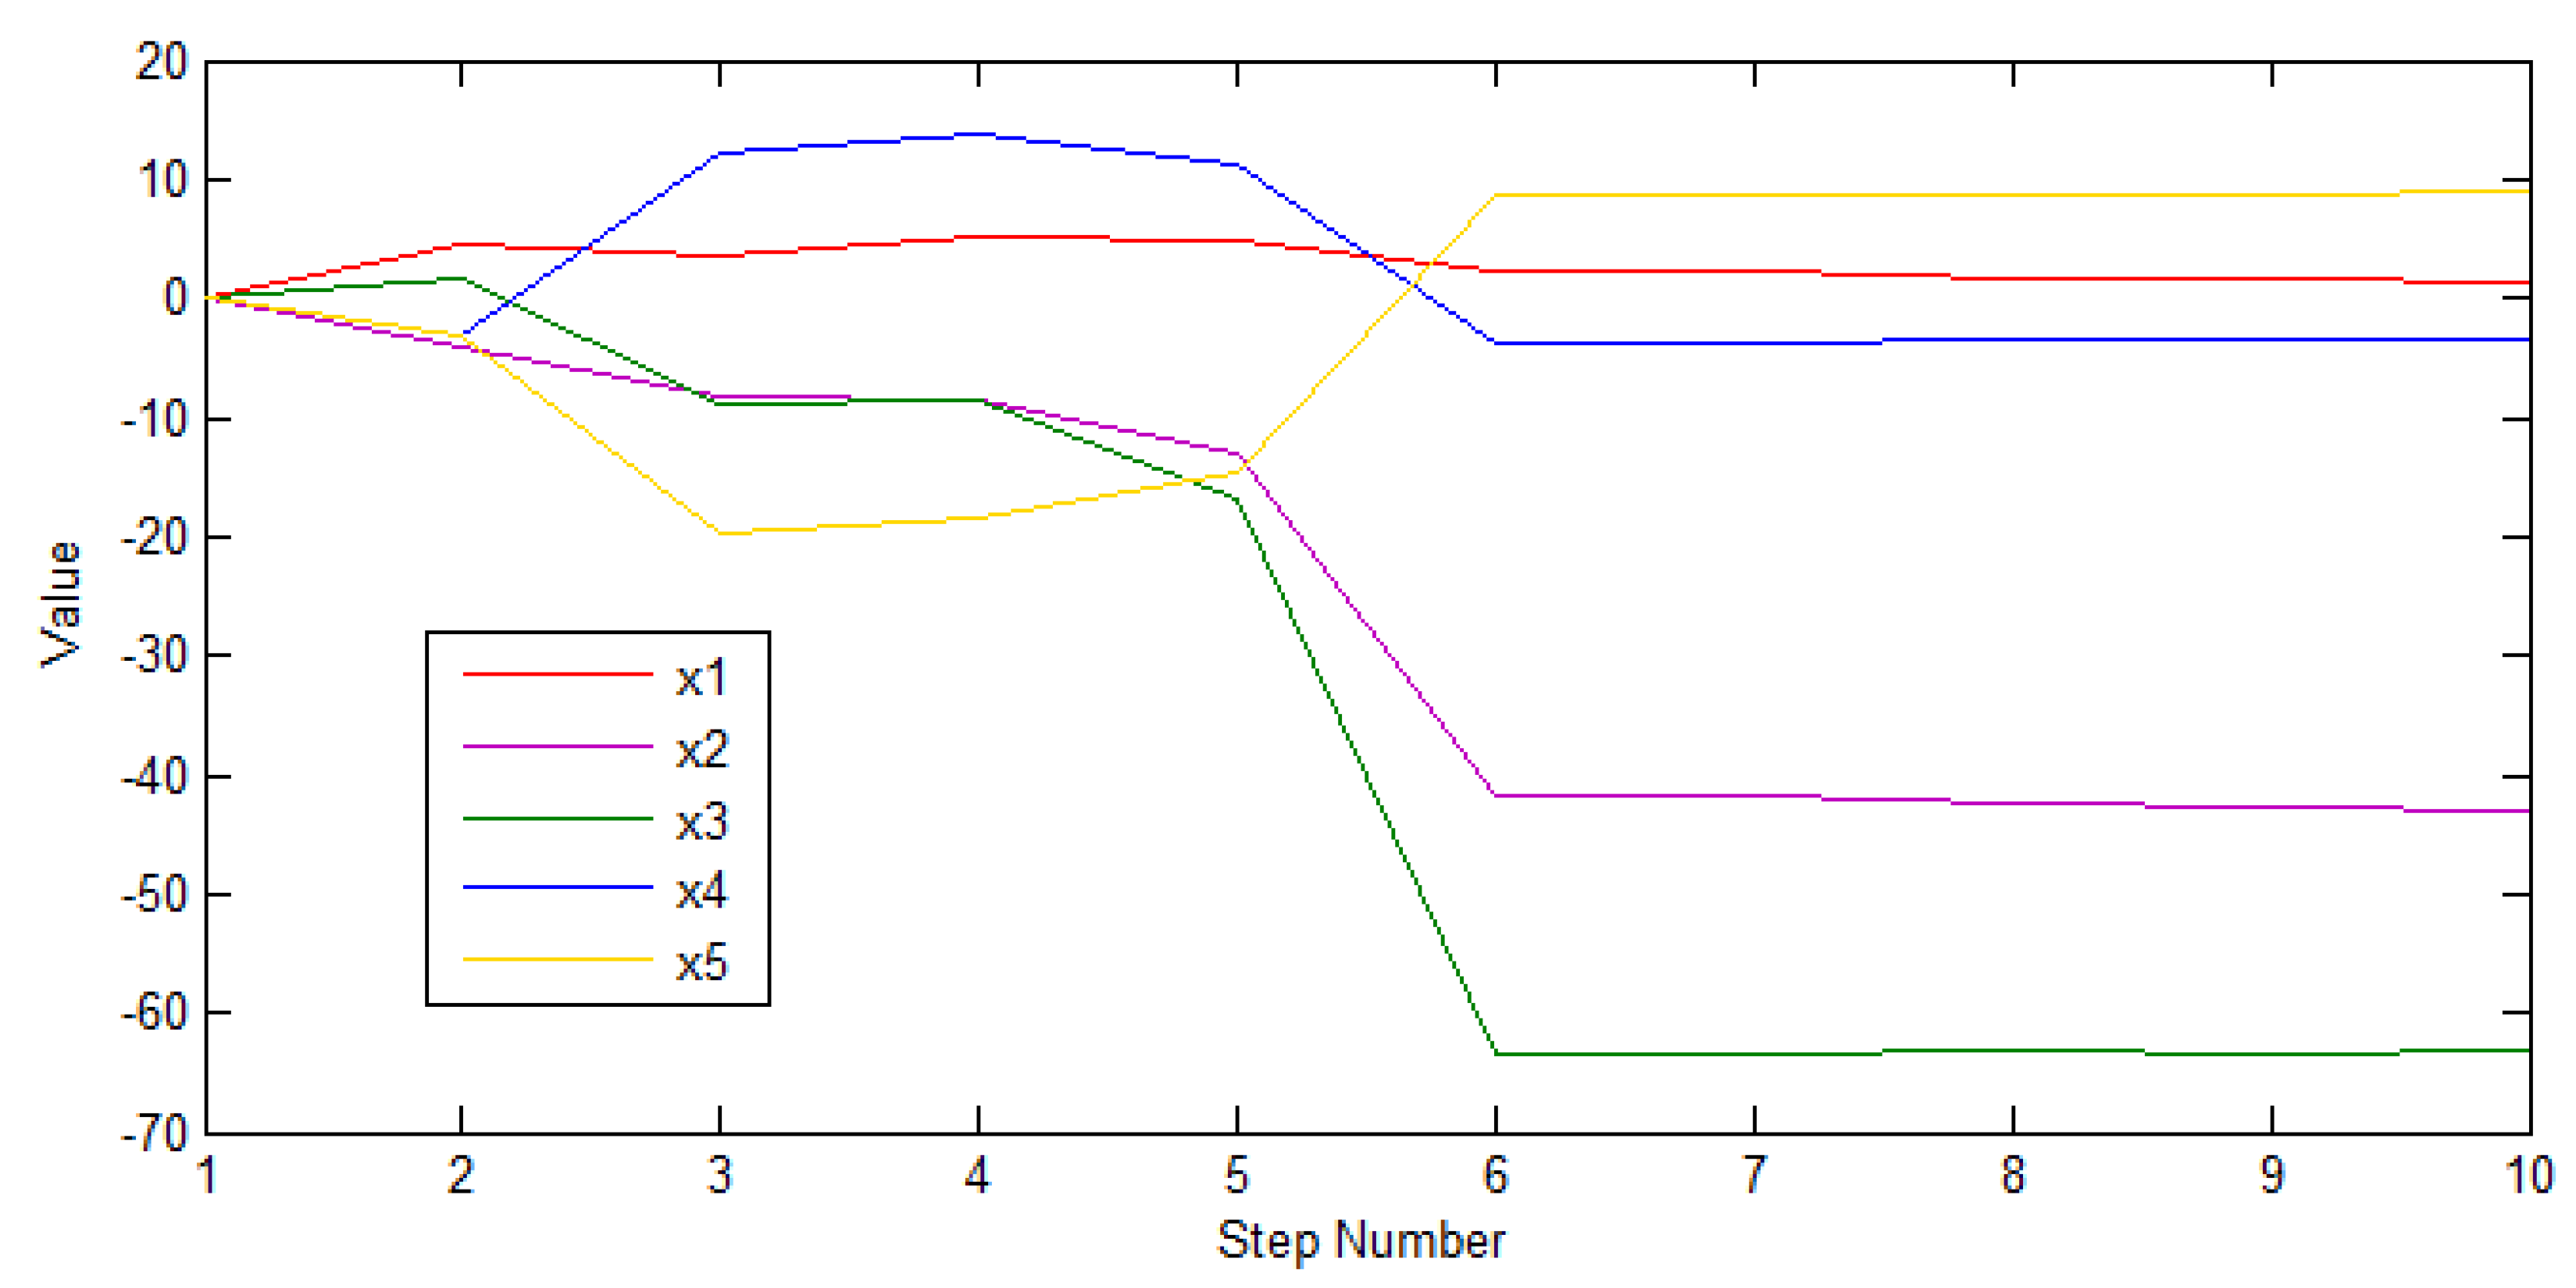
P is set based on the experience. It is generally set to be a large value, so as to guarantee the algorithm convergence. In this paper, it is set to be a matrix with the initial value of 1000 for 5 × 5 diagonal elements. As can be seen from
Figure 6, the diagonal element value of
P decreases rapidly and then tends to be stable for the first 5 steps. It corresponds to the elements of state vector
X in
Figure 7, namely change between two adjacent states is relatively small after 5 steps.
4. Experiment
A test field has been constructed on the fourth floor of the School of Environmental Science and Spatial Informatics (SESSI) building in China University of Mining and Technology (CUMT) with the selection of Samsung Galaxy Note3 as the mobile testing device. The phone's built-in IMU is MPU 6050, which includes 3-axis accelerometer, gyroscope and magnetometer. Its sampling frequency is 100HZ. In the experiment, a pedestrian walks from the westernmost C area to B area passing A area at a constant speed. In the walking process, the pedestrian holds his mobile phone steadily at level, walking a total of 314 steps.
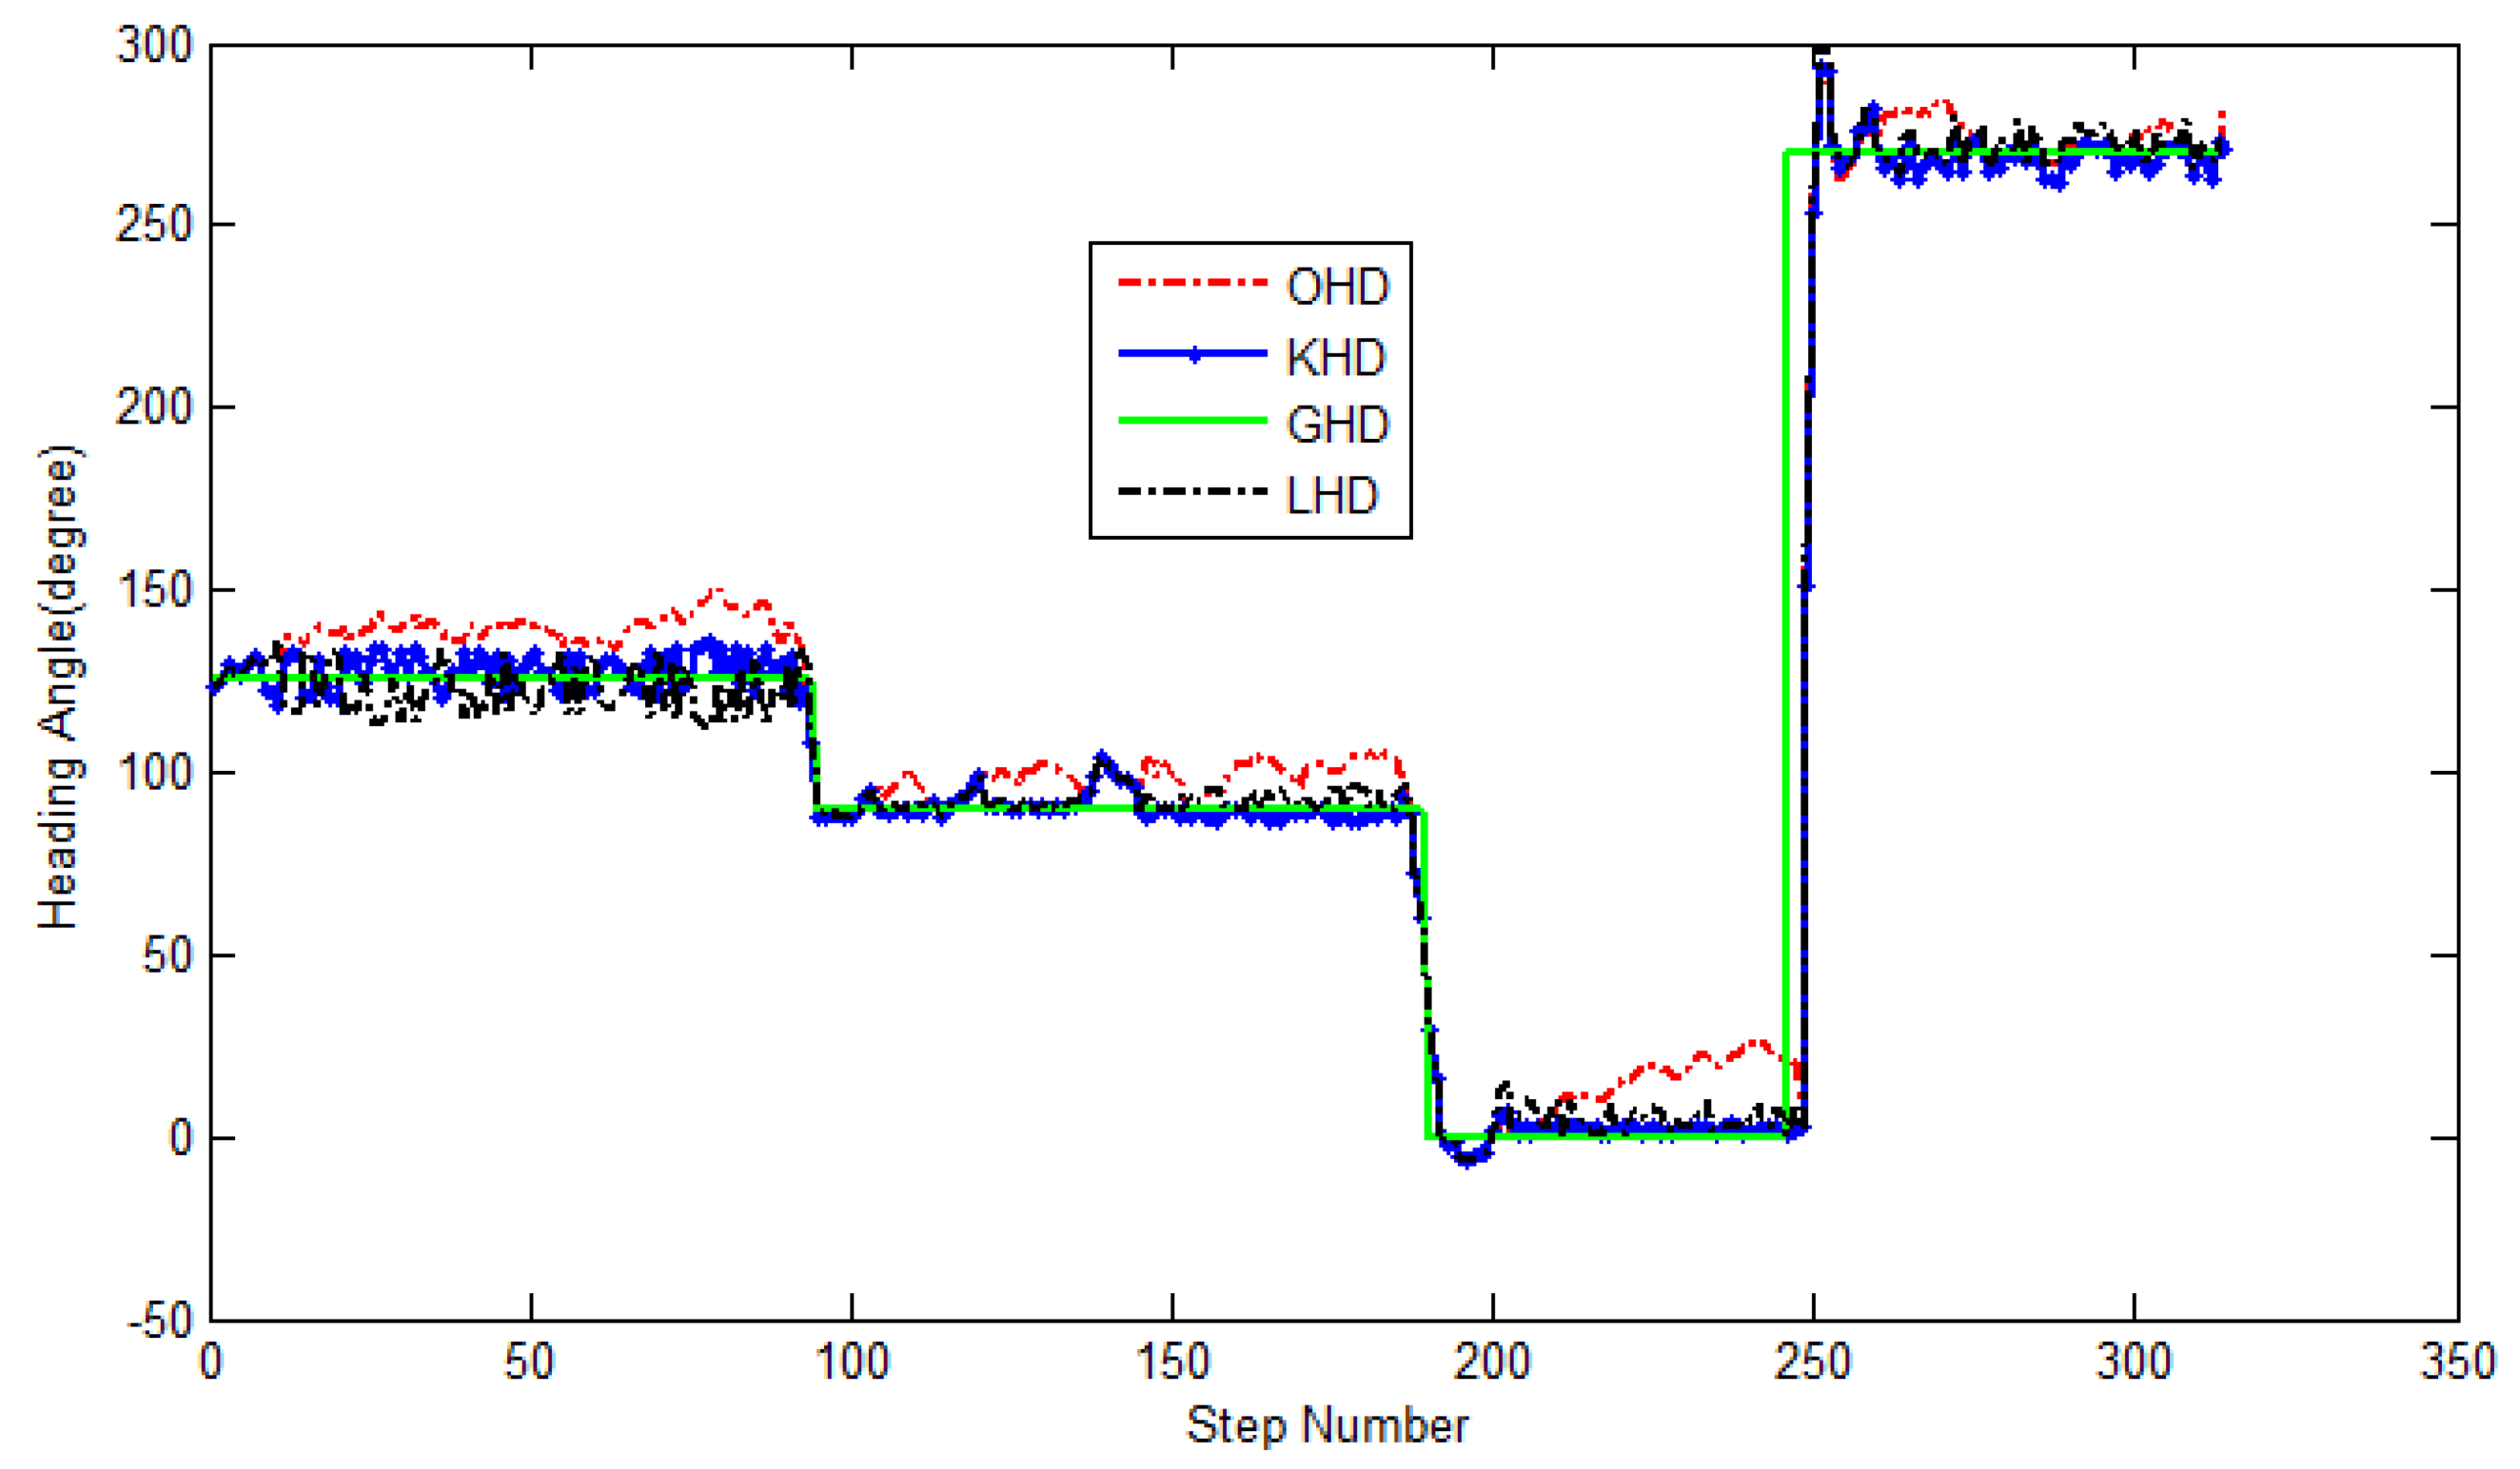
The four direction calculation methods are compared: in the first method, the direction value is acquired by original direction sensor of mobile phone, denoted as OHD; in the second method, the direction error is restricted by map matching, denoted as GHD; in the third method, real-time compensation is made for direction error based on the least squares algorithm, denoted as LHD; in the fourth method, real-time compensation is made for direction error based on Kalman filtering algorithm, denoted by KHD.
4.1. Analysis of Heading Error
The pedestrian walks along the corridor specified by arrow in
Figure 5 from the westernmost of Zone C on the fourth floor of the SESSI building. According to the geographic direction, heading angle turns from 125° to 90°, then from 90° to 0°, and then from 0° to 270°.
Figure 8 shows the results of heading calculation of various algorithms.
Table 1 further lists the heading error information of various algorithms. Independent analysis are conducted for the heading of four straight lines, and
Table 1 shows that: the mean error of KHD algorithm is 36.3%, 15.7%, 16.9% and 57.8% that of OHD respectively; the maximum heading error is 30.7%, 23.7%, 20.8% and 88.9% that of OHD respectively, and the minimum absolute error is within 0.3°. The angle error of LHD algorithm is between those of KHD and OHD.
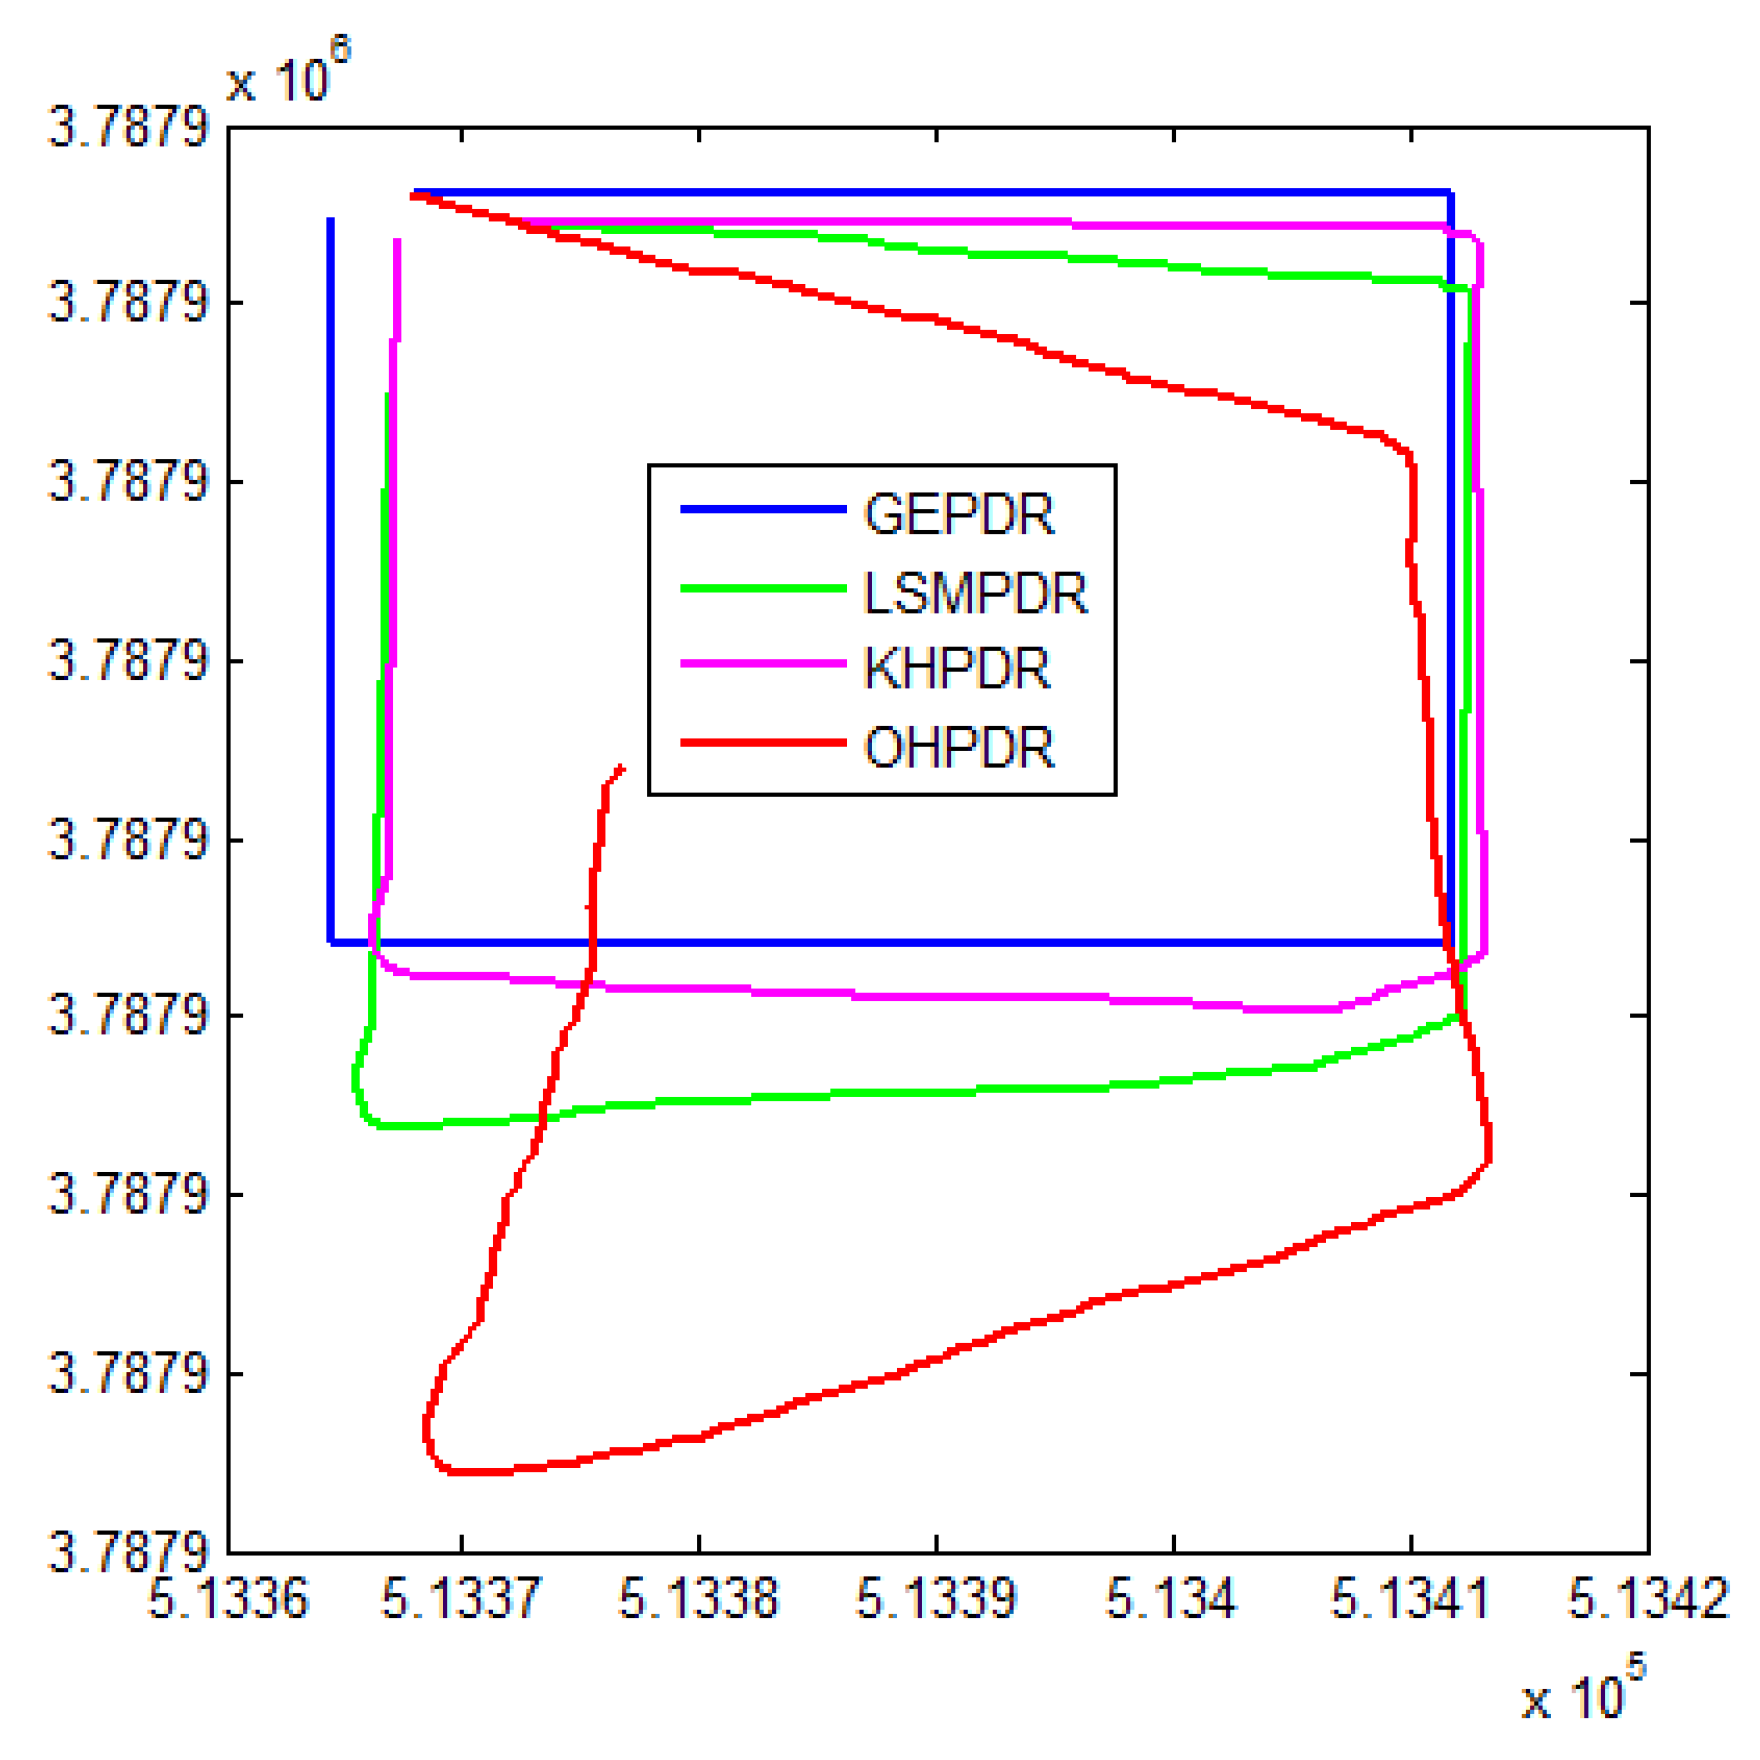
4.2. PDR-Based Positioning Trajectory Analysis
Four PDR algorithms, namely OHPDR, LSMPDR, KHPDR and GEPDR were defined, respectively, according to the above proposed four directions of OHD, LHD, KHD and GHD.
The walking trajectory predetermined is marked as Ground True, and the starting position is set with the error of about 2 m which is determined by the results of WIFI positioning from the true position.
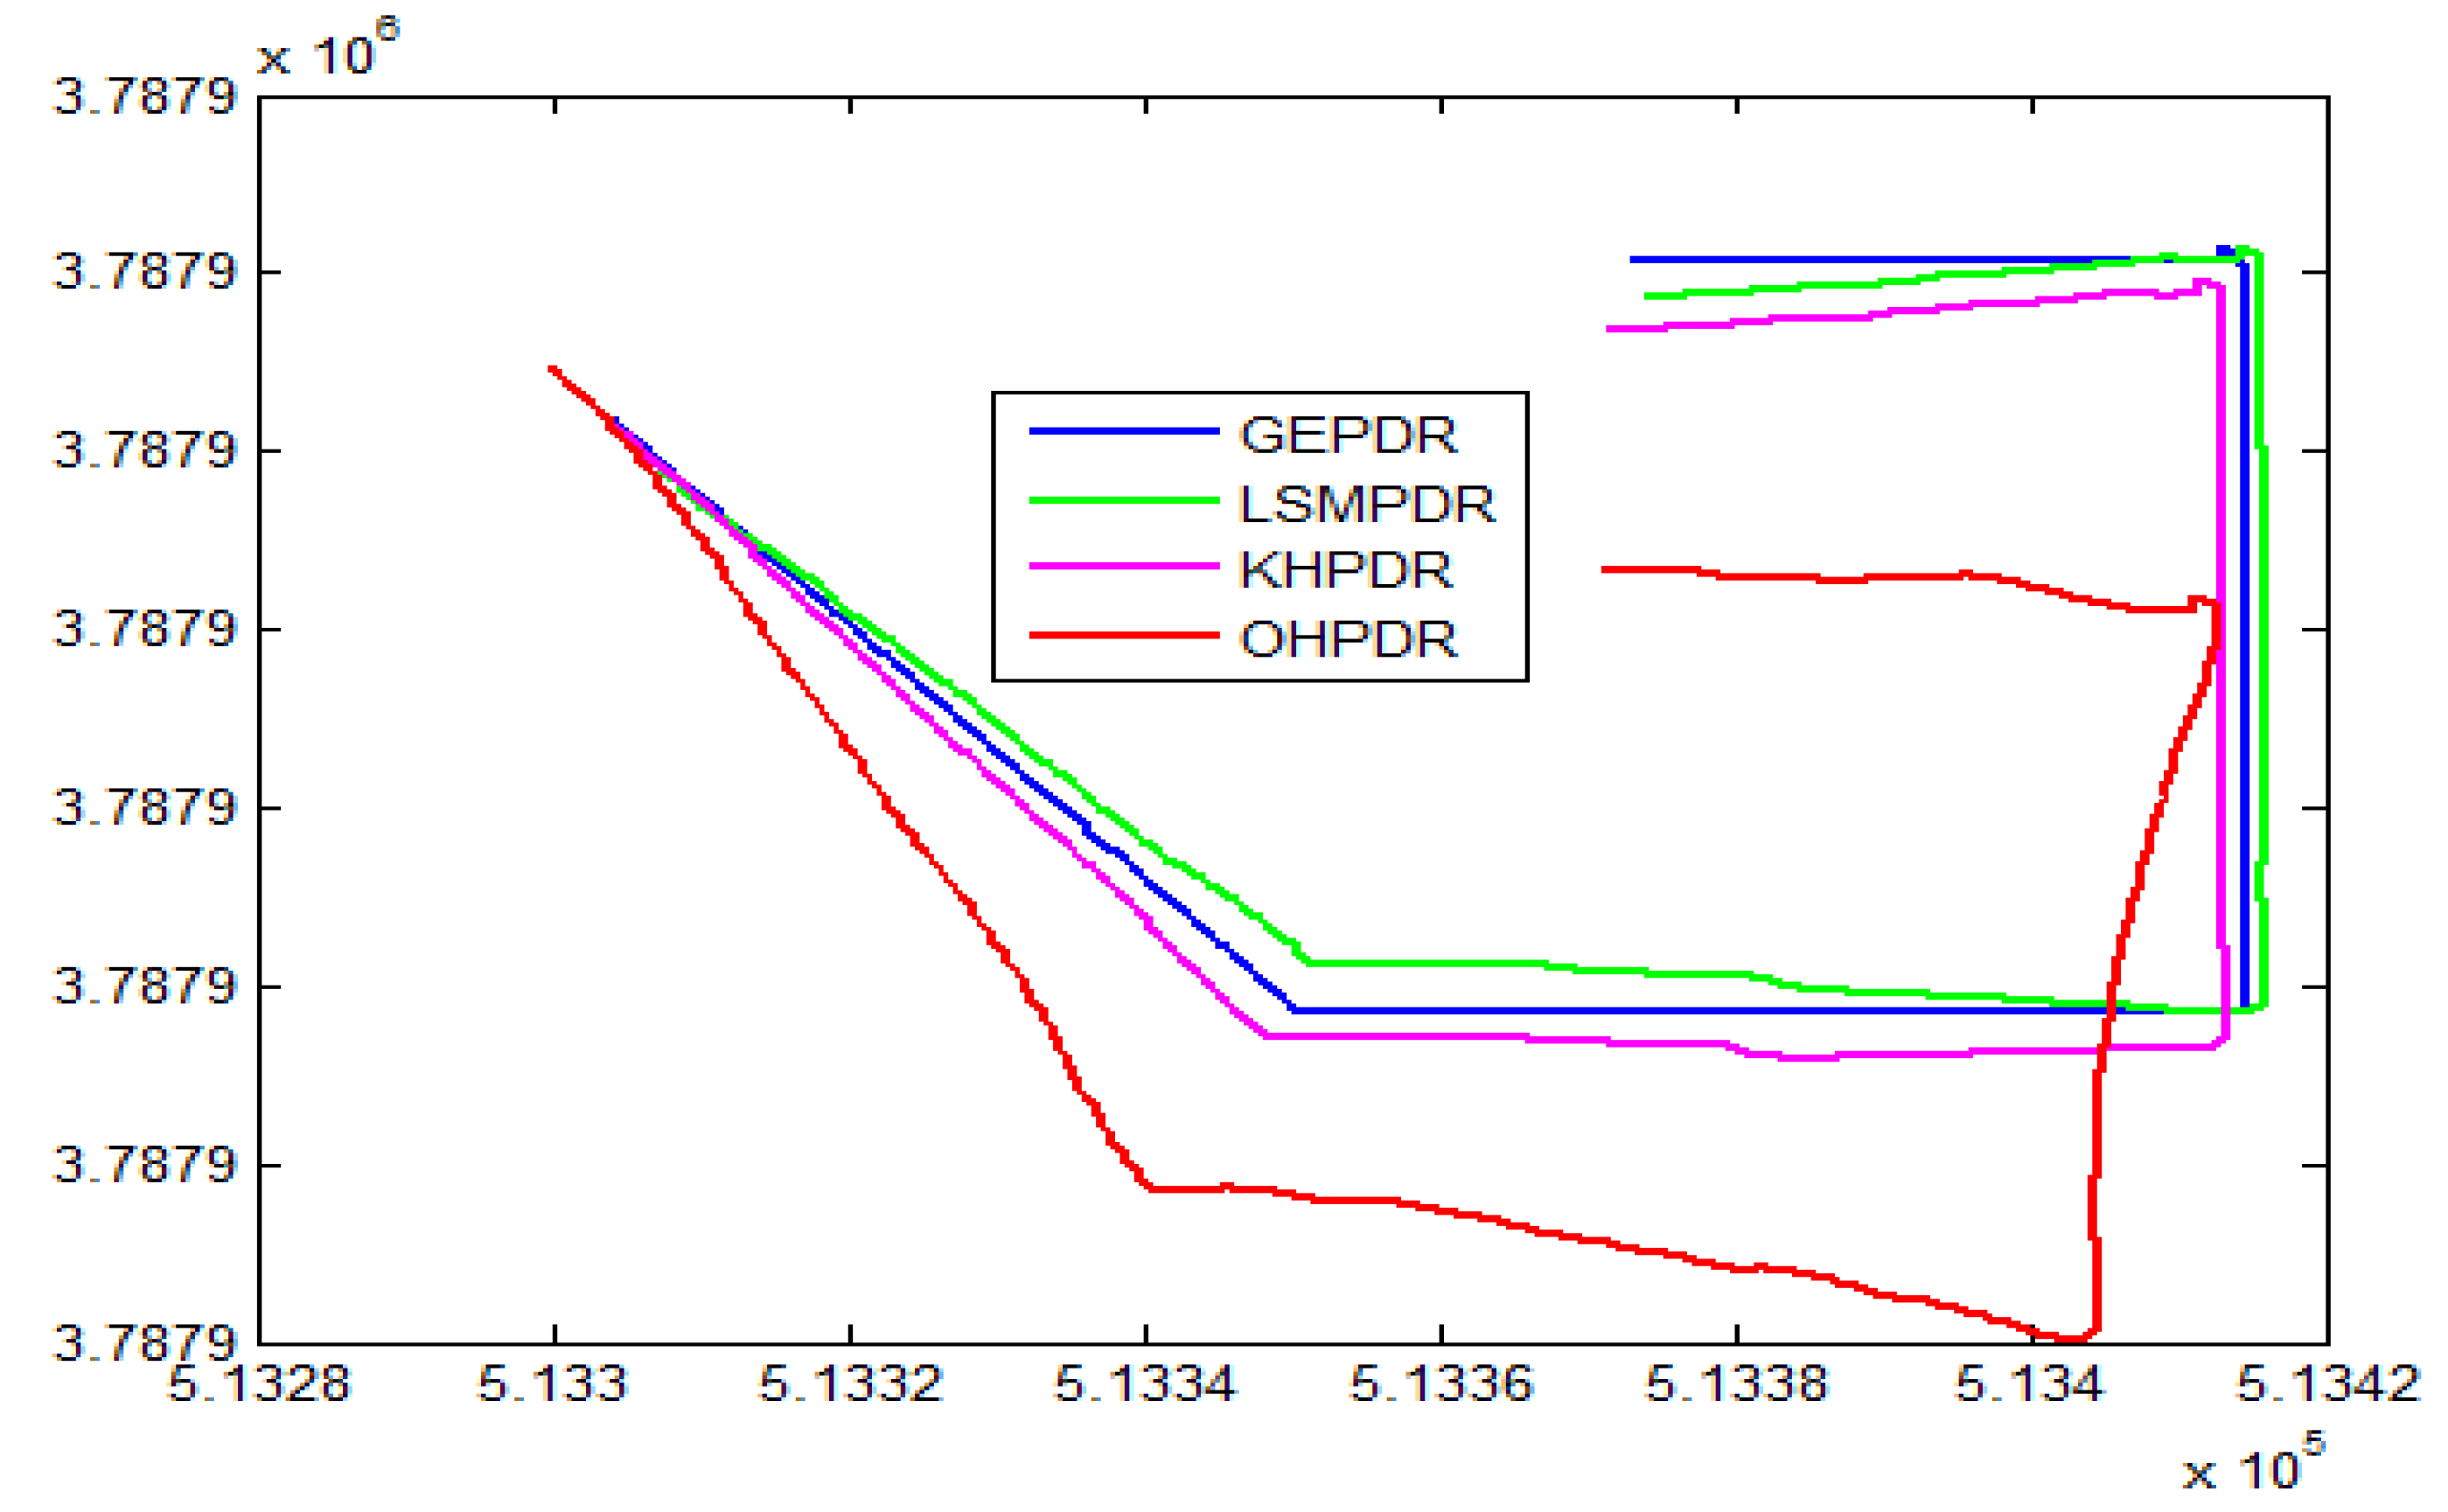
Figure 9 shows the calculation trajectory of the four solutions.
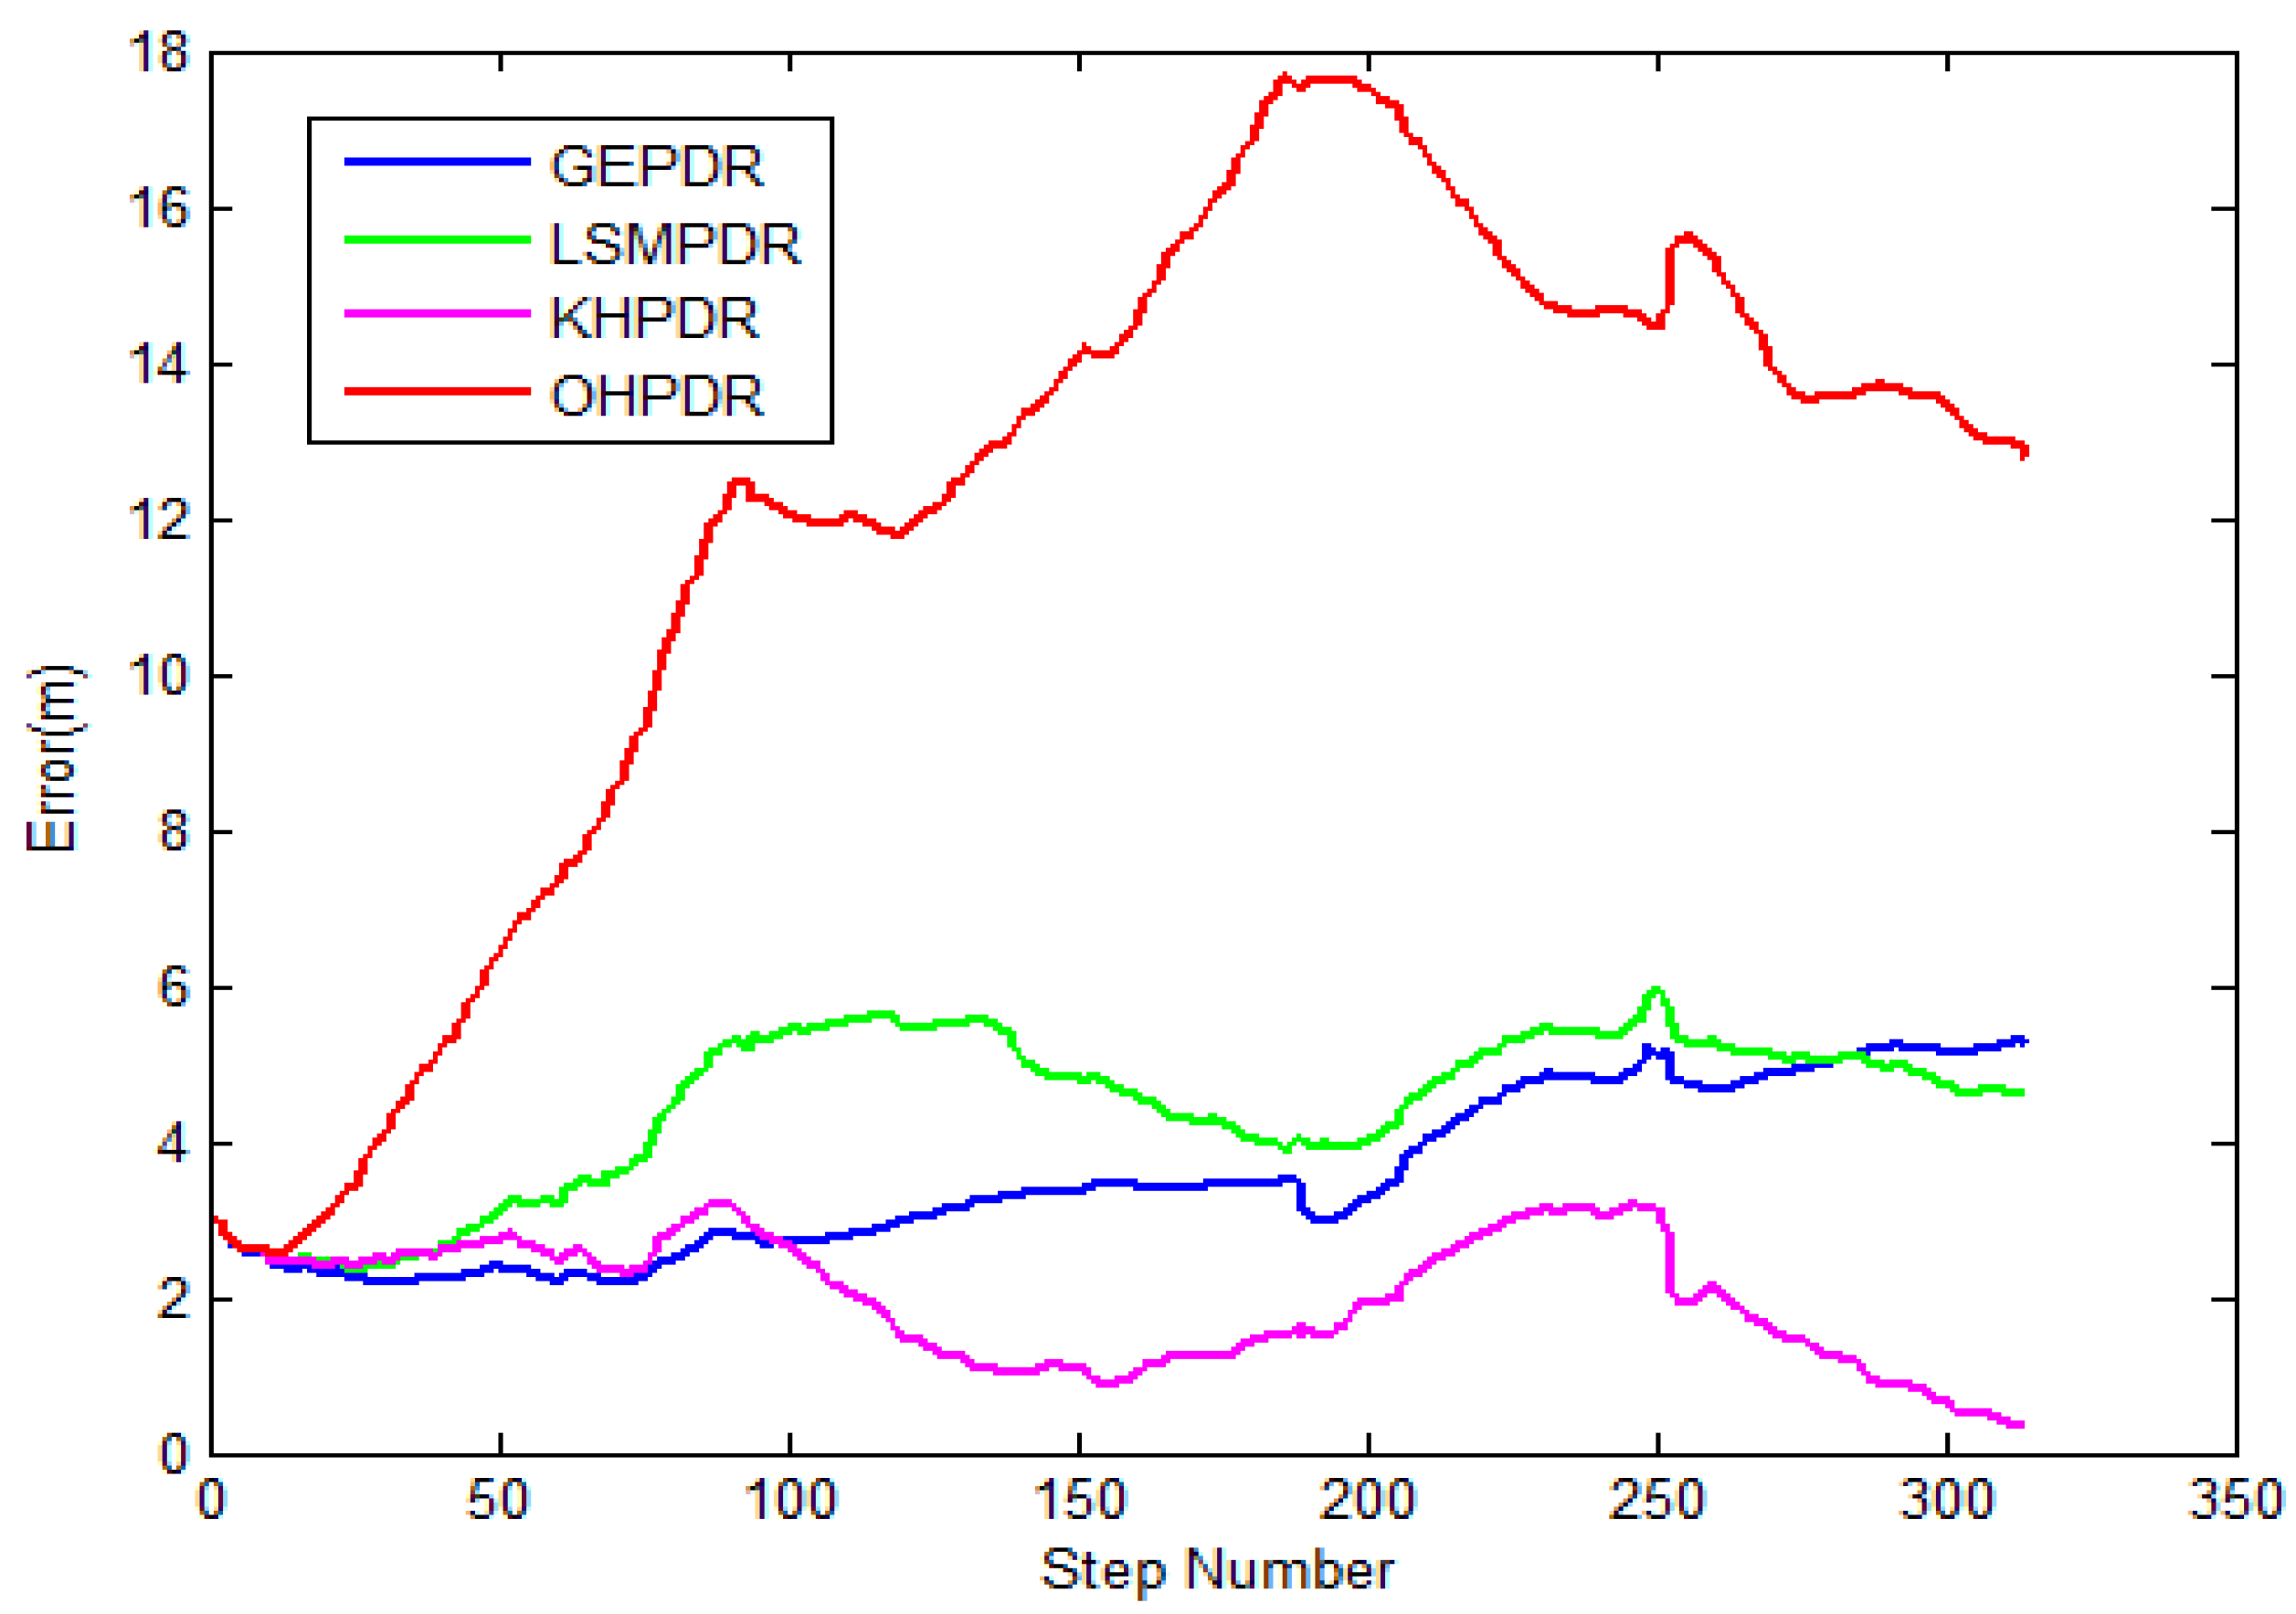
Figure 10 and
Table 2 show the positioning errors arising in the above four solutions.
The trajectory of OHPDR is in red, as shown in
Figure 9. Within the range of the first 200 steps or so, the error has been accumulated from the initial 2.56 m to 22.67 m. Subsequently, the error is slightly decreased, but the mean error reaches 12.03 m. Because of the heading error, this solution completely deviates from the true trajectory.
The trajectory of GEPDR is in blue. The walking direction value will be matched to the four known directions automatically according to the smallest difference method, just as in this experiment (such as 125°, 90°, 80° and 270°). The trajectory obtained through this approach is almost consistent with the geometry of the corridor, but compulsive direction constraints may make the walking trajectory different in a whole or even “through-wall”. In this experiment, the mean positioning error of the method is 3.52 m.
The trajectory of LSMPDR is in green. This method adopts the first ten steps in each straight gait as the direction training data, and uses the least squares algorithm for error solution and real-time compensation. In the experiment, the mean positioning error of this method is 4 m, and the maximum error of only 5.97 m, indicating that this method reduces the cumulative error to a certain extent.
The trajectory of KHPDR is in pink. The positioning result of this method is the best one among the four methods. The mean positioning error is controlled within about 2 m, and it does not change sharply with the extension of the positioning time. Compared with the other three methods, this method significantly reduces the error in the mean value, minimum value and maximum value, decreased by 80.7%, 34.5% and 47.8%; 87.5%, 85.1% and 86.3%; 83.1%, 27.3% and 35.6% respectively.
4.3. Comprehensive Error Analysis Based on the Four PDR Algorithms.
Comprehensive error analysis was conducted in C–B area, B-C area on the 5th floor and a rectangular corridor area on the 3rd floor. There were 4 boys and 2 females who participated in the experiment. The average age is 23 years old. Two males hold the height of about 1.80 m, about 1.75 m for another two males. One female holds a height of 1.62 m and the other one holds a height 1.58 m. In each experimental area, each person walked two times on average. All persons held mobile phones horizontally, and walked in normal gait. There were three obvious right turns from area B to C, three obvious left turns from area C to B, and three right turns with right angles in the trajectory on third floor. Standard deviation of the positioning error and root mean square deviation of the positioning results were recorded.
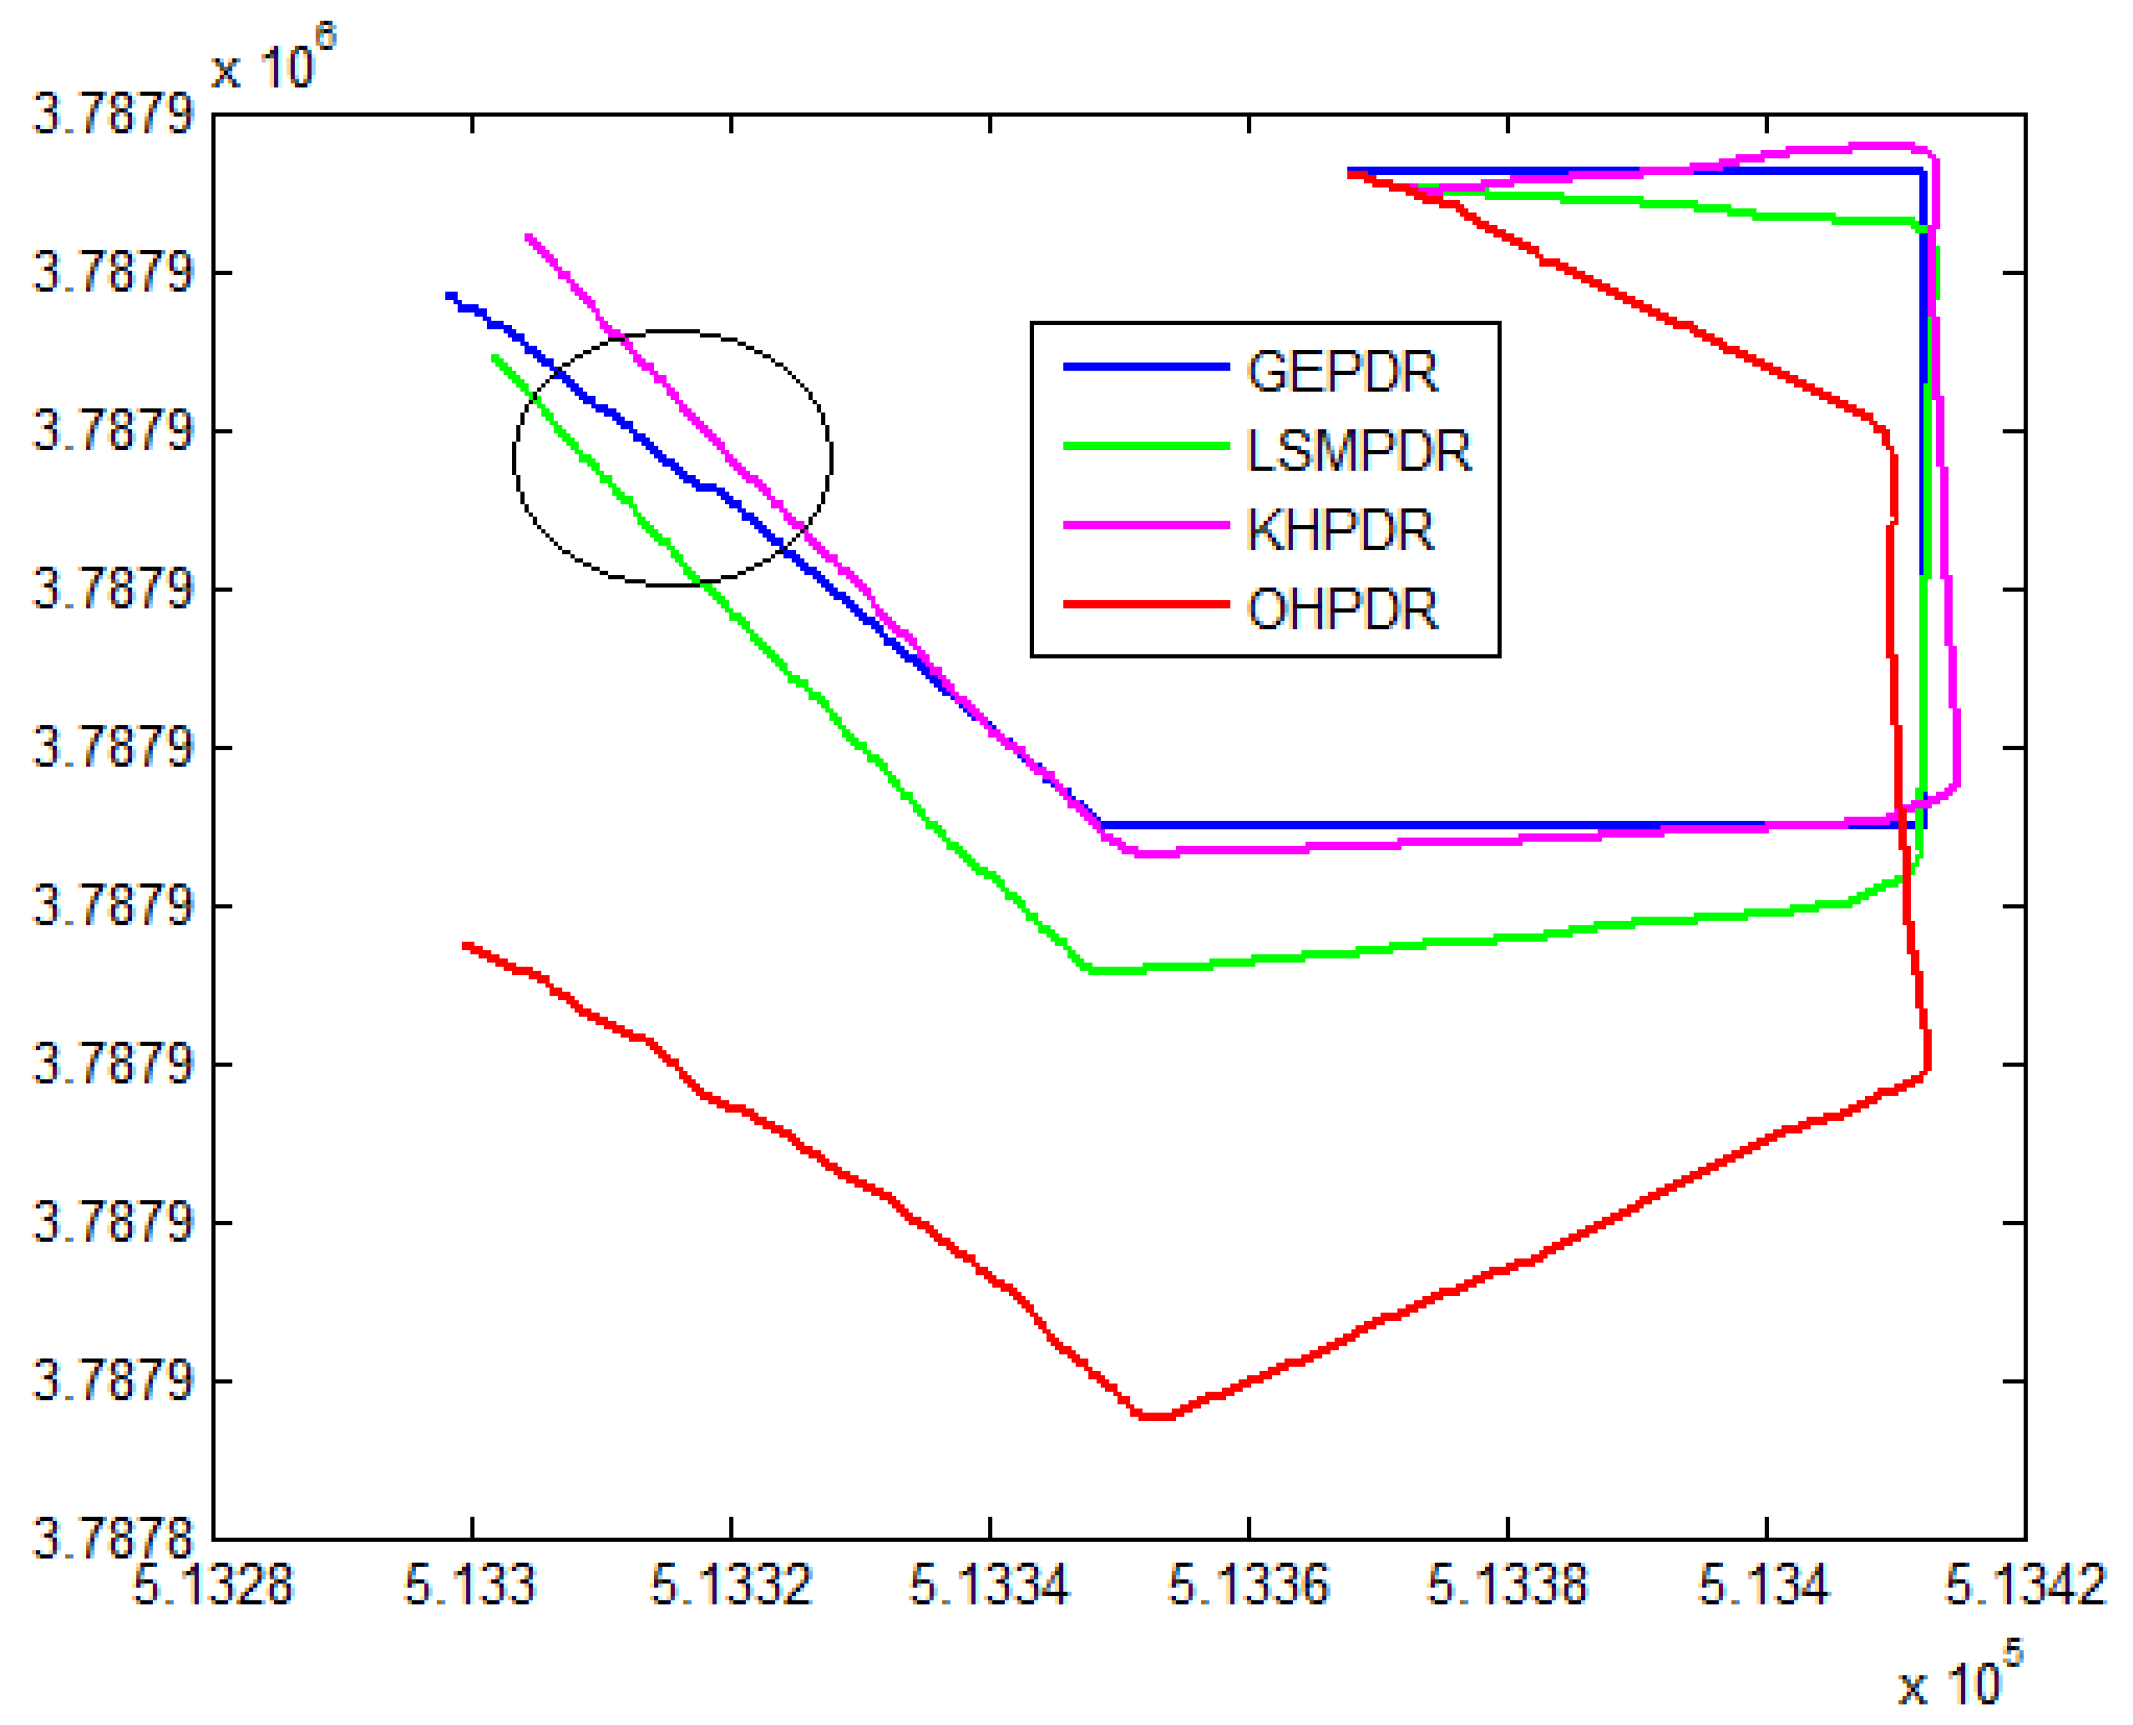
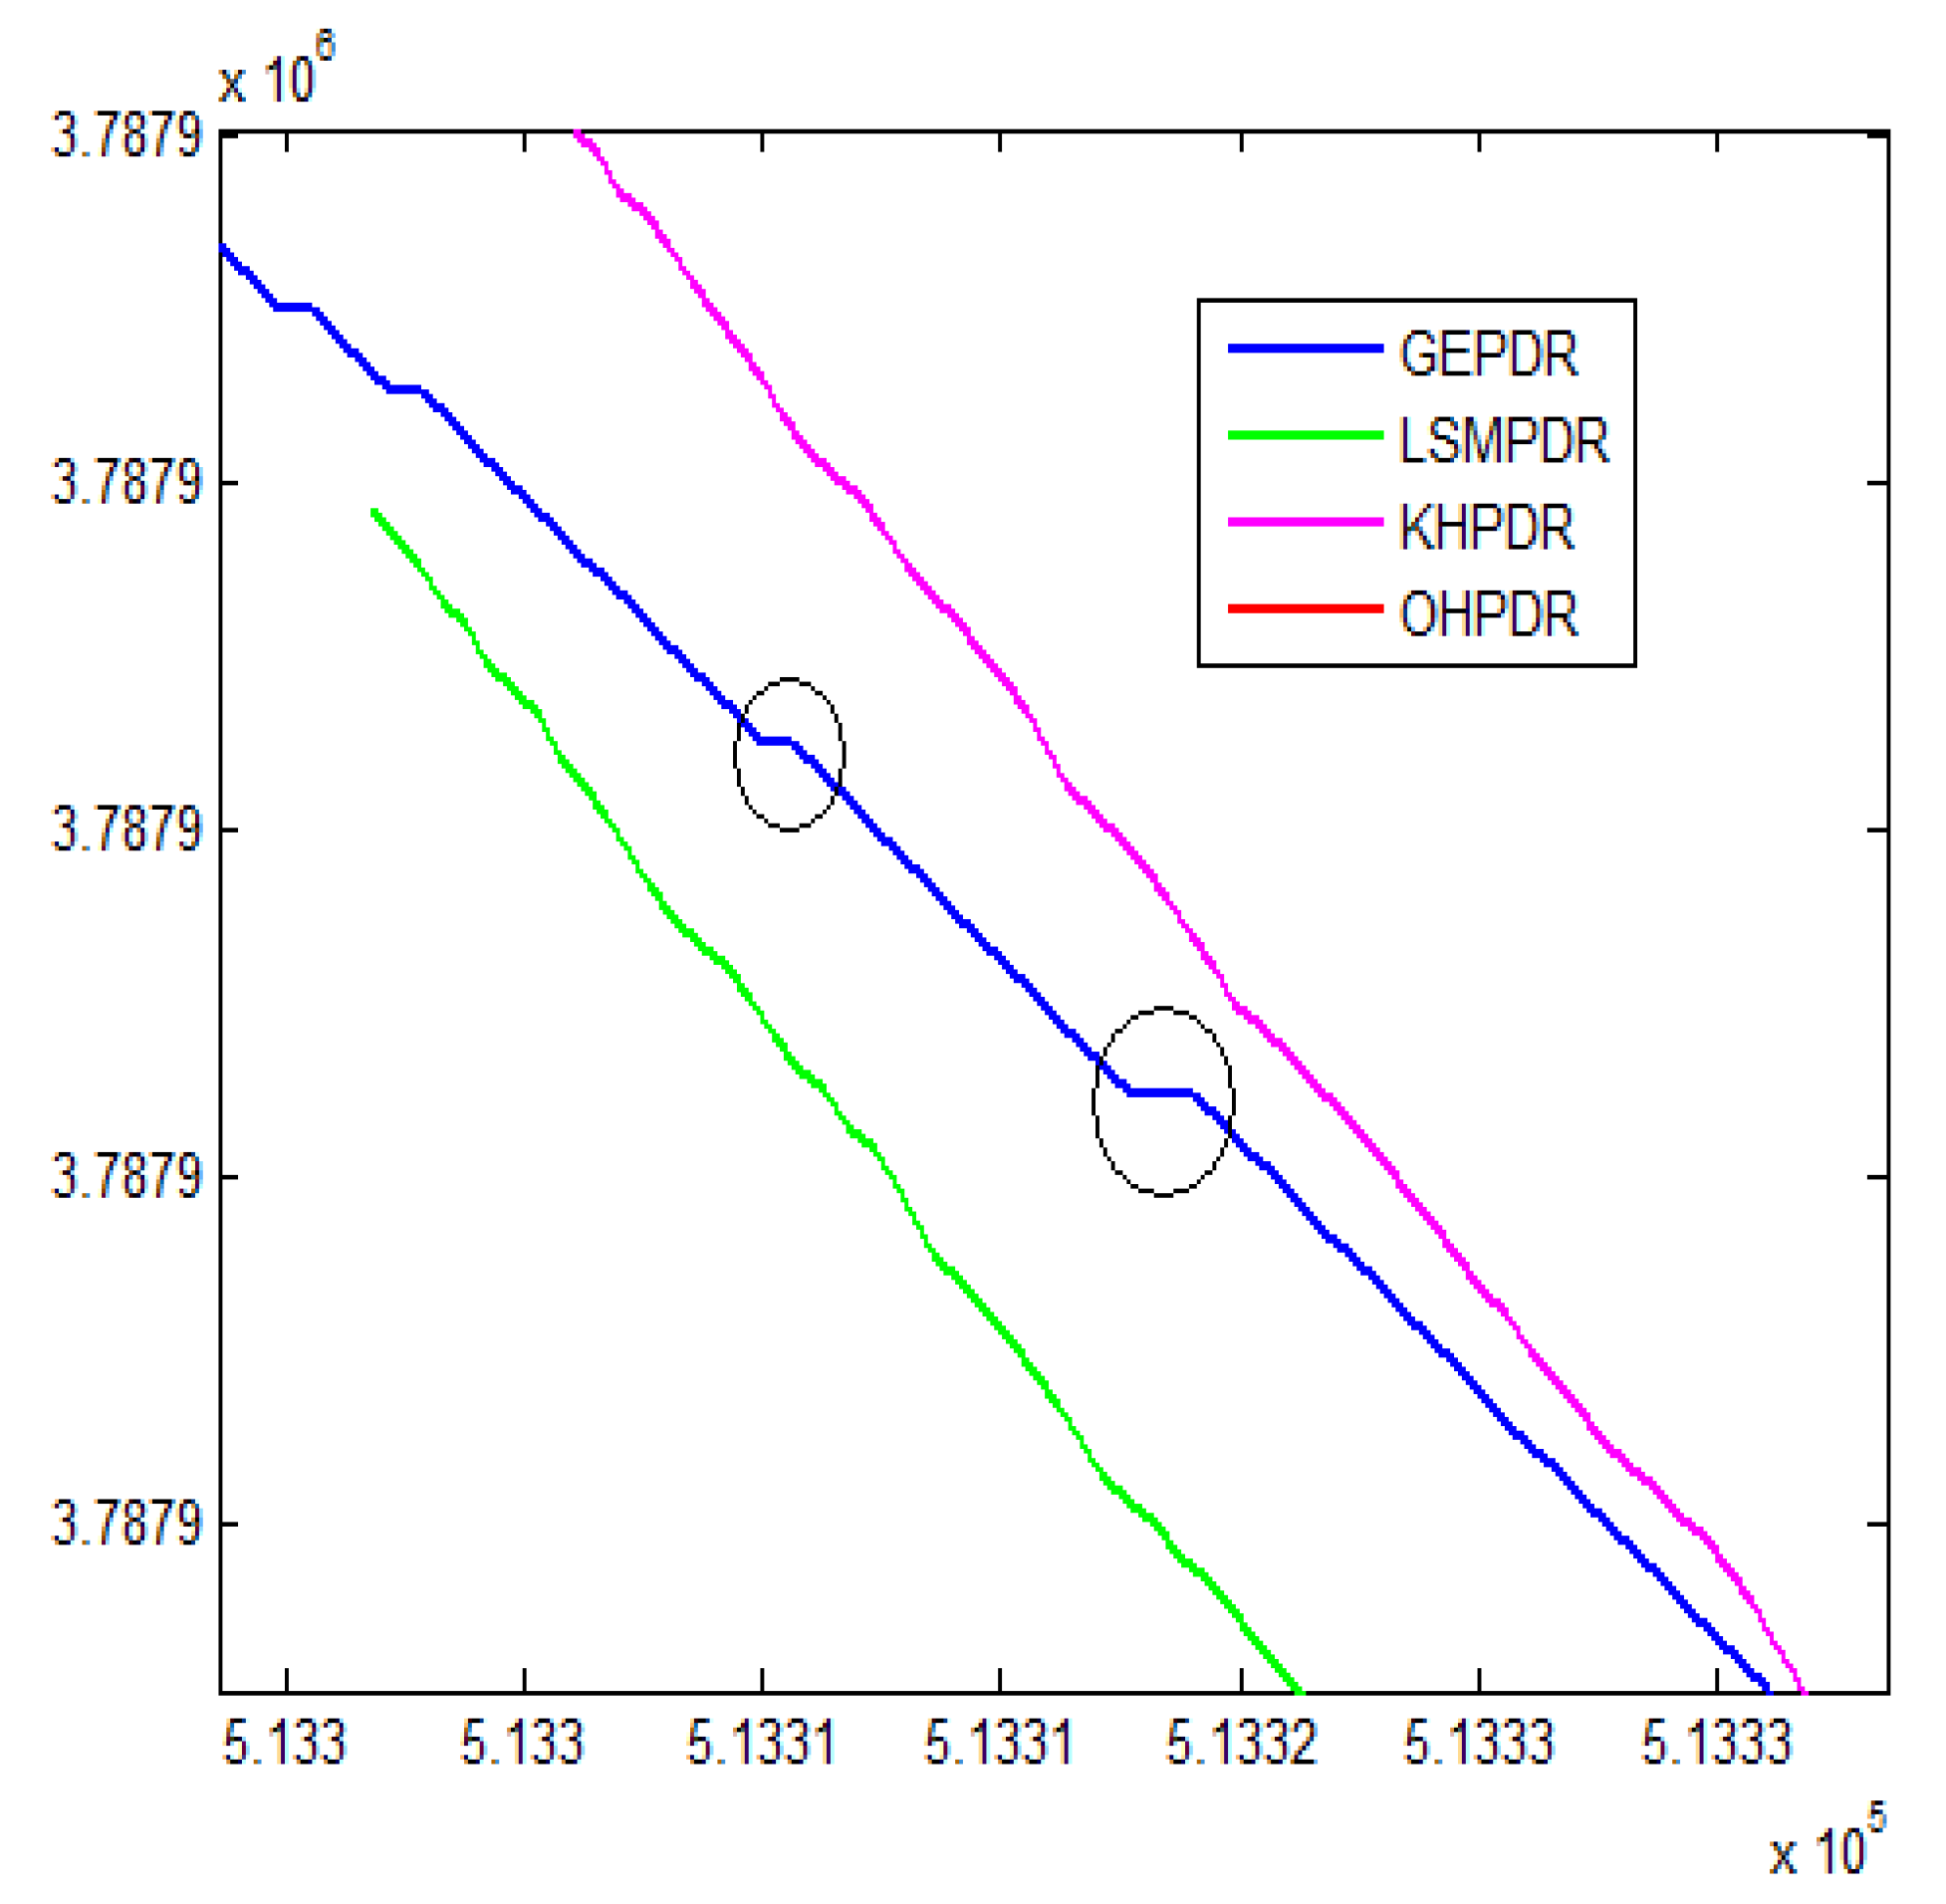
Figure 11,
Figure 12 and
Figure 13 show a walking trajectory.
From
Table 3,
Table 4 and
Table 5, we can see that the KFPDR method has the highest precision in general. As for the GHPDR method followed KFPDR in precision, there are two points to note:
(1) When the direction is fixed to the geometric direction, it itself will bring a certain error, because the actual direction of walk is only close to the geometric direction, so that this error will be amplified after accumulation for a long time.
(2) When the direction error of original gait is too large (see the circles in
Figure 11), the geometric constraint directly constrains the step direction to the horizontal left (See the circles in
Figure 12 for details), resulting in deviation in overall trajectory and increase in the positioning error.
For the LSMPDR method, it is a kind of global optimization, without taking into account the correlation between adjacent data. This is exactly the advantages of Kalman Filter method. Therefore, the positioning accuracy is only higher than OHPDR algorithm.
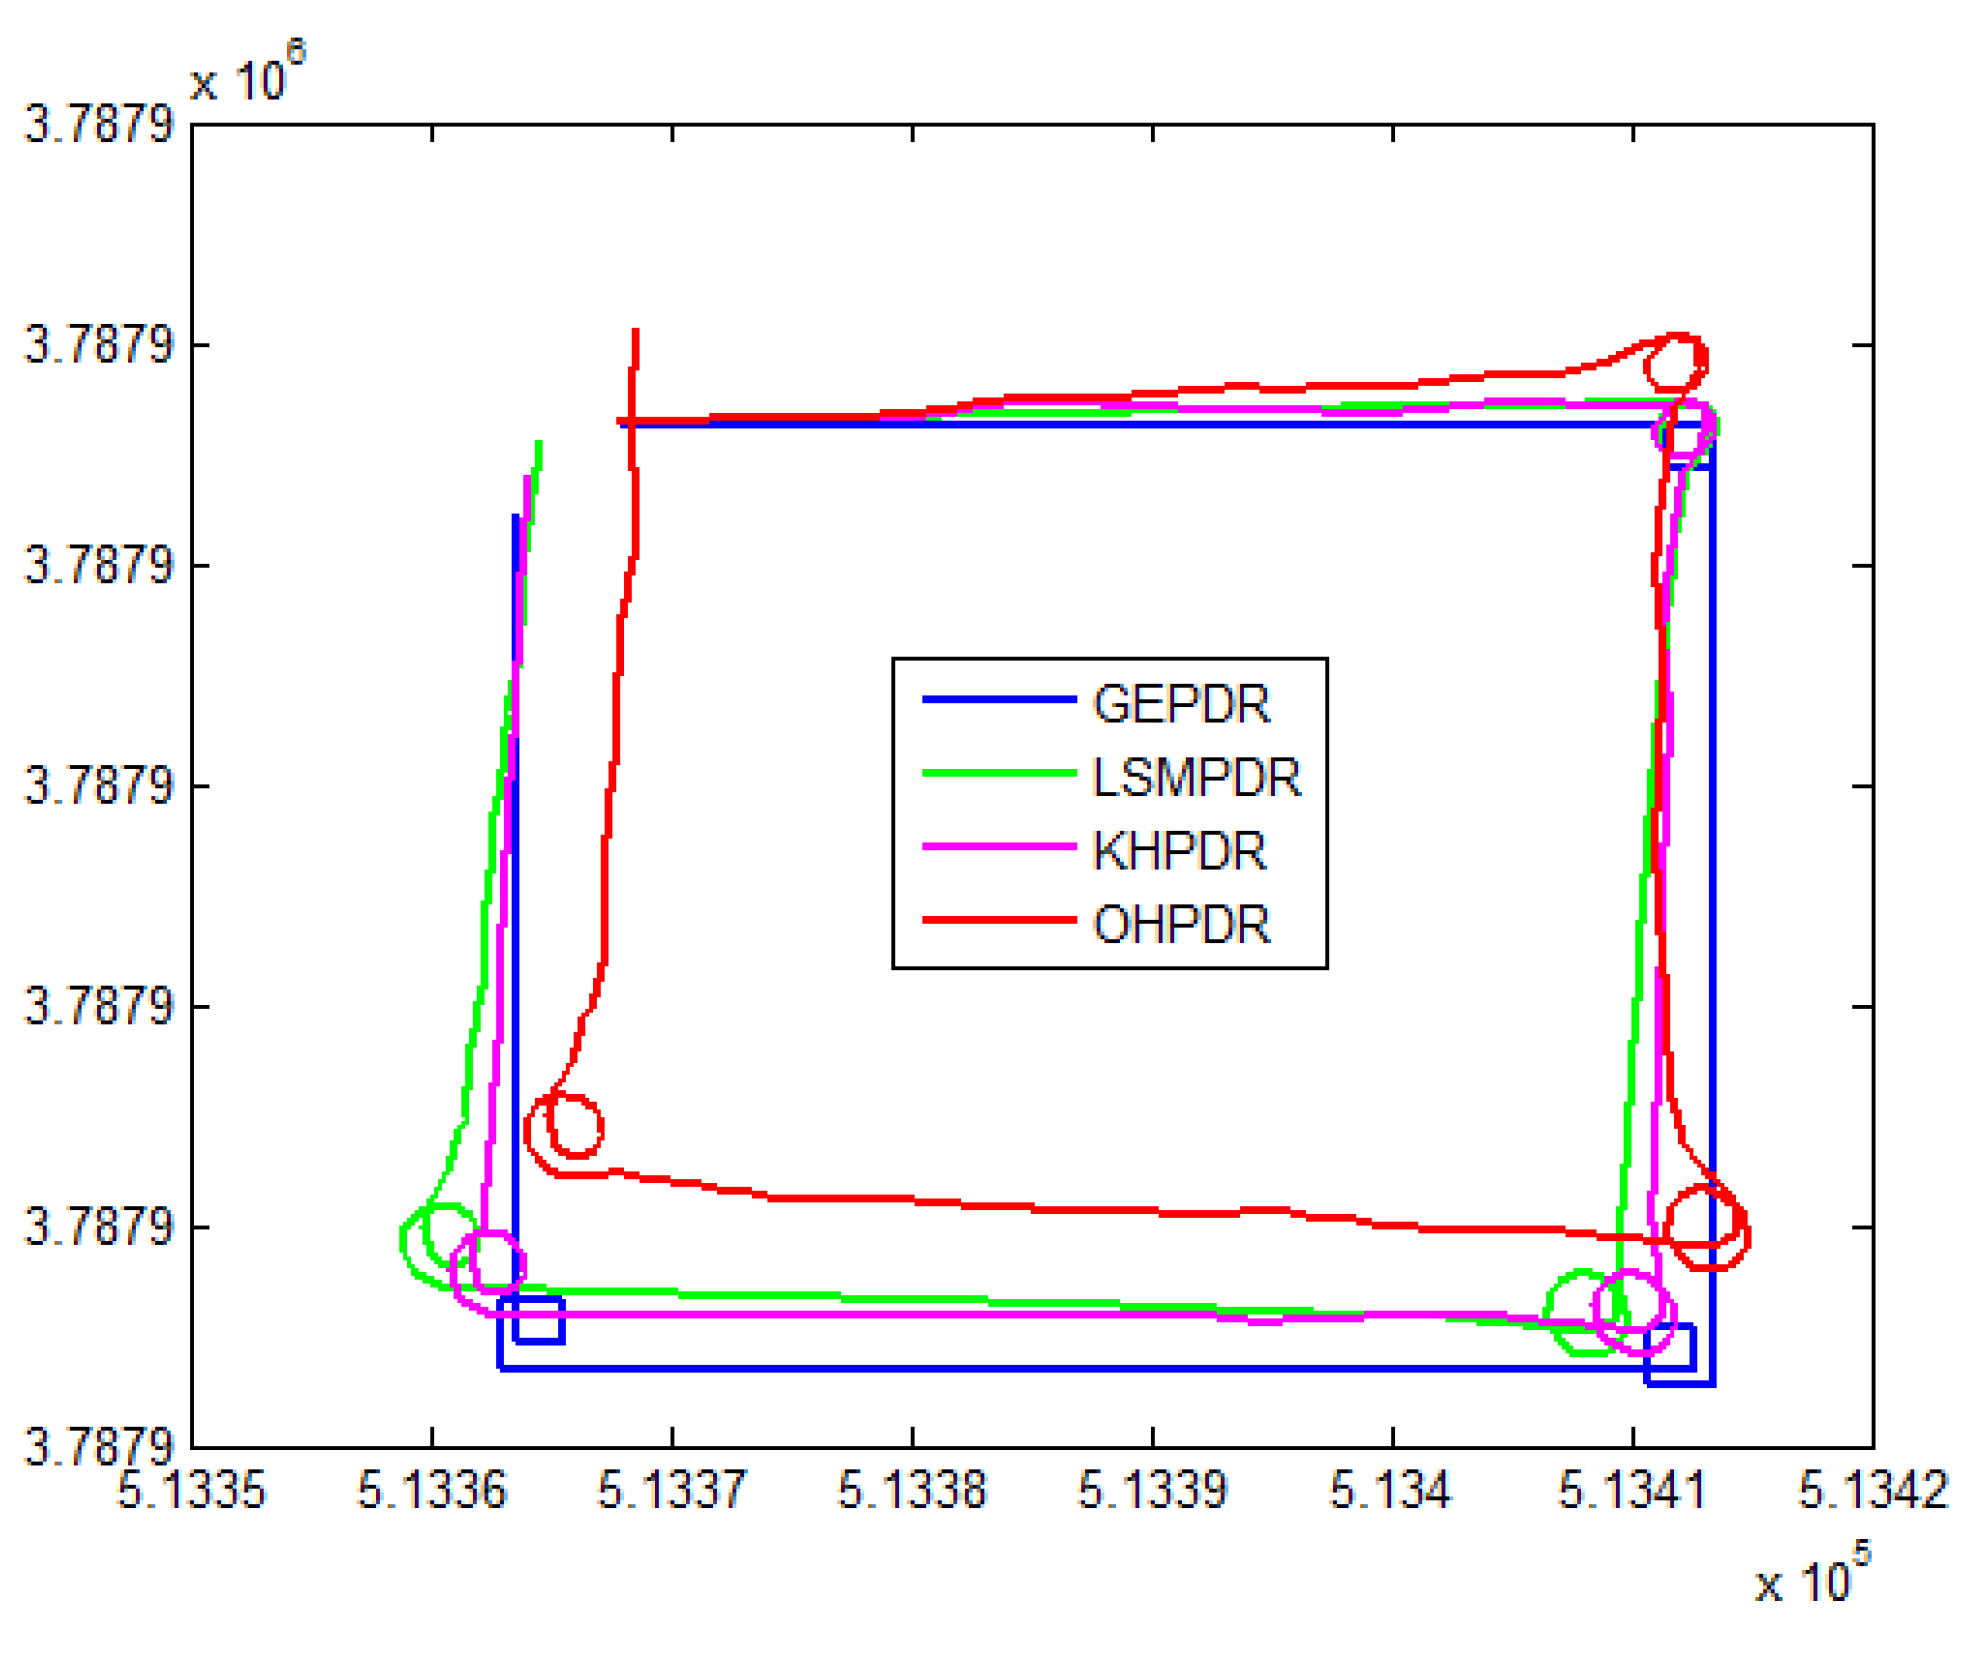
In addition, a new experiment was conducted in order to verify the effectiveness of the algorithm, namely turned a circle at the corner with right angle in the rectangular experimental area on third floor and then continued to move forward. Experimental results are shown in
Figure 14:
As shown in
Figure 14, the trajectory of algorithm OHPDR held maximum deviation from the true value because any optimization was not conducted in the direction. Algorithm GEPDR held relatively smooth trajectory, but had large whole deviation; especially at the corner, the true circle was bound into a small rectangle. Algorithm KHPDR was the most close to the true trajectory and algorithm LSMPDR was slightly inferior in algorithm KHPDR.
5. Conclusions
The method proposed in this paper takes the gait heading data under walking in a straight line as the basic data used for training the error model parameters. For every turning, the parameters are retrained when restarting walking in a straight line, so as to improve the accuracy of heading estimation as well as get control well the heading error. Because of its continuous learning function, the accuracy of the heading estimation can be improved, and the accumulation effect of PDR positioning error can be effectively inhibited. The method proposed in this paper is also applicable to the outdoor. In the case of known map, the straight paths whose directions have been determined in the map can be used to constrain the orientation. If the user walks like zigzag style, this algorithm cannot realize constraints by using the geometric direction of building. The parameters of error model can be calculated by using Kalman filtering algorithm only in the case that 10 successive steps of the direction of walk are kept stable, which can be used to calculate the heading error and conduct real-time compensation for heading. The parameters of error model can be calculated again until the next turn and stable direction values of ten steps are got once again. Future research directions can be conducted from the following three aspects:
(1) Positioned in pocket or pouch is one of our research interests in the future, which needs more complex direction transformation method and more stable step length and gait identification method. Currently, horizontal stability must be maintained as soon as possible.
(2) The current direction filtering assumes that the users move forward along straight line after turning, and constrains are conducted by known geometric direction of the building. Further work should consider random movement of users, and detect the state of motion through algorithm, of which direction constraint is not conducted; direction filtering calculation should be conducted again when the direction of walk is consistent with the geometric direction of the building once again.
(3) Constraints can be conducted by using straight corridors, so constraints by curved sides can also be studied, such as curved tunnel and curved roadway, which need to conduct further study on the vectorization technology of map.


