Article

Mapping Historical Data: Recovering a Forgotten Floristic and Vegetation Database for Biodiversity Monitoring

1
Department of Civil, Environmental and Mechanical Engineering, University of Trento, Trento 38123, Italy
2
IASMA Research and Innovation Centre, Edmund Mach Foundation (FEM), San Michele a/Adige (Trento) 38010, Italy
3
MOUNTFOR Project Centre, European Forest Institute (EFI), San Michele a/Adige, Trento 38010, Italy
4
CNR IVALSA, Istituto Valorizzazione Legno & Specie Arboree, Sesto Fiorentino, Florence 50019, Italy
5
Technology Transfer Centre, Edmund Mach Foundation (FEM), San Michele a/Adige, Trento 38010, Italy
*
Author to whom correspondence should be addressed.
These authors contributed equally to this work.
ISPRS Int. J. Geo-Inf. 2016, 5(7), 100; https://0-doi-org.brum.beds.ac.uk/10.3390/ijgi5070100
Submission received: 21 March 2016 / Revised: 1 June 2016 / Accepted: 13 June 2016 / Published: 23 June 2016
(This article belongs to the Special Issue Spatial Ecology)

Abstract

:
Multitemporal biodiversity data on a forest ecosystem can provide useful information about the evolution of biodiversity in a territory. The present study describes the recovery of an archive used to determine the main Schmid’s vegetation belts in Trento Province, Italy. The archive covers 20 years, from the 1970s to the 1990s. During the FORCING project (an Italian acronym for Cingoli Forestali, i.e., forest belts), a comprehensive process of database recovering was executed, and missing data were digitized from historical maps, preserving paper-based maps and documents. All of the maps of 16 forest districts, and the related 8000 detected transects, have been georeferenced to make the whole database spatially explicit and to evaluate the possibility of performing comparative samplings on up-to-date datasets. The floristic raw data (approximately 200,000 specific identifications, including frequency indices) still retain an important and irreplaceable information value. The data can now be browsed via a web-GIS. We provide here a set of examples of the use of this type of data, and we highlight the potential and the limits of the specific dataset and of the historical database, in general.

1. Introduction

Forest ecosystems support a great proportion of the world’s terrestrial taxa [1,2]. In particular, they harbor a notably high species diversity of many taxa, including birds, invertebrates, and soil microbes [3,4,5,6]. Moreover, their ecosystem services are essential for supporting human life and activities [7]. The long-term maintenance of forest biodiversity is considered a key task of global guiding significance and has long been included in many national forest management plans and international policy actions. Forest biodiversity conservation is also currently considered for forests where the production of timber and pulpwood is the main goal [8,9,10].
To assess the state of naturalness of a forest, and the level of species diversity supported by the forest, it is essential to provide detailed information about the distribution of the plant species that form the forest community [11], as well as the historical trends defined by the occurrence of these species up to the actual establishment of the community [12,13,14,15,16,17,18]. For the same reasons and for the same purposes, it is also essential to provide detailed information on the dynamics of the landscape, with particular emphasis on the vegetation component [19,20,21]. Consequently, the study of a whole vegetation community, or of one or more “umbrella” species, can offer a methodological approach for evaluating the quality and the state of the entire ecosystem [22,23,24]. Many previous studies have focused on the dynamics of invasive plants [25]. Recently, vegetation studies were also focused on the traditional ecological knowledge transformation in the context of the study of the cultural evolution of local alpine communities [21].
Many research programs have studied flora and vegetation biodiversity. These programs have acquired field data and conducted floristic inventories for many years. Currently, monitoring programs can also exploit technological progress in data management and new remote sensing tools that facilitate the collection of ecosystem data from extensive areas or from areas that are difficult to access. However, it is also the case that historical floristic data are essential to allow effective comparisons between previous and present situations [12,26]. The information provided by such historical approaches and perspectives cannot be entirely replaced by remote sensing techniques. In the context of vegetation and floristic studies, with particular emphasis on the integration of data from various sources, historical floristic data are progressively becoming more important [27]. It is certainly the case that floristic data collection is becoming increasingly expensive. For this reason, scarce data-gathering resources are primarily invested in areas and studies in cases where there is a greater risk of biodiversity loss. The consequence of this selective allocation is that floristic monitoring is reduced in most, or all other, regions. However, when we try to paint a portrait of long-term vegetation evolution in an area that is currently monitored, we often find that there are no historical floristic data to support comparisons. As a result, there is no way to obtain information on the important temporal component of the overall pattern of the vegetation and of its evolution. If such information were available, it would facilitate the identification of the changes and the anthropic or natural driving forces responsible for the current conditions [13,17,18].
In this context, the recovery of historical floristic and vegetation databases can represent a very important component in the long run.
The FORCING project (an Italian acronym for Cingoli Forestali, i.e., forest belts) is a project financed by the Province of Trento to support the recovery of an old archive that contained vegetation data collected between 1978 and 1991 in Trentino (Italy). The original sampling project was financed in the 1970s by the Edmund Mach Foundation (Province of Trento) to characterize the so-called Schmid’s vegetation belts in terms of species presence. The original project involved approximately 15 people, including botanists, forest guards and officials, technical staff, and land surveyors. The project identified ca. 200,000 vascular plants, grasses, trees, and shrubs belonging to approximately 1300 floral species present at various elevations in the province. An estimate of the total cost of the project in 2015 is approximately 1,350,000 euros.
Schmid’s vegetation belts were proposed in a systematic formulation by the Swiss botanist Emil Schmid [28]. The Schmid’s belts are the basic units constructed on biocoenotic basis to describe the vegetation and include any vascular plant species with equal or similar natural area, both horizontally and vertically, namely the species with similar climatic and soil requirements. The method, based on complete census of plant species at each study site, generates data on species composition and relative abundance of each species.
This systematic methodology, absolutely unique in its proposition and descriptive accuracy, was further optimized by Schmid [29] and Famiglietti and Schmid [30], and in such profile exerted a significant influence on some currents of the Italian geobotany school [31].
The asserted current definition of vegetation belt corresponds to that proposed by Pignatti, which speaks of a “portion of space, located in a mountainous area, in which there are similar bioclimatic conditions and therefore has the same potential from the vegetation point of view” [32].
The identification of the forest belts had a specific forest management meaning because it was believed that Schmid’s belts could become a permanent component of the forest assessment planning process for the years to come [31,33]. Information on Schmid’s belts furnished some indications of the potential vegetation of the area being analyzed. Through the years, however, the management and ecological value of Schmid’s belt information and approaches were revised, and these information sources and methods lost their potential as a management information tool. Nevertheless, the enormous sampling effort that these studies entailed furnished a substantially large vegetation database that long lay forgotten in the archives of Fondazione Edmund Mach [34].
This database represents a unique historical basis for assessing vegetation change occurring over the past 20–40 years. This information resource is potentially useful for both mapping historical floristic information and for identifying the effects of envisaged climate change events and processes and their impacts on the human activities and the ecosystem services of the Trentino region’s forests.
The main aims of the present paper are as follows:
(i)
to present and valorize an important historical archive;
(ii)
to perform selected tests to check the integrity and congruence of the archive;
(iii)
to explore the degree of completeness of the archive and to evaluate its usefulness as a support tool for scientific studies or nature conservation plans; and
(iv)
to present a web-GIS platform where the data and the historical maps can be browsed, along with some relevant technical details.

2. Material and Methods
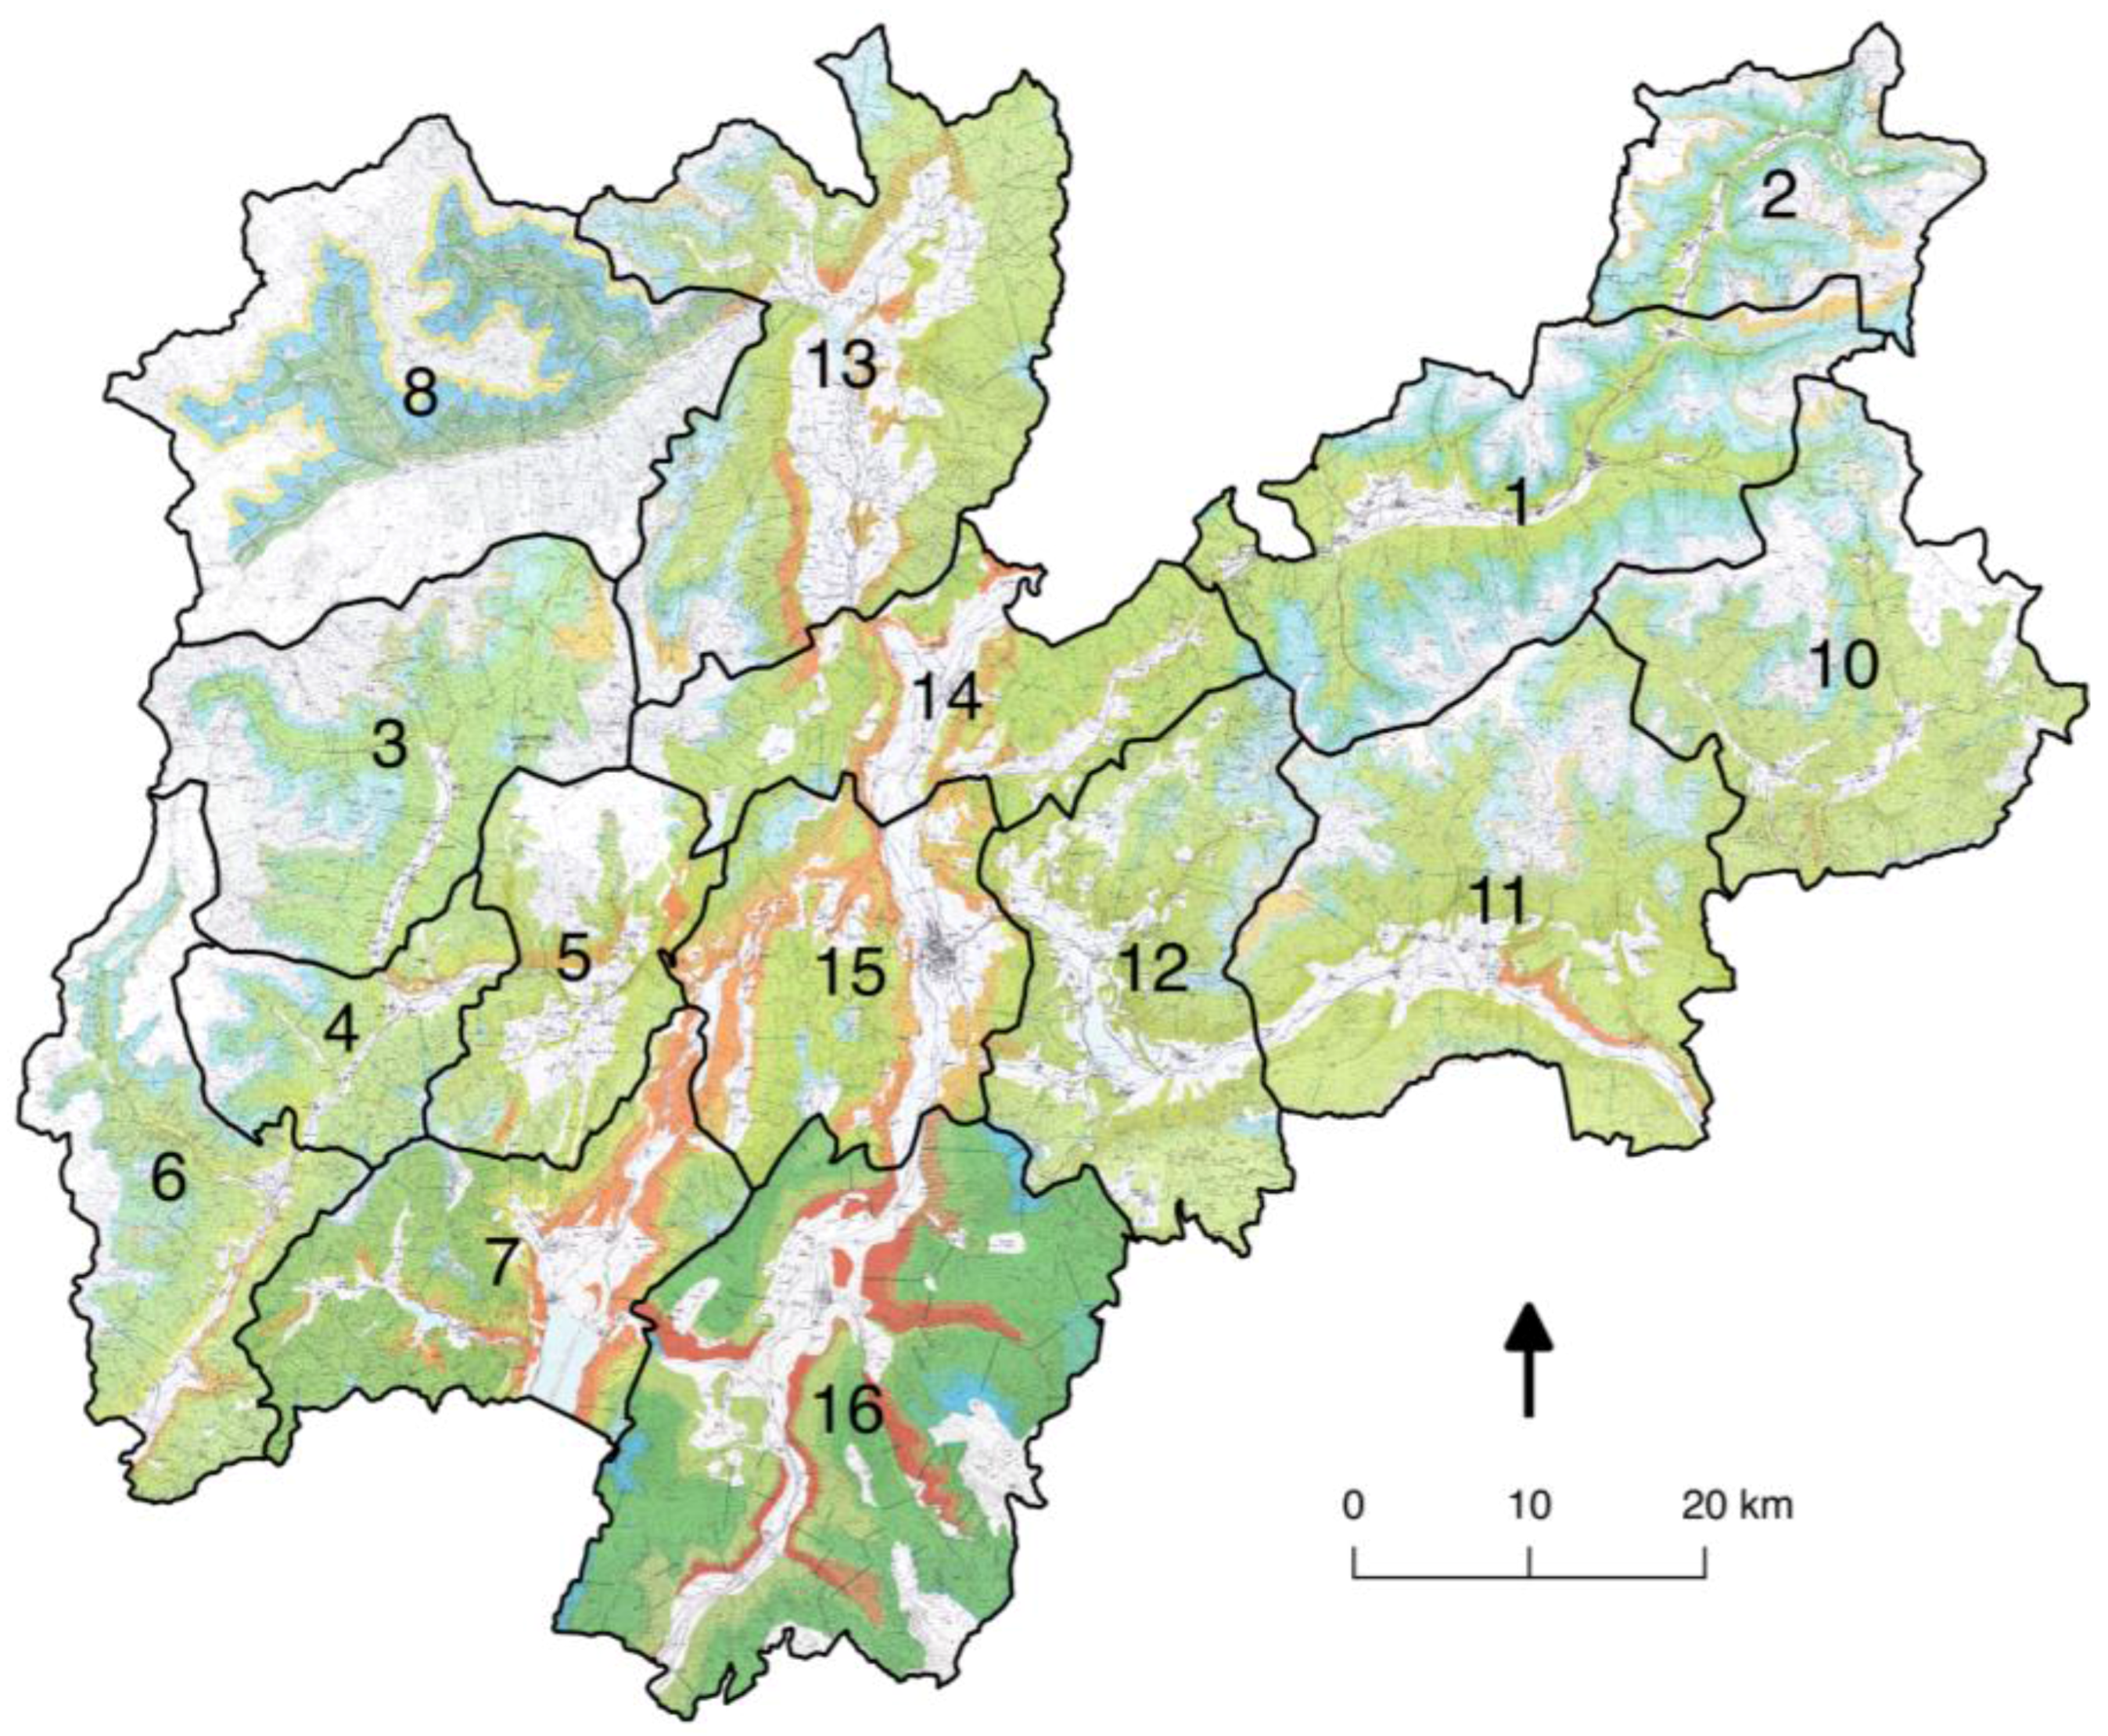
2.1. Study Area

The study area is the Province of Trento in the northeastern Italian Alps, a mountain region of approximately 6212 km2 (Figure 1). The territory is characterized by strong variability in forest species composition due to the presence of different geomorphological conditions and elevations. The forest varies from Mediterranean vegetation, where forests of Quercus ilex occur, up to alpine areas where Pinus mugo and alpine herbaceous vegetation represent the principal forest cover.
To assess the spatial distribution of species richness and to standardize the subsequent analysis, we decided to divide the study area into a grid of 5 km × 5 km cells, following the same cut procedure adopted for the Trentino Flora Inventory [35].
Trentino Flora Inventory is a huge and reliable data base updated and maintained by Museo Civico di Rovereto using both repeated field campaigns and historical herbarium samples. It is also the main source of floristic data in the region and published statistical information about species absence, presence, and frequency that are calculated according to the 5-km grid. Therefore, the choice to use the same cut for the FORCING project database allows us to compare both raw data and processing results with Trentino Flora Inventory. The summed number of species present in each cell was mapped out to obtain the species richness map.

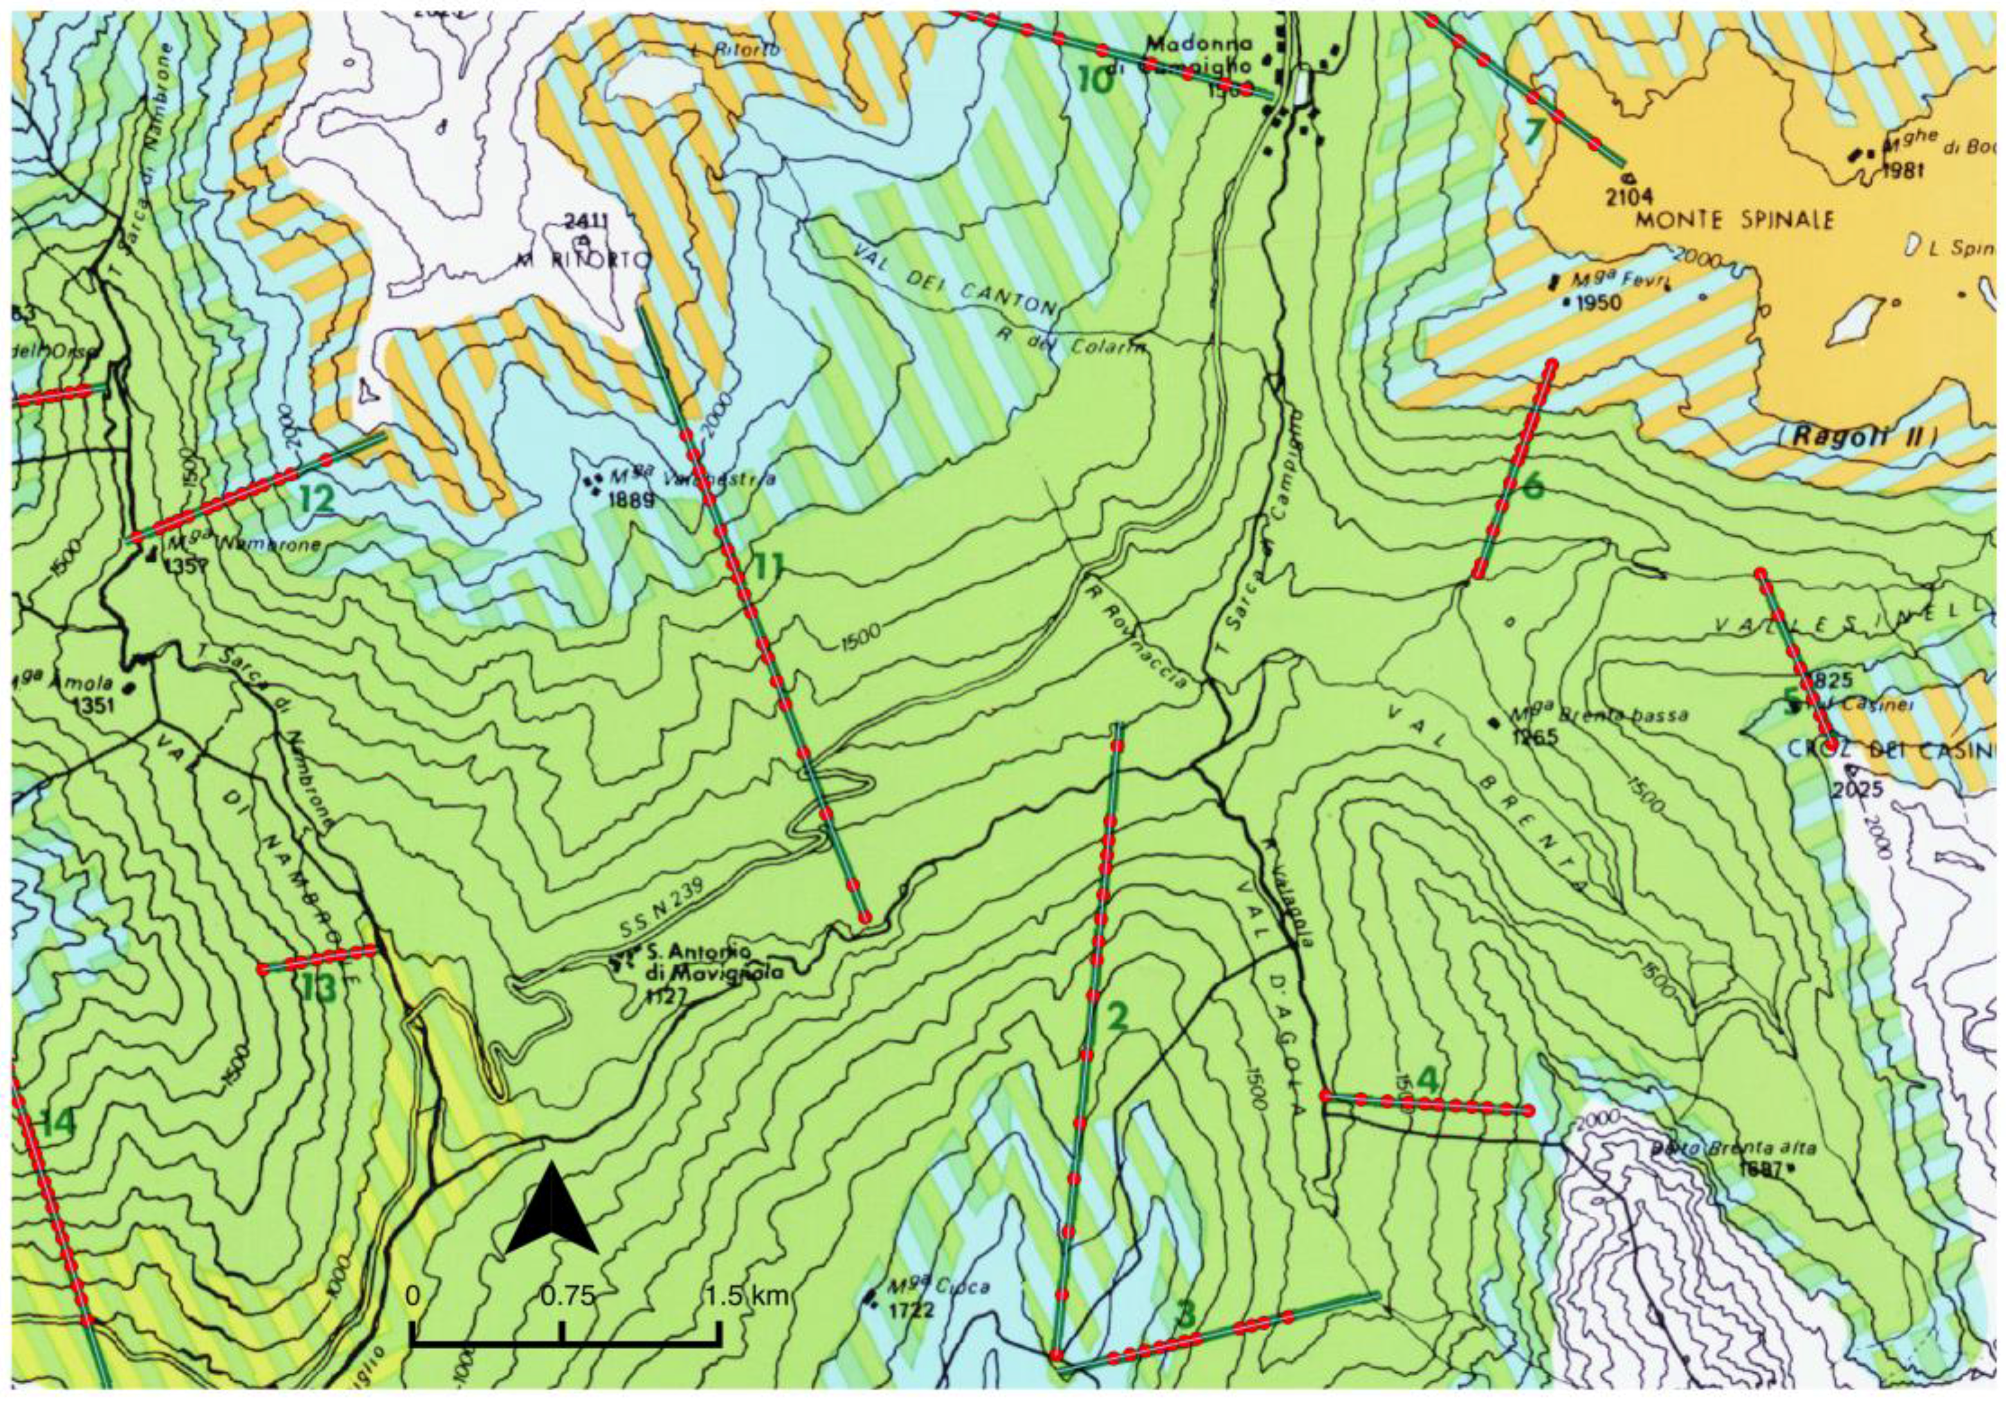
2.2. Original Field Sampling

In the original sampling activity the Trentino region was divided into 16 homogeneous zones, each corresponding to a morphological sub-valley system (Figure 2). Simultaneously, the region was divided into five altitudinal belts. Usually, the sampling activity was conducted zone by zone by one team composed of two field workers. The entire sampling campaign required approximately 13 years. Within each belt, individuated linear segments were defined to traverse the mountainsides in a direction perpendicular way to the contour lines. These segments were termed “series”. The field workers, walking through each series, defined a sampling area on the terrain that covered every 50 m of altitudinal gap. The result was a transect 10 m in length and 1 m in width. Along this transect, all floristic species were collected along with an indication of their abundance, as well as other information related to the morphological/geological conditions of the sampling site. No herbarium samples of the species were collected, or at least conserved; therefore, we must rely on the original recordings and on the data coming from the database. To recover further information we met one of the former sampler of the 1970s–1990s (now retired) we had the possibility to discuss some issues with him and we tested that they were well trained on species identification.

2.3. The Original Database

The archive was originally built on a DEC PDP/11 database management system platform, and subsequently saved in a series of tables in ASCII format. These tables contained all of the information regarding the species collected, with additional information about the environmental conditions of the sampling sites, e.g., geology, morphology, and canopy cover. The data were not geolocalized through the use of a coordinate system, but were manually drawn in the form of a series of paper maps—specifically, 16 maps—each corresponding to a zone (see Table 1). The data were originally mapped at a scale of 1:25,000 and then reported in the final maps at a scale of 1:100,000. The ASCII tables do not permit the user to process any query or to overlay the table with other types of data. It has been necessary to recover the database operating on the existing data structure to scan the paper maps in digital form, combining and mixing the data from the 16 zones and restoring and reorganizing the architecture of the original database, eliminating any redundancy. In addition, the sampling points have been georeferenced through the use of a Python script that automatically overlaid them with altitude, slope, and aspect maps, associating them with geographic coordinates to each point. The final result is a new database in SQlite3/Spatialite format, with the possibility of inquiring and overlaying these data structures with a database client and GIS software.
In the context of data sharing and dissemination [36] a web-GIS platform has been developed within the project. Through this platform, it is possible to explore the data stored in the new database and to view the distribution of the species collected.

2.4. Software Used

The scanned maps were imported in Grass GIS version 6.4 [37]. The maps were georeferenced in the reference system WGS84 UTM Zone 32N through the use of the module of GIS Grass georectify, and exported in GeoTIFF format.
The original scale of the maps was 1:100,000.
We then proceeded to the manual digitization of the series reported in the maps using Qgis 2.0 [38].
The location of the sampling points (transects) was performed automatically through a script developed in Python language using the pysqlite modules for the interface to the sqlite3 database and the Python bindings for the gdal and ogr libraries for the manipulation of raster and vector geodata (Figure 3).
The new database was developed using the relational database management system sqlite3 with the geographical extension spatialite version 4.2.0.
The development of the web-GIS, is hosted on servers in the Fondazione Edmund Mach and is accessible at http://meteogis.fmach.it/forcing/.
The web-GIS was developed using PHP version 5.5 for the server side with the use of Mapserver version 6.0.2 for the provision of geospatial data. The client side has been developed in Javascript language using GeoExt libraries (version 3.4.1) to build the client interface for the web-GIS.

2.5. Cluster Analysis

To evaluate the completeness of the database from a vegetation/floristic point of view, a classification of the cells on the basis of species composition has been performed. Such methodology was realized with a hierarchical agglomerative clustering (HAC) approach. The HAC approach has been widely used in vegetation studies [39,40,41,42,43]. It produces a nested hierarchy of groups of similar objects, based on a matrix containing the pairwise distances between all objects [44]. Specifically, a cluster analysis based on the relative Euclidean (chord) distance with Ward’s clustering algorithm was performed in this study.
The existence of significant differences in the floristic composition between clusters was contrasted using a Multiple Response Permutation Procedure (MRPP) test [45]. The MRPP test provides a significant difference test between two or more groups of samples. A significant P-value (p < 0.05) indicates that the vegetation groups are significantly different in terms of species composition.
Subsequently, for each group, the indicator value of species was calculated using the Dufrene-Legendre Indicator Species Analysis [46] to characterize the groups in terms of the most representative species. This approach enables the researcher to evaluate and compare the floristic archive in qualitative terms, comparing these groups with existing group information based on bibliographic data on the main species assemblages found in Trentino.

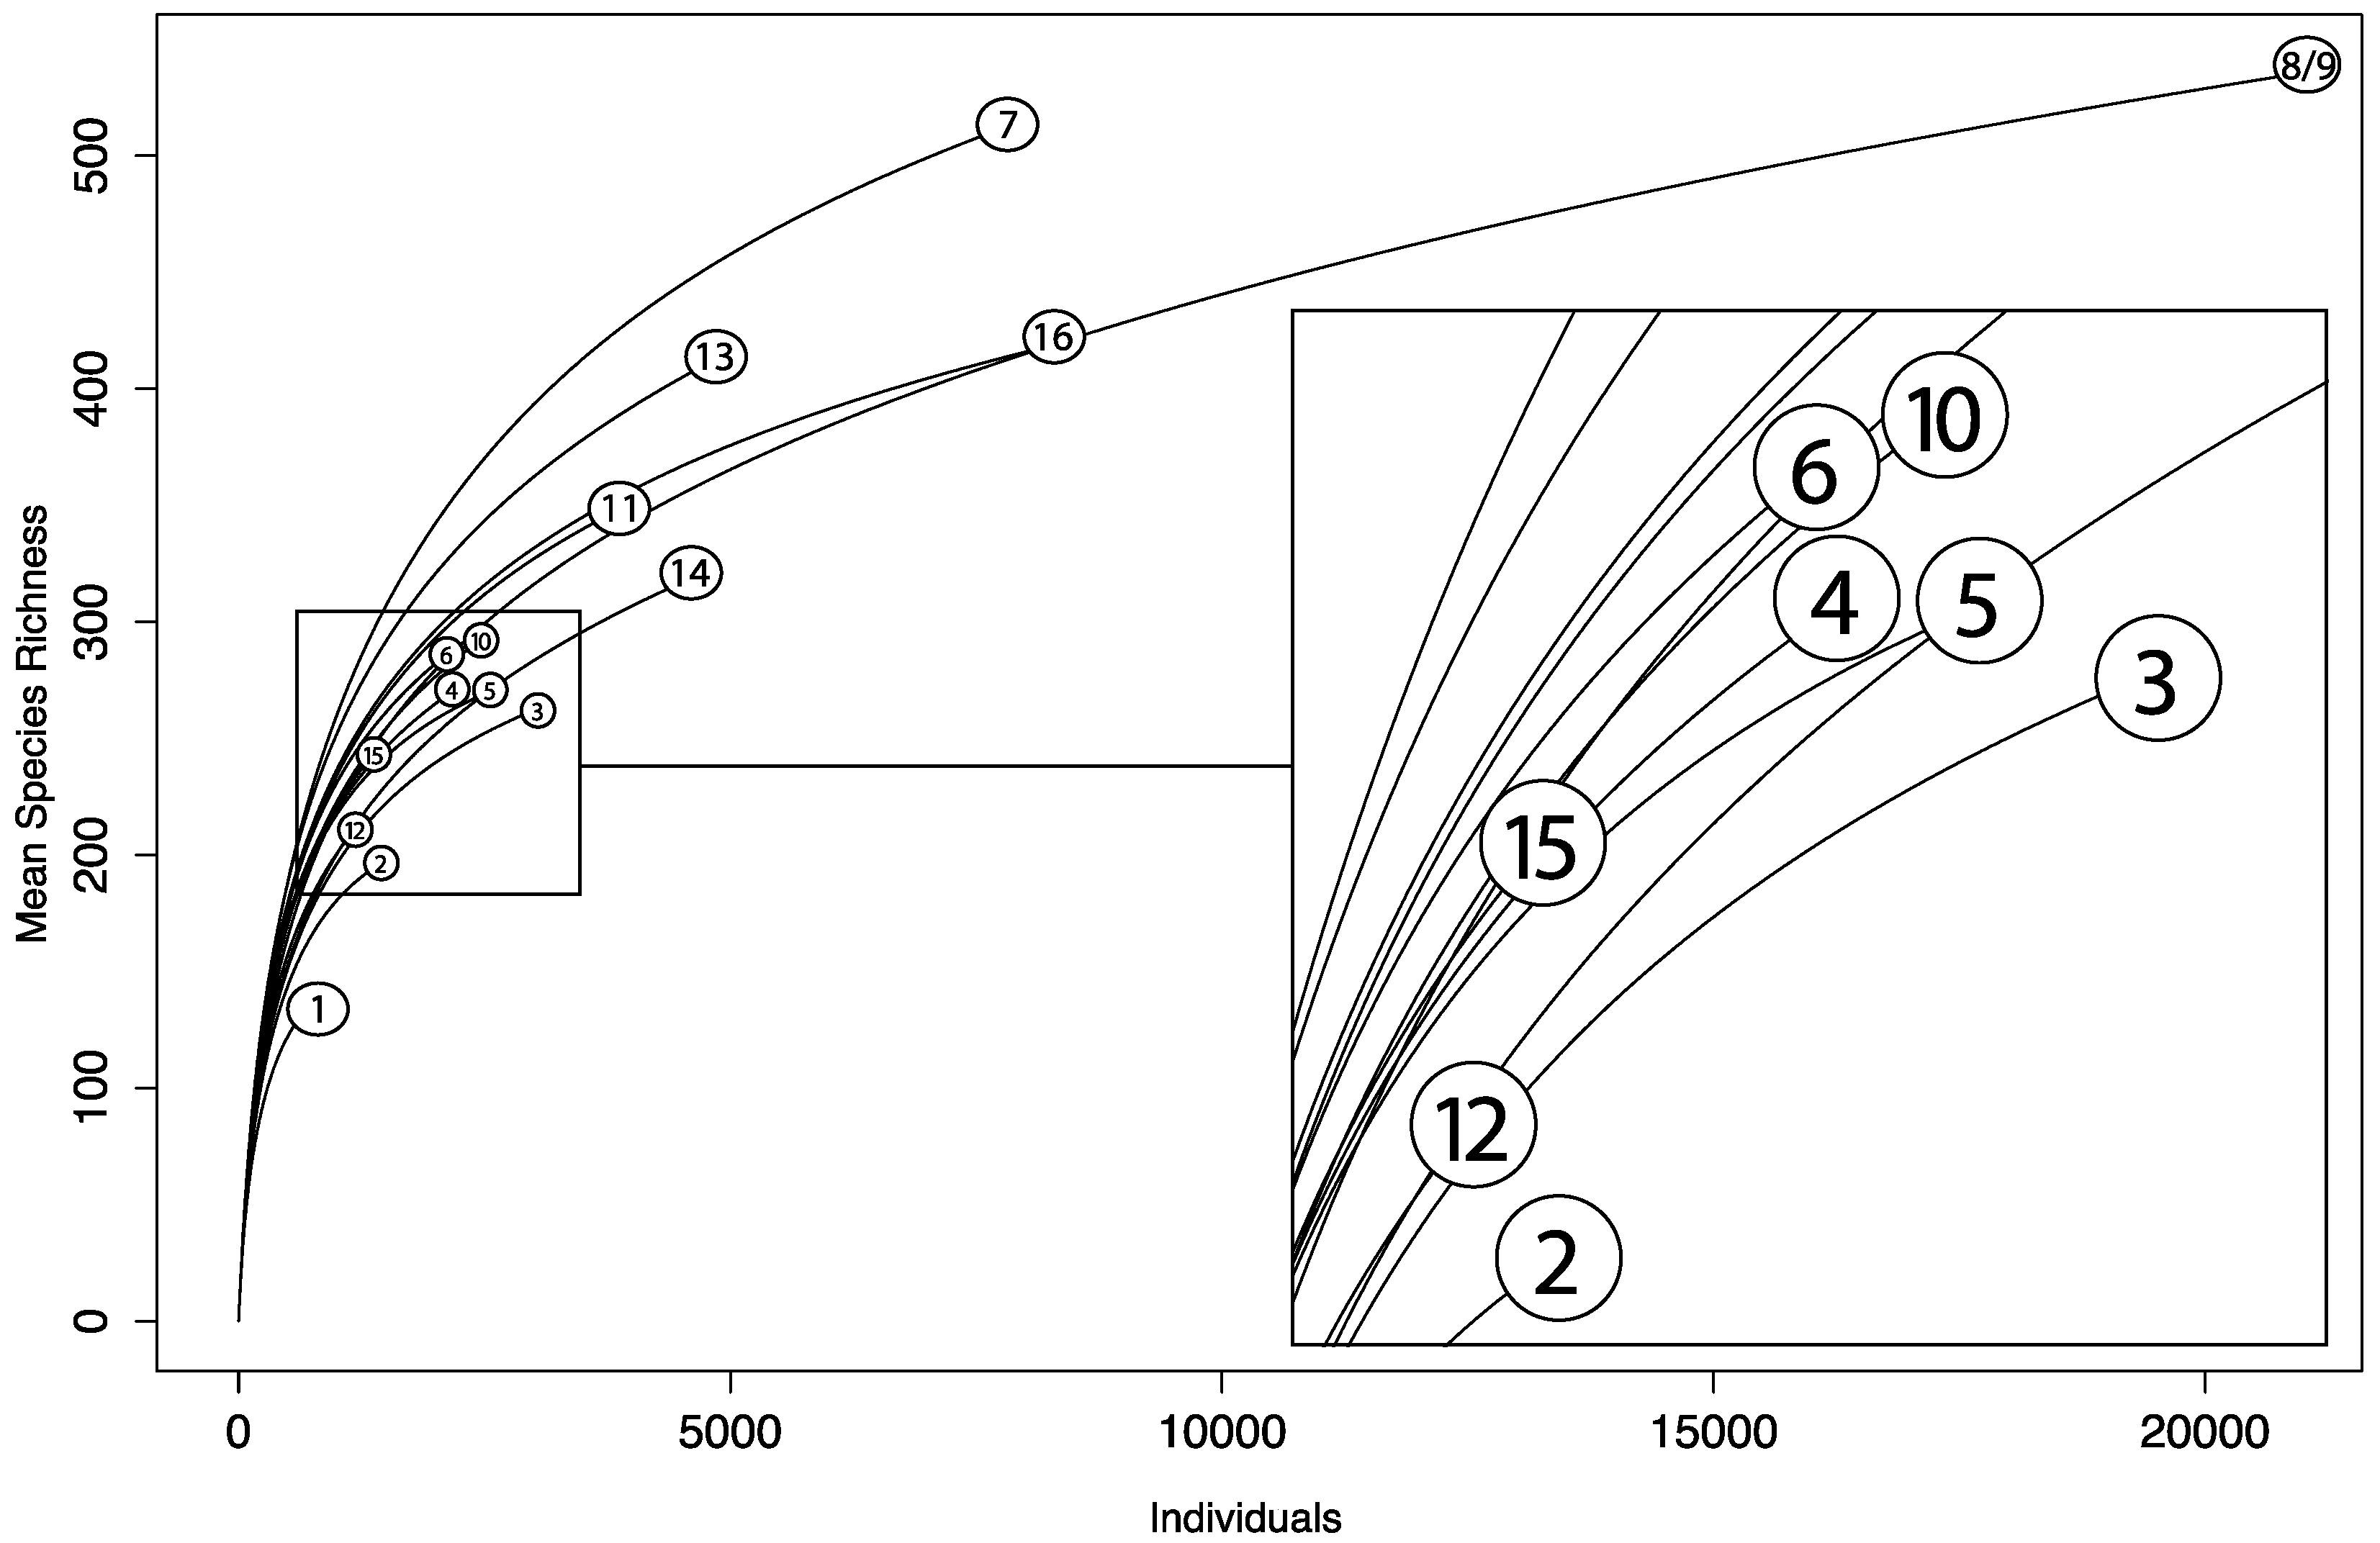
2.6. Rarefaction Analysis

Comparing raw species counts for various assemblages and evaluating a seemingly diagnostic ratio involving species counts and numbers of sampled will quite generally produce misleading results due to differences in terms of sampling effort [47]. It is well known that increasing the surface area sampled (and, thus, increasing the number of samples acquired) increases the probability of obtaining new species, an elementary application of the fundamental ecological species-area relationship [48]. A robust way to compare diversity between different sampling surfaces and estimate the potential number of species found, and, at the same time, the completeness of the archive, is to calculate sample-based rarefaction curves [49,50].
The rarefaction technique permits the researcher to evaluate and compare the species richness of various sampling sites, effectively adjusting for differences in different sampling effort. Furthermore, observations of the shape of the rarefaction curve yield implications and inferences regarding the level of completeness of the floristic archive [39]. This technique was applied to the 16 zones to compare them and individuate any differences in species diversity in the light of the substantial differences in sampling effort.
All the statistical procedures were conducted using R software [51]. All of the geoprocessing operations were performed using Grass and Quantum GIS software.

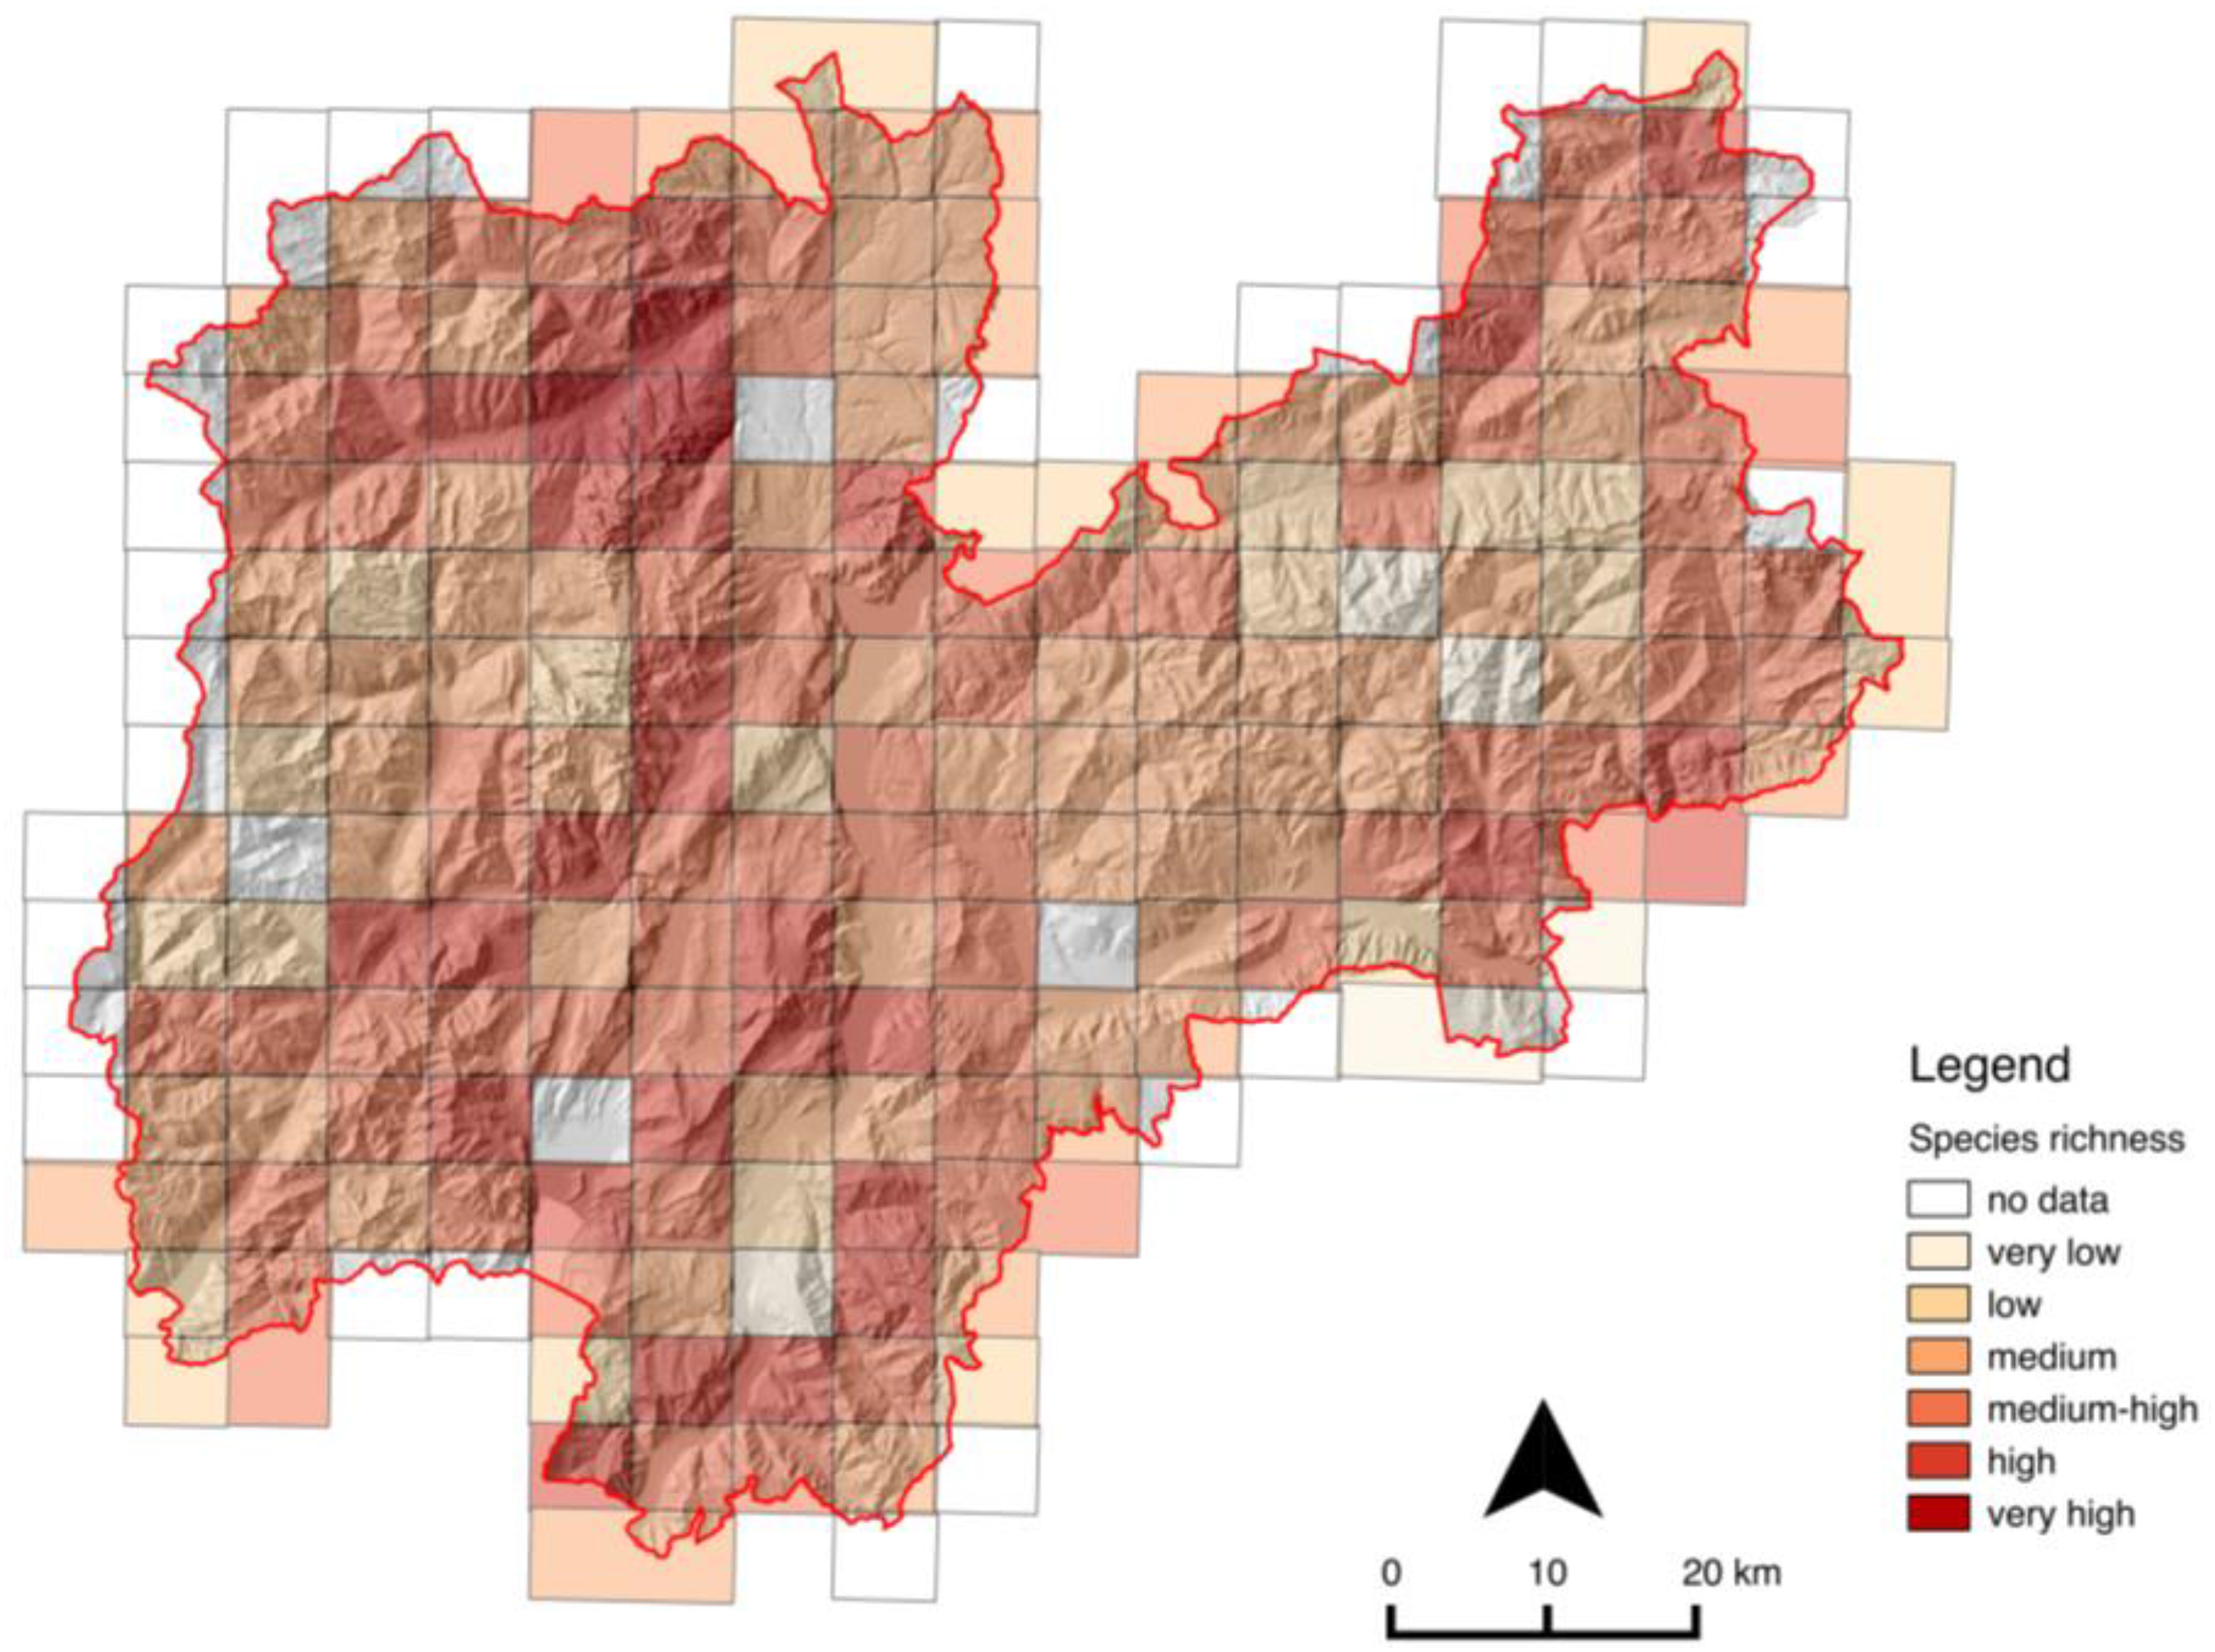
3. Results and Discussion

The digitalization and geolocalization of the samples produced 8148 records. Of these records, 7059 were geolocalized and reported in map form (86.63%). The number of linear transects geolocalized was 517 of 609 (83.52%), and the total number of species detected was 1285 species, for a total number of surveys equal to 190,761. The estimated distance covered by the entire sampling team was 65,536 m.
Table 1 shows the total number of series sampled and the number of species detected for each zone. The map in Figure 4 shows the total number of samples overlaid with the original paper maps.
The web-GIS, hosted within servers provided by the Edmund Mach Foundation, allows for the exploration and overlay of the database content with several geographic layers, i.e., the digitized series map, digital elevation model, and the OpenStreetMap topographic layer. Furthermore, it is possible to view the richness overview map, organized by 5-km square cells or by municipality districts. Data exploration is possible in two ways: (i) after enabling the layer of the richness divided by cells, the selection function makes it possible to select one or more cells. Then, by clicking on the species list function, a new window will appear with the list of species detected inside the selected area; and (ii) clicking in the “species search” button allows the user to select a species with the aid of an auto-complete field and to view the geographical distribution.
Six clusters were identified (Figure 5), with the first cluster composed of only one cell. An MRPP analysis (based on 999 permutations) showed statistical significance of the distance between the clusters with an observed delta value equal to 0.4964, an expected delta value equal to 0.5782, and a p-value less than 0.001. Table 2 summarizes the results of the cluster analysis, with the species most represented individuated by the Species Analysis Indicator. The cluster analysis identifies macro differences among groups following an ecological and climatic gradient. Clusters 2 and 6 identify ecological conditions influenced by the warmer air coming from Garda Lake and the Po plain (in the southern part of the province) or where local microclimates are warmer (see Figure 1). These groups are localized in the southern part of Trentino or in those areas of Trentino where warm air can ascend via the Adige Valley. Group 4 identifies the main vegetation of central Trentino, mountain forest dominated by spruce, while groups 5 and 3 highlight the more alpine area that is strictly unaffected by southern Mediterranean influence. Cluster 1 identifies a single cell and appears to be idiosyncratic, most likely due to strong anthropic influence. These results support and confirm the species distribution in Prosser et al. [35].
The species richness map overlain with a hill-shaded layer is shown in Figure 6.
The comparison between the zones shows disparities both in terms of the number of species detected (ranging from a minimum of 245 species of zone 2 to a maximum of 606 species of zone 7) and sampling effort (minimum detected in the zone 2 with 245 reliefs and a maximum of 1089 reliefs in zone 8/9) (see Table 1). Observation of the rarefaction curves shown in Figure 7 serves to highlight that, apart from zones 1, 2, 12, and 15, the pattern associated with the zones of interest is characterized by a number of samples less than 400. Then, ideally cutting the curves to the same number of samples, the state described is different from that suggested by the analysis of raw data shown in Table 1. Zone 8/9, which is characterized by a high number of species and high number of samples, shows an estimated average species richness that falls approximately in the middle compared to the other areas. The zones with greater estimated average species richness are zones 7 and 13. Zone 7 is located near Garda Lake, hosts different vegetation belts and is an area where the local biodiversity is extremely high. Zone 13 is located at the confluence of the Non Valley and Adige Valley. In this case, as well, the altitude shift is very significant. On the contrary, the zones with the lowest average estimated species richness are the zone 5 and 3. These areas are characterized by more homogeneous forest vegetation composition. Additionally, in this case, a comparison with Flora Trentina confirms the trends and situation [35].
It is necessary to remember that the sampling was conducted out to produce Schmid’s vegetation belts and was not intended as a complete inventory of forest flora. Considering the shape of the rarefaction curves, it is also possible to note when the curves reach a plateau, evidence that the floristic inventory is nearly complete. Considering the peculiar sampling approach adopted for this work in 1970, we did not expect to reach the plateau in any of the zones. Nevertheless, the rarefaction analysis highlights that zone 16 shows a tendency to reach a final asymptote. This finding shows that the data for certain areas can be considered relatively complete and have the potential for broader possible use.
Generally speaking, the results of the rarefaction analysis produce trends comparable with other bibliographic sources showing an increasing dynamic without reaching the asymptote [52,53]. Furthermore, the general distribution of the species richness in the Province of Trento agrees with the overall species richness distribution highlighted by other papers that use the same 5 × 5 km grid [54,55,56,57]. The altitudinal effect of the grid is also clear and is the same as that which can be observed in Prosser [35,54].
Although the 5-km grid was useful to carry out the cited comparisons with the Trentino Flora Inventory [35] it must be said that the dimension of the grid may influence the number of plant communities taken into account in each cell. On the other side since the majority of Trentino region is located in relatively homogeneous mountain areas, this effect is limited to some specific areas. Several other studies, also performed in a heterogeneous environment, have used a similar grid to analyze plant biodiversity [58,59,60]. Furthermore, our choice to use such a grid size was also because it fully overlaps with the data provided by the Forest Service of the Province of Trento, from where we could infer several other soil and dendrometrical parameters.
Therefore, the main results of this comparison confirm the accuracy and quality of the original sampling and strongly suggest the possibility to use some data for more complete analysis, although limited to forest environments.
The high species richness detected in the valley areas, or in high stressed areas is consistent with what has been amply demonstrated in alpine region, i.e., in the peak areas are strongly influenced by the extreme climatic conditions that operate by a filter in the number of species. Furthermore the decrease of micro-habitat, together with periodic stress input produce a positive effect on the overall number of species thanks to the introduction of pioneer and non-native species [61].

4. Conclusions

In this study, we recovered a substantial archive of forest floristic data and maps and made it available to the scientific community via a freely accessible web-GIS. The number of records contained in the archive and the preliminary investigations showed that the archive has great potential for use in forest studies. The simple floristic data analysis we performed shows that floristic data are congruent with the Trentino forests’ vegetation features and can be retained as reliable even if they cannot be considered a complete inventory of the Trentino forest flora because the focus of the original sampling was on forest vegetation. In some areas, the sampling appears to have attained a higher level of completeness. The data could be used to compare past floristic composition with present composition, to produce scenarios of future biodiversity shifts due to climate change, or to compare different regions with similar floristic composition [62].
Through the geolocalization of the transects, it could be possible to compare the present vegetation features and evaluate some of the temporal patterns of vegetation (e.g., new species, invasive species, changes in land use), and it could also be possible to resample near the same sites.
The data could be useful in the context of research projects, as well as in planning and evaluating projects for nature conservation.
The use of historical floristic databases must always take into account the purposes of the original sampling, which can limit their utility for particular purposes; nevertheless their value is immense, especially if, as in the present case, the floristic data are georeferenced and can be compared with the present state of the vegetation, can be considered more complete, and their use could be potentially wider.

Acknowledgments

The FORCING project (Recovery and Valorization of the Schmid Forest Belts Archive in the Autonomous Province of Trento) was cofunded to Fondazione Edmund Mach through Nicola La Porta by CARITRO (Cassa di Risparmio di Trento e Rovereto). The authors would like to express their deepest gratitude to the Forest Services of the Autonomous province of Trento that provided technical support for the whole survey period and in particular to Mauro Conci, Gino Zambanini, Luciano Zanotelli, Lucio Carli and Flavio Marchetti who were involved as main botanists and technicians for their long work performed in the collection, identification and mapping the vascular species, to Andrea Peterlongo for his precious work to rescue and safely store the data archive and to Emanuel Endrizzi for his help in the initial stage of data format migration. The authors want to thank also Filippo Prosser and Francesco Festi for their scientific support.

Author Contributions

Nicola La Porta and Marco Ciolli conceived the recovery of the archive; Nicola La Porta obtained the CARITRO competitive grant and procured the original data material; Nicola La Porta and Marco Ciolli shared scientific responsibility of the project. Francesco Geri, Fabio Zottele and Marco Ciolli designed the recovery and data collection and digitizing; Francesco Geri designed the web-GIS, performed the analyses on vegetation data and wrote the paper; All authors have contributed to discuss the results and implications of the work and to comment on the manuscript at all stages before approval. All the authors revised the paper.

Conflicts of Interest

The authors declare no conflict of interest.

References

  1. Olson, D.M.; Dinerstein, E.; Wikramanayake, E.D.; Burgess, N.D.; Powell, G.V.; Underwood, E.C.; Loucks, C.J. Terrestrial Ecoregions of the World: A New Map of Life on Earth: A new global map of terrestrial ecoregions provides an innovative tool for conserving biodiversity. BioScience 2001, 51, 933–938. [Google Scholar] [CrossRef]
  2. Lindenmayer, D.B. Forest wildlife management and conservation. Ann. N. Y. Acad. Sci. 2009, 1162, 284–310. [Google Scholar] [CrossRef] [PubMed]
  3. Gill, A.M. Biodiversity and bushfires: An Australia-wide perspective on plant-species changes after a fire event. In Australia’s Biodiversity—Responses to Fire; Gill, A.M., Woinarski, J., York, A., Eds.; Department of the Environment and Heritage: Canberra, ACT, Australia; pp. 9–53.
  4. Majer, J.D.; Recher, H.F.; Postle, A.C. Comparison of arthropod species richness in eastern and western Australian canopies: A contribution to the species number debate. Mem. Qld. Mus. 1994, 36, 121–131. [Google Scholar]
  5. Torsvik, V.; Goksoyr, J.; Daae, F. High diversity in DNA of soil bacteria. Appl. Environ. Microbiol. 1990, 56, 782–787. [Google Scholar] [PubMed]
  6. Lindenmayer, D.B.; Franklin, J.F.; Fischer, J. General management principles and a checklist of strategies to guide forest biodiversity conservation. Biol. Conserv. 2006, 131, 433–445. [Google Scholar] [CrossRef]
  7. FAO. State of the World’s Forests. Available online: http://www.fao.org/forestry/sofo/en/ (accessed on 26 April 2016).
  8. Sacchelli, S.; Zambelli, P.; Zatelli, P.; Ciolli, M. Biomasfor An open source holistic model for the assessment of sustainable forest bioenergy. iForest. 2013, 6, 285–293. [Google Scholar] [CrossRef]
  9. Law, B.S.; Chidel, M.; Brassil, T.; Turner, G.; Kathuria, A. Trends in bird diversity over 12 years in response to large-scale eucalypt plantation establishment: Implications for extensive carbon plantings. For. Ecol. Manag. 2014, 322, 58–68. [Google Scholar] [CrossRef]
  10. Toyoshima, Y.; Yamaura, Y.; Mitsuda, Y.; Yabuhara, Y.; Nakamura, F. Reconciling wood production with bird conservation: A regional analysis using bird distribution models and forestry scenarios in Tokachi district, northern Japan. For. Ecol. Manag. 2014, 307, 54–62. [Google Scholar] [CrossRef]
  11. Catorci, A.; Vitanzi, A.; Tardella, F.M.; Hrsak, V. Regeneration of Ostrya carpinifolia Scop. forest after coppicing: Modelling of changes in species diversity and composition. Pol. J. Ecol. 2011, 59, 483–494. [Google Scholar]
  12. Walz, U.; Müller, F. Changes of the flora of Saxon Switzerland—GIS allows comparison with historical data (Florenwandel in der Sächsischen Schweiz—Geographisches informationssystem erlaubt vergleich mit historischen daten). Hercynia 2009, 42, 197–215. [Google Scholar]
  13. Hannus, J.J.; von Numers, M. Temporal changes in the island flora at different scales in the archipelago of SW Finland. Appl. Veg. Sci. 2010, 13, 531–545. [Google Scholar] [CrossRef]
  14. Májeková, J.; Zaliberová, M.; Šibík, J.; Klimová, K. Changes in segetal vegetation in the Borská nížina Lowland (Slovakia) over 50 years. Biologia 2010, 65, 465–478. [Google Scholar] [CrossRef]
  15. Chou, C.H.; Huang, T.J.; Lee, Y.P.; Chen, C.Y.; Hsu, T.W.; Chen, C.H. Diversity of the alpine vegetation in central Taiwan is affected by climate change based on a century of floristic inventories. Bot. Stud. 2011, 52, 503–516. [Google Scholar]
  16. Stöckli, V.; Wipf, S.; Nilsson, C.; Rixen, C. Using historical plant surveys to track biodiversity on mountain summits. Plant Ecol. Divers. 2011, 4, 415–425. [Google Scholar] [CrossRef]
  17. Kopecky, M.; Hedl, R.; Szabo, P. Non-random extinctions dominate plant community changes in abandoned coppices. J. Appl. Ecol. 2013, 50, 79–87. [Google Scholar] [CrossRef]
  18. Pardo, I.; Camarero, J.J.; Gutierrez, E.; Garcia, M.B. Uncoupled changes in tree cover and field layer vegetation at two Pyrenean treeline ecotones over 11 years. Plant Ecol. Divers. 2013, 6, 355–364. [Google Scholar] [CrossRef]
  19. Ciolli, M.; Tattoni, C.; Ferretti, F. Understanding forest changes to support planning: A fine-scale Markov chain approach. In Models of the Ecological Hierarchy from Molecules to the Ecosphere; Jordán, F., Jørgensen, S., Eds.; Elsevier: London, UK, 2012; pp. 341–359. [Google Scholar]
  20. Tattoni, C.; Ciolli, M.; Ferretti, F. The fate of priority areas for conservation in protected areas: A fine-scale markov chain approach. Environ. Manag. 2011, 47, 263–278. [Google Scholar] [CrossRef] [PubMed]
  21. Ianni, E.; Geneletti, D.; Ciolli, M. Revitalizing traditional ecological knowledge: A study in an alpine rural community. Environ. Manag. 2015, 56, 144–156. [Google Scholar] [CrossRef] [PubMed]
  22. Landres, P.; Verner, J.; Thomas, J. Ecological uses of vertebrate indicator species: A critique. Conserv. Biol. 1988, 2, 316–328. [Google Scholar] [CrossRef]
  23. Lambeck, R.J. Focal species: A multi-species umbrella for nature conservation. Conserv. Biol. 1997, 11, 849–856. [Google Scholar] [CrossRef]
  24. McKenney, D.W.; Lindenmayer, D.B. An economic assessment of a nest box strategy for the conservation of an endangered species. Can. J. For. Res. 1994, 24, 2012–2019. [Google Scholar] [CrossRef]
  25. Pyšek, P.; Prach, K. Research into plant invasions in a crossroads region: History and focus. Biol. Invasions 2003, 5, 337–348. [Google Scholar] [CrossRef]
  26. Baessler, C.; Klotz, S.; Durka, W. Temporal changes and spatial determinants of plant species diversity and genetic variation. In Long-Term Ecological Research; Springer: Houten, The Netherlands, 2010; pp. 279–297. [Google Scholar]
  27. Daoud-Bouattour, A.; Muller, S.D.; Jamaa, H.F.B.; Saad-Limam, S.B.; Rhazi, L.; Soulié-Märsche, I.; Rouissi, M.; Touati, B.; Jilani, I.B.H.; Gammar, A.M.; et al. Conservation of Mediterranean wetlands: Interest of historical approach. C. R. Biol. 2011, 334, 742–756. [Google Scholar] [CrossRef] [PubMed]
  28. Schmid, E. Principles of natural partitioning of the vegetation of the Mediterranean area. Ber. Schweiz. Bot. Ges. 1949, 59, 169–200. [Google Scholar]
  29. Schmid, E. Fundamentals of the natural distribution of Mediterranean vegetation. Arch. Bot. Biogeogr. Ital. 1963, 39, 1–39. [Google Scholar]
  30. Famiglietti, A.; Schmid, E. Forest phytocoenosis and vegetation belts of the Lucano Central Apennines (Group of Volturino and neighboring areas). Annali Centro Econ. Montana Venezie 1969, 7, 1–180. [Google Scholar]
  31. Susmel, L. Normalizzazione delle Foreste Alpine; Liviana Editrice: Padova, Italy, 1980; p. 487. [Google Scholar]
  32. Pignatti, S. The vegetational belts in Italy. G. Bot. Ital. 1979, 113, 411–428. (In Italian) [Google Scholar] [CrossRef]
  33. Arrighetti, A. L’analisi del sottobosco strumento assestamentale e selvicolturale. Annali AISF Acc. It. Sci. For. 1981, 1, 159–197. [Google Scholar]
  34. La Porta, N.; Zottele, F.; Endrizzi, E.; Soraruf, L.; Ciolli, M. Allo studio dei Cingoli forestali del Trentino un importante archivio floristico della biodiversità forestale da valorizzare. Dendronatura 2011, 1, 29–36. [Google Scholar]
  35. Prosser, F. Quattro anni di cartografia floristica in Trentino. Dendronatura 1994, 15, 7–20. [Google Scholar]
  36. European Parliament. Directive 2007/2/EC of the European Parliament and of the Council of 14 March 2007 Establishing an Infrastructure for Spatial Information in the European Community (INSPIRE). 2007. Available online: http://inspire.ec.europa.eu/ (accessed on 10 February 2016).
  37. GRASS Development Team. Geographic Resources Analysis Support System (GRASS GIS) Software. Available online: http://grass.osgeo.org (accessed on 25 February 2016).
  38. QGIS Development Team. QGIS Geographic Information System. Available online: http://qgis.osgeo.org (accessed on 10 March 2016).
  39. Kazanis, D.; Arianoutsou, M. Vegetation composition in a post-fire successional gradient of Pinus halepensis forests in Attica, Greece. Int. J. Wildland Fire 1996, 6, 83–91. [Google Scholar] [CrossRef]
  40. Salinas Jacoba, M.; Gabriel, B.; Ana Romero, T. Evaluating riparian vegetation in semi-arid Mediterranean watercourses in the south-eastern Iberian Peninsula. Environ. Conserv. 2000, 27, 24–35. [Google Scholar] [CrossRef]
  41. Costa, O.S., Jr.; Attrill, M.; Pedrini, A.G.; De-Paula, J.C. Spatial and seasonal distribution of seaweeds on coral reefs from Southern Bahia, Brazil. Bot. Mar. 2002, 45, 346–355. [Google Scholar] [CrossRef]
  42. Dias, E.; Elias, R.B.; Nunes, V. Vegetation mapping and nature conservation: A case study in Terceira Island (Azores). Biodivers. Conserv. 2004, 13, 1519–1539. [Google Scholar] [CrossRef]
  43. Fendereski, F.; Vogt, M.; Payne, M.R.; Lachkar, Z.; Gruber, N.; Salmanmahiny, A.; Hosseini, S.A. Biogeographic classification of the Caspian Sea. Biogeosciences 2014, 11, 6451–6470. [Google Scholar] [CrossRef] [Green Version]
  44. Legendre, P.; Legendre, L. Numerical Ecology, 2nd ed.; Elsevier: Amsterdam, The Netherlands, 2008. [Google Scholar]
  45. Zimmerman, G.M.; Goetz, H.; Mielke, P.W. Use of an improved statistical method for group comparisons to study effects of prairie fire. Ecology 1985, 66, 606–611. [Google Scholar] [CrossRef]
  46. Dufrêne, M.; Legendre, P. Species assemblages and indicator species: The need for a flexible asymmetrical approach. Ecol. Monogr. 1997, 67, 345–366. [Google Scholar] [CrossRef]
  47. Gotelli, N.J.; Colwell, R.K. Quantifying biodiversity: procedures and pitfalls in the measurement and comparison of species richness. Ecol. Lett. 2001, 4, 379–391. [Google Scholar] [CrossRef]
  48. Brown, J.H. Species diversity. In Analytical Biogeography: An Integrated Approach to the Study of Animal and Plant Distribution; Myers, A.A., Giller, P.S., Eds.; Chapman & Hall: New York, NY, USA, 1998. [Google Scholar]
  49. Colwell, R.K.; Coddington, J.A. Estimating Terrestrial Biodiversity through Extrapolation. Philos. Trans. R. Soc. Lond. B Biol. Sci. 1994, 345, 101–118. [Google Scholar] [CrossRef] [PubMed]
  50. Chiarucci, A.; Bacaro, G.; Rocchini, D. Quantifying plant species diversity in a Natura 2000 network: Old ideas and new proposals. Biol. Conserv. 2008, 141, 2608–2618. [Google Scholar] [CrossRef]
  51. R Core Team. R: A Language and Environment for Statistical Computing. Available online: http://www.R-project.org (accessed on 20 February 2016).
  52. Sekulová, L.; Hájek, M.; Syrovátka, V. Vegetation–environment relationships in alpine mires of the West Carpathians and the Alps. J. Veg. Sci. 2013, 24, 1118–1128. [Google Scholar] [CrossRef]
  53. Geri, F.; Lastrucci, L.; Viciani, D.; Foggi, B.; Ferretti, G.; Maccherini, S.; Chiarucci, A. Mapping patterns of ferns species richness through the use of herbarium data. Biodivers. Conserv. 2013, 22, 1679–1690. [Google Scholar] [CrossRef]
  54. Prosser, F.; Festi, F. Cartografia floristica in Trentino. Inf. Bot. Ital. 1993, 24, 23–31. [Google Scholar]
  55. Perazza, G.; Decarli Perazza, M. Cartografia orchidee tridentine (COT): Mappatura delle orchidee spontanee in Provincia di Trento (Italia settentrionale), aggiornamento generale. Ann. Museo Civ. Rovereto Sezione Archeol. Storia Sci. Nat. 2005, 20, 153–339. [Google Scholar]
  56. Marini, L.; Prosser, F.; Klimek, S.; Marrs, R.H. Water-energy, land-cover and heterogeneity drivers of the distribution of plant species richness in a mountain region of the European Alps. J. Biogeogr. 2008, 35, 1826–1839. [Google Scholar] [CrossRef]
  57. Marini, L.; Gaston, K.J.; Prosser, F.; Hulme, P.E. Contrasting response of native and alien plant species richness to environmental energy and human impact along alpine elevation gradients. Glob. Ecol. Biogeogr. 2009, 18, 652–661. [Google Scholar] [CrossRef]
  58. Manton, M.G.; Angelstam, P.; Mikusiński, G. Modelling habitat suitability for deciduous forest focal species–a sensitivity analysis using different satellite land cover data. Landsc. Ecol. 2005, 20, 827–839. [Google Scholar] [CrossRef]
  59. Ecke, F.; Magnusson, M.; Hörnfeldt, B. Spatiotemporal changes in the landscape structure of forests in northern Sweden. Scand. J. For. Res. 2013, 28, 651–667. [Google Scholar] [CrossRef]
  60. Vimal, R.; Devictor, V. Building relevant ecological indicators with basic data: Species and community specialization indices derived from atlas data. Ecol. Indic. 2015, 50, 1–7. [Google Scholar] [CrossRef]
  61. Vittoz, P.; Camenisch, M.; Mayor, R.; Miserere, L.; Vust, M.; Theurillat, J.P. Subalpine-nival gradient of species richness for vascular plants, bryophytes and lichens in the Swiss Inner Alps. Bot. Helv. 2010, 120, 139–149. [Google Scholar] [CrossRef]
  62. Ruiz-Labourdette, D.; Schmitz, M.F.; Pineda, F.D. Changes in tree species composition in Mediterranean mountains under climate change: Indicators for conservation planning. Ecol. Ind. 2013, 24, 310–323. [Google Scholar] [CrossRef]
Figure 1. Study area.
Ijgi 05 00100 g001
Figure 2. Territorial division of the Province of Trento in 16 zones.
Ijgi 05 00100 g002
Figure 3. Particular of the historical map overlaid with the sampling points recovered and georeferenced in this work.
Ijgi 05 00100 g003
Figure 4. Distribution of the transects and sampling points around the entire study area.
Ijgi 05 00100 g004
Figure 5. Cluster analysis results overlaid on the Trentino Province area boundary (in red).
Ijgi 05 00100 g005
Figure 6. Species richness map overlaid with a hill-shaded layer.
Ijgi 05 00100 g006
Figure 7. Rarefaction analysis conducted on the 16 zones. The zone numbers are referenced at the end of each line.
Ijgi 05 00100 g007
Table 1. Summary of total number of series and species detected for each zone.
Number of MapSeries NumberSpecies Number
1391429
2245353
3417355
4489445
5489443
6489454
7763606
81089578
10427453
11672500
12361416
13623532
14569481
15361428
16763544
Table 2. Summary results of the species indicator analysis, with the species most represented and a short description for each zone.
Cluster NumberNumber of CellsIndicator SpeciesDescription
11Bifora radians, Borago officinalis, Carex humilis, Conium maculatum, Dianthus barbatus, Heliotropium europaeumSynanthropic habitats, crops, low altitude grasslands
244Clematis recta, Melittis melissophyllum, Sorbus torminalis, Vincetoxicum hirundinaria, Viburnum opalus, Euphorbia carniolica, Frangola alnusMeso-thermophilic deciduous forests, wet or calcareous soils
311Potentilla aurea, Luzula alpino-pilosa, Luzula sylvatica, Luzula lutea, Trifolium alpinumAlpine pastures and forests on acid soils
477Pinus cembra, Larix decidua, Vaccinium uliginosum, Vaccinium myrtillus, Rhododendron ferrugineum, Vaccinium vitis, Veratrum album, Oxalis acetosella, Picea excelsaPine forests
54Helianthemum oelandicum, Coronilla varia, Quercus robur, Gentianella germanica, Digitalis lutea, Lamium album, Solidago virga-aurea, Clinopodium vulgare, Veronica fruticansSubmontane calcareous grassland
644Stachys alopecuros, Rhododendron hirsutum, Fraxinus excelsior, Phyteuma scheuchzeri, Laburnum alpinum, Pinus mugo, Epipactis atropurpurea, Mercurialis perennisBushes with Pinus mugo and Rhododendron hirsutum

