1. Introduction
Integrated environmental resources research in interdisciplinary projects demands for a comprehensive and holistic system understanding, which in turn relies on powerful and effective data management and information sharing strategies. At the same time, European and German research donors increasingly enforce open science and open access policies through ICT (Information and Communication Technology) tools, networks and media, aiming to make scientific knowledge more easily accessible and to make research more open, global, collaborative, creative and closer to society [
1]. This in turn requires information management and sharing methods based on the best available knowledge and techniques to support different kinds of users, e.g., researchers, decision makers and stakeholders. To specifically address the demand for geospatial information sharing, a number of data format and interface standards have been developed during the last decade, mainly driven by the Open Geospatial Consortium (OGC) and other standardization organizations. Examples are the ISO19115 standard for geographic information metadata [
2] or the Catalogue Services Specification [
3], both of which are widely applied in geodata infrastructures on national and international levels [
4]. However, information sharing in environmental sciences also demands for the integration of geospatial data with other, non-spatial data.
Addressing these demands on the level of specific scientific disciplines, various data repositories have been developed, such as the Data Observation Network for Earth [
5], the CUAHSI Hydrologic Information System [
6] or the PANGAEA information system [
7]. Many of these systems are constrained to specific user groups (e.g., experts) and rather define a framework infrastructure instead of really offering user and service interfaces or do not support geospatial services at all. Another problem is the often missing support for the upload and sharing of user-owned datasets. This is not a problem of missing features in available standards, but simply a lack of support for these functions on the client’s side. Regarding the data management design, many existing systems also lack a fine-grained user permission management (e.g., write permission to owned data only). Summarizing the current situation, it can be stated that, even though standards and software are readily available, integrating geodata and thematic information together with standardized services and mapping capabilities in ready-to-use client/server architectures is still challenging.
To address those challenges, the development of the web-based River Basin Information System (RBIS) started more than 10 years ago, and up to now, the system has been applied in more than 35 research projects of different sizes in South America, Africa, Europe, Australia and Asia (see examples in
Section 7). As most of the study regions were located in developing countries, challenges related to it were always taken into account during the design and implementation. One of those is still the accessibility to the Internet (statistics for the current situation can be found under [
8]). However, also the local infrastructure for data management (e.g., for time series data or geodata) from the authority side is not as developed, such as in Europe, where, e.g., the INSPIRE (Infrastructure for Spatial Information in the European Community) initiative [
4] is driving forward to publish geodata in a common manner. The existing data often need time-consuming data preprocessing, e.g., if it is only available as an image, handwritten records, floppy disks, text and Excel files with a changing structure every year, and so on. It is also not always easy to find out which data exist and how they can be accessed. Especially at the beginning of a research activity, the data collection can be very challenging and time consuming. Therefore, it is also important to have an easily-accessible common data base to avoid every researcher or project member having to do the same work again, which includes not only the data acquisition, but also preprocessing from different formats to one. Once the data are prepared, they can be used in further steps of scientific workflows (e.g., hydrological modelling), which is also one aim that RBIS supports, as well as the dissemination and sharing of research data among researchers and decision makers in a standardized and service-oriented way. The accessibility and openness of research data are also increasingly requested by funding agencies [
9].
What is RBIS? RBIS is a web-based information system, developed at the Department of Geography, Geographic Information Science at the Friedrich Schiller University of Jena in Germany, aiming at researchers and decision makers. Its main objectives are the management of environmental data from different disciplines focusing on the management of metadata and several data formats (e.g., spatial, time series and processing data) (
Section 2). To find and access the managed data, there are search and filter functions (
Section 3), as well as interfaces and services provided (
Section 4). The administration, especially related to the user and permission management, is described in
Section 5. Its current architecture and used software components are described in
Section 6. Examples for the application and use types of RBIS are part of
Section 7. Finally, there is a short discussion and outlook for further planned developments.
2. RBIS: Data Management, Analysis and Visualization
RBIS is designed to manage different types of environmental data with and without a spatial context together with its metadata. The data are not limited by the content, spatial location or special field of research and are primarily grouped by the type (e.g., time series data, geodata (vector and raster formats), space time data, maps, documents, simulation models, etc.). The current usage is mainly related to data needed or produced for climate impact assessments from the fields of natural sciences (e.g., hydro-meteorological time series data, land use, fire, socioeconomic, soil, geology, elevation, vegetation, indicators, etc.), with a special focus on hydro-meteorological time series data management, e.g., as is required for hydrological modeling. Beside the management and storage of data, RBIS provides functions for the visualization, linking, analysis and processing of certain data types (e.g., time series data) to support researchers, decision makers, research result dissemination and information discovery and extraction for local stakeholders.
2.1. Metadata
The main focus of the system is on metadata (“data about data” [
10]) to make existing data findable and to inform about their existence. In this case, the dataset is not required to be uploaded itself, but is to be described as well as possible. The metadata in RBIS are stored based on a complete implementation of the ISO 19115 Standard for Geographical Data, which has been extended according to the specific requirements of the data types supported in RBIS. Accordingly, geodata are described according to ISO 19115, while all other datasets only use subsets of the standard, e.g., the “Persons and Organizations” element for the description of responsible parties.
The visualization of metadata datasets, their creation, manipulation and linking is described in the following sections.
2.1.1. Overview and Detailed View
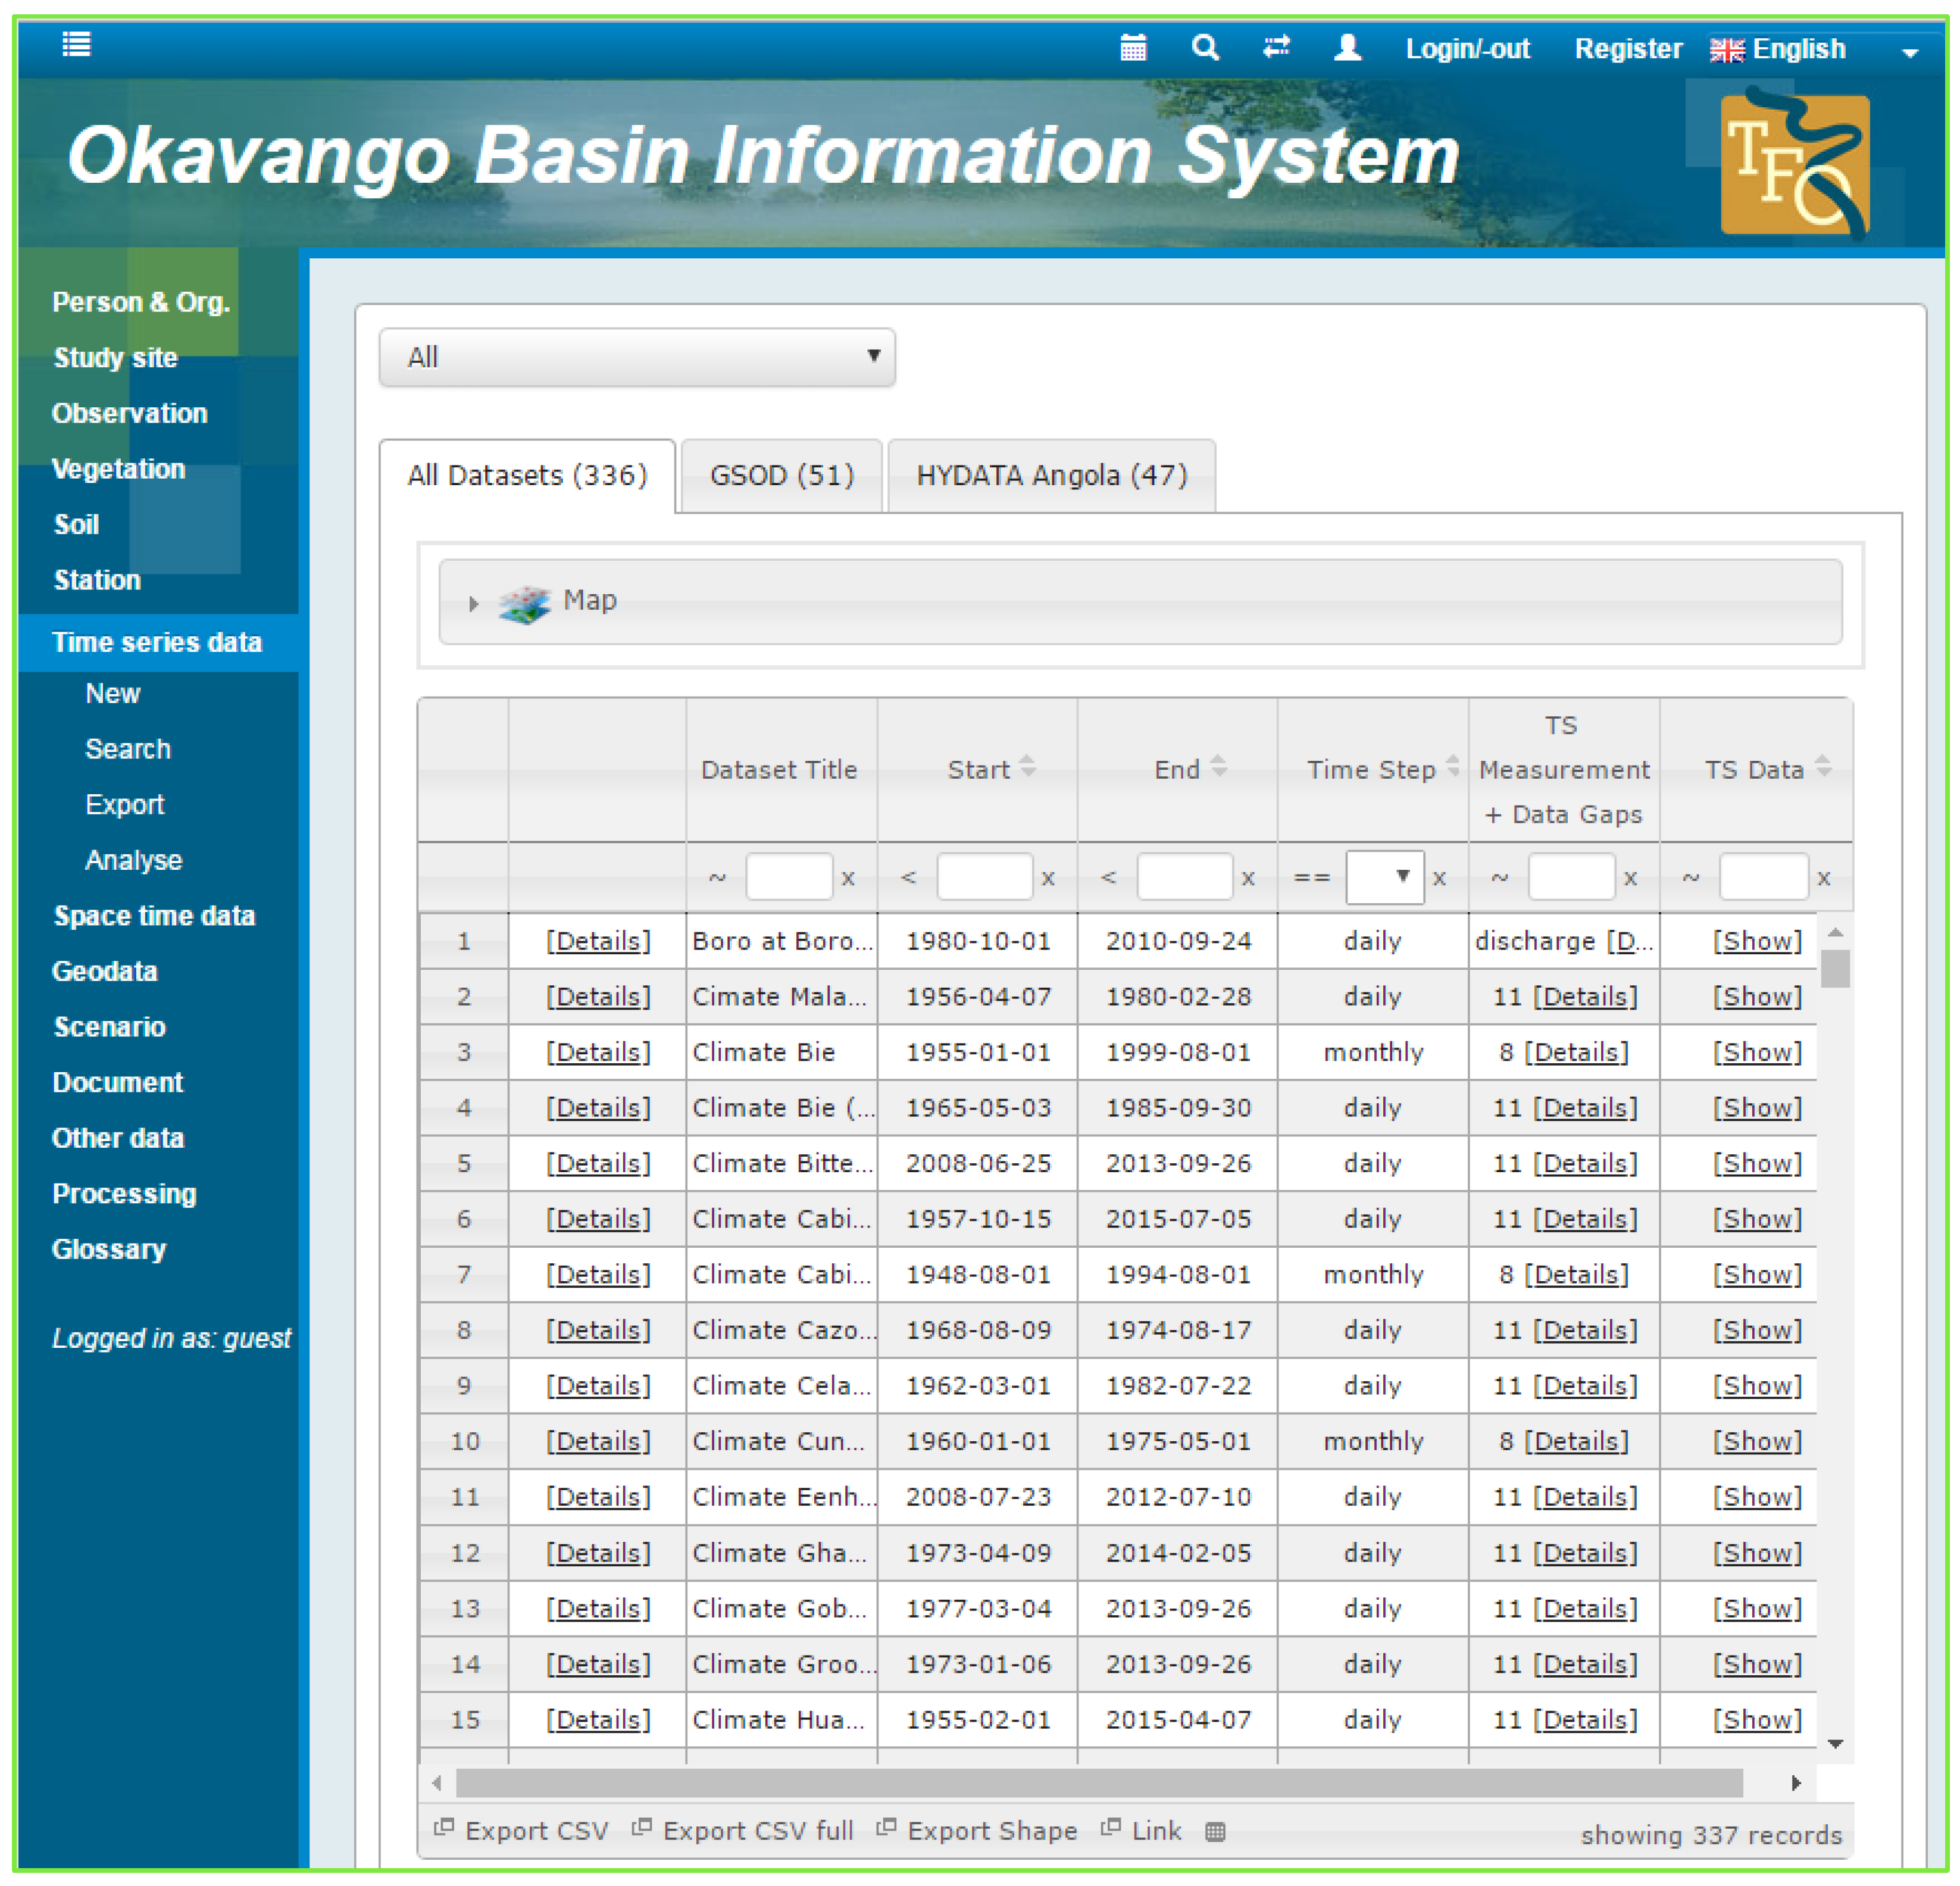
The overview list may include visible or hidden columns, which can be displayed on demand. An example for time series data metadata is shown in
Figure 1. In the table header, the datasets can be sorted or filtered using different operators fitting to the data type, e.g., “contains”, “does not contain” or “ends with” for text or “<”, “≤” or “>” for numbers. In addition, it is possible to export the resulting lists as a CSV dataset, either limited to the most important dataset attributes or including all available metadata attributes. Datasets including or linked to spatial coordinates can further be exported as a vector dataset in Shapefile format. In addition, current search and filter results can be saved for later use and sharing with others.
The details link in the first columns (see
Figure 1) always leads to a more detailed view on single datasets. Here, it is possible to view, edit or delete the dataset and to access associated or linked data and functions. This also includes a file upload function that allows one to easily attach arbitrary files to a dataset, such as pictures, raw data or text documents. As an example, this could be the picture of a measurement station, making it easier to correctly interpret associated measured data.
2.1.2. Multilingual Support
While researchers are typically used to working and communicating in English, local stakeholders (e.g., in Vietnam) and other interested parties often have limited skills and experience in this regard. To lower language barriers and thus usage barriers for non-English speakers, RBIS features a multilingual support for all of its user interfaces. All navigation elements, notices, metadata field descriptions and, under certain circumstances, the content of selection lists can be translated. The current state of all translations (stored in the database and files) covers English, Vietnamese, Spanish, Portuguese and German. In the RBIS web interface, the languages can easily be changed by using a drop-down list located at the right top corner of the webpage (see
Figure 1).
2.1.3. Creation and Editing
In order to create, manipulate or delete datasets in RBIS, it is required to have a user account with appropriate access permissions (see
Section 5). To avoid data inconsistencies and to simplify data input, information is entered using selection lists whenever possible. To ease the creation of datasets (e.g., when entering a larger number of similar datasets), RBIS features a template system that supports the storage and re-use of user-generated dataset templates. Those templates can also serve as a base for the automated creation or import of data.
2.1.4. Linking of Datasets
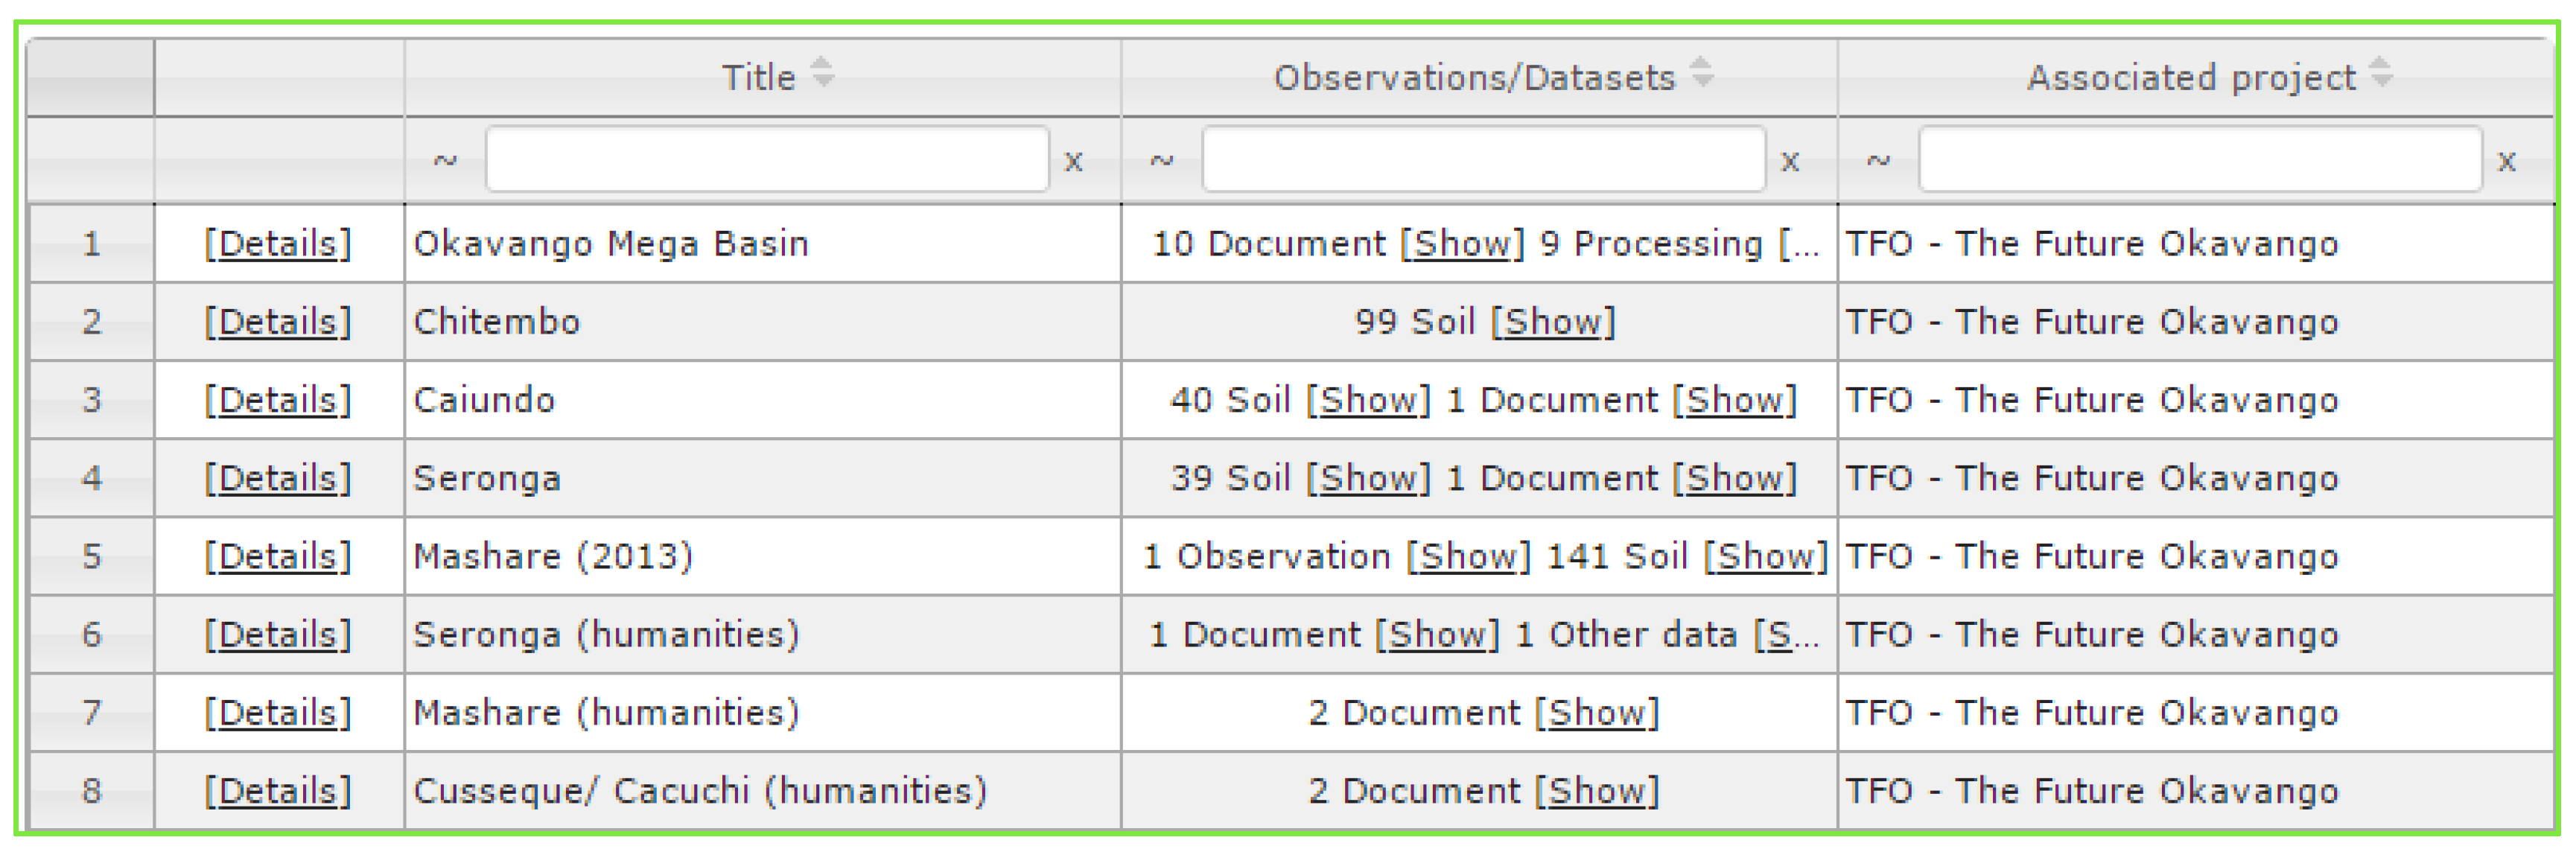
Environmental information is often associated and contextualized with other data. An example could be a time series dataset that was used within a study, which on the other hand, is described within a publication stored in the RBIS “Document” section. To establish the according links, it is possible to loosely link every RBIS dataset with any other dataset stored in RBIS. Explicit links are also possible and created by using metadata fields. A common example for this type of association is the linkage of a person or organization to a dataset, expressing their role as a responsible party. Another example is the direct linkage between a study site and a dataset, which is shown in
Figure 2 from the study site point of view. This can be used if a dataset itself has no spatial coordinates, but still refers to a certain study site or area, underlining its spatial relation. Another way of linking is via the in- and out-put description of a processing step (see
Section 2.4). Created linkages are always visible from each involved dataset.
2.2. Spatial Data
Datasets managed in environmental information systems and specifically in RBIS somehow have a spatial relation. To describe this relation, certain RBIS datatypes contain their own location information using point coordinates, the bounding box extent or a polygon. As a second option, they can be directly linked to one of those datasets, e.g., each time series dataset is linked to a station dataset.
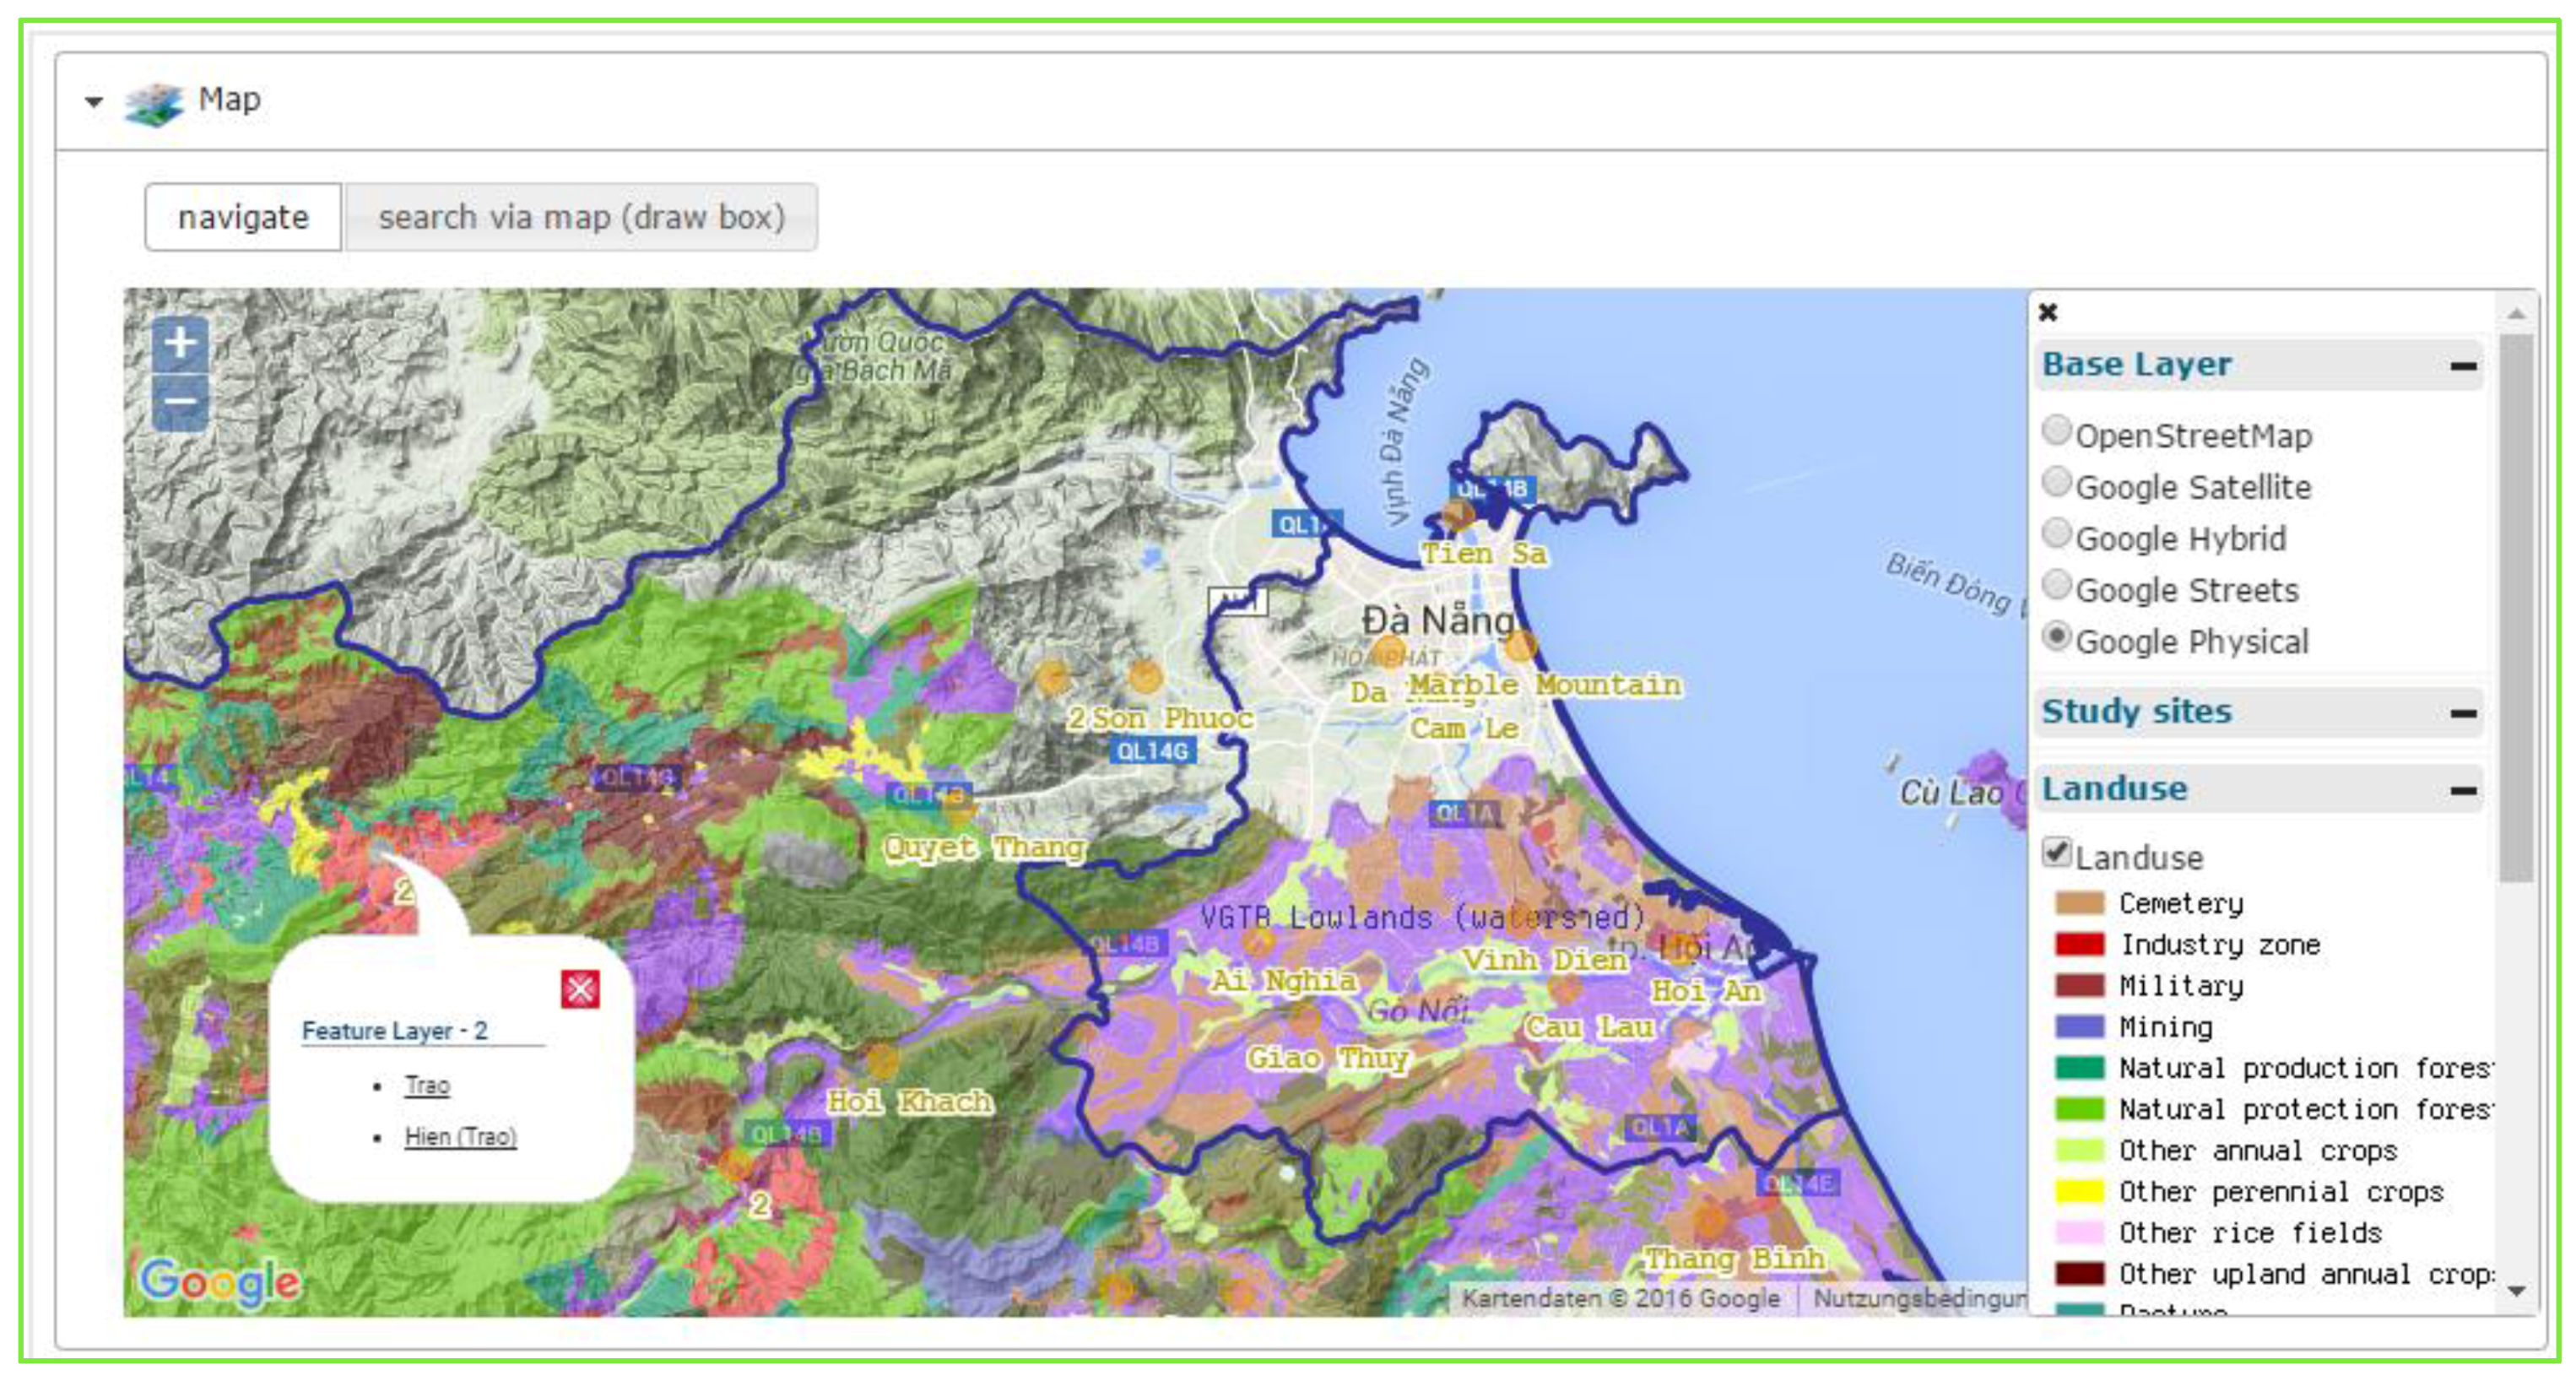
Once spatial information is available for a specific dataset, it can be displayed in maps. Point coordinates (displayed as clustered points depending on the zoom level) or bounding box extents are displayed within a dynamic filled feature layer, which will always change once the listed datasets in the overview lists are changed during filtering. Imported shape and raster files can be combined in maps and displayed in another separate web client integrated in RBIS. In general, WMS (Web Map Service) or WMS-T (WMS + Time) [
12] from internal (RBIS) and external sources can be included in every map (
Figure 3). Once an internal WMS is created, it will be automatically included in the map of the related dataset. External WMS or WMS-T sources must be configured by the application administrator, but this also allows one to create excludable layer lists.
2.3. Time Series Data
Measured or simulated time series data usually can be related to a point (e.g., measurement station), grid cells of different sizes (e.g., climate model data) or a polygon (e.g., spatial modelling entities like hydrological response units). The focus in RBIS lies on the management, processing and visualization of station data.
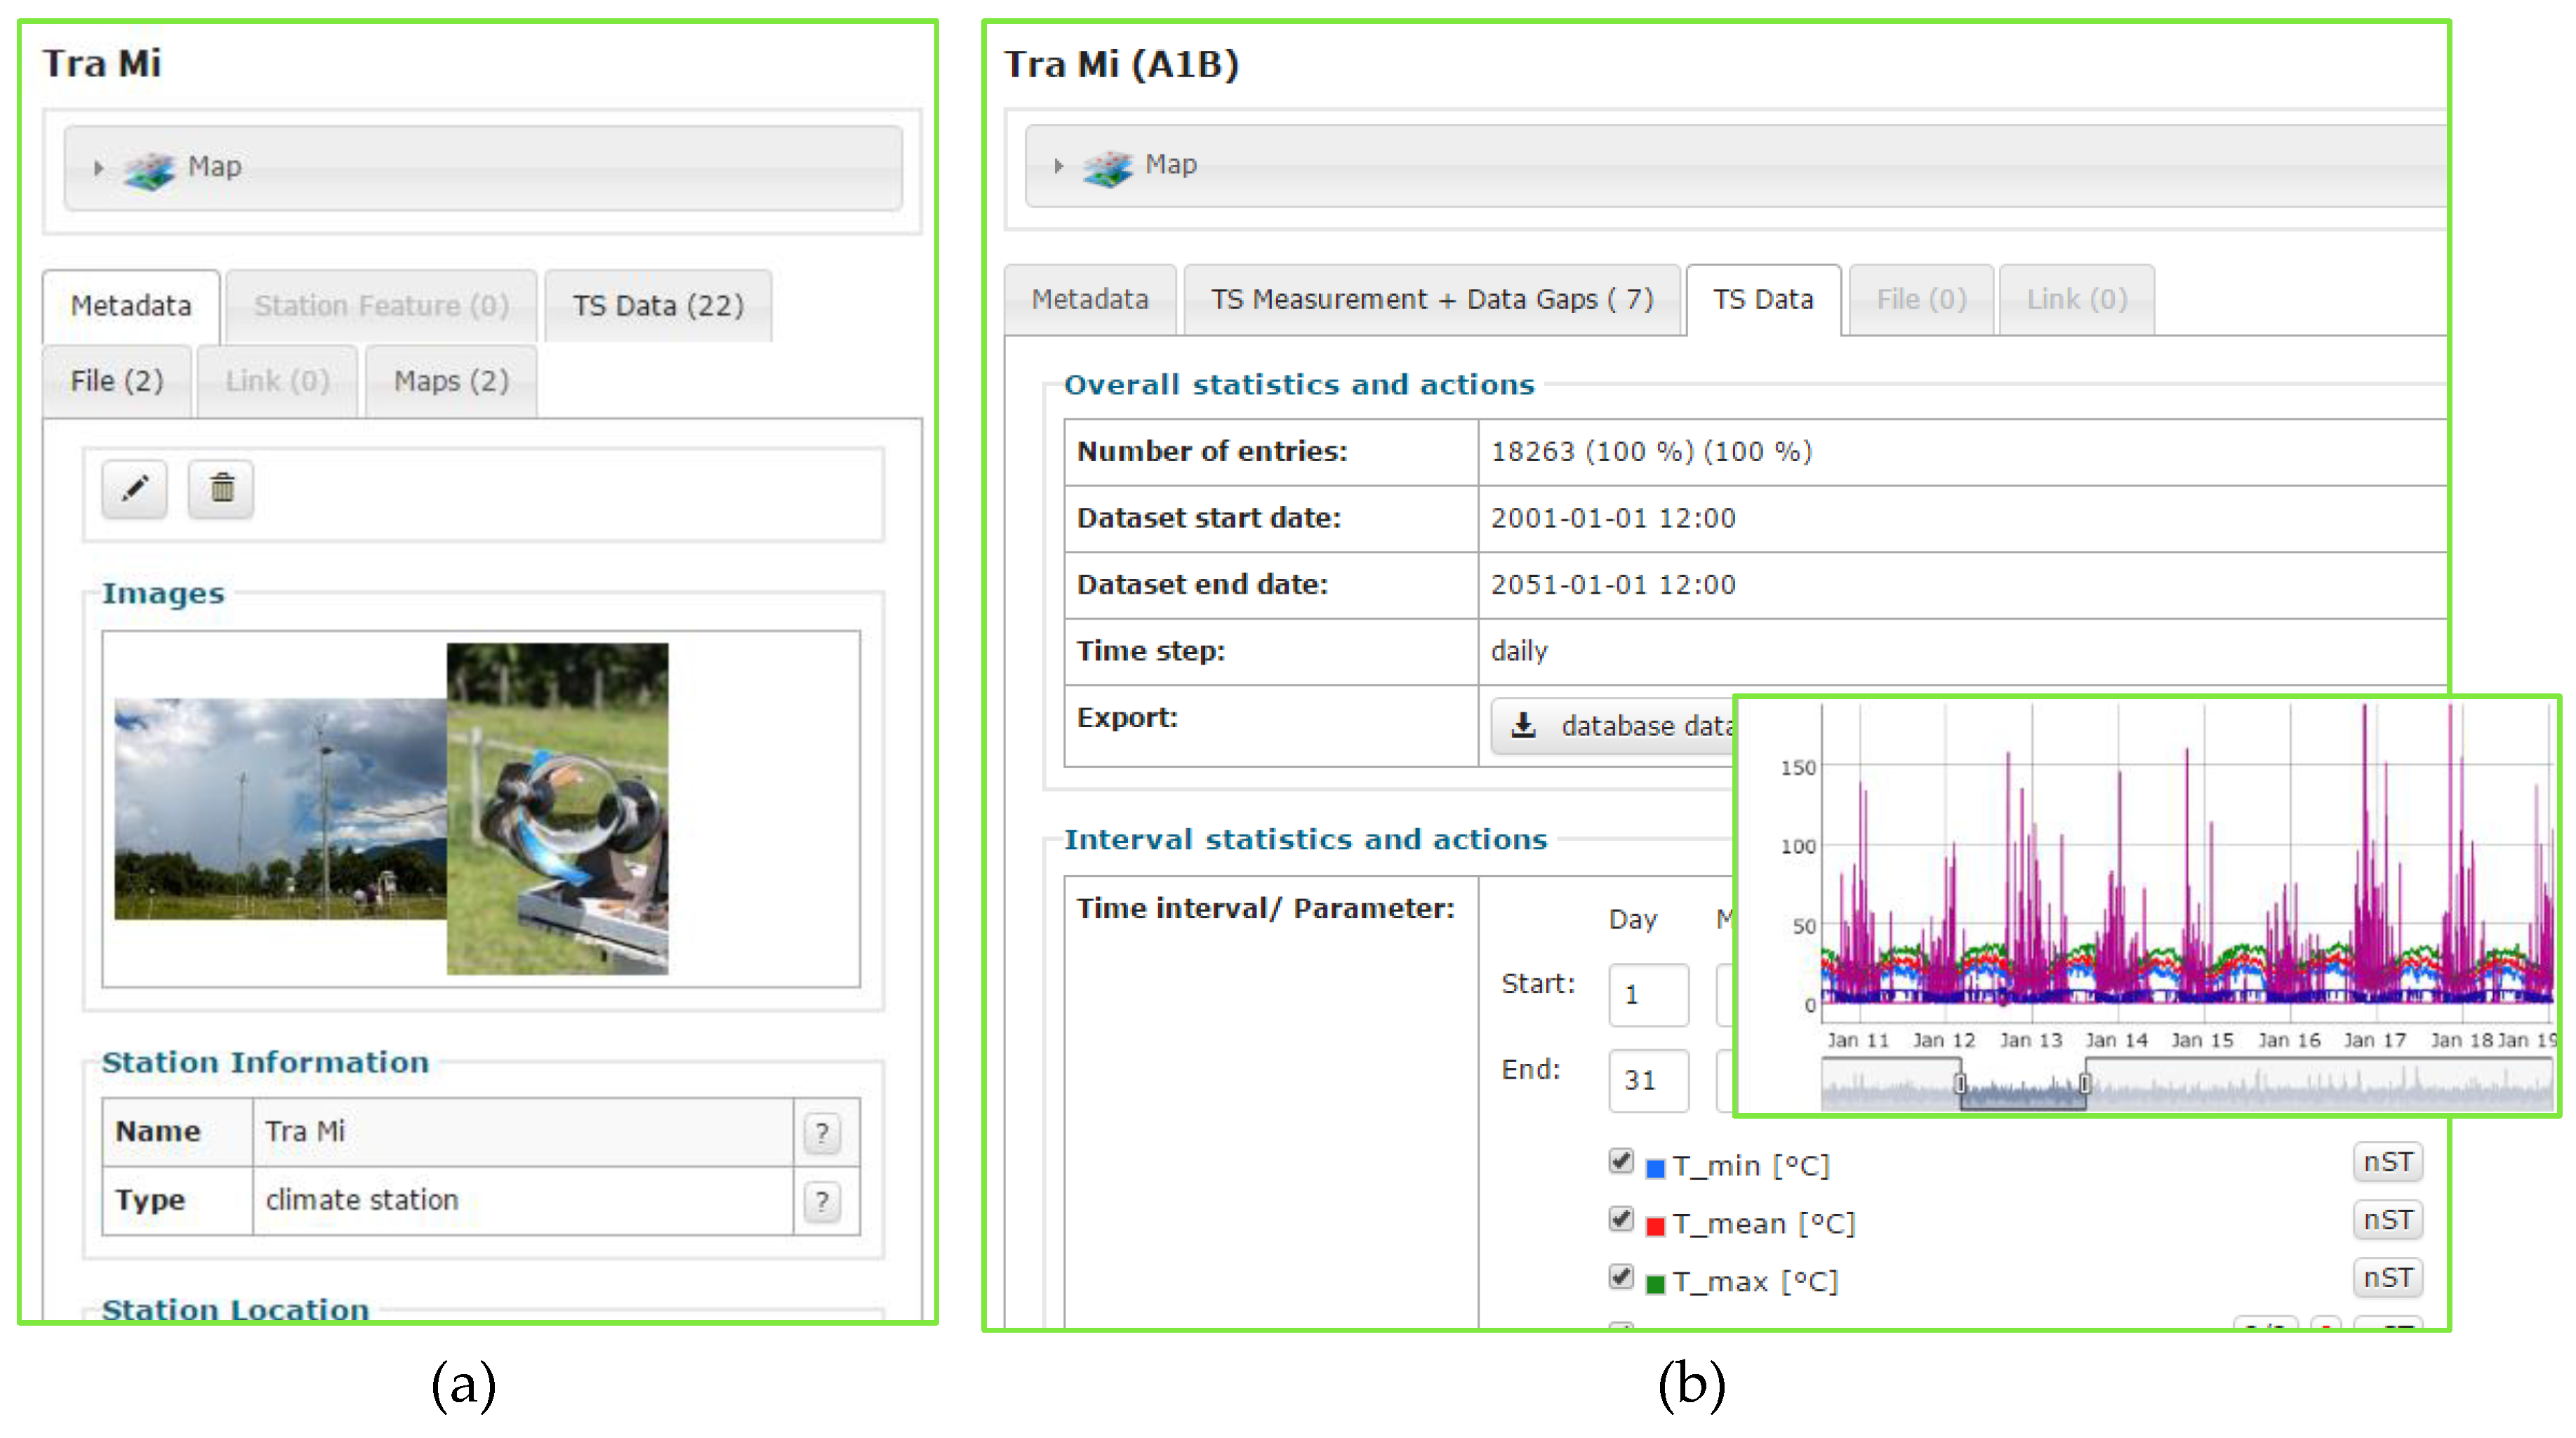
Stations are described by their name, type (climate, gauging, borehole, virtual station, etc.), spatial location (coordinates in the spatial reference system of the original source), year of establishment and, maybe, closing and responsible parties (
Figure 4a). Time series metadata can directly be linked to a station and may have one or more parameters (
Figure 5b). A time series dataset should be uploaded as text in a certain given format (for more details, see the online tutorial [
14]). Depending on the time step, gaps will be analyzed and stored as metadata. Once the dataset has been successfully uploaded, it can be visualized as an image or as an interactive diagram (
Figure 4b). To further analyze data, it is possible to explore at what distance the data of the same parameter and temporal resolution is available, how well it correlates, at which elevation and if data gaps could be filled by using one or more of the surrounding stations. With respect to data gaps, a rule-based gap filling toolbox is provided within RBIS [
14]. Data values for gaps filled by the implemented interpolation functions (e.g., nearest neighbor, linear interpolation, inverse distance weighting) are stored separate from the original data. The interpolation details (methods, parameters and time series used) are stored as metadata to ensure all provenance information related to the gap filling process is tracked. Finally, time series data can be accessed and downloaded in different ways. The following options are available:
download of the originally imported data file,
export of the complete dataset as it is stored in the database (missing date values are filled to ease further use, e.g., for modelling tasks),
export of the time series data with selected parameters in a selected time interval,
export of the time series data with or without filled gaps,
export of aggregated time series data in different time steps,
export of data from different stations (one parameter only) as needed in environmental simulation models [
15].
A further RBIS module allows one to store and manage space-time-variant data, i.e., a mixture of time series data and geodata typically given as a series of raster images. The parameters are described similarly to time series data, including parameter type, unit and description. The metadata description follows the geodata metadata profile, which is extended by additional information, such as the value for missing values and temporal resolution. The dataset itself can be stored as a file as described in
Section 2.1.1. An example could be climate model results given as netCDF files. Due to their hybrid characteristics, space-time datasets can be browsed and searched via the time series data and geodata views.
2.4. Processing Data
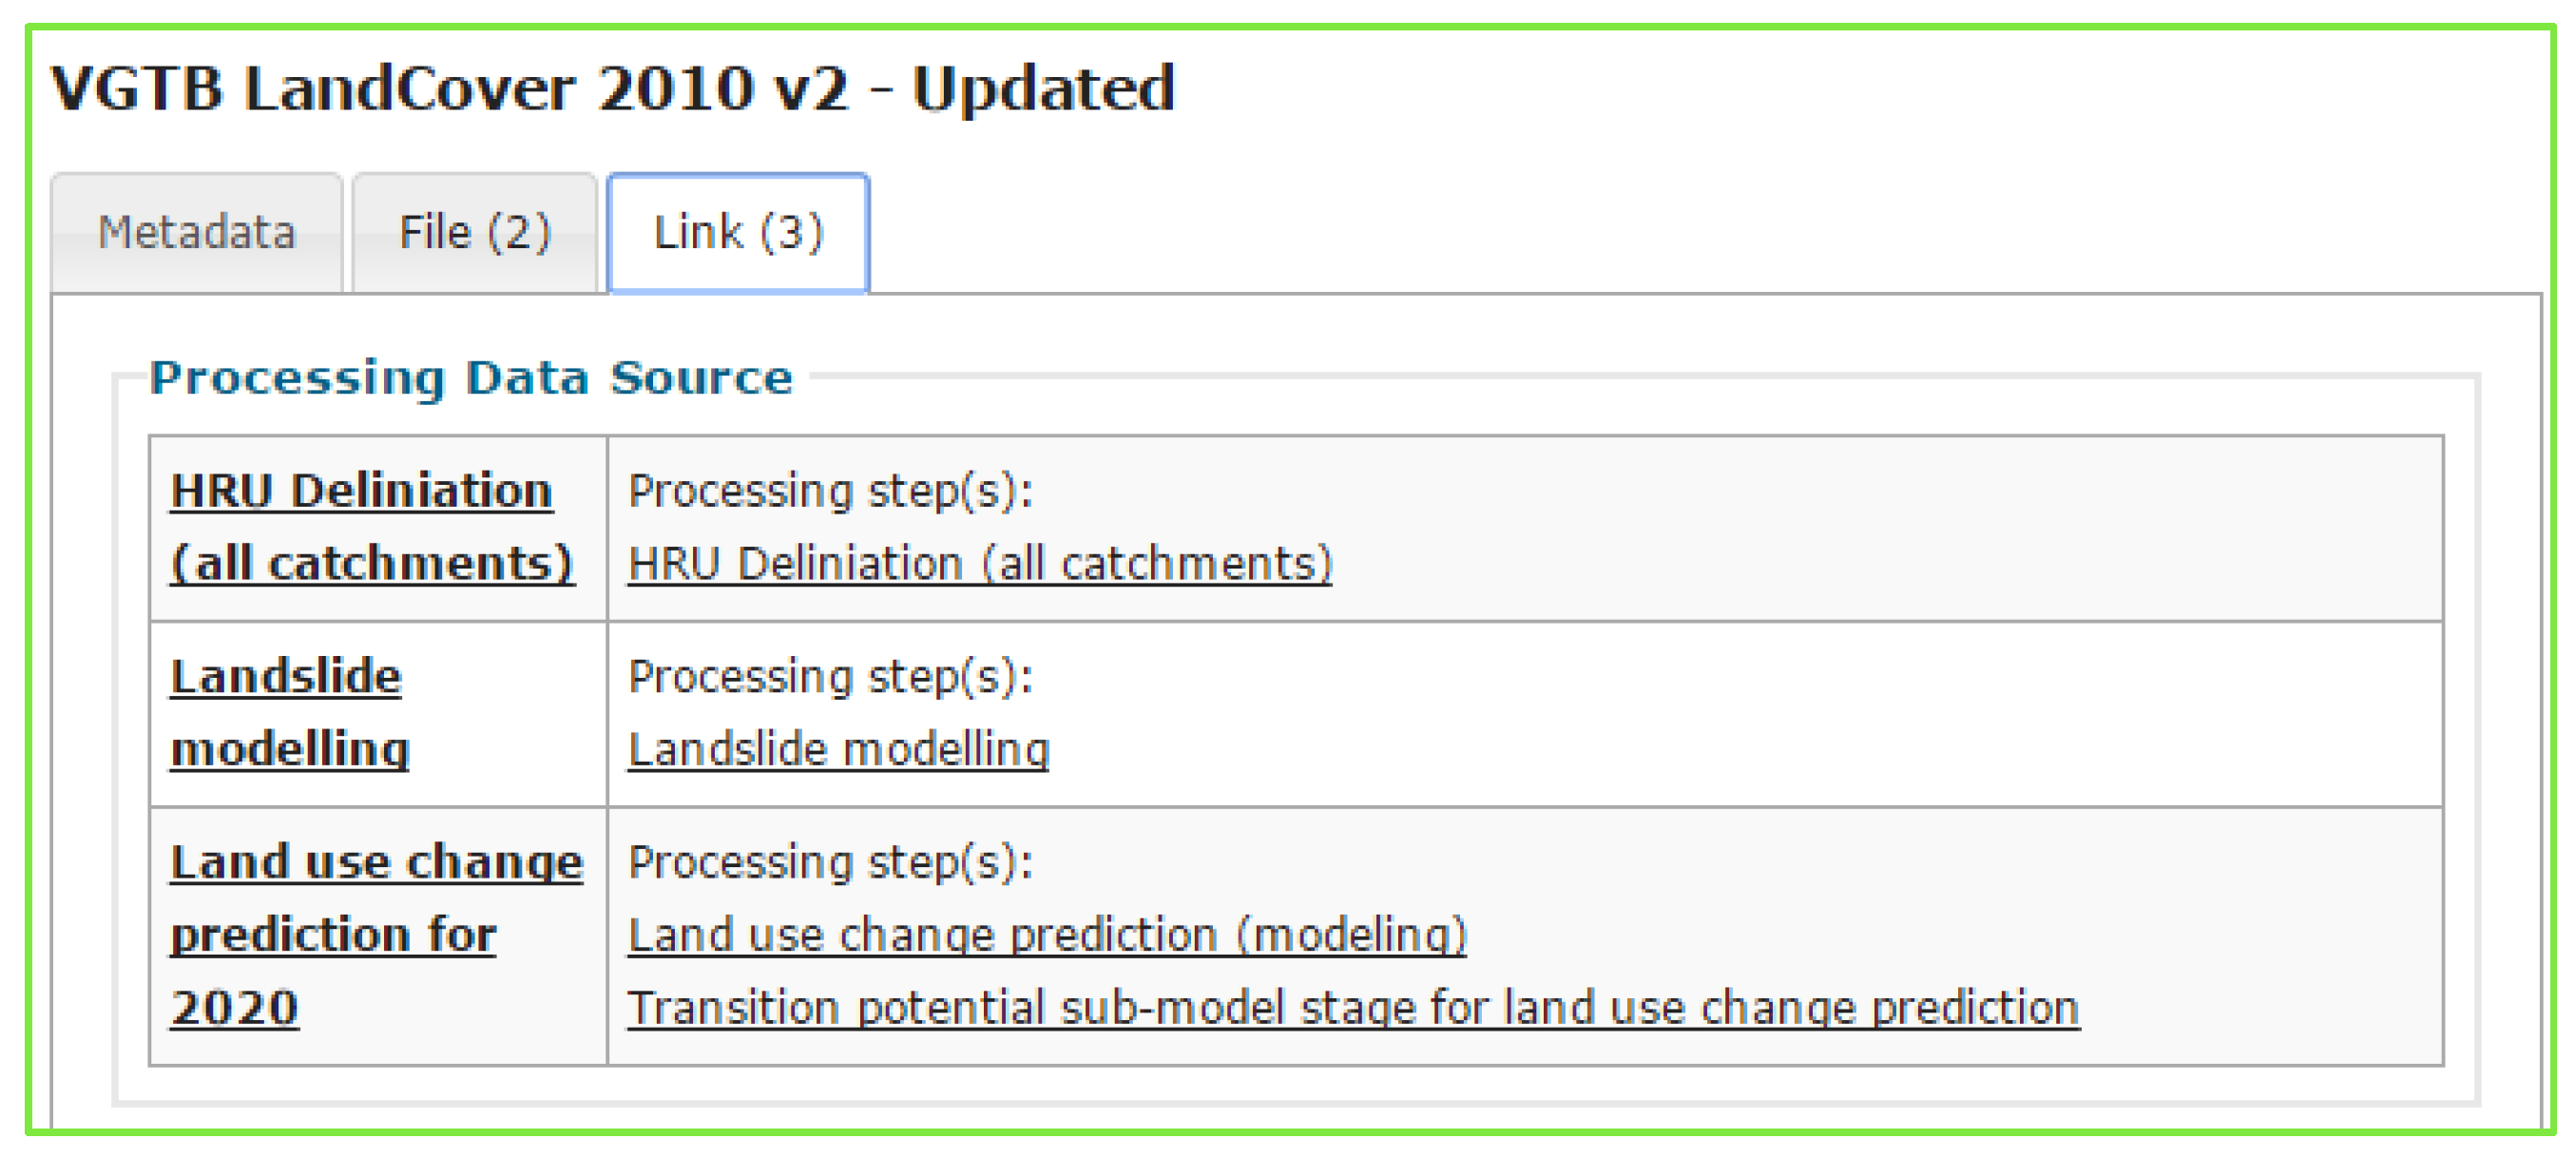
Research projects using RBIS may also have to deal with the modelling of environmental processes (land use, climate, hydrology, etc.), e.g., in the context of scenario-based impact assessment. The description of simulation software, model application and model chaining was therefore an important requirement during the development of RBIS. This is reflected in the RBIS “Processing” module, which allows the description of lineage processes. It consists of the three parts allowing to describe data source, processing software and processing step (see the next section). An RBIS dataset (e.g., time series data) can directly link to a processing step to build a linkage between result data and how it was created. Conversely, it is possible to see where a certain dataset has been used as input for a processing step, as shown in
Figure 5. The implementation aims to still allow a mapping to the lineage element of ISO 19115 [
2] to provide that information in a standardized way while allowing one to store much more detailed processing information in a flexible way. The mapping to ISO 19115 will also give the opportunity to use existing external tools like MetaViz [
16] for graph-based provenance visualizations, similar to the schematic illustration in
Figure 6.
2.4.1. Data Source, Software and Processing
In order to properly describe a data processing workflow, RBIS allows one to manage information about input data (i.e., data sources), the software and method used to process the data, the application of the software to the input data and the resulting output data.
A data source is described in RBIS by metadata with standard attributes, like name, description or responsible person. This dataset can then be linked to a list of datasets stored in RBIS or to external resources, like time series or maps. The second component to be described is the software that has been used for the processing (e.g., for modelling or data preprocessing). Special functions, modules or extensions of software can be described in a new dataset and can be linked to a parent or related software package. The finally used version of the software or module of a software has to be created as a separate dataset to avoid having duplicated descriptions. The processing step gives information about what was done, a linking input data source with the software version, creator, study site, parent or previous processing steps and output data. A process step can further be described with additional attributes, like start/end times, type of processing and, in the case of time-variant simulation, the simulation’s time period.
2.4.2. Processing Examples
One example for a processing step is the automated import of the Global Surface Summary of the Day (GSOD) data (see
Section 4.1). The software used is an automated import routine within RBIS; the data source is an FTP service that is accessed; the processing step is the import or update process itself. The date of the last process execution will be updated automatically on every update.
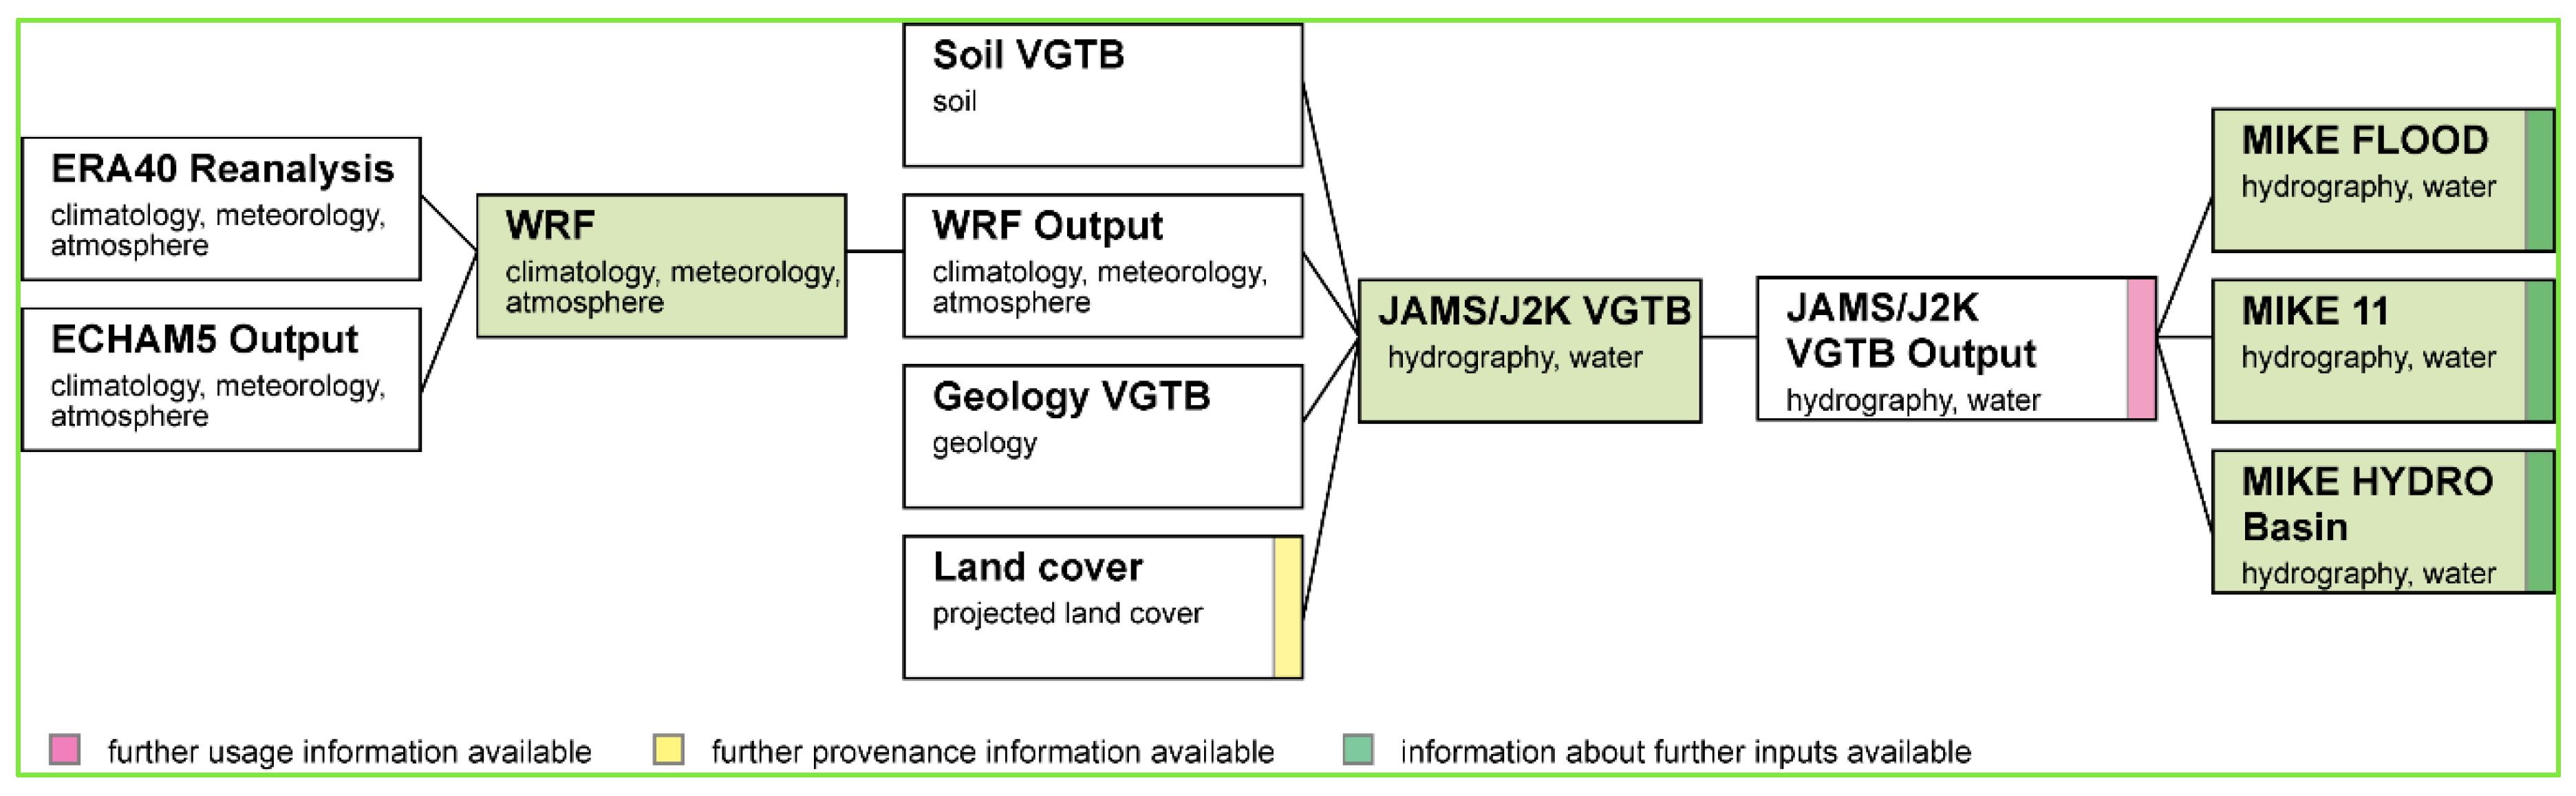
Another example of a simplified process/model chain described within the Vu Gia Thu Bon RBIS [
13] is illustrated in
Figure 6. It shows that the ECHAM5 climate model datasets of different climate scenarios serve as input data for a regional downscaling process based on the Weather Research and Forecasting (WRF) regional climate model together with historical ERA40 reanalysis datasets. The results were used as climate data inputs together with soil, geology, land cover and elevation datasets to assess the impact of changing climate and land cover on the water availability and sediment load in the Vu Gia and Thu Bon (VGTB) River Basin in central Vietnam. The simulated discharge at several points inside the basin and at its outlet have then been used as input for the application of MIKE FLOOD, MIKE 11 and MIKE HYDRO models to predict floods, saltwater intrusion and the impacts of reservoirs [
17].
2.5. Other Data
There are also some other types of data that can be managed and described by metadata. One of them is “documents”, like publications, posters, presentations or others. Datasets that do not have their own detailed description, like time series data, or that do not fit into the existing structure can be described under “other data”. This could be just a file (e.g., Excel file with any kind of information) or the description of an external data repository (see
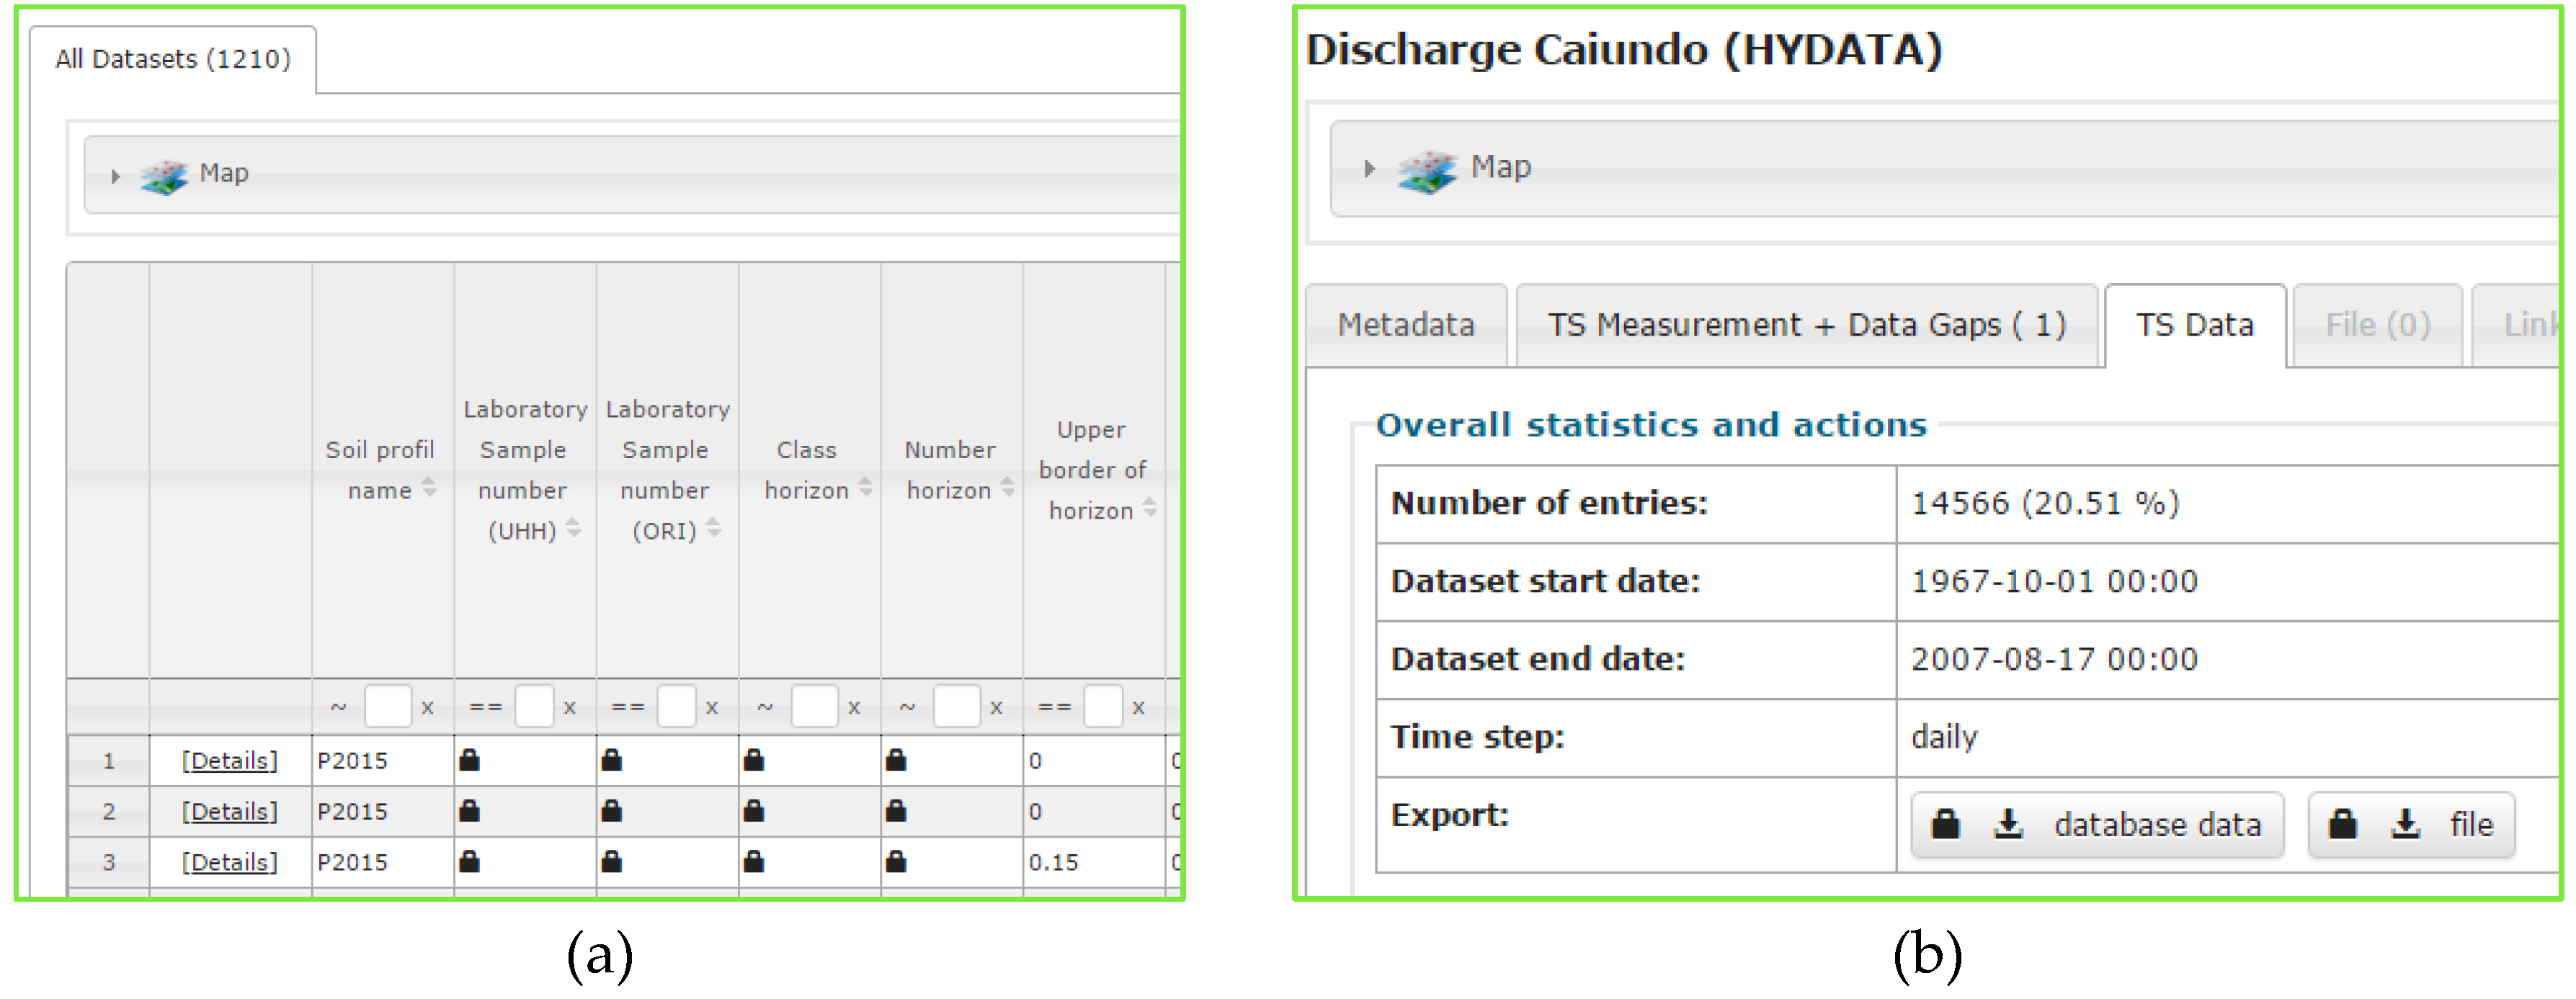
Section 2.4.1). An example of the customized description of a data type is soil information (sampling profiles and horizons). While the filter functions described in
Section 2.1.1 can also be applied to search for specific soil datasets (e.g., all samples with a certain pH value range), the locations of the resulting dataset are easily visualized in overview maps. Making use of these common RBIS functions, datasets with specific properties and in locations can quickly be identified. A list of soil horizons with restricted view and download permissions is shown in
Section 5. For all of these data types, there is a basic set of attributes, but in most cases, it needs to be extended according to the available information.
Another special type of data is information about future development scenarios and related indicators. Here, RBIS supports the description of scenarios (e.g., climate change scenarios, story lines) and can be used to link project results to them. Calculated or delineated indicators (e.g., related to drinking water, population, precipitation, food security) in different formats (e.g., single values, time series data, diagrams, maps) can be directly linked to a scenario and study area. The scenario and indicator module is a product of demands raised in a research project, where it was requested to describe a great variety of different indicator values in the context of study areas and climate change scenarios [
18].
Within many research projects, not only research data need to be shared, but also information about events, like, e.g., meetings with stakeholders, project workshops or important deadlines. To provide such kinds of functionality within RBIS, a calendar was implemented. This calendar makes use of the existing RBIS permission management system and allows one to easily attach documents (e.g., the meeting minutes or workshop presentation) to individual events. Moreover, a central RBIS notification function can be used to inform users about new and upcoming events.
3. Search and Filter
To avoid ending up with a “data cemetery” containing many datasets that are never used again, it is necessary to provide options to make stored data easily findable and available via their stored metadata. In order to achieve this, RBIS implements various functions, which focus on different user groups and application scenarios. The main focus groups are the researchers, project partners and local stakeholders who already know about the existence of RBIS. A further user group consists of external researchers or stakeholders interested in the provided data collection within RBIS. While the first group can make use of RBIS search functions, external users depend on search engines, like Google, to find RBIS. Once a user has found the system, it is necessary to help him or her in the second step to find the data and information he or she is looking for. For this purpose, RBIS allows one to view all metadata even for users not logged in to the system, i.e., including search engines that want to index RBIS content.
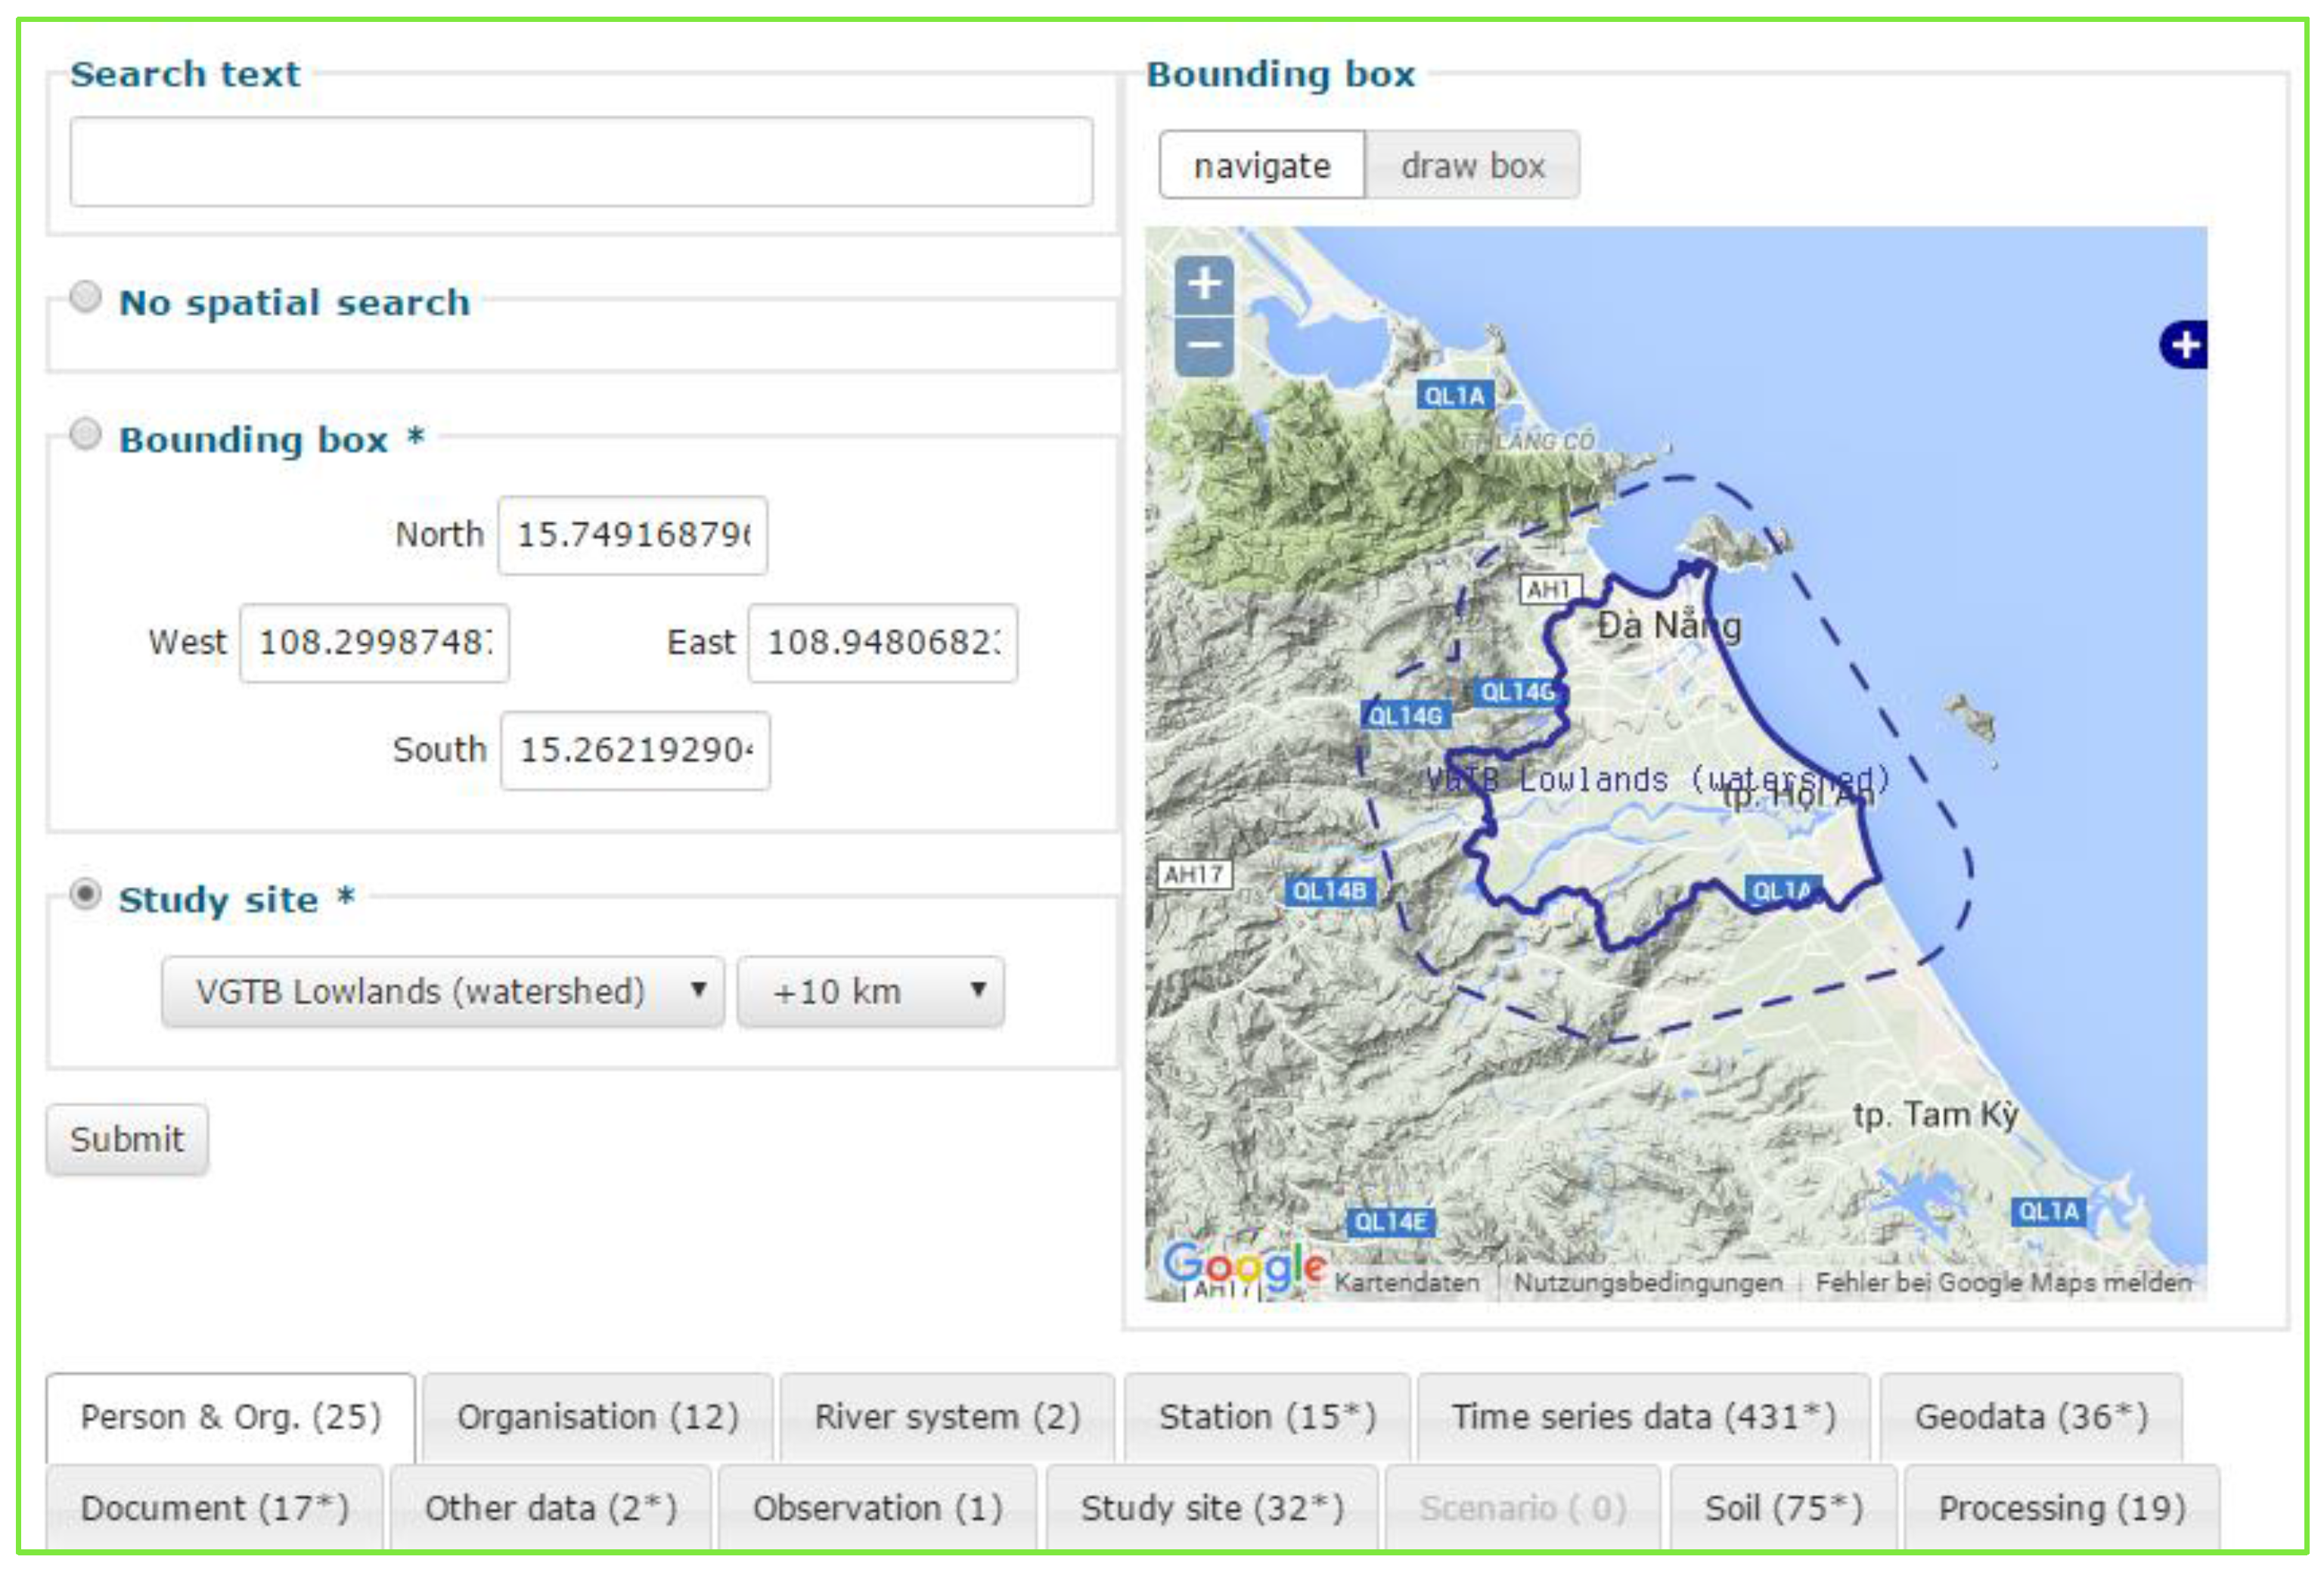
Once a user has found access to RBIS, there are several options to search for data and information. For a general overview, there is a global search function, which is based on the full text search option provided by the underlying database management system, PostgreSQL [
19]. This also includes a spatial search option based on a bounding box or a study site representing an area plus an optional buffer zone (see
Figure 7). The spatial search is implemented by using functions of the PostgreSQL extension PostGIS [
20]. As a result, the user will get a list of results grouped by their data type. Without providing any search criteria, all datasets are listed, which allows a quick overview of RBIS content. Study site, extent and spatial buffer can also be set as temporary or permanent filters, which are automatically applied for subsequent searches, regardless of dataset type. This function can be used to create individual views or to reduce the amount of presented datasets in RBIS installations covering larger regions, e.g., as found in the Southern African Science Service Centre for Climate Change and Adaptive Land Management (SASSCAL) Information System (IS) [
21], which covers the area of the whole of southern Africa and belongs to the science service center SASSCAL [
22].
Another option to search for datasets is to directly open the overview list of a type of data (e.g., “time series data”). Here, the user can search via a map (bounding box) or use the filter options described in
Section 2.1.1. Furthermore, there is a text search over all attributes of a data type as a free text search or with the help of predefined lists showing only used items.
Finally, datasets in RBIS are also exposed via its integrated Catalog Web Service (CSW) interface (see
Section 4). This open metadata exchange standard also provides search functions, which thus can be used to find and access data in RBIS.
4. Interfaces and Services
As the system aims to integrate data from different sources, to provide data for further use (e.g., for modelling) and to inform about existing data in a standardized way, several service interfaces are implemented. Other interfaces support the automated import and preprocessing of time series data from different sources or the export of data in specific formats. These import and export interfaces and services are briefly described in
Section 4.1. The third option is the exposure of metadata via the standardized CSW. Its integration and usage is shown in
Section 4.2.
4.1. Integration with Data Providers and Users
Beside the manual import of data and metadata via its web frontend, RBIS provides various functions for the automated import and preprocessing for selected data types. One example is the interfaces for the automated import and update of time series data. The data can be located locally or in online repositories, as well as from web services. One of those online repositories is the Global Surface Summary of the Day (GSOD) product. Provided by the National Climatic Data Center (NCDC) in Asheville, USA, GSOD is a global, freely-available climate dataset based on World Meteorological Organization (WMO) weather stations and the Integrated Surface Database (ISD) (DSI-3505) [
23,
24]. When importing these data into RBIS using automated functions, units are converted from English to SI-units [
15]. GSOD data do not substitute the need for further time series data acquisitions necessary for in-depth analyses in a region, but help greatly in the early stages of research or if no other data are available. Similarly, climate data measured at weather stations all over Germany and provided by the Climate Data Center of the German Weather Service [
25] can be easily imported into RBIS.
A further use case for automated data import is the continuous integration of online measurements done within individual research projects (e.g., soil moisture data). Once data can be requested or accessed by the RBIS server, import processes can be easily configured by a user or customized data reader implemented by the administrator. For the configuration by a user, the data must be in a certain format (date and parameter in columns). Furthermore, it is necessary to create a preprocessing rule (column delete list, allow deletion of duplicate dates) and to combine it with an import rule describing the data source location, file name rule (prefix), time series data import template and link to the destination dataset. All kinds of import or update processes implemented in RBIS can be described and linked with the process description introduced in
Section 2.4.2. Not just data imports, but also the creation of metadata datasets can be automated based on a set of equally-structured base data and predefined templates.
For further use and analyses of data or metadata in external tools, it is important to have functions for mass export and download. One of them is a function for metadata export in the CSV format. Datasets exported like this can be easily compared, checked or analyzed in external tools, like MS Excel, and allow further processing and analysis of data. RBIS also includes specific functions for exporting data to the Jena Adaptable Modelling System (JAMS) [
26], allowing one to easily provide time series data inputs for a large variety of quantitative and qualitative hydrological simulation models.
4.2. Services
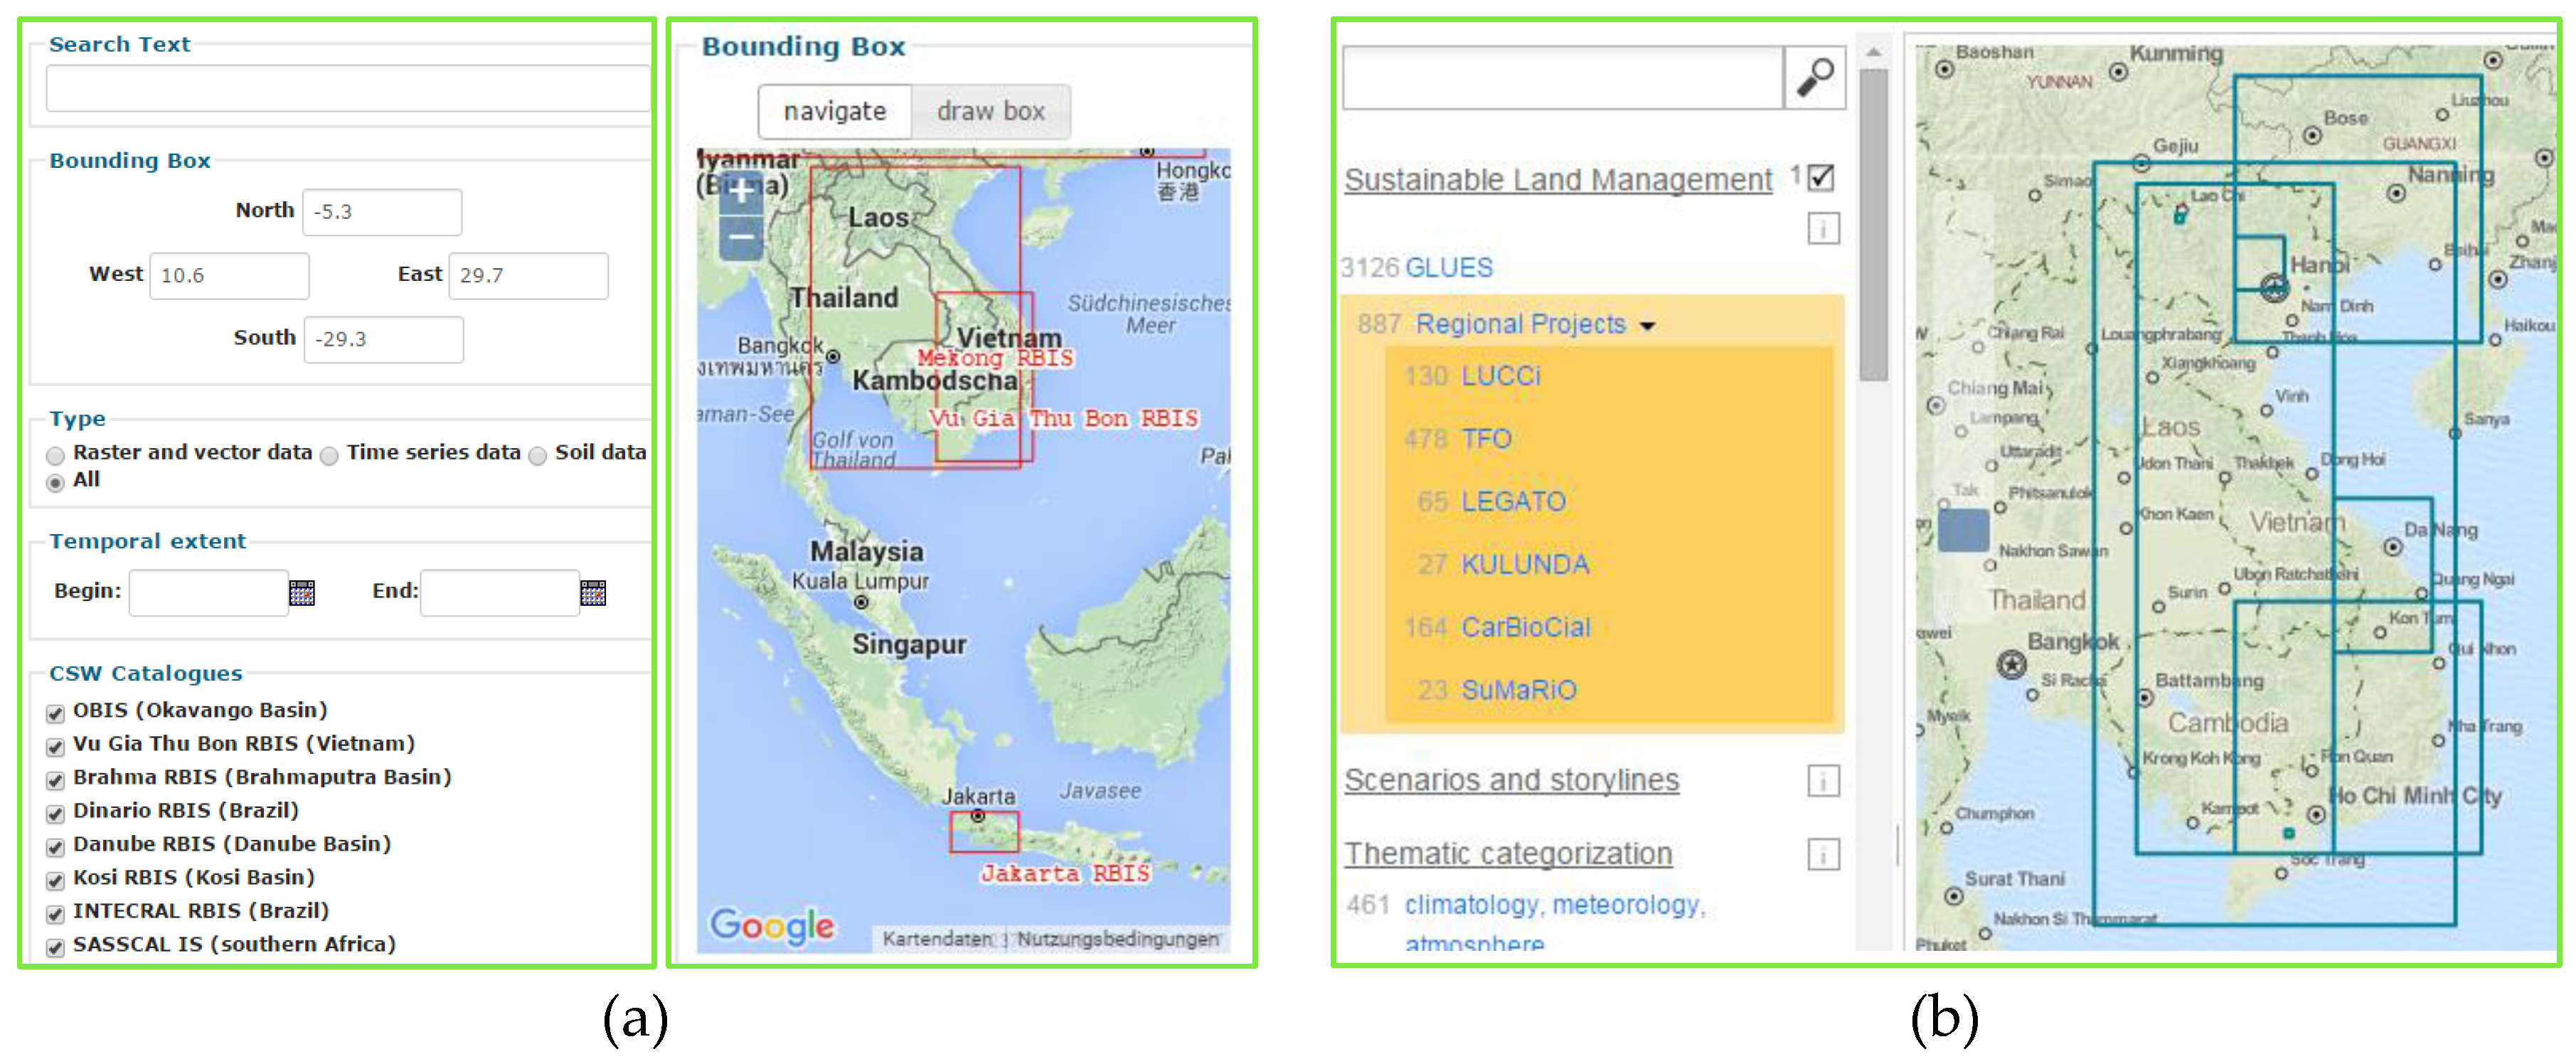
To expose metadata about raster, vector, soil and time series datasets on the Internet, an OGC standard-compliant CSW [
3] based on the pycsw implementation [
27] has been set up and integrated. While exposing only datasets that do not have any read permission restrictions, the RBIS CSW can be accessed from any CSW client. Examples are a web-based search interface, integrating a number of RBIS instances [
28] and the GLUES Geodata infrastructure [
29] (see
Figure 8), a joint data and service platform for research projects worldwide funded within the research program “Sustainable Land Management” of the German Ministry of Education and Research (BMBF) [
30].
The setup of a Sensor Observation Service (SOS) [
31] for time series data based on istSOS [
32] is currently under development.
5. Administration, User and Permission Management
For the administration and maintenance of RBIS instances, it is necessary to care about the general configuration (e.g., overall spatial extent, UTM zone for distance calculations, activation or deactivation of modules), user and permission management, user support, error detection and reporting and the collection of user demands. All write accesses (user name, type of action, date, error message and snapshot of the previous state of the dataset) are logged, and recent changes are shown under the menu “report”. Furthermore, notification mails can be sent automatically, to keep project members informed about new or changed datasets.
The user and permission management functions in RBIS provide fine-grained options to protect or publish metadata and data. For this reason, any access to RBIS requires the use of a user account. The creation of user accounts follows a two-step procedure. First, a user can apply for a user account via an online registration form. In a second step, the system’s administrators will decide if a user account is created and which general permissions will be granted (e.g., permission to read, download or modify information). Once the account is created, the user will be informed about his or her user account and password. Accounts may further have expiration dates. The assignment of view, export or manipulation permissions to a user account is done by the assignment of permission groups. Those freely-designable groups indicate which type of permission is granted within each of the different RBIS modules. The permission management via groups is based on the assumption that everybody within a project is allowed to have access to all datasets within a module, and user accounts are only provided to project members. As this assumption does not fit always with the requirements, it is completed by a dataset-based permission management with an assigned owner. Such requirements can originate from dataset owners (protection of intellectual property), use restrictions of datasets (license, use limitation), as well as from the demand to provide user accounts for external users, like local stakeholders or other researchers. In addition to the group-based permissions, each dataset can have individual permissions, i.e.,
Public metadata and data
Public metadata, data download for registered users (default)
Public metadata, data download on request
Metadata visible for registered users, download for registered users
Metadata visible for registered users, data download on request
Metadata and data not accessible
Data in this case refer to uploaded data, like documents or time series data (
Figure 9b), but can also be related to single fields, as shown in
Figure 9a.
All RBIS instances have per default a guest account (guest/guest), which is an account with view permissions. With the option for an automatic guest login, it is not necessary to always actively login, which is a very useful and successful option to allow search engines to index metadata datasets.
6. Software Components and Architecture
The software framework RBIS is built on open source software in a modular way to ensure an easy reuse and adaptation of the system for different research projects and their demands. The system as a whole can be used and modified without any restrictions or license fees. It is possible to run it in different environments, e.g., in a native Linux installation on a server or within VirtualBox [
33] in a virtual environment as a copy on a local computer with or even without Internet access. This is not only useful for presentations for locations without or with insufficient Internet connectivity, but it is also an easy way to distribute the whole system for further use at the end of the research project to local stakeholders or organizations. The software components used and the internal application structure of RBIS will be explained in the following sections.
6.1. Software Components
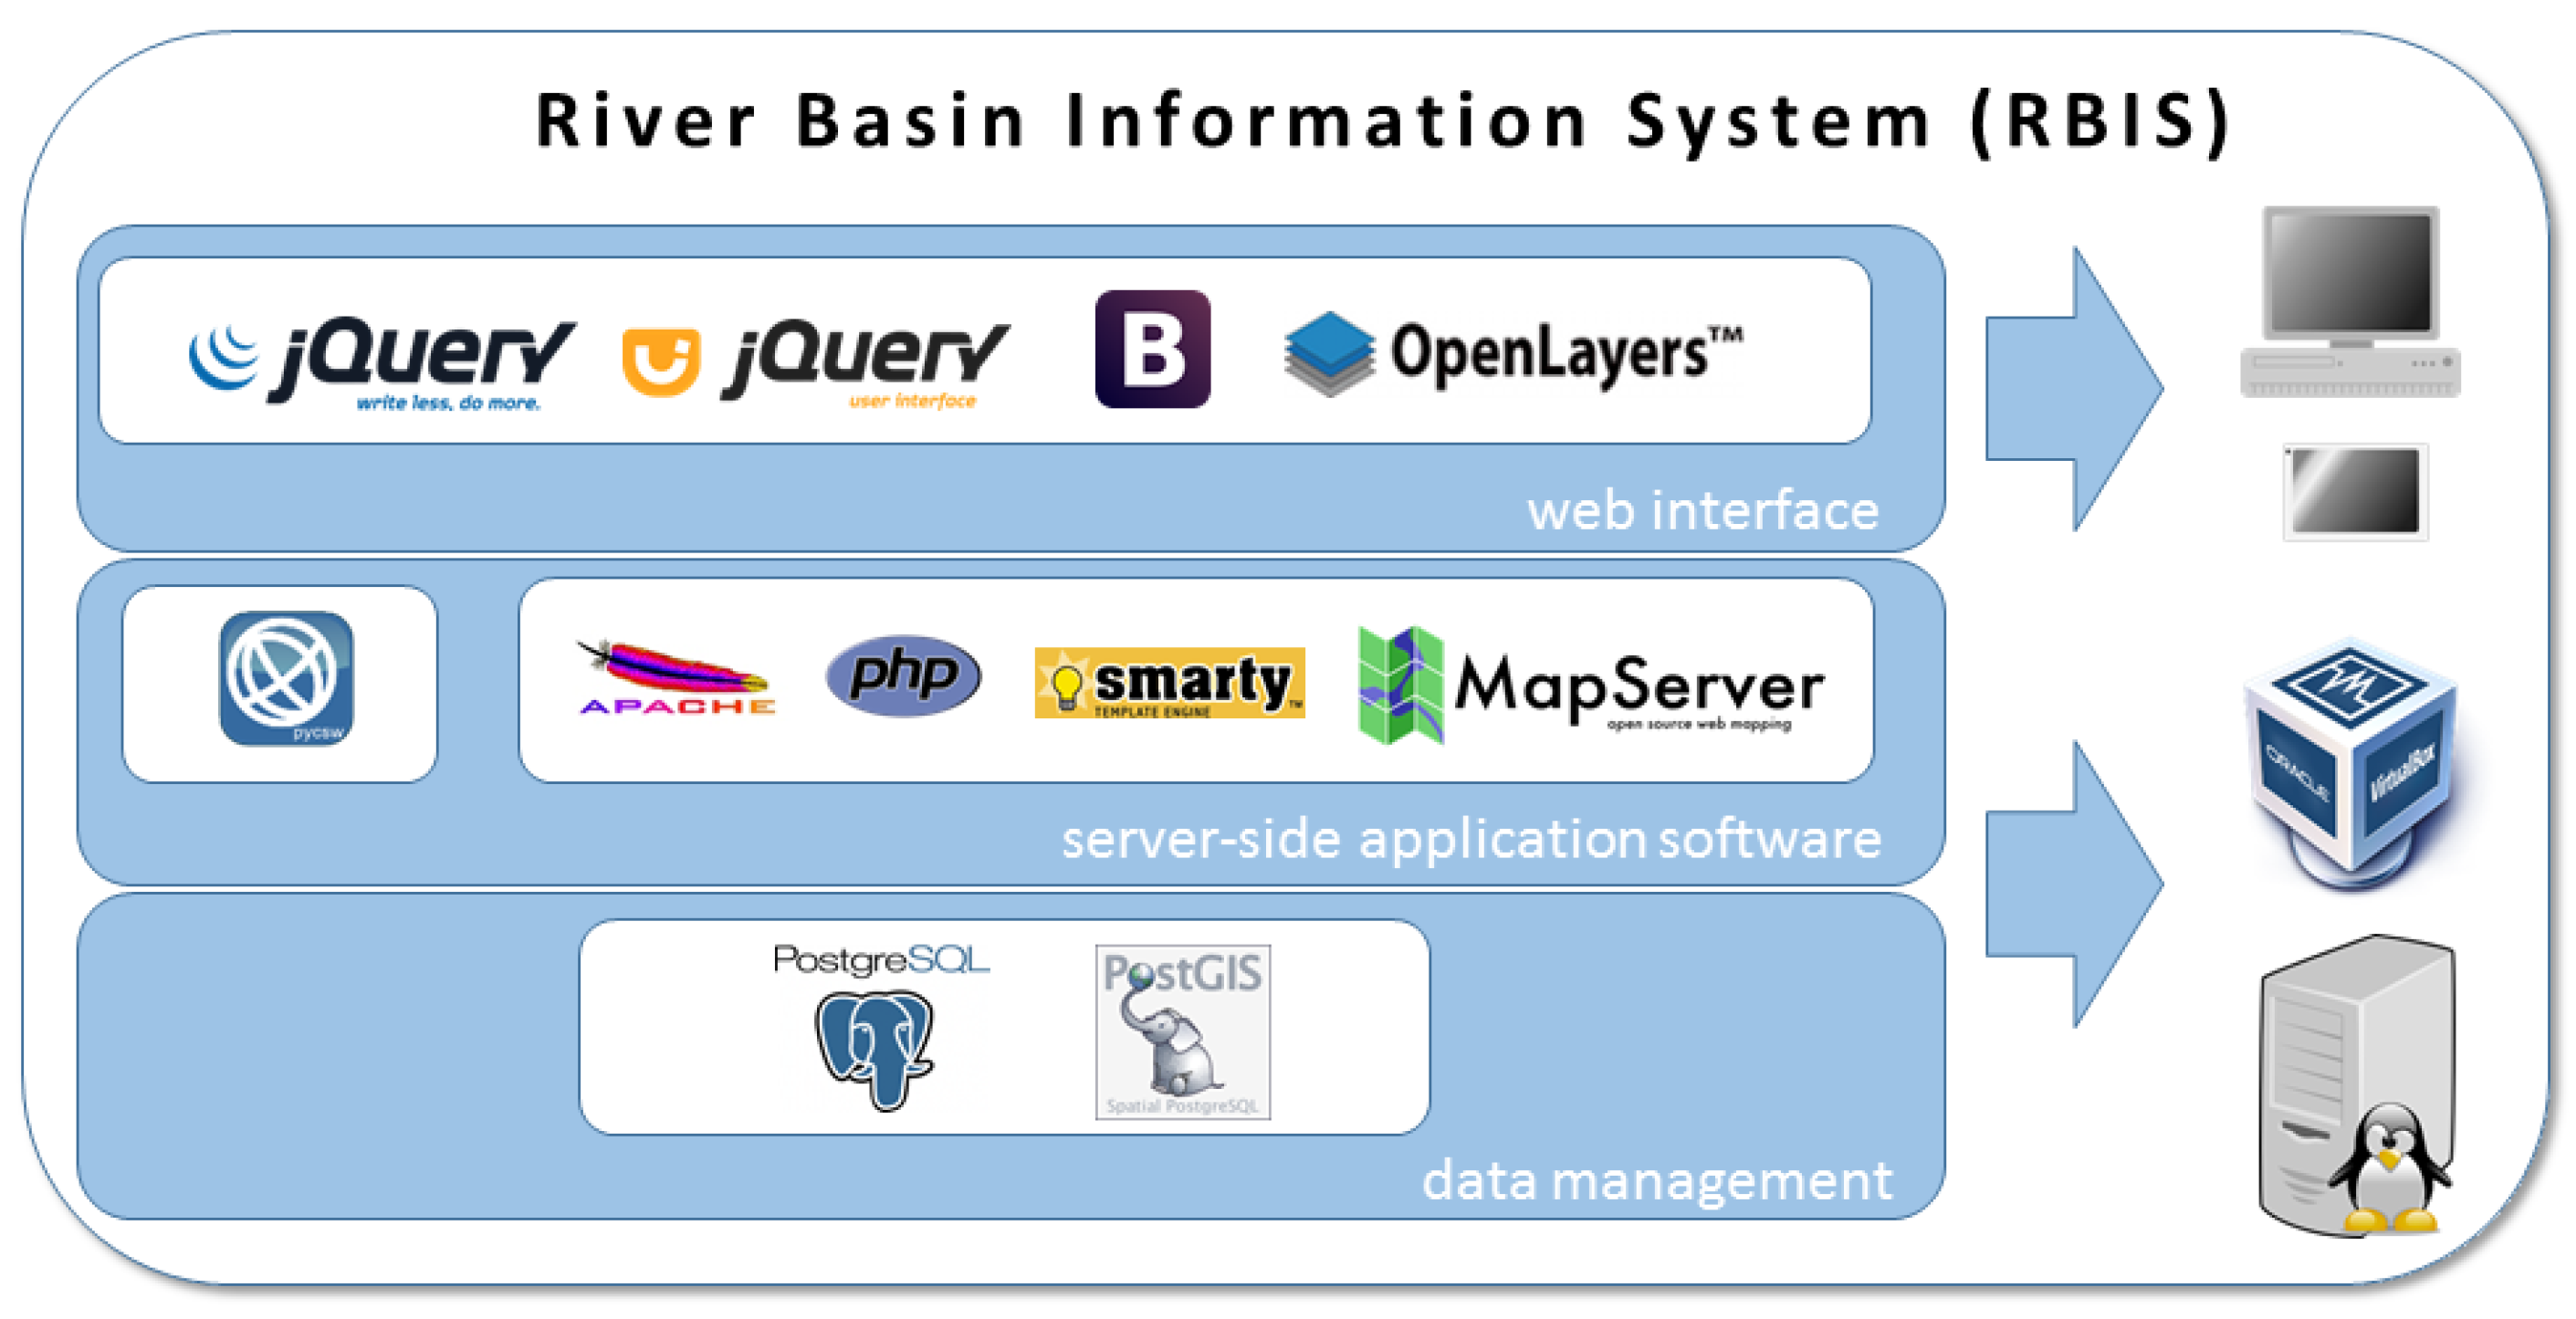
RBIS is built for a Linux environment and was successfully deployed on the Debian and Ubuntu operating systems. The major software packages used and their role within RBIS are shown in
Figure 10.
The database management system PostgreSQL [
34] together with the PostGIS extension [
20] is used to store application data (e.g., user accounts), metadata and parts of the data within RBIS.
The main part of the RBIS logic is written in PHP [
35]. The Apache HTTP Server [
36] is used as a webserver. The template engine Smarty for PHP is used to separate application logic and content from its presentation [
37]. Furthermore, for the processing and creation of maps, MapServer [
38] is used. To expose metadata of spatially-related datasets, the CSW server pycsw [
27] written in Python is integrated.
For the web-based frontend, the Bootstrap [
39] web framework together with different JavaScript libraries (e.g., jQuery 1.11 [
40] and jQuery UI [
41]), are used to create a user-friendly and intuitive graphical user interface. For the display of map data in web browsers, OpenLayers 2 [
42] is used. The use of an older version of both jQuery and OpenLayers ensures the compatibility of older web-browsers still in use, especially in developing countries.
6.2. Application Architecture
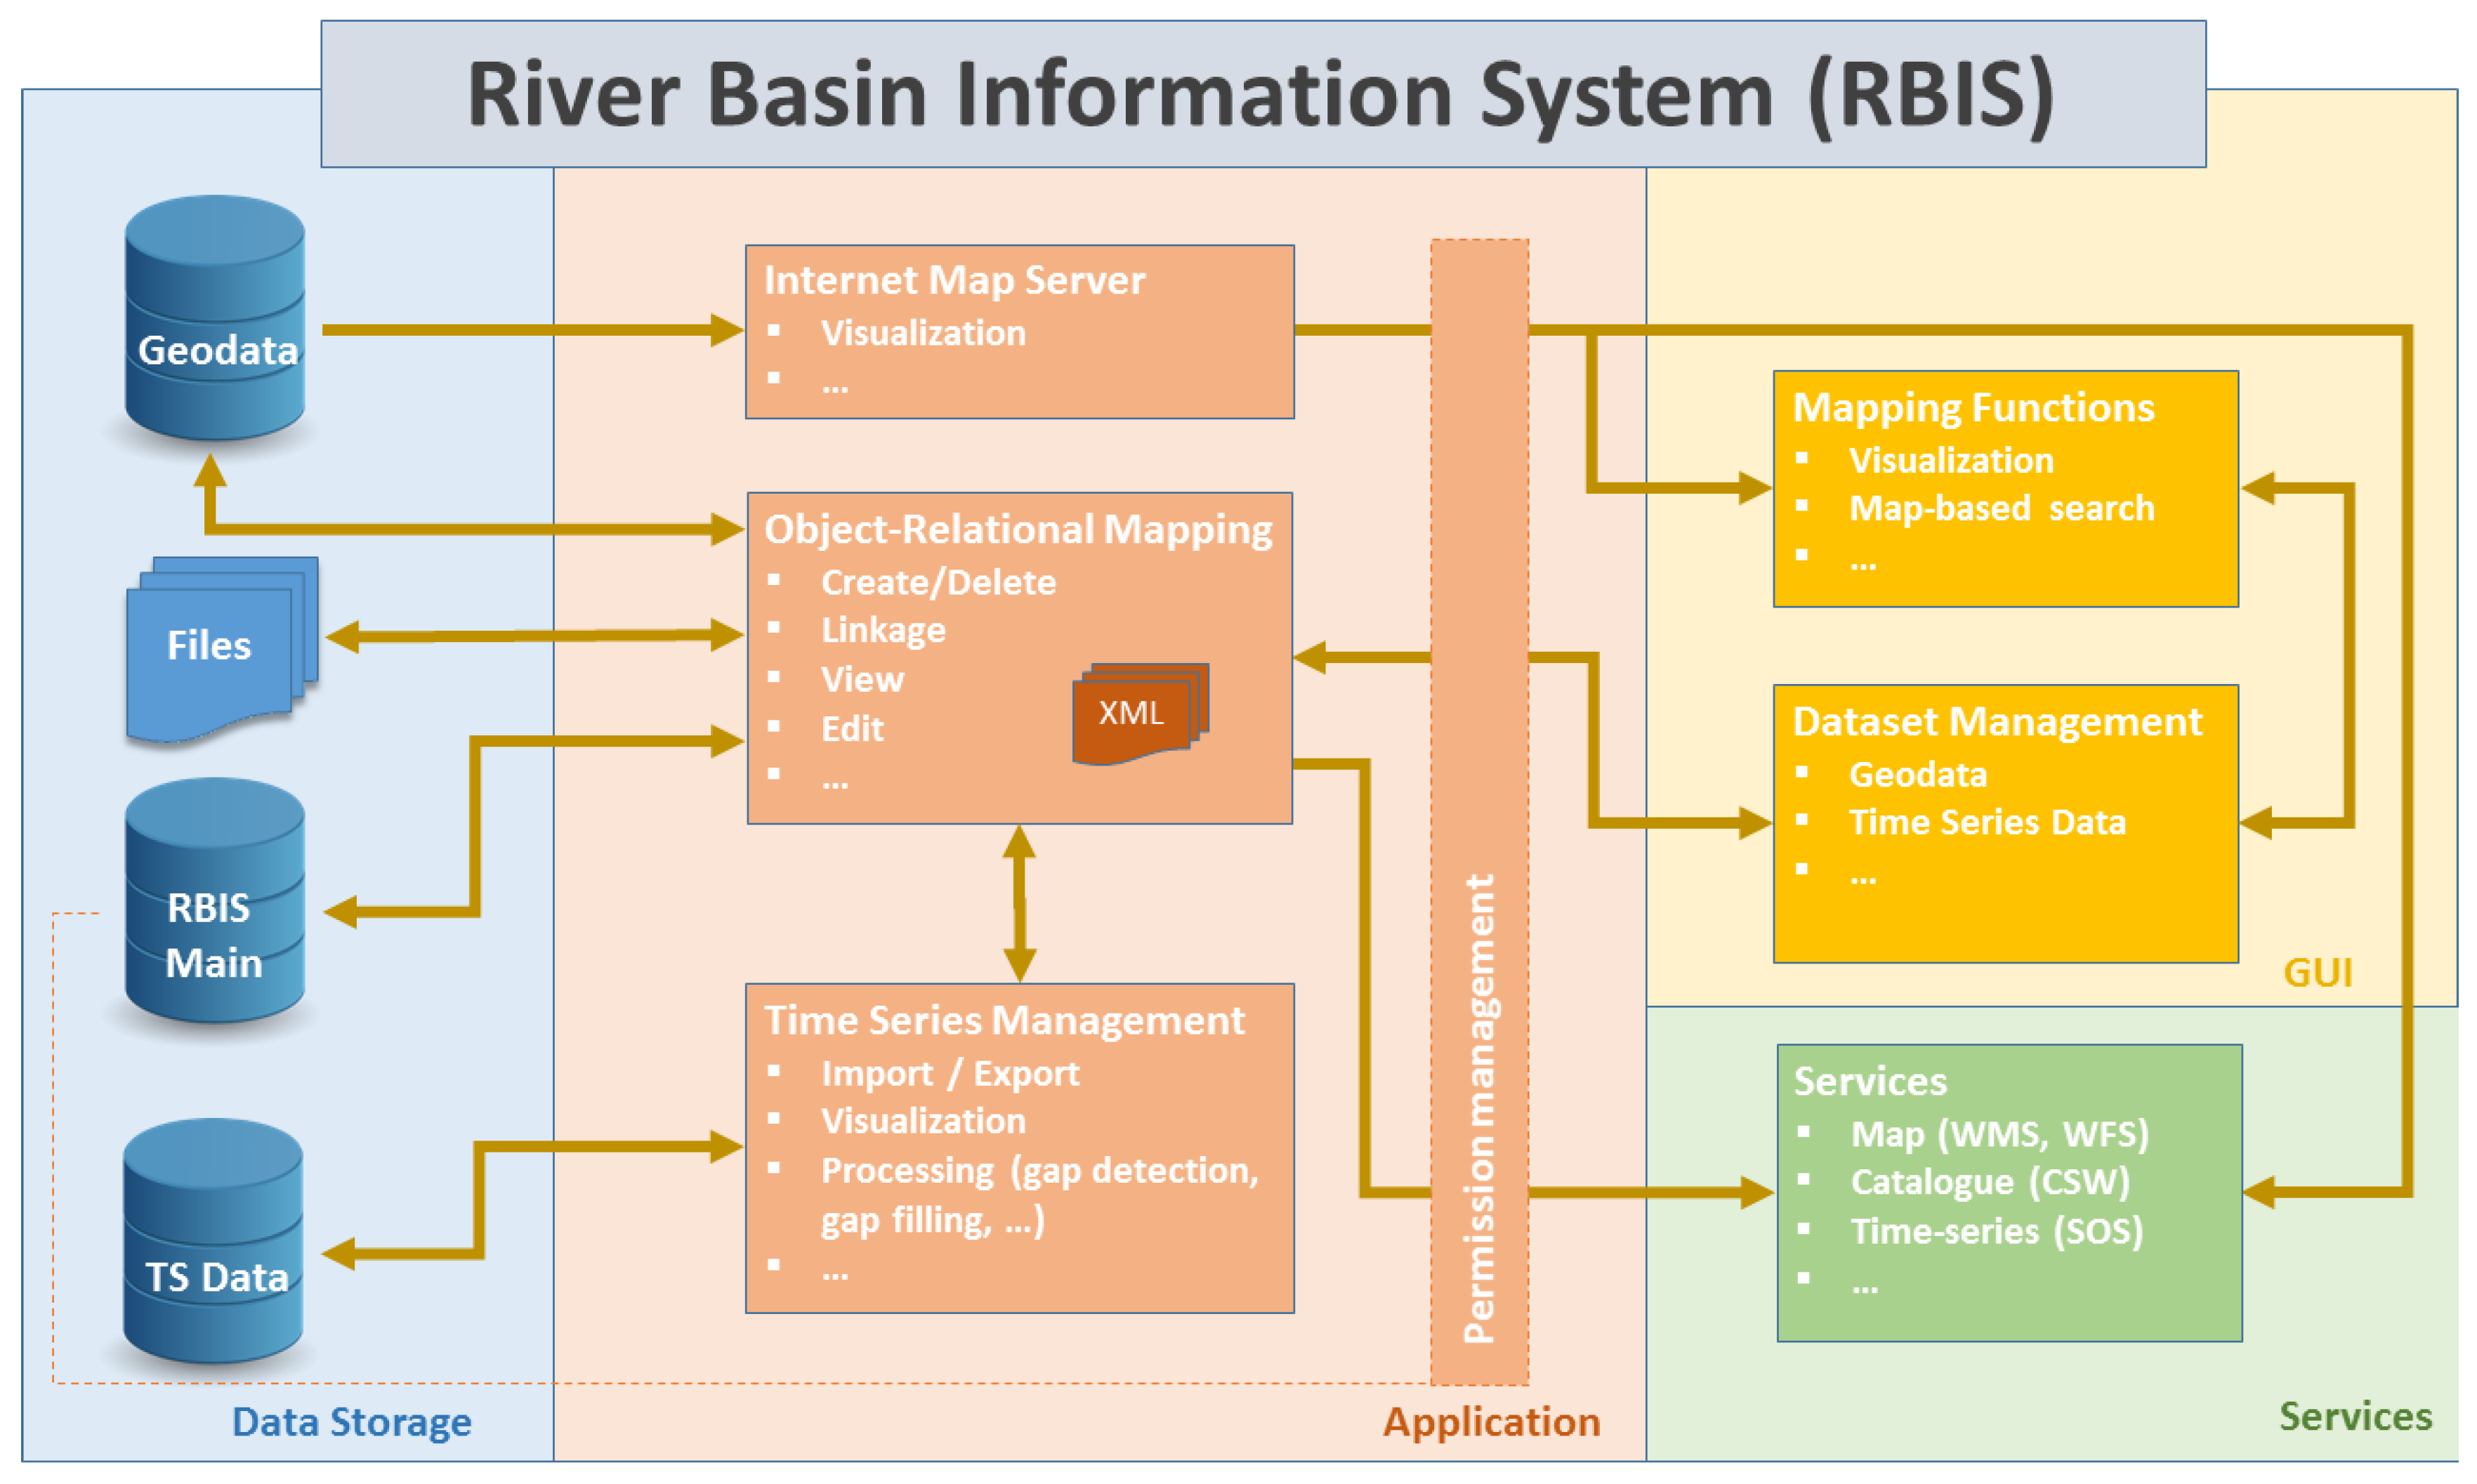
The structure and main functional components of RBIS are shown in
Figure 11. The data storage is organized in three separate PostgreSQL databases. The main RBIS database is used for storing application data, metadata and other data. The storage of the metadata is based on a full implementation of ISO 19115 as the relational database schema extended by data type-specific tables. Geodata and time series data are managed in separate databases. Time series data are organized in generic tables, each associated with one time series metadata dataset. The date value is stored as a UNIX timestamp for easier processing during gap detection and filling. Values are stored as all equal, independent of their parameter type, each parameter one column. All changed values (e.g., from gap filling) are stored in separate tables to ensure that the original dataset will never be changed. Prepared database views simplify the access of gap filled time series data, e.g., from external applications, like simulation models. The geodata database manages imported map data (e.g., Shapefiles) and the Mapfile configuration for the MapServer. All uploaded files (e.g., time series data, documents, pictures) are stored in the file system of the server.
The RBIS framework is written on the server-side mainly in PHP following object-oriented programming paradigms. The common access to stored metadata datasets (e.g., persons and organizations, stations, geodata, time series data, etc.) is realized with a description layer [
43] using XML documents to hold all information needed for access, manipulation, visualization and linking of database contents; e.g., in case of the creation or change of a dataset, the data will first pass several checks against the expected type, while a second step will generate all required SQL statements in a delineated order based on a dependency analyses. The implemented object-relational mapping allows one to easily adapt the application logic and frontend to changes in the underlying database schema, e.g., in order to adapt to the specific requirements of a research project. RBIS does not use one of the existing object-relational mapping tools for PHP, as they have not been shown to provide the flexibility that is required for RBIS.
XML documents also hold information on how datasets or other components of RBIS are interlinked. An important one is the “Time Series Management” providing import and export functionalities, as well as processing steps, like gap detection or filling. Depending on the amount of possible data values (e.g., more than 2,000,000 values) and access permissions (e.g., no download permission), time series diagrams are either visualized as an image with the help of the open source graph library JpGraph [
44] or as an interactive diagram at the client side using the open source JavaScript charting library dygraphs [
45].
The graphical user interface of RBIS for the management of different types of data (e.g., geodata, time series data) is created based on templates using the Smarty template engine [
37]. The jQuery Grid Plugin jqGrid [
46] is used for the overview list of datasets. In comparison to other similar JavaScript libraries for visualizing data tables, jqGrid performed best under the given conditions and requirements. To reduce requests to the server, the full list of datasets is loaded only once and rendered on demand. This means once the list is loaded, no further requests to the server are necessary for sorting and filtering, which is a big advantage if the available Internet connectivity is low.
Once there is spatial location information related to a dataset, the RBIS mapping functions are activated. The location or bounding box of datasets is displayed and directly linked for a map-based search in a map visualized with the help of OpenLayers [
42]. Background WMS layers from RBIS (based on MapServer WMS [
38]) or external sources can be visualized. Besides WMS, other services like, e.g., the CSW catalogue service are provided by RBIS and can be accessed from outside.
Because of the demand to easily adapt RBIS to upcoming project requirements, the internal structure is modularized to ensure high flexibility and extensibility. Functions or sets of functions related to RBIS modules can be activated or deactivated in the configuration file. A selection of important modules with related special features of RBIS are:
Management of metadata datasets and responsible parties.
Management, analysis and visualization of measured and simulated time series data.
Management and visualization of spatial data.
Management of documents and any kind of files.
Management of study sites and observation data.
Management of simulation models and linking in- and out-put data.
7. Applications
RBIS has been successfully applied in more than 35 research projects mainly related to integrated land and water resources management and climate change impact assessment in South America, Africa, Europe, Australia and Asia. They differ in the size of the covered study region (from a few km2 to several 100,000 km2), the amount of registered and active users, the amount and type of stored data and the addressed target groups (e.g., students, researchers, stakeholders). This section will give an overview of RBIS applications and will highlight their major differences.
7.1. Application Types
In general, three cases for the usage of RBIS can be identified based on the different scales of application. The first one belongs to single research topics (small scale), which includes RBIS instances related to small projects, like PhD theses with a small amount of registered users. The main focus lies on climate and hydrological data management, pre-processing, analysis, access and preservation of time series data collected for the related study [
47]. Examples are:
KosiRBIS [
48] with data collected in the Kosi River Basin within a PhD project evaluating upstream-downstream linkages of hydrological dynamics in the Himalayan region [
49].
JakartaRBIS [
50] as part of a PhD research assessing the impacts of land use and climate changes on hydrology in Western Java, Indonesia using hydrological models [
51].
OTI RBIS [
52] with a special focus on the Kara River Basin in Togo and Benin as a part of a PhD research project about river basin assessment and hydrologic process modelling for integrated land and water resources management in West Africa [
53].
Once the advantages have been discovered there is a high motivation of the author to incorporate data and to make use of a broad range of system functions.
The second is groups of researchers working together on a single field of research (medium scale). RBIS instances are set up for project cooperation at an institutional and bilateral level for the exchange and management of jointly-used datasets, like geodata or time series data. Examples are:
DrysalRBIS: Geodata and environmental data in the BMBF-funded project DRYSAL (Multi-scale analyses of dryland salinity impacts and adaptive Integrated Water Resources Management (IWRM) strategies for salinity mitigation in the Berg River basin, Western Cape Province, South Africa (2005–2008)).
SeyhanRBIS: Time series data collected and measured in the Seyhan River Basin during the project GIRMASEM (GIS supported Integrated Water Resources Management System (IWRMS) for the Eastern Mediterranean: A regional clean water action plan for the Seyhan River (GIRMASEM) (2006–2009)).
The last group of application cases refers to interdisciplinary research projects (large scale), involving a large number of researchers, and local stakeholders beyond the project consortium are also involved and addressed. Those RBIS installations usually have many registered users from different disciplines, institutions, organizations and authorities. Examples are:
BrahmaRBIS [
54] and DanubeRBIS: environmental data from the Brahmaputra and Upper Danube River Basins collected and produced within the EC project BRAHMATWINN (Twinning European and South Asian river basins to enhance capacity and implement adaptive integrated water resources management approaches [
55]) (2006–2010).
Okavango Basin Information System (OBIS) [
11] stores environmental information from the Okavango River Basin for the BMBF-funded project “The Future Okavango” (2010–2015) [
56,
57].
Vu Gia Thu Bon RBIS [
13] manages environmental data from the Vu Gia and Thu Bon River Basin from the BMBF-funded LUCCi project (Land Use and Climate Change interactions in the Vu Gia Thu Bon River Basin/Central Vietnam; BMBF; 2010–2015) [
58].
Due to its flexible structure and ease of integration, existing RBIS instances have been further used for projects covering bigger or smaller study regions. Examples for further usage of existing data collections are:
Assam RBIS [
59] is a subset view of the BrahmaRBIS where new datasets have been uploaded within the Guwahati Field Trial Project financed by the state government of Assam (2013–2016).
The SASSCAL Information System (IS) is the project database for water-related tasks within Phase 1 of the ongoing SASSCAL project (Southern African Science Service Centre for Climate Change and Adaptive Land Management (SASSCAL)—a Regional Science Service Centre (RSSC) in Southern Africa; BMBF; 2014–2017). SASSCAL IS is a newly-created RBIS instance that integrates all datasets of OBIS, LetabaRBIS and DrysalRBIS.
7.2. RBIS System Performance
The dedicated SQL-based storage of RBIS information allows one to efficiently manage large amounts of table data. For example, the metadata and application data representation in the RBIS database involves more than 300 tables with 1500 attributes overall. This, on the other hand, requires a careful design of the overall relational structure and SQL statements, the latter being safeguarded by the object-relational mapping interface implemented in RBIS (see
Section 6.2). As a result, RBIS allows one to store a large amount of individual datasets within a single database management server. The overall amount of over 8000 time series datasets, 900 geodata datasets and some hundreds of other datasets on a single PostgreSQL server proved to create only minor SQL execution times and related server load. For example, the SASSCAL IS instance [
21] includes more than 230 geodata datasets and 680 time series datasets, which refer to more than 500 associated files. The fact that this system performs very well even in a virtual environment on a notebook further emphasizes the efficient overall system design.
7.3. RBIS Deployment and Maintenance
All RBIS instances mentioned above are hosted and maintained on dedicated server hardware at the Department of Geography of the University of Jena in Germany. With the increasing visibility and robustness during the last 10 years, project partners decided to use RBIS for their own research activities. One example is the Institute for Technology and Resources Management in the Tropics and Subtropics (ITT) in Cologne, Germany. One of their coordinated projects is the CNRD project (Center for Natural Resources and Development). This worldwide university network promotes academic exchange and cooperation in the area of natural resources management, in particular related to water, land, ecosystem and renewable energy [
60]. One part of the activities is MSc student exchanges and joint student projects on case studies, which use RBIS as the data infrastructure. For this reason, ITT hosts its own RBIS server with currently 12 RBIS instances [
61].
Furthermore, research activities initiated by a research group of the ITT and numerous partners working in the area of river basin assessment and management are cooperating within the “basin-info” network [
62]. One of the basins is the Limari catchment, where geodata and measured time series data have been incorporated during several research projects into the “Centro-Norte-Chile RBIS:Limari and Petorca River Basin Information System” [
63,
64]. The Centro-Norte-Chile RBIS is currently hosted at the Center for Advanced Research in Arid Zones (CEAZA), a scientific research and technological center in the Region of Coquimbo in Chile [
65].
8. Discussion and Outlook
The development of RBIS during the last 10 years was driven by needs and requirements raised in research projects and in cooperation with different disciplines. Due to the application in many different research projects, it was possible to continuously extend and adapt the system according to user needs. As shown in the previous section, not only the source code, but sometimes even the data collection could be reused during that period. Throughout the many years of RBIS’s evolution, a close cooperation between the software development team, domain experts and RBIS users proved to be of utter importance for a successful implementation of the system. This close cooperation does not only support fast and informal error reporting, but it also eases the selection of features for implementation. It should not be forgotten that comprehensive user support plays a very important role to keep such a system alive and used. Building trust, raising acceptance and motivating user are more essential and time consuming than the provision of technical solutions. This includes training courses for data providers and users, taking care of multilingual web interfaces, providing online tutorials and a reliable and fast response to user requests. Experiences during various research projects showed that provisioning of added values through the use of centralized data management systems like RBIS is the best option to convince data owners to share data and metadata. The availability of effective and easily-usable access control mechanisms can further increase acceptance for such systems. Providing the information system as a virtual appliance (e.g., based on VirtualBox) can be a further incentive for collaboration and data sharing. Even though this typically limits its use (e.g., no collaborative access/read access only), this option proved to be especially beneficial in regions with limited Internet availability, as can still often be found in developing parts of the world.
Future improvements and the addition of new features will be mainly driven by research project demands. One will be the provision of more data integration services of data available in other repositories (e.g., derived from satellite imagery). Another focus will be on the support for processing services and to create a closer link between web-based model applications and process descriptions.


