Article

Improved Biogeography-Based Optimization Based on Affinity Propagation

1
School of Information Science and Engineering, Shandong Normal University, Jinan 250014, China
2
Shandong Provincial Key Laboratory for Distributed Computer Software Novel Technology, Jinan 250014, China
3
School of Mathematic and Quantitative Economics, Shandong University of Finance and Economics, Jinan 250010, China
4
School of computer and Information Engineering, Heze University, Heze 274015, China
5
Shandong Police College, Jinan 250014, China
*
Author to whom correspondence should be addressed.
ISPRS Int. J. Geo-Inf. 2016, 5(8), 129; https://0-doi-org.brum.beds.ac.uk/10.3390/ijgi5080129
Submission received: 26 May 2016 / Revised: 28 June 2016 / Accepted: 11 July 2016 / Published: 23 July 2016
(This article belongs to the Special Issue Spatial Ecology)

Abstract

:
To improve the search ability of biogeography-based optimization (BBO), this work proposed an improved biogeography-based optimization based on Affinity Propagation. We introduced the Memetic framework to the BBO algorithm, and used the simulated annealing algorithm as the local search strategy. MBBO enhanced the exploration with the Affinity Propagation strategy to improve the transfer operation of the BBO algorithm. In this work, the MBBO algorithm was applied to IEEE Congress on Evolutionary Computation (CEC) 2015 benchmarks optimization problems to conduct analytic comparison with the first three winners of the CEC 2015 competition. The results show that the MBBO algorithm enhances the exploration, exploitation, convergence speed and solution accuracy and can emerge as the best solution-providing algorithm among the competing algorithms.

1. Introduction

As an important branch in artificial intelligence, Evolutionary Algorithms (EAs) are derived from the simulation of complex biological systems in nature with the ability to cognize things of humans based on their interaction with nature. The biogeography-based optimization (BBO) algorithm is a new intelligent optimization algorithm that was proposed by Simon who was enlightened by biogeography theory [1] in 2008 based on the research of a mathematics model for biological species migration [2]. BBO has been widely studied, and good research achievements in theoretical analysis, improvement, and application have been achieved.
Some variations of BBO have recently been developed to improve the performance of basic BBO [3,4,5,6,7]. However, in these improved BBOs, the migration operation judges only the method of the immigration operation in terms of the immigration and emigration rates in different habitats without considering the interactional relationship among habitats. Therefore, there is still an insufficiency in these improved BBOs regarding the migration operator, which is good for exploitation but poor for exploration. Currently, we need changes that are more important than a simple hybrid.
This work proposes an improved BBO algorithm with Affinity Propagation (AP) [8] based on the Memetic framework [9,10,11,12] (MBBO). This algorithm improves the migration operation of the basic BBO algorithm by using the AP strategy to promote exploration. Further, the MBBO algorithm uses simulated annealing (SA) [13] as a local search strategy to promote exploitation and strengthen the ability to get out of the local optimum. This work also tests the MBBO algorithm and the three first winners of the CEC 2015 competition [14,15,16] in the CEC 2015 benchmarks and compares their operation results. After the modification of BBO, the Wilcoxon signed-rank test is used to demonstrate the differences between different implementations of the MBBO and the other three algorithms of the CEC 2015 competition, based on which it can be found that MBBO proposed in this work performs significantly better than do the three algorithms.
To summarize, our contributions are as follows:
  • This work proposed an improved BBO algorithm using the AP strategy to modify the migration operation to promote exploration and
  • proposed a MBBO algorithm using the Memetic framework and SA as the local search strategy to promote exploitation.

2. Improved BBO with Affinity Propagation based on Memetic Framework
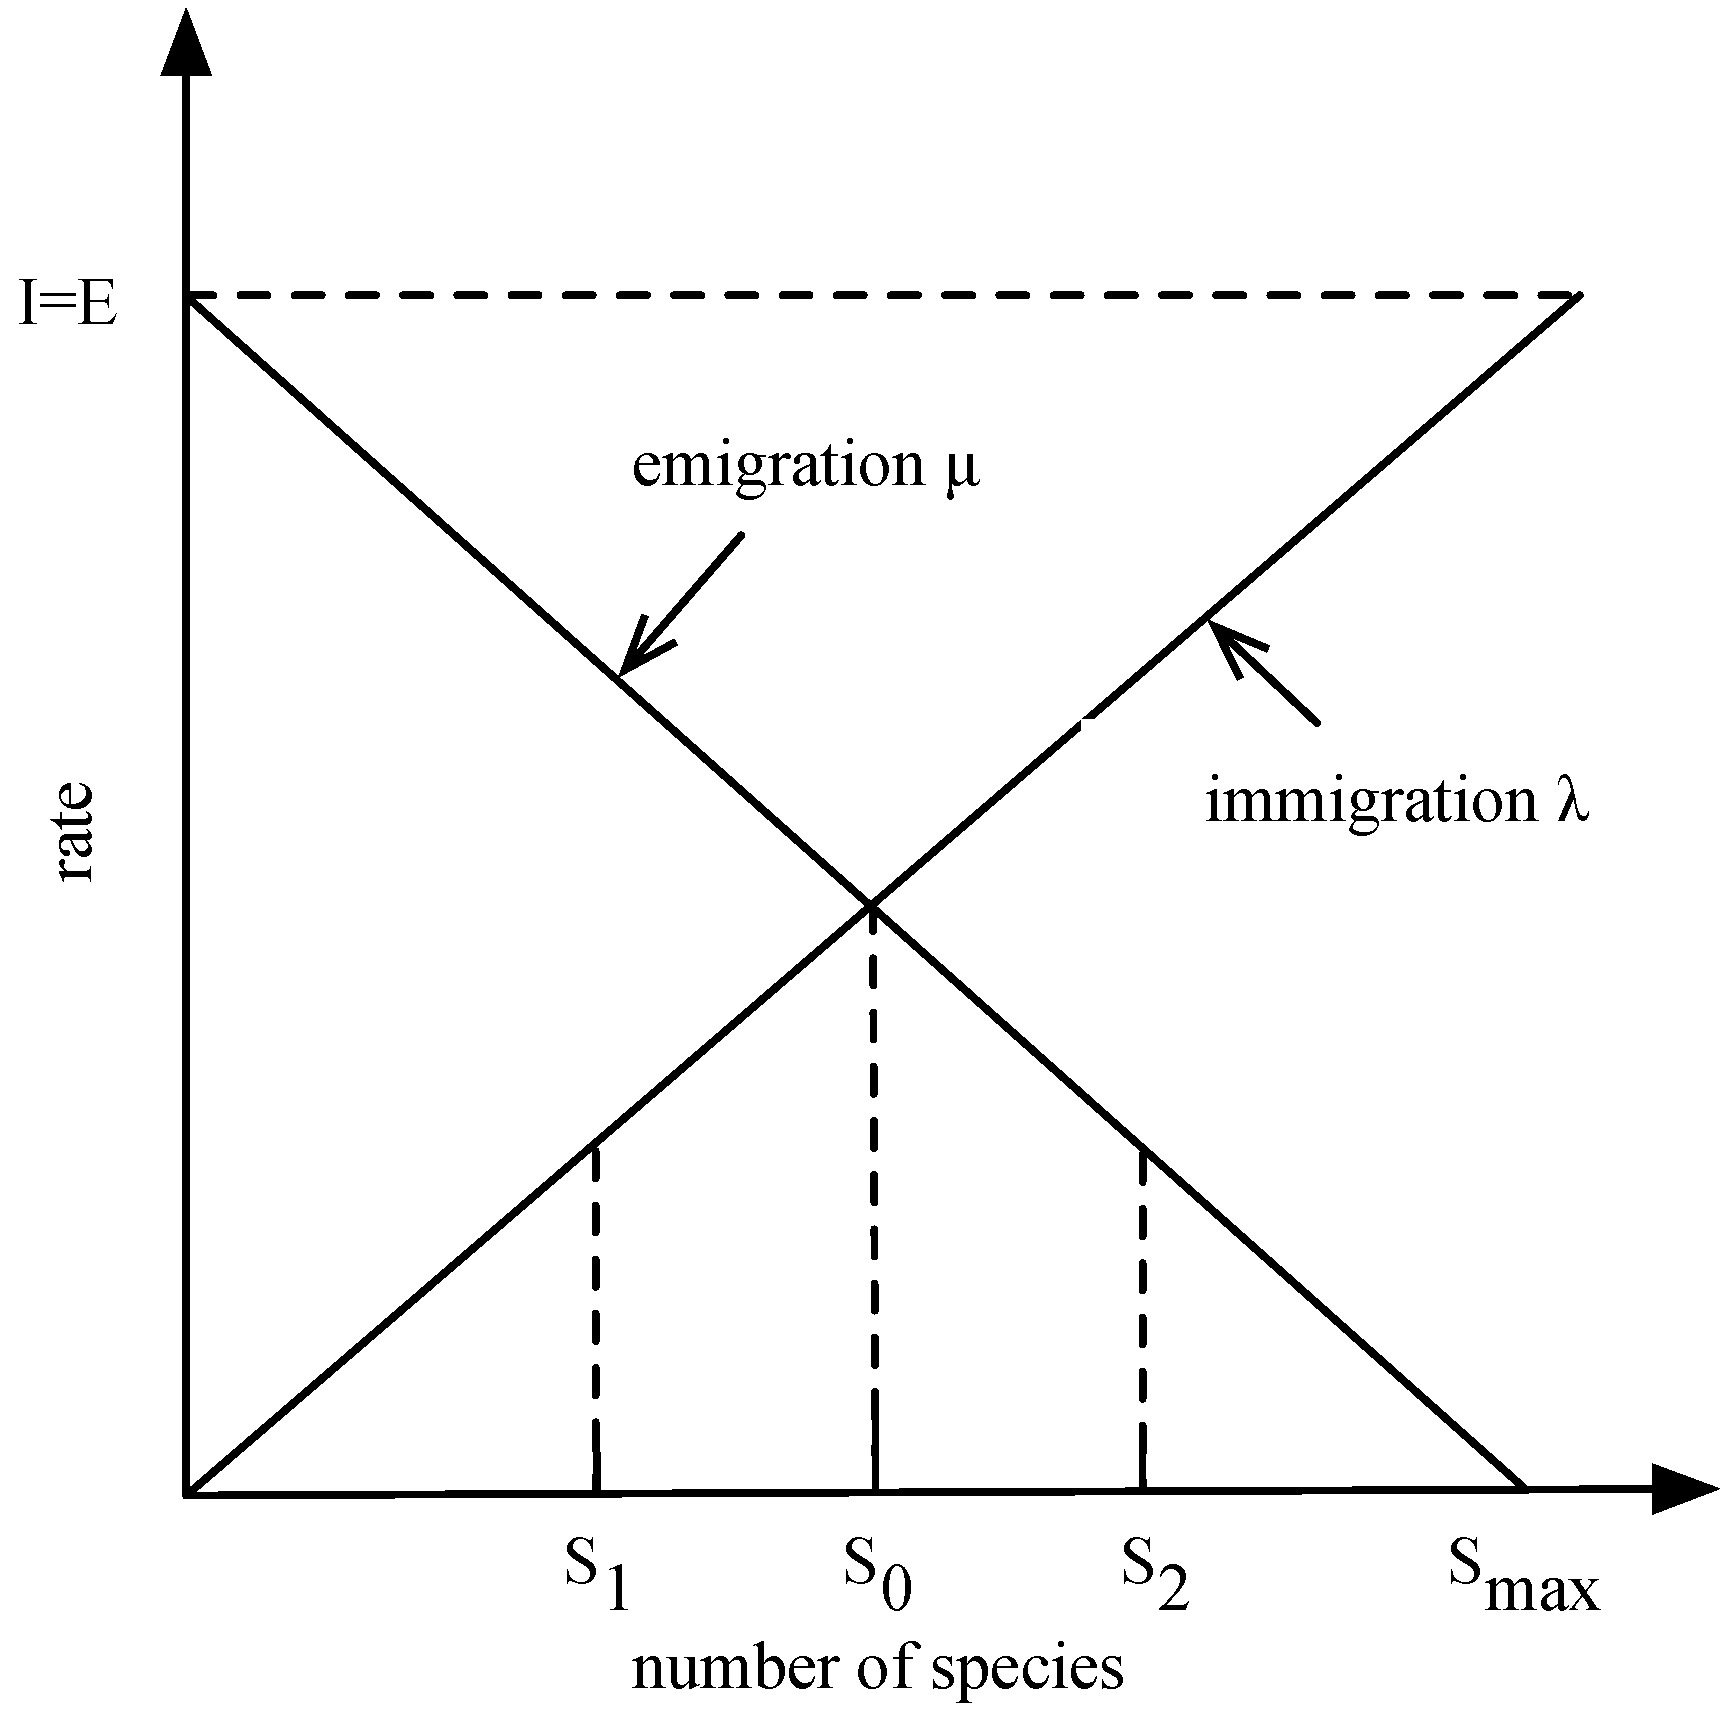
2.1. BBO

In an ecosystem, the habitat suitability index (HSI) [17] can be used to describe the fitting degree of a habitat for species living in it [18]. HSI can be expressed with suitability index variables (SIV), which describe the characteristics of HSI, such as precipitation, humidity, and vegetation diversity in a habitat. A habitat with high HSI has more species living in it, whereas a habitat with low HSI has fewer species. In other words, HSI is directly proportional to the diversity of species. The largest possible number of species that a habitat can support is Smax; the immigration of species is λ, with a maximum of I; and the emigration rate is μ, with a maximum of E, with E = I, as shown in Figure 1.
When the number of species in this habitat is 0, the immigration rate at this time is obviously the maximum I. With the immigration of species, the number of species in the habitat increases; further, the immigration rate decreases when the emigration rate increases. When the number of species reaches the upper limit Smax, the habitat achieves the saturation state; thus, the immigration rate decreases to 0, and the emigration rate reaches the maximum E. In Figure 1, S1 < S2 and HSI at S1 is smaller than that at S2. Obviously, when the number of species in the habitat is S1, the immigration rate λ(S1) at S1 is larger than λ(S2) at S2. Similarly, the emigration rate μ(S1) at S2 is smaller than μ(S2) at S2. For immigration among different habitats, the probability of immigration or emigration behavior occurring in one habitat is directly proportional to its immigration or emigration rate. Therefore, the immigration rate in one habitat can be used as the criterion for the immigration behavior, and the emigration rate can be further used to judge the emigration behavior from that habitat. In contrast, a habitat with high HSI can attract more species; however, this habitat may tend to be saturated with an increase in the number of species; thus, a larger amount of species may start to emigrate. For habitats with low HSI, more species may immigrate into it from other habitats upon the saturation of the number of species if few species live in habitats with low HSI. Such a behavior is called the migration behavior of species. In another situation, a habitat with low HSI has few species living in it, but no large species immigration occurs, which keeps the HSI low. Species in these habitats either go extinct or immigrate to other habitats. Such behavior is called mutation behavior. Using the descriptions of the immigration and emigration rates, consider the probability Ps that the habitat contains exactly S species. Ps changes from time t to time t + Δt according to Formula (1).
P s ( t + Δ t ) = P s ( t ) ( 1 λ s Δ t μ s Δ t ) + P s 1 λ s 1 Δ t + P s + 1 μ s + 1 Δ t
where, λs and μs represent the immigration rate and emigration rate, respectively, when the number of species in the habitat is S. There are three conditions that satisfy this formula:
  • At t time, there were S species in the habitat and no migration behavior in period Δt;
  • At t time, there were S + 1 species in the habitat, with one species immigrating in period λs;
  • At t time, there were S − 1 species in the habitat, with one species emigrating in period λs.
According to the linear relationship between immigration rate and emigration rate shown in Figure 1, the computational method of immigration rate and emigration rate when the number of species is k can be obtained as Formulas (2) and (3), respectively.
λ k = I ( 1 k n )
μ k = E ( k n )
where n is Smax. Assume the special case E = I. In this case, λk + μk = E can be obtained. When Δt → 0, Formula (3) can be converted into Formula (4).
p s = ( λ s + μ s ) P s + μ s + 1 P s + 1 , S = 0 ( λ s + μ s ) P s + λ s 1 P s 1 + μ s + 1 P s + 1 , 1 S S max 1 ( λ s + μ s ) P s + λ s 1 P s 1 , S = S max
If the probability of each species being counted in a habitat is low, mutation behavior may easily occur. In other words, the function of mutation probability is inversely proportional to the probability of species being counted in this habitat. Therefore, the corresponding mutation function can be obtained as Formula (5).
m s = m max ( 1 P s P max )
Assuming that a feasible solution of the optimization problem can be expressed with an integer vector, every integer component in the vector is defined as a SIV. If the objective function for the problem to be solved is known, the feasible solution with a higher adaptive value can be defined as the habitat with higher HSI. Assuming that the habitat is HSIVm where H is the feasible solution of the optimization problem, m is the dimensionality of the solution vector and HSI is the adaptive value of the objective function, the basic procedure of the BBO algorithm can be obtained.

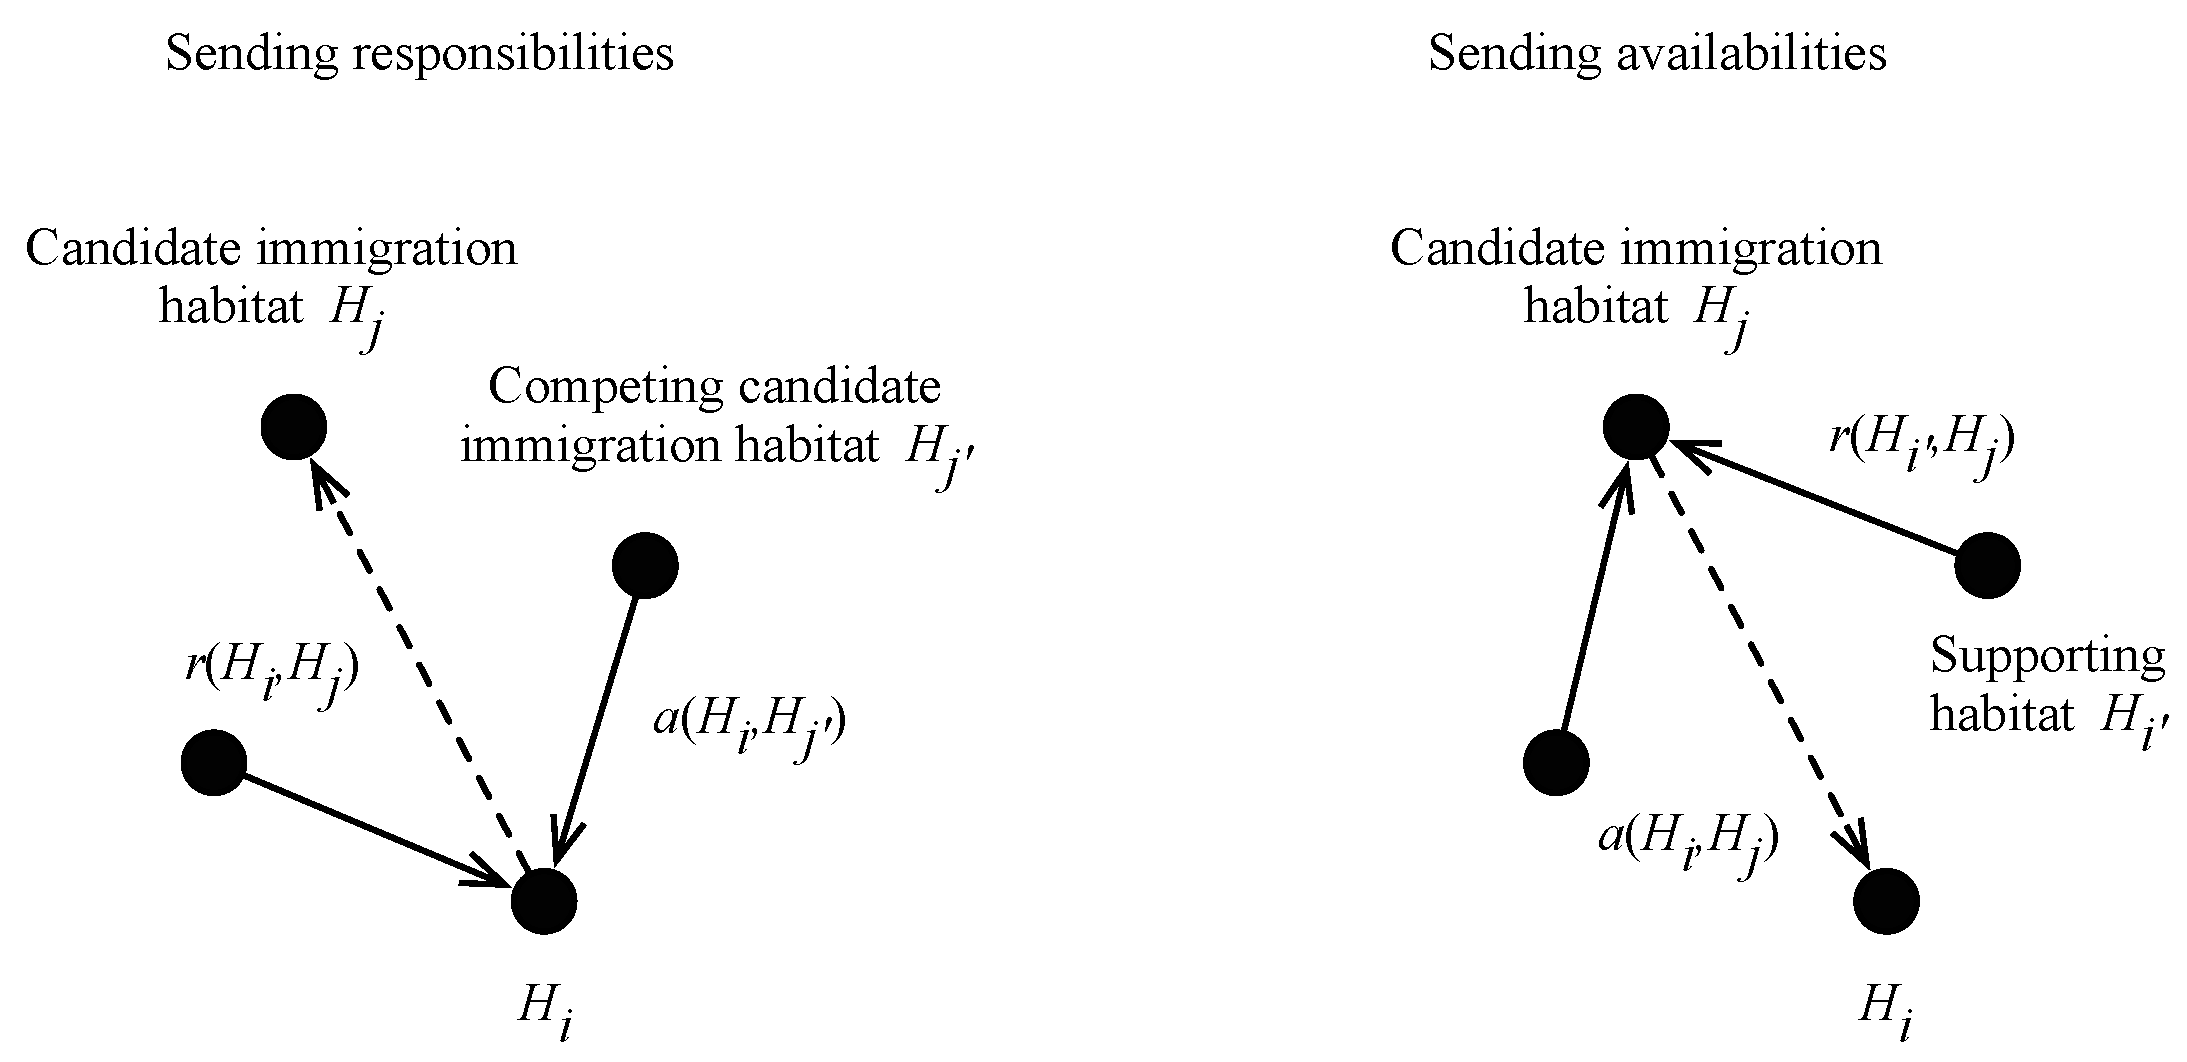
2.2. BBO with Affinity Propagation

Affinity propagation (AP) is a clustering strategy proposed by Frey and Dueck [8]. The basic idea of this strategy is to calculate the cluster center of all samples, which are treated as nodes in a network, via information transfer in all lines of the network. During the clustering, two types of information are transferred among nodes: attractiveness and availability. The clustering result is dependent on the similarity and information transfer among samples. This feature makes the strategy suitable as an auxiliary means for information transfer among habitats in the BBO algorithm. Among all habitats, a habitat with a high immigration rate can attract species from a habitat with a high emigration rate. Definitions related to AP applied to the BBO algorithm are as follows.
Definition 1. 
Migration matrix of habitat. Assuming that the habitat count is n, the similarity s(Hi, Hj) between any two habitats (the similarity can be either symmetric or asymmetric) can be calculated to represent the probability of habitat Hj attracting species emigrating from habitat Hi and immigrating into habitat Hj. The similarity matrix s n × n , which is composed of similarities between two habitats, is called the migration matrix of the habitat. s(Hi, Hj) is calculated as Formula (6).
s H i , H j = S I V i m S I V j m
Definition 2. 
Habitat immigration reference (HIR). Similarity s(Hk, Hk) shows whether habitat Hk is more likely to be immigrating which is denoted by HIR(k) (k = 1, 2,…, n). The value of HIR(k) can affect the ratio between the number of habitats to be immigrated into and that of habitats to be emigrated from. This ratio can determine whether the migration operation of the MBBO algorithm can effectively search the global optimum of the optimization problem.
The definition regarding HIR in [8] shows that the number of habitats to be immigrated into is directly proportional to HIR(k). According to Formula (1), HIR(k) is proportional to the immigration rate λk and inversely proportional to the emigration rate for any habitat Hk. In this work, let the value of s(Hk, Hk) be the ratio between the immigration rate λk and the emigration rate μk of habitat Hk, λ k / μ k . In Section 3.3, another method for obtaining the value is used for comparison to discuss how to select a more optimal value of HIR(k) (e.g., the mid-value of similarity S in [8], the average of similarity S, half of the mid-value of similarity S, and half of the average of similarity S).
Definition 3. 
Habitat attractiveness. Let habitat Hj belong to habitat set H i n . For candidate habitat Hj to be immigrated into, evidence r(Hi, Hj) is collected from habitat Hi (called the attractiveness of habitat Hj to habitat Hi) to describe the attractiveness of habitat Hj to attract species emigrating from habitat Hi and immigrating into habitat Hj. Such attractiveness can be called habitat attractiveness.
Definition 4. 
Habitat availability. For habitat Hj, evidence a(Hi, Hj) is collected for habitat Hi to be emigrated from (called the availability of habitat Hi to habitat Hj) to describe the suitability of species emigrating from habitat Hj and immigrating into habitat Hi. Such availability can be called habitat availability.
The stronger the evidence is (the larger the sum of r(Hi, Hj) and a(Hi, Hj)), the larger the probability is of species emigrating from habitat Hi and immigrating into habitat Hj. The methods for calculating and updating information matrix are shown as Formulas (7) and (8), respectively. The basic procedure of AP is shown in Figure 2.
r ( H i , H j ) s ( H i , H j ) max j s . t . j j { a ( H i , H j ) + s ( H i , H j ) }
a ( H i , H j ) m i n { 0 , r ( H j , H j ) + H i s . t . H i { H i , H j } max { 0 , r ( H i , H j ) } } , i j H i s . t . H i { H i , H j } max { 0 , r ( H i , H j ) } , i = j
where r(Hj, Hj) and a(Hi, Hj) can be obtained using the migration immigration matrix of habitat s(Hi, Hj) and the habitat immigration reference HIR(k).

2.3. Local Search Strategies

To ensure population diversity under the precondition of fast convergence, this work uses SA as the local search (LS) strategy of the MBBO algorithm. SA uses the Metropolis criterion to accept non-prepreerence solutions and prevent them from falling into a local optimum. If the function is f(S), the current solution is f(S1), the new solution is f(S2), and the increment is df = f(S2) − f(S1), then the Metropolis criterion can be expressed as Formula (9).
p = 1 , d f < 0 exp ( d f T ) , d f 0

2.4. MBBO Algorithm

In this section, we provide some definitions as a first step towards formalizing the BBO algorithm and provide an outline of the algorithm.
Definition 5. 
Habitat migration strategy Ω ( r , a ) : H n H is a probabilistic operator used to control the migration operation. It can be judged that when the species emigrate from habitat Hi, they immigrate into habitat Hj with habitat attractiveness r and habitat availability a.
Definition 6. 
Habitat mutation strategy M ( λ , μ ) : H H is a probabilistic operator used to control the mutation operation. Habitat mutation operation with randomly changing SIVm is determined by the existing probability of species count Ps. Existing probability of species count Ps can be calculated using Formula (4). For the basic procedure of the habitat mutational strategy, refer to the mutational operation of the BBO algorithm.
Definition 7. 
Global search strategy of MBBO G = { m , n , λ , μ , Ω , M } is a 6-tuple that can iteratively optimize the initialized habitat.
Definition 8. 
Local search strategy of MBBO L = { t , l , P } : H n H is a 3-tuple set that can conduct local optimization of the evolution of the habitat in every generation. To provide this ability without the limit of a local optimum to the optimization of a habitat, the non-prepreerence solution can be accepted for a certain probability. t is a sufficiently large initial temperature, l is the Metropolis chain length that is, the performance time under temperature T, and P is the probability of acceptance, which can be calculated with using Formula (9).
Definition 9. 
MBBO algorithm M B B O = { Φ , G , L , T } is a 4-tuple where Φ = ∅ → {Hn,HSIn} refers to initializing a set of habitats and calculating the function of the HSI value of a habitat. G is the global search strategy which can perform global optimization of the habitat. L is the local search strategy, which can perform local optimization of the habitat. T = H n { t r u e , f a l s e } is a termination criterion.
The basic procedure of the MBBO algorithm is as Algorithm 1.
Algorithm 1: MBBO
  • Initialize the BBO parameters, including the habitat modification probability, mutation probability, maximum species count S, maximum migration rates E and I, maximum mutation rate mmax, the generation counter: g=0, the Metropolis chain length: L, the initial temperature T;
  • Create a random initial population H i ( g ) , i = 1, 2, 3,…,N and g = 0, 1, 2,…,MAXGEN;
  • Evaluate f( H i ( g ) ), i = 1, 2, 3,…,N;
  • for g = 1 to MAXGEN do
    • for i = 1 to N do
      • Sort the population from best f( H i ( g ) ) to least f( H i ( g ) );
      • Map the HSI to the number of species;
      • Calculate the immigration rate λi, the emigration rate μi, the Habitat attractiveness a and the Habitat availability r;
    • for i = 1 to N do
      • Modify the non-elite members of the population probabilistically with the migration operator;
    • for i = 1 to N do
      • Evaluate the new individuals in the population;
      • Replace the habitats with their new versions;
      • Replace the worst with the previous generation’s elites;
    • while T ≠ 0 do
      • for L = 1 to l do
        • Create a random H i ( g ) ;
        • Calculate df = f( H i ( g ) ) − f( H i ( g ) );
        • if df < 0 then
          • H i ( g ) is accepted as the new current solution
        • else
          • H i ( g ) is accepted as the new current solution as probability∝exp(−Δt/kT)
        • T = T − 1; g = g + 1;

3. Experimental Settings and Results

3.1. CEC 2015 Benchmarks

In this work, to investigate the performance of the MBBO, we compared it with SPS-L-SHADE-EIG algorithm [14], DEsPA algorithm [15] and MVMO algorithm [16] using the CEC 2015 benchmarks. For convenient description, these functions [19] are denoted as F1-F15, as shown in Table 1. The SPS-L-SHADE-EIG algorithm combines the adaptive differential evolution [20,21] with linear population size reduction(L-SHADE) [22] with the eigenvector-based (EIG) [23] crossover and successful-parent-selecting (SPS) frameworks [24]. The DEsPA algorithm is a new Differential Evolution algorithm with a success-based parameter adaptation with resizing population space [25]. The MVMO algorithm is Mean-variance mapping optimization that uses a special mapping function for mutation operation. These three algorithms are state-of-the-art evolutionary mechanisms.

3.2. CEC 2015 Benchmarks Results and Analysis

3.2.1. Experiment Parameter Setting

The three aforementioned optimization techniques are used to optimize the 15 CEC2015 benchmark functions given in Table 1. For each test function, each algorithm is run 100 times. As suggested in [19], 10 , 000 × D function evaluations were used for the test functions with 10 and 50 dimensions. The search range was set to [ 100 , 100 ] D for each dimension.
The parameters of MBBO should be set according to [2]. Let the maximum number of species in a habitat N = 50; habitat modification probability Pmod = 1; mutation probability m = 0; elitism parameter K = 2; and maximum immigration and emigration rate for each island I = E = 1.

3.2.2. Experiment Result and Analysis

The experiment results are shown in Table 2. For unimodal functions F1 and F2, it can be found that the MBBO algorithm and the other three algorithms are able to obtain the optimal solution. Benchmarks F3-F5 are simple and multimodal; the MBBO algorithm uses the Affinity Propagation which can relatively accurately judge the global optimal solution according to the mutual affinity relationship between different solutions.
Benchmarks F6–F8 are hybrid functions, whereas the remaining benchmarks are composition functions. For these functions, the MBBO algorithm is better than the other three algorithms regarding the optimization result when the peak of function F9 shows undulation and jumpiness. Therefore, the Affinity Propagation of the MBBO algorithm can find the optimal solution of a function by propagating migration information among solutions. The MBBO algorithm uses SA as a local search strategy which can make the algorithm accept non-prepreerence under a certain probability and have a stronger ability to skip the local optimum. Therefore, MBBO can accurately obtain the optimal solution. MBBO uses the Memetic framework to optimize the complex function in global search and local search. With the strong global optimization ability of Affinity Propagation and the strong ability of SA to skip the local optimum, the MBBO algorithm can effectively solve complex functions such as F10-F15.
To performance the MBBO algorithm and the other three algorithms for limited budget, we added the experiment over 50 number of evaluations to compare the performance evolution among these algorithms. For 10-D function F3, F4, F7, F8, F14 and F15, the cumulative distribution function (CDF) plots can be found in Figure 3 that compared with the three other algorithms over 50 function evaluations. Figure 3a–f are the optimization processes of MBBO, SPS-L-SHADE-EIG, DEsPA and MVMO algorithms in F3, F4, F7, F8, F14 and F15 benchmark functions. For hybrid function F7 and F8, it can be found that MBBO algorithm is better than the other three algorithms in Figure 3c,d. For composition Function F14 and F15, it can be found in Figure 3e,f that compared with other three algorithms, MBBO algorithm has larger difference, while the result of this function solved with SPS-L-SGADE-EIG algorithm is more stable.

3.2.3. Statistical Analysis

A Wilcoxon signed-rank test has been conducted to determine whether the differences among the median results of the MBBO algorithm, SPS-L-SHADE-EIG algorithm, DEsPA algorithm and MVMO algorithm given in Table 2 are statistically significant.
Table 3 shows the statistical comparison of the MBBO algorithm with the other three algorithms (SPS-L-SHADE-EIG, DEsPA and MVMO) for the 10-D benchmark functions using the Wilcoxon signed-rank test, with freedom at a 0.05 level of significance and 95 % confidence level.
The Wilcoxon signed-rank test results can be summarized as follows:
  • MBBO algorithm and SPS-L-SHADE-EIG algorithm: A Wilcoxon signed-rank test showed that the MBBO algorithm did not elicit a statistically significant change in F 1 ( z = 0.367 , p = 0.713 ) , F2 (z = −0.920, p = 0.357 ) , F 4 ( z = 1.134 , p = 0.254 ) and F 15 ( z = 1.090 , p = 0.091 ) . In these four functions, the median change from MBBO algorithm to SPS-L-SHADE-EIG algorithm is not significantly different from zero. This suggests that with 95 % confidence, the difference between the algorithms is statistically significant for the remaining 11 functions.
  • MBBO algorithm and DEsPA algorithm: A Wilcoxon signed-rank test showed that the MBBO algorithm did not elicit a statistically significant change in F 1 ( z = 1.547 , p = 0.122 ) , F2 (z = −0.178, p = 0.859 ) and F 4 ( z = 1.932 , p = 0.061 ) with a 95 % confidence level. Therefore, the test has not provided statistically significant evidence that the two algorithms are different for these benchmark functions. For the other 12 cases, the median change from MBBO algorithm to DEsPA algorithm is very different from zero.
  • MBBO algorithm and MVMO algorithm: A Wilcoxon signed-rank test showed that the MBBO algorithm did not elicit a statistically significant change in F 1 ( z = 1.249 , p = 0.212 ) , F2 (z = −1.823, p = 0.068 ) and F 4 ( z = 1.823 , p = 0.068 ) . In these three functions, the median change from MBBO algorithm to SPS-L-SHADE-EIG algorithm is not significantly different from zero; for the other 12 cases, the two algorithms are different with a 95 % confidence level.
It can be concluded that, the compared algorithms are significantly different in most cases, with 95% confidence. Therefore, it is evident that MBBO can significantly outperform the other three algorithms and can emerge as the best solution-providing algorithm among the competing SPS-L-SHADE-EIG, DEsPA and MVMO algorithms.

3.3. Effect of the HIR on the Performance of MBBO

3.3.1. Experiment Setting

The HIR value in Affinity Propagation of the MBBO algorithm is the ratio between the habitat immigration rate and habitat emigration rate. To the compare efficiency with different values of HIR, a comparison experiment is set. Let the HIR value be the ratio between the habitat immigration and emigration rates, the mid-value in habitat similarity matrix S, half of the mid-value of habitat similarity matrix S, the average of habitat similarity matrix S, and half of the average of habitat similarity matrix S. Then, compare the efficiency of algorithms with the averages and standard deviations in the 25 independent tests using the CEC 2015 benchmarks. The parameters of the MBBO algorithm for five HIR sampling methods are set according to Subsection 3.2.1. Let the maximum species count in habitat N = 50; habitat modification probability Pmod = 1; mutation probability m = 0; elitism parameter K = 2; and maximum immigration and migration rates for each island I = E = 1.

3.3.2. Experimental Results and Analysis

The experimental results are shown in Table 4 According to these results, it can be found that the effect of MBBO algorithm (HIR(k) = λ k / μ k ) is better than that of the other four situations for the solutions of the CEC 2015 benchmarks. The setting of the HIR value as the ratio between the habitat immigration and emigration rates can use the information regarding the number of species in a habitat. The propagation of information regarding attractiveness and availability among habitats can more accurately guide the species migration behavior among habitats.

3.4. Experimental Results Analysis

The MBBO algorithm uses Affinity Propagation which can relatively accurately judge the global optimal solution according to the mutual affinity relationship between different solutions. The MBBO algorithm uses SA as the local search strategy which can make the algorithm accept non-prepreerence under a certain probability and have a stronger ability to skip the local optimum. Therefore, MBBO can accurately obtain the optimal solution. MBBO uses the Memetic framework to optimize a complex function in global search and local search. With the strong global optimization ability of Affinity Propagation and the strong ability of SA to skip the local optimum, the MBBO algorithm can effectively solve complex functions.

4. Conclusions

This work proposed a MBBO algorithm that uses the AP strategy to modify the migration operation of the BBO algorithm and based on the Memetic frame, with SA as the local search strategy. According to an analysis of the test results of MBBO regarding the CEC 2015 benchmarks, this algorithm can better solve the limit value of function optimization. Compared with the SPS-L-SHADE-EIG, DEsPA and MVMO algorithms, it can be found that the MBBO algorithm has significantly better performance than do the other three algorithms. However, the study of the BBO algorithm is still in its infancy stage compared with other EAs (such as Genetic Algorithms [26,27] and Particle Swarm Optimizer [28,29]). In future work, other algorithm framework (such as the cultural algorithm framework [30]) models should be used to modify the performance of the BBO algorithm.

Acknowledgments

This work is partially supported by National Natural Science Foundation (61373148, 61502151), National Social Science Foundation (12BXW040), Shandong Province Natural Science Foundation (ZR2012FM038, ZR2014FL010), Shandong Province Social Sciences Project (15CXWJ13). The authors also gratefully acknowledge the helpful comments and suggestions of the reviewers, which improve the presentation greatly.

Author Contributions

Zhihao Wang prepared the general research idea and wrote the article. Peiyu Liu and Min Ren gave advice of the paper. Yuzhen Yang and Xiaoyan Tian conducted the computer simulation described in Section 3. All authors have read and approved the final manuscript.

Conflicts of Interest

The authors declare no conflict of interest.

References

  1. MacArthur, R.; Wilson, E. The Theory of Biogeography; Princeton University Press: Princeton, NJ, USA, 1967. [Google Scholar]
  2. Simon, D. Biogeography-based optimization. IEEE Trans. Evol. Comput. 2008, 12, 702–713. [Google Scholar] [CrossRef]
  3. Ma, H.; Simon, D. Analysis of migration models of biogeography-based optimization using Markov theory. Eng. Appl. Artif. Intell. 2011, 24, 1052–1060. [Google Scholar] [CrossRef]
  4. Ma, H.; Simon, D.; Fei, M.; Xie, Z. Variations of biogeography-based optimization and Markov analysis. Inf. Sci. 2013, 220, 492–506. [Google Scholar] [CrossRef]
  5. Yang, G.P.; Liu, S.Y.; Zhang, J.K.; Feng, Q.X. Control and synchronization of chaotic systems by an improved biogeography-based optimization algorithm. Appl. Intell. 2013, 39, 132–143. [Google Scholar] [CrossRef]
  6. Gong, W.; Cai, Z.; Ling, C.X.; Li, H. A real-coded biogeography-based optimization with mutation. Appl. Math. Comput. 2010, 216, 2749–2758. [Google Scholar] [CrossRef]
  7. Bhattacharya, A.; Chattopadhyay, P. Hybrid Differential Evolution With Biogeography-Based Optimization for Solution of Economic Load Dispatch. IEEE Trans. Power Syst. 2010, 25, 1955–1964. [Google Scholar] [CrossRef]
  8. Frey, B.J.; Dueck, D. Clustering by passing messages between data points. Science 2007, 315, 972–976. [Google Scholar] [CrossRef] [PubMed]
  9. Moscato, P.; Norman, M.G. A memetic approach for the traveling salesman problem implementation of a computational ecology for combinatorial optimization on message-passing systems. Parallel Comput. Transput. Appl. 1992, 1, 177–186. [Google Scholar]
  10. Merz, P.; Zell, A. Clustering gene expression profiles with memetic algorithms. In Parallel Problem Solving from Nature-PPSN VII; Springer: Berlin, Germany, 2002; pp. 811–820. [Google Scholar]
  11. Kannan, S.S.; Ramaraj, N. A novel hybrid feature selection via Symmetrical Uncertainty ranking based local memetic search algorithm. Knowl. Based Syst. 2010, 23, 580–585. [Google Scholar] [CrossRef]
  12. Banos, R.; Gil, C.; Reca, J.; Montoya, F. A memetic algorithm applied to the design of water distribution networks. Appl. Soft Comput. 2010, 10, 261–266. [Google Scholar] [CrossRef]
  13. Kirkpatrick, S.; Gelatt, C.D.; Vecchi, M.P. Optimization by simulated annealing. Science 1983, 220, 671–680. [Google Scholar] [CrossRef] [PubMed]
  14. Guo, S.M.; Tsai, J.S.H.; Yang, C.C.; Hsu, P.H. A self-optimization approach for L-SHADE incorporated with eigenvector-based crossover and successful-parent-selecting framework on CEC 2015 benchmark set. In Proceedings of the 2015 IEEE Congress on Evolutionary Computation, Sendai, Japan, 25–28 May 2015.
  15. Awad, N.; Ali, M.Z.; Reynolds, R.G. A differential evolution algorithm with success-based parameter adaptation for CEC2015 learning-based optimization. In Proceedings of the 2015 IEEE Congress on Evolutionary Computation, Sendai, Japan, 25–28 May 2015; pp. 1098–1105.
  16. Rueda, J.L.; Erlich, I. Testing MVMO on learning-based real-parameter single objective benchmark optimization problems. In Proceedings of the 2015 IEEE Congress on Evolutionary Computation (CEC), Sendai, Japan, 25–28 May 2015.
  17. Wesche, T.A.; Goertler, C.M.; Hubert, W.A. Modified habitat suitability index model for brown trout in southeastern Wyoming. N. Am. J. Fish. Manag. 1987, 7, 232–237. [Google Scholar] [CrossRef]
  18. Hanski, I.; Gilpin, M.E. Metapopulation Biology; Academic Press: Waltham, MA, USA, 1997. [Google Scholar]
  19. Liang, J.; Qu, B.; Suganthan, P.; Chen, Q. Problem Definitions and Evaluation Criteria for the CEC 2015 Competition on Learning-Based Real-Parameter Single Objective Optimization; Technical Report 201411A; Computational Intelligence Laboratory, Zhengzhou University: Zhengzhou, China; Nanyang Technological University: Singapore, 2014. [Google Scholar]
  20. Tanabe, R.; Fukunaga, A. Success-history based parameter adaptation for differential evolution. In Proceedings of the 2013 IEEE Congress on Evolutionary Computation, Cancun, Mexico, 20–23 June 2013; pp. 71–78.
  21. Tanabe, R.; Fukunaga, A. Evaluating the performance of SHADE on CEC 2013 benchmark problems. In Proceedings of the 2013 IEEE Congress on Evolutionary Computation, Cancun, Mexico, 20–23 June 2013; pp. 1952–1959.
  22. Tanabe, R.; Fukunaga, A.S. Improving the search performance of SHADE using linear population size reduction. In Proceedings of the 2014 IEEE Congress on Evolutionary Computation (CEC), Beijing, China, 6–11 July 2014; pp. 1658–1665.
  23. Guo, S.M.; Yang, C.C. Enhancing differential evolution utilizing eigenvector-based crossover operator. IEEE Trans. Evol. Comput. 2015, 19, 31–49. [Google Scholar]
  24. Guo, S.M.; Yang, C.C.; Hsu, P.H.; Tsai, J.S.H. Improving Differencial Evolution with a Successful Parent Selecting Framework. IEEE Trans. Evol. Comput. 2015, 19, 717–730. [Google Scholar] [CrossRef]
  25. Zhang, J.; Sanderson, A.C. JADE: adaptive differential evolution with optional external archive. IEEE Trans. Evol. Comput. 2009, 13, 945–958. [Google Scholar] [CrossRef]
  26. Holland, J.H. Building blocks, cohort genetic algorithms, and hyperplane-defined functions. Evol. Comput. 2000, 8, 373–391. [Google Scholar] [CrossRef] [PubMed]
  27. Booker, L.B.; Goldberg, D.E.; Holland, J.H. Classifier systems and genetic algorithms. Artif. Intell. 1989, 40, 235–282. [Google Scholar] [CrossRef]
  28. Kennedy, J. Particle swarm optimization. In Encyclopedia of machine learning; Springer: New York, NY, USA, 2011; pp. 760–766. [Google Scholar]
  29. Shi, Y.; Eberhart, R. A modified particle swarm optimizer. In Proceedings of the 1998 IEEE International Conference on Evolutionary Computation, Anchorage, AK, USA, 4–9 May 1998; pp. 69–73.
  30. Reynolds, R.G. An introduction to cultural algorithms. In Proceedings of the Third Annual Conference on Evolutionary Programming, Singapore, 24–26 February 19949.
Figure 1. The relationship of fitness of habitats (species count), immigration rate λ and emigration rate μ. S1 is a relatively poor solution, whereas S2 is a relatively good solution.
Ijgi 05 00129 g001
Figure 2. Responsibilities r ( H i , H j ) are sent from habitat H i to candidate immigration habitat H j and indicate how strongly each habitat favors the candidate immigration habitat over other immigration habitats. Availabilities a ( H i , H j ) are sent from the candidate immigration habitat to habitat H i and indicate to what degree each candidate immigration habitat is available as an immigration habitat for the habitat.
Ijgi 05 00129 g002
Figure 3. (a–f) are the cumulative distribution function (CDF) plots for 10-D function F3, F4, F7, F8, F14 and F15 of MBBO, SPS-L-SHADE-EIG, DEsPA and MVMO algorithms. (a) F3; (b) F4; (c) F7; (d) F8; (e) F14; (f) F15.
Ijgi 05 00129 g003
Table 1. Summary of the Congress on Evolutionary Computation (CEC)’15 Benchmark functions used in our experimental study.
Test Functions F i * = F i ( x * )
Unimodal Functions
F1Rotated High Conditioned Elliptic Function100
F2Rotated Cigar Function200
Simple Multimodal Functions
F3Shifted and Rotated Ackley’s Function300
F4Shifted and Rotated Rastrigin’s Function400
F5Shifted and Rotated Schwefel’s Function500
Hybrid Functions
F6Hybrid Function 1 (N = 3)600
F7Hybrid Function 2 (N = 4)700
F8Hybrid Function 3(N = 5)800
Composition Functions
F9Composition Function 1 (N = 3)900
F10Composition Function 2 (N = 3)1000
F11Composition Function 3 (N = 5)1100
F12Composition Function 4 (N = 5)1200
F13Composition Function 5 (N = 5)1300
F14Composition Function 6 (N = 7)1400
F15Composition Function 7 (N = 10)1500
Search Range: [ 100 , 100 ] D
Table 2. Comparison of MBBO, SPS-L-SHADE-EIG, DEsPA and MVMO. Statistical results of the 10-D and 50-D benchmark functions, averaged over 100 independent runs.
MBBOSPS-L-SHADE-EIGDEsPAMVMO
BestMedianMeanDistanceBestMedianMeanDistanceBestMedianMeanDistanceBestMedianMeanDistance
10-D
F10.00E+000.00E+000.00E+000.00E+000.00E+000.00E+000.00E+000.00E+000.00E+000.00E+000.00E+000.00E+000.00E+000.00E+000.00E+000.00E+00
F20.00E+000.00E+000.00E+000.00E+000.00E+000.00E+000.00E+000.00E+000.00E+000.00E+000.00E+000.00E+000.00E+000.00E+000.00E+000.00E+00
F31.10E+011.50E+011.70E+011.10E+012.00E+012.20E+012.60E+012.00E+011.91E+012.19E+011.90E+011.91E+012.01E+012.33E+011.40E+012.01E+01
F41.34E-016.25E-011.23E+001.34E-017.83E-018.72E-011.95E+007.83E-018.93E-019.95E-011.17E+008.93E-019.83E-011.23E+009.76E-019.83E-01
F59.93E+001.34E+012.14E+019.93E+001.24E+011.64E+012.35E+011.24E+011.43E+011.86E+012.56E+011.43E+012.19E+012.35E+012.98E+012.19E+01
F60.00E+000.00E+001.01E-010.00E+000.00E+000.00E+001.23E-010.00E+000.00E+000.00E+008.79E-010.00E+000.00E+000.00E+007.98E-010.00E+00
F76.70E-031.02E-022.23E-026.70E-039.76E-031.94E-022.78E-029.76E-031.23E-022.31E-023.21E-021.23E-022.35E-023.12E-025.37E-022.35E-02
F87.63E-051.26E-047.32E-047.63E-051.01E-041.37E-048.81E-041.01E-042.13E-044.34E-049.86E-042.13E-043.98E-046.98E-049.98E-043.98E-04
F92.39E+018.69E+019.51E+012.39E+016.92E+011.00E+021.50E+026.92E+019.21E+011.02E+021.02E+029.21E+011.02E+021.97E+021.28E+021.02E+02
F102.03E+022.21E+022.04E+022.03E+021.98E+023.68E+023.53E+021.98E+022.58E+022.76E+022.37E+022.58E+022.98E+023.97E+023.15E+022.98E+02
F113.28E-027.52E-024.37E-013.28E-027.82E-029.79E-029.27E-017.82E-028.27E-029.86E-017.78E-018.27E-025.24E-021.00E-013.33E-015.24E-02
F122.39E+018.96E+011.00E+022.39E+019.82E+011.32E+021.06E+029.82E+011.92E+022.94E+022.36E+021.92E+022.01E+022.96E+022.75E+022.01E+02
F133.30E-031.23E-022.12E-023.30E-033.46E-028.26E-022.31E-023.46E-028.72E-029.26E-027.89E-028.72E-022.05E-022.83E-027.23E-022.05E-02
F141.03E+021.98E+023.94E+021.03E+021.95E+022.35E+025.21E+021.95E+024.32E+028.92E+027.26E+024.32E+023.95E+024.77E+025.67E+023.95E+02
F153.61E+018.70E+019.50E+013.61E+019.32E+011.02E+021.67E+029.32E+011.01E+021.36E+022.34E+021.01E+022.51E+023.55E+022.45E+022.51E+02
50-D
F10.00E+000.00E+000.00E+000.00E+000.00E+000.00E+000.00E+000.00E+000.00E+000.00E+000.00E+000.00E+000.00E+000.00E+000.00E+000.00E+00
F20.00E+000.00E+000.00E+000.00E+000.00E+000.00E+000.00E+000.00E+000.00E+000.00E+000.00E+000.00E+000.00E+000.00E+000.00E+000.00E+00
F31.09E+011.83E+011.93E+011.09E+012.91E+013.22E+012.32E+012.91E+012.81E+013.11E+012.82E+012.81E+014.15E+016.51E+012.82E+014.15E+01
F49.23E-011.23E+001.98E+009.23E-011.02E+003.52E+002.55E+001.02E+001.92E+002.46E+003.26E+001.92E+002.24E+003.86E+004.62E+002.24E+00
F51.70E+031.92E+031.87E+031.70E+031.53E+032.98E+031.75E+031.53E+032.42E+032.99E+032.68E+032.42E+032.73E+033.82E+033.00E+032.73E+03
F61.35E+021.98E+021.75E+021.35E+021.87E+022.11E+022.39E+021.87E+022.06E+022.67E+022.49E+022.06E+022.94E+023.22E+023.15E+022.94E+02
F72.31E+013.92E+012.56E+012.31E+013.52E+014.05E+012.74E+013.52E+013.94E+014.96E+013.16E+013.94E+014.52E+015.81E+014.87E+014.52E+01
F89.23E+002.16E+014.58E+019.23E+001.81E+012.79E+015.57E+011.81E+012.02E+012.62E+016.58E+012.02E+013.31E+016.32E+015.18E+013.31E+01
F97.20E+011.06E+021.02E+027.20E+011.36E+022.56E+022.37E+021.36E+021.84E+023.35E+023.02E+001.84E+024.89E+026.51E+025.56E+024.89E+02
F103.29E+027.95E+026.87E+023.29E+027.23E+028.09E+028.35E+027.23E+027.84E+029.86E+028.76E+027.84E+025.91E+026.98E+027.92E+025.91E+02
F111.36E+022.78E+022.69E+021.36E+022.47E+023.00E+023.00E+022.47E+022.84E+023.76E+023.56E+022.84E+023.34E+025.87E+024.98E+023.34E+02
F124.50E+011.00E+021.10E+024.50E+019.32E+011.04E+021.23E+029.32E+011.07E+021.98E+021.79E+021.07E+022.04E+023.01E+022.96E+022.04E+02
F131.32E-026.54E-025.77E-021.32E-023.73E-027.57E-027.62E-023.73E-026.25E-028.27E-027.26E-026.25E-026.13E-027.60E-026.67E-026.13E-02
F143.47E+045.98E+044.79E+043.47E+045.95E+046.83E+046.35E+045.95E+045.74E+047.89E+047.12E+045.74E+046.95E+048.63E+048.01E+046.95E+04
F153.72E+019.60E+011.01E+023.72E+011.03E+021.56E+021.35E+021.03E+021.62E+022.32E+022.17E+021.62E+023.74E+026.19E+025.97E+023.74E+02
Table 3. The statistical comparison of the MBBO algorithm with the other three algorithms, using the Wilcoxon signed-rank test with freedom at a 0.05 level of significance and 95 % confidence level.
MBBO and SPS-L-SHADE-EIGMBBO and DEsPAMBBO and MVMO
zp-Value (2-Tailed)zp-Value (2-Tailed)zp-Value (2-Tailed)
F1−0.3670.713−1.5470.122−1.2490.212
F2−0.9200.357−0.1780.859−1.8230.068
F3−2.0770.038−2.5050.012−2.7160.007
F4−1.1340.254−1.9320.061−1.8990.058
F5−2.1390.032−2.6600.008−2.6340.008
F6−3.6960.000−3.7050.000−3.7020.000
F7−2.9960.003−2.8200.004−2.4920.013
F8−2.3230.025−2.4320.014−2.8140.005
F9−2.9280.003−2.4130.015−3.2030.001
F10−3.2220.001−2.9950.003−3.2200.001
F11−2.7460.006−2.3950.017−2.4660.014
F12−2.6400.008−3.3240.001−5.2440.000
F13−5.3760.000−4.2780.000−4.4370.000
F14−2.9340.003−2.6660.008−2.9360.003
F15−1.0900.091−2.9360.003−6.2320.000
Table 4. Comparison of efficiency with different values of habitat immigration reference (HIR). Let the HIR value be the ratio between habitat immigration rate and emigration rate, the mid-value in habitat similarity matrix S, half of the mid-value of habitat similarity matrix S, the average of habitat similarity matrix S, and half of the average of habitat similarity matrix S. Then, compare the efficiency of algorithms with the averages and standard deviations in 25 independent tests using the CEC 2015 Benchmarks
MBBO ( HIR ( k ) = λ k / μ k )MBBO ( HIR ( k ) = M e d i a n ) MBBO ( HIR ( k ) = M e d i a n / 2 ) MBBO ( HIR ( k ) = A v e r a g e ) MBBO ( HIR ( k ) = A v e r a g e / 2 )
MeanStd.MeanStd.MeanStd.MeanStd.MeanStd.
F11.78E+006.27E-012.30E+009.89E-012.13E+008.51E-012.84E+007.58E-012.59E+001.26E+00
F24.68E+031.62E+034.76E+031.39E+034.93E+031.33E+035.19E+031.34E+034.82E+031.92E+03
F34.11E+018.11E+004.84E+011.04E+014.45E+019.63E+004.13E+011.02E+014.41E+011.15E+01
F45.91E+001.56E+007.56E+002.31E+006.37E+001.14E+007.27E+001.60E+007.03E+001.69E+00
F59.97E+012.91E+011.14E+023.65E+011.13E+024.02E+011.14E+022.50E+011.18E+023.82E+01
F66.04E+022.63E+028.86E+023.03E+027.77E+022.65E+021.02E+034.75E+021.06E+034.16E+02
F74.65E-023.60E-021.07E-011.14E-017.23E-026.15E-021.13E-018.00E-029.99E-021.11E-01
F87.31E+022.09E+028.49E+022.21E+028.74E+022.33E+029.65E+022.34E+028.67E+022.79E+02
F93.02E+016.21E+003.45E+015.78E+003.16E+015.81E+003.46E+017.08E+003.45E+016.64E+00
F107.26E+001.09E+008.47E+009.48E-017.66E+009.36E-018.22E+001.34E+008.33E+001.01E+00
F117.22E+002.41E+009.63E+002.82E+007.70E+002.93E+001.04E+013.11E+009.70E+003.79E+00
F126.18E+042.72E+046.92E+042.41E+046.39E+041.97E+047.28E+043.49E+046.42E+041.91E+04
F132.13E+004.68E-013.52E+003.14E-013.40E+004.55E-016.23E+025.39E+023.23E+032.41E+03
F146.40E+011.47E+012.77E+021.03E+021.71E+022.01E+024.32E+022.43E+015.62E+023.31E+02
F151.02E+027.31E+001.07E+029.03E+001.23E+021.46E+015.11E+033.21E+036.42E+041.91E+04

