Article

Design and Implementation of a Robust Decision Support System for Marine Space Resource Utilization

1
State Key Laboratory of Coastal and Offshore Engineering, Dalian University of Technology, Dalian 116024, China
2
National Marine Environmental Monitoring Center, Dalian 116024, China
*
Author to whom correspondence should be addressed.
ISPRS Int. J. Geo-Inf. 2016, 5(8), 140; https://0-doi-org.brum.beds.ac.uk/10.3390/ijgi5080140
Submission received: 12 May 2016 / Revised: 24 July 2016 / Accepted: 1 August 2016 / Published: 8 August 2016
(This article belongs to the Special Issue Web/Cloud Based Mapping and Geoinformation)

Abstract

:
Increasing coastal space resource utilization (CSRU) activities and their impact on coastal environments has been recognized as a critical coastal zone stressor. Consequently, the need for sustainable and valid CSRU management has been highlighted. In this study, a highly-intelligent prototype decision-aided system for CSRU was developed. In contrast with existing coastal decision-aided systems, this system is aimed at the management of CSRU, providing reliable and dynamic numerical simulation, analysis, and aided decision making for real coastal engineering based on a self-developed fully automatic numerical program. It was established on multi-tier distributed architecture based on Java EE. The most efficient strategies for spatial data organization, automatic coastal numerical programs, and impact assessment modules are demonstrated. In addition, its integrated construction involving the addition of a new coastal project on the webpage, its one-click numerical prediction of coastal environmental impacts, assessments based on numerical results, and its aided decision-making capabilities are addressed. The system was applied to Ningbo Sea, China, establishing the Ningbo CSRU Decision Support System. Two projects were demonstrated: one reclamation project and one land-based outlet planning case. Results indicated that these projects had detrimental effects on local coastal environments. Therefore, the approvals of these projects were not recommended.

1. Introduction

Increasing human activities in coastal zones require integrated coastal zone management (ICZM). Many protocols, approaches, and tools for ICZM application (e.g., Wang et al. [1], Deboudt et al. [2], Wheeler et al. [3], Prem [4], Areizage et al. [5], Rochette and Bille [6]) have been developed since its importance was discussed during the Stockholm Conference in 1972 [7,8]. Among these, Deboudt et al. [2] systematically expounded the three phases in the development of ICZM in France. Many new tools have been created to improve the implementation of French ICZM strategies since 2001. Recently, improved Geographic Information System (GIS) and Decision Support System (DSS) technologies have been integrated into ICZM, and many coastal management systems have been explored using different functions. A GIS-based ICZM system has been designed and established for managing different kinds of data and information involving land and water environments, as well as sharing [9]. The Guangdong coastal zone sustainable development DSS has been established to promote harmonious ecological and social development in Guangdong, China [10]. Rodríguez et al. has presented GIS applications for coastal hazards, shoreline evolution, and coastal sand dune evolution in different areas of the Spanish littoral zone [11].
Studies published over the last decade have demonstrated the effectiveness of GIS systems in coastal information management, coastal environmental monitoring and prediction, coastal disaster warning, coastal fisheries, and comprehensive improvement of coastal zones. In coastal information management, the Integrated Ocean Observing System was established to monitor the variability of coastal waters and estuaries in the United States [12]. In China, a multisource spatial data management system developed by Du et al. has provided intelligent information analysis and technology services for coastal zone and offshore investigation and management [13]. Red ACOMAR Canarias [14] is a typical application used in coastal environmental monitoring and prediction. Coastal disaster warning is an important feature of a coastal management system; current data have been considered to create contingency plans in order to minimize environmental risks. Data assimilation modelling developed by Copeland & Thiam-Yew has been used to assess risks of oil landfalls [15]. The Quanzhou coastal zone disaster system [16] has achieved effective monitoring and early warning of marine calamity.
In coastal fisheries, Riolo [17] developed an innovative fishery GIS to analyze and visualize temporal and spatial patterns of the longline fishery in the American Samoa. In China, fishing efficiency and sustainable fisheries development in the South China Sea [18] were improved via a fisheries information dynamic collection and real-time automatic analysis system. With the development of a prototype, the Digital Sea of China, coastal management systems entered a new development stage [19]. The implementation of the ChongMing Dongtan coastal ecosystem management platform through simulating future ecological conditions dramatically promoted local social economic and ecological development [20]. MarineMap, developed by Merrifield et al. [21], was easily implemented in the design of marine protected areas and significantly contributed to the further development of broader tools and approaches for coastal and marine spatial planning. In addition, Gourmelon et al. [22] developed a dynamic GIS and used both capture data and contaminant participatory workshops to promote ICZM. Such systems have therefore played important roles during the practice of ICZM.
Coastal space resource utilization (CSRU) is an important component of marine resource exploitation and utilization. It significantly contributes to the development of marine and social economies in coastal zones. However, the environmental impact of CSRU activities on coastal ecosystems and resources cannot be ignored. Long-term and large-scale CSRU activities have degraded coastal environments over time. Sustainable and effective CSRU management, as the main component of ICZM, is critical for harmonious economic development and environmental protection in regional coastal zones. Previously, coastal numerical models were employed to simulate and forecast the changes in coastal environments caused by CSRU activities. However, due to the complexity of modeling, it is often difficult to perform, even for a skilled user. In contrast, decision-making in CSRU management largely depends on the marine environmental impact assessment report drafted by individuals or groups. Decision-makers and stakeholders are unable to perform simulation, analysis, and assessment of marine environmental change alone.
In China, the importance and urgency of ICZM was clearly stated in the 2015 National Marine Meeting, and the requirement for the management and control of CSRU was highlighted. Therefore, a special decision-aided system, aimed at CSRU management and decision-aided making, needs to be developed. Spatial and non-spatial data should be utilized to describe the status of coastal environments, coupled with coastal numerical models for simulating the changes in coastal environments caused by CSRU activities. We focused on the development of a highly sophisticated decision support system for coastal space resource utilization (CSRU-DSS) that assists coastal zone manager and stakeholder decision making in the management of CSRU.
This paper presents the design and implementation of this CSRU-DSS, established on multi-tier distributed architecture. It describes in detail how the system can provide dynamic numerical simulation, analysis, and assessments for potential CSRU development scenarios. In addition, a case study utilizing the system is presented.

2. Methods

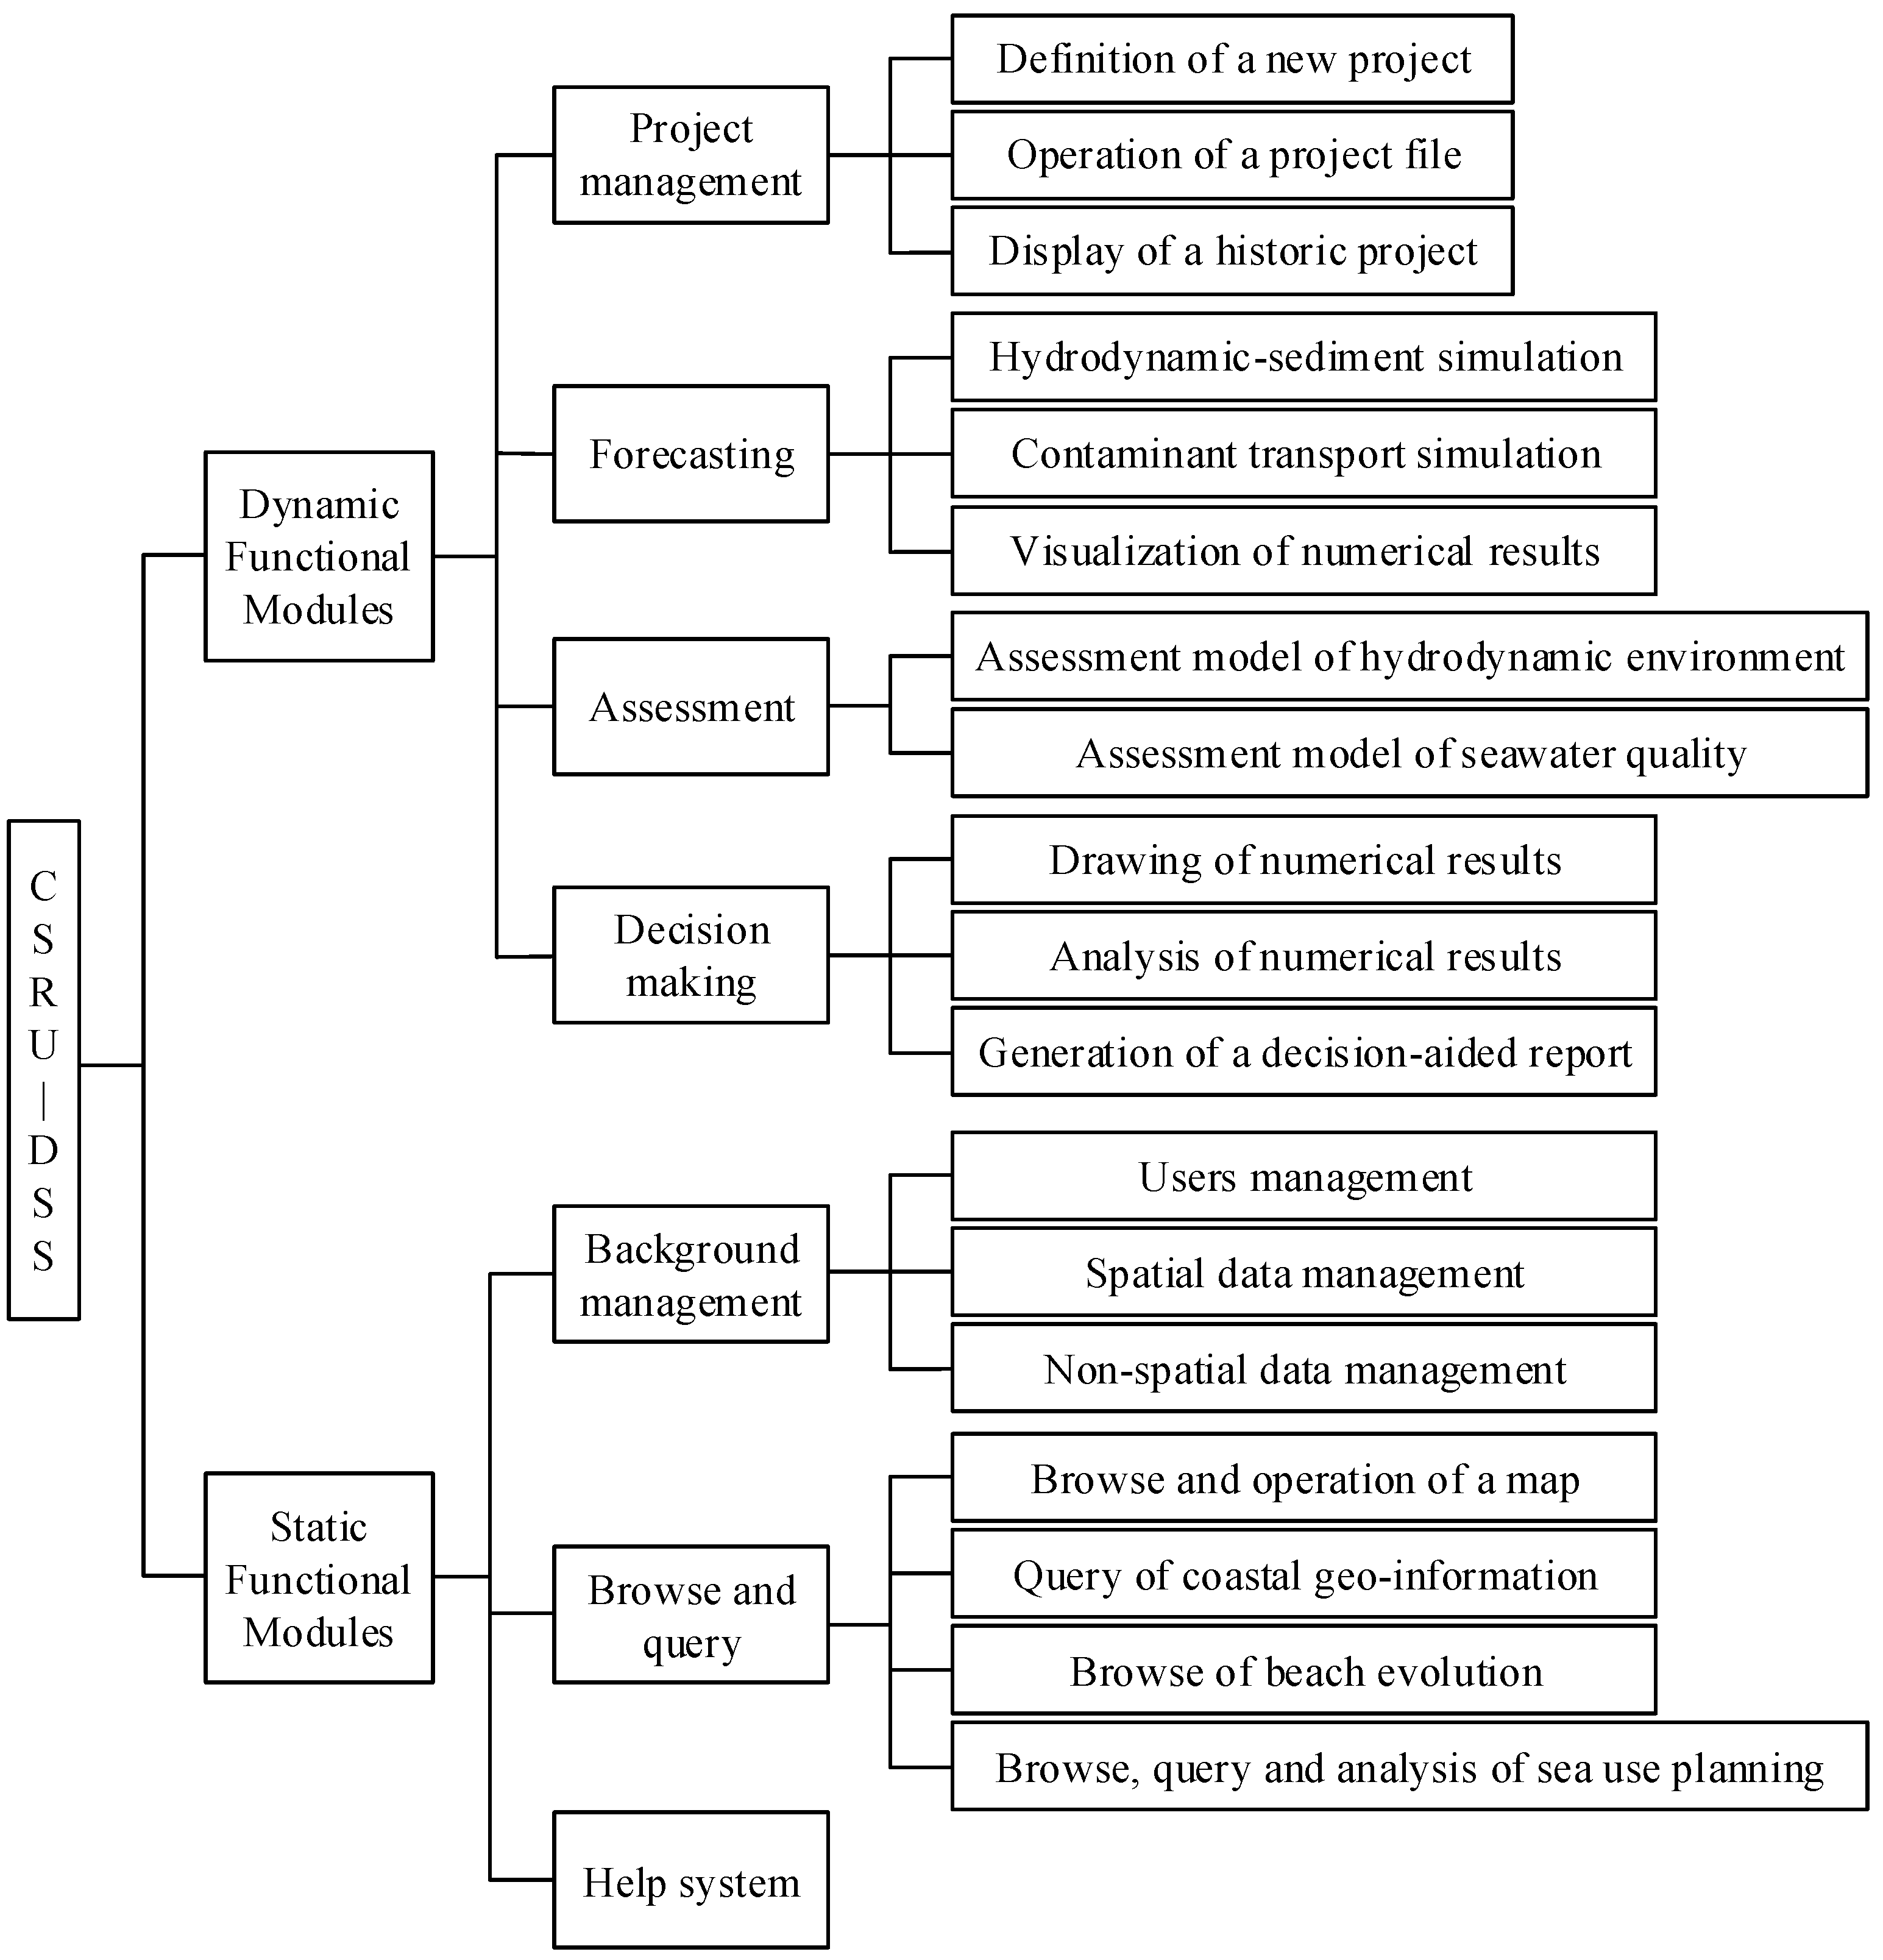
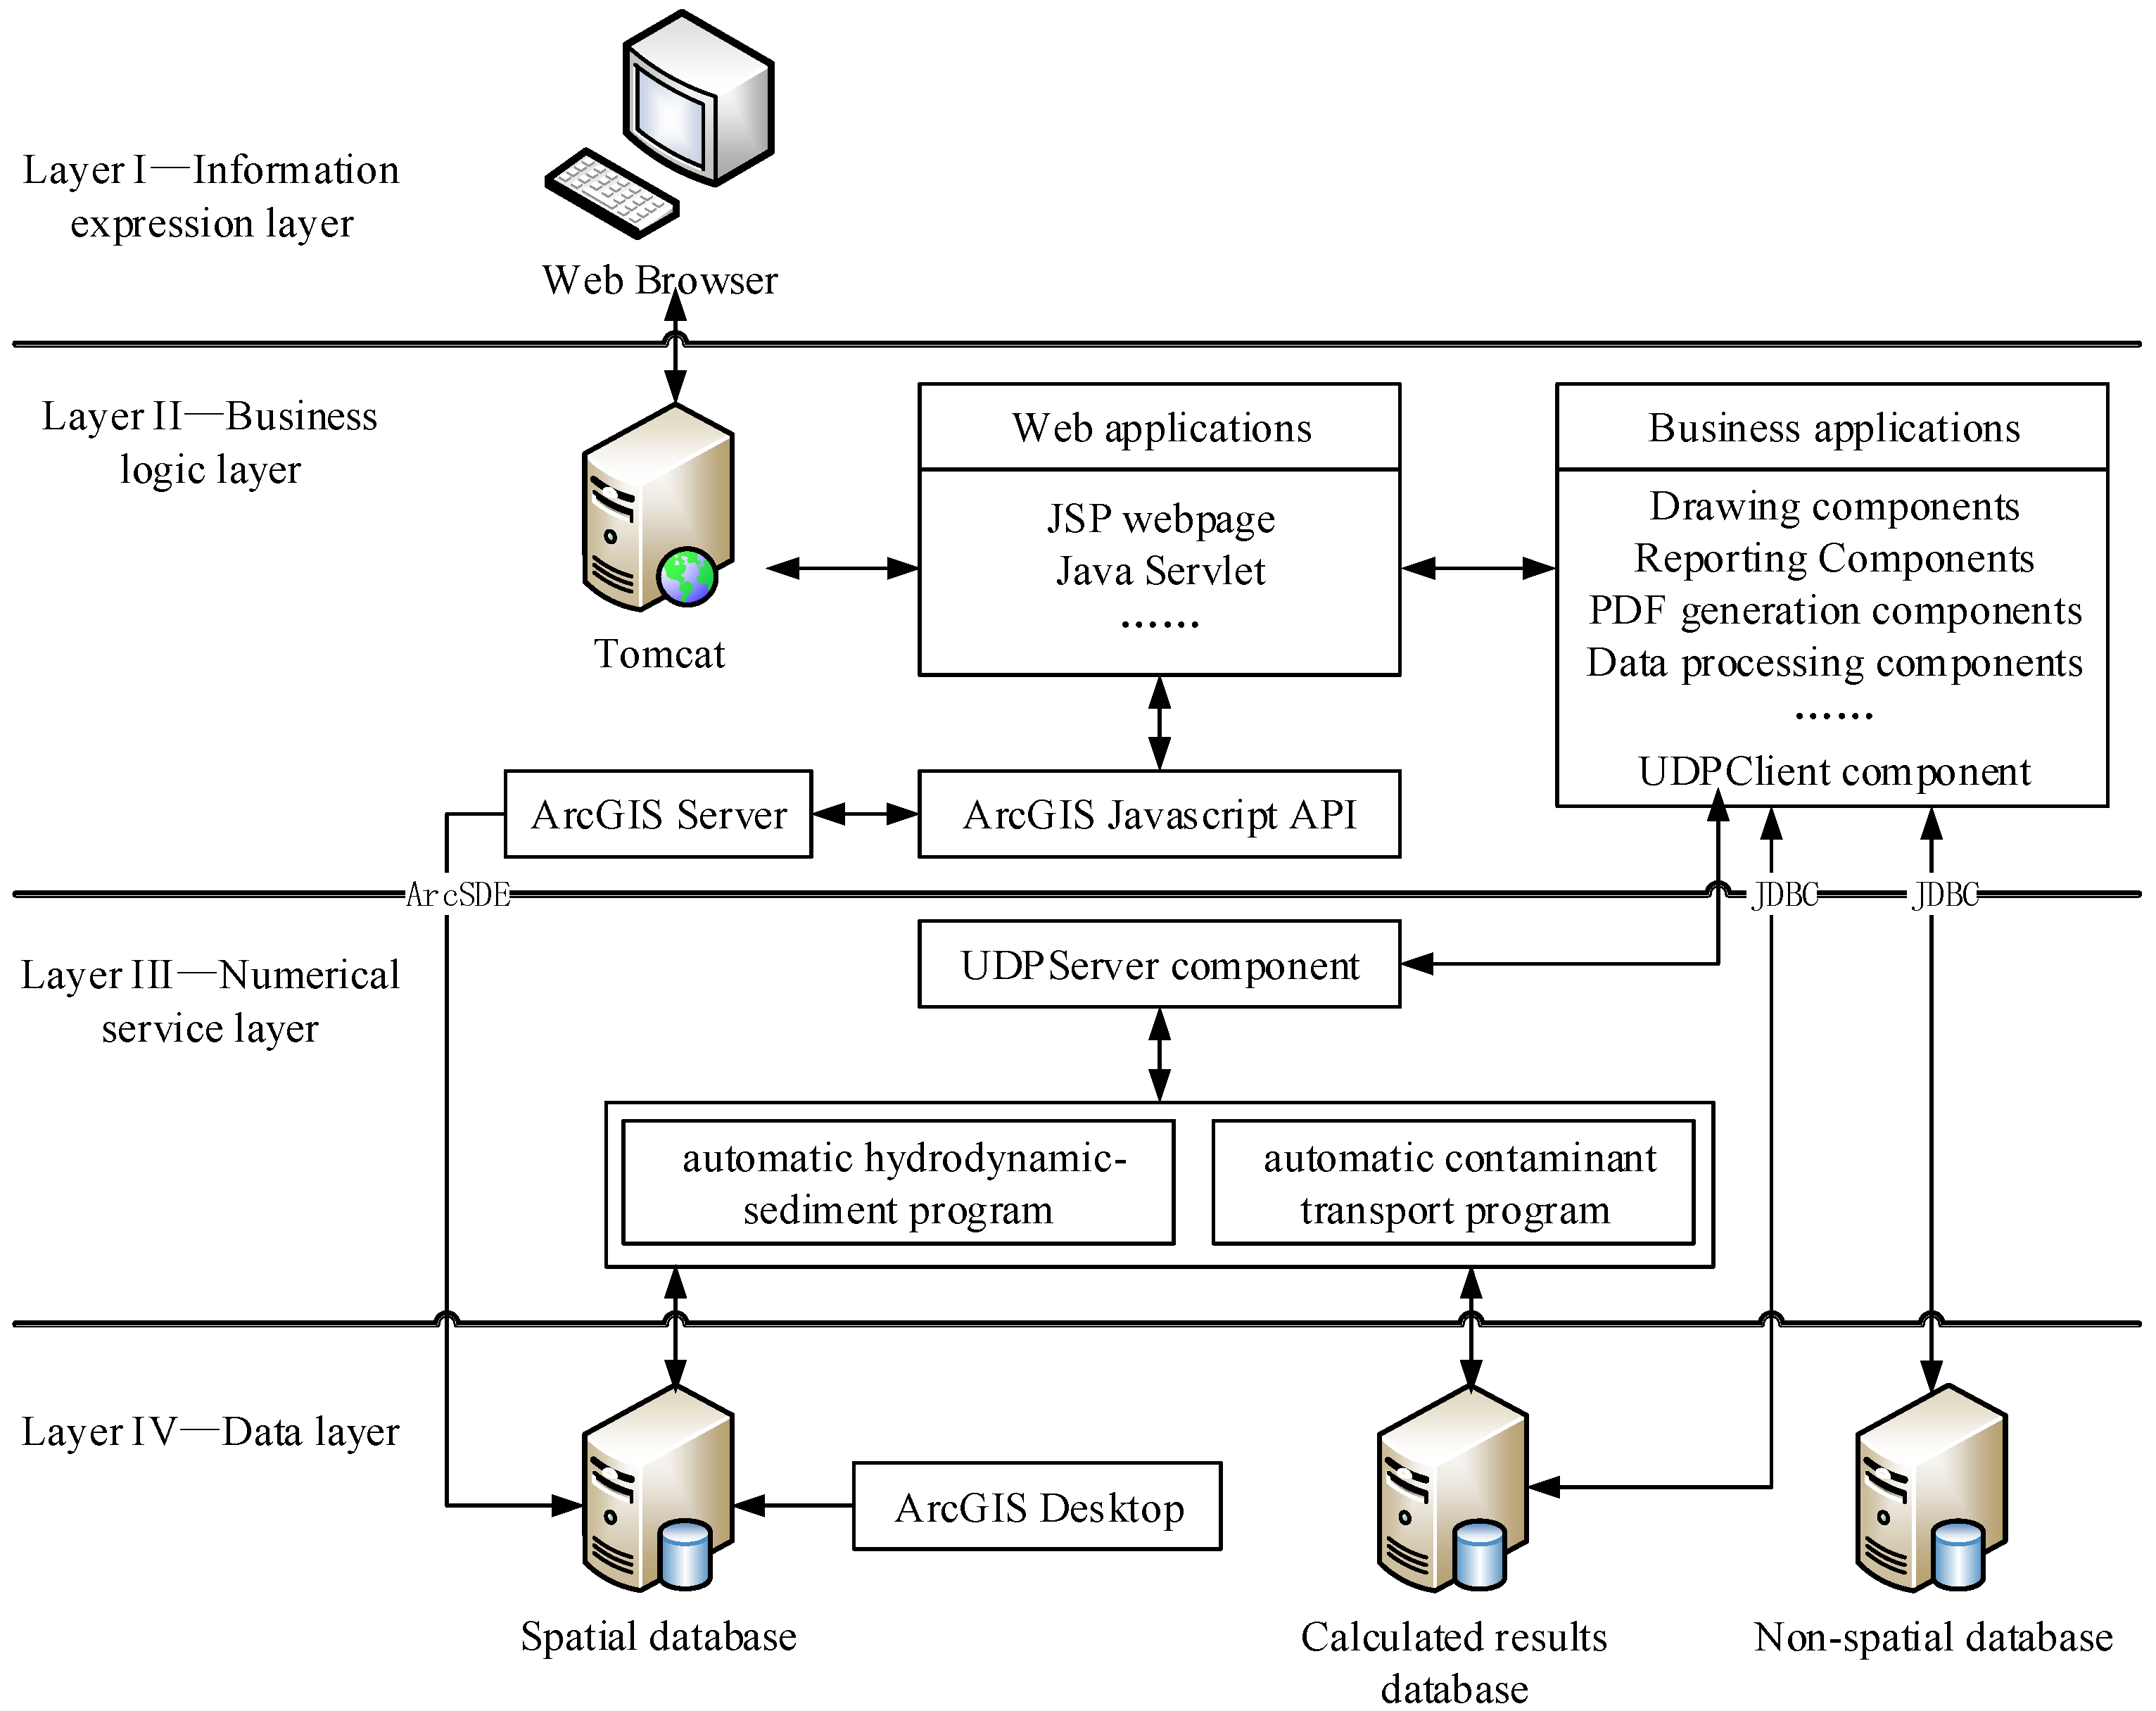
2.1. CSRU-DSS Architecture

The CSRU-DSS was established according to a Web GIS-based methodology. Spatial and non-spatial data were applied to mapping, and coastal numerical models were used for forecasting. National standards were employed to analyze and make assessments using numerical results. The CSRU-DSS possesses the basic functions of common coastal GIS, such as coastal data management, display, retrieval, query, and statistical analysis, through the collation of data in a coastal spatial database. Furthermore, it is capable of a series of functions for timely responses to coastal environment changes caused by a new coastal project. The distinctive functions include automatic modeling, numerical simulation, analysis, environment change assessment, and improved decision making. Figure 1 displays the functional structure of the system. A dynamic functional module and a static functional module with several sub-modules have been designed into the system. The modules in the dynamic function module interact with each other. The forecasting module obtains necessary project data from the project-management module and provides numerical results to the assessment module. These are required for the decision making module. In contrast, the modules in the static functional module are independent.
In most of the existing coastal decision-aided systems, numerical models are stationary with a fixed computational domain and grid system. However, in a CSRU-DSS, the coastline will be altered and the numerical models are required to adapt to these changes. Therefore, this system needs to be dynamic. According to the above requirements, this CSRU-DSS was established on a multi-tier distributed architecture based on Java EE (Figure 2). Layer I is the map-service-based information expression layer for users. It has a simple and user-friendly interface to display results, and to provide functions and services. In addition, controls have been added for sending requests to Layer II. Layer II is the business logic layer comprising a web application sublayer and a business application sublayer storing web applications and business applications, respectively. The web application sublayer delivers a function request derived from Layer I to the business application sublayer. A complete business function is completed by the business applications after receiving the function request from the web application sublayer. After processing the results derived from the business application sublayer, Java Server Pages (JSP) are generated dynamically by the web applications and displayed onto Layer I. In addition, GIS functions, such as browse and query, are realized using ArcGIS JavaScript API. Most of the function requests, with the exception of the hydrodynamic and contaminant simulation function in the dynamic function module, are processed in Layer II. Layer III comprises the numerical service layer, which stores the automatic numerical programs and UDPServer component. Automatic numerical programs provide numerical services that represent the core functionalities of the system, and the forecasting functionalities in the dynamic function module are realized. The UDPServer component cooperates with the UDPClient component in Layer II to complete the access and control of the numerical programs. A linkage between Layer II and Layer III is established. Layer IV is the data layer; all system data are stored here. It answers the request from Layer II or Layer III, and controls data reading and writing. The multi-tier distributed architecture is the main advantage of Java EE. It possesses a clear structure, extendibility, stability, reliability, and security. Most function modules are performed in Layer II, displayed in Layer I and obtain data in Layer IV. In particular, the forecasting modules are carried out in both Layer II and Layer III.
Tomcat has been integrated into the system to implement and publish the web service. The web pages are mainly developed by JSP technology and their GIS functions are obtained through the ArcGIS Server JavaScript API. All of the business logic modules are implemented by Java Servlet or JavaBean. The automatic numerical programs were developed by Liang et al. [23]. The SQL Server was selected for data storage and management.

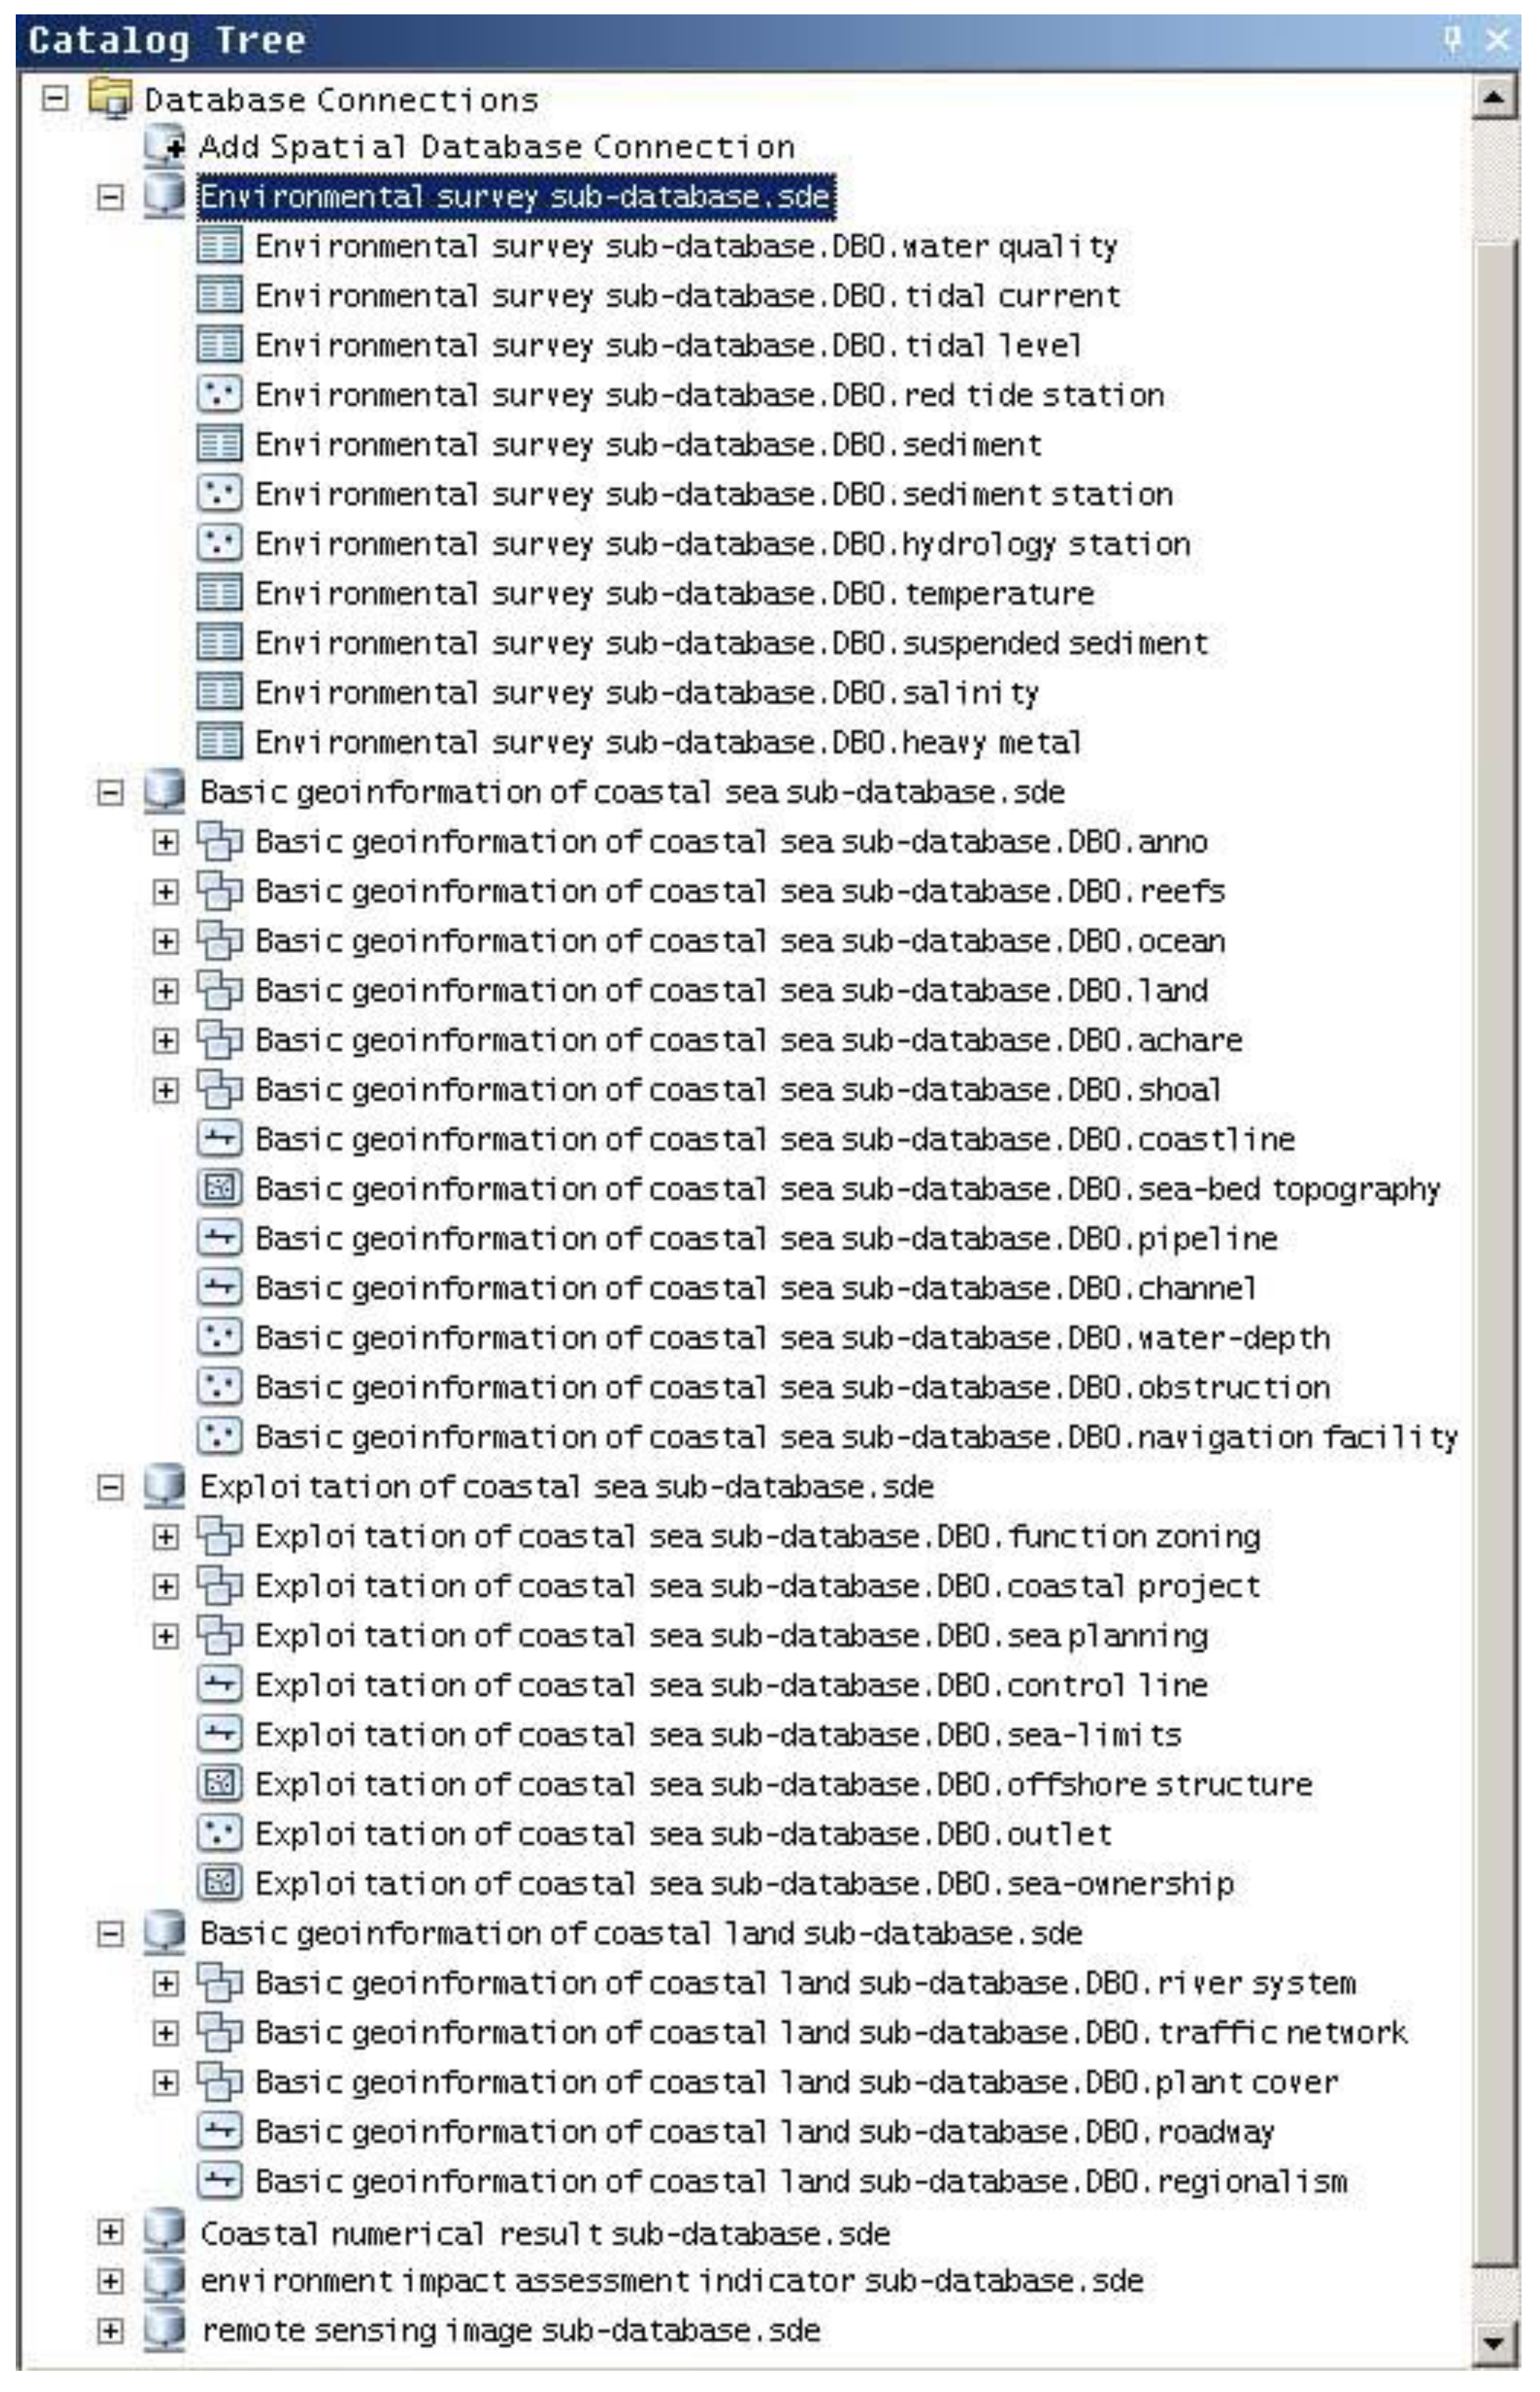
2.2. Spatial Data Organization and Map Services

The coastal zone is a complex region comprising multi-levels, multi-factors, and multi-fields. Furthermore, coastal water variables exhibit temporal-spatial distributions. Therefore, it is difficult to organize coastal zone spatial data and establish spatial databases. In the present case, a geo-ontology approach was adopted and a geo-ontology conceptual model of the coastal zone was constructed. This provides important semantic characteristics for the organization of spatial data in the coastal zone. Through data categorizing, merging, and even segmenting, the spatial data classes match the concepts or attributes of the geo-ontology conceptual model. Coding is used to establish the mapping relationship between the geo-ontology conceptual model and spatial data of the coastal zone with uniform encoding rules. Spatial databases for the coastal zone are established according to the conception structures in the geo-ontology conceptual model. A geodatabase was applied to spatial data storage. ArcSDE was employed to establish a database connection between the SQL Server and ArcCatalog. There is a one-to-one correspondence between a data table in the SQL Server and a feature set or a feature class in the ArcCatalog. Figure 3 displays the physical storage structure of the spatial database. Seven sub-databases were established. Map services were published after the maps were created in ArcMap.

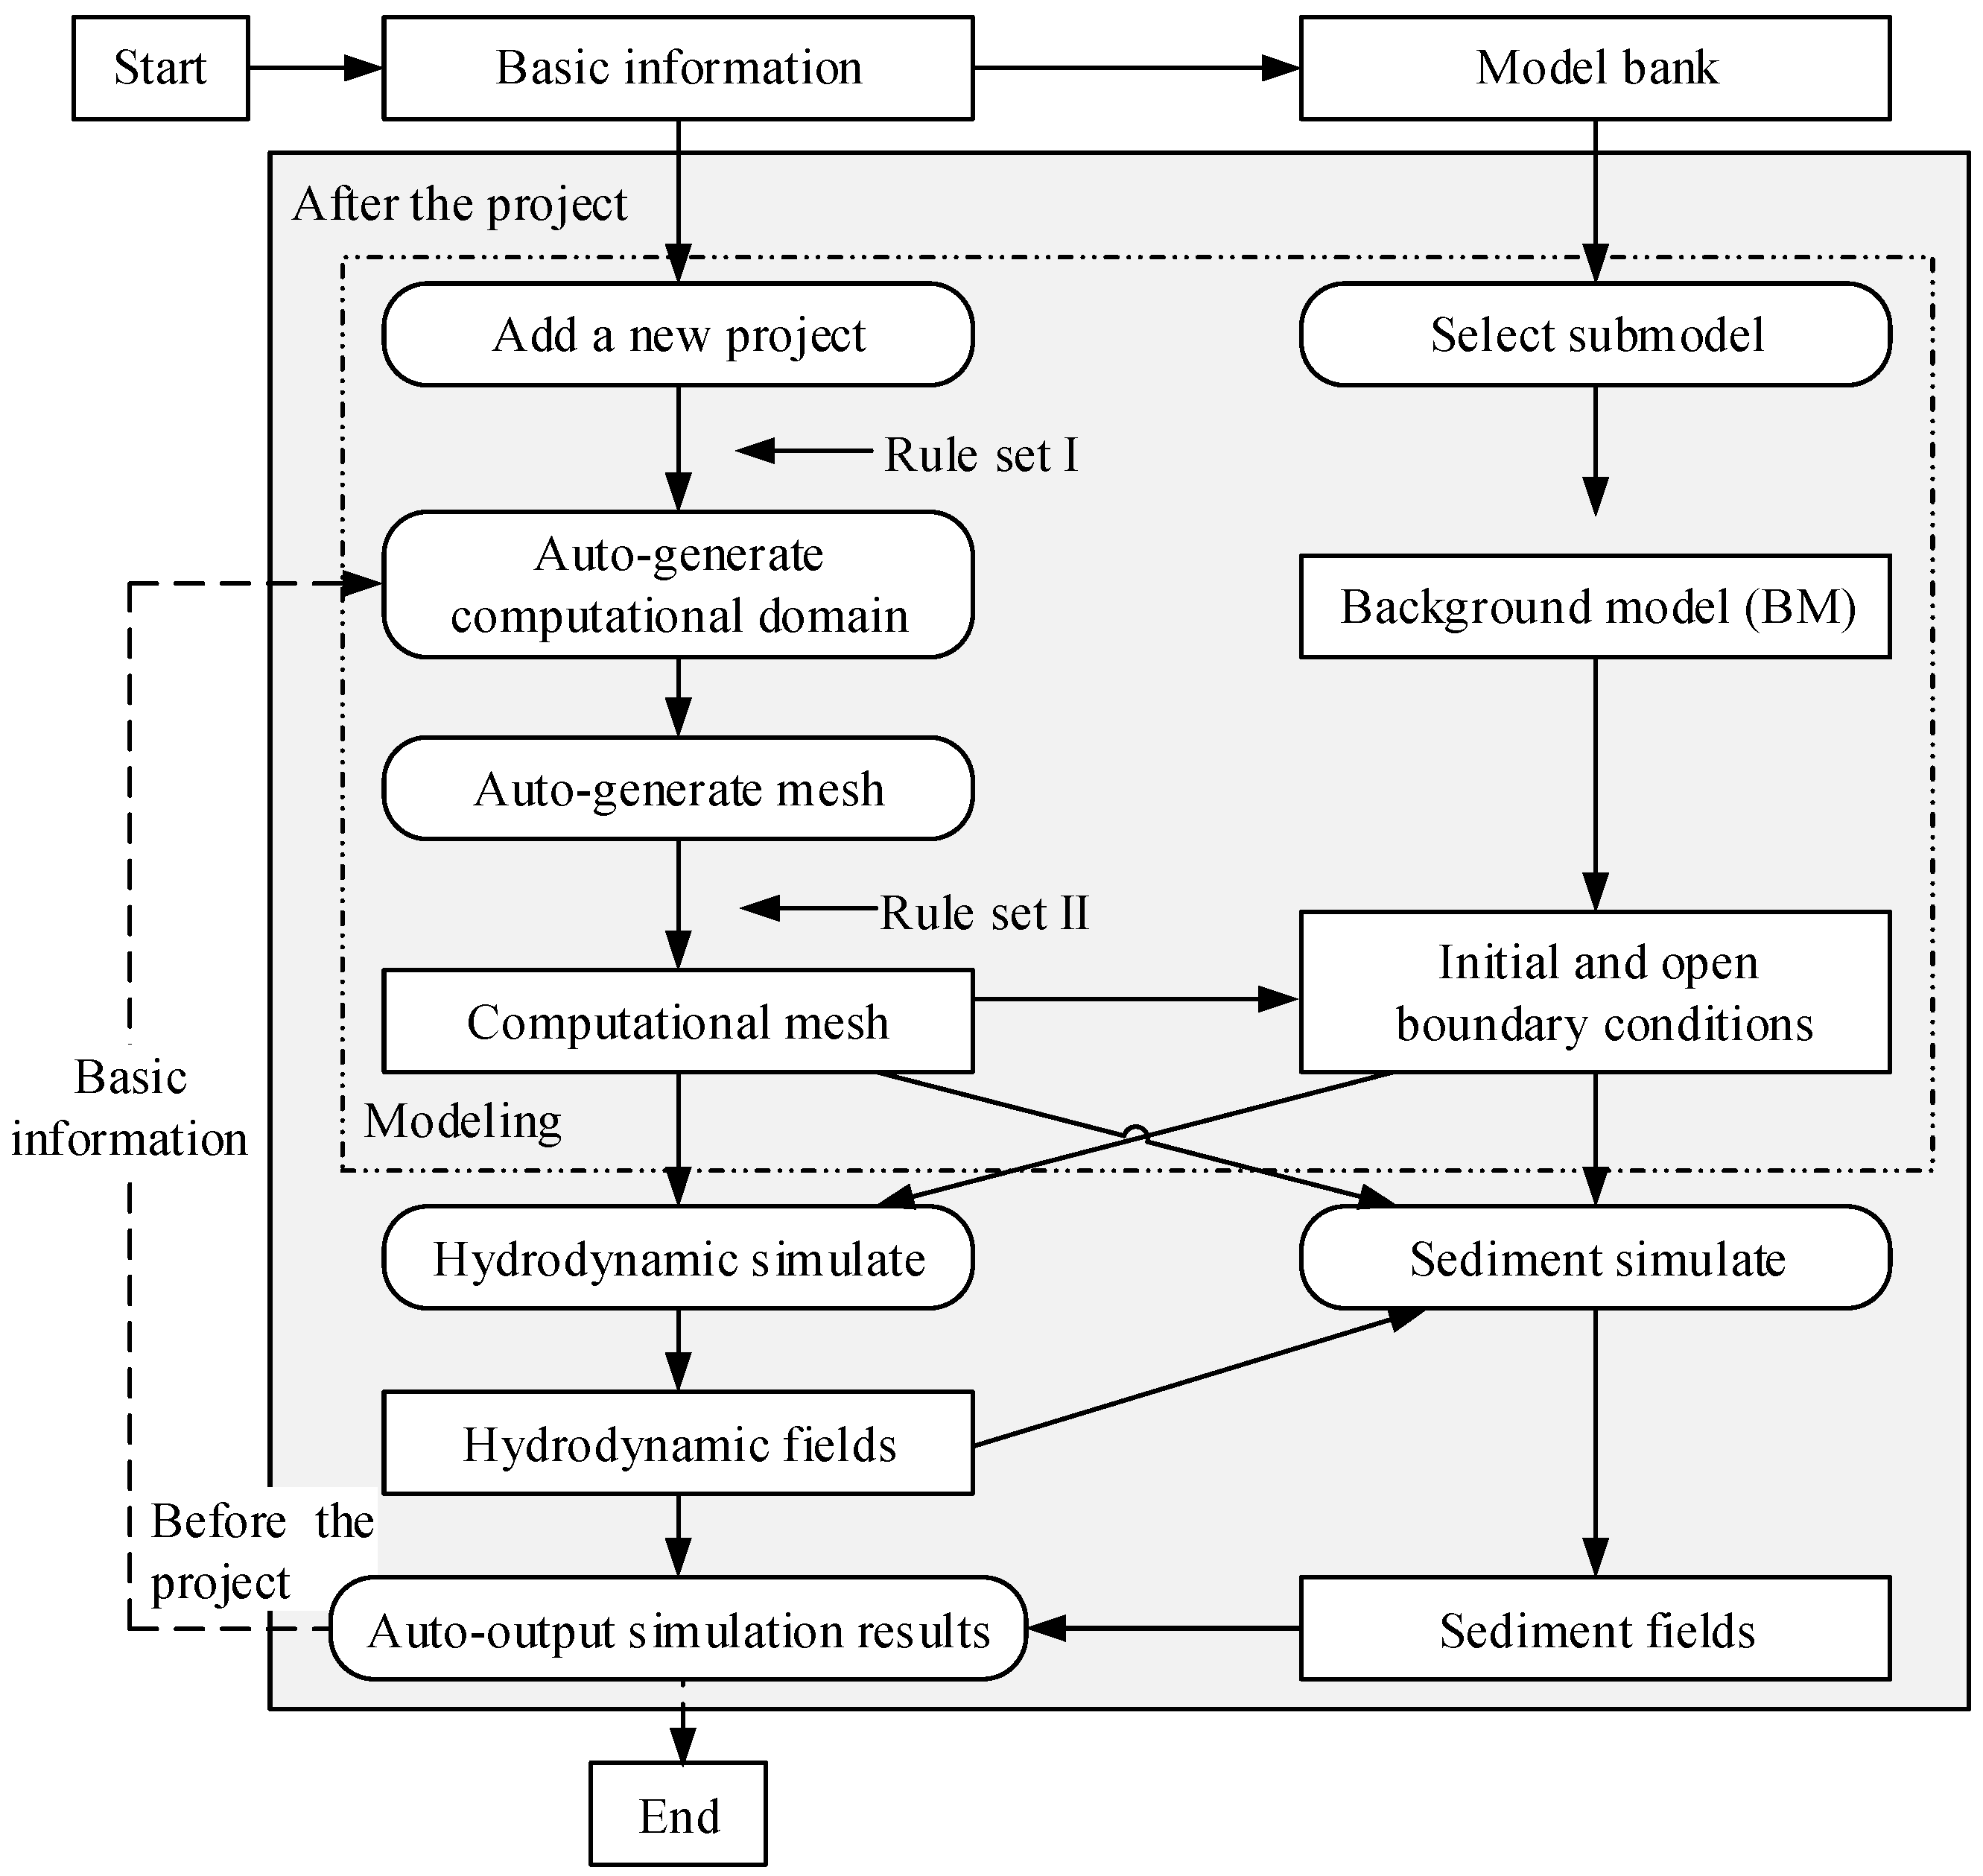
2.3. Automatic Coastal Numerical Programs and Numerical Services

Web GIS-based automatic coastal numerical programs are an important component of the CSRU-DSS. They were employed for forecasting and are stored in Layer III. A preset static model in existing decision-aided systems provides numerical simulation and analysis for a specific computational domain. Therefore, the system does not work if the coastal environment changes. The automatic programs enable dynamic modeling and simulation for the implementation of coastal projects. To date, two types of CSRU have been considered in the CSRU-DSS; a coastline reconstruction project and a land-based outlet project. The coastline reconstruction project involves several CSRU activities that result in coastline change such as reclamation, coastal protection, and port construction. To this end, two types of automatic coastal programs have been established. The automatic hydrodynamic-sediment program was developed to simulate changes in hydrodynamics and the sediment condition caused by a new coastline reconstruction project. The automatic contaminant transport program was designed to simulate contaminant transport for a new land-based outlet. These programs are compiled into EXE files and provide numerical services. The general concept of the automatic program is as follows.
Step 1.
The modeling layer acquires requisite calculated parameters from a new coastal project and a computational boundary, including spatial data and attributes. They are performed automatically according to actions on the customized webpage. The best fit background model (BM) is selected from a model bank containing a series of validated models and initial coastlines. The new coastal project is added and the computational domain is created.
Step 2.
The computational mesh is generated automatically. The mesh quality is improved by adding new nodes or adjusting the position of nodes in a poor grid after evaluation according to rules. Finally, the mesh met requirements of the numerical computational stability is obtained.
Step 3.
The relevant simulation data and parameters are extracted from the BM such as tidal level at the open boundary and water depth in the computational domain.
Step 4.
The project model is initiated and simulates the coastal conditions in multi-tidal cycles. The results of the numerical simulation are outputted automatically during the simulation.
Step 5.
Coastline and computational boundary data are re-read to create a new computational domain before project implementation. Steps 2 to 4 are repeated to output the calculated results before the project.
Automatic numerical simulations of before and after the implementation of a new coastal project are applied in order to compare the coastal environment changes caused by the project. There are several steps involved in each process including project data acquisition, calculated domain drafting, calculated mesh generation, initial and open boundary condition abstraction, program running, and simulation results extraction. Human operation is unrequired throughout the whole process. The process was described in detail by Liang et al. [23]; in addition, the authors also demonstrated the high efficiency, rationality, and robustness of an automatic coastal numerical program.
Figure 4 displays the automatic hydrodynamic-sediment program workflow. In this workflow, basic information, such as the position, number and type of a project, open boundary position, and tidal prism section position, is required. After defining a new project on the web browser, the project and open boundary information is stored in TXT files. All necessary information for setting up a new local model is automatically acquired from these files. During simulation, results were outputted every hour and stored in DAT files formatted as text. These DAT files are more readable than NC files.

2.4. Assessment Modules and Decision-Aided Services

Related national standards are employed when evaluating the effects of a new coastal project on the coastal environment. In Chinese National Standard GB/T 29726-2013 (Directive of Strategic Environmental Assessment for Reclamation Planning in Bays), the hydrodynamic comprehensive index is calculated using four indexes: average change of current speed at representative points, average change of erosion-accumulation rates, percentage decrease in tidal prism, and percentage reduction in water exchange rate. These were obtained from the calculated results after computational stability. The evaluation model for coastal environment impact caused by the coastline reconstruction project was then obtained. A quick assessment can be completed online according to this standard. Another seawater quality evaluation model was established according to Chinese National Standard GB 3097-1997 (Seawater Quality Standard). This was used to evaluate seawater quality after the new land-based outlet. The concentration of a contaminant discharged from the outlet was obtained from the simulation results. These evaluation models were implemented by Java servlets to provide decision-aided services.

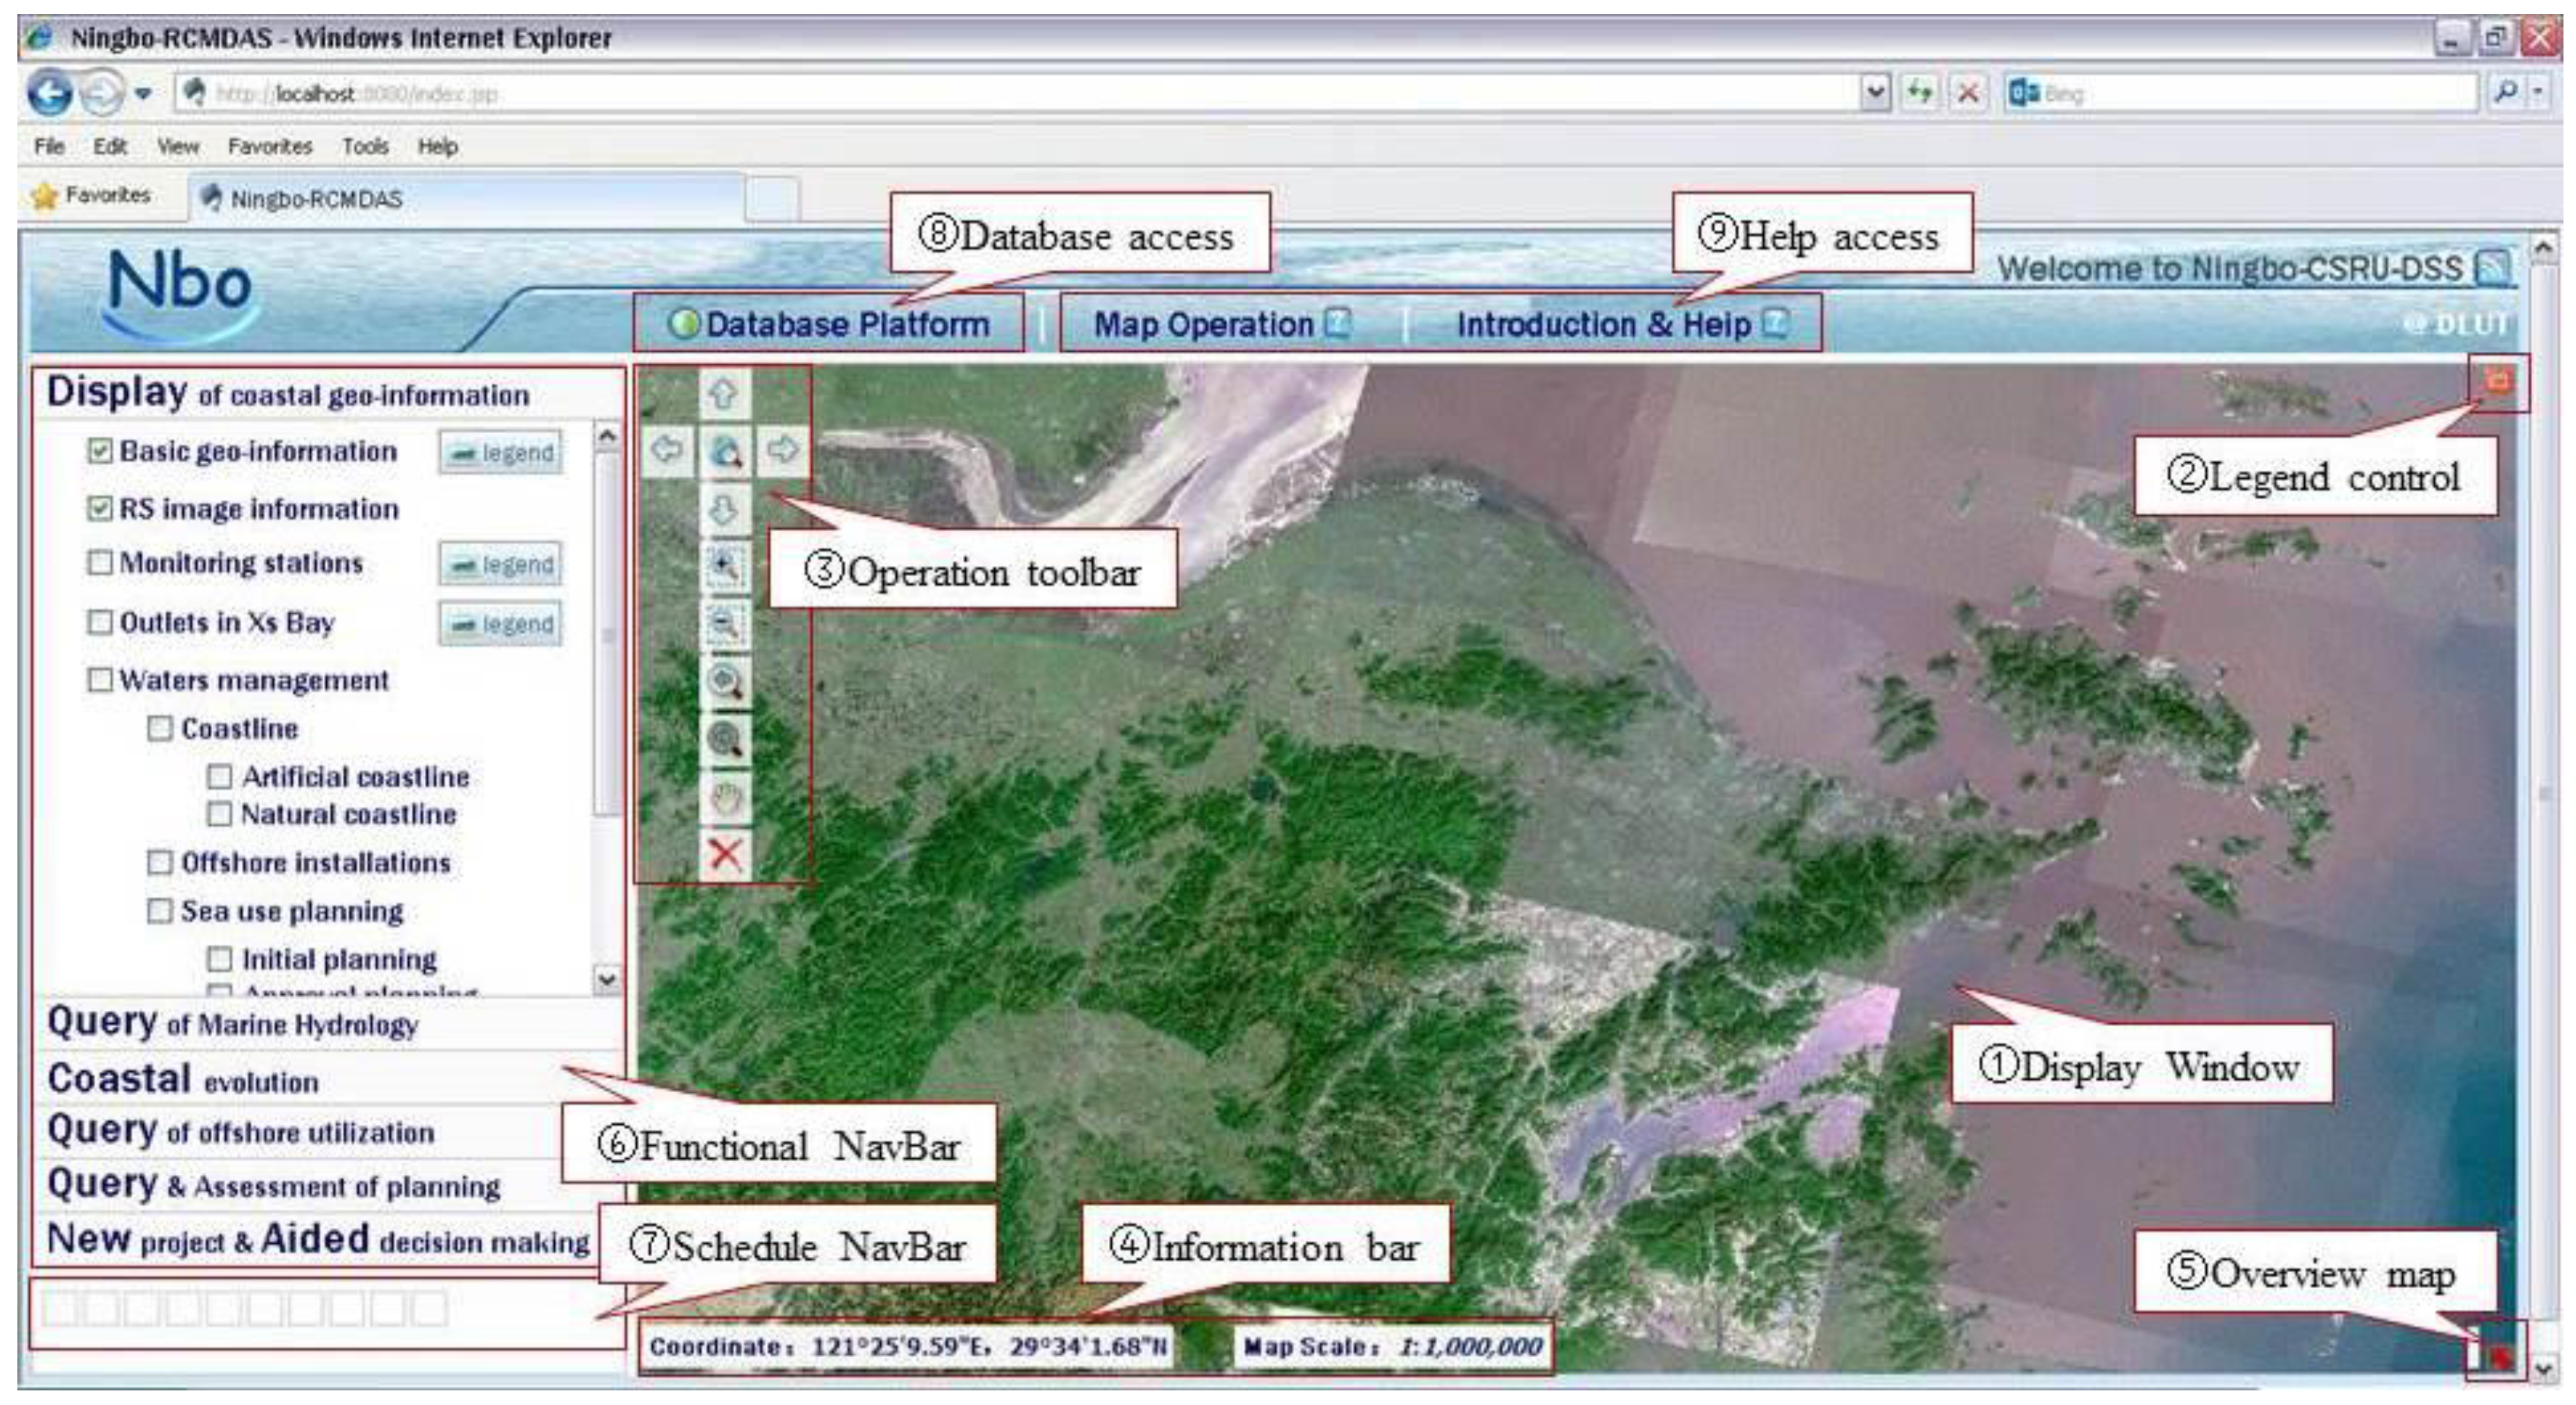
2.5. Integration of the CSRU-DSS

One of the major features of the CSRU-DSS is the connection of various modules and their performance of systematical functions such as management of spatial data, query of coastal information, and coastal environmental assessment of CSRU. A workflow-based integration approach was adopted. There are several workflows in the system including the process relationships among modules for transactions. Different modules and components were invoked in different transactions. Following their sequential organization, the integration of the system was completed. For instance, the environmental impact assessment was carried out in the following order: project drafting, numerical simulation, results handling and visualization, assessment, and decision making. During this process, the type of numerical services and assessment modules were selected automatically according to the project type defined by the users.

3. Case Study

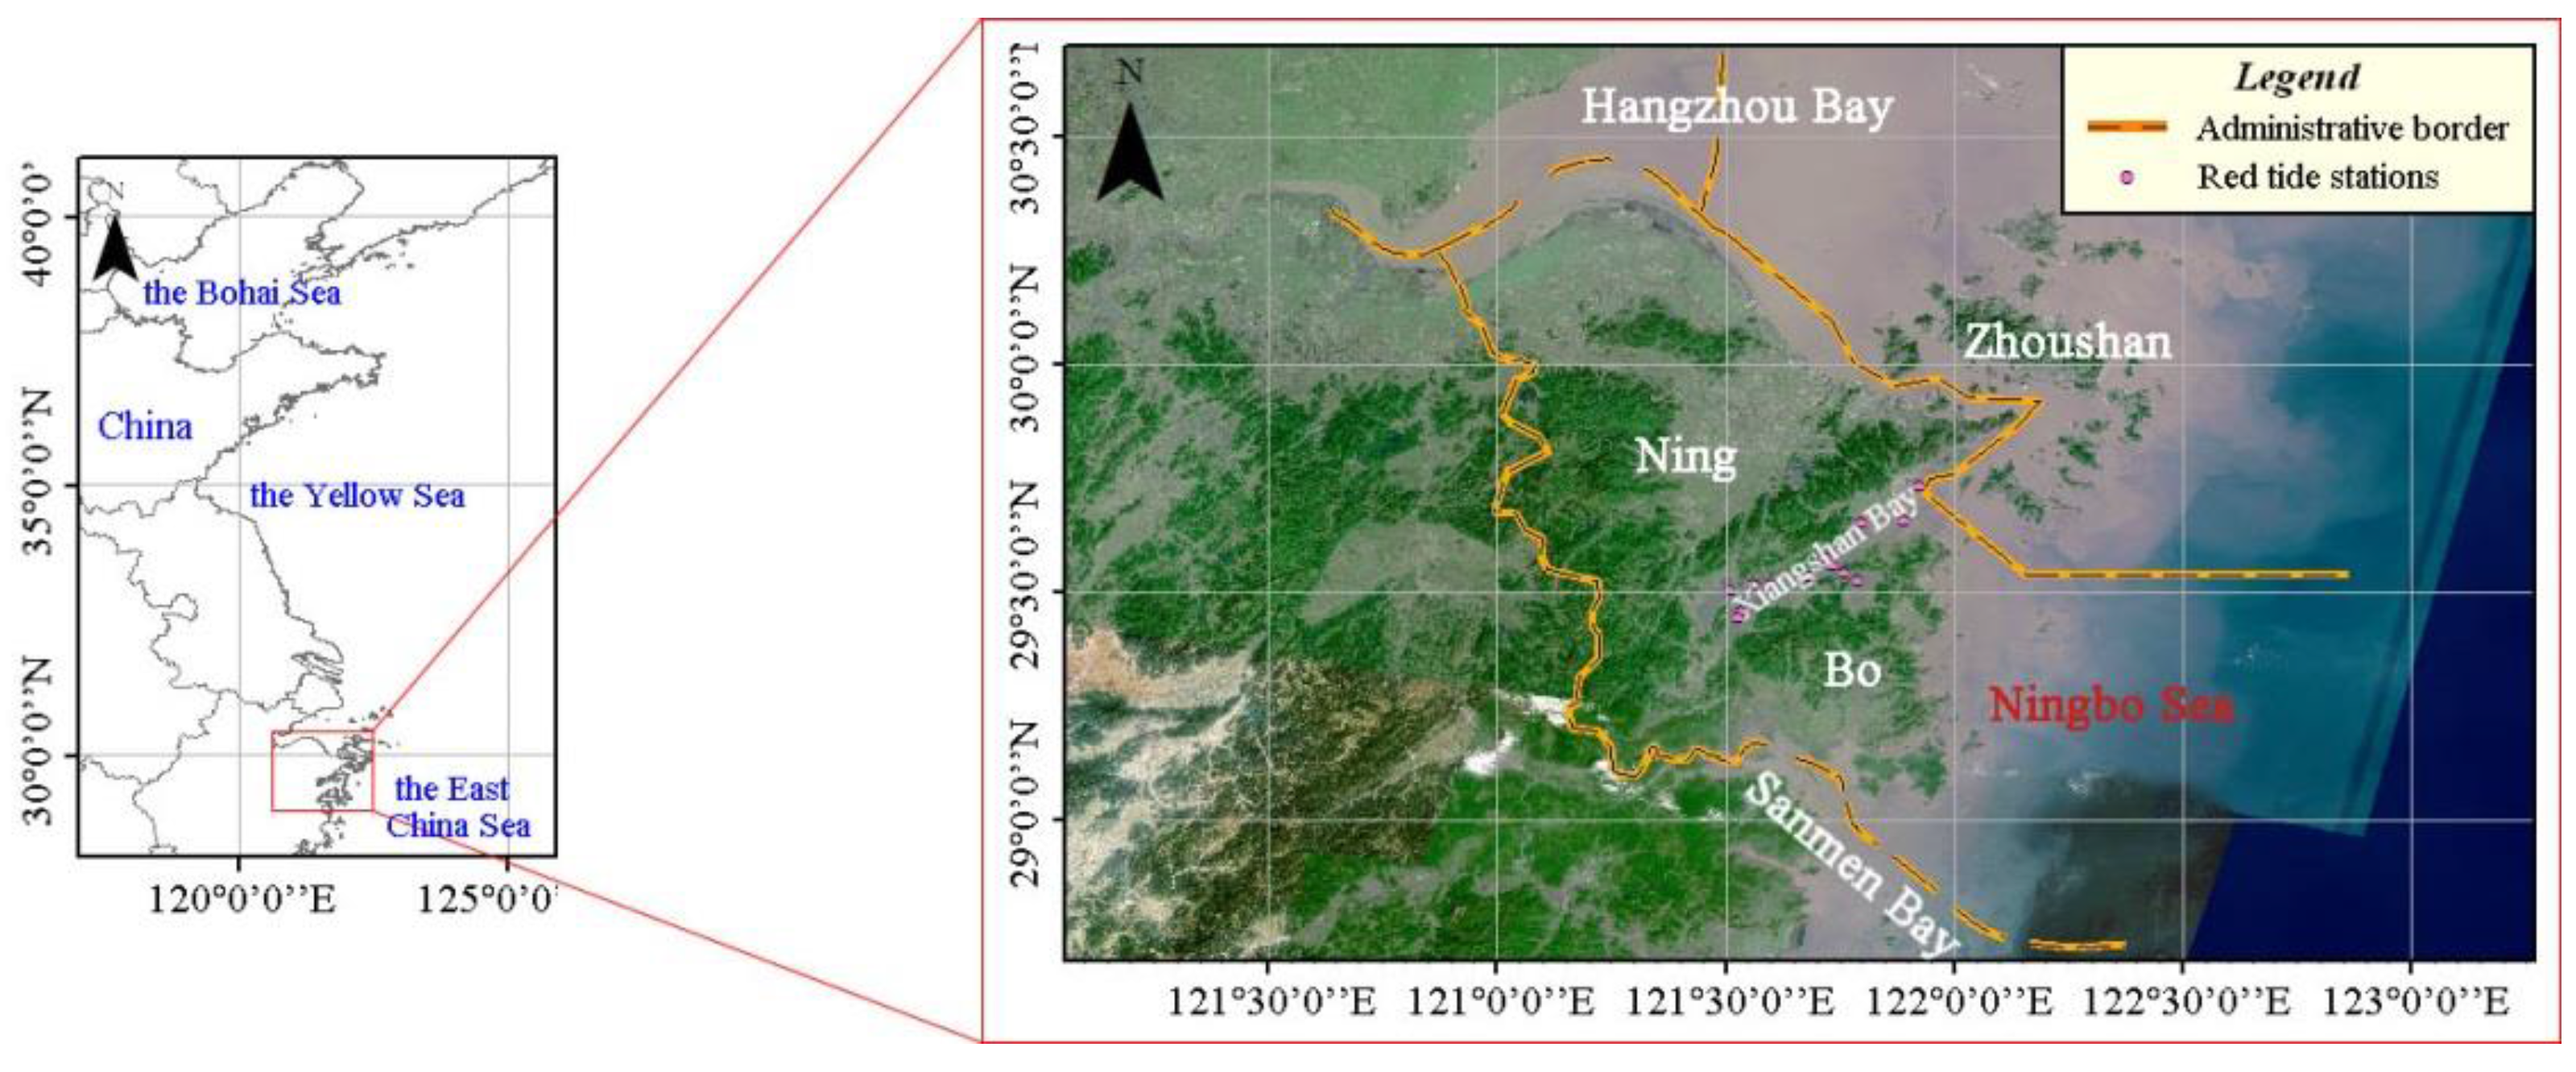
3.1. Study Area and System Setup

Ningbo Sea is situated on the southeastern coast of China and covers an oceanic area of 8014.89 km2. Its 1579.97 km coastline extends from Hangzhou Bay to Sanmen Bay (Figure 5). Recently, CSRU activities in Ningbo have been increasing, resulting in the region becoming the leading marine economy of Zhejiang Province, China. Consequently, its coastal environment has been significantly impacted, leading to increased demands for CSRU management. To address this, a CSRU-DSS for Ningbo Sea (Figure 6) was developed based on the basic framework and functional structure described earlier. Historical and in-situ coastal water data were managed in the database using a geo-ontology approach, complete sets of model banks were established for simulation, evaluation models were set up, and other components were obtained in the Ningbo-CSRU-DSS. This system provided online functions for managers such as display and query of basic information in coastal waters, sea use planning, project management, numerical simulation, coastal environment assessment, and decision making. In addition, a decision-aided report can be created online and downloaded in the form of a PDF file. In this section, two scenarios are presented to demonstrate the application and operation of the complete environmental impact assessment of a new coastal project using this system in this area.

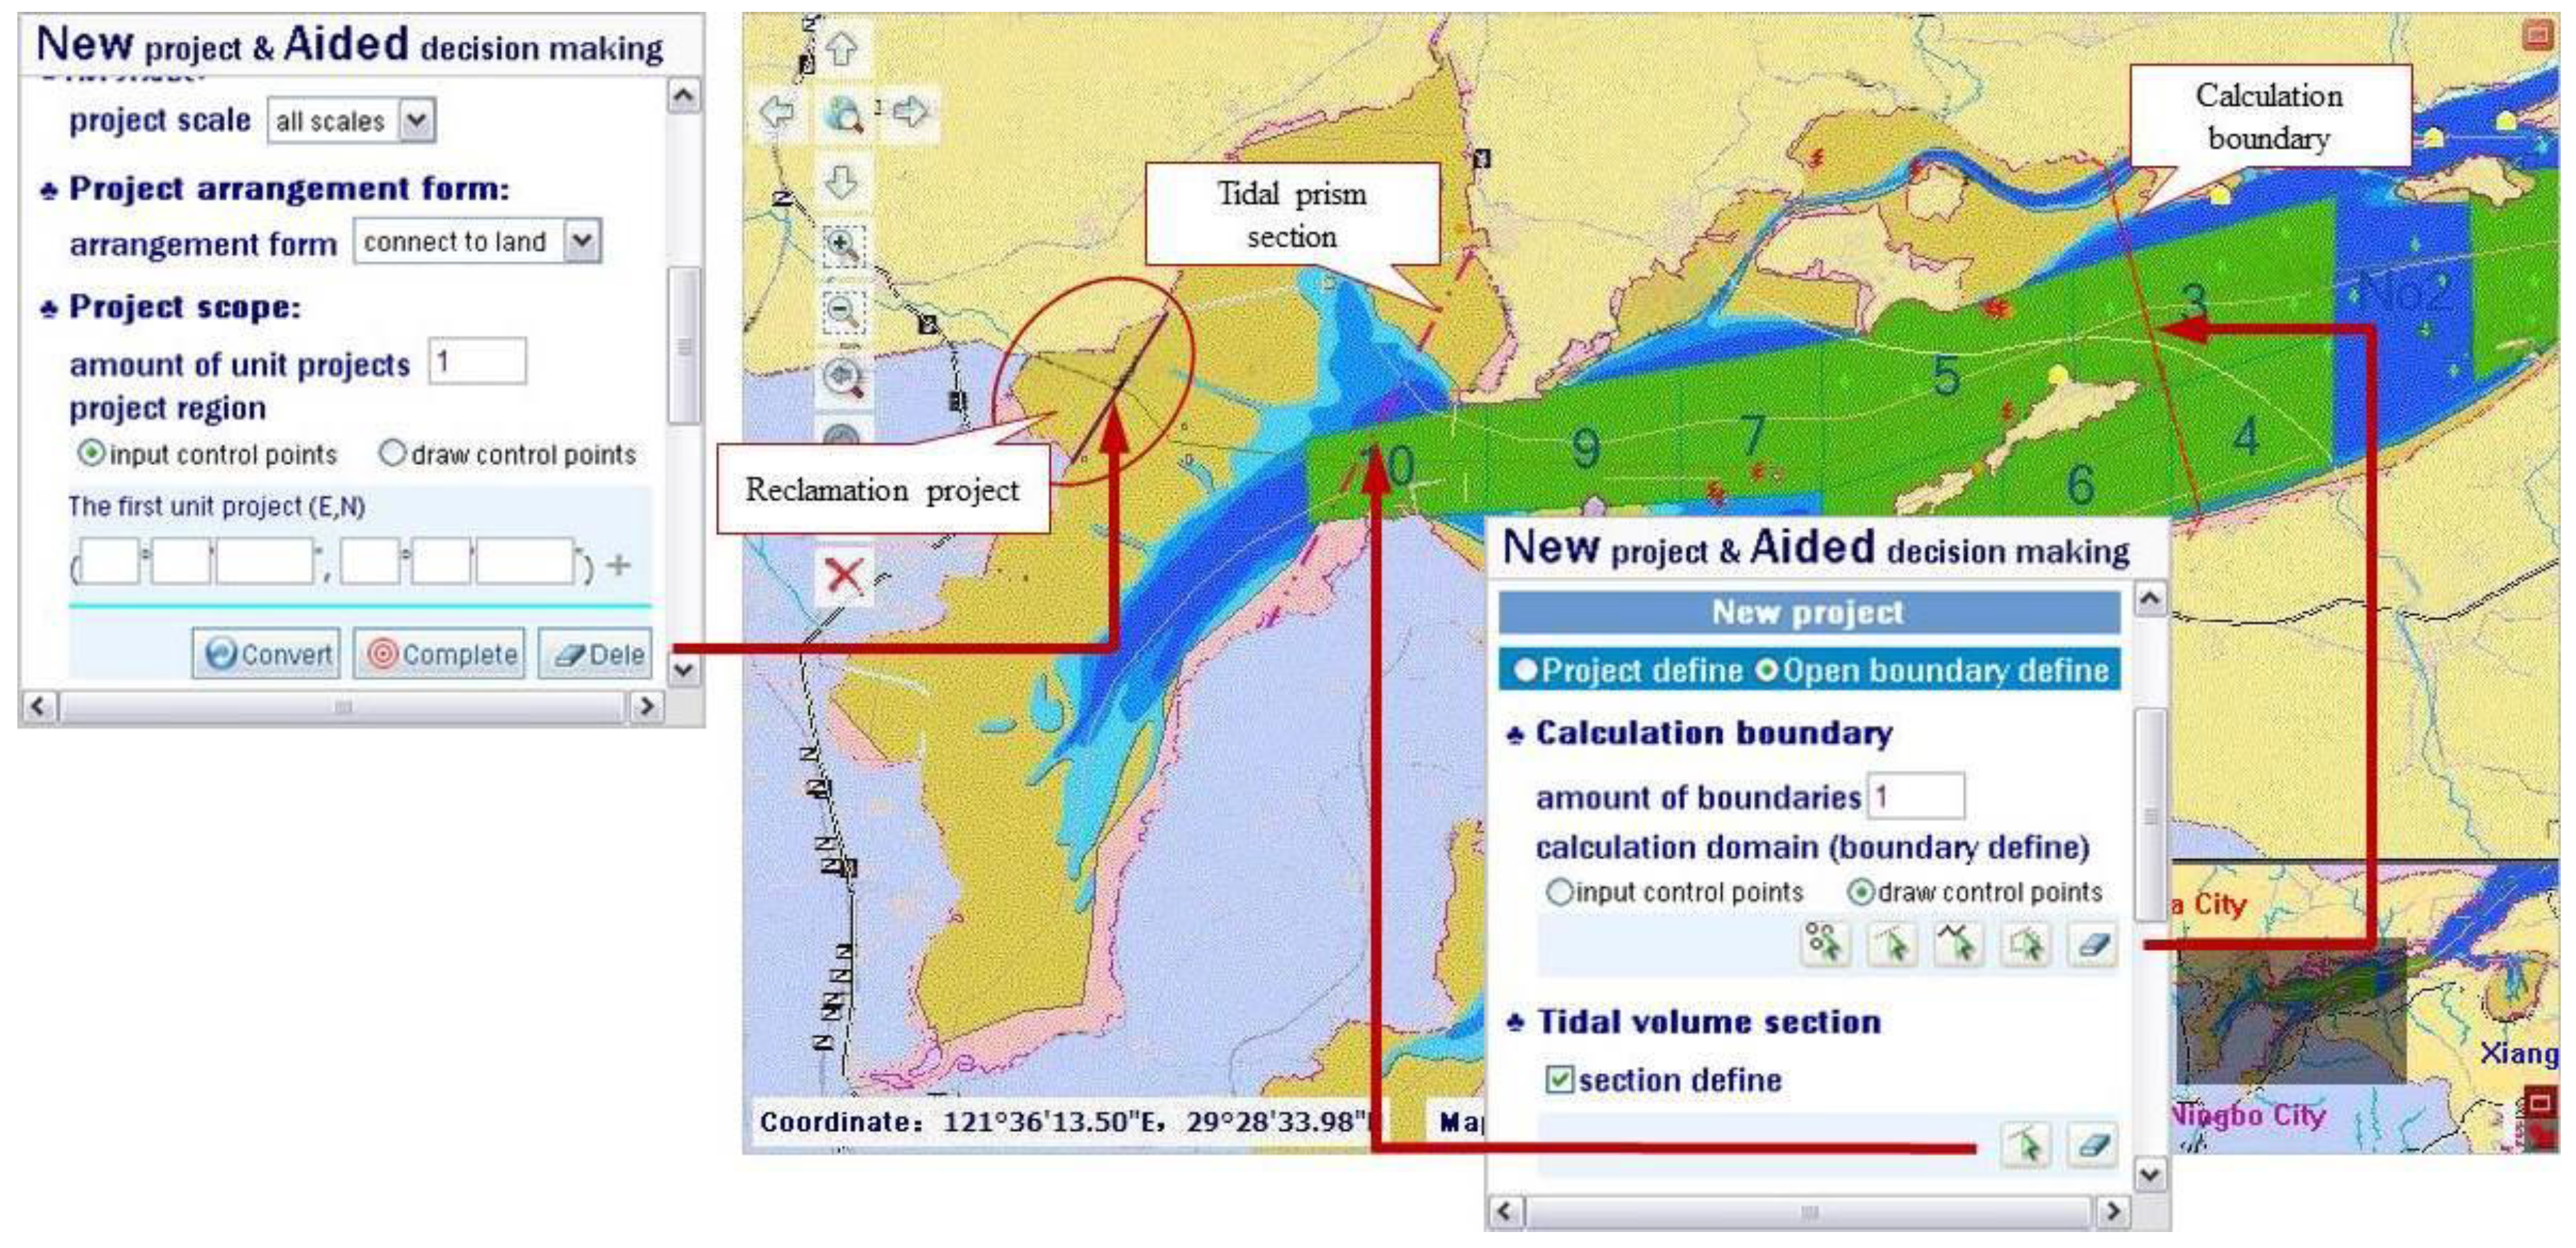
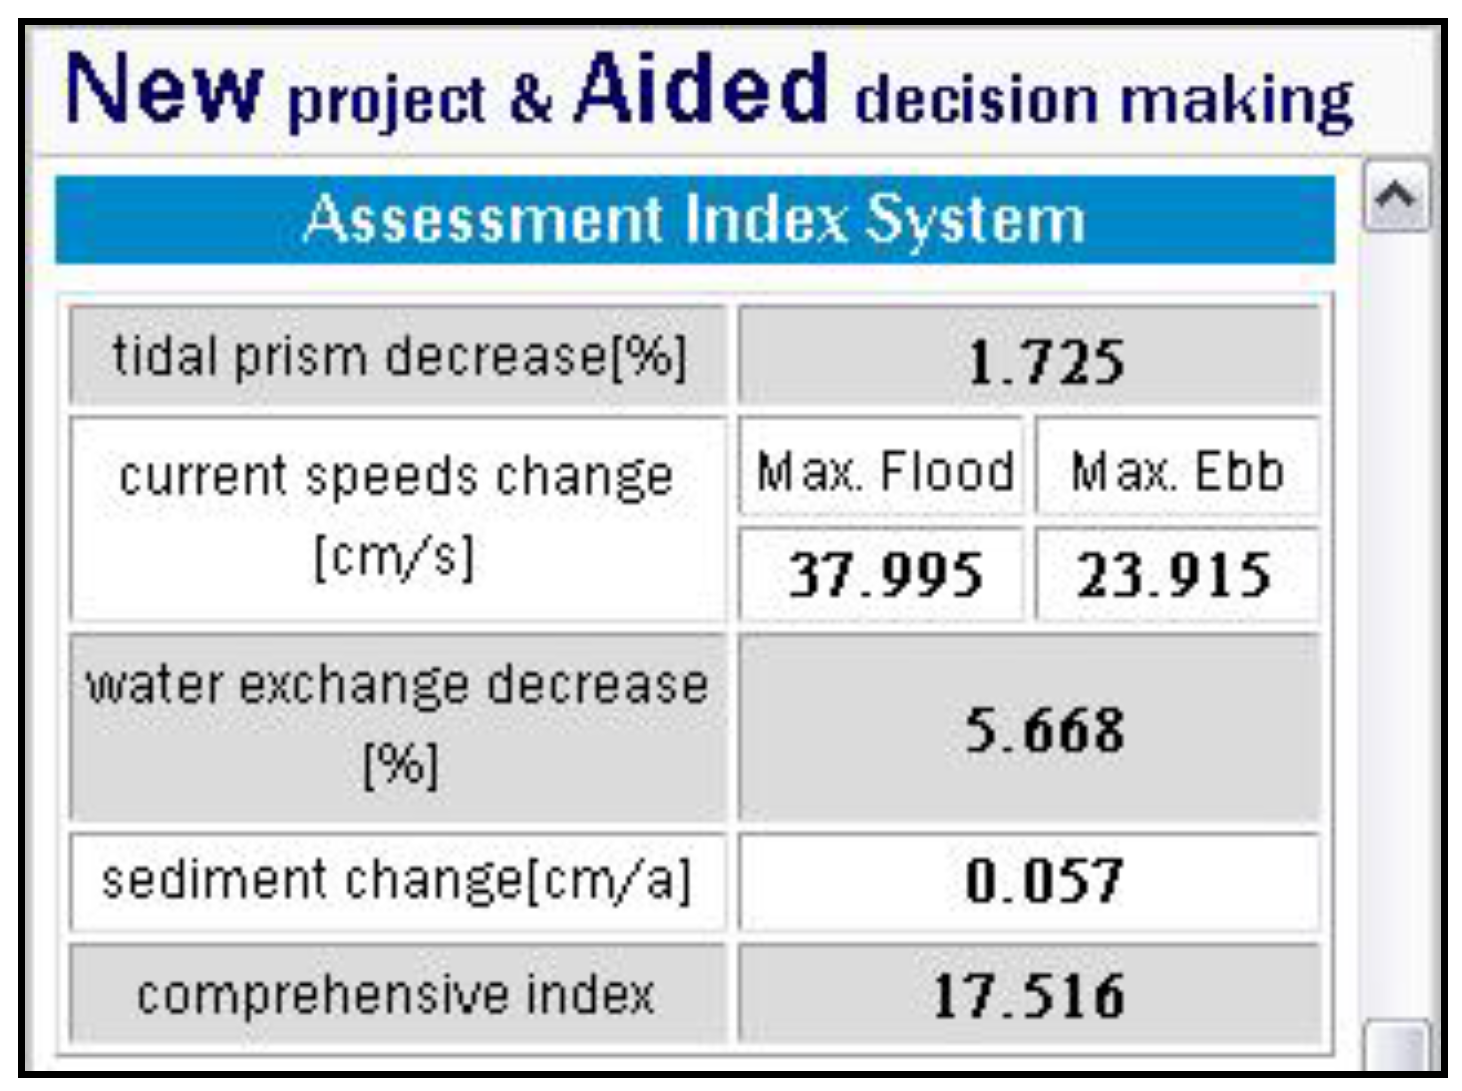
3.2. Reclamation Scenario

The planned reclamation project in the inner area of Xiangshan Bay is presented in Figure 7. The project construction will directly lead to some changes in regional hydrodynamics and the sediment environment. To assess these changes and make scientific decisions, the Ningbo-CSRU-DSS was employed by local coastal zone managers. As shown in Figure 7, users defined the project and related calculation parameters on the webpage. The project position can be inputted in the textboxes or drawn on the map. Other basic information, such as project amount, scale, and arrangement form, can be inputted or chosen from the drop-down menu. All this information is automatically abstracted and recorded in TXT files in the background. The simulation information was outputted on the webpage in detail. Once the simulation was complete, the environmental impact assessment was executed automatically. An overall evaluation was obtained, and the calculated results for the four hydrodynamic-sediment indexes and comprehensive index were outputted on the webpage (Figure 8). The tidal prism and water exchange rate decreased by 1.73% and 5.67%, respectively. The change in current speed was 38.00 and 23.92 cm/s at maximum flood tide and maximum ebb tide, respectively. The sediment exchange rate reached 0.06 cm/yr and the calculated comprehensive index was 17.52. Overall, there was a negative impact on hydrodynamic and sediment conditions according to Chinese National Standard GB/T 29726-2013. Figure 9 displays the course curves of tidal currents before and after project implementation at a position adjacent to the project defined by the users. There was an obvious influence on the tidal current at this position. The change in the coastal environment at any point could be obtained easily. There are alternative approaches to data processing and display; these are useful for users to evaluate the feasibility of a project and reach a final decision.

3.3. Land-Based Outlet Scenario

The building of a land-based outlet was proposed near the entrance of Huangdun Bay in Xiangshan Bay. The project parameters were defined on the webpage in detail (Figure 10). As shown, this outlet was located at the surface layer with a discharge rate of 10 m3/s. Three main contaminant parameters, chemical oxygen demand (COD), dissolved inorganic nitrogen (DIN), and dissolved inorganic phosphate (DIP), were considered. Their discharge concentration reached A standard in Chinese National Standard GB 8978-1996 (Integrated Wastewater Discharge Standard). All this project information was recorded in a TXT file to provide basic information for the subsequent automatic numerical simulation. These processes were executed in the background. Then, the automatic contaminant transport program was selected following page actions. Similar to the processes of the new coastline reconstruction project, the assessment module of seawater quality was executed automatically after the simulation ended. The calculated concentrations at red tide stations in Xiangshan Bay were abstracted from the simulation results. After comparing with the national standard, the calculated concentrations and assessment results at red tide stations were displayed on the webpage (Figure 11). As shown, the outlet reduced seawater quality to below the marine functional zoning seawater standard. The seawater quality at other positions could be obtained based on webpage actions. Multi-style expressions of the calculated results were implemented such as course curves of contaminant change and contour plots.

4. Conclusions and Future Work

This paper presented the design and implementation of a Web GIS-based CSRU-DSS. Compared with existing systems, this system is simple to use, and can provide active management and reliable decision support in the management of CSRU.
During system development, the geo-ontology approach was employed for the organization of spatial data. Well-structured spatial databases are established and provide map services. Automatic hydrodynamic-sediment and contaminant transport programs are developed and transplanted into the system. Therefore, dynamic modeling and simulation after a webpage-defined coastal project can be achieved. The entire computational process is performed automatically without manual intervention. To evaluate a project’s influence on the coastal environment, the assessment modules are invoked. Reliable decision-aided services are performed according to national standards and based on simulation results. The organization of modules is addressed using the workflow integration approach and the systematical functions are realized. The CSRU-DSS was applied to Ningbo Sea, China, where it plays an important role in the management of CSRU in this region. CSRU-DSS has been shown to be an innovative and practical decision-aided tool for CSRU management.
Functional improvements of CSRU-DSS are currently under development. In the future, other automatic coastal numerical programs will be incorporated into the system. An automatic ecological program capable of forecasting the influence of a new coastal project on ecological oceanic environments will also be integrated. Furthermore, a proxy service [24] will be invoked for online decision support and uncertainty analyses. In addition, comprehensive assessment models will be embedded in the system to provide a comprehensive evaluation of a coastal project’s influence. Therefore, future CSRU-DSSs will provide improved and more comprehensive services. The system is expected to be effective in long-term coastal management, with the potential to be adapted and applied to broader coastal zones.

Acknowledgments

The work described in this paper was substantially supported by grants from the State Ocean Administration People's Republic of China (grant Nos. 201105009 and 201405025) and the Foundation for Creative Research Groups of China (grant No. 51221961).

Author Contributions

All the authors contributed to the development of CSRU-DSS and this manuscript. Jing Xie, Shuxiu Liang, and Jiang Change designed and implemented CSRU-DSS and wrote the manuscript. Zhaochen Sun proposed the research and conceived the system framework. Jiawen Sun edited the manuscript.

Conflicts of Interest

The authors have no conflicts of interest to declare.

Abbreviations

BMBackground model
CRSUCoastal space resource utilization
CSRU-DSSCoastal space resource utilization decision support system
GISGeographic Information System
ICZMIntegrated coastal zone management
JSPJava Server Page

References

  1. Wang, J.G.; Su, F.Z.; Zhou, C.H.; Yang, X.M.; Du, Y.Y.; Chen, X.F. On effects of coastal location and management policy on landuse changes in coastal zone: A case study of Golden Coastal Region in Changli County. Geogr. Res. 2005, 24, 520–526. [Google Scholar]
  2. Deboudt, P.; Dauvin, J.; Lozachmeur, O. Recent developments in coastal zone management in France: The transition towards integrated coastal zone management (1973–2007). Ocean Coast. Manag. 2008, 51, 212–228. [Google Scholar] [CrossRef]
  3. Wheeler, P.; Peterson, J. Exploring stakeholder views regarding spatial information and enabling technology use for ICZM: A case study from Victoria, Australia. Coast. Manag. 2010, 38, 1–21. [Google Scholar] [CrossRef]
  4. Prem, M. Action plan for the implementation of the ICZM protocol for the Mediterranean. In Proceedings of the 10th International Conference on the Mediterranean Coastal Environment, Rhodes, Greece, 25–29 October 2011; pp. 81–91.
  5. Areizaga, J.; Sano, M.; Medina, R.; Juanes, J. A methodological approach to evaluate progress and public participation in ICZM: The case of the Cantabria Region, Spain. Ocean Coast. Manag. 2012, 59, 63–76. [Google Scholar] [CrossRef]
  6. Rochette, J.; Bille, R. ICZM protocols to regional seas conventions: What? Why? How? Mar. Policy 2012, 36, 977–984. [Google Scholar] [CrossRef]
  7. UNEP. Stockholm declaration on the human environment. In Proceedings of the United Nations Conference on the Human Environment, Stockholm, Sweden, 5–16 June 1972.
  8. Giordano, L.; Alberico, I.; Ferraro, L.; Marsella, E.; Lirer, F.; Di Fiore, V. A new tool to promote sustainability of coastal zones. The case of Sele plain, southern Italy. Rend. Lincei-Sci. Fis. E Nat. 2013, 24, 113–126. [Google Scholar] [CrossRef]
  9. Alkan, R.M.; Seker, D.Z.; Demirel, H.; Kalkan, Y.; Kabdasli, S. Designing an information system for supporting Integrated Coastal Zone Management (ICZM)—A case study. Fresenius Environ. Bull. 2006, 15, 829–834. [Google Scholar]
  10. Xiong, Y.Z.; Zhang, M.Y.; Xia, B.; Zhang, Z.D. Study on the construction of Guangdong coastal zone sustainable development decision support system. In Proceedings of the Geoinformatics 2008 and Joint Conference on GIS and Built Environment: Monitoring and Assessment of Natural Resources and Environments, Guangzhou, China, 28–29 June 2008.
  11. Rodríguez, I.; Montoya, I.; Sánchez, M.J.; Carreño, F. Geographic information systems applied to integrated coastal zone management. Geomorphology 2009, 107, 100–105. [Google Scholar] [CrossRef]
  12. Porter, D.E.; Small, T.; White, D.; Fletcher, M.; Norman, A.; Swain, D.; Friedmann, J. Data management in support of environmental monitoring, research, and coastal management. J. Coast. Res. 2004, 45, 9–16. [Google Scholar] [CrossRef]
  13. Du, Y.Y.; Wang, J.G.; Wang, Z.Y.; Yang, X.M. Construction and implementation of multisource spatial data management system of China’s coastal zone and offshore. Acta Oceanol. Sin. 2004, 23, 97–108. [Google Scholar]
  14. Barrerra, C.; Rueda, M.J.; Llinas, O.; Azevedo, E.B.; Gelodo, M.D. Real-time monitoring network in the Macaronesian region as a contribution to the Coastal Ocean Observations Panel (COOP). J. Oper. Oceanogr. 2008, 1, 59–69. [Google Scholar] [CrossRef]
  15. Copeland, G.; Thiam-Yew, W. Current data assimilation modelling for oil spill contingency planning. Environ. Model. Softw. 2006, 21, 142–155. [Google Scholar] [CrossRef]
  16. Yang, J. The Research on the Coastal Zone Disaster and the Prevention and Reduction System of the Disaster in Quanzhou; Southwest University: Chongqing, China, 2007. (In Chinese) [Google Scholar]
  17. Riolo, F. A geographic information system for fisheries management in American Samoa. Environ. Model. Softw. 2006, 21, 1025–1041. [Google Scholar] [CrossRef]
  18. Yan, Y.R.; Wang, F.; Guo, X.Y.; Feng, B.; Lu, H.S. Research and development of South China Sea fisheries information dynamic collection and realtime automatic analysis system based on GPS, GIS and RS integration. J. Fish. China 2014, 38, 748–758. (In Chinese) [Google Scholar]
  19. Su, F.; Du, Y.Y.; Pei, X.; Yang, X.M.; Zhou, C.H. Constructing digital sea of china with the datum of coastal line. Geo-Inf. Sci. 2006, 8, 12–15. (In Chinese) [Google Scholar]
  20. Zhu, Y.L. Design and Development of ChongMing Dongtan Coastal Ecosystem Managing Platform; East China Normal University: Shanghai, China, 2011. (In Chinese) [Google Scholar]
  21. Merrifield, M.S.; Mcclintock, W.; Burt, C.; Fox, E.; Serpa, P.; Steinback, C.; Gleason, M. MarineMap: A web-based platform for collaborative marine protected area planning. Ocean Coast. Manag. 2013, 74, 67–76. [Google Scholar] [CrossRef]
  22. Gourmelon, F.; Le Guyader, D.; Fontenelle, G. A dynamic GIS as an efficient tool for integrated coastal zone management. ISPRS Int. J. Geo-Inf. 2014, 3, 391–407. [Google Scholar] [CrossRef] [Green Version]
  23. Liang, S.X.; Xie, J.; Sun, Z.C.; Lu, Y.P.; Liu, G.S.; Xiong, W. Development of a regional coastal management decision-aided system. Part A: Establishment of an automatic numerical simulation program. Ocean Coast. Manag. 2014, 96, 173–180. [Google Scholar] [CrossRef]
  24. Sun, A.Y.; Miranda, R.M.; Xu, X. Development of multi-metamodels to support surface water quality management and decision making. Environ. Earth Sci. 2015, 73, 423–434. [Google Scholar] [CrossRef]
Figure 1. Functional modules of the CSRU-DSS.
Ijgi 05 00140 g001
Figure 2. CSRU-DSS structure map.
Ijgi 05 00140 g002
Figure 3. Physical storage structure of the coastal-zone spatial database.
Ijgi 05 00140 g003
Figure 4. Automatic hydrodynamic-sediment program workflow.
Ijgi 05 00140 g004
Figure 5. Map of Ningbo Sea and its adjacent areas.
Ijgi 05 00140 g005
Figure 6. Main webpage of Ningbo-CSRU-DSS on a browser.
Ijgi 05 00140 g006
Figure 7. The new reclamation project defined on part of the webpage.
Ijgi 05 00140 g007
Figure 8. Coastal environmental impact assessment results displayed on the webpage.
Ijgi 05 00140 g008
Figure 9. Tidal current course curves before and after the project at a specified point on the webpage. The tidal fields before and after the project are displayed. The flow vector before project implementation is in red, and the one after project implementation is in blue.
Ijgi 05 00140 g009
Figure 10. The new land-based outlet defined on part of the webpage.
Ijgi 05 00140 g010
Figure 11. Seawater-quality impact assessment results displayed on the webpage.
Ijgi 05 00140 g011

