Article

Use of Social Media for the Detection and Analysis of Infectious Diseases in China

1
Department of Geography, Kent State University, Kent, OH 44240, USA
2
School of Information Engineering, China University of Geosciences, Wuhan 430074, China
3
Department of Geography and Geology, Eastern Michigan University, Ypsilanti, MI 48197, USA
4
School of Economics, Jinan University, Guangzhou 510632, China
*
Author to whom correspondence should be addressed.
ISPRS Int. J. Geo-Inf. 2016, 5(9), 156; https://0-doi-org.brum.beds.ac.uk/10.3390/ijgi5090156
Submission received: 6 February 2016 / Revised: 15 August 2016 / Accepted: 19 August 2016 / Published: 30 August 2016

Abstract

:
Social media activity has become an important component of daily life for many people. Messages from Twitter (US) and Weibo (China) have shown their potential as important data sources for detecting and analyzing infectious diseases. Such emerging and dynamic new data sources allow us to predict how infectious diseases develop and evolve both spatially and temporally. We report the dynamics of dengue fever in China using messages from Weibo. We first extract and construct a list of keywords related to dengue fever in order to analyze how frequently these words appear in Weibo messages based on the Latent Dirichlet Allocation (LDA). Spatial analysis is then applied to detect how dengue fever cases cluster spatially and spread over time.

1. Introduction

Since 2013, 2.35 million cases of dengue fever have been reported in the Americas, and 37,687 of these dengue fever cases were considered to be severe [1]. Identifying the geographical ranges helps the public understand the risk posed by infectious disease outbreaks [2]. Early detection of disease activity, followed by a rapid response, can largely reduce the impact of both seasonal and pandemic influenza [3]. Social media analytics enable the possibility of infectious disease surveillance at a fine scale and in a timely manner [2]. Progress in the areas of geospatial analytics has led to increased intelligence in investigating the outbreak, transmission, and treatment of diseases at both local and global scales. Furthermore, geospatial services and sensor apps affect people’s daily behavior and lifestyle [4].
The geographical context of health research has shifted from a data-scarce to a data-rich environment [5]. Social media websites such as Twitter (US) and Weibo (China) serve as platforms for both sharing and communicating information. The widespread application of mobile smart devices has facilitated social media usage because most micro-blog users update information in their social media using mobile devices. Social media messages contain new ideas and report events in real time [6]. The large spatiotemporal data in Weibo represents a goldmine to understand and model various social phenomena across spaces. For example, a web-enabled Geo-Twitter analytics system can be used to conduct crisis management based on place, time, and concept [7]. Based on the location of the tweets, obesity patterns have been mapped in a GIS environment [8]. Social media can also be used to assess the effects of natural disasters, such as post-earthquake microblogging [9] and real-time earthquake detection [10].
Scholars have begun to analyze the relationship between social media and public health [2]. Geo-tagged tweets are used to explore the prevalence of healthy and unhealthy food consumption across the contiguous United State based on sentiment analysis [11]. Tweets have also been used to study the individual food environment and its impact on food choices [12]. Twitter has been explored as a method for informing, debating and influencing opinions in health policy [13]. However, it has been noted that we have very poor knowledge of the global distribution of most infectious diseases [2]. The records of disease occurrence have usually been obtained from the literature [14], web reports [15], and GenBank [16]. These efforts aim to define the extent of the disease and to populate a database of the reported disease [17]. For example, a comprehensive database of confirmed human dengue infections has been manually built, including 8309 georeferenced occurrences [18]. Nevertheless, it is difficult to track the trends in infectious diseases and their distribution in real time using these databases.
Internet-based surveillance systems and search engines provide a novel approach to monitoring public health issues [3,19]. In particular, social media are timely and versatile. In addition, social media entries are self-reported and volunteered compared to the official data. For example, Twitter can be used to track and predict the emergence and spread of an influenza epidemic [20]. In fact, the early detection of epidemics is possible based on the data mining of Twitter messages [21]. For instance, FluMapper presents the integrated results from an interactive exploration of the spatial distribution of flu risk and dynamic mapping of movement patterns across multiple spatial and temporal scales [22]. Messages from Weibo have also shown their potential for predicting how infectious diseases occur and spread [23].
In this paper, we analyze an outbreak of dengue fever in China that occurred in 2014 through integrating the social media analytics and GIS methods. This research will contribute to the literature regarding infectious disease detection and prediction. There are two research objectives in this paper:
  • To explore the spatiotemporal relationship between the evolution of dengue fever and related Weibo posts; and
  • To model the spread of the dengue fever in space and time.
The methods used for data acquisition and topic extraction are introduced in the following section. Both temporal and spatial trends of Weibo messages are presented. Then, we explore the relationship between social media and disease outbreaks based on the detection of the 2014 dengue outbreak. Finally, a summary is provided, as well as descriptions of the limitations of this study and the future work that should be undertaken.

2. Data Collection and Methods

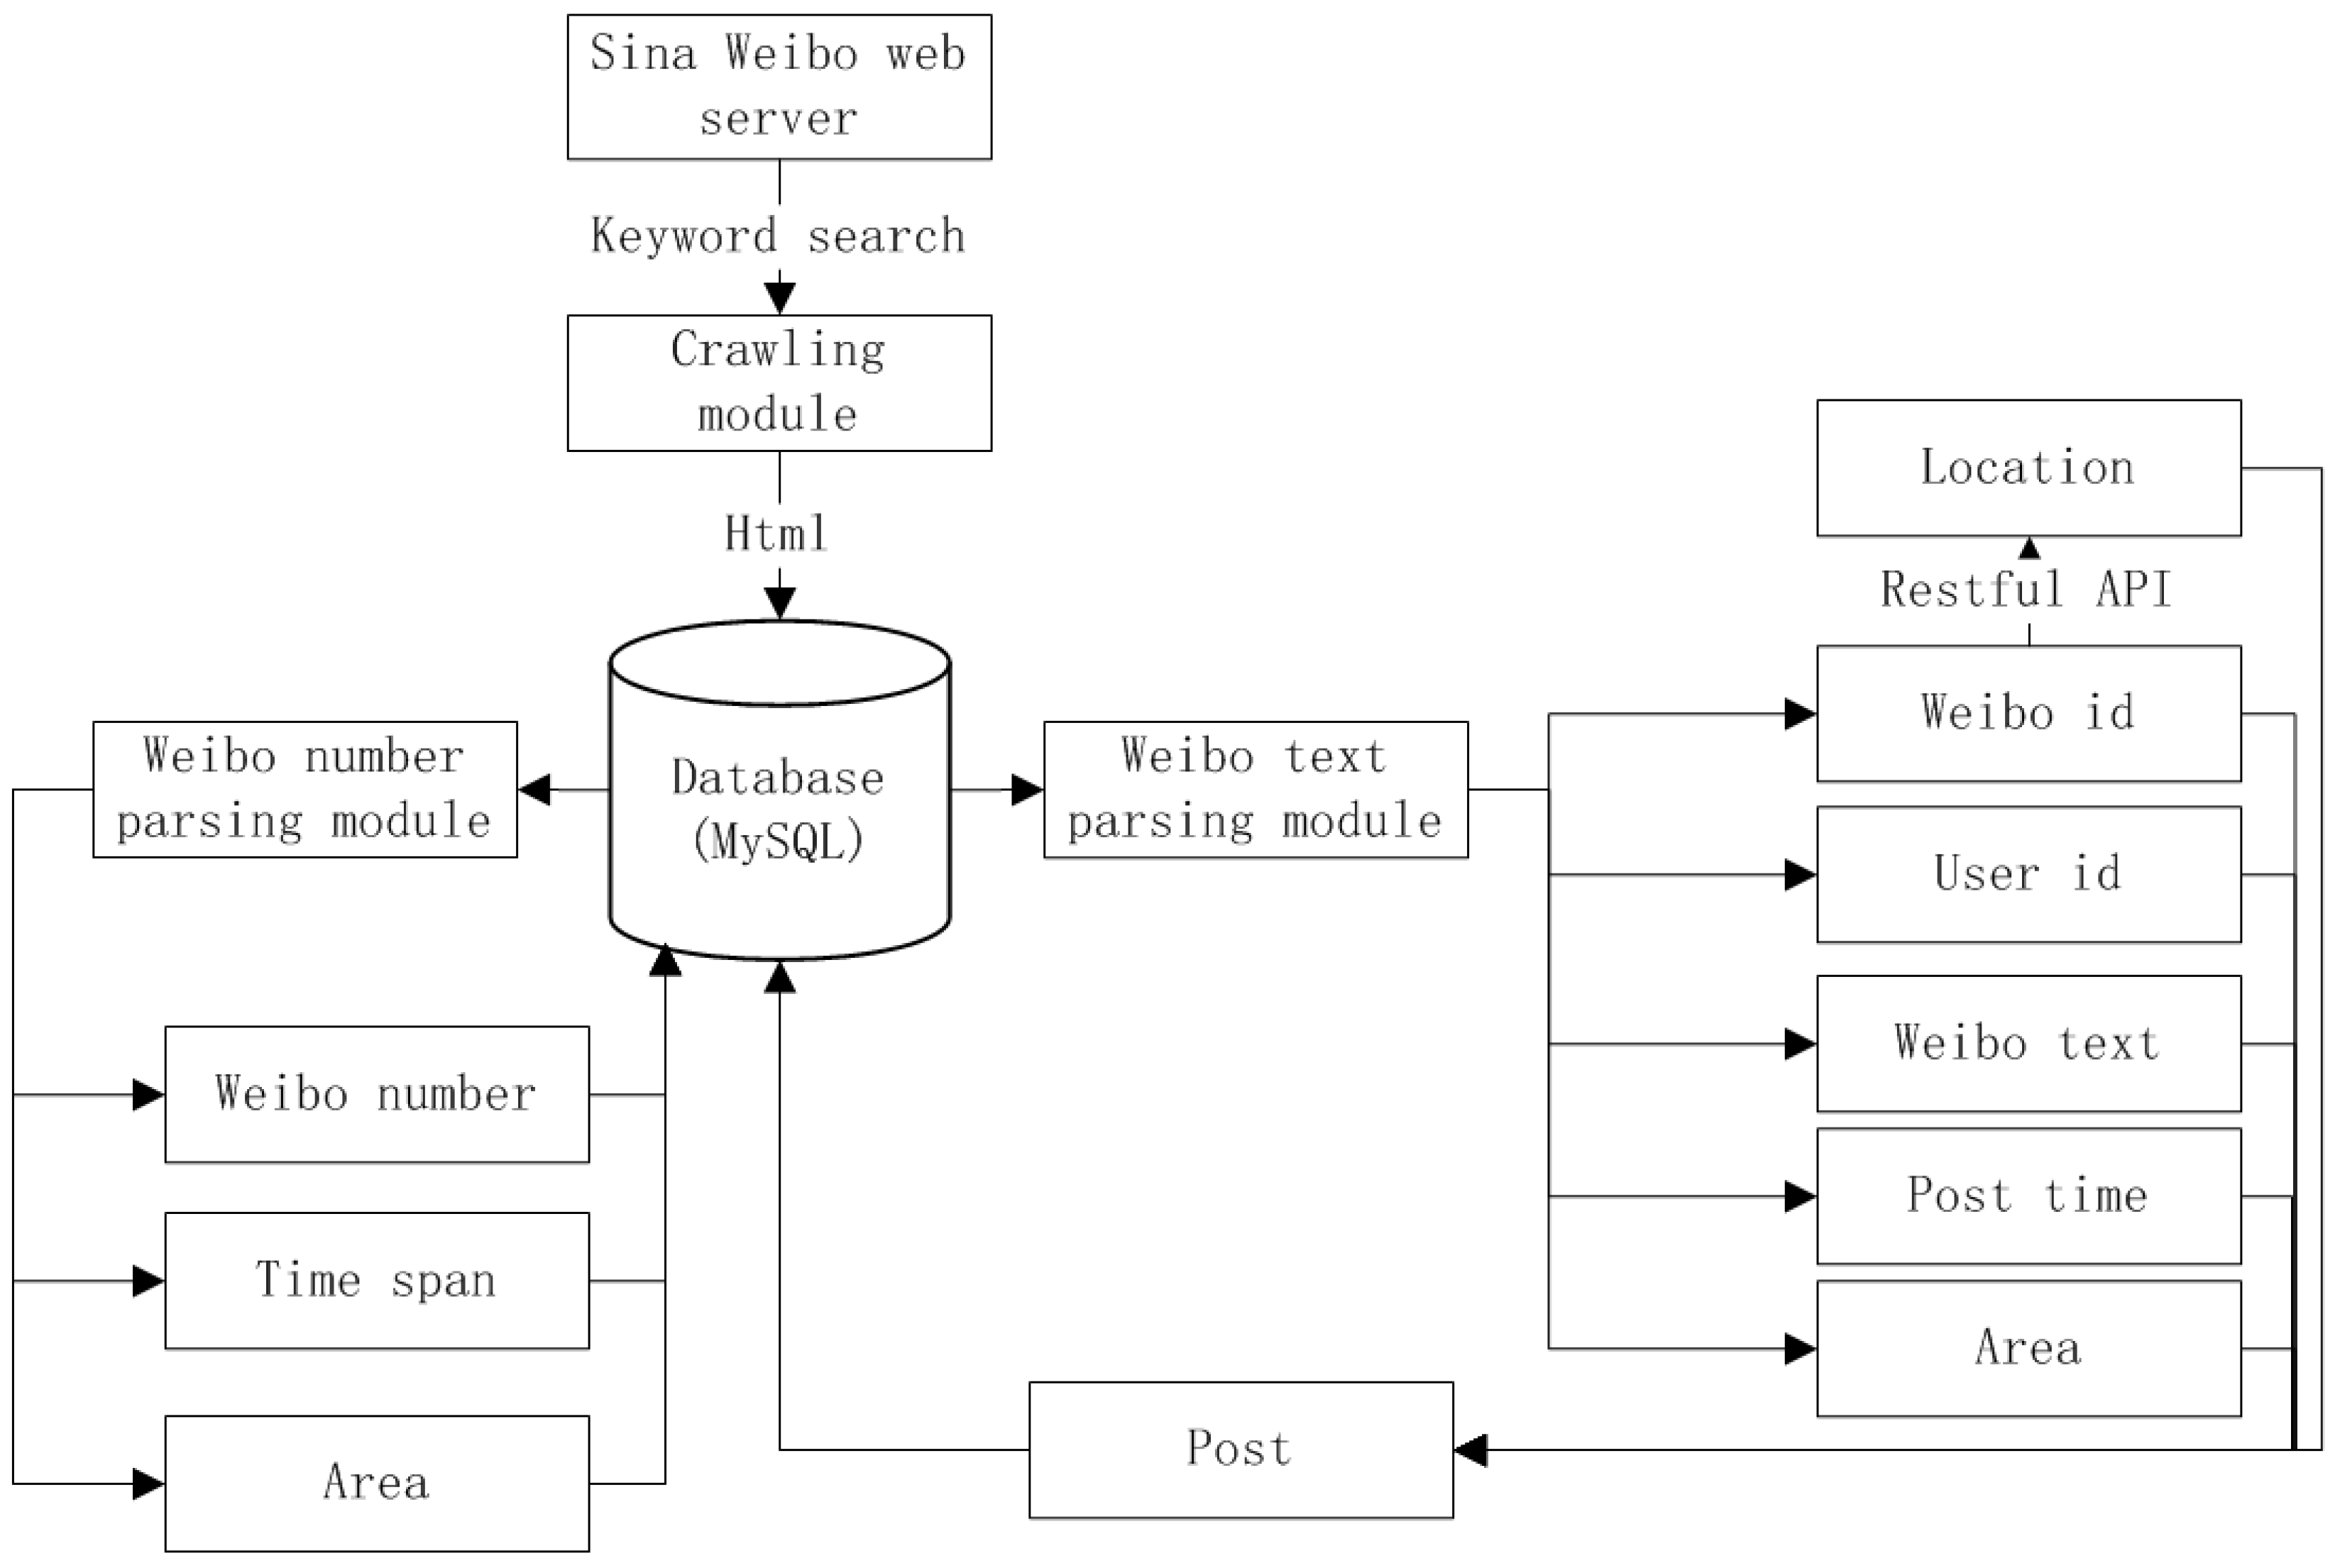
2.1. Data Collection

Weibo is a microblogging website with the largest user group in China, and it is regarded as an equivalent version of Twitter in the USA. By December 2013, the number of monthly active users had reached 129.1 million, with 61.4 recorded daily active users. Users sent more than 2.8 billion posts in December 2013. Weibo provides a series of API (application programming interface) for developers, which is very similar to the Twitter stream API. Because only a small portion of data can be collected through the official API provided by Weibo, it has caused a challenge with regard to data limitation. Hence, a web crawler has been developed to collect data from Weibo to obtain a more complete dataset, along with the official API (Figure 1).
The developed web crawler functions in the following manner: First, Weibo provides several search pages to inquire about posts based on the post content, location, timing, and user id. The pages return the number of records (up to 1000 posts) that meet the search criteria. With the crawler, posts can be collected based on keywords, timing, and location.
In addition, because the Weibo API does not provide an interface to obtain Weibo text based on specified keywords, we used the crawler to send the request to the Weibo servers for data acquisition. The items extracted included the Weibo ID, text, post time, user ID, and location information. The posts only contained the place name, instead of the actual geographical coordinates in latitude and longitude. The traditional method used to obtain more detailed data was to convert place names to coordinates by geocoding. Due to the ambiguity and typographical errors made in many place names, we were unable to obtain coordinates in many cases. Thus, we used a Weibo API to send a request to the Weibo servers with the Weibo ID in order to retrieve the actual location of the Weibo post. Then, a post can be described as a six-tuple Weibo entry (weiboid, text, post-time, userid, area, and location).
Our data collection provided us with two different datasets across spatial scales covering Guangdong province, as well as the entirety of China for later analysis. To be conservative, we used “dengue” as the only search keyword for crawling. Because the original posts in social media more accurately reflect the social dynamics [24], we extracted 23,144 original Weibo posts as Dataset 1 based on the keyword “dengue” (“登革热” in Chinese) from 1 June 2014 to 28 October 2014 in Guangdong province, China.
The area and location attributes were used to describe the geographic location of posts. However, due to privacy protection and device limitations, the locations of most posts were not disclosed. As Figure 2 shows, there were only 1910 georeferenced “dengue”-related posts collected as Dataset 2 in Guangdong province. The location used in our search condition is the place where the posts were sent rather than the location illustrated by the user profiles. According to our observations, the Chinese character “de” (“的” in Chinese) was uniformly distributed in our collected sample posts with an appearance rate of 46.4%. In order to observe the trends in dengue fever in a larger area and a wider time period, another dataset (Dataset 3) was collected by the crawler for posts made from 1 June 2014 to 2 November 2014. Every record in the dataset contained the number of posts including “de”, the number of posts related to the “dengue” keyword, the time stamp (in terms of the day), and the location (province) where the post was sent. To estimate the trends in one day, the posts related to “dengue” (Dataset 4) were collected by hour in Guangdong province for 22 September 2014. We also collected the data about officially-reported new dengue cases (Dataset 5) in Guangdong province on 22 September 2014 (Table 1).

2.2. Topics in Posts

Latent Dirichlet allocation (LDA) [25] is a generative probabilistic model of a corpus. The basic idea is that documents are represented as random mixtures over latent topics, where each topic is characterized by a distribution over words. It has been used to recommend tags for resources [26] and to assign the annotation of large satellite images [27]. This paper used a LDA model to mine the relevant topics and to explore the contents related to public health. A topic contains a series of words and the associated probabilities belonging to that topic. A LDA model also generates a topic distribution for every document.
We first extracted posts from the database and saved each post as a document. LDA was implemented in Java using Gibbs sampling [28]. The dimensionality (k) of the Dirichlet distribution (and the dimensionality of the topic variable n) was assumed to be known and fixed. The word probabilities were parameterized by α and β, where α was the parameter of the Dirichlet prior to the per-document topic distributions and β was the parameter of the Dirichlet prior to the per-topic word distribution. Given the nature of our study being related to “dengue”, the number of topics was usually less than 10. In order to extract all the possible topics at the initial stage, in this experiment we set k, the number of topics to extract, as 20. We used symmetrical Dirichlet priors in the LDA estimation as α = 50/K and β = 0.01, which are common settings suggested in many publications.
We then examined the extracted 20 topics and merged similar topics. Finally, the topics were classified into five categories, which were “prevention”, “detection”, “fear”, “symptoms”, and “care”. Topics and words with probabilities for each topic are shown in Table 2.
With the five generic topics derived using the LDA, we categorized each Weibo post related to “dengue” into a certain topic. In LDA, each document was treated as a distribution of various topics. We classified documents using the maximum probability topic based on a trained LDA model. As shown in Table 3, most public concerns were related to the prevention and detection of dengue.

2.3. Kalman Filter

There are biases and flaws in social media data [29], which are due to unexpected events or other external factors, such as media reports. The event of a dengue outbreak should also take the impact of daily work, as well as life and the incubation period of the disease into consideration. To account for such factors and prepare for further detection of dengue fever, we attempted to reduce the impact of this ‘noise’.
Digital filtering is a technique that performs mathematical operations on sampled data to reduce or enhance certain aspects of the data in order to produce estimates that tend to be more precise. Kalman filtering, also known as linear quadratic estimation (LQE), is an algorithm to estimate the state of a dynamic system given that the variance is known. Kalman filtering is widely used in many fields such as communication, navigation, guidance. and control.
Kalman filtering can be illustrated using a linear stochastic difference equation as follows [30]:
X(k) = A × X(k − 1) + B × U(k) + W(k)
With a systematic measurement value as follows:
Z(k) = H × X(k) + V(k)
In the formula, X(k) is the system state at timestamp k, while U(k) is the control amount towards the system at timestamp k. A and B are system parameters as a matrix in the multi-model system. Z(k) is the measured amount for timestamp k. H, as another matrix in the multi-measure system, is a parameter in the measurement system. W(k) and V(k) are types of noise within the process and measurement, respectively, under the assumption of white Gaussian noise.

3. Spatial Analysis of Dengue Fever

The Chinese Center for Disease Control and Prevention publishes monthly disease reports [31]. The report showed that there were 14,759 cases of dengue fever in September 2014 in China. According to the Guangdong Health Department report, there were 9282 new cases of dengue fever from 22 September 2014 to 31 September 2014. Guangdong province was most impacted by the dengue fever outbreaks in 2014. Hence, Guangdong province was chosen as the representative area in our study.

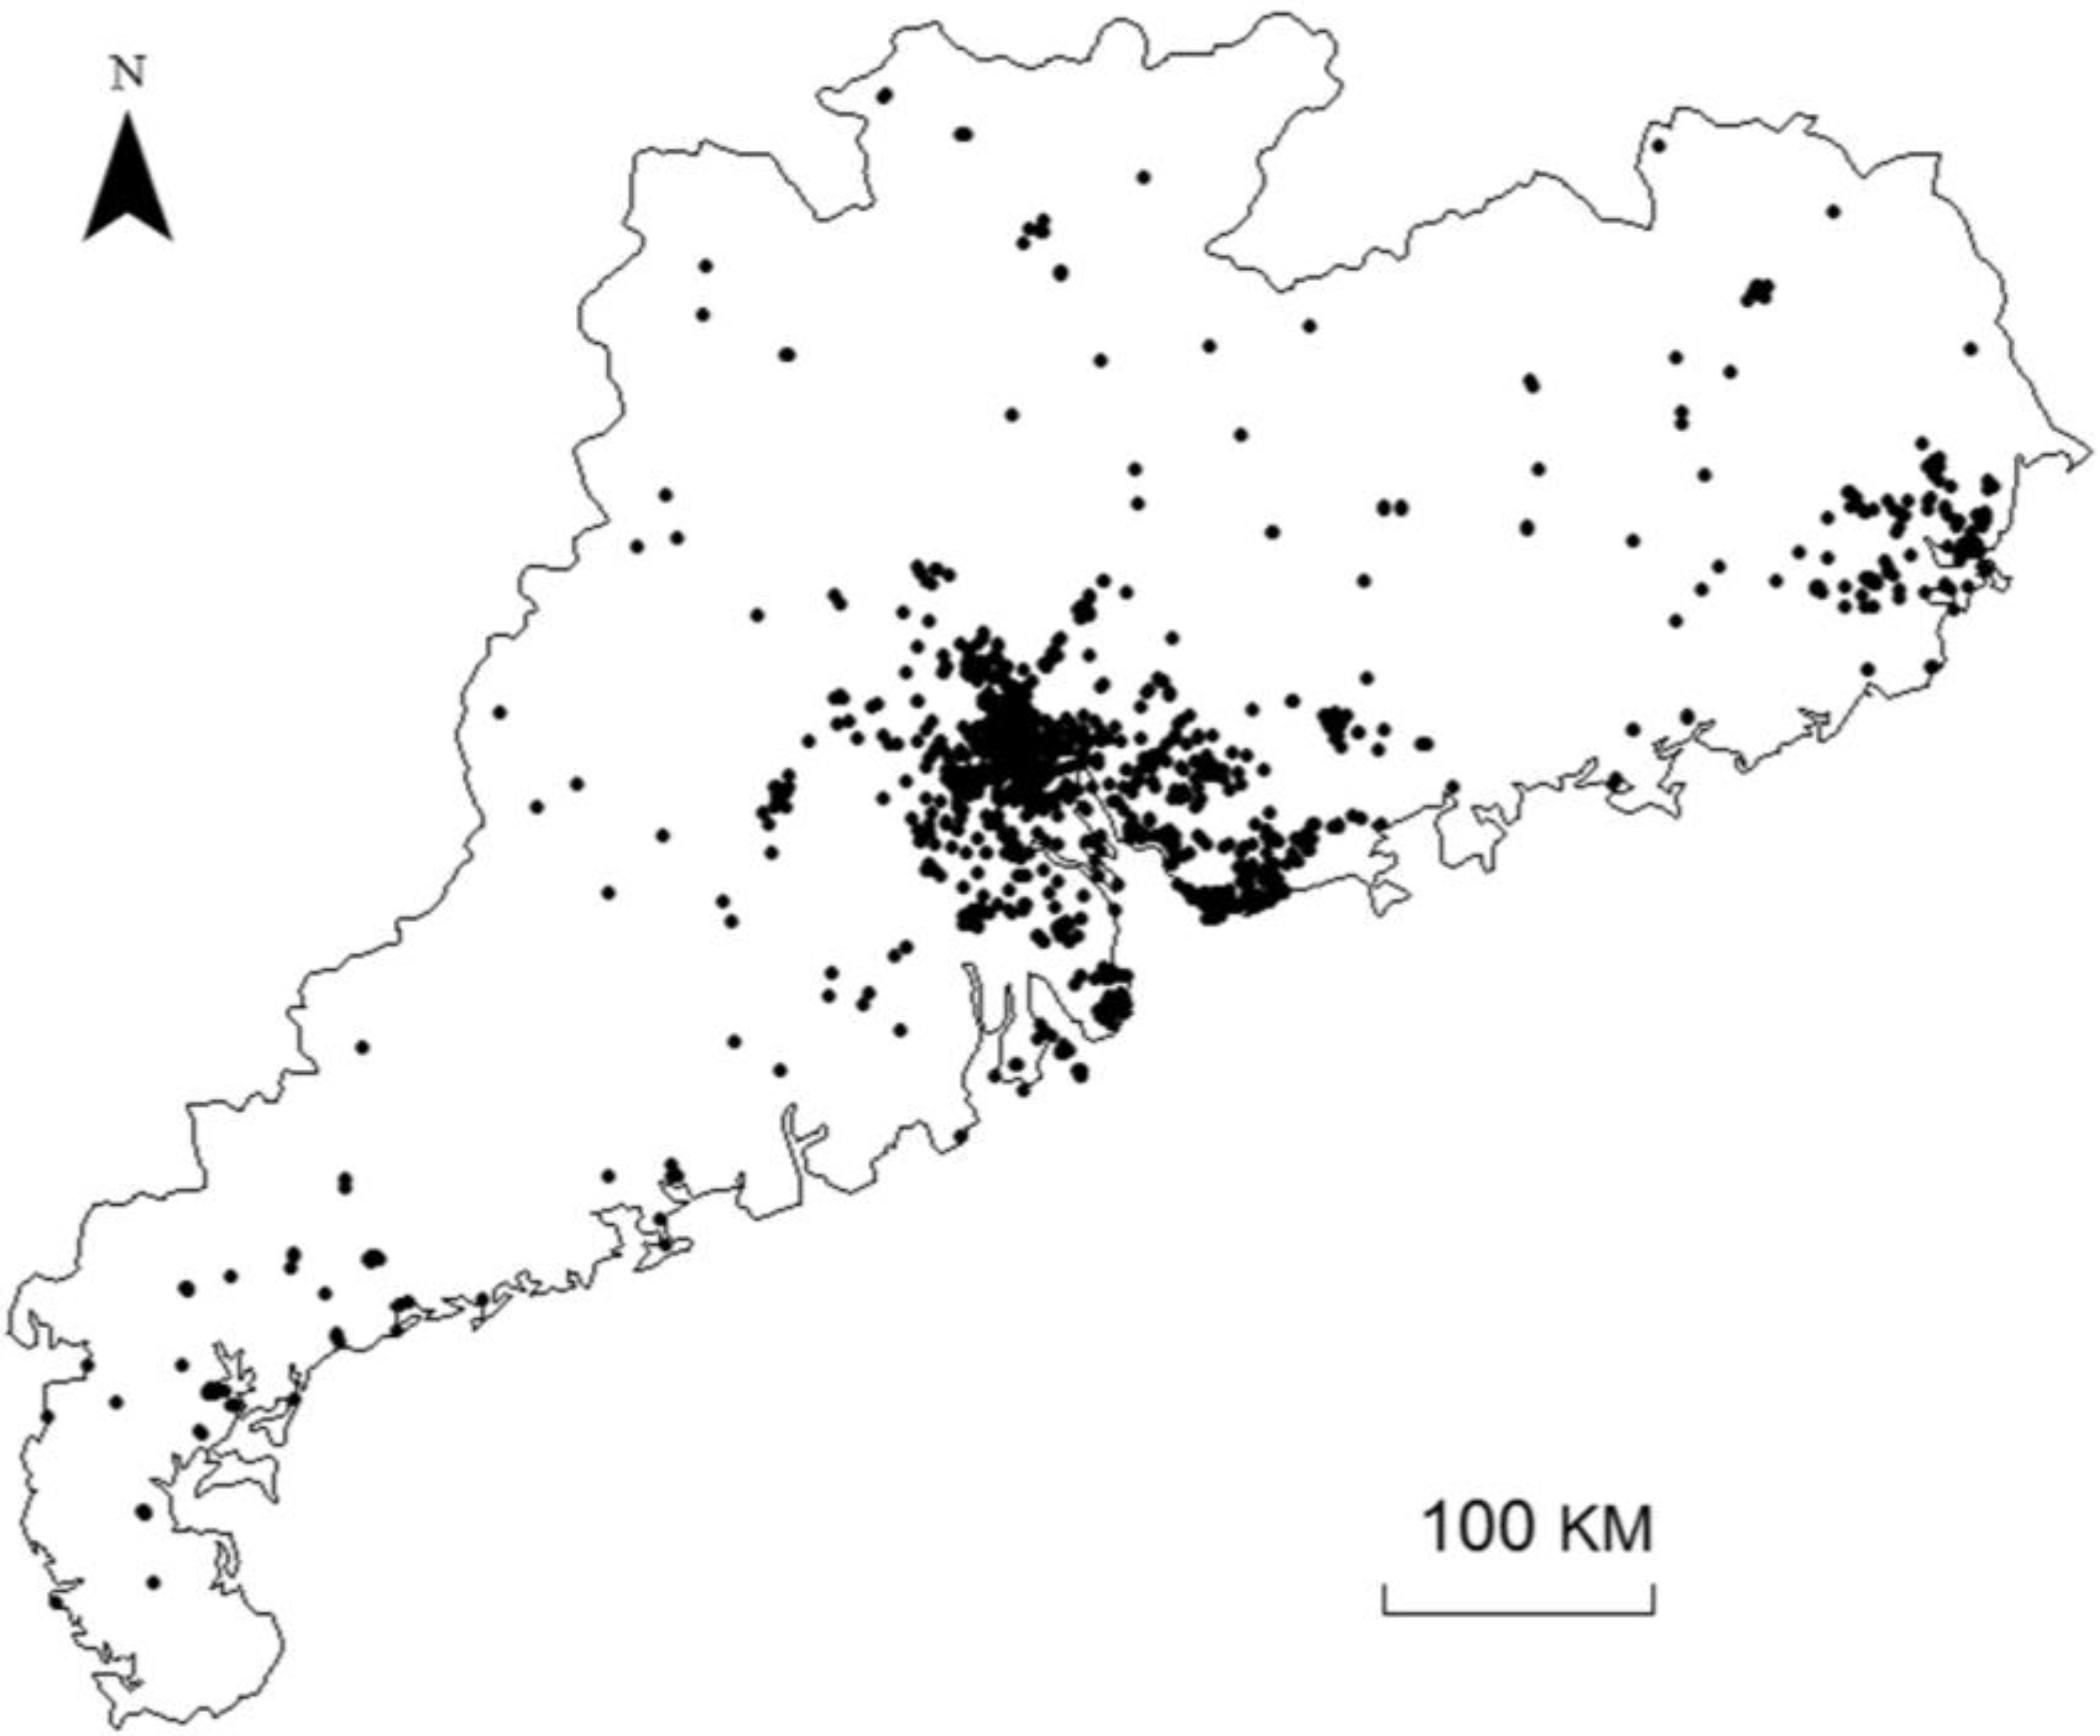
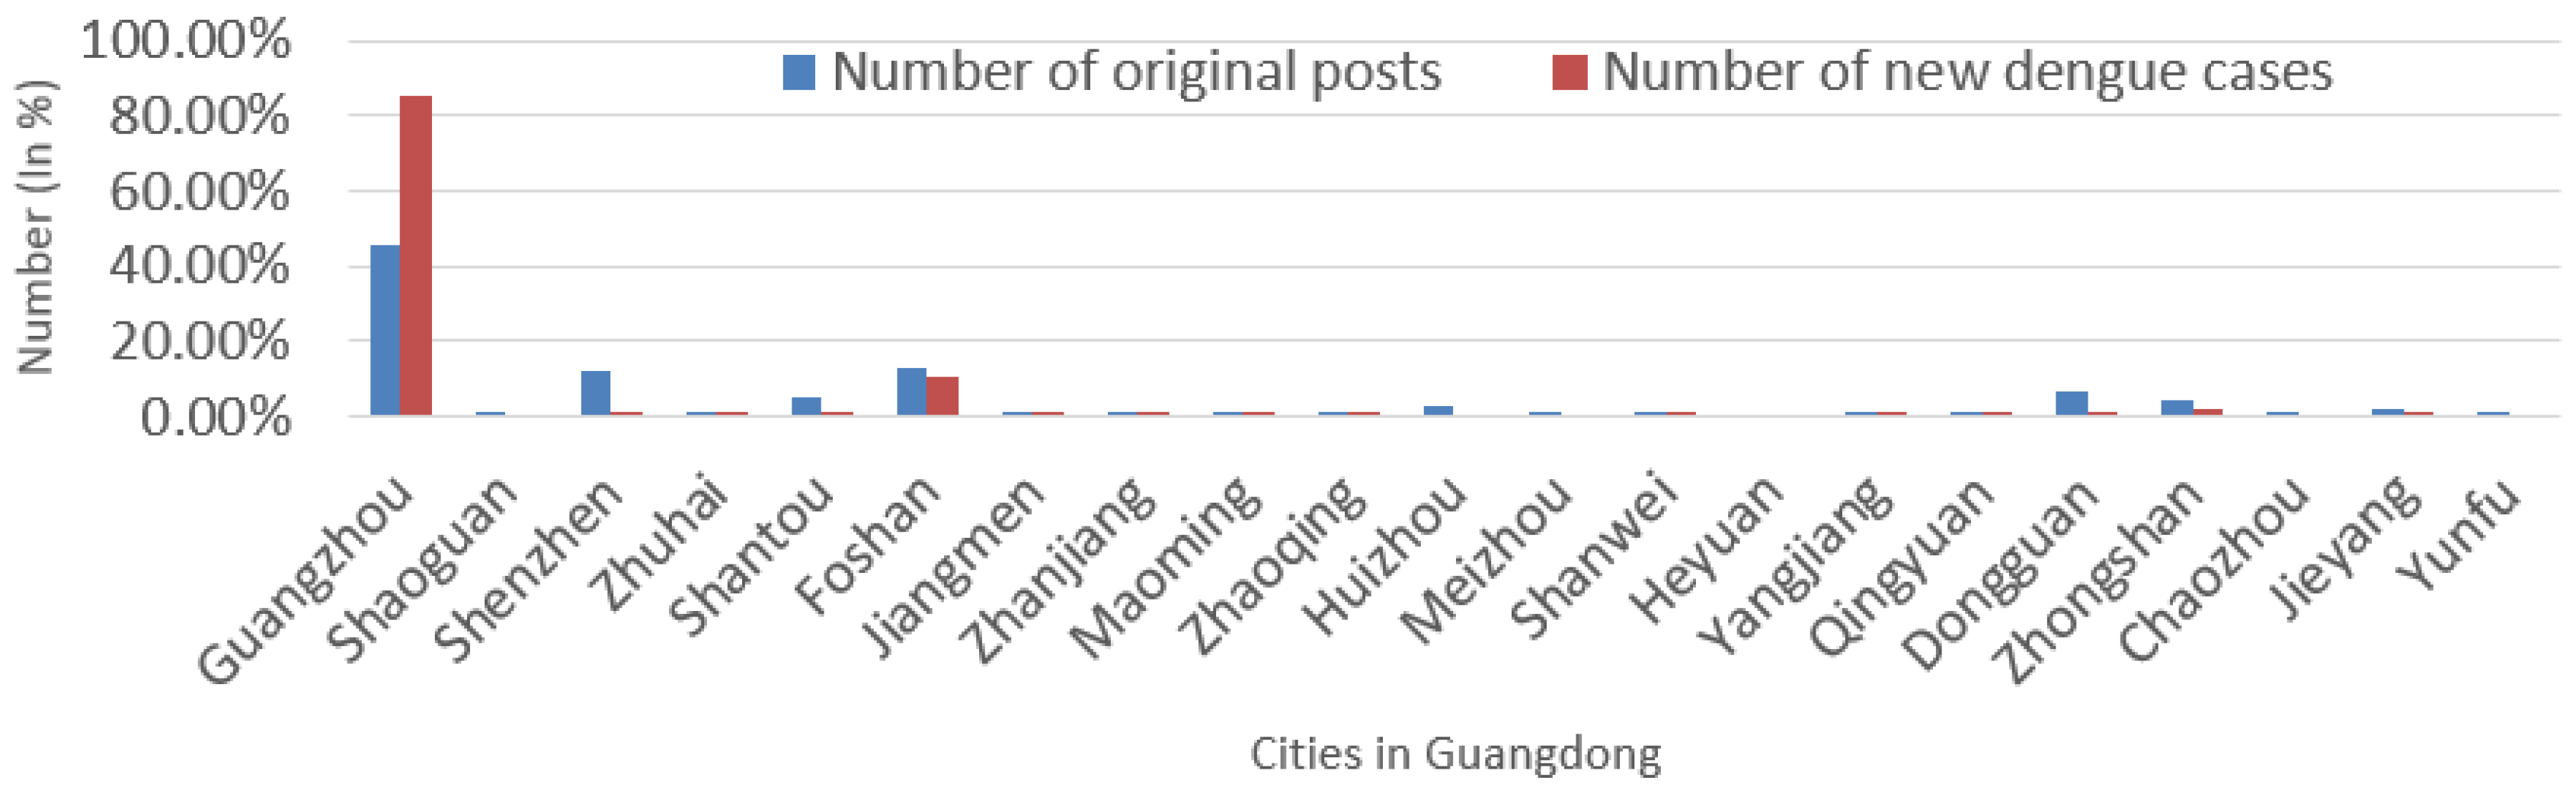
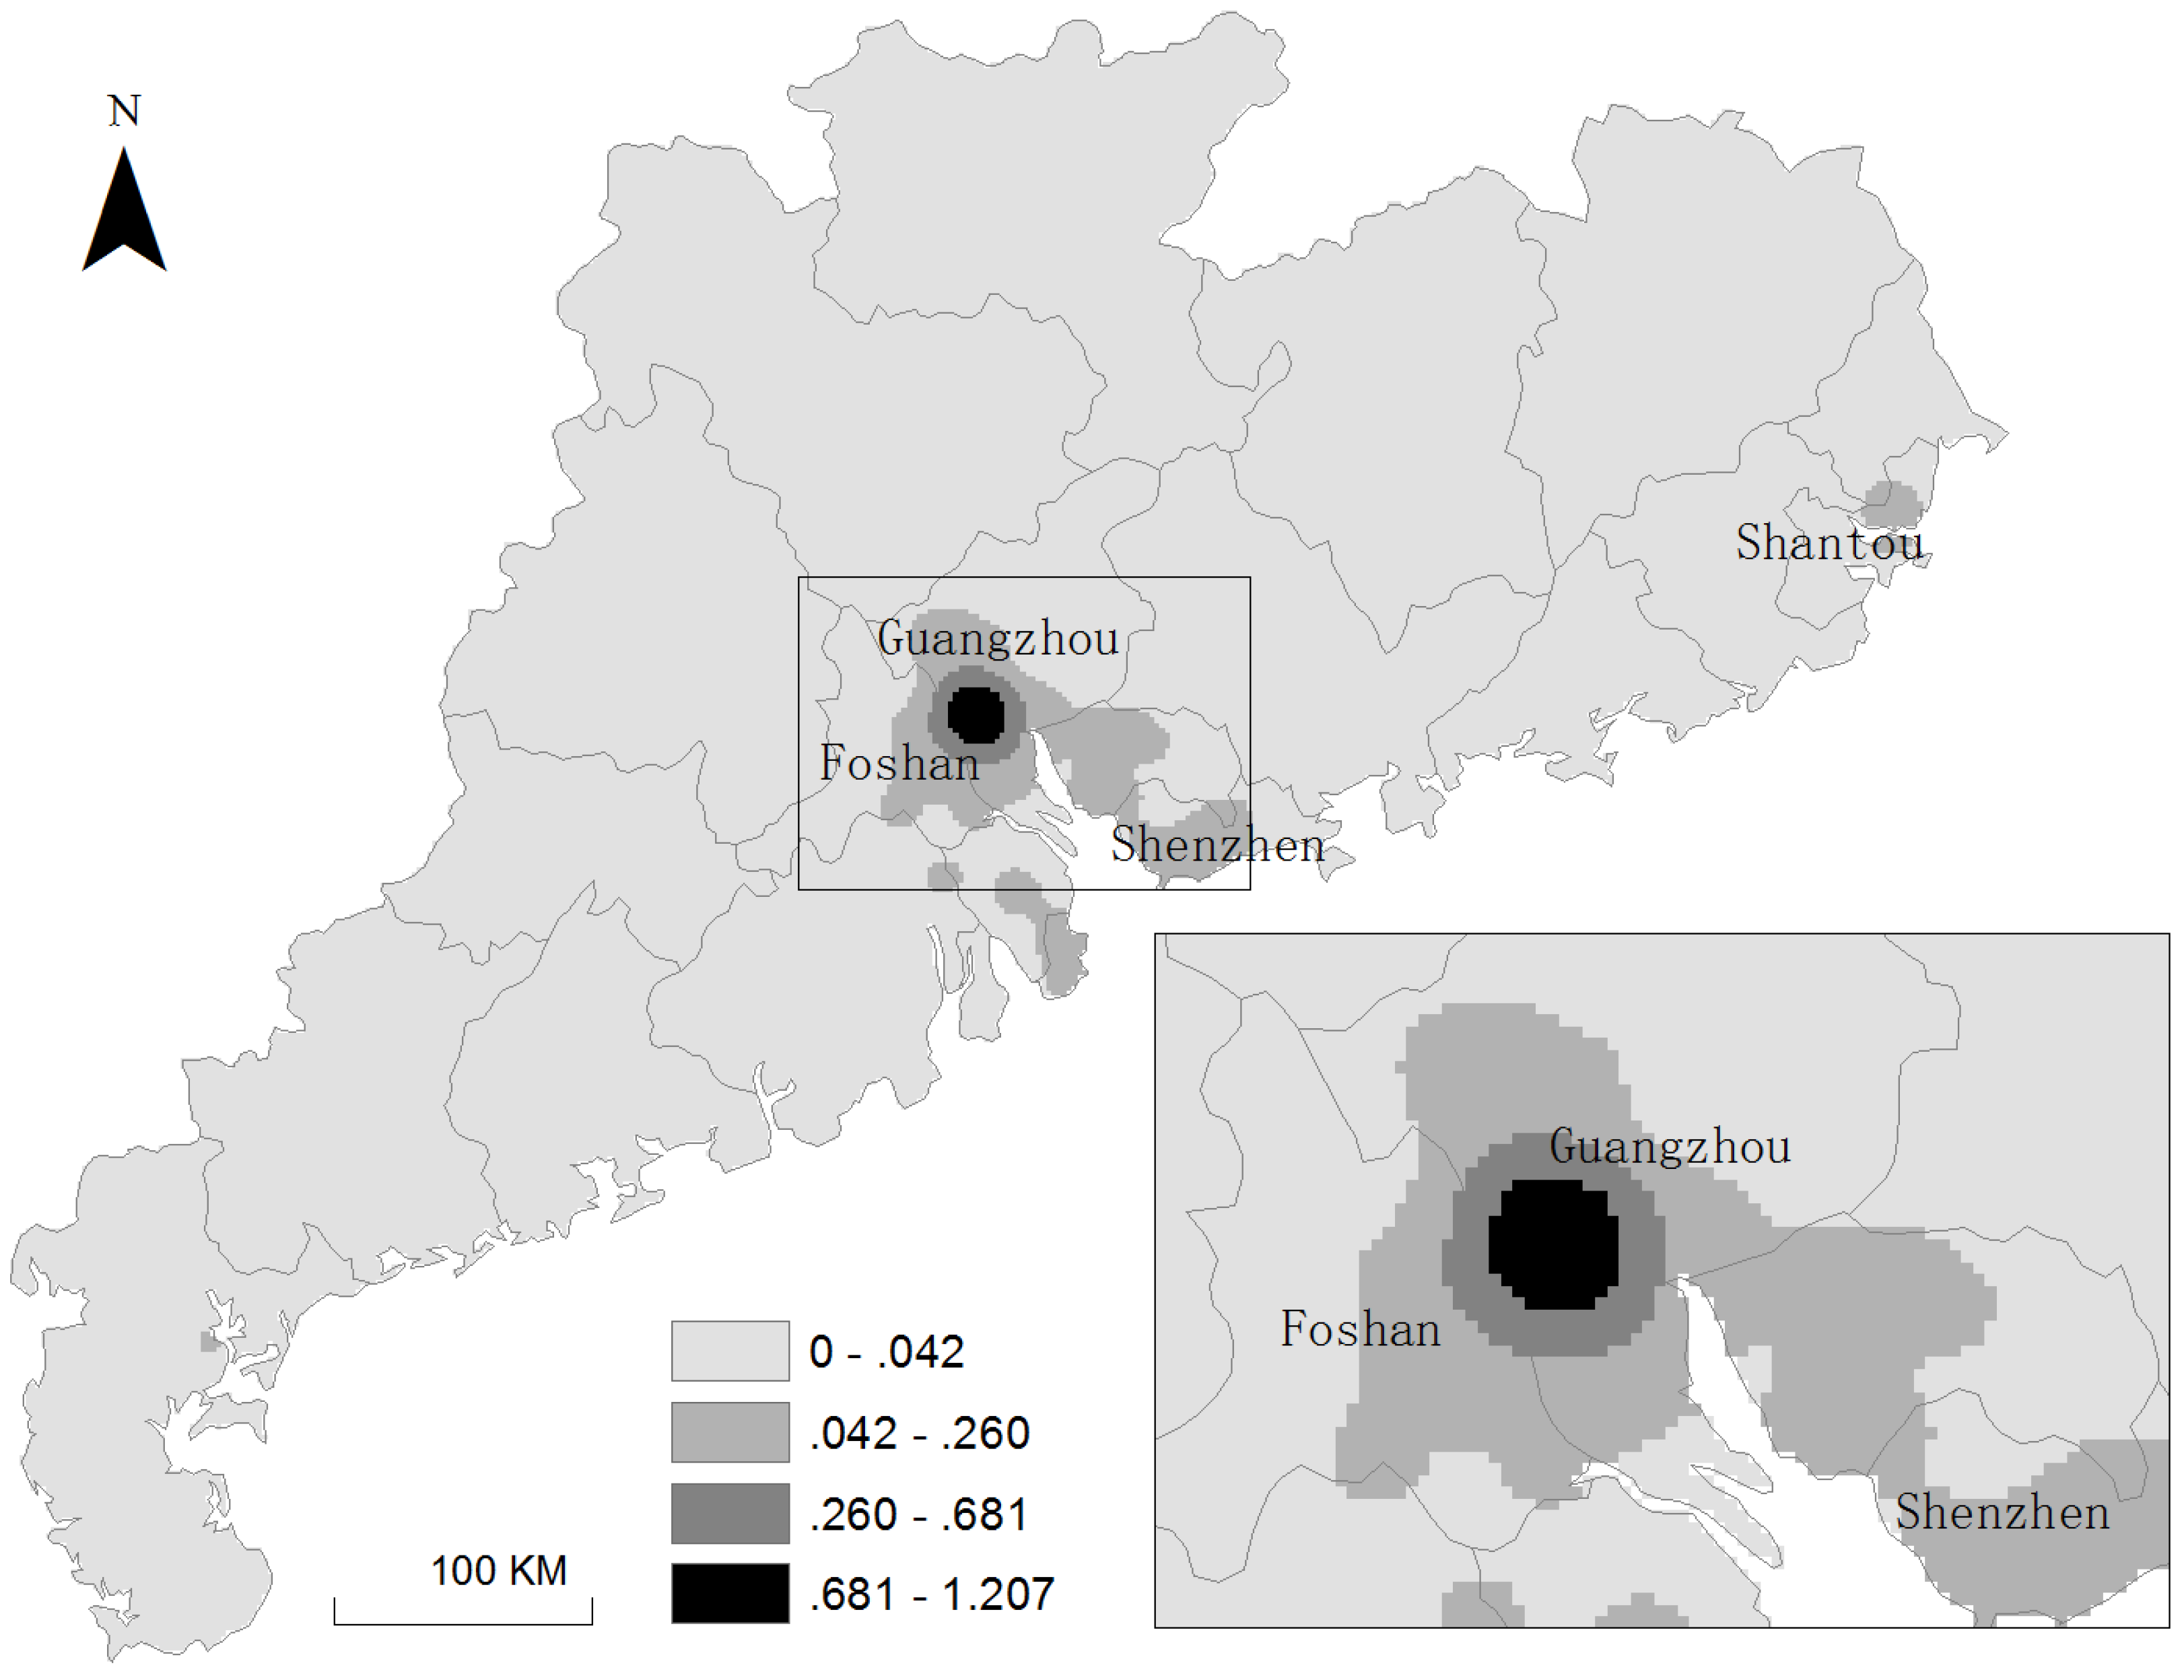
3.1. Distribution in Guangdong Province

Starting from 22 September 2014, the Guangdong Health Department began to publish a daily city-level report about dengue disease. Both datasets, the Weibo posts about the dengue fever and the number of dengue fever cases from the official data were counted for each city. The percentages of reported dengue disease and the number of posts were compared in Figure 3.
Both the number of new dengue fever cases and the number of new Weibo posts were first normalized by percentage for 22 September 2014. After that, an ANOVA was carried out using SPSS. The Pearson correlation coefficient in the ANOVA was 0.954, suggesting that the number of new Weibo posts was significantly correlated (at the 2-tailed 0.01 level) with the number of new dengue fever cases.
To further investigate the geographical distribution of posts from Weibo about “dengue” in Guangdong province, we performed a kernel density estimation in ArcGIS aiming to identify the hot spot of the posts (Figure 4).
Figure 4 provides a glimpse of the spatial distribution, showing that the center of the dengue epidemic was located in Guangzhou and Foshan. The distribution was a good match with the level of the epidemic in Guangdong province reported from the official channel, as Guangzhou and Foshan were the most affected cities according to the official dengue epidemic report. In addition, the degree of infection tended to decrease way from the epidemic center. This phenomenon was consistent with the law of infectious disease outbreaks as well as with a reflection of Tobler’s First Law of Geography. Moreover, with a close investigation, the posts in Weibo provided a finer epidemic distribution than the official report at both regional and local scales.

3.2. Distribution in China

There is no doubt that dengue fever in China will not be evenly distributed. On 22 September 2014, various media reported that there was dengue fever in China, and they raised awareness about this disease. On the same day, there were 1044 original posts that appeared on Weibo that included the word “dengue”. Compared with the 625 posts containing the word on the day before, this was a large increase. The distributions in 32 provinces are shown in Figure 5. Guangdong province accounted for more than 50% of the total Weibo posts containing the word “dengue” (Figure 5).
An interesting finding is that Henan province had the second highest number of posts. One possible explanation is that many of the people comprising the floating population in Guangdong province were from Henan province. As the capital of China, Beijing also had a large number of posts regarding this topic. Beijing was ranked third for the distribution of posts in China, while Fujian province was ranked fourth among all of the provinces in China. This could be attributed to that fact that Fujian province is geographically close to Guangdong province and that these two areas have similar climate and environment.

4. Temporal Analysis of Dengue Fever

Compared to the official report, the posts related to dengue fever were more capable of capturing the real-time signs of events. Therefore, monitoring Weibo posts provides a new method for estimating and detecting the temporal patterns of epidemics. Dengue fever is an infectious disease that has latent, outbreak, and recovery phases in its diffusion process [32]. Our paper aimed to explore the relationship between the Weibo posts in the virtual world and the dengue cases that were identified in the real world.

4.1. Distribution on Specific Days

Guangdong Health Department published daily reports about the dengue epidemic during the period from 22 September 2014 to 30 October 2014. During the same time period, we also collected posts related to dengue fever within Guangzhou. Our first analysis was performed to compare the Weibo post data with the official reported data, therefore an ANOVA correlation study was carried out for the two groups of data after they were normalized on a Log scale. The 2-tailed Pearson correlation value was 0.679 at a significance level of 0.0001, which showed that the number of posts and the number of new cases were significantly correlated on these days. To validate the results, a visual exploratory comparison was performed, and the results are shown in Figure 6.
Figure 6 shows that although the local government had been closely monitoring the disease to prevent infection and improve treatment from 22 September, the number of infected people continued to increase. This finding is consistent with the incubation period of dengue fever, which is 4–7 (with a range of 3–14) days [33]. The overall infection curve first increased and then decreased.
In summary, the trends in public attention on the Weibo had similar curves to the numbers of infected people, but they were not strongly correlated. There were two possible reasons for this finding. (1) The user attention on Weibo was very sensitive to dengue outbreaks. Especially when infections were found, the public concern rates would quickly reach the top and then gradually decrease. In this case, the highest rate of concern was more than 10 times the average value of concern; (2) The public concerns about an event were affected by various media. In this case, after many media widely reported dengue fever on 26 September, the concern of the public hit a peak as a response to these reports. Due to the enormous human mobility during the National Day Golden Week, more users had a chance to come in contact with virus carriers or potential patients. The public media began to report more infected cases during the holiday from 1 to 7 October 2014. Both factors promoted the number of posts to peak on 9 October. Obviously people had a certain understanding for dengue, so there were fewer public concerns on 9 October compared with 26 September.

4.2. The Effect of the Day of the Week

The numbers of new infections in Guangdong province were classified into three groups, which were posted on a weekend (which included holidays), the first day of the week, and other weekdays. We also used the same classification for the numbers of posts in Weibo. The former classification is shown in Figure 7a, and the latter is shown in Figure 7b.
Figure 7 shows that (1) weekends had fewer reported cases and a higher number of Weibo posts than weekdays; (2) The number of new cases increased greatly on the first day of a work week. In addition, the rates of concern on weekdays did not show large fluctuations. The daily activities of the population were closely constrained by their occupations. Although most hospitals offered seven-day services, the capacity of the services varied. In addition, people needed to coordinate their hospital visits with their schedules. Therefore, people were more inclined to go to the hospital during working hours for non-emergency diseases such as dengue fever, which partially explained the overwhelming increase in numbers observed on Mondays as a result of the accumulation of cases over the weekend. People tended to have more time during the weekend to post information on the Weibo platform compared to the busy weekdays. This explained why the number of posts related to dengue from Weibo increased over the weekend.

4.3. Distribution on a Single Day

On a finer temporal scale, we can observe the variation of dengue-related posts during the 24 h within a day. Since the total number of Weibo posts cannot be solicited in a daily manner, we developed a metric to estimate the population size. Because the Chinese character “de” has a very high frequency in the posts, we compared the frequencies of posts with the keyword “de” (the frequent word) with those with the keyword “dengue”. Figure 8 reveals the hour-by-hour distribution of Weibo posts within a single day (22 September 2014). The two temporal distributions of posts, “de” versus “dengue”, were correlated to some extent. The dengue-related posts reached a peak in the morning time slot from 11 am to 12 noon, which is believed to be consistent with the release of disease testing reports at most hospitals.

4.4. Noise Canceling and Prediction Based on Kalman Filtering

One can argue, based on Figure 9, that the initial phase showed a large number of Weibo posts, and at the same time, an increasing number of new cases. In the middle phase, the number of new cases was relatively stable, while there was a slight decline in the number of Weibo posts. During the later phase, both the number of Weibo posts and the number of new cases declined, and the former declined slightly more rapidly than the latter.
Figure 10 presents the number of posts related to dengue from Weibo on different dates after applying Kalman filter. As seen in the figure, the temporal distribution of the number of dengue Weibo posts in Guangdong province showed a similar trend as the national distribution. The temporal curve for Guangdong province demonstrated two palpable fluctuations on 14 June and 2 July. The latter coincided with the first confirmed case in Guangdong province, which provides strong evidence of the detection of a dengue fever case. The former discernable peak was 17 days ahead of the confirmed case and also provides an effective warning to watch out for the disease. The national temporal curve shows that discussions about dengue were detected in early June, suggesting that the first case of dengue was not in Guangdong province. This finding is consistent with the report from the Chinese Center for Disease Control and Prevention.

5. Spatiotemporal Pattern of Dengue Fever

The Chinese Center for Disease Control and Prevention disseminated the information about the outbreak of various epidemic diseases. In addition, due to the large-scale outbreak of dengue fever, the Guangdong Disease Prevention Center also announced daily information from 22 September 2014 to 30 October 2014. However, the official information about dengue was not disclosed in other provinces. Therefore, it was difficult to monitor the dissemination process and pattern of dengue fever in China, due to the lack of effective data support from official channels for comparison and verification purposes. Weibo posts provided a partial solution to monitor dengue fever through detecting multiple stages of an infectious disease: infection, incubation, outbreak, and recovery. Based on the analysis of posts from Weibo, the dengue fever outbreak could be explored across space and over time.

5.1. Epidemic Diffusion Process

Based on the second dataset collected by provinces and weeks, we explored the diffusion of dengue fever in China. Kalman filtering was used to cancel the noise. We mapped the dengue epidemic in China and presented the process of infectious diffusion as four stages.
The first stage was the dengue infection phase from Week 1 of our observation timeline to Week 12. At this stage, a small number of dengue patients began to appear in some provinces. As shown in Figure 11a, these cases were mainly reported in Guangdong province (GD) and Zhejiang province (ZJ) as well as few epidemic observations in Beijing (BJ).
This was followed by an incubation period from Week 13 to Week 15, with the gradual emergence of dengue patients in several other provinces. As shown in Figure 11b, most patients were in the incubation period of the dengue infection during this time period.
As shown in Figure 11c, the third stage was the outbreak phase, which lasted from Week 16 to Week 18. Within this stage, dengue disease rapidly spread out in the country, with Guangdong province and Beijing being the hot spots. The daily numbers of infected patients reached a peak in Guangdong province, and the official disease center started to disclose new cases to the public in a daily manner starting from the first Monday of Week 16.
This stage was followed by the recovery stage from Week 19 to Week 22. This stage is shown in Figure 11d. The number of new cases of dengue fever gradually decreased as the number of cured patients increased day by day. It can also be noted from the figure that the public attention decreased.

5.2. Spatial Pattern

The spatial distribution of the infections presented two patterns. First, the diffusion of the disease in Guangdong province primarily occurred in areas around the Guangzhou and Foshan districts. In addition, due to the high chances of encountering the contagion in major metropolitan regions in China, Beijing and Shanghai were also core areas of infection. However, the epidemic situation was effectively controlled in these two areas at an early stage, which was attributed to the better health infrastructure as well as the high degree of urbanization.
In order to study the spatial transmission pattern in China, we selected Week 17 as a sample dataset, which was during the outbreak stage of the dengue epidemic. We used Moran’s I to examine whether there existed a spatial autocorrelation as another angle to understand the spatial transmission of dengue. GeoDa software package, an exploratory spatial data analysis tool, was used to run the analysis and the results are presented in Figure 12. In the figure, the spatial weighted matrix was built based on the provinces’ adjacency, and the number of posts related to dengue standardized by population was set as the attribute. Moran’s I indicator was −0.12 at the significance level of 0.012, indicating that there was a moderate degree of negative spatial dependency in local regions. The spatial autocorrelation map showed that there were spatial clusters, mostly in the northwest area, as well as in the eastern coastal zone. Guangdong province, which was one of the high outbreak regions, did not appear to have a positive dependence effect on its neighboring province, while Fujian province and Jiangxi province, adjacent to Guangdong province, appeared to have a low-high spatial interaction with their neighboring areas. The analysis using Moran’s I was in agreement with the results of our previous findings of the epidemic process.

6. Conclusions

The growing community of social media users are contributing an enormous volume of data to platforms such as Twitter and Weibo, reflecting their feelings and opinions on real-world events [34,35,36,37,38,39,40,41]. Due to the popularity of location-based mobile devices, such data also contains spatiotemporal footprints, which may be used to monitor human activity and information diffusion in real time [42,43]. Therefore, location-based social media provides novel methods to study large-scale events such as the outbreak of epidemic diseases in the domain of public health. This paper uses Weibo to study the spatiotemporal evolution of a dengue disease outbreak in China in 2014. Our findings suggest that the discussion of dengue disease on China’s major social media platform strongly correlated with the outbreak of the disease in both the spatial and temporal dimensions. In addition, we applied the Kalman filter method to decrease the noise and confirmed this finding.
The spatial analysis of dengue-related topics from Weibo posts shows that there exists a strong degree of spatial correlation of the discussions of dengue fever in cyberspace with the real-world epidemic dengue activity. Furthermore, there are local spatial hotspots of people’s attention on dengue fever in the social media, with a distance decay effect.
The temporal analysis shows that due to external factors such as the impact from official mass media, there is a synchronization of daily discussion frequencies on the social media website with the real world disease outbreak rhythm. Last but not least, our data collection used both the Weibo API and a crawler in order to address the daily access restrictions and limitations of the searching capabilities of public Stream API.
There are some limitations associated with this research. First of all, social media are very sensitive to the impact from mass media. How to better quantify the noise caused by mass media needs further investigation. In addition, the demographics of social media users are different from those in the real world, and such difference varies across space, which might affect the effectiveness of policy implications derived from this study. Furthermore, fewer than 10% of the posts are geotagged. Hence, how to better address as well as reduce biases and flaws in social media data need to be further explored.

Acknowledgments

This work was supported by the National Science Foundation under Grant No. 1416509, National Social Science Foundation of China (No. 11 & ZD159), and the National Natural Science Foundation of China under Grant No. 41301426, 41301427, 41329001.

Author Contributions

Xinyue Ye and Shengwen Li co-designed and performed the research. Xining Yang updated the literature review and edited the manuscript. Chenglin Qin provided the initial research ideas and framework. All authors read and approved the final manuscript.

Conflicts of Interest

The authors declare no conflict of interest.

References

  1. Dengue and Severe Dengue. Available online: http://www.who.int/mediacentre/factsheets/fs117/en/ (accessed on 27 January 2016).
  2. Hay, S.I.; George, D.B.; Moyes, C.L.; Brownstein, J.S. Big data opportunities for global infectious disease surveillance. PLoS Med. 2013, 10, e1001413. [Google Scholar] [CrossRef] [PubMed]
  3. Ginsberg, J.; Mohebbi, M.H.; Patel, R.S.; Brammer, L.; Smolinski, M.S.; Brilliant, L. Detecting influenza epidemics using search engine query data. Nature 2009, 457, 1012–1014. [Google Scholar] [CrossRef] [PubMed]
  4. Raubal, M.; Jacquez, G.; Wilson, J.; Kuhn, W. Synthesizing population, health, and place. J. Spat. Inf. Sci. 2013, 7, 103–108. [Google Scholar] [CrossRef]
  5. Richardson, D.B.; Volkow, N.D.; Kwan, M.-P.; Kaplan, R.M.; Goodchild, M.F.; Croyle, R.T. Spatial turn in health research. Science 2013, 339, 1390–1392. [Google Scholar] [CrossRef] [PubMed]
  6. Anand, S.; Narayana, K. Earthquake reporting system development by tweet analysis. Int. J. Emerg. Eng. Res. Technol. 2014, 2, 96–106. [Google Scholar]
  7. MacEachren, A.M.; Robinson, A.C.; Jaiswal, A.; Pezanowski, S.; Savelyev, A.; Blanford, J.; Mitra, P. Geo-Twitter analytics: Applications in crisis management. In Proceedings of the 25th International Cartographic Conference, Paris, France, 3–8 July 2011; pp. 3–8.
  8. Ghosh, D.; Guha, R. What are we “tweeting” about obesity? Mapping tweets with topic modeling and geographic information system. Cartogr. Geogr. Inf. Sci. 2013, 40, 90–102. [Google Scholar] [CrossRef] [PubMed]
  9. Qu, Y.; Huang, C.; Zhang, P.; Zhang, J. Microblogging after a major disaster in China. In Proceedings of the ACM 2011 Conference on Computer Supported Cooperative Work, Hangzhou, China, 19–23 March 2011.
  10. Sakaki, T.; Okazaki, M.; Matsuo, Y. Tweet analysis for real-time event detection and earthquake reporting system development. IEEE Trans. Knowl. Data Eng. 2013, 25, 919–931. [Google Scholar] [CrossRef]
  11. Widener, M.J.; Li, W. Using geolocated Twitter data to monitor the prevalence of healthy and unhealthy food references across the US. Appl. Geogr. 2014, 54, 189–197. [Google Scholar] [CrossRef]
  12. Chen, X.; Yang, X. Does food environment influence food choices? A geographical analysis through “tweets”. Appl. Geogr. 2014, 51, 82–89. [Google Scholar] [CrossRef]
  13. King, D.; Ramirez-Cano, D.; Greaves, F.; Vlaev, I.; Beales, S.; Darzi, A. Twitter and the health reforms in the English National Health Service. Health Policy 2013, 110, 291–297. [Google Scholar] [CrossRef] [PubMed]
  14. Rogers, D.J.; Wilson, A.J.; Hay, S.I.; Graham, A.J. The global distribution of yellow fever and dengue. Adv. Parasitol. 2006, 62, 181–220. [Google Scholar] [PubMed]
  15. Brownstein, J.S.; Freifeld, C.C.; Reis, B.Y.; Mandl, K.D. Surveillance Sans Frontières: Internet-based emerging infectious disease intelligence and the health map project. PLoS Med. 2008, 5, e151. [Google Scholar] [CrossRef] [PubMed]
  16. Benson, D.A.; Cavanaugh, M.; Clark, K.; Karsch-Mizrachi, I.; Lipman, D.J.; Ostell, J.; Sayers, E.W. GenBank. Nucleic Acids Res. 2013, 41, D36–D42. [Google Scholar] [CrossRef] [PubMed]
  17. Brady, O.J.; Gething, P.W.; Bhatt, S.; Messina, J.P.; Brownstein, J.S.; Hoen, A.G.; Moyes, C.L.; Farlow, A.W.; Scott, T.W.; Hay, S.I. Refining the global spatial limits of dengue virus transmission by evidence-based consensus. PLoS Negl. Trop. Dis. 2012, 6, e1760. [Google Scholar] [CrossRef] [PubMed]
  18. Messina, J.P.; Brady, O.J.; Pigott, D.M.; Brownstein, J.S.; Hoen, A.G.; Hay, S.I. A global compendium of human dengue virus occurrence. Sci. Data 2014, 1. [Google Scholar] [CrossRef] [PubMed]
  19. Milinovich, G.J.; Williams, G.M.; Clements, A.C.A.; Hu, W. Internet-based surveillance systems for monitoring emerging infectious diseases. Lancet Infect. Dis. 2014, 14, 160–168. [Google Scholar] [CrossRef]
  20. Achrekar, H.; Gandhe, A.; Lazarus, R.; Yu, S.-H.; Liu, B. Predicting flu trends using Twitter data. In Proceedings of the 2011 IEEE Conference on Computer Communications Workshops, Shanghai, China, 10–15 April 2011.
  21. Velardi, P.; Stilo, G.; Tozzi, A.E.; Gesualdo, F. Twitter mining for fine-grained syndromic surveillance. Artif. Intell. Med. 2014, 61, 153–163. [Google Scholar] [CrossRef] [PubMed]
  22. Padmanabhan, A.; Wang, S.; Cao, G.; Hwang, M.; Zhang, Z.; Gao, Y.; Soltani, K.; Liu, Y. FluMapper: A cyberGIS application for interactive analysis of massive location-based social media. Concurr. Comput. Pract. Exp. 2014, 26, 2253–2265. [Google Scholar] [CrossRef]
  23. Wang, S.; Paul, M.; Dredze, M. Exploring health topics in Chinese social media: An analysis of Sina Weibo. In Proceedings of the Twenty-Eighth AAAI Conference on Artificial Intelligence, Québec City, QC, Canada, 27–31 July 2014.
  24. Aslam, A.A.; Tsou, M.; Spitzberg, H.B.; An, L.; Gawron, J.M.; Gupta, D.K.; Peddecord, K.M.; Nagel, A.C.; Allen, C.; Yang, J.A.; et al. The reliability of tweets as a supplementary method of seasonal influenza surveillance. J. Med. Internet Res. 2014. [Google Scholar] [CrossRef] [PubMed]
  25. Blei, D.M.; Andrew, Y.; Ng, M.I.J. Latent Dirichlet allocation. J. Mach. Learn. Res. 2003, 3, 993–1022. [Google Scholar]
  26. Krestel, R.; Fankhauser, P.; Nejdl, W. Latent dirichlet allocation for tag recommendation. In Proceedings of the Third ACM Conference on Recommender Systems, New York, NY, USA, 23–25 October 2009.
  27. Lienou, M.; Maitre, H.; Datcu, M. Semantic annotation of satellite images using latent Dirichlet allocation. IEEE Geosci. Remote Sens. Lett. 2010, 7, 28–32. [Google Scholar] [CrossRef]
  28. Porteous, I.; Newman, D.; Ihler, A.; Asuncion, A.; Smyth, P.; Welling, M. Fast collapsed gibbs sampling for latent dirichlet allocation. In Proceeding of the 14th ACM SIGKDD International Conference on Knowledge Discovery and Data Mining, Las Vegas, NV, USA, 24–27 August 2008.
  29. Ruths, D.; Pfeffer, J. Social media for large studies of behavior. Science 2014, 346, 1063–1064. [Google Scholar] [CrossRef] [PubMed]
  30. Kalman, R.E. A new approach to linear filtering and prediction problems. J. Basic Eng. 1960, 82, 35–45. [Google Scholar] [CrossRef]
  31. Chinese Center for Disease Control and Prevention. Dengue and Severe Dengue. Available online: http://www.chinacdc.cn/tjsj (accessed on 27 February 2015). (In Chinese)
  32. Seneviratne, S.; Gurugama, P.; Garg, P.; Perera, J.; Wijewickrama, A. Dengue viral infections. Indian J. Dermatol. 2010, 55, 68. [Google Scholar] [CrossRef] [PubMed]
  33. Rigau-Pérez, J.G.; Clark, G.G.; Gubler, D.J.; Reiter, P.; Sanders, E.J.; Vorndam, A.V. Dengue and dengue haemorrhagic fever. Lancet 1998, 352, 971–977. [Google Scholar] [CrossRef]
  34. Ye, X.; Lee, J. Integrating Geographic Activity Space and Social Network Space to Promote Healthy Lifestyles. ACMSIGSPATIAL Health GIS. Available online: http://www.sigspatial.org/sigspatial-special-issues/sigspatial-special-volume-8-number-1-march-2016/Paper3.pdf (accessed on 27 August 2016).
  35. Wang, Z.; Ye, X.; Tsou, M. Spatial, temporal, and content analysis of Twitter for wildfire hazards. Nat. Hazards 2016. [Google Scholar] [CrossRef]
  36. Li, S.; Ye, X.; Lee, J.; Gong, J.; Qin, C. Spatiotemporal analysis of housing prices in China: A big data perspective. Appl. Spat. Anal. Policy 2016. [Google Scholar] [CrossRef]
  37. Chong, Z.; Qin, C.; Ye, X. Environmental regulation, economic network and sustainable growth of urban agglomerations in China. Sustainability 2016, 8, 467. [Google Scholar] [CrossRef]
  38. Zhang, F.; Zhu, X.; Ye, X.; Guo, W.; Hu, T.; Huang, L. Analyzing urban human mobility patterns through thematic model at the finer scale. ISPRS Int. J. Geo-Inf. 2016, 5, 78. [Google Scholar] [CrossRef]
  39. Shaw, S.; Tsou, M.; Ye, X. Human dynamics in the mobile and big data era. Int. J. Geogr. Inf. Sci. 2016, 30, 1687–1693. [Google Scholar] [CrossRef]
  40. Yang, X.; Ye, X.; Sui, D.Z. We know where you are: In space and place-enriching the geographical context through social media. Int. J. Appl. Geospat. Res. 2016, 7, 61–75. [Google Scholar] [CrossRef]
  41. Wang, Y.; Wang, T.; Ye, X.; Zhu, J.; Lee, J. Using social media for emergency response and urban sustainability: A case study of the 2012 Beijing rainstorm. Sustainability 2016, 8, 25. [Google Scholar] [CrossRef]
  42. Zhao, H.; Lee, J.; Ye, X.; Tyner, J. Spatiotemporal analyses of religious establishments in coastal China. GeoJournal 2016. [Google Scholar] [CrossRef]
  43. Huang, X.; Zhao, Y.; Yang, J.; Zhang, C.; Ma, C.; Ye, X. TrajGraph: A graph-based visual analytics approach to studying urban network centralities using taxi trajectory data. IEEE Trans. Vis. Comput. Graph. 2016, 22, 160–169. [Google Scholar] [CrossRef] [PubMed]
Figure 1. Data collection process.
Ijgi 05 00156 g001
Figure 2. Location of the posts with ‘Guangdong’ as the value for the area attribute.
Ijgi 05 00156 g002
Figure 3. The number of original posts and new dengue fever cases reported on 22 September 2014.
Ijgi 05 00156 g003
Figure 4. The distribution of posts about dengue fever in Guangdong.
Ijgi 05 00156 g004
Figure 5. The number of original posts about dengue fever in China on 22 September 2014.
Ijgi 05 00156 g005
Figure 6. Trend in Guangdong province.
Ijgi 05 00156 g006
Figure 7. (a) Impact of new cases reported on different days of the week; (b) Impact of the number of Weibo posts on different days of the week.
Ijgi 05 00156 g007
Figure 8. The trend on one day, 22 September 2014.
Ijgi 05 00156 g008
Figure 9. The number of new cases and the number of Weibo posts.
Ijgi 05 00156 g009
Figure 10. The number of Weibo posts related to dengue fever.
Ijgi 05 00156 g010
Figure 11. (a) The distribution of the number of Weibo posts per million people in China (Week 1—1 to 7 June 2014); (b) The distribution of the number of Weibo posts per million people in China (Week 14—31 August to 6 September 2014); (c) The distribution of the number of Weibo posts per million people in China (Week 17—21 to 27 September 2014); (d) The distribution of the number of Weibo posts per million people in China (Week 21—19 to 26 October 2014).
Ijgi 05 00156 g011aIjgi 05 00156 g011b
Figure 12. Local Moran’s I (a) scatter plot; (b) cluster map.
Ijgi 05 00156 g012
Table 1. Dataset list.
DatasetNumberData FieldsTime
123,144ID, text, post-time, userid, area, latitude, longitude, province, cityFrom 1 June 2014 to 28 October 2014 in Guangdong province
21910ID, text, post-time, userid, area, latitude, longitude, province, cityGeoreferenced in Dataset 1
35270#posts with “de”, #posts with “dengue”, date, province1 June 2014 to 2 November 2014, in China
4504#posts with “dengue”, hour, city22 September 2014, in Guangdong province
5504#new dengue cases, city22 September 2014, in Guangdong province
Table 2. The word frequency distribution of different topics: (a) prevention, detection, fear; (b) symptom, care.
(a)
(a)
PreventionDetectionFear
WordsProbabilitiesWordsProbabilitiesWordsProbabilities
Carried0.063Case0.104Mosquito0.186
Prevention0.061Infection0.057No0.044
Work0.058Our city0.049Now0.026
Inspection0.044Current0.048Know0.024
Strengthen0.034Find0.038Really0.018
Health0.033Patient0.034Family0.017
Staff0.025Severe0.026Feeling0.017
Construction site0.019Input0.026Feel0.015
Company0.015Happen0.024Should0.014
Situation0.015Treatment0.022Recently0.013
Recently0.013Yesterday0.020Easy0.013
Neighboring0.012Disease0.020Terrible0.013
Emphasis0.011Yesterday0.019Powerful0.012
Management0.010Reporter0.019See0.010
Increase0.009Center0.019Scary0.010
Efforts0.009Risk0.015Danger0.010
Area0.009This year0.014Actually0.009
Unit0.009Understand0.013Is not it0.009
Recent0.009Arise0.013Really0.009
Public0.009Hospitalized0.011A little0.008
(b)
(b)
SymptomCare
WordProbabilitiesWordProbabilities
Symptom0.055Mosquito0.166
Occur0.039No0.051
Fever0.035Find0.030
Headache0.024Action0.020
Rash0.023Need0.020
Pathogenesis0.023Family0.018
Muscle0.022Easy0.017
Decrease0.022Issue0.016
Virus0.019Now0.012
Main0.019Introduce0.011
Cause0.017Mother0.011
Acute0.016Terrible0.011
Prevention0.015Should0.011
Disease0.015See0.011
Performance0.014Friend0.010
Hemorrhage0.014Worry0.009
Treatment0.013Like0.008
Arthralgia0.013Actually0.008
Infect0.013Phone0.008
Clinical0.012Detect0.008
Table 3. Distribution of topics.
TopicNumber of Sub-TopicsNumber of Weibo Posts
Prevention97669
Detection87751
Symptom12414
Fear11003
Care1890
Total2019,727

