Article

A Content-Based Remote Sensing Image Change Information Retrieval Model

1
Institute of Remote Sensing and Digital Earth, Chinese Academy of Sciences, Beijing 100094, China
2
University of Chinese Academy of Sciences, Beijing 100049, China
*
Author to whom correspondence should be addressed.
ISPRS Int. J. Geo-Inf. 2017, 6(10), 310; https://0-doi-org.brum.beds.ac.uk/10.3390/ijgi6100310
Submission received: 28 August 2017 / Revised: 25 September 2017 / Accepted: 16 October 2017 / Published: 18 October 2017
(This article belongs to the Special Issue Earth/Community Observations for Climate Change Research)

Abstract

:
With the rapid development of satellite remote sensing technology, the size of image datasets in many application areas is growing exponentially and the demand for Land-Cover and Land-Use change remote sensing data is growing rapidly. It is thus becoming hard to efficiently and intelligently retrieve the change information that users need from massive image databases. In this paper, content-based image retrieval is successfully applied to change detection, and a content-based remote sensing image change information retrieval model is introduced. First, the construction of a new model framework for change information retrieval from a remote sensing database is described. Then, as the target content cannot be expressed by one kind of feature alone, a multiple-feature, integrated retrieval model is proposed. Thirdly, an experimental prototype system that was set up to demonstrate the validity and practicability of the model is described. The proposed model is a new method of acquiring change detection information from remote sensing imagery and so can reduce the need for image pre-processing and also deal with problems related to seasonal changes, as well as other problems encountered in the field of change detection. Meanwhile, the new model has important implications for improving remote sensing image management and autonomous information retrieval. The experiment results obtained using a Landsat data set show that the use of the new model can produce promising results. A coverage rate and mean average precision of 71% and 89%, respectively, were achieved for the top 20 returned pairs of images.

Graphical Abstract

1. Introduction

Land-Use (LU) and Land-Cover (LC) (also referred to as LULC) change can be associated with varying rates of change of one of the Earth’s surface components. However, with human activity increasing, the Earth’s surface has been modified significantly in recent years by various kinds of land cover changes [1,2]. Given its large number of practical applications, including the monitoring of deforestation, and agricultural expansion and intensification, as well as damage assessment, disaster monitoring, urban expansion monitoring, city planning, and land-resource management [1,3], knowledge of LULC changes is needed in many fields. Satellite images have long been the primary and most important source of data for studying different kinds of land-cover changes due to the long periods for which consistent measurements are available and the high spatial resolution of the imagery [4,5]. With the rapid development of remote sensing technology and the increasing variety of Earth observation satellites, the volume of data in satellite image datasets is growing exponentially [6]. However, as they are limited by the capacity of the available data processing and analysis, mass data organization and management lag far behind the explosive increase in the amount of remote sensing imagery. Therefore, one of most challenging emerging applications is how to efficiently and precisely access change information data from such archives based on users’ needs.
The state-of-the-art systems for accessing change information from original images still rely on the use of keywords or metadata, such as geographical coordinates, the data acquisition time and the sensor type [7], along with prior knowledge of the target change events. The performance of keyword matching-based retrieval approaches is highly dependent on the completeness of this prior knowledge. In order to provide consistent data that can be used to derive land-cover information as well as geophysical and biophysical products for regional assessment of surface dynamics and to study the functioning of Earth systems, new data service systems have been proposed. These include the NASA-funded Web-enabled Landsat Data [8] project that systematically generated 30-m composited Landsat Enhanced Thematic Mapper Plus (ETM+) mosaics of the conterminous United States and Alaska from 2002 to 2012, the Australian Geoscience DATA CUBE framework [9,10], and ChangeMatters [11], founded by Esri’s ArcGIS Server Image Extension, which accesses the 34,000 Global Land Survey (GLS) Landsat scenes consisting of worldwide imagery from the 1970s, 1990s, 2000, and 2005, which were created by the USGS and NASA. However, the geographical area covered by the remote sensing imagery used by the above-mentioned services is small and the available products are limited by the universality of the algorithms used to produce them. Also, as extensions of the keyword/metadata approach, they cannot accurately be applied to all the different change application areas actually required by users.
In contrast to the keyword-to-find-image approach, content-based image retrieval (CBIR) is a major advance that aims to search images using visual features that are similar to those of the query image submitted by the user. This technique uses a description of the image consisting of automatically extracted visual features such as color, texture, and shape. After a user submits one or more query images, the images in the database are ranked according to their similarity with the query images and the most similar images are returned to the user [12,13,14]. This efficient method of managing and utilizing the information contained in an image database from the viewpoint of comprehension of the image content provides a new opportunity to solve the problem of information management in a large remote sensing image database [7,15]. Therefore, content-based remote sensing image retrieval (CBRSIR) is a topic that has attracted the attention of scholars around the world. It will become particularly important in the next decade when the number of acquired remote sensing images will again dramatically increase. Feature extraction is fundamental to content-based image retrieval. In the remote sensing literature, several primitive features for characterizing and describing images for retrieval purposes have been presented; these include the fuzzy color histogram [16], the integrated color histogram [17], the Gray Level Co-occurrence Matrix (GLCM) [18], the fast wavelet [19], and visual salient point features [20]. Most studies have focused mainly on methods with different visual features and their effects on CBRSIR [20,21,22]. However, on its own, one type of feature cannot always express the image content precisely and perfectly [23], and it is hard to attain satisfactory retrieval results when using a single feature. Therefore, in this paper, the multi-features integrated retrieval model is proposed, in which the main color and texture features of the remote sensing image proposed by the researcher are included to improve the image retrieval.
Very few studies describe the utilization of CBIR techniques for change detection [14]. Classical change-detection techniques rely on image differences or ratios, post-classification comparison, classification of multi-temporal datasets, or change vector analysis [1,2,3,4,5]; whereas, pixel-based methods require a sub-pixel registration accuracy, as mis-registrations greater than one pixel produce numerous errors when comparing images [1,2,3,4,5]. To overcome the problems described above, content-based remote sensing image retrieval can be applied to accessing and detecting change information in remote sensing imagery. As accessing and detection of remote images’ change information can be seen the similar pairs (different rates with the same geographical location) of images retrieval, in this paper, a new content-based remote sensing image change information retrieval (CBRSICIR) model is proposed for the retrieval of information change from remote sensing imagery. The new model makes two general improvements to the existing content-based remote sensing image retrieval models. First, the structure and framework of the content-based retrieval of remote sensing image change information is built. In addition, an experimental prototype system is set up to demonstrate the validity and practicability of this model. Secondly, the multiple-feature integrated retrieval model is proposed—this model uses three types of color feature and four types of texture feature to improve the retrieval of change information from remote sensing imagery. The new model is a new method of acquiring change information from remote sensing imagery and can reduce the need to carry out image pre-processing. It can also overcome problems related to seasonal changes and other factors that affect change detection and, thereby, meet the needs of many different kinds of user. Meanwhile, the new model has important implications for improving remote sensing image management and autonomous information retrieval.
The remainder of this article is organized as follows. Section 2 describes the study data and the main data-processing steps. 
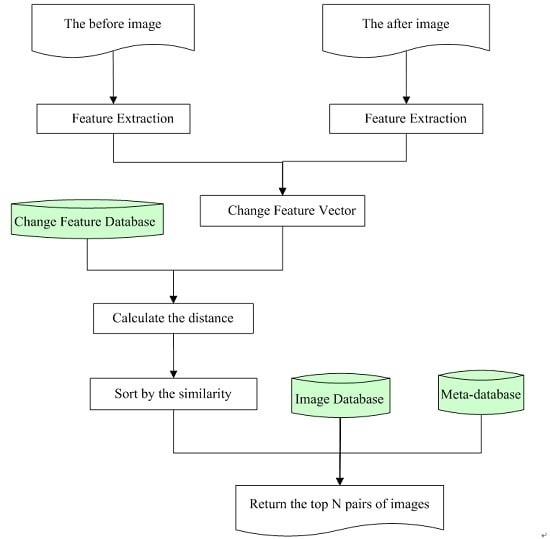
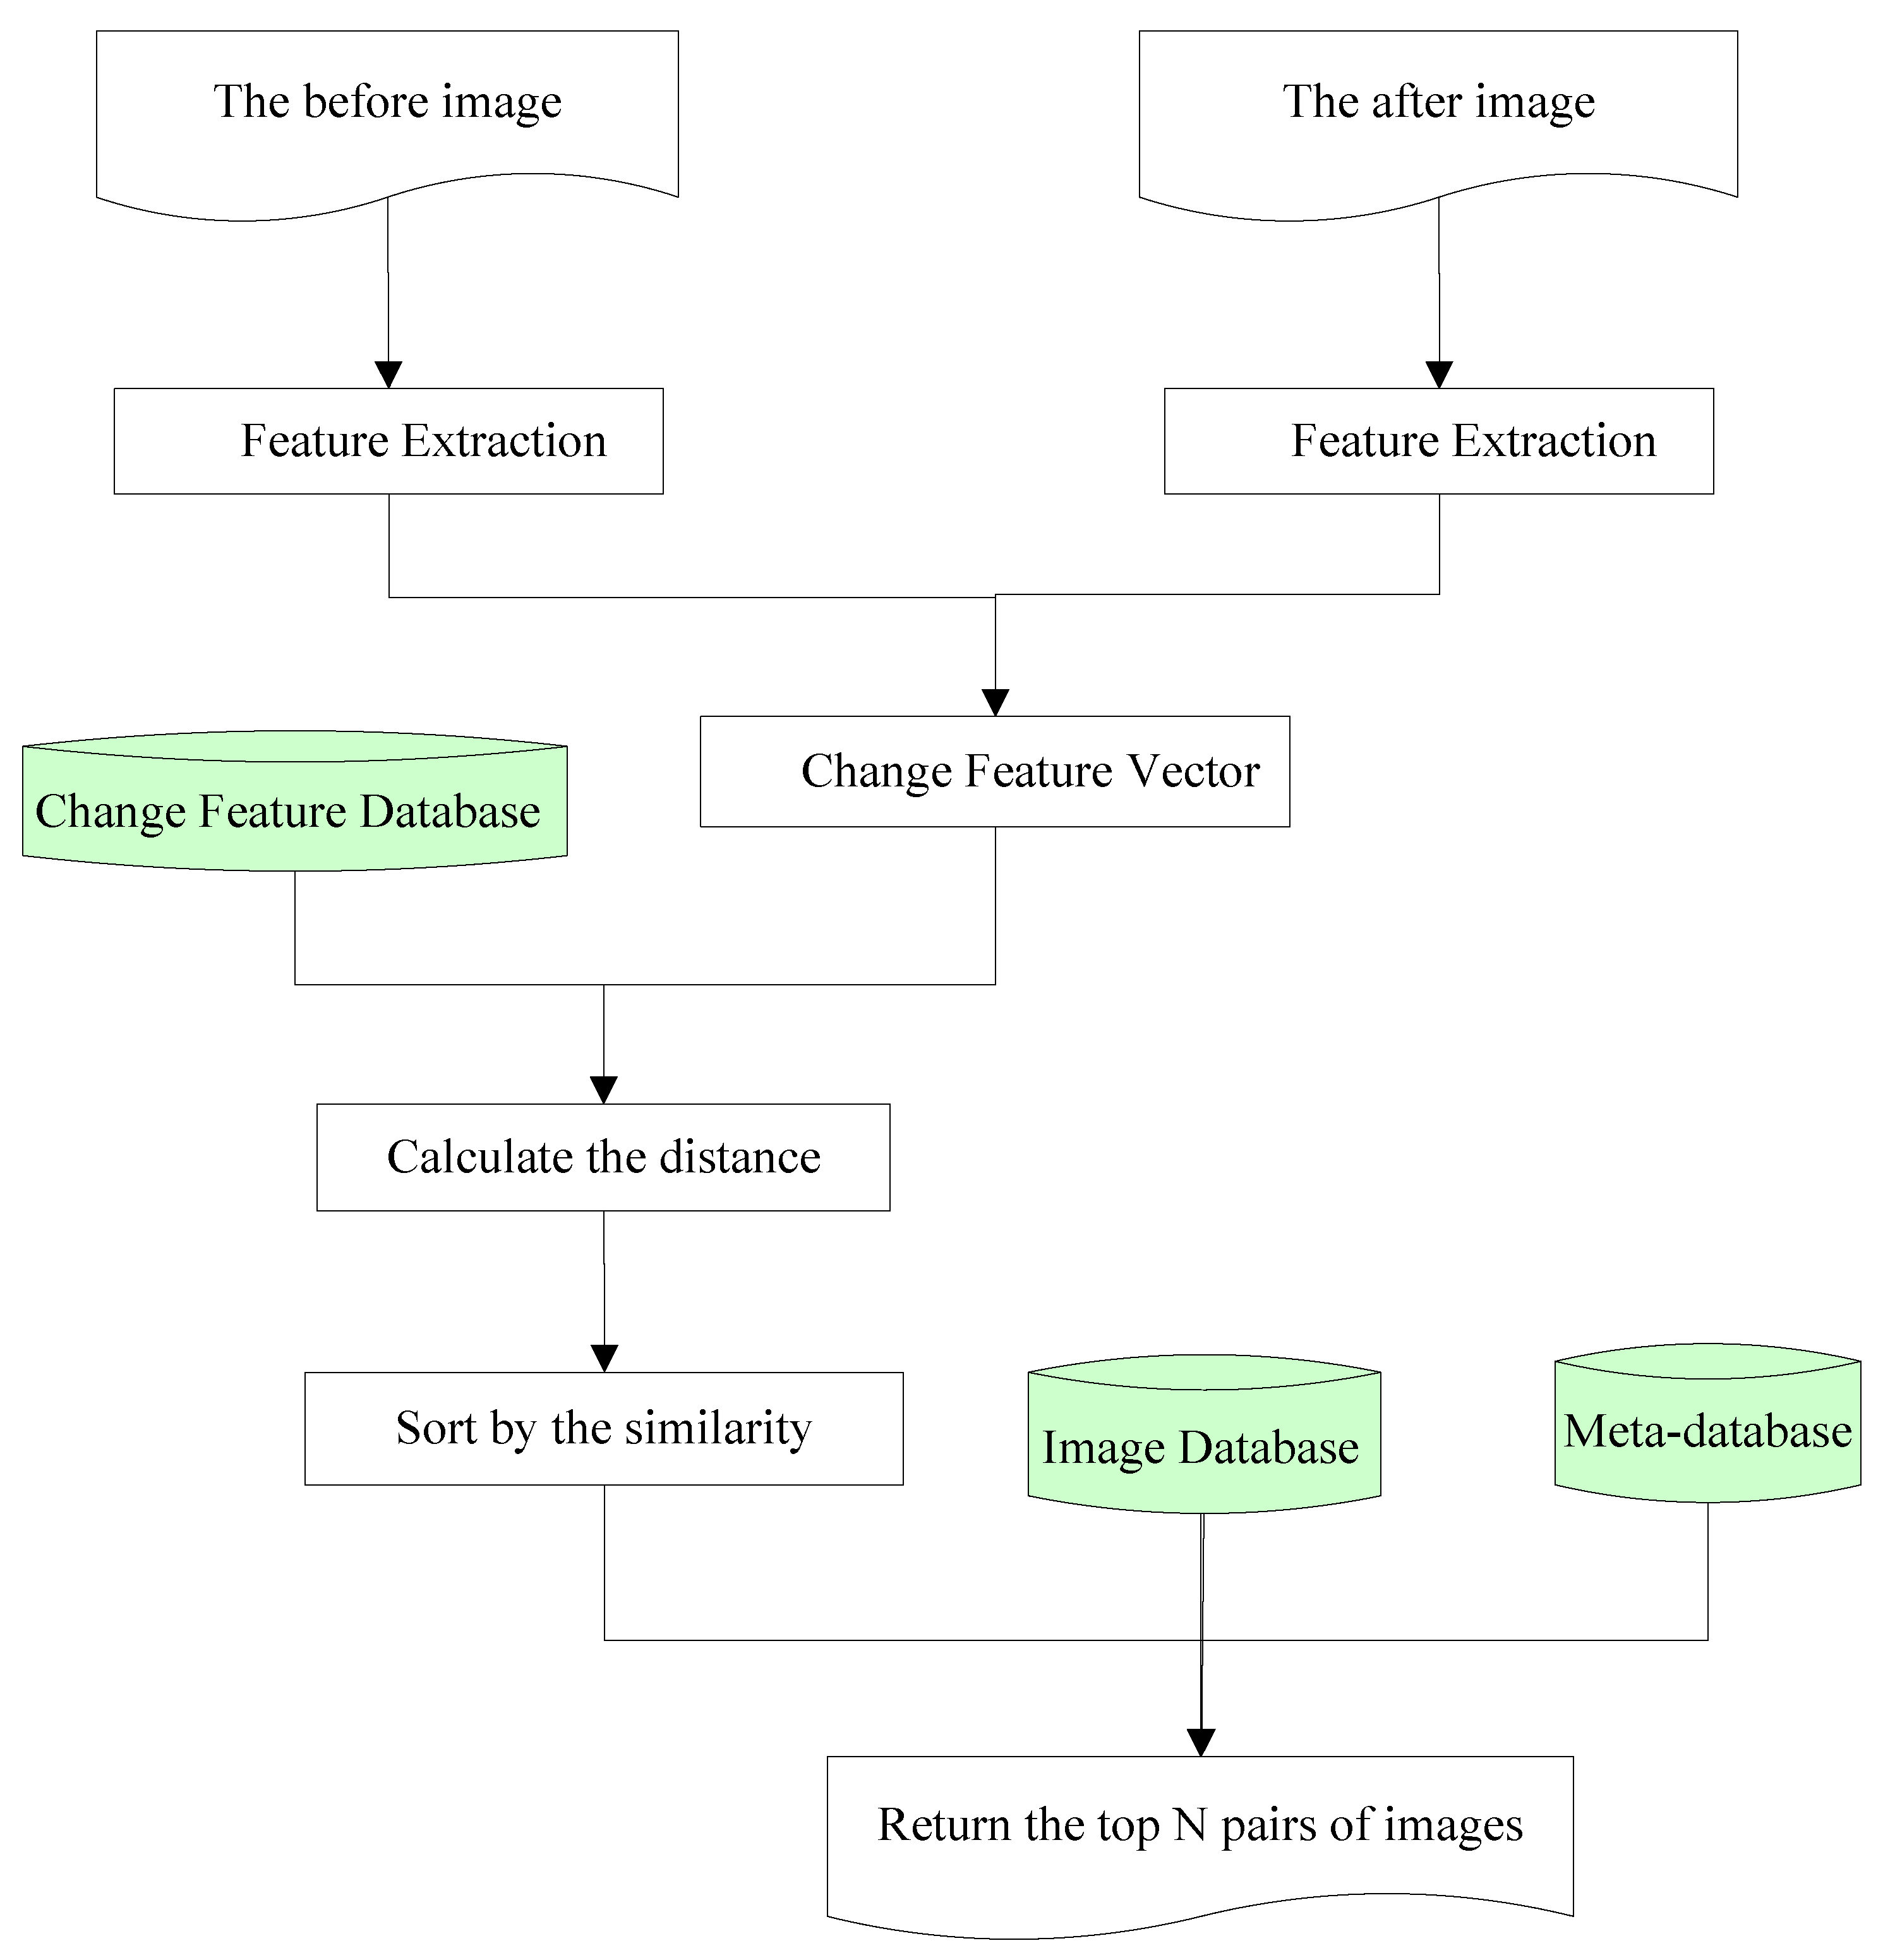
Section 3 describes the content-based remote sensing image change information retrieval model in detail. Section 4 presents the experimental results that were obtained by using a remote sensing imagery dataset. Conclusions are drawn in Section 5, where recommendations for future research are also given.

2. Data and Study Area

2.1. Study Area

The study area consisted of part of the city of Beijing, China (as shown in Figure 1). Due to the growth of the city and its outward expansion into the surrounding rural areas, the city of Beijing has received a lot of attention from researchers in recent years [24]. The study area itself included all of the urban, much of the suburban, and parts of the rural districts of Beijing. Beijing was selected as the study area because: (1) it made field visits easy; (2) as a national capital, Beijing (formerly romanized as Peking) is undergoing unprecedented urban growth; and, (3) the study area includes a wide variety of land-cover change types that provide many prime examples of the land-cover/land-use changes currently occurring in China. These changes include extensive urbanization, water resource changes and degradation of vegetation/cultivated land.

2.2. Landsat Data

We used Landsat 5 and Landsat 8 remote sensing images as the experimental dataset to evaluate the efficiency of our proposed new model. A total of 14 scenes acquired by Landsat 5 TM (11 images) and Landsat 8 (3 images) between 1996 and 2015 were used. 14 images with Worldwide Reference System (WRS) Path 123 and Row 032 and cloud cover of less than 80% were downloaded from the U.S. Geological Survey (http://glovis.usgs.gov/). More information about the images used can be seen in Table 1.

3. Methods

This study was a “prototype” for content-based remote sensing image change information retrieval using times-series of Landsat data of Beijing. Testing this approach for other regions with different environments will be a future research direction. The new model has three components: remote sensing image preprocessing and data archiving, content-based remote sensing image change information retrieval, and assessment criteria.

3.1. Remote Sensing Image Preprocessing and Data Archiving

The remote sensing image preprocessing and data archiving consisted of four parts: image preprocessing, image decomposition based on Quin+-tree [25], feature extraction from pairs of remote sensing images, and content-based remote sensing image change information retrieval.

3.1.1. Image Preprocessing

Image preprocessing for change information retrieval consists of two steps: false-color composition and coarse geographic registration. Because of the medium-low resolution of Landsat images and the small number of gray levels that the images contain, it is hard to distinguish between different ground objects using only the naked eye. Researchers have found that the human eye can recognize 30 to 40 gray-scale levels. However, the human eye is also sensitive to color, being able to distinguish between hundreds or even thousands of different colors. In order to improve the identification of natural and man-made objects, and especially to improve the effectiveness of the change information retrieval, false-color composition was used in this study. Near infrared (red), green (blue), and red (green) composition was adopted, as this is a traditional band combination useful for seeing changes in plant health [26]. This meant that Landsat bands 5, 4, and 3 were assigned to R (red), G (green), and B (blue) to make false-color composites. For the Landsat 8 imagery, bands 6, 5, and 4 were used for the corresponding colors. To maintain consistency, the false-color images derived from the Landsat 8 data were linearly scaled to 256 gray-scale levels, the same as for the Landsat-5 imagery.
The geographic registration and multi-temporal radiometric correction of images are important, if not indispensable, parts of change detection (CD) methods. For most traditional CD models, to avoid spurious results, sub-pixel registration accuracy is generally required as image displacement will cause false change areas to appear in the scene [3]. A higher geographic registration accuracy becomes even more important when images from different sensors with different resolutions are used. Although the change information detection and retrieval based on the proposed new model has a low registration accuracy requirement, it can be applied to compare the content (extracted features) of the before and after images of a pair. Landsat 5 and Landsat 8 data with the same resolution were used as the experimental data in this study and so no pre-processing (geographic registration and multi-temporal radiometric correction) was needed, which is not the case with classic change-detection methods. Also, the native geo-referencing of the L1T products was sufficient for the change information detection. However, the latitude and longitude of the corners of large image pairs had to be the same. Given the requirement of Gaussian coordinate transformation and the structure of the USGS data collection, it cannot be guaranteed that the corners of Landsat Level-1 products have the same latitudes and longitudes, even for the same path/row. Therefore, sub-regions (defined as having corners with Gaussian coordinates [418,564, 437,821; 539,737, 4,526,184]) were cropped from the original scenes. The images cropped from a pair of TM false-color images acquired in 2013 and 2015 are shown in Figure 2.

3.1.2. Image Decomposition Based on Quin+-Tree

The diversity and complexity of remote sensing images and the enormous data volume produce big challenges for the effective retrieval of information from remote sensing image databases. A satellite remote sensor collects ground surface data from a distance, meaning that the acquired image represents a broad scene that contains many ground objects. However, for many practical applications, users are often only interested in part of the scene or particular objects, such as those with military significance, infrastructure or those related to ground resources. Therefore, important small-scale objects and particular regions of remote sensing images attract more attention than the images as a whole. The result is that remote sensing images are almost always sliced into small pieces [7]. In this paper, the Quin+-tree [25] method was adopted to decompose scenes. A size of 128 × 128 pixels was considered an appropriate choice for the resulting pieces [25], which meant that each cropped image was sliced into 2288 small pieces.
As the cropped images covered the same areas after preprocessing, the small images with the same decomposition number acquired at different times also covered the same areas. Pairs of small images containing change information were thus formed. In this paper, we refer to the older image in the pair as the ‘before’ image and the more recent image as the ‘after’ image. The image pairs were organized by algorithm of full permutation of their data acquisition methods. For example, if there were three images with the same geographic location but different acquisition times, A, B and C, then there would be three pairs of small images, A->B, A->C and B->C. As a result, a total of 151,008 pairs of small images containing change information were formed.

3.1.3. Feature Extraction from Pairs of Remote Sensing Images

As color is insensitive to image rotation and translation, as well as to image size and direction, it is considered to be the most expressive visual feature and has been extensively studied. Texture is not sensitive to noise and it is rotation-invariant; in addition, textural patterns are scale-invariant [7,20]. Texture is, therefore, also regarded as one of the most important visual features, especially in terms of understanding the innate surface properties of a ground object and their relationship to the surrounding environment. In this study, therefore, three color features and four texture features were extracted from remote sensing images. In the color-feature extraction, the color correlogram [27], color moments, and HSV-HIST histogram [28], were used. In the texture-feature extraction, Fast wavelet [19], In-moments, GLCM, and Texture Spectrum [18] were adopted.
As shown in Table 2, a 423-dimensional feature vector was used to represent the content of one remote sensing image consisting of seven descriptors. In order to prevent numerical difficulties in the calculation and feature values in higher numerical ranges from dominating those in smaller numerical ranges, the seven categories of feature descriptors were normalized by being scaled to the range [0, 1]. An 846-dimensional change feature vector was then ordered by feature vector on the basis of the before and after images in a pair.

3.1.4. Remote Sensing Image Preprocessing and Data Archiving

In order to allow complete change information results to be successfully retrieved, each new remote sensing scene had to be preprocessed and archived to the database. The main steps in the remote sensing image preprocessing and data archiving procedure are shown in Figure 3.
The main steps in the preprocessing and archiving are as follows.
  • Parsing the metadata from the scene itself and any accompanying metadata files and archiving the scene and the metadata to the database
  • Image preprocessing, including false-color composition, and coarse geographic registration based on the scene’s metadata
  • Image decomposition based on Quin+-tree. The remote sensing images are sliced into 128 × 128 pixel pieces and the pieces are then archived to the image database
  • Extracting the feature vector for each image piece. The values are scaled to the range [0, 1] and the feature vectors archived to the feature database
  • Forming pairs of change feature vectors. Overlapping images are registered to pairs and then the change feature vectors are organized so that the more recent image comes after the older one in each pair. Finally, the change feature vectors are archived to the change feature database.

3.2. Content-Based Remote Sensing Image Change Information Retrieval

The main procedures included in the content-based remote sensing image change information retrieval model are shown in Figure 4.
As shown in Figure 4, the main processing steps in the new change model are as follows.
  • Input the target pair of query images—the before and after images.
  • Extract the feature vectors for both images in the target pair and scale the values to the range [0, 1].
  • Form the target change feature vector of the target pair. The change feature vectors are organized so that the more recent image comes after the older one in each pair.
  • Calculate the distance between the change feature vector of the target pair of images and the change feature database. The Euclidean distance is used for this.
  • Sort the similarity between the change feature vector of the target pair of images and the change feature database.
  • Return the top N similar pairs of images. In our experiment, the value of N was 12.

3.3. Assessment Criteria

Evaluation of the retrieval performance is a crucial step in content-based remote sensing image retrieval. Many different methods for measuring the performance of a system have been created and used by researchers. We used the most common evaluation methods, namely recall (or sensitivity) and precision (or specificity).

3.3.1. Coverage Ratio

Traditionally, the recall, precision, and recall-precision break-even point have been the methods most commonly used to assess the effectiveness of retrieval models. However, Schapire et al. [29] put forward very reasonable arguments as to why these conventional evaluation metrics are not very informative for users of a CBIR system. In particular, the recall index cannot be calculated by the user until all relevant images have been seen by the user, which is not possible except by means of an exhaustive search. As the user cannot know how well the image retrieval search is going [7], the coverage ratio, which can be applied to remote sensing image retrieval, was used as the performance metric in this study. This ratio can be calculated as shown in Equation (1) below:
cov e r a g e   r a t i o = { n R i 10 i ( 10 i R ) , n R i R ( 10 i > R )
where R is the total number of relevant images in the image database and n R i is the number of relevant images returned in the top 10i images. When the value of 10i < R, the coverage ratio is the same as the precision; when the value of 10i > R, the coverage ratio is the same as the recall. In this study, i was set to {1, 2, 3, 4, 5, 10, 20}.

3.3.2. Mean Average Precision

Precision and recall-precision are single-value metrics that are based on the whole set of images returned by the retrieval system. For systems that return a ranked image sequence, it is desirable to also consider the order in which the returned images are presented. The average precision index ranks the more relevant images more highly. This index is equal to the average of the precisions calculated for each of the relevant images in the ranked sequence. The mean average precision for a set of queries is the mean of the average precision scores for each query. It is calculated as
M a p = 1 N s r = 1 N s ρ s ρ r
where r is the rank, Nr denotes the number of relevant images returned, Ns represents the number of real relevant images returned, ρr is the rank number in the relevant images that are returned, and ρs is the rank number in the real relevant images that are returned.

4. Results

Our model was implemented within the Matlab2015a environment. The empirical evaluation was performed on a Dell3G PC with a Win7 operating system. In order to analyze the effectiveness of the new model that used multiple features, our experiments were divided into three groups. Group 1 described the remote sensing images using nine kinds of features to compare the change information retrieval performance using the multiple features together with the other features described in Section 4.1. Group 2 compared the retrieval performances obtained using different features for different types of ground object changes. Group 3 showed change information retrieval examples using the content-based remote sensing image change information retrieval model with different features.
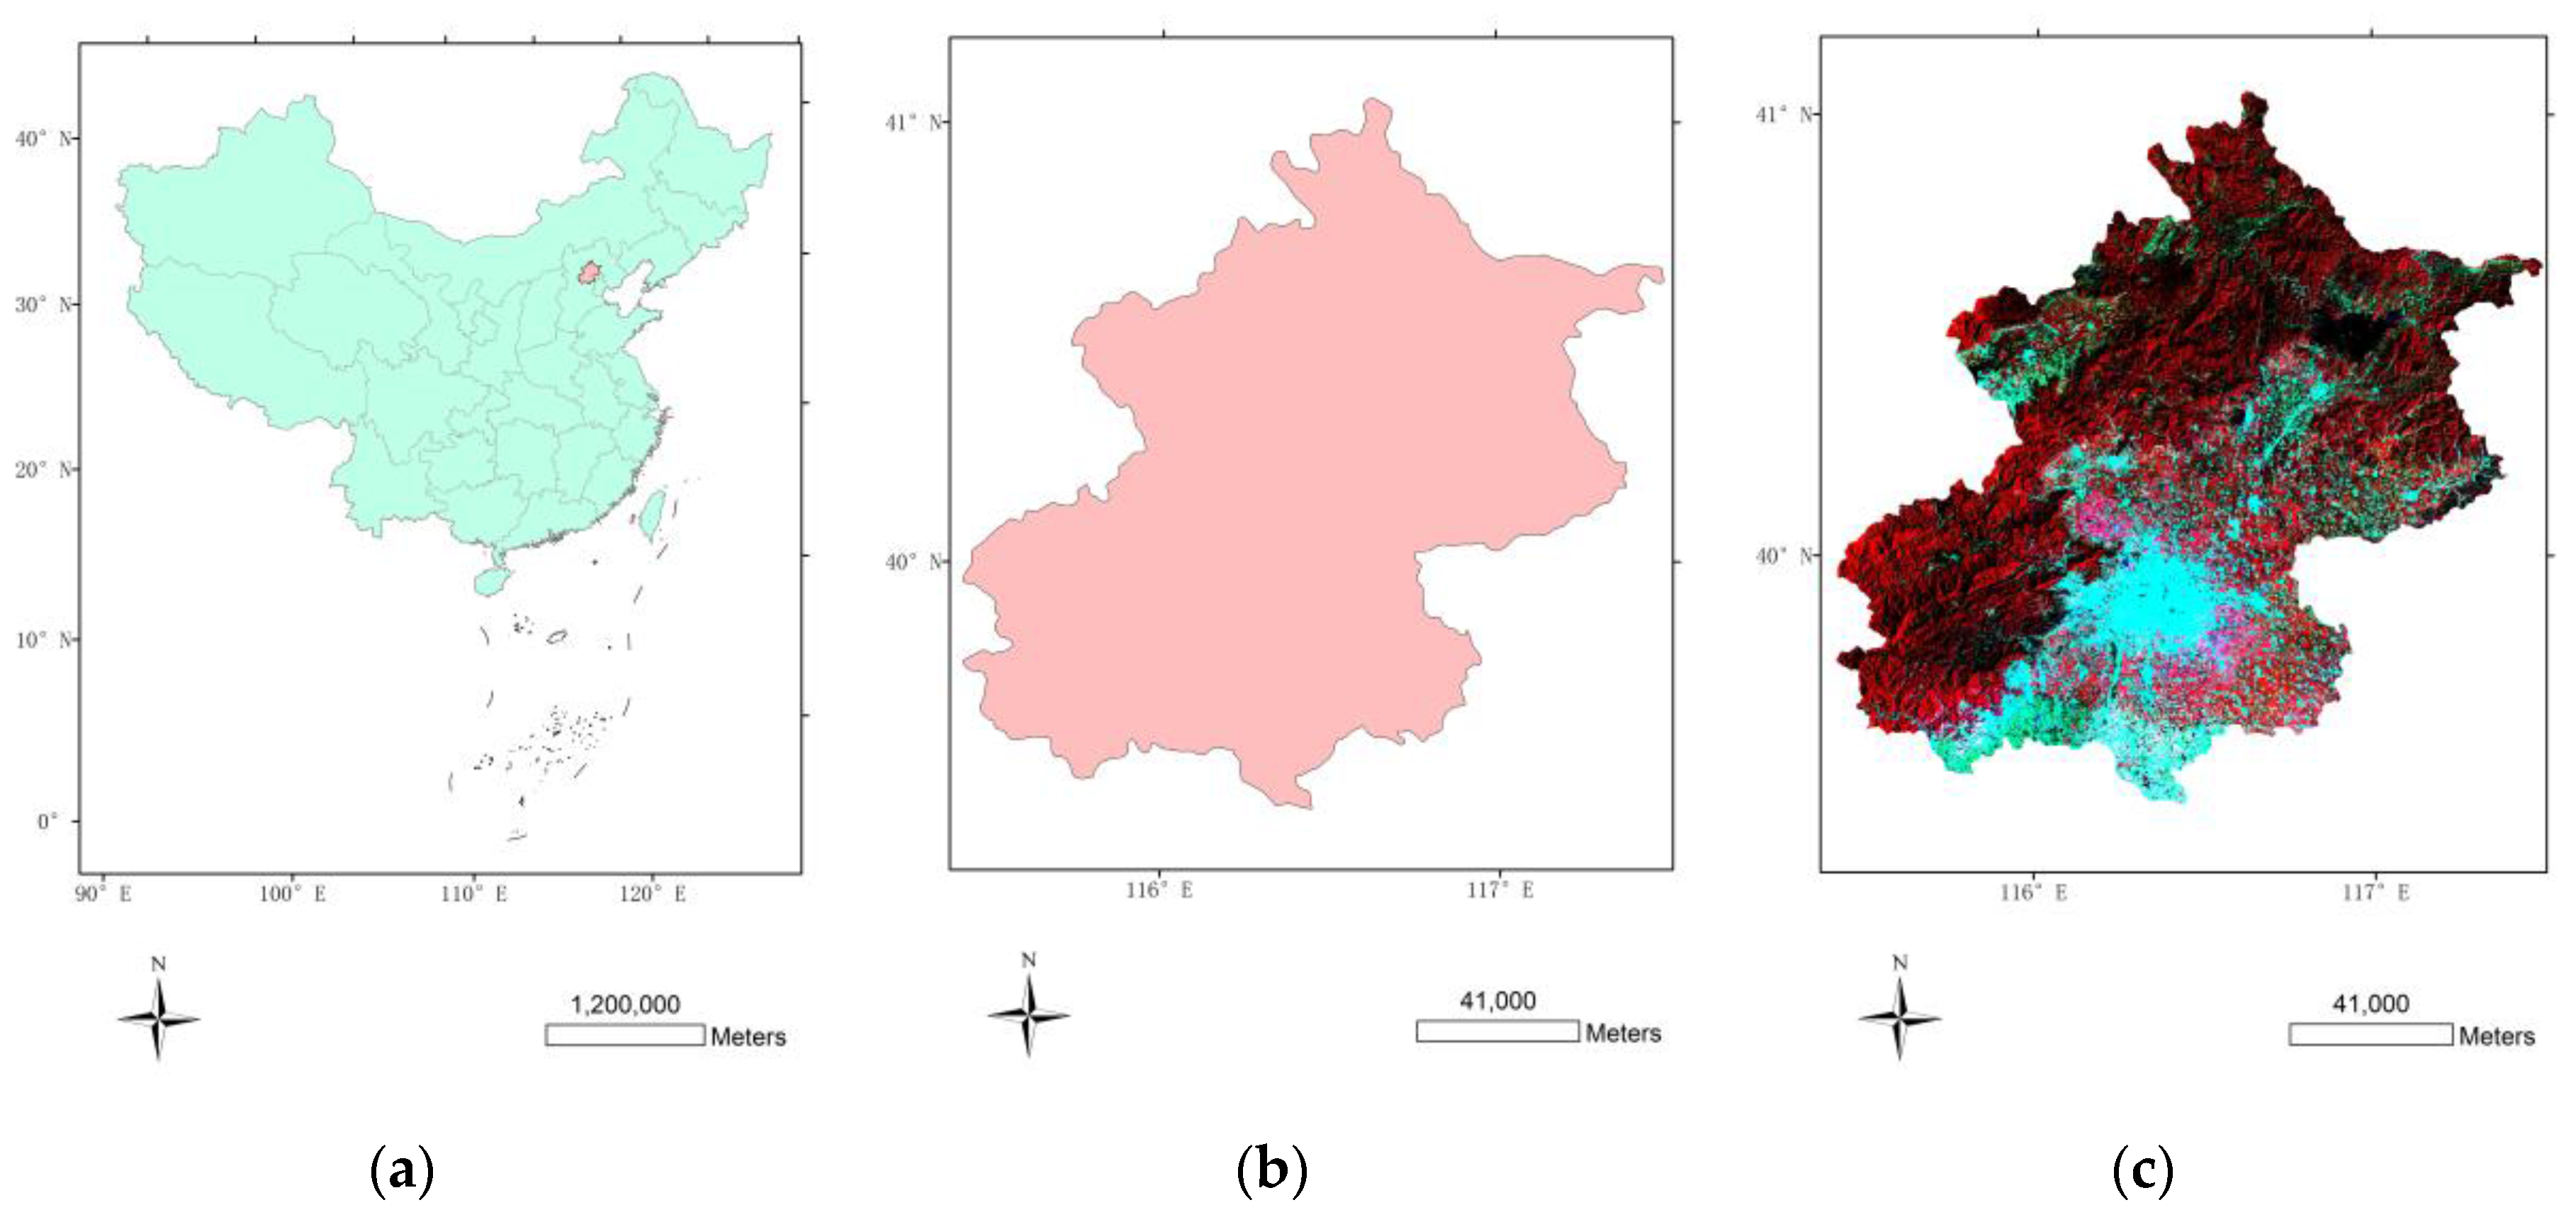
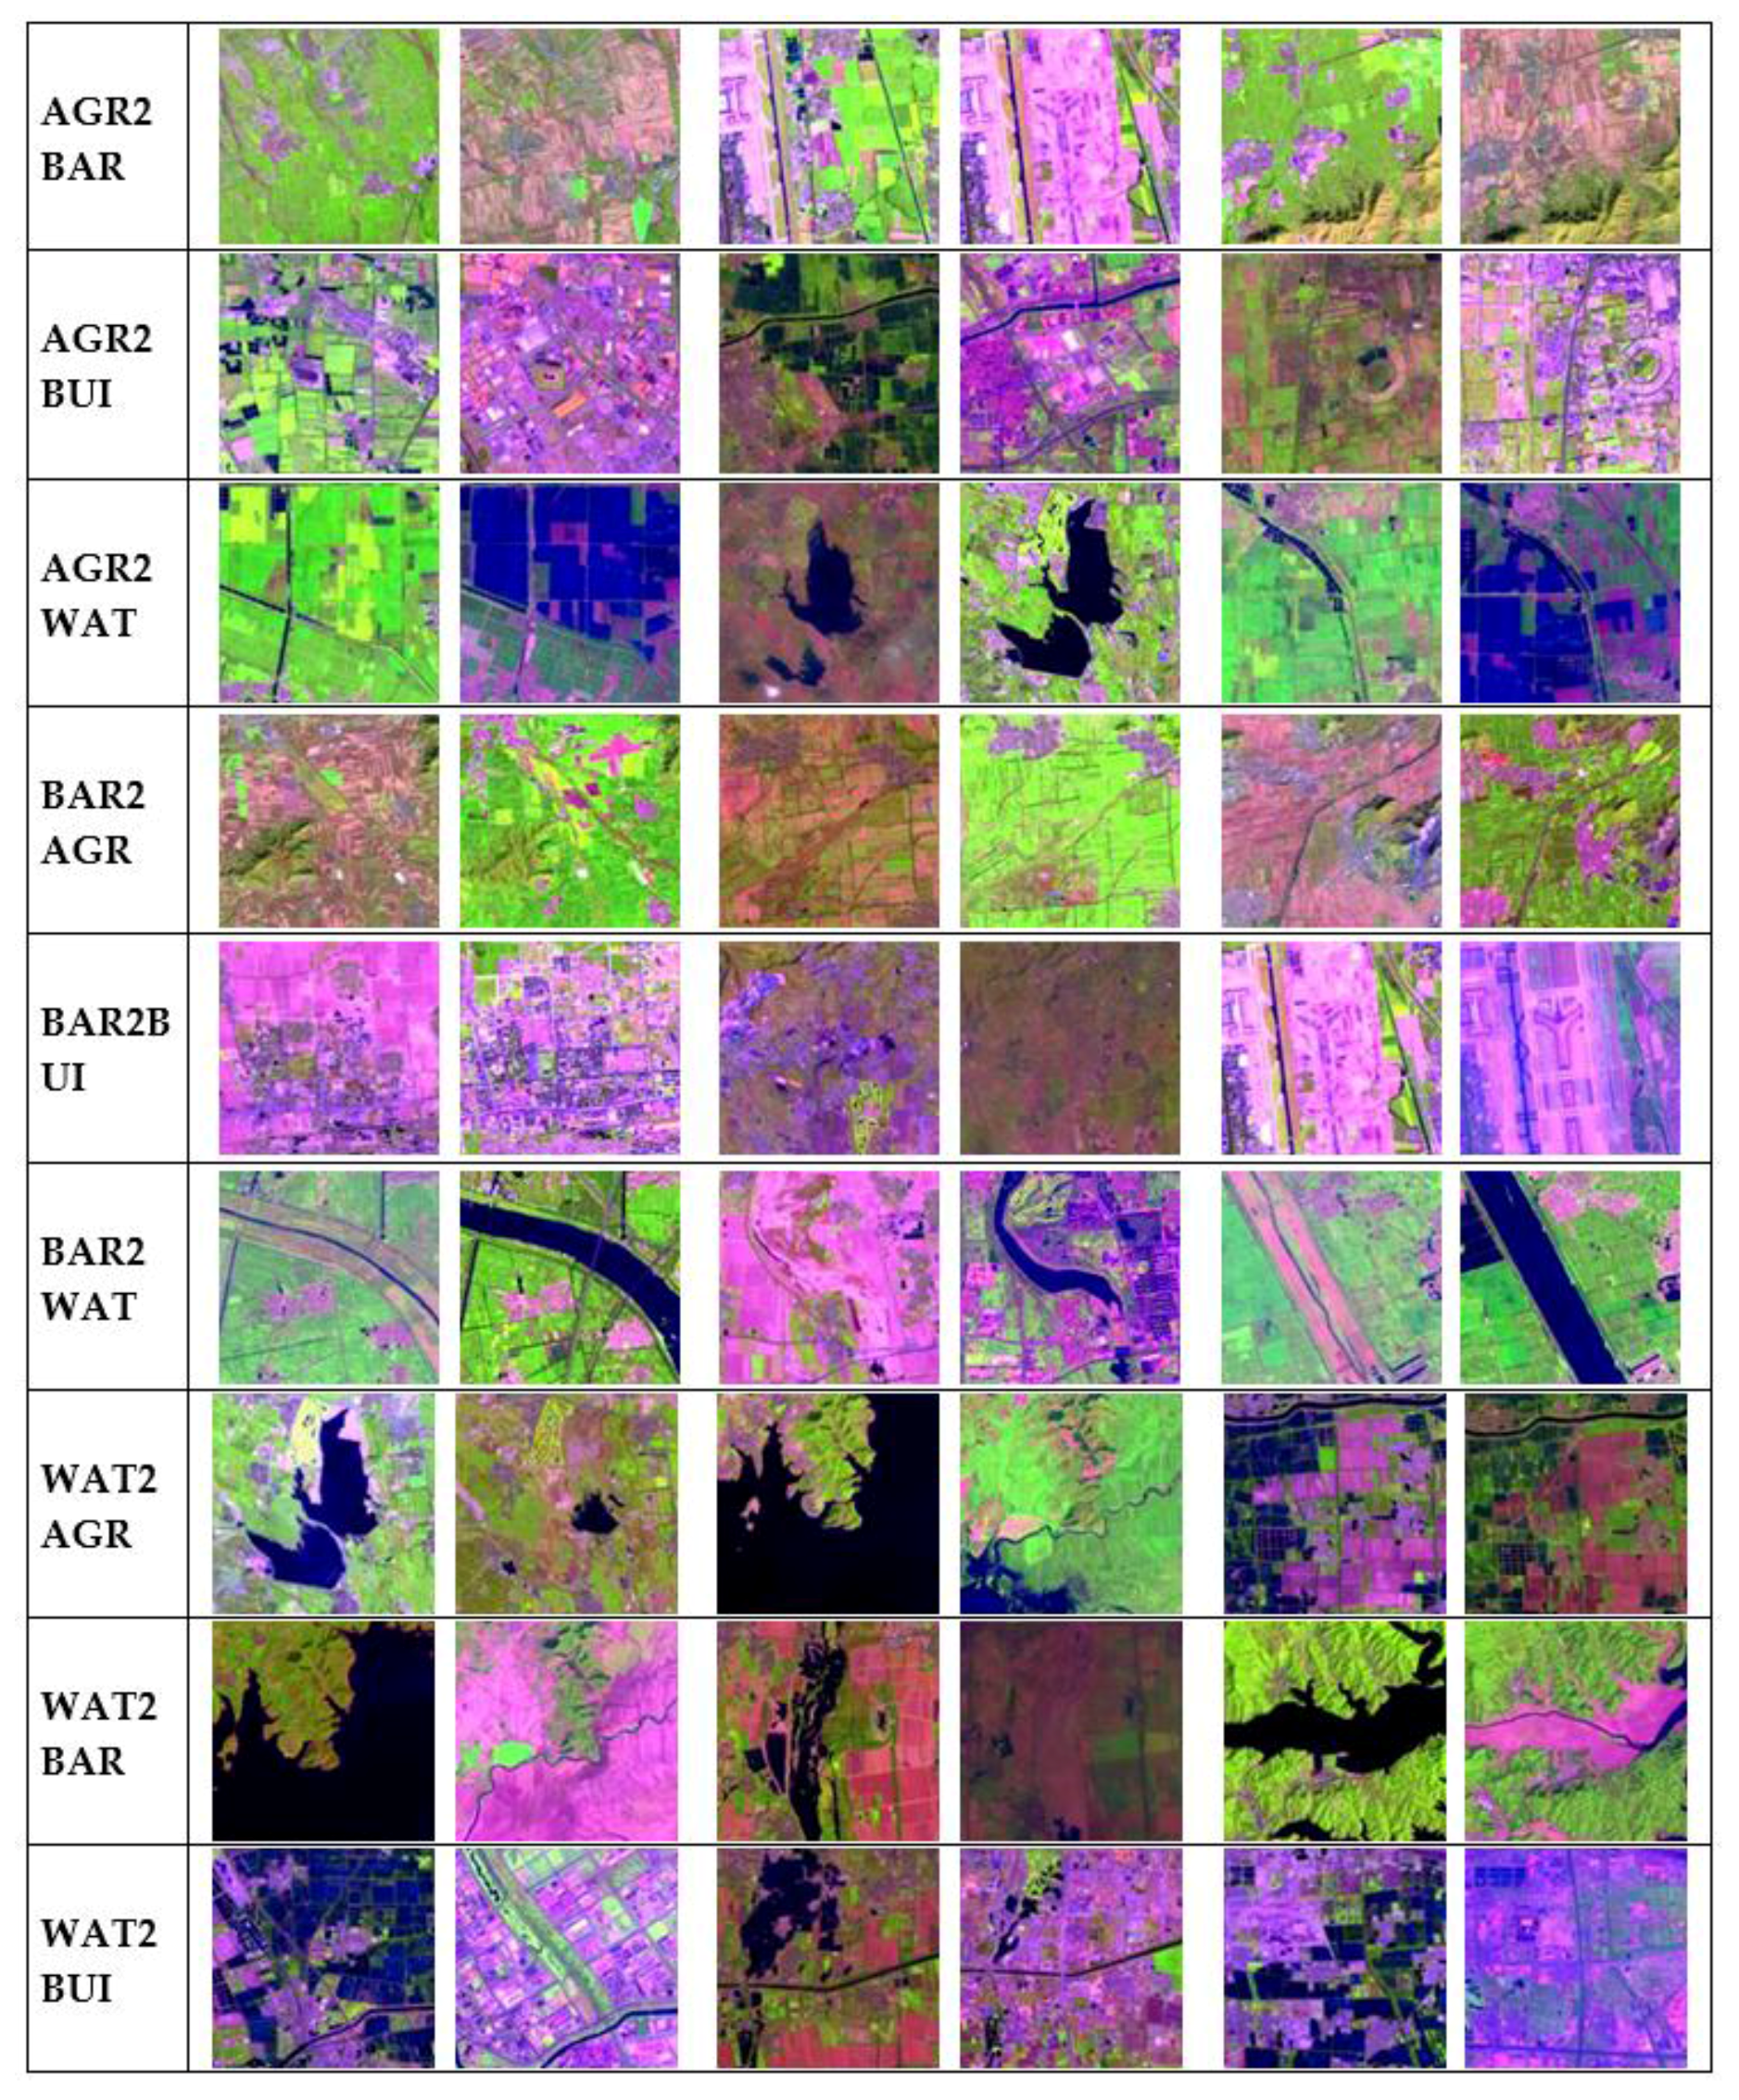
In order to evaluate the efficiency of our proposed algorithm, the 14 Landsat images were sliced into 128 × 128 pixel pieces. The small images were then manually categorized into four classes, including agricultural land/vegetation (AGR), bare land (BAR), built-up land (BUI), and water (WAT). 1192 pairs of images corresponding to nine classes of ground object changes were also selected. These included AGR2BAR (Agricultural Land/Vegetation to Bare Land), AGR2BUI (Agricultural Land/Vegetation to Built-up Land), AGR2WAT (Agricultural Land/Vegetation to Water), BAR2AGR (Bare Land to Agricultural Land/Vegetation), BAR2BUI (Bare Land to Built-up Land), BAR2WAT (Bare Land to Water), WAT2AGR (Water to Agricultural Land/Vegetation), WAT2BAR (Water to Bare Land), and WAT2BUI (Water to Built-up Land), and thus formed the experimental remote sensing image database. There were 161, 295, 67, 194, 44, 42, 149, 103 and 137 pairs of images, respectively, in the classes listed. Figure 5 shows three sample pairs of images for each of the nine change classes. It should be noted that Beijing has undergone unprecedented urban growth in the past three decades and the length of time between the demolition of buildings and the construction of new ones is very short. In addition, the spatial resolution of the Landsat satellites is relatively low. This means that it is difficult to capture the change from built-up land to other ground objects and so there were no data corresponding to the changes BUI2AGR (Built-up Land to Agricultural Land/Vegetation), BUI2BAR (Built-up Land to Bare Land), and BUI2WAT (Built-up Land to Water).

4.1. Comparision of Different Features

In the unified framework of our proposed content-based remote sensing image change information retrieval method, different feature combinations were tested for demonstrating the effectiveness of combined color and texture features. In this experiment, the Color correlogram, Color moments, HSV-HIST, Fast wavelet, In-moments, GLCM, and Texture Spectrum were exploited to represent the change content. Multi-Color, Multi-Texture, and Multi-all produce hybrid multiple features by combining three categories of color feature, four categories of texture feature, and seven categories of color and texture features, respectively. Altogether, nine comparison tests were made.
Table 3 and Table 4 show the coverage ratios and also the values of the mean average precision that were obtained when i was set to {1, 2, 3, 4, 5, 10, 20} for 20 trials per category, resulting in 180 trials of the remote sensing image database. As demonstrated in Table 3 and Table 4, of the features tested, the change information retrieval results that were based on the Color Moments feature produced the highest coverage ratios and mean average precisions. For Multi-Texture, the coverage ratios and mean average precisions were higher than those obtained for single texture features. Better results were also obtained using Multi-Color than for any of the single-color features except Color Moments. In addition, the values obtained using Multi-all were higher than those for Multi-Color and Multi-Texture. It can also be seen that the coverage rate (Table 3) and mean average precision (Table 4) both decrease as i increases. This means that change information retrieval based on CBIR is effective and always gives the top ranking to the most relevant change images pairs.
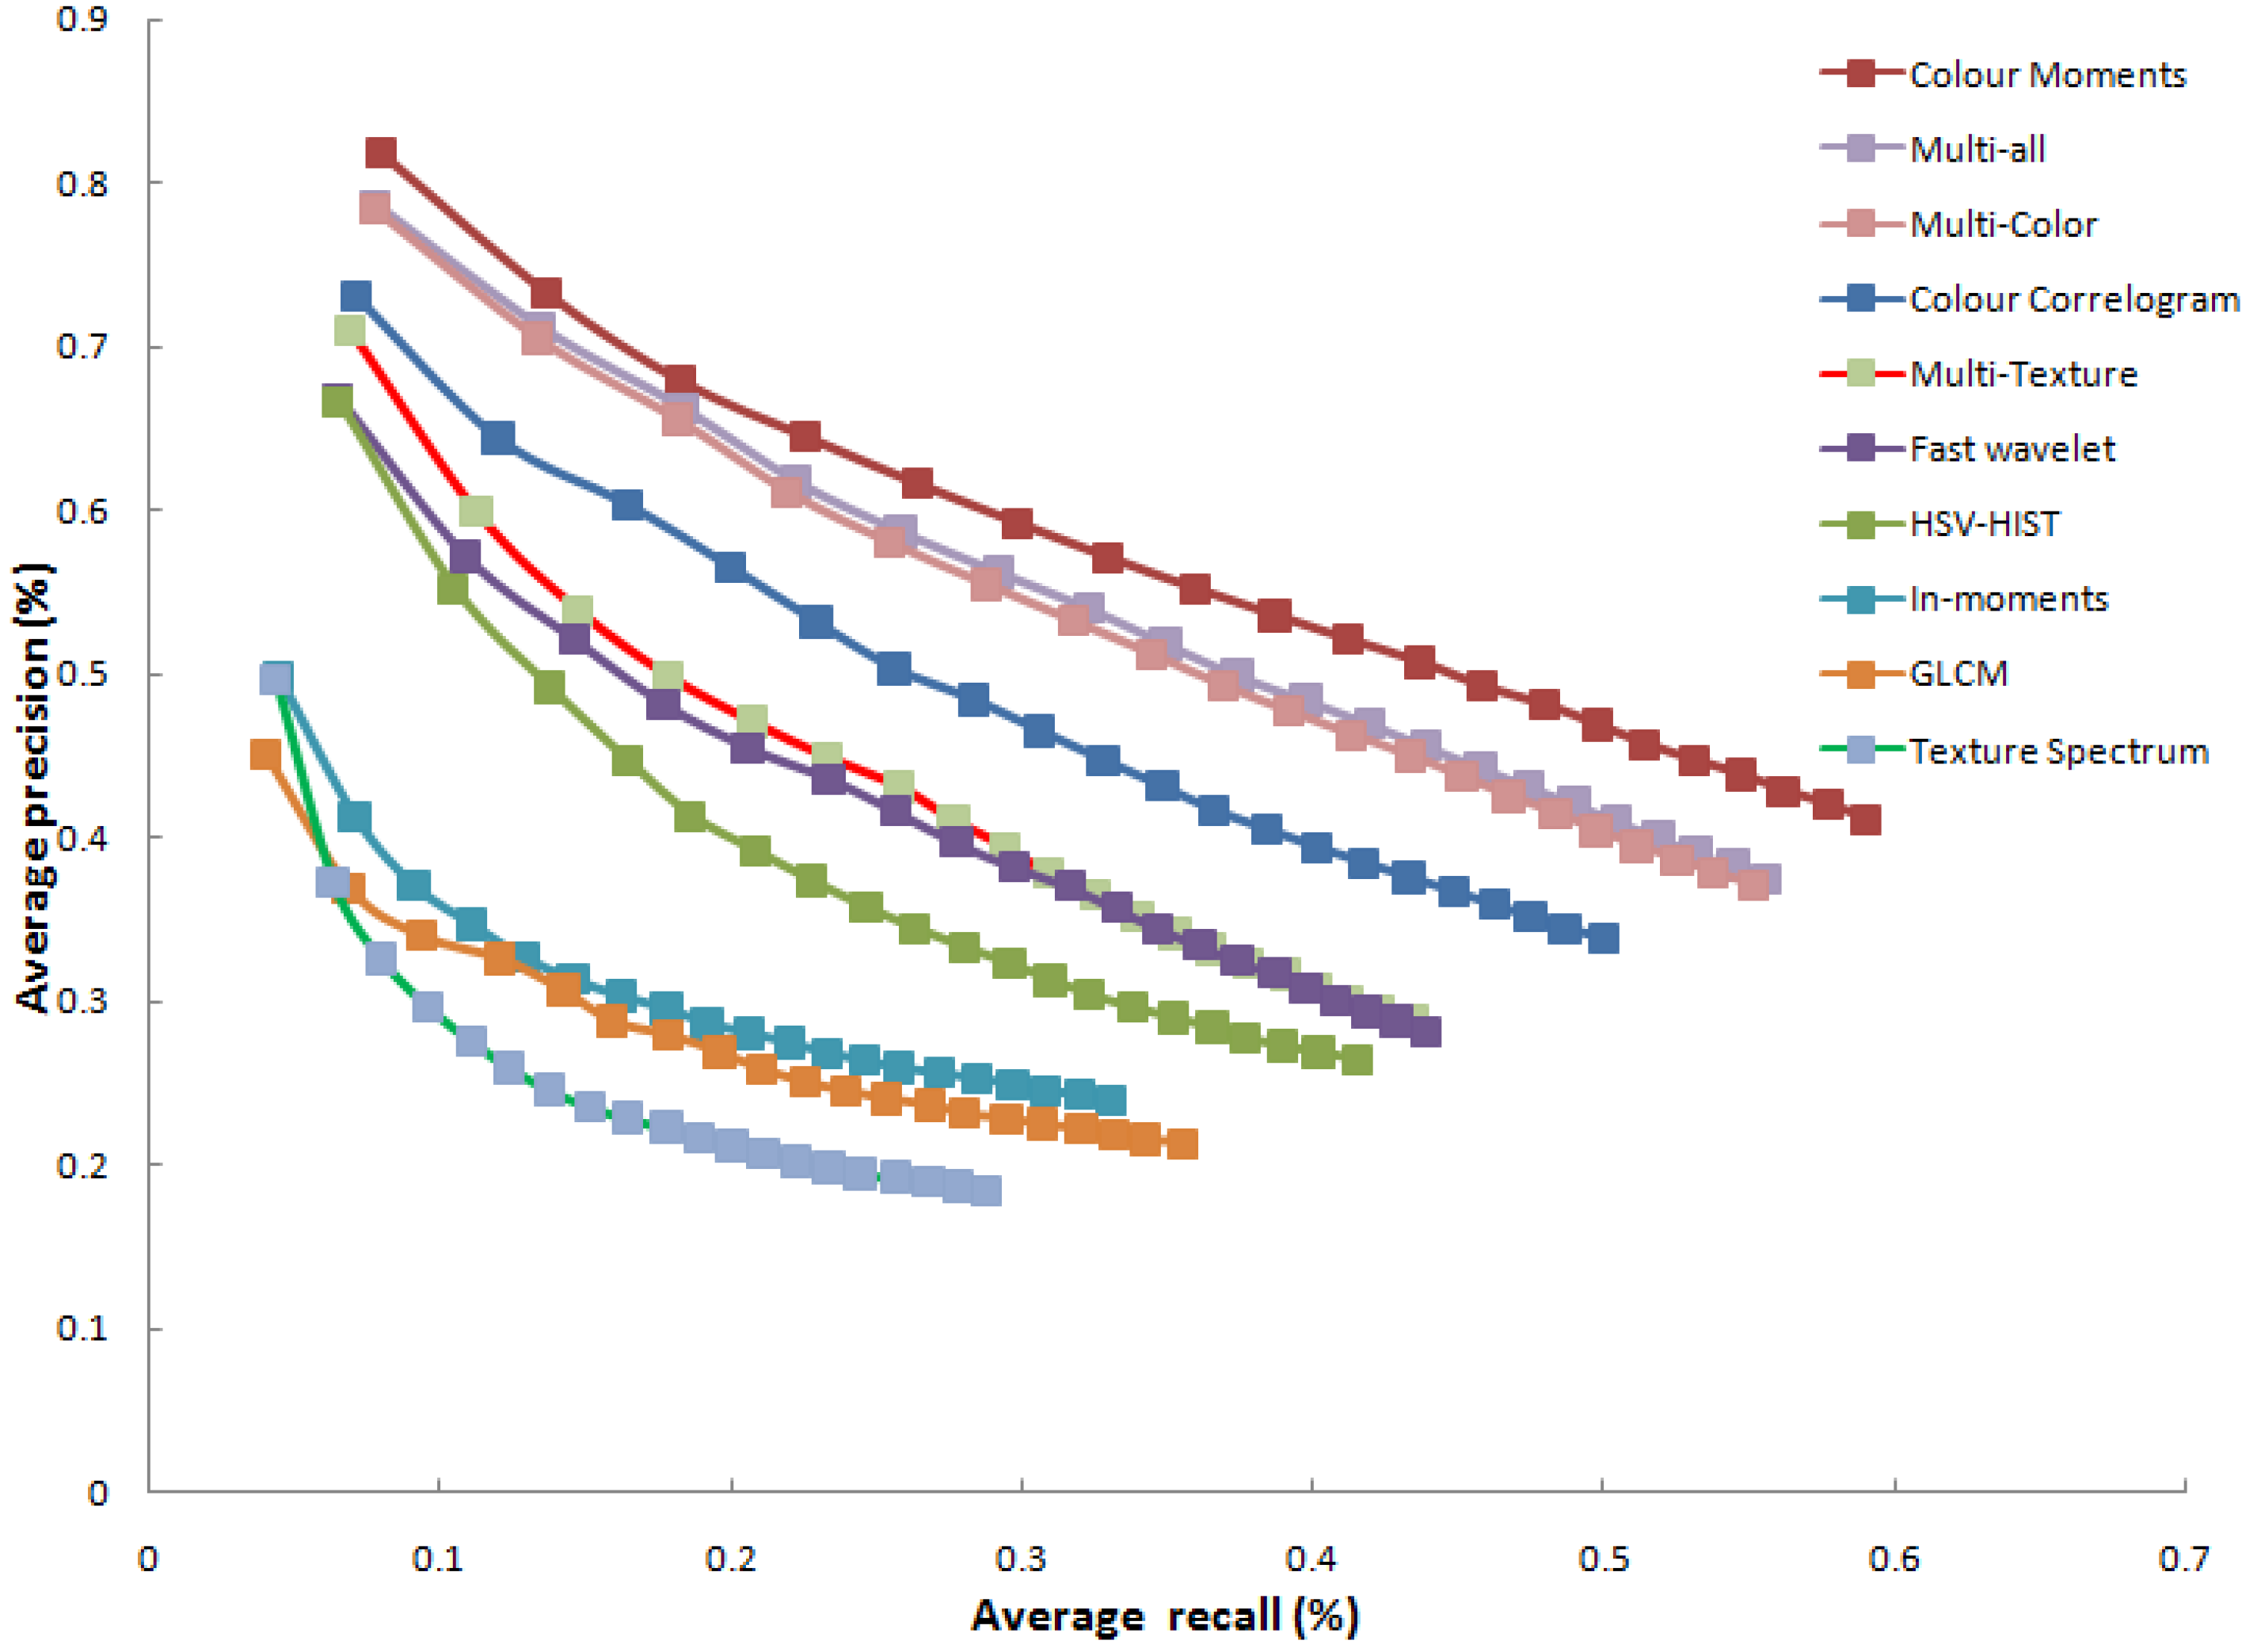
Figure 6 shows the precision-recall graphs that were obtained for the different methods using 20 trials per category (giving at total of 180 trials) when i was set to {1, 2, 3, ..., 20}. As shown in Figure 6, the change information retrieval results based on the Color Moments method again outperformed the other methods in terms of the precision-to-recall ratio. Also, the results based on Multi-all were better than those for the other eight methods.
It is important to note that the change information retrieval results based on the Color Moments method had the highest coverage ratios and mean average precision values and also the best performance in terms of precision-to-recall ratio. However, this does not mean that the use of this method will necessarily produce good results using other databases as a single feature cannot always express the image content precisely and perfectly. The time needed for the feature extraction was 2.13 s. The retrieval time was dependent on the scale of data—in this study, it was about 3.5 s. However, these times were achieved without using big data processing methods, such as parallel computing.

4.2. Comparative Performance of Different Features for Different Retrieval Cases

The change information retrieval performance based on different features was evaluated for the different ground object change classes. Table 5 and Table 6 show the coverage ratios and mean average precisions obtained when i was set to 2 for 20 trials for each class of change in ground objects in the remote sensing image database. According to Table 5 and Table 6, the retrieval results based on different features were different for different change classes. The results obtained using the Color Moments feature still had good coverage ratios and mean average precisions in most cases. However, for the AGR2WAT class, the results obtained using HSV-HIST, Multi-color, and Multi-all were all better than those obtained using Color Moments. For the BAR2WAT class, the highest coverage ratios and mean average precisions were obtained using the Fast wavelet method. For Multi-all, the coverage ratios and mean average precisions were higher than those obtained for any other single feature or combined features, except for Color Moments.
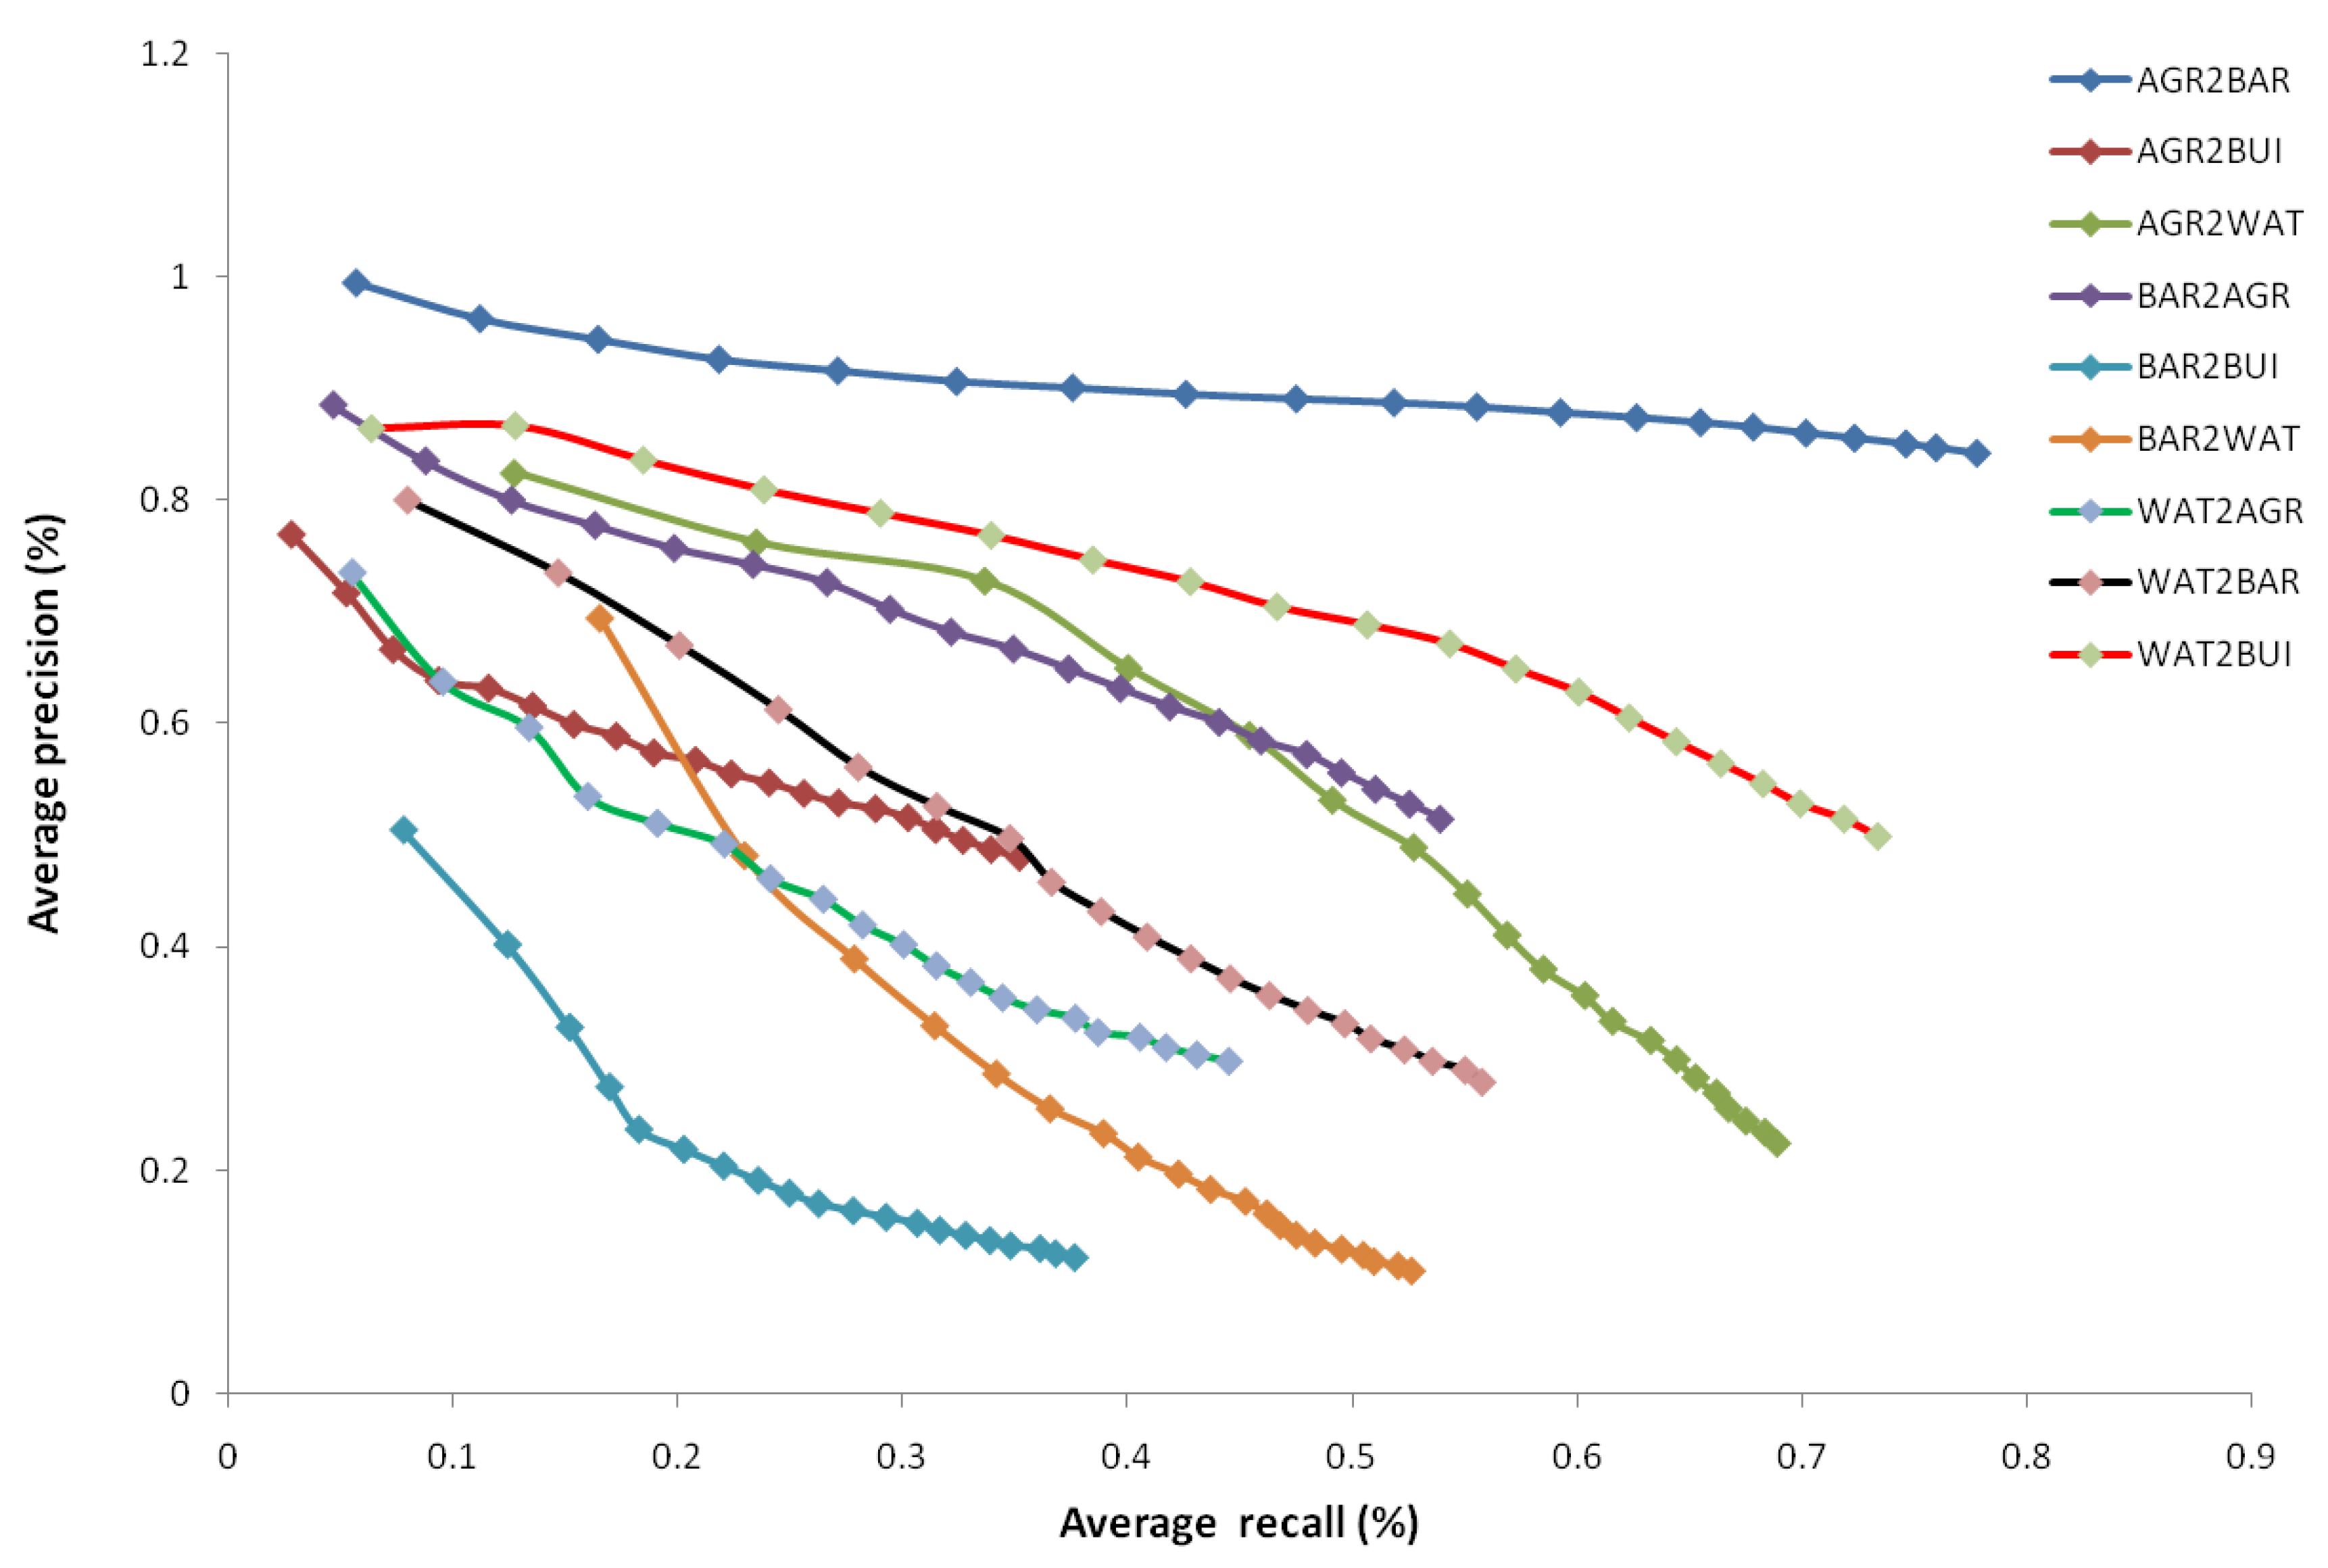
Figure 7 shows the precision-recall graphs for different ground-change classes that were obtained using the Multi-all method and 20 trials per category. i was set to {1, 2, 3, ..., 20}, resulting in a total of 180 trials using the remote image database. As shown in Figure 7, using this method, the change information retrieval results for the AGR2BAR change class were the best; good results were also obtained for WAT2BUI, BAR2AGR, AGR2WAT, and WAT2BAR. The worst performance was for the BAR2BUI change class. These results show that it is hard to attain satisfactory retrieval results for all change classes using a single combined-feature model. In future work, to bridge the semantic gap between the content of low-level and high-level features, some pre-learning mechanism and relevance feedback (RF) methods should be introduced to improve the retrieval performance for different ground-change classes.

4.3. Search Examples

To illustrate the effectiveness of our approach for querying target pairs of remote sensing images, we provide here some screenshots obtained from our new data service system using the remote sensing images archive. 
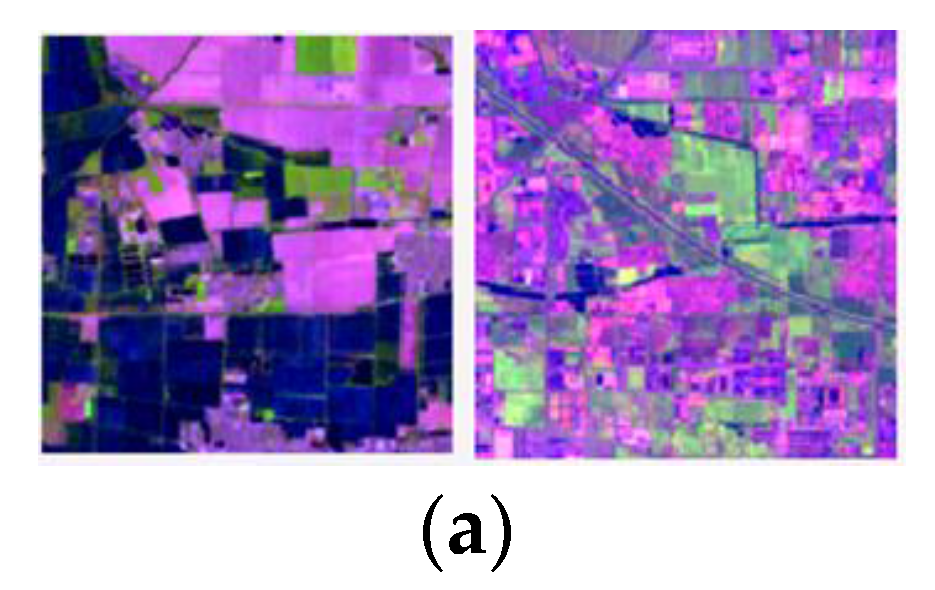
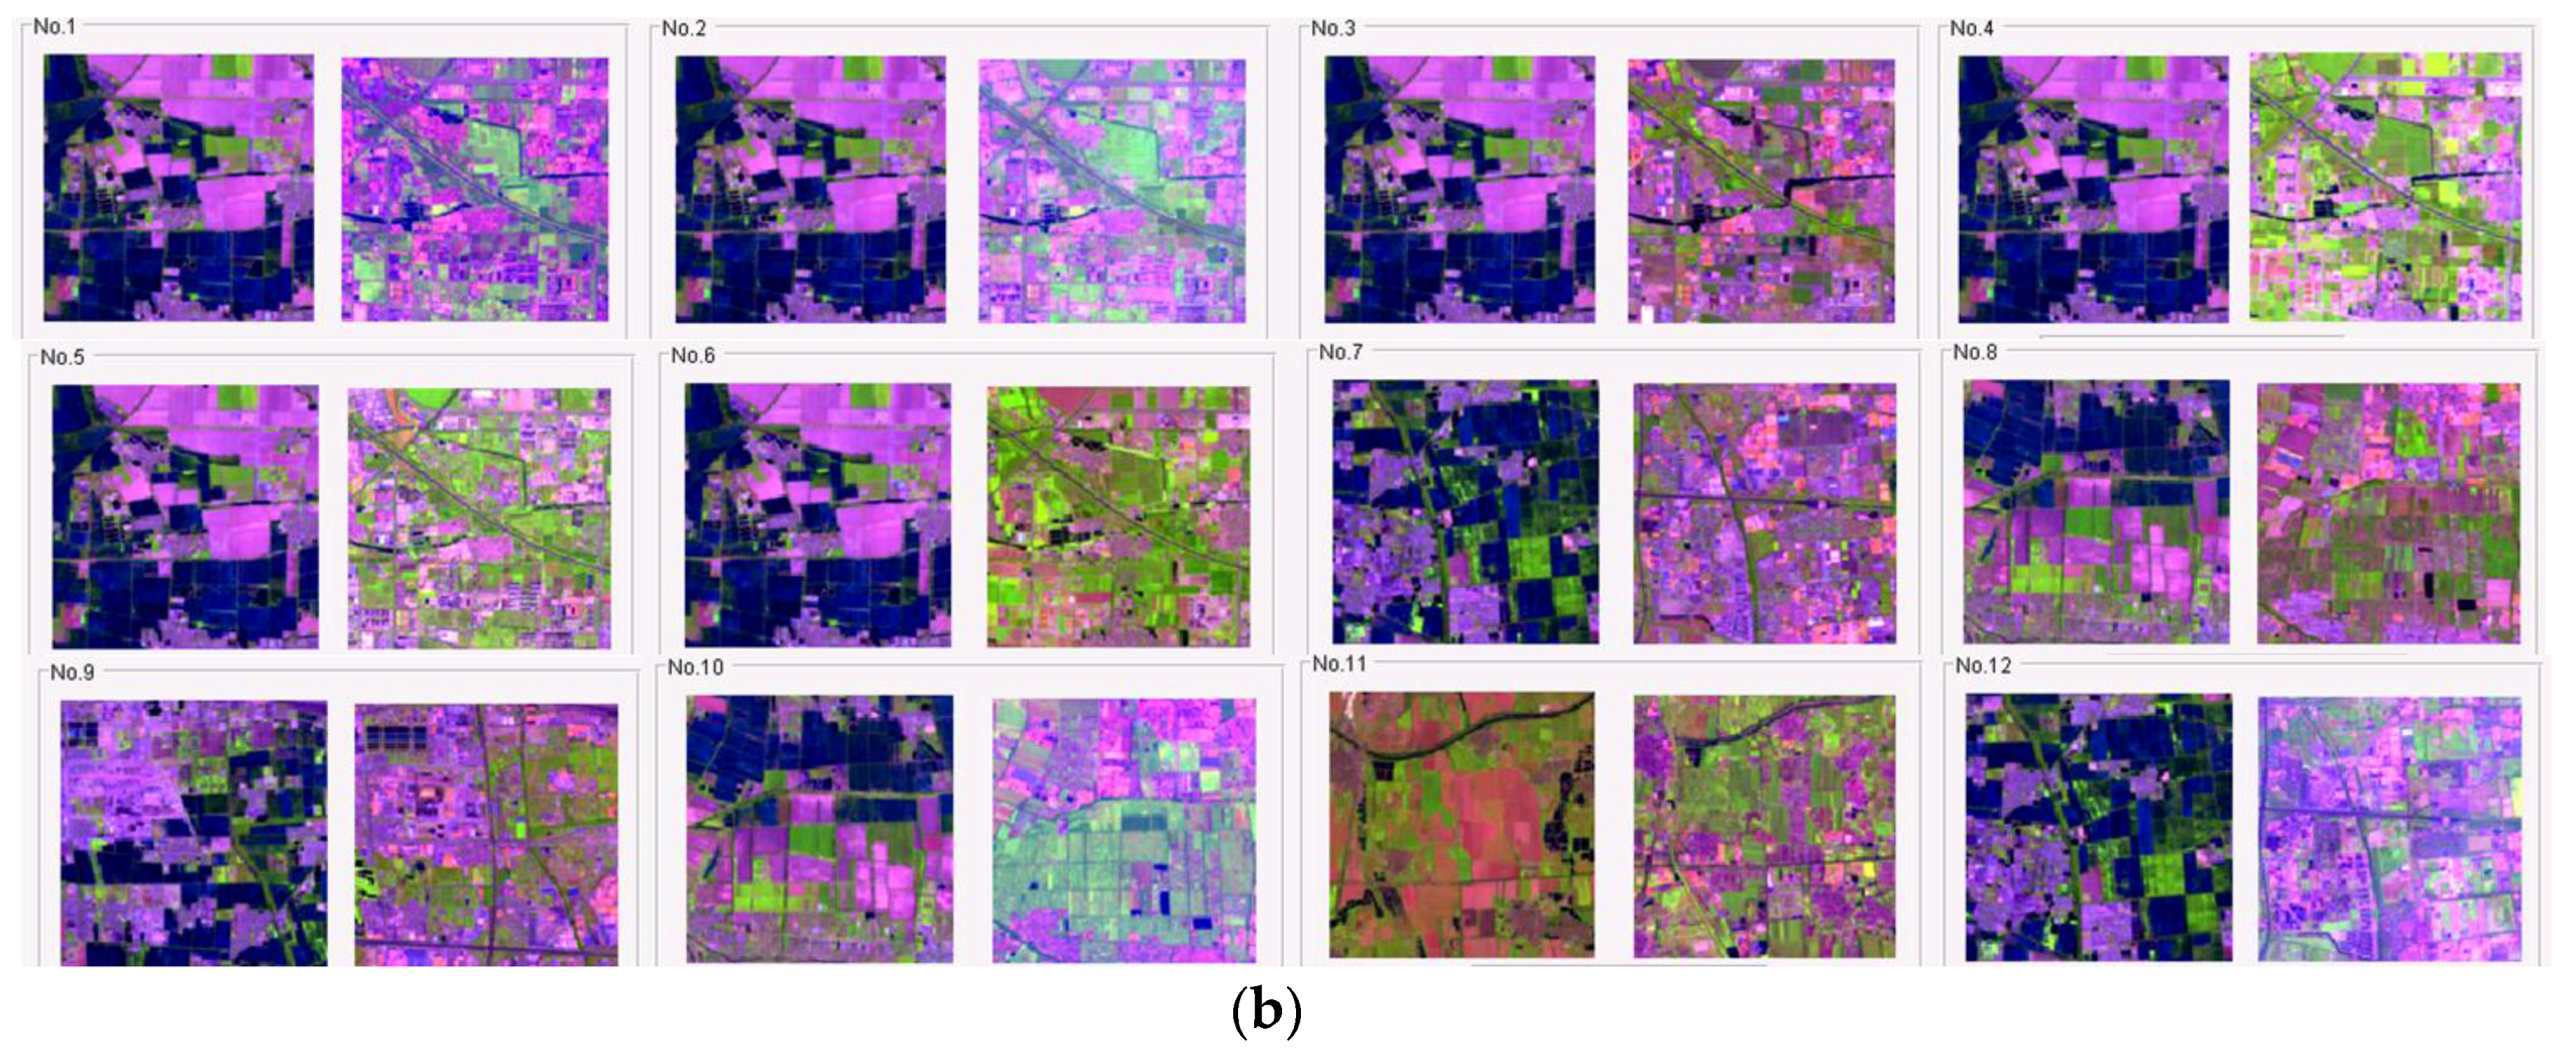
Figure 8, shows a typical query pair of “WAT2BUI” images (Figure 8a) and the corresponding images retrieved using the proposed method based on the Multi-all feature. The order of the retrieval of the image pairs was as shown in Figure 8b. Figure 9 shows a typical query pair of “BAR2BUI” images (Figure 9a) and the corresponding images retrieved using the proposed method based on Color Moments. From these figures, it can be seen that, through using multiple features, the new method produces promising results.

5. Conclusions

The demand for LULC remote sensing data from all walks of life is growing rapidly as the volume of image datasets increases. As existing knowledge based on a priori knowledge plus the keyword/metadata remote sensing data service model cannot meet the related challenges, content-based remote sensing image retrieval technology is being introduced to extract a variety of change information from remote sensing data. The CBRSICIR model proposed in this paper includes two main innovations.
  • The new model includes a wholly new way of accessing change information from remote sensing imagery and effectively uses the low-level features of the images. It can overcome the problems that arise due to the same type of object having different spectra. So, the new model can be easily applied on all kinds of change information retrieval. It can also meet the different needs that users have in terms of extracting change information from remote sensing imagery. At the same time, the new model greatly reduces the image preprocessing requirements, which means that it can be applied globally using full time-series of data, not limiting to the number and type of change classes in this particular territory (Beijing). Thereby, it improves the standard and efficiency of remote sensing information services.
  • As the target content cannot be expressed exactly by a single feature, a multiple-feature integrated retrieval model was proposed in this paper. To describe the visual content of an image, we used three-color feature extraction and four-texture feature extraction. For the color-feature extraction, the HSV-HIST histogram, color correlogram, and color moments methods were used. For the texture-feature extraction, GLCM, In-moments, Texture Spectrum, and Fast wavelet were adopted. An 846-dimensional change-feature vector was extracted to describe the content of the changes in the remote sensing imagery. The use of high-dimensional features not only ensures that the change information retrieval for all kinds of changes in ground objects is efficient and accurate, it also means that feature selection for different kinds of changes in ground objects will be possible in the future.
As a future development of this work, we plan to extend the validation of the proposed new method to larger data sets. In addition, to bridge the gap between the semantic content of the low-level and high-level features, some pre-learning mechanism and relevance feedback (RF) methods will be introduced to improve the retrieval performance for different ground-change classes.

Abbreviations

The following abbreviations are used in this manuscript.
AGR2BARAgricultural/Vegetation Land to Bare Land
AGR2BUIAgricultural/Vegetation Land to Built-up land
AGR2WATAgricultural/Vegetation Land to Water
BAR2AGRBare Land to Agricultural/Vegetation Land
BAR2BUIBare Land to Built-up land
BAR2WATBare Land to Water
BUI2AGRBuilt-up land to Agricultural/Vegetation Land
BUI2BARBuilt-up land to Bare Land
BUI2WATBuilt-up land to Water
CBIRContent-based Image Retrieval
CBRSIRContent-based Remote Sensing Image Retrieval
CDChange Detection
GLCMGray Level Co-occurrence Matrix
GLSGlobal Land Survey
HSV-HISTHSV-HIST histogram
LCLand-Cover
LULand-Use
LULCLand-Cover and Land-Use
NASANational Aeronautics and Space Administration
RSRemote Sensing
RFRelevance Feedback
USGSUnited States Geological Survey
WAT2AGRWater to Agricultural/Vegetation Land
WAT2BARWater to Bare Land
WAT2BUIWater to Built-up land
WELDWeb-enabled Landsat Data System
WRSWorldwide Reference System

Acknowledgments

The development of the HY-2A CAPF project was supported by the NSOAS and SOA. Additional funding was provided by the “Research on the model of remote sensing disaster monitoring and assessment based on crowdsourcing” project (Y6SJ2700CX) of the Institute of Remote Sensing and Digital Earth, Chinese Academy of Sciences. We are also very grateful to the USA Geological Survey for providing the Landsat 5 and Landsat 8 remote sensing images of Beijing.

Author Contributions

Fu Chen conceived and designed the experiments; Wei Xia built the experimental platform; Liyuan Jiang prepared and processed the remote sensing data; Caihong Ma designed and performed the experiments, analyzed the data and wrote the paper; Jianbo Liu, Qin Dai and Jianbo Duan supervised the research; and, Wei Liu and Wei Xia gave comments on the manuscript and helped to revise it.

Conflicts of Interest

The authors declare no conflict of interest.

References

  1. Deilami, B.R.; Ahmad, B.B.; Saffar, M.R.A.; Umar, H.Z. Review of change detection techniques from remotely sensed images. Res. J. Appl. Sci. Eng. Technol. 2015, 10, 221–229. [Google Scholar]
  2. Roy, M.; Ghosh, S.; Ghosh, A. A novel approach for change detection of remotely sensed images using semi-supervised multiple classifier system. Inf. Sci. 2014, 269, 35–47. [Google Scholar] [CrossRef]
  3. Hussain, M.; Chen, D.; Cheng, A.; Wei, H.; Stanley, D. Change detection from remotely sensed images: From pixel-based to object-based approaches. ISPRS J. Photogramm. Remote Sens. 2013, 80, 91–106. [Google Scholar] [CrossRef]
  4. Olson, G.A.; Cheriyadat, A.; Mali, P.; O’Hara, C.G. Detecting and managing change in spatial data-land use and infrastructure change analysis and detection. In Proceedings of the 2004 IEEE International Geoscience and Remote Sensing Symposium, Anchorage, AK, USA, 20–24 September 2004; pp. 729–734. [Google Scholar]
  5. Zhu, Z.; Woodcock, C.E. Continuous change detection and classification of land cover using all available landsat data. Remote Sens. Environ. 2014, 144, 152–171. [Google Scholar] [CrossRef]
  6. Datcu, M.; Seidel, K. Human centered concepts for exploration and understanding of images. In Proceedings of the 2003 IEEE Workshop on Advances in Techniques for Analysis of Remotely Sensed Data, Greenbelt, MD, USA, 27–28 October 2005; pp. 52–59. [Google Scholar]
  7. Ma, C.; Dai, Q.; Liu, J.; Liu, S.; Yang, J. An improved svm model for relevance feedback in remote sensing image retrieval. Int. J. Digit. Earth 2014, 7, 725–745. [Google Scholar] [CrossRef]
  8. Web-Enabled Landsat Data. Available online: https://weld.cr.usgs.gov/ (accessed on 18 October 2017).
  9. Lewis, A.; Lymburner, L.; Purss, M.B.J.; Brooke, B.; Evans, B.; Ip, A.; Dekker, A.G.; Irons, J.R.; Minchin, S.; Mueller, N. Rapid, high-resolution detection of environmental change over continental scales from satellite data—The earth observation data cube. Int. J. Digit. Earth 2015, 9, 1–6. [Google Scholar] [CrossRef]
  10. OPEN DATA CUBE. Available online: http://www.datacube.org.au/ (accessed on 18 October 2017).
  11. Changematters-Infrared. Available online: http://changematters.esri.com/compare (accessed on 18 October 2017).
  12. Marakakis, A.; Galatsanos, N.; Likas, A.; Stafylopatis, A. Combining Gaussian Mixture Models and Support Vector Machines for Relevance Feedback in Content Based Image Retrieval; Springer: New York, NY, USA, 2009; pp. 249–258. [Google Scholar]
  13. Datcu, M.; Daschiel, H.; Pelizzari, A.; Quartulli, M.; Galoppo, A.; Colapicchioni, A.; Pastori, M.; Seidel, K.; Marchetti, P.G.; D’Elia, S. Information mining in remote sensing image archives: System concepts. IEEE Trans. Geosci. Remote Sens. 2003, 43, 188–199. [Google Scholar] [CrossRef]
  14. Molinier, M.; Laaksonen, J.; Hame, T. Detecting man-made structures and changes in satellite imagery with a content-based information retrieval system built on self-organizing maps. IEEE Trans. Geosci. Remote Sens. 2007, 45, 861–874. [Google Scholar] [CrossRef]
  15. Zhang, N. Research on Key Techniques of Content-Based Optical Remote Sensing Image Retrieval. Ph.D. Thesis, National University of Defense Technology, Changsha, China, 2008. [Google Scholar]
  16. Han, J.; Ma, K.K. Fuzzy color histogram and its use in color image retrieval. IEEE Trans. Image Process. A Publ. IEEE Signal Process. Soc. 2002, 11, 944. [Google Scholar] [CrossRef] [PubMed]
  17. Hsu, W.; Chua, S.T.; Pung, H.H. An integrated color-spatial approach to content-based image retrieval. In Proceedings of the ACM International Conference on Multimedia ’95, San Francisco, CA, USA, 5–9 November 1995; pp. 305–313. [Google Scholar]
  18. Ojala, T.; Pietikäinen, M.; Mäenpää, T. Multiresolution Gray-Scale and Rotation Invariant Texture Classification with Local Binary Patterns; Springer: Berlin/Heidelberg, Germany, 2000; pp. 404–420. [Google Scholar]
  19. Cheng, Q.M. Research on Key Technologies for Content Based Retrieval from Remote Sensing Image Database. Ph.D. Thesis, Institute of Remote Sensing Application, Chinese Academy of Science, Beijing, China, 2004. [Google Scholar]
  20. Wang, X.; Shao, Z.; Zhou, X.; Liu, J. A novel remote sensing image retrieval method based on visual salient point features. Sens. Rev. 2014, 34, 349–359. [Google Scholar] [CrossRef]
  21. Quartulli, M.; Olaizola, I.G. A review of EO image information mining. ISPRS J. Photogramm. Remote Sens. 2013, 75, 11–28. [Google Scholar] [CrossRef]
  22. Zhao, L.; Tang, J.; Yu, X.; Li, Y.; Mi, S.; Zhang, C. Content-based remote sensing image retrieval using image multi-feature combination and svm-based relevance feedback. Lect. Notes Electr. Eng. 2012, 124, 761–767. [Google Scholar]
  23. Wang, X.Y.; Yang, H.Y.; Li, D.M. A New Content-Based Image Retrieval Technique Using Color and Texture Information; Pergamon Press, Inc.: Oxford, UK, 2013; pp. 746–761. [Google Scholar]
  24. Wang, D.-C.; Li, C.-J.; Song, X.-Y.; Wang, J.-H.; Yang, X.-D. Assessment of land suitability potentials for selecting winter wheat cultivation areas in Beijing, China, using RS and GIS. J. Integr. Agric. 2011, 10, 1419–1430. [Google Scholar] [CrossRef]
  25. Li, D.; Ning, X. A new image decomposition method for content-based remote sensing image retrieval. Geomat. Inf. Sci. Wuhan Univ. 2006, 31, 659–662. [Google Scholar]
  26. NASA Earth Observatory. Available online: https://earthobservatory.nasa.gov/Features/FalseColor/page6.php (accessed on 18 October 2017).
  27. Huang, J.; Kumar, S.R.; Mitra, M.; Zhu, W.J.; Zabih, R. Image indexing using color correlograms. In Proceedings of the Conference on Computer Vision and Pattern Recognition, San Juan, PR, USA, 17–19 June 1997; p. 762. [Google Scholar]
  28. Liu, Z.; Zhang, Y. Color image retrieval using local accumulative histogram. J. Image Graph. 1998, 3, 533–537. [Google Scholar]
  29. Schapire, R.E.; Singer, Y.; Singhal, A. Boosting and Rocchio applied to text filtering. In Proceedings of the International ACM SIGIR Conference on Research and Development in Information Retrieval, Melbourne, Australia, 24–28 August 1998; pp. 215–223. [Google Scholar]
Figure 1. Maps showing administrative areas and terrain. (a) The geographical location of Beijing, China; (b) Political map of Beijing; and, (c) Topographic map of Beijing derived from Landsat 5 data.
Ijgi 06 00310 g001
Figure 2. Cropped images extracted from a 2013/2015 TM false-color pair. (a) Scene 1 (31 July 2013); (b) Scene 2 (7 September 2015).
Ijgi 06 00310 g002
Figure 3. Flow chart for the remote sensing image preprocessing and data archiving.
Ijgi 06 00310 g003
Figure 4. The architecture of the content-based remote sensing image change information retrieval model.
Ijgi 06 00310 g004
Figure 5. Remote sensing database: samples of three pairs of images for each of the 9 change classes.
Ijgi 06 00310 g005
Figure 6. Comparison of the average PVR (precision-recall) curve for different methods.
Ijgi 06 00310 g006
Figure 7. Comparison of the average PVR curve for different ground-change classes.
Ijgi 06 00310 g007
Figure 8. Query by example: looking for “WAT2BUI” in a database of remote sensing images. (a) The target pair of query images. (b) Pairs of images retrieved using the proposed method based on Multi-all features. The 12 most similar pairs of images are shown.
Ijgi 06 00310 g008aIjgi 06 00310 g008b
Figure 9. Query by example: looking for “BAR2BUI” (bare land to Beijing airport) in a database of remote sensing images. (a) The target pair of query images. (b) Pairs of images retrieved using the proposed method based on Color Moments. The 12 most similar pairs of images are shown.
Ijgi 06 00310 g009
Table 1. RS (Remote Sensing) Image information.
NoLANDSAT_SCENE_IDSensorBandsAcquisition Date
1LT51230321996182HAJ00Landsat 554330 June 1996
2LT51230321999190HAJ00Landsat 55439 July 1999
3LT51230322000257BJC00Landsat 554313 September 2000
4LT51230322001243BJC00Landsat 554331 August 2001
5LT51230322003185BJC00Landsat 55434 July 2003
6LT51230322004188BJC00Landsat 55436 July 2004
7LT51230322004252BJC00Landsat 55438 September 2004
8LT51230322007276IKR00Landsat 55433 October 2007
9LT51230322010156IKR00Landsat 55435 June 2010
10LT51230322010220IKR00Landsat 55438 August 2010
11LT51230322011159IKR00Landsat 55438 June 2011
12LC81230322013212LGN00Landsat 865431 July 2013
13LC81230322014231LGN00Landsat 865419 August 2014
14LC81230322015250LGN00Landsat 86547 September 2015
Table 2. Description of the feature vector.
Color FeatureNumber of DimensionsTexture FeatureNumber of Dimensions
Color Correlogram256Fast wavelet20
Color Moments9In-moments7
HSV-HIST72GLCM8
Texture Spectrum51
Table 3. Comparison of different methods: Coverage Rate.
Methodi = 1 (%)i = 2 (%)i = 3 (%)i = 4 (%)i = 5 (%)i = 10 (%)i = 20 (%)
Color Correlogram0.72 ± 0.140.64 ± 0.170.60 ± 0.180.56 ± 0.190.53 ± 0.190.48 ± 0.160.51 ± 0.12
Color Moments0.82 ± 0.130.73 ± 0.170.67 ± 0.200.64 ± 0.210.62 ± 0.210.57 ± 0.190.61 ± 0.13
HSV-HIST0.64 ± 0.140.53 ± 0.170.47 ± 0.180.43 ± 0.160.40 ± 0.150.36 ± 0.120.42 ± 0.14
Fast wavelet0.65 ± 0.120.55 ± 0.130.50 ± 0.130.46 ± 0.130.44 ± 0.130.41 ± 0.120.45 ± 0.13
In-moments0.47 ± 0.120.39 ± 0.120.35 ± 0.120.32 ± 0.130.31 ± 0.120.29 ± 0.100.34 ± 0.08
GLCM0.41 ± 0.100.34 ± 0.090.32 ± 0.090.31 ± 0.090.29 ± 0.080.29 ± 0.090.36 ± 0.10
Texture Spectrum0.45 ± 0.100.33 ± 0.080.29 ± 0.080.26 ± 0.080.25 ± 0.070.24 ± 0.050.30 ± 0.07
Multi-Color0.78 ± 0.120.70 ± 0.160.65 ± 0.180.61 ± 0.190.58 ± 0.190.53 ± 0.160.57 ± 0.13
Multi-Texture0.69 ± 0.100.57 ± 0.130.51 ± 0.140.47 ± 0.140.45 ± 0.130.41 ± 0.100.45 ± 0.11
Multi-all0.79 ± 0.120.71 ± 0.160.67 ± 0.180.62 ± 0.190.60 ± 0.190.55 ± 0.170.58 ± 0.13
Table 4. Comparison of different methods: Mean Average Precision value.
Methodi = 1 (%)i = 2 (%)i = 3 (%)i = 4 (%)i = 5 (%)i = 10 (%)i = 20 (%)
Color Correlogram0.91 ± 0.060.84 ± 0.080.80 ± 0.100.76 ± 0.110.74 ± 0.110.66 ± 0.130.58 ± 0.14
Color Moments0.94 ± 0.040.89 ± 0.060.86 ± 0.070.83 ± 0.090.81 ± 0.100.74 ± 0.120.66 ± 0.14
HSV-HIST0.88 ± 0.040.80 ± 0.050.74 ± 0.060.70 ± 0.080.67 ± 0.090.57 ± 0.100.48 ± 0.11
Fast wavelet0.89 ± 0.040.80 ± 0.050.74 ± 0.070.70 ± 0.070.67 ± 0.070.58 ± 0.080.50 ± 0.09
In-moments0.85 ± 0.050.72 ± 0.060.66 ± 0.070.61 ± 0.070.58 ± 0.080.48 ± 0.080.40 ± 0.09
GLCM0.82 ± 0.050.69 ± 0.060.61 ± 0.070.56 ± 0.070.53 ± 0.070.42 ± 0.070.36 ± 0.07
Texture Spectrum0.86 ± 0.060.74 ± 0.080.66 ± 0.080.60 ± 0.080.56 ± 0.070.43 ± 0.050.34 ± 0.05
Multi-Color0.93 ± 0.050.87 ± 0.070.84 ± 0.080.81 ± 0.080.79 ± 0.090.70 ± 0.120.63 ± 0.13
Multi-Texture0.89 ± 0.030.82 ± 0.040.77 ± 0.050.73 ± 0.060.70 ± 0.070.61 ± 0.080.53 ± 0.08
Multi-all0.94 ± 0.050.89 ± 0.070.85 ± 0.080.83 ± 0.080.80 ± 0.090.72 ± 0.120.64 ± 0.13
Table 5. Comparison of coverage rates obtained using different methods and nine types of ground change classes (i = 2).
MethodAGR2BARAGR2BUIAGR2WATBAR2AGRBAR2BUIBAR2WATWAT2AGRWAT2BARWAT2BUI
Color Correlogram0.88 ± 0.210.68 ± 0.220.62 ± 0.300.82 ± 0.300.36 ± 0.190.47 ± 0.220.58 ± 0.260.49 ± 0.230.83 ± 0.12
Color Moments0.92 ± 0.150.77 ± 0.240.71 ± 0.310.93 ± 0.170.43 ± 0.240.49 ± 0.210.70 ± 0.260.72 ± 0.280.90 ± 0.13
HSV-HIST0.57 ± 0.230.48 ± 0.210.76 ± 0.280.46 ± 0.160.24 ± 0.140.34 ± 0.130.47 ± 0.120.68 ± 0.220.77 ± 0.11
Fast wavelet0.65 ± 0.250.60 ± 0.200.61 ± 0.290.67 ± 0.210.26 ± 0.130.50 ± 0.200.41 ± 0.170.63 ± 0.260.61 ± 0.22
In-moments0.55 ± 0.290.45 ± 0.260.47 ± 0.280.50 ± 0.260.21 ± 0.080.16 ± 0.100.36 ± 0.150.42 ± 0.220.40 ± 0.23
GLCM0.38 ± 0.210.34 ± 0.130.47 ± 0.270.29 ± 0.130.16 ± 0.070.27 ± 0.120.35 ± 0.200.48 ± 0.280.33 ± 0.20
Texture Spectrum0.34 ± 0.140.35 ± 0.100.32 ± 0.210.35 ± 0.120.22 ± 0.110.23 ± 0.100.31 ± 0.130.36 ± 0.220.53 ± 0.12
Multi-Color0.90 ± 0.220.71 ± 0.210.77 ± 0.280.82 ± 0.250.40 ± 0.190.48 ± 0.140.63 ± 0.220.71 ± 0.250.86 ± 0.11
Multi-Texture0.64 ± 0.210.60 ± 0.220.68 ± 0.300.67 ± 0.180.30 ± 0.130.46 ± 0.260.46 ± 0.170.61 ± 0.300.74 ± 0.20
Multi-all0.91 ± 0.230.73 ± 0.210.77 ± 0.290.84 ± 0.250.41 ± 0.190.49 ± 0.150.65 ± 0.220.74 ± 0.250.88 ± 0.10
Table 6. Comparison of different methods: Mean Average Precision for nine kinds of ground change classes (i = 2).
MethodAGR2BARAGR2BUIAGR2WATBAR2AGRBAR2BUIBAR2WATWAT2AGRWAT2BARWAT2BUI
Color Correlogram0.95 ± 0.090.82 ± 0.180.87 ± 0.120.97 ± 0.050.68 ± 0.150.84 ± 0.140.80 ± 0.150.78 ± 0.150.88 ± 0.12
Color Moments0.95 ± 0.120.91 ± 0.080.88 ± 0.150.96 ± 0.090.73 ± 0.130.89 ± 0.070.86 ± 0.150.91 ± 0.140.94 ± 0.08
HSV-HIST0.77 ± 0.180.72 ± 0.150.89 ± 0.150.76 ± 0.120.80 ± 0.190.81 ± 0.140.74 ± 0.130.85 ± 0.150.83 ± 0.14
Fast wavelet0.86 ± 0.110.80 ± 0.160.83 ± 0.170.86 ± 0.110.71 ± 0.150.82 ± 0.110.71 ± 0.140.79 ± 0.160.83 ± 0.13
In-moments0.75 ± 0.180.71 ± 0.180.86 ± 0.150.69 ± 0.170.65 ± 0.180.75 ± 0.180.63 ± 0.120.76 ± 0.160.71 ± 0.18
GLCM0.63 ± 0.150.63 ± 0.140.77 ± 0.180.64 ± 0.160.68 ± 0.220.62 ± 0.170.72 ± 0.140.75 ± 0.210.71 ± 0.18
Texture Spectrum0.69 ± 0.140.62 ± 0.120.78 ± 0.180.71 ± 0.130.82 ± 0.200.69 ± 0.150.71 ± 0.170.89 ± 0.100.78 ± 0.15
Multi-Color0.96 ± 0.090.85 ± 0.130.92 ± 0.120.95 ± 0.070.73 ± 0.180.84 ± 0.120.82 ± 0.130.90 ± 0.100.89 ± 0.09
Multi-Texture0.85 ± 0.120.78 ± 0.160.85 ± 0.180.86 ± 0.110.74 ± 0.130.82 ± 0.170.78 ± 0.140.83 ± 0.150.86 ± 0.10
Multi-all0.97 ± 0.090.87 ± 0.130.93 ± 0.110.97 ± 0.060.74 ± 0.180.87 ± 0.120.83 ± 0.140.91 ± 0.110.90 ± 0.09

