GIS-Based Evaluation of Spatial Interactions by Geographic Disproportionality of Industrial Diversity


Lab of Rural Planning, Division of Environmental Science and Technology, Graduate School of Agriculture, Kyoto University, Kyoto 606-8502, Japan
*
Author to whom correspondence should be addressed.
ISPRS Int. J. Geo-Inf. 2017, 6(11), 352; https://0-doi-org.brum.beds.ac.uk/10.3390/ijgi6110352
Submission received: 12 September 2017
/
Revised: 31 October 2017
/
Accepted: 6 November 2017
/
Published: 8 November 2017
(This article belongs to the Special Issue Discovery and Prediction of Moving Objects in Databases using GIS-based Tools)
Abstract
:Diversity of regional industry is regarded as a key factor for regional development, as it has a positive relationship with economic stability, which attracts population. This paper focuses on how the spatial imbalance of industrial diversity contributes to the population change caused by inter-regional migration. This paper introduces a spatial interaction model for the Geographic Information System (GIS)-based simulation of the spatial interactions to evaluate the demographic attraction force. The proposed model adopts the notions of gravity, entropy, and virtual work. An industrial classification by profit level is introduced and its diversity is quantified with the entropy of information theory. The introduced model is applied to the cases of 207 regions in South Korea. Spatial interactions are simulated with an optimized model and their resultant forces, the demographic attraction forces, are compared with observed net migration for verification. The results show that the evaluated attraction forces from industrial diversity have a very significant, positive, and moderate relationship with net migration, while other conventional factors of industry, population, economy, and the job market do not. This paper concludes that the geographical quality of industrial diversity has positive and significant effects on population change by migration.
1. Introduction
Concerns for economic sustainability in regional development are growing as conditions for it are becoming worse due to regional depopulation, especially in rural areas [1,2,3,4,5]. Recent depopulation is mainly caused by inter-regional migration [6], and it is related with the uneven geographical distribution of regional industry [7,8,9]. In South Korea, it is reported that the regional imbalance of industry caused severe out-migration in a large number of regions and this led to a collapse of regional industries and communities [10]. Consequentially, the local governments’ major policies for their economic sustainability are with respect to the population problem. These policies aim toward the development of regional industry, as the policy-makers are expecting that well-developed industries will create more jobs and that this will attract the population [11]. There is empirical evidence that proves the influence of regional industry on population movement, mainly the migration of labor [12,13,14]. Simini et al. [15] show how the spatial distribution of employment opportunities determine inter-regional migration. However, just how the geographic condition of the regional industries determine the population change caused by multi-regional interactions has not yet explored.
There have been numerous efforts to determine the relationship between industry and migration [16,17]. It has been determined that the diversity of the regional industry has a positive relationship with the stability of the regional economy and industry, which has a positive influence on the attraction of population [18,19], while highly-profitable industries also attract population [20]. The former is related with the industrial diversity and the latter is related with the average industrial profit. These two factors combine to form an attraction factor in this paper. Based on this relationship, this paper focuses on how the geographic condition of diversity in regional industry affects the change in the regional population.
Uneven spatial distributions of regional population and economy are known as major causes for migration [21]. Every region has influence over every region, since the population change by migration is the result of multi-regional spatial interactions [22]. In that regard, the demographic movement of migration has been treated as spatial interactions in the gravity models which explain the flow of population [23,24]. The gravity model has been developed as an explanatory model to explain migration between two regions with respect to population and distance [25]. Alonso [26] introduced a doubly-constrained gravity model and remarkably enhanced the model as a predictive model by analyzing patterns of multi-regional inflows and outflows. However, that model has to solve a complex matrix, specifically a very high-degree equation, and this feature makes it difficult or impossible to obtain the results [27,28,29]. Recent studies on the inter-regional migration mainly focus on the prediction of the population move with respect to the previous migration patterns [30]. Additionally, explanation models on the relationship between industry and migration concentrate on their correlation without considering their geographic situation. Hence, a new approach is introduced in this paper with simulation and optimization processes in order to determine the geographical influence of regional industry on inter-regional migration. The objective of this paper is to determine whether the geographical condition of diversity has a significant effect on the spatial interactions, namely inter-regional migration. For the purpose, an explanation model based on the gravity model is introduced and the effect of diversity of regional industry on inter-regional migration is numerically evaluated. The introduced model adopts the theories of gravity, entropy, and virtual work, and simulates the spatial interactions in order to evaluate the demographic attraction force of regions. The diversity in regional industry is quantified with the entropy of information theory [31]. Empirical studies prove that entropy is an effective index to use to quantify industrial diversity [32]. Entropy is calculated from the distribution of employees by industrial categories. This paper adopts categories reorganized by the industries’ profit levels, which are different from the standard industrial classification. Parameters in the model are optimized according to the spatial distribution of this entropy, which represents the diversity in the regional industry. The optimized model simulates the virtual interactions, and the attraction forces are evaluated. Real cases of 207 regions that cover almost all the territories, except islands, of South Korea in 2010 were applied in the introduced model and those regions’ attraction forces were evaluated. The results were compared with observed net migration from the period of 2011 to 2015, for verification.
2. Factors of Spatial Interactions
For a few decades, trend analysis-based spatial interaction models have been preferred due to their practical prediction performance [33,34,35]. Regional population is influenced by various factors, such as economy, job opportunities, or industrial structure of the region [36]. The trend-analyzing models estimate future migration from the previous inflows and outflows, region by region. Therefore, they are not practical for estimating the effects of those factors on inter-regional migration, even though they are effective predictive models. The explanatory models that deal with the relationships between the migration and the factors do not investigate the interactions. This paper focuses on the geographic influence of diversity in regional industries on the spatial interactions. Hence, a new approach, between the explanatory models and the predictive models, is introduced.
Ravenstein [37] set a theoretical foundation of migration. After that, Reilly [25] established a physical relationship between population and its movement based on Newton’s law of gravity by developing the ‘gravity model’ of the spatial interactions. It was improved by adopting a distance function [38], probabilistic approaches [39,40,41], or entropy concepts [42,43,44,45]. The gravity-based spatial interaction model has the advantage of estimating regional situations and it has been widely used in the field of migration analysis [46].
It was discovered that the structure of a region influences population movement [15,47]. Adopting this, it is assumed in this paper that industrial structure, more specifically diversity in regional industry, affects spatial interactions. This paper applies entropy in a different way from the previous works. They use entropy as a factor of spatial structure that quantifies the condition of a whole system [48]. Different from that, this paper applies entropy as a factor of regional industry that quantifies the condition of a region in the system.
Curry [49] determined that the flows of population are influenced by geographic conditions. Alonso [26] developed a doubly-constrained gravity model to analyze multi-regional migration with separate constraints on inflows and outflows of regional population. A feature of the doubly-constrained element allowed the gravity model to estimate the geographical conditions. However, the same feature makes it difficult to determine the variables that satisfy the constraints, in spite of the efforts to enhance the doubly-constrained model [27,28]. In reality, the totals of inflow and outflow are matched in the inter-regional migration. From this fact, a single constraint is set in this paper. Assuming a nation to be a closed system that leads to the conservation of the total population, the inflows and outflows of the spatial interactions should be same in a nation.
The feature of the distance factor in the spatial interaction model decides the influences from the geographic conditions. The distance factor should reflect patterns of the spatial interactions affected by the geographic conditions [33]. The influence of distance on interactions does not linearly increase [50]. Generally, it is underestimated in short distances and overestimated in long distances [51]. In this paper, it is assumed that the feature of the distance factor is variable according to the geographic condition and it is optimized with the introduction of a single constraint.
3. Materials and Methods
3.1. Fundamental Concepts
This paper introduces the concepts of weighted entropy estimated by industrial diversity, and its application to the evaluation of spatial interactions.
3.1.1. Industrial Diversity and Entropy
In this paper, it is assumed that diversity in regional industry is a major factor of spatial interactions. More specifically, differences in diversity level between regions cause the interactions. Therefore, quantifying the diversity must precede the evaluation of the spatial interactions. The situation of regional industry can be represented as a distribution, and the diversity in the distribution can be estimated as a value by calculating its entropy according to the information theory [31]. The function of the entropy is expressed as:
where H is the entropy; i is element of distribution; N is the total number of elements; and pi is the appearance probability of element i that can be presented as a proportion of the element.
In this paper, entropy is calculated with the distribution of employees, according to the categories of industry by profit level. This paper introduces an industrial classification rearranged by profit per employee. It is different from the conventional categories of the Standard Industrial Classification (SIC) in that the introduced classification categorizes industries according to their economic effectiveness, while the SIC focuses on the type of product. The profit level of the ith industry means a higher ith profit level in a group. The entropy quantifies the diversity by substituting pi in Equation (1) for the probability of the existence of an arbitrary employee in the profit level of the ith industry. pi is proportional to the employees in the profit level of the ith industry as compared to total employees in the region.
The entropy is weighted by the average profit per employee of the regional industries in order to reflect both diversity and economic performance of regional industries. This weighted entropy is applied to the introduced model as the attraction factor. The weight and weighted entropy are shown as:
where wi is the weight of region i; N is the number of levels, or the number of industrial profit categories; profitj is the profit of the jth industry level; employeeij is the number of employee of the jth industry level in region i; and is the weighted entropy of region i.
3.1.2. Evaluation of Spatial Interactions
The introduced model follows the conventional form of the gravity model established by Reilly [25]. However, terms of distance and gravitational acceleration are modified in order to estimate the geographic disproportionality of the industrial diversity.
Fundamentally, properties of a region attract population, and its influence is in inverse proportion to the distance. The condition of the regional industry decides the tendency of inter-regional migration, and its amount is determined by the population. It is based on an assumption that people are willing to move to well-structured regions for jobs. Those features experience spatial interactions and the terms in the introduced model are modified to reflect them.
The conventional gravity model is composed of the populations of interacting regions, distance, and a constant that decides the strength of the interaction [35]. The typical form is expressed as:
where Iij is the interaction from origin i to destination j; mi and mj are, respectively, the population functions of regions i and j; dij is the distance between regions i and j; and Gij is a constant determined through statistics of movement from region i to j.
The introduced model modifies the gravitational acceleration term to be a variable one, not a constant. It estimates demographic attractive force from the relative attractiveness, while the formal doubly-constrained gravity model estimates the attractive and repulsive force from statistical patterns. The term Gij is determined by the difference of quantified diversity, the weighted entropy between two regions. The term Gij determines the direction of interaction and there is no prescribed origin or destination. Gij is skew-symmetric, therefore inflow to a region means an equivalent outflow from another region:
where and are the weighted entropy of region i and j, respectively. The mass of region i, mi, is expressed as:
where fp is the population function and pi is the amount of population in region i; λ is a mass constant set as 1.0 in this paper; and pi is normalized to the 0.0–1.0 range. Since the model is aiming at explanation, the constant and the variable are normalized. In predictive models, the constant would be set to fit the observed migration.
In this paper, distance is regarded as a factor of friction against interactions based on the concept of Stouffer [38]. The distance term in the model is modified as a sigmoid function, adopting the concept of Boyle and Flowerdew [51]. The sigmoid function adjusts the friction as an “S”-shaped curve. It means that the friction slightly increases in short-distance, steeply increases in middle-distance and slightly increases in long-distance. The shape of the distance function determines the patterns of the interactions. The function of distance friction is:
where is the distance friction between region i and j; α and β are shape parameters that determine central point and slope of the sigmoid curve respectively; dij is the real distance between regions i and j; and dmax is the maximum distance between regions. Two parameters in the function determine the shape of the curve. An optimization process with an introduced constraint determines those parameters.
3.1.3. Virtual Interaction and Attraction Force
The concept of virtual interaction is derived from the ‘virtual work’ of physics, and this concept is adopted in this paper for the evaluation of the attraction force. In the real world, it is difficult to measure interactions directly because of the complex relationship between the interactions themselves. For this reason, the indirect method was introduced in this paper to measure the spatial interactions.
The virtual work assumes a virtual movement of a mass that should not move, and determines parameters that makes the movement zero. Applying that, a concept of virtual interaction is adopted. The parameters in the introduced model are determined as values that minimize the aggregation of the simulated virtual interaction. The virtual interaction is evaluated with Equation (8), derived from Equation (4):
where Gij, mi, and are substituted by Equations (5)–(7), respectively. All the variables in the equation(, , , , and ) are normalized to the 0–1 range.
There is a constraint on the aggregation of interactions. The optimization of the parameters in the introduced model is operated under the constraint. The sum of the simulated virtual interactions should be zero in the whole nation, based on the assumption that the population in the nation is conserved. This paper regards the national boundary of South Korea as a closed system of population, neglecting international migration. (In 2010, the international net migration of South Korea was less than 0.03% of the population [52].) This is represented as:
where N is the number of regions, and j starts from i because Iij is skew-symmetric, Iij = −Iji.
This paper assumes that the attraction force of a region is a resultant force of every interaction in the region, and that it is a potential force that can attract population to the region. The force of a region is evaluated by aggregating all the virtual interactions related with the region. The evaluation function is:
where Fi is the attraction force of region i; N is the number of regions; Iij is the virtual interaction from region i to j; and in case of I = j, Iij is 0.
A positive value of a region means that the region has the potential to attract people to the region, which would lead to an increase in population. A negative value means an outflow and a decrease in population.
3.2. Data
This paper applied the introduced model to the cases of 207 regions, cities and counties in South Korea for 2010. Those regions cover almost all the lower-level local governments in South Korea. The island areas were excluded. Official statistics of population, industry, coordinates, and migration were collected from the Korean statistical information service system, KOSIS [52]. Total population, coordinates and net migration of each region was gathered (Supplementary Materials Table S1). Employee data was collected, and the regional industry data and employees were classified by regions and by 1088 industrial categories by the SIC in order to examine the industrial distribution of each region. All the data were gathered from KOSIS [52].
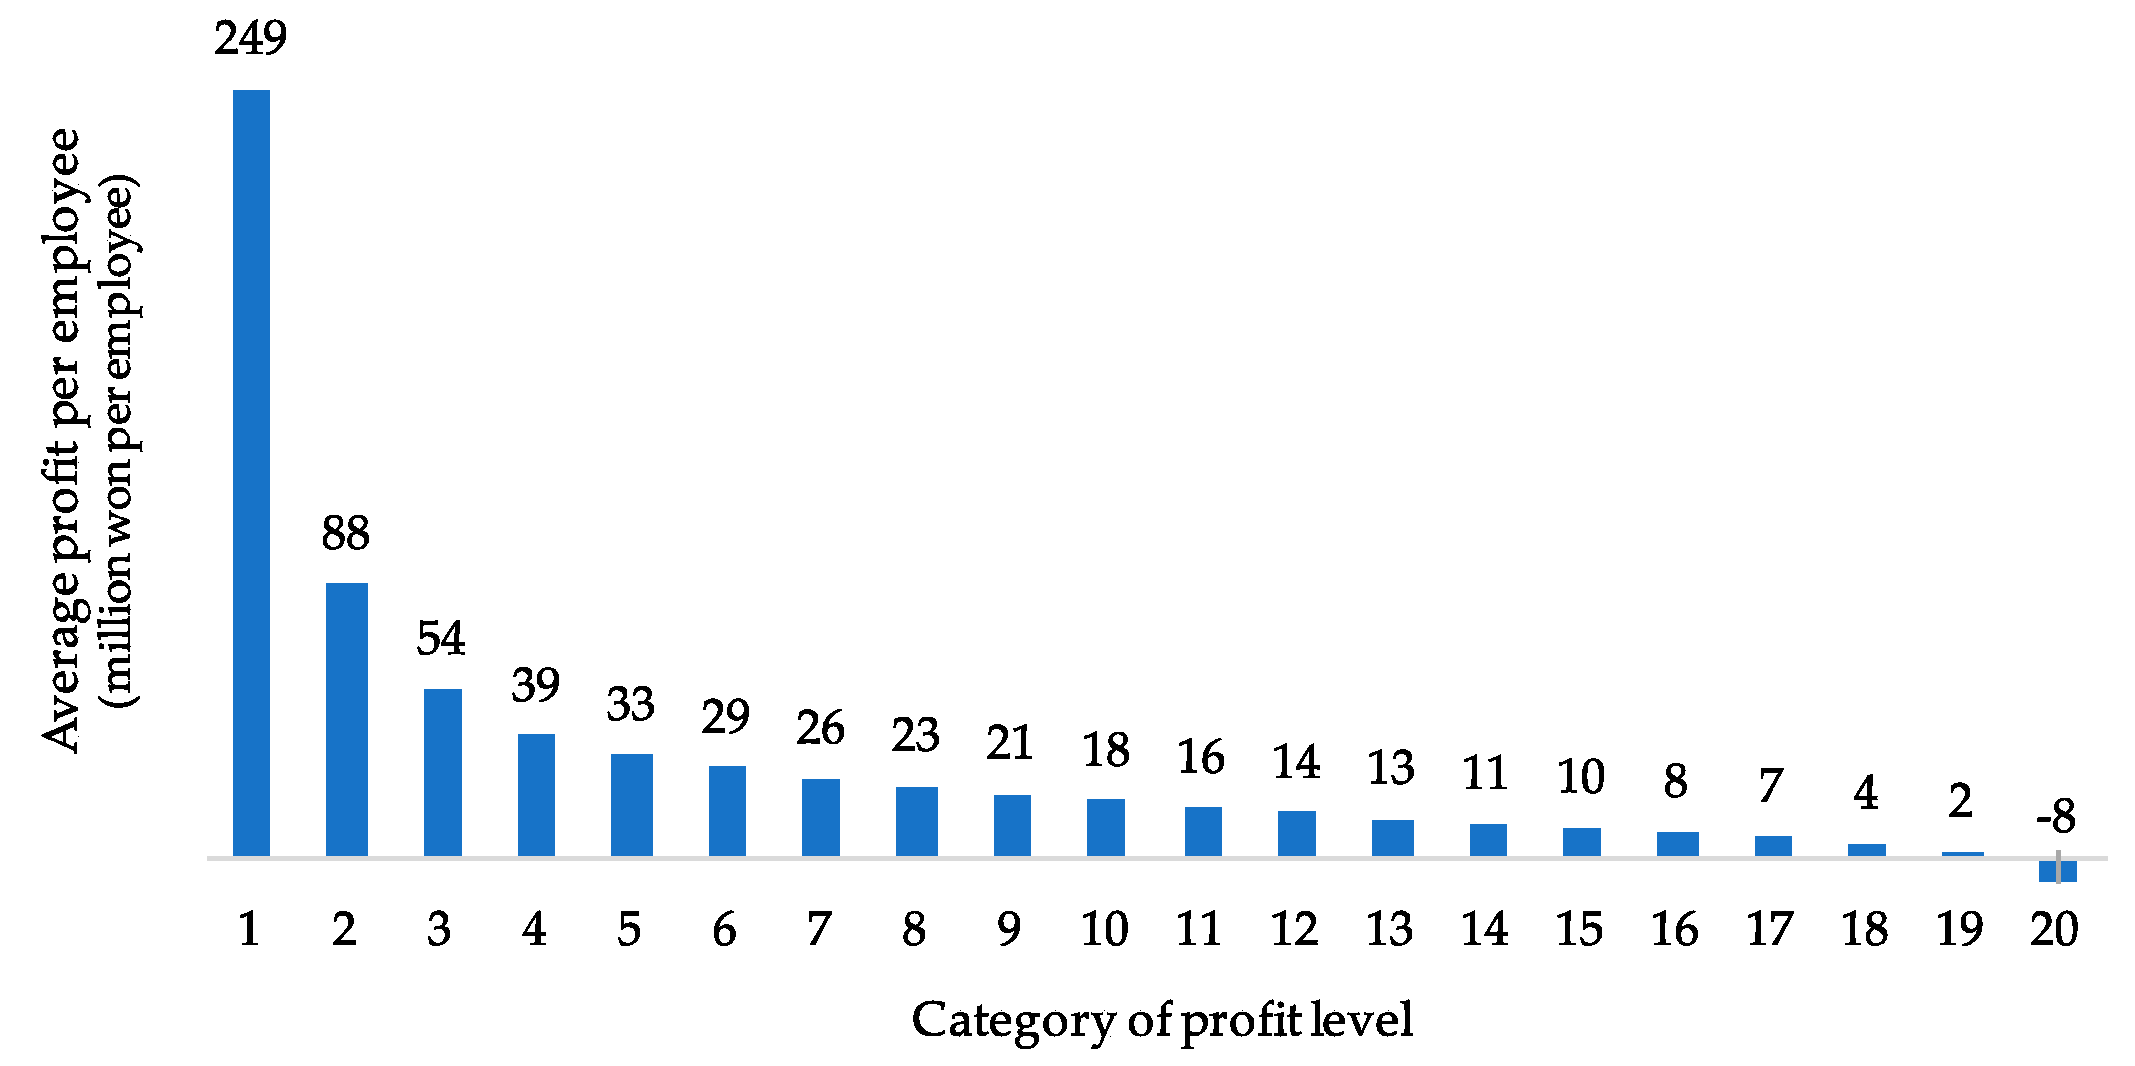
In the industrial classification, this paper introduces industrial categories by profit level that reclassify the 1088 categories of the SIC into twenty categories by annual profit per employee. This is based on the assumption that the profit efficiency represents the level of industry. This data was analyzed to estimate the entropy of the diversity in regional industry. The introduced categories are illustrated in Figure 1, and the details of the 1088 categories by SIC are presented in Supplementary Materials Table S2.
GIS coordinates of city halls and county offices were used as central coordinates of the regions. The distances between regions were calculated with those coordinates. Those values were substituted for the interaction distances between regions.
Observed net migration data of 207 regions were analyzed to examined the effect of attraction force on the real inter-regional migration. The period of the data is from 2011 to 2015.
3.3. Methods
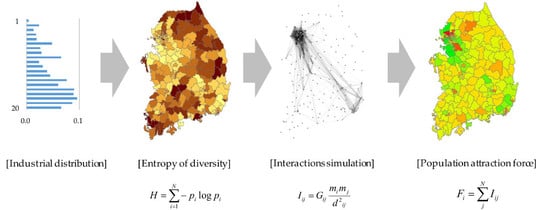
The attraction force was evaluated through a five-step process and the values are compared with the observed net migration for verification. The process is illustrated in Figure 2, and is described as below:
- Step 1: Analyzing the data;
- Step 2: Calculating the entropy of industrial diversity;
- Step 3: Simulating the spatial interactions;
- Step 4: Optimizing the parameters in the model; and
- Step 5: Evaluating the attraction force.
In Step 1, population, coordinates, and industry data were analyzed. Distances between all pairs of regions were calculated with the GIS coordinates. Industrial distributions of all regions were analyzed by calculating the proportion of employees in each the introduced category. The regional average of industrial profit level was calculated with the data of industrial distribution and the related average profits. In Step 2, the entropy of each region was calculated with the industrial distribution data, and weighted entropy was estimated with the entropy and regional average industrial profit.
In Step 3, virtual interaction was simulated through the introduced model with the data of weighted entropy, distance and population. A simulation program was developed for this process with the JAVATM programming language; it is presented in the Supplementary material. In Step 4, variables in the model were optimized to satisfy the introduced constraint. This step reiterated the process of Step 3, and the parameters were determined as a result of this optimization process. In Step 5, the attraction force was evaluated with the optimized model. Through these steps, the demographic attraction forces of all the regions were evaluated from the perspective of their conditions of location and industrial diversity.
For verification, the evaluated values were compared with the observed net migration. The Pearson R correlation between them was examined to verify that the introduced model evaluated the attraction force of the industrial diversity. For comparison, this paper also explored the correlations of net migration with population, Gross Regional Domestic Product (GRDP), employment rate, and the industrial diversity by the conventional SIC. All the data were gathered from KOSIS [52].
4. Results and Discussion
The results of entropy, average profit level of regional industry, and attractive force calculations are presented in Supplementary Materials Table S3. Data of the compared factors are also presented in that table (GRDP per capita, employment rate, and entropy of SIC-based industrial distribution).
4.1. Industrial Distribution and Weighted Entropy
Four cases of weighted entropy are presented in Figure 3, and the figure shows how the conditions of regional industry determine the value of the weighted entropy. In Figure 3, cases (a) and (b) have similar entropy, but case (b) shows higher ‘weight’ resulting in higher weighted entropy. In cases (c) and (d), the distributions are biased towards different categories. Values of the quantified diversity (i.e., the entropy) are similar in both cases but the weighted entropy of case (c) is higher than that of case (d). Comparing the cases of (b) and (c), the weighted entropy of case (c) is higher than that of case (b) although the entropy of case (b) is higher. These results show how the weighted entropy is determined by the diversity and the average industrial profit of the regional industry.
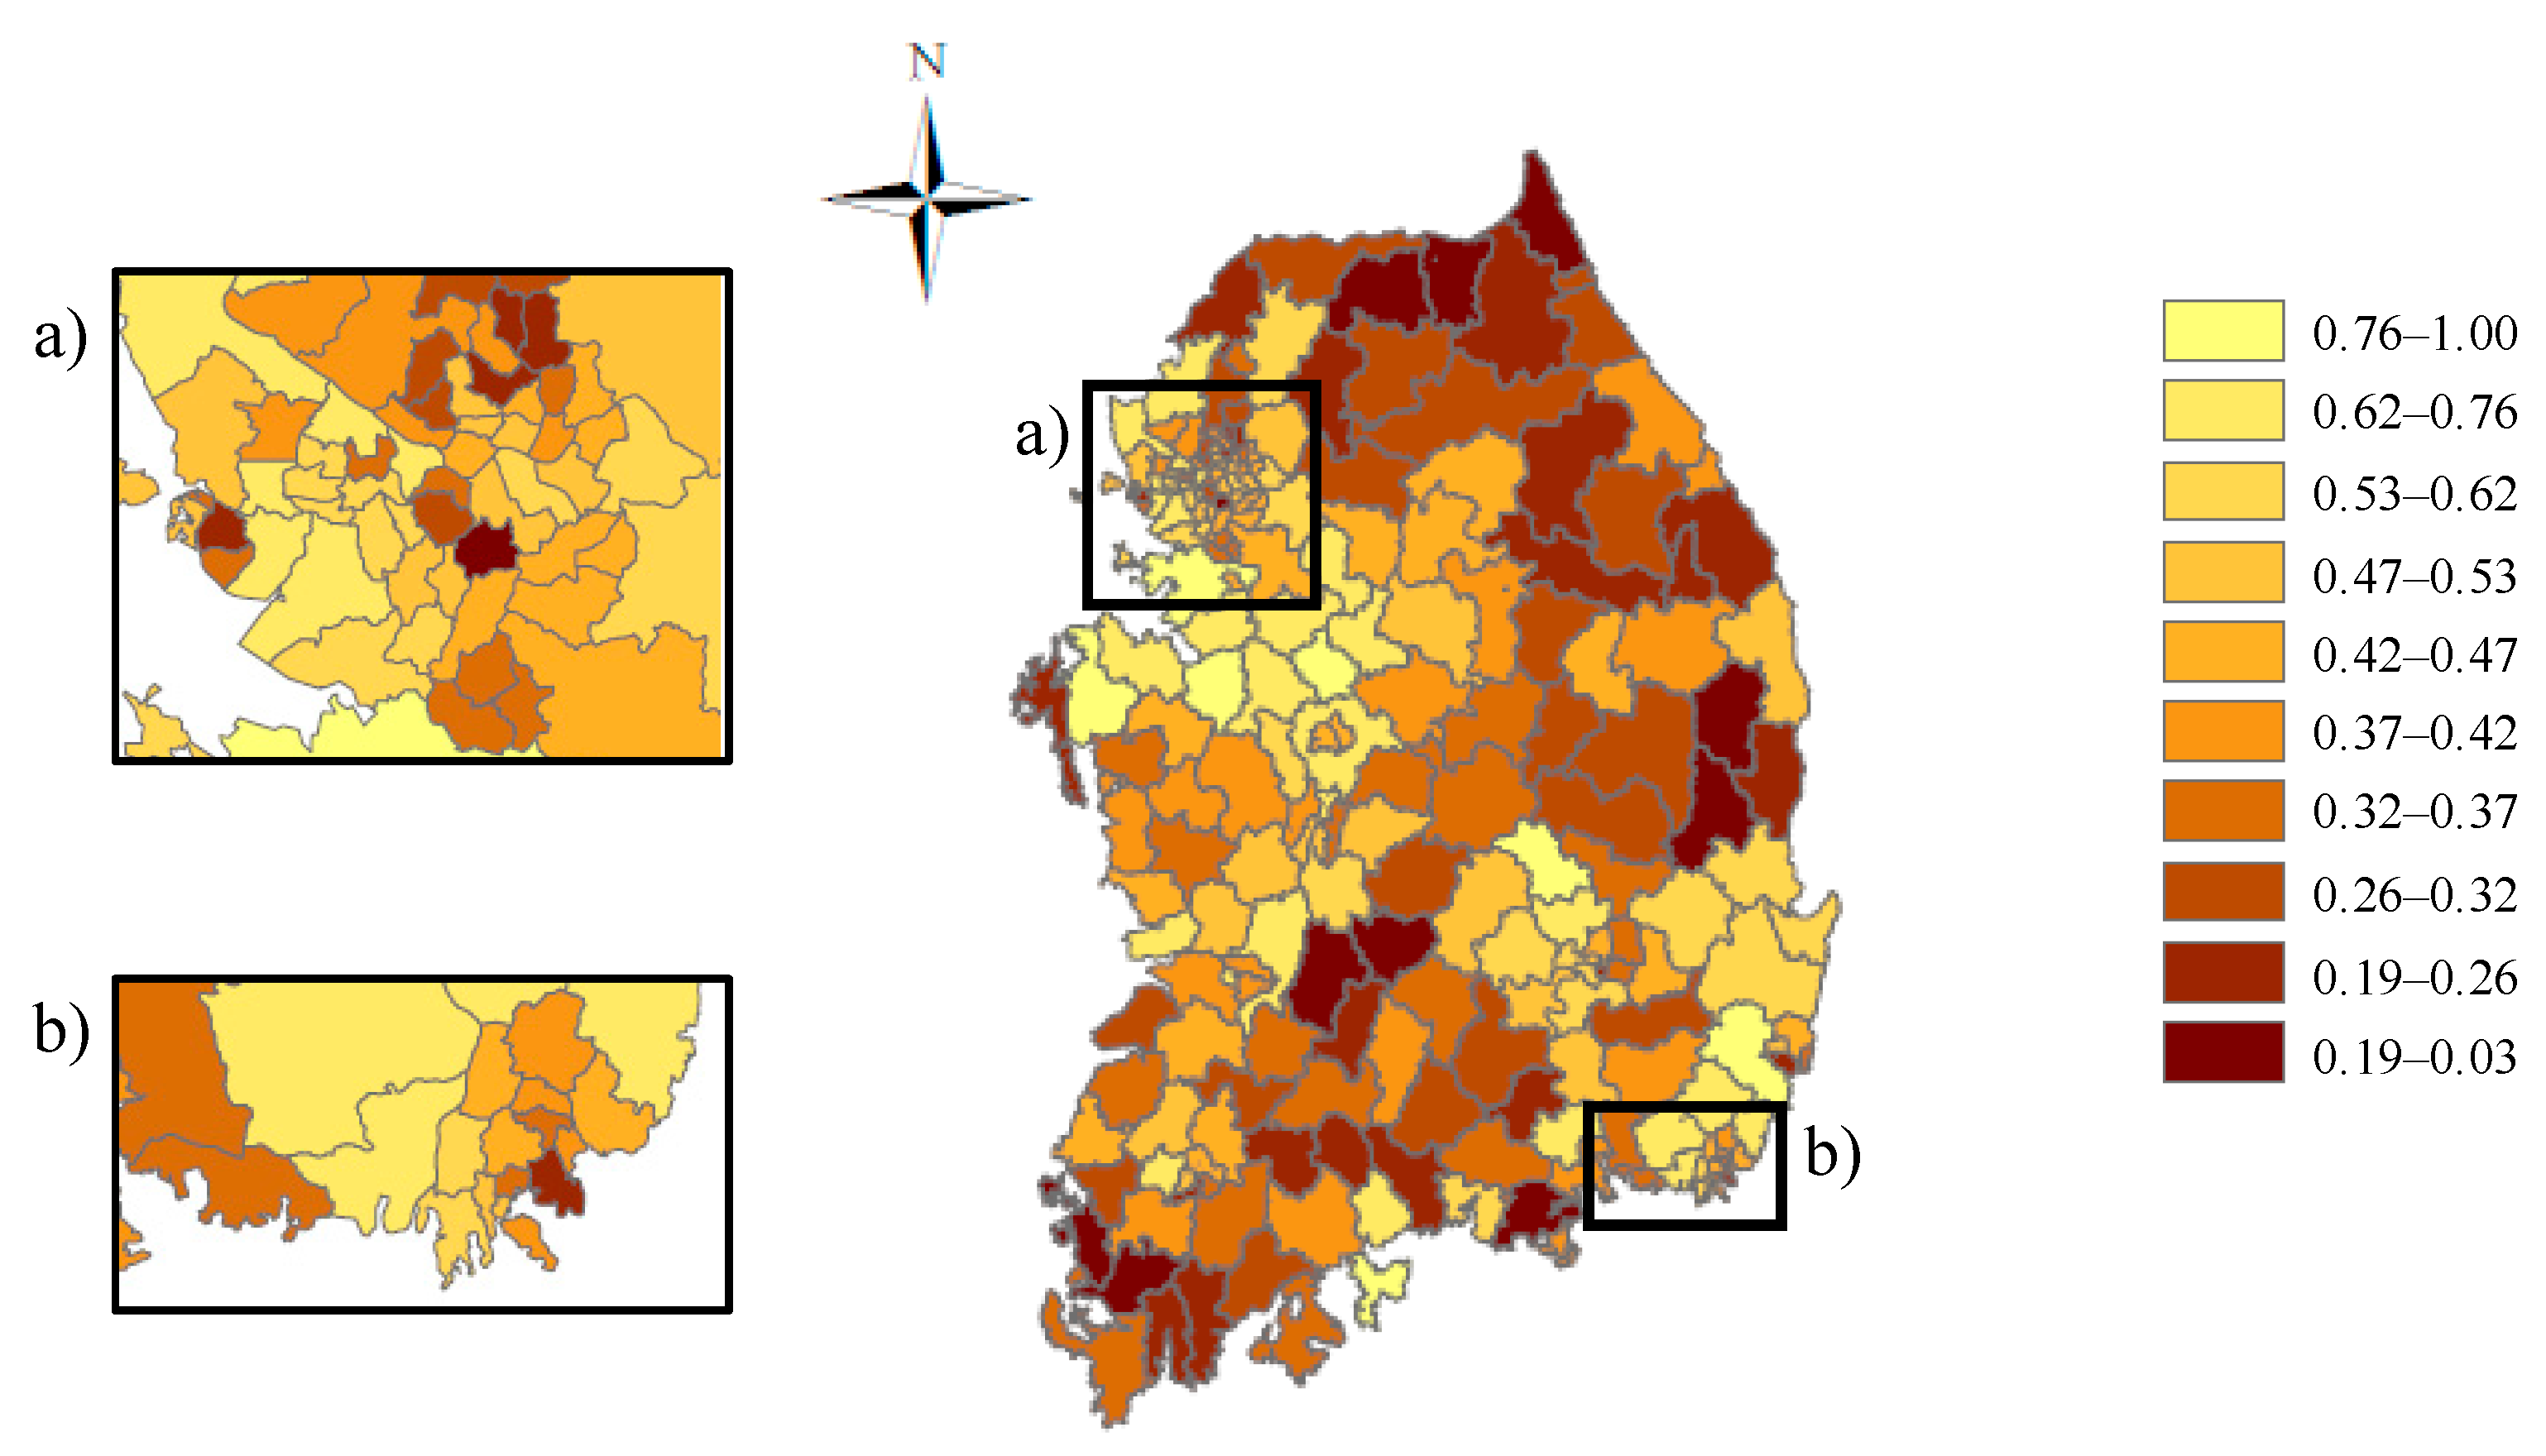
The results of the weighted entropy of 207 cities and counties in South Korea are illustrated in Figure 4. A high weighted entropy means that the region’s industries are well-distributed by profit level, and vice versa. The weighted entropy of urban areas tends to be higher than those of rural areas. Figure 4 shows that the values of weighted entropy are especially high in the vicinity of the two major metropolitan areas, Seoul and Busan. It seems that high entropy areas are congregated and they create a number of clusters. However, not all the urban areas have high entropy and, also, not all the rural areas have low entropy.
4.2. Spatial Interactions and Attraction Forces
The optimization process of virtual interactions determined the parameters in Equation (7) as α = 3.82 and β = 0.198. Optimized values of the parameters determine the shape of the distance–friction curve of term d′2 in Equation (7), as presented in Figure 5. The distance–friction curve shows how the impact of friction on interaction changes against distance. The curve has the shape of the sigmoid curve. There is a small amount of friction on the short-distance interaction, a large amount friction on the long-distance interaction, and a proportional friction on the middle-distance interaction. This is different from the distance function of previous works that adopted linear or exponential functions, assuming a continuously increasing friction [35].
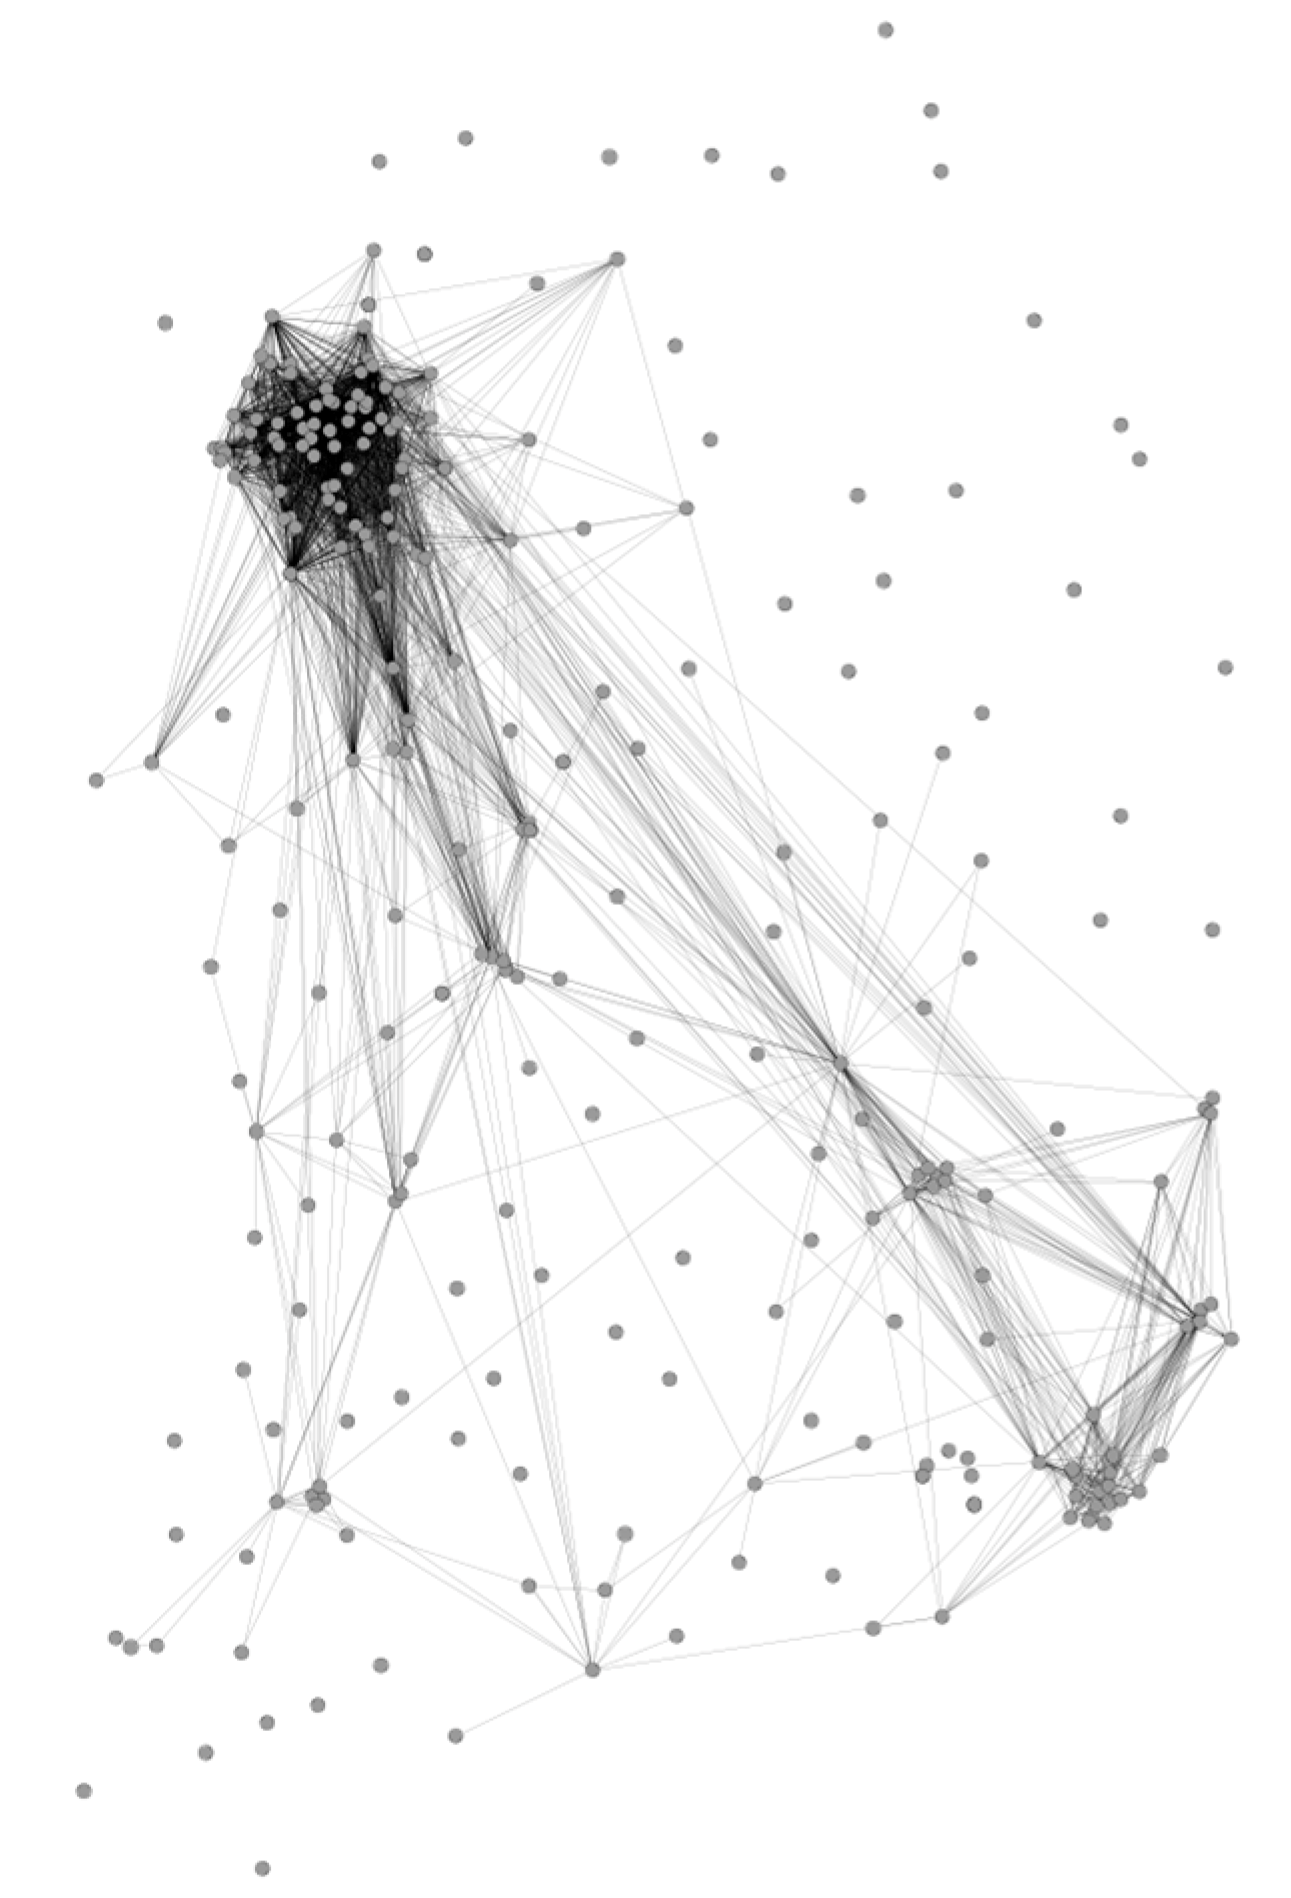
The spatial interactions are simulated with the optimized distance function and the upper 10% of the simulated interactions are illustrated in Figure 6. It clearly shows that the simulated interactions converge on the regions of high weight entropy, especially in the metropolitan areas.
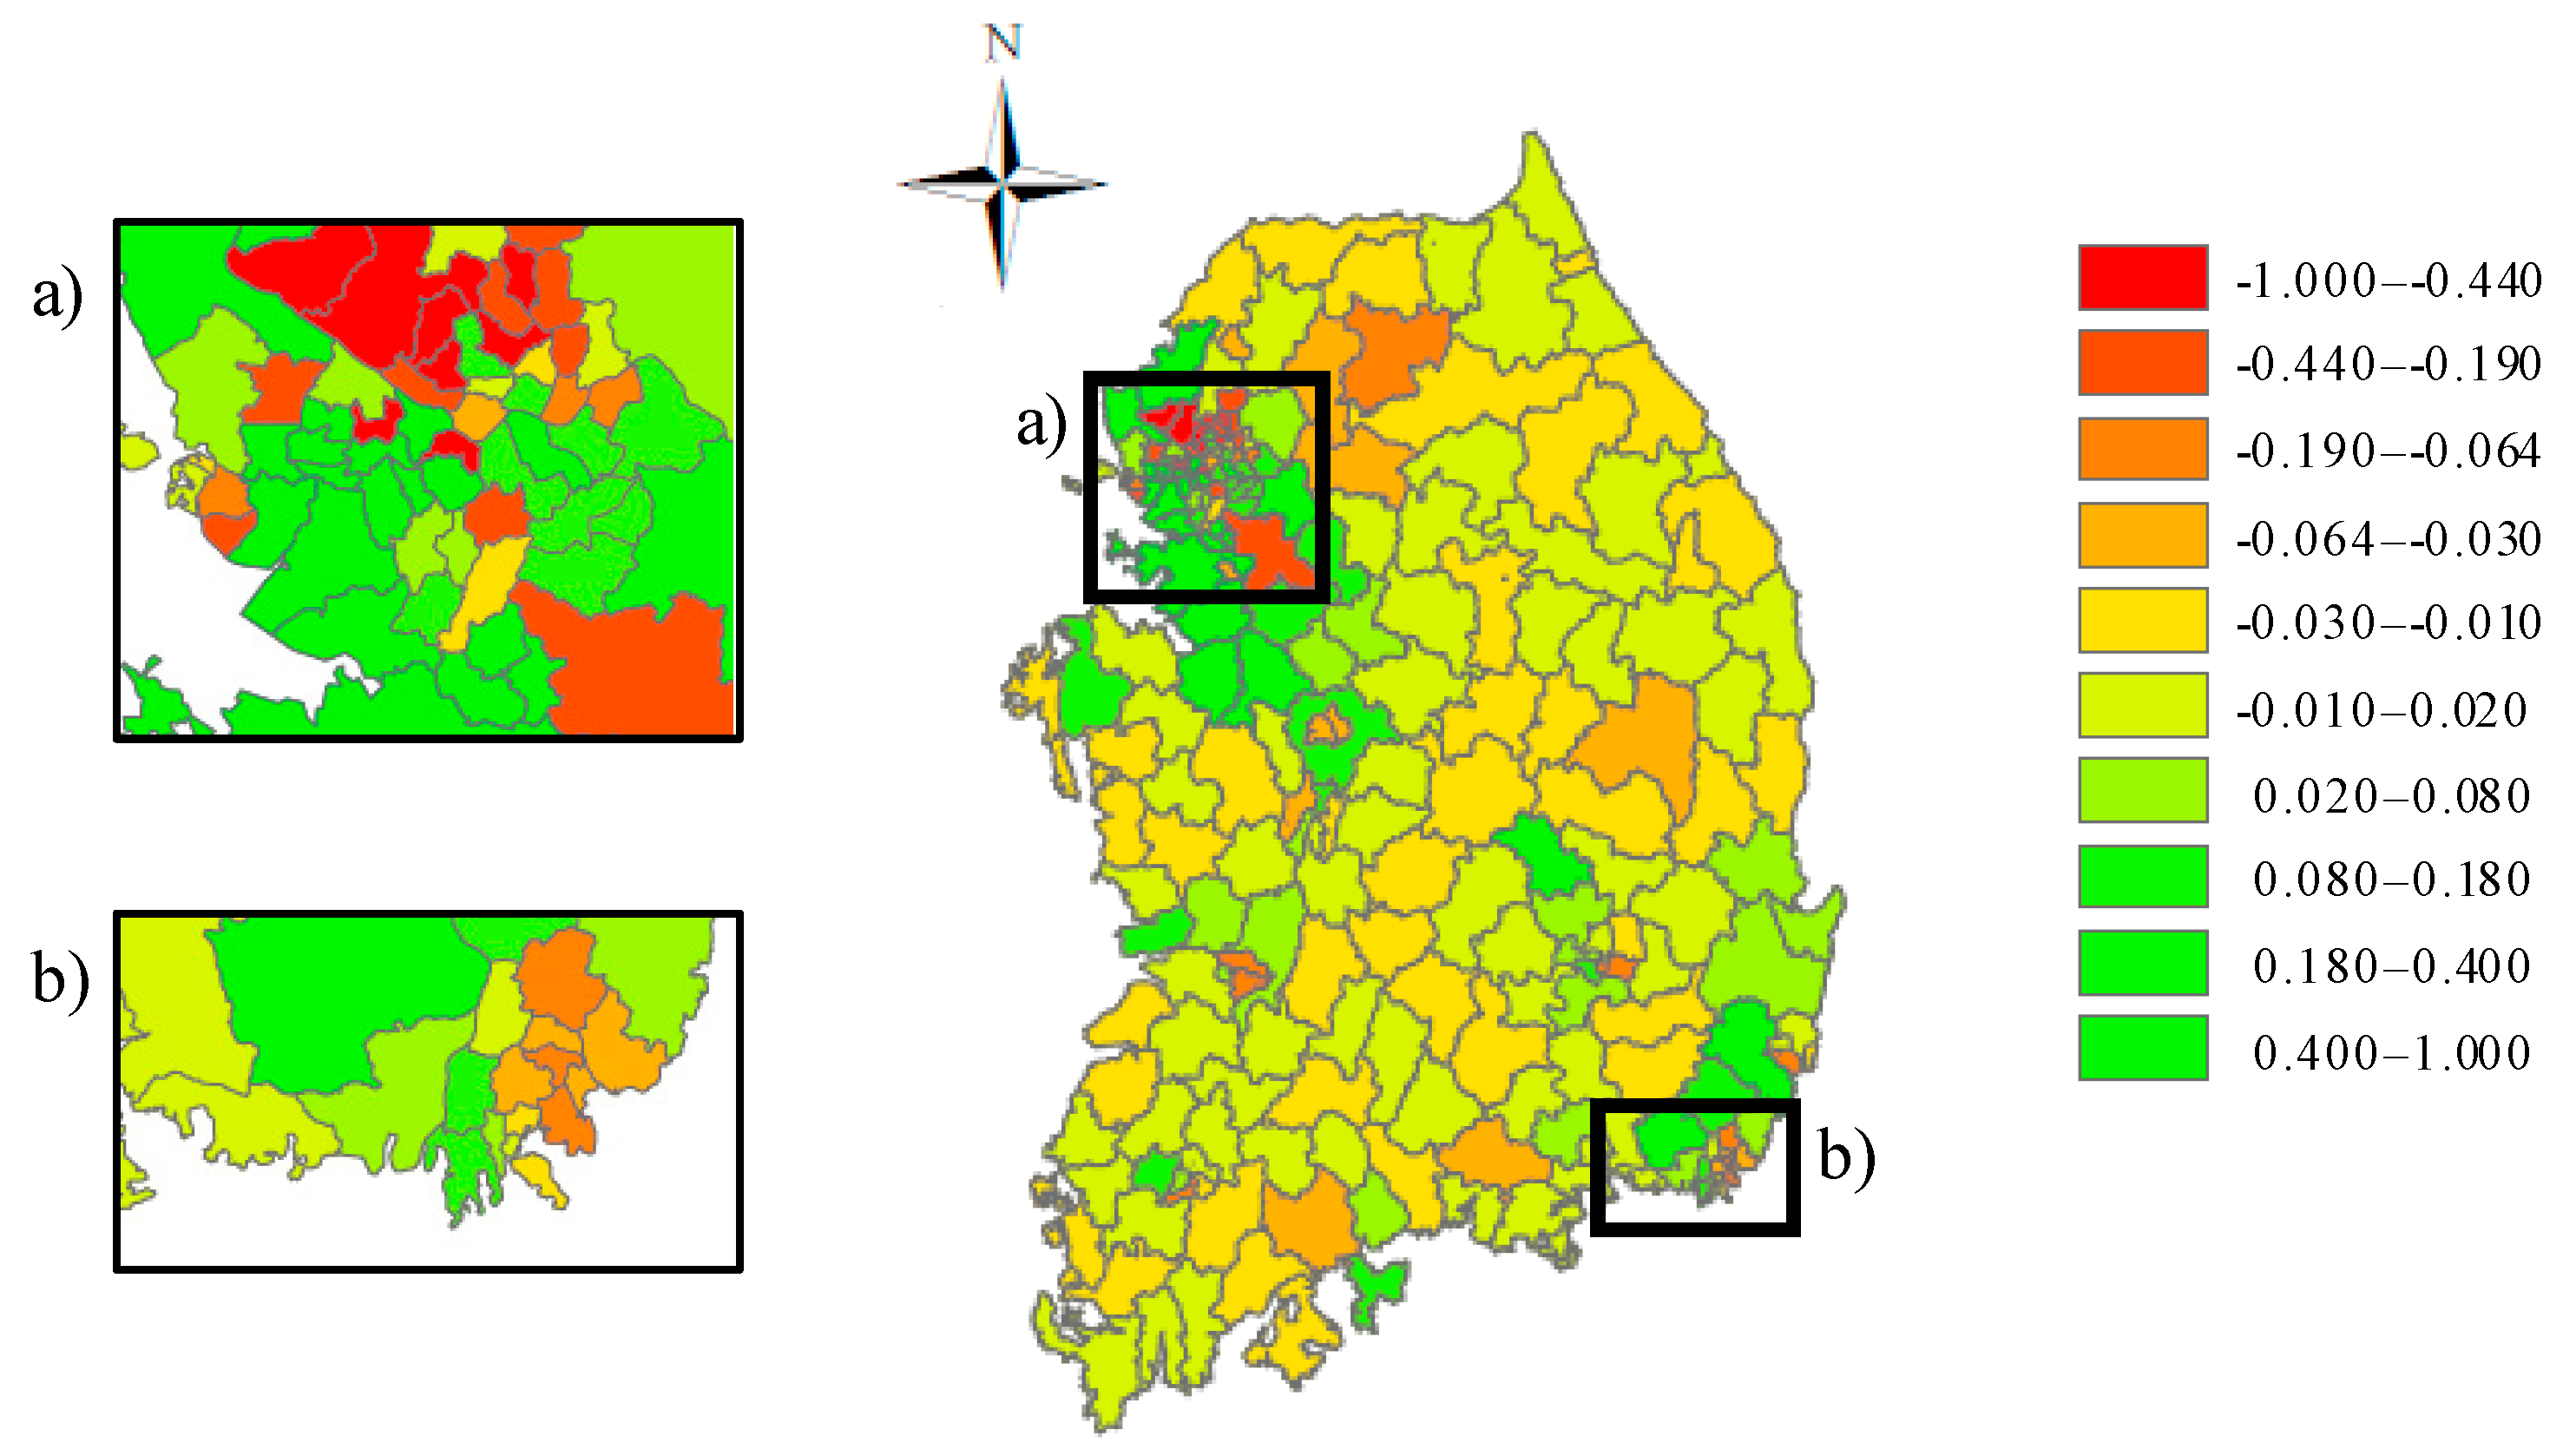
The attraction forces were evaluated with the results of simulated interactions and they were normalized to the −1.0 to 1.0 range. Evaluated results of attraction force are illustrated in Figure 7. A positive value for a region means that the region had a potential to attract people that would lead to a population increase, and vice versa. This reveals the potential population growth areas and declining areas. Interestingly, both high-attraction force regions and low-attraction force regions are found in the metropolitan areas. Regions far from the metropolitan areas represent neutral values of attractive force. This explains the demographic interactions in capital areas.
4.3. Evaluated Forces and Observed Migration
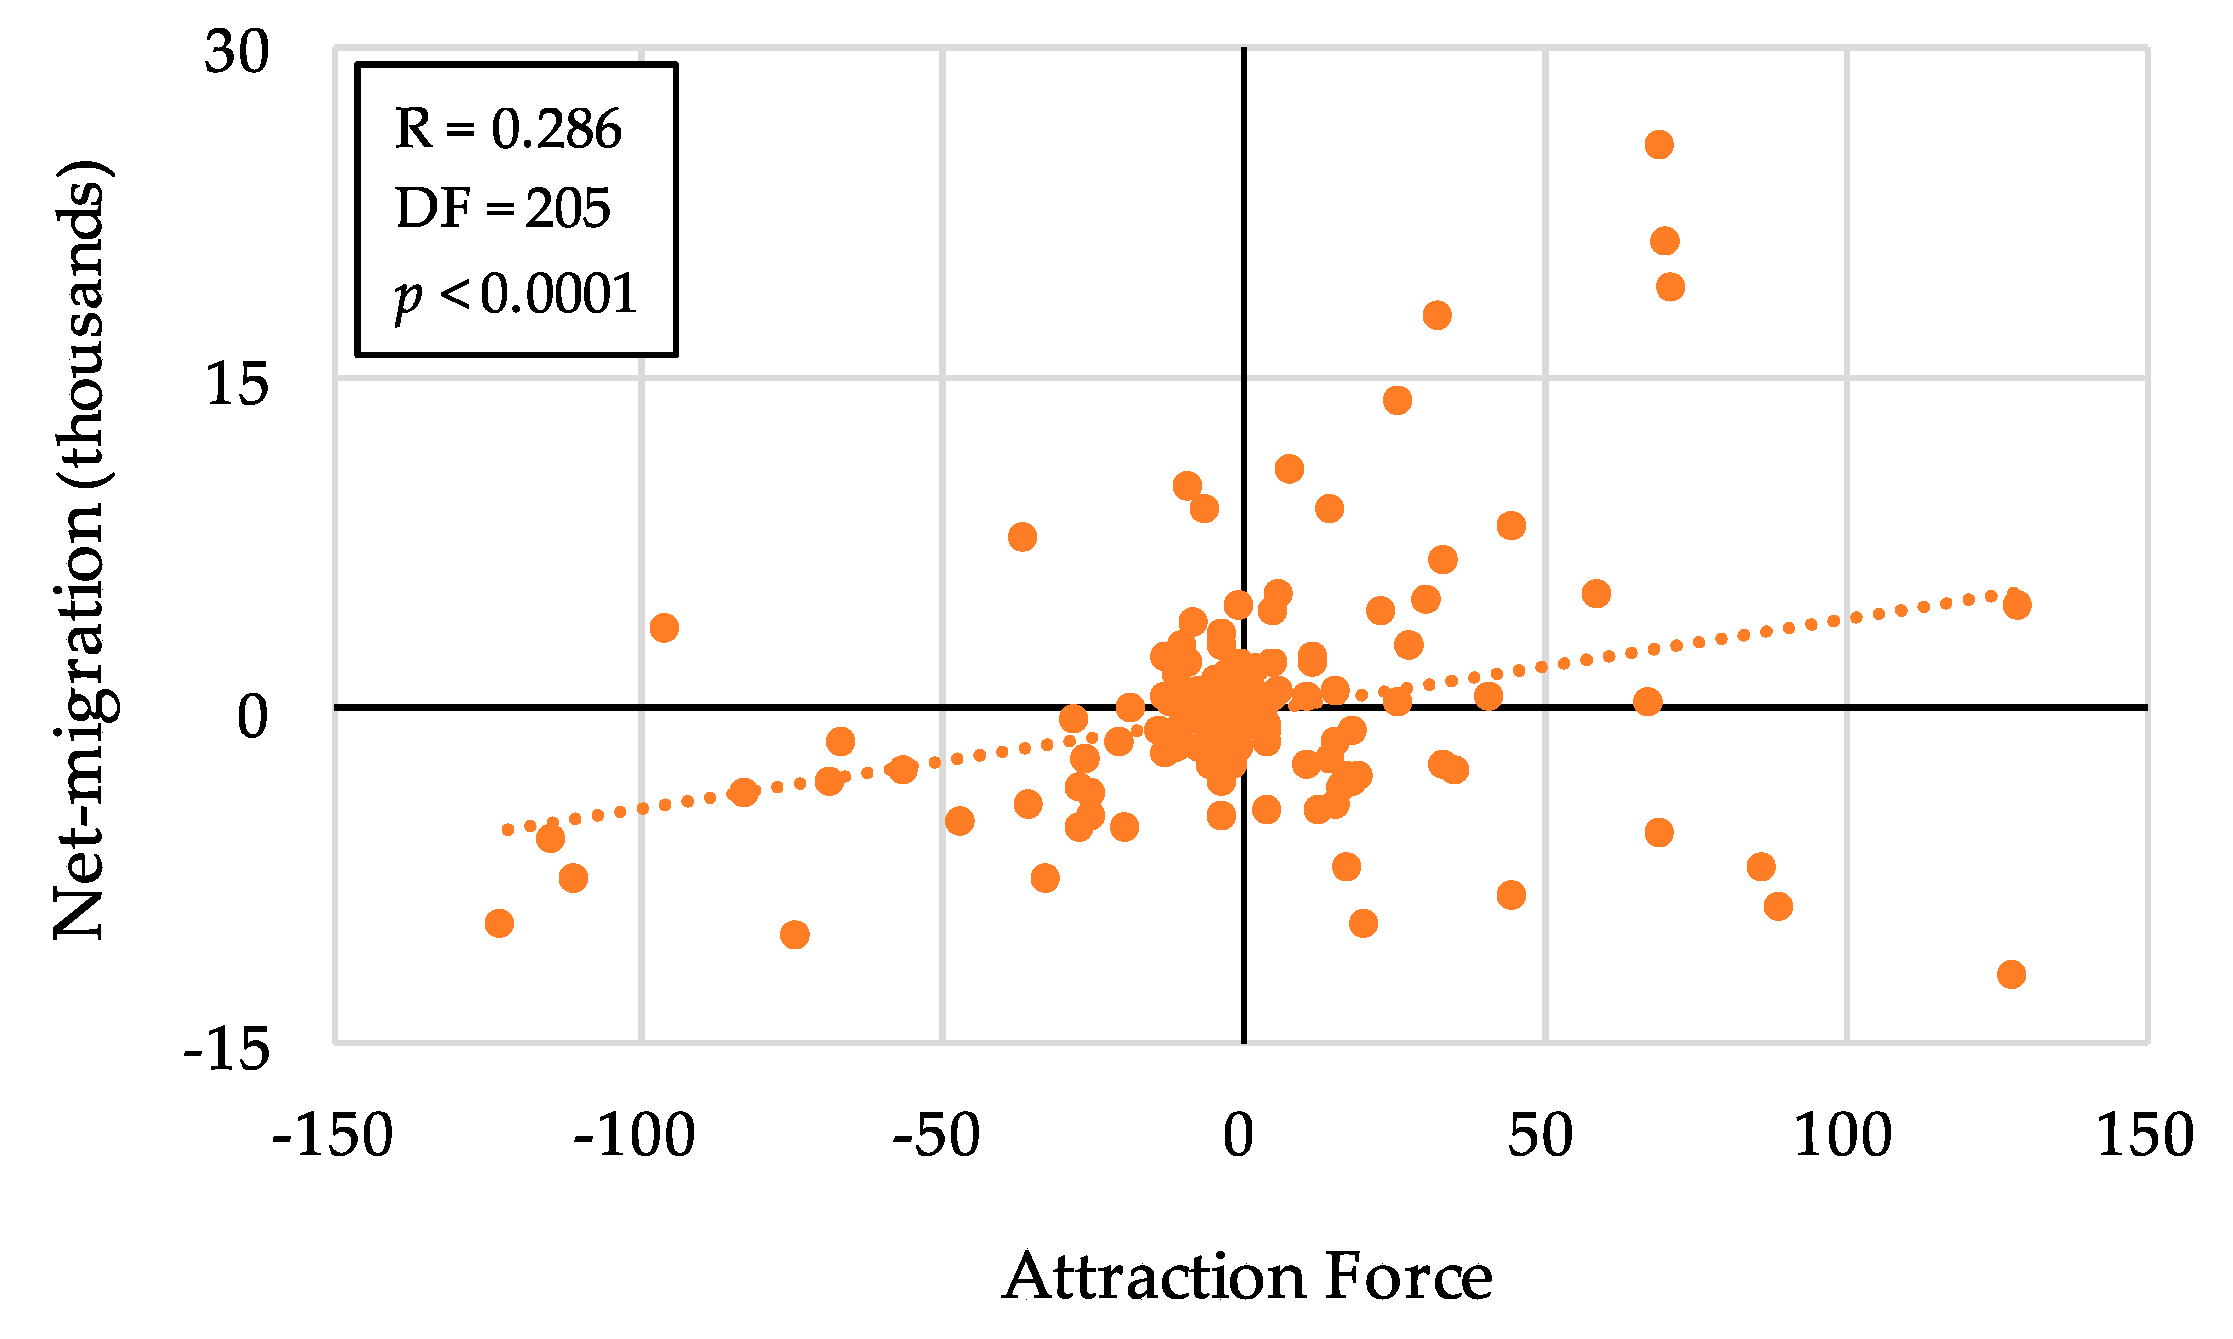
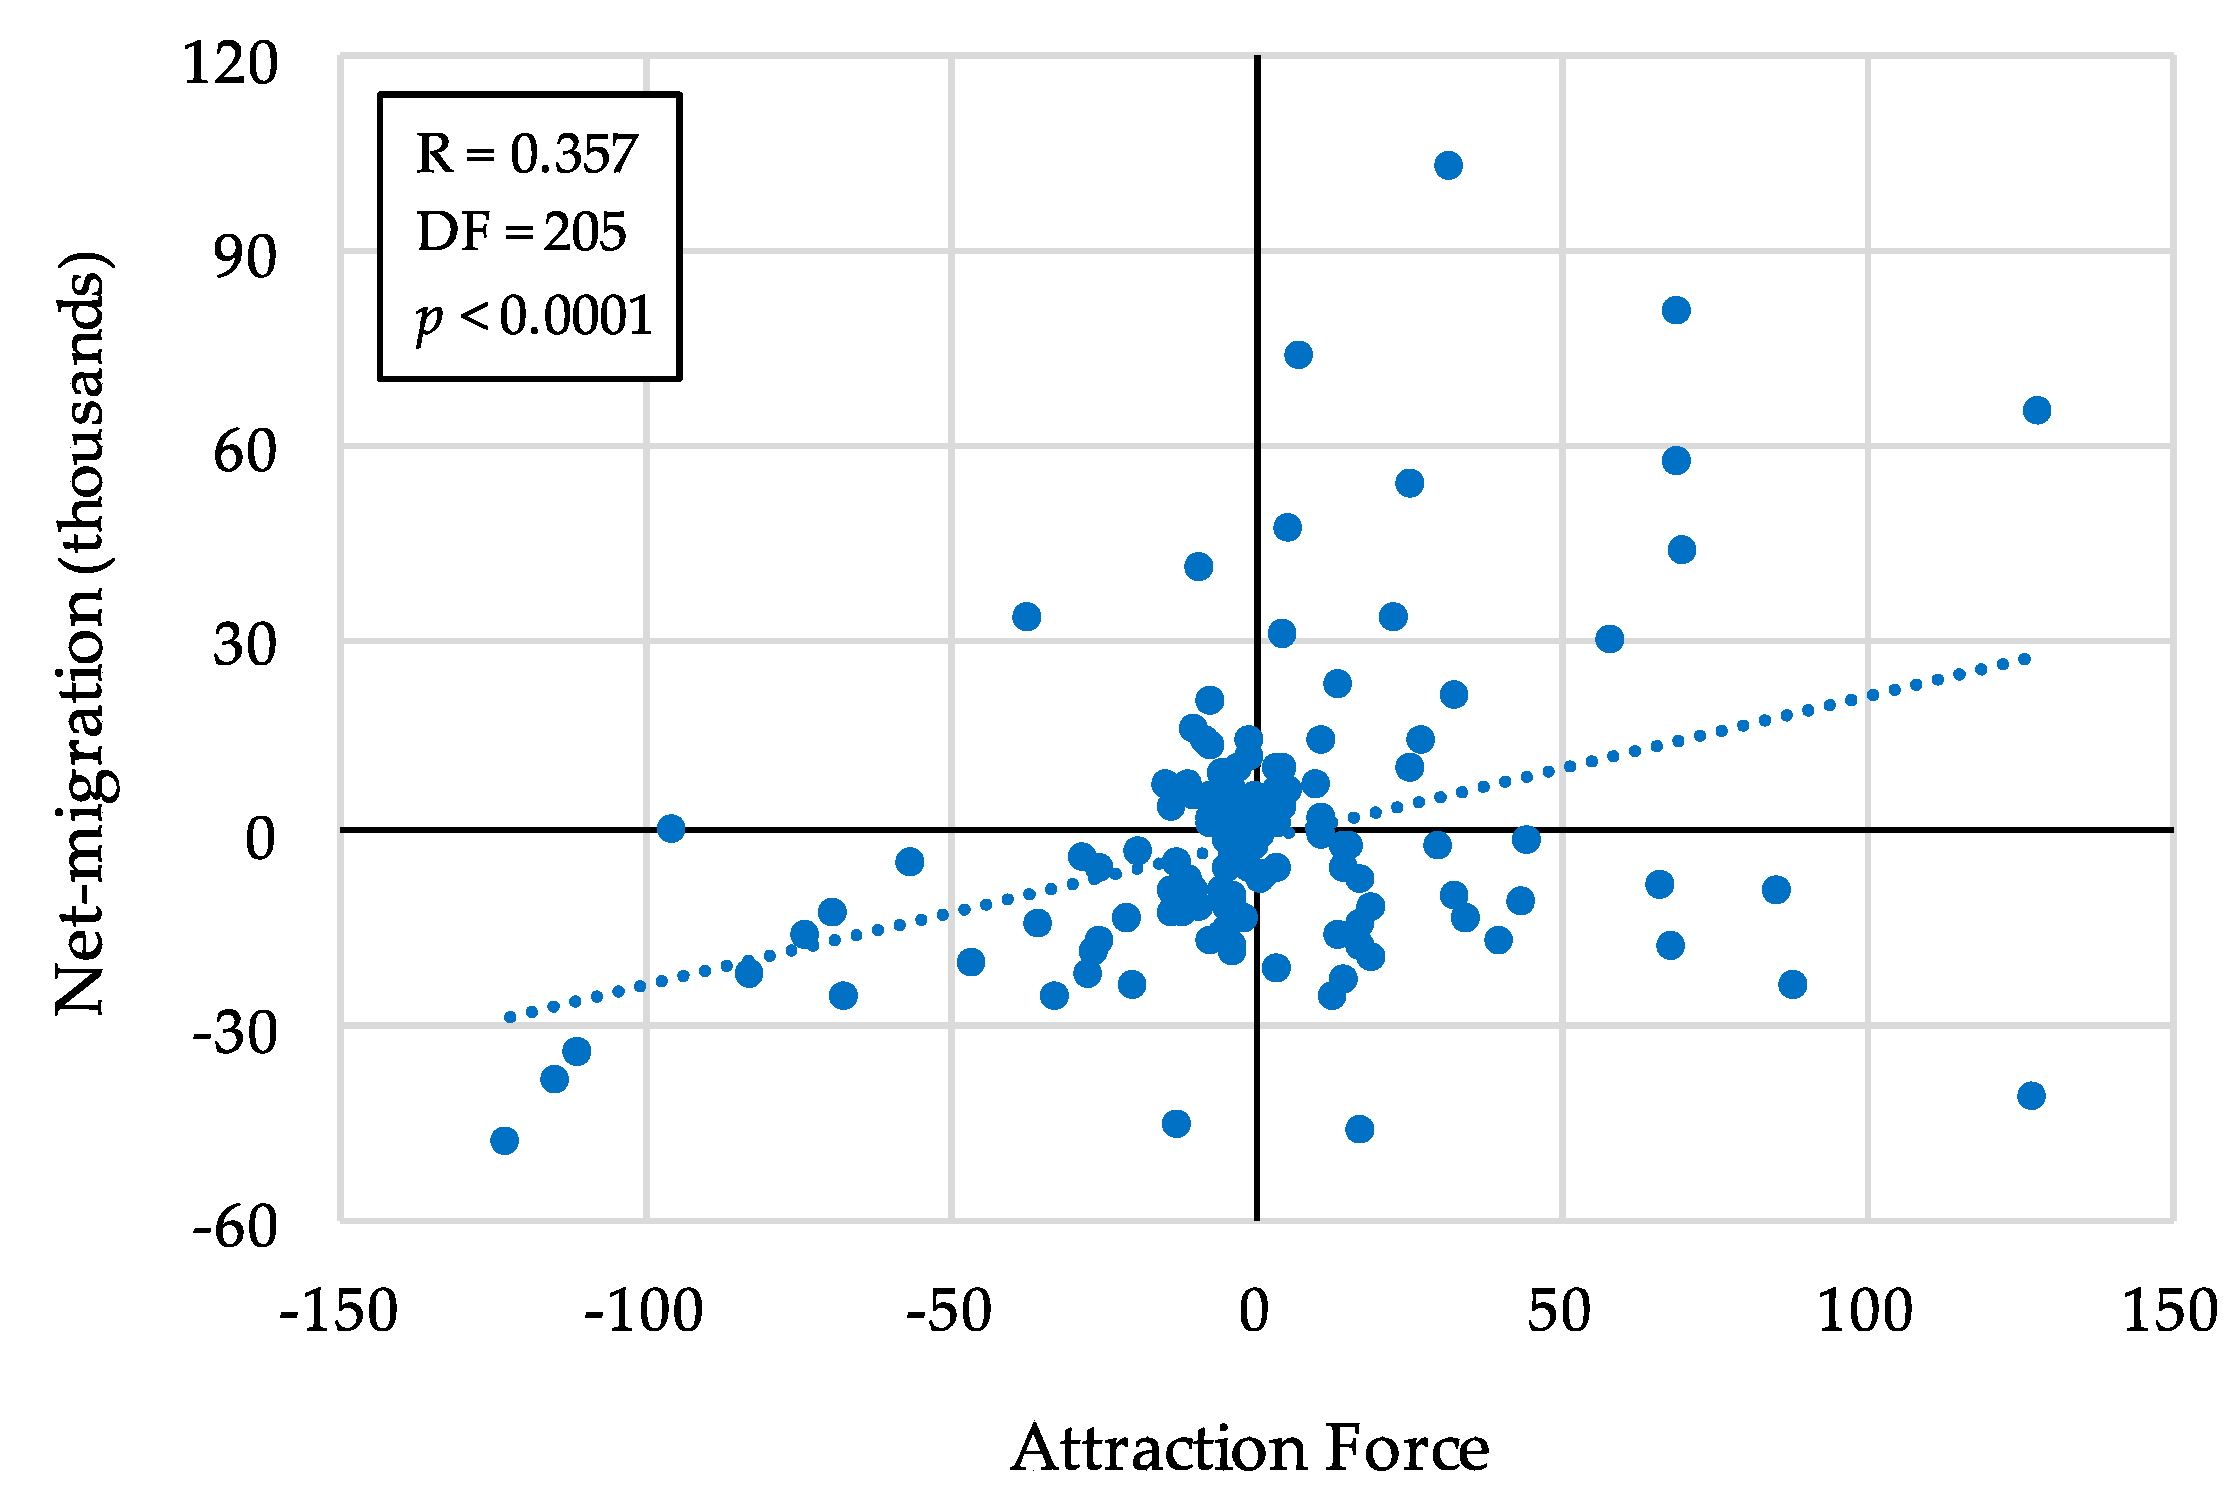
This paper estimated the Pearson’s R correlation between the evaluated attraction force and the real observed net migration. Figure 8 shows the relationship between the attraction force and net migration in 2011, and Figure 9 shows the relationship between the attraction force and the net migration over the period of 2011–2015. The results revealed that the correlation between the attractive force and the net migration in 2011 in 207 cities and counties is very significant, moderate, and positive. The R coefficient was 0.286 and p-value is less than 0.0001. The correlation between net migration during 2011–2015 and the attractive force was also estimated, and it was revealed as very significant, moderate, and positive with an R coefficient of 0.357 and p-value of less than 0.0001. Considering that the interactions and attraction forces are evaluated from the entropy of industrial diversity, it can be inferred that the spatial interactions can be explained by the geographic disproportionality of the diversity in regional industry.
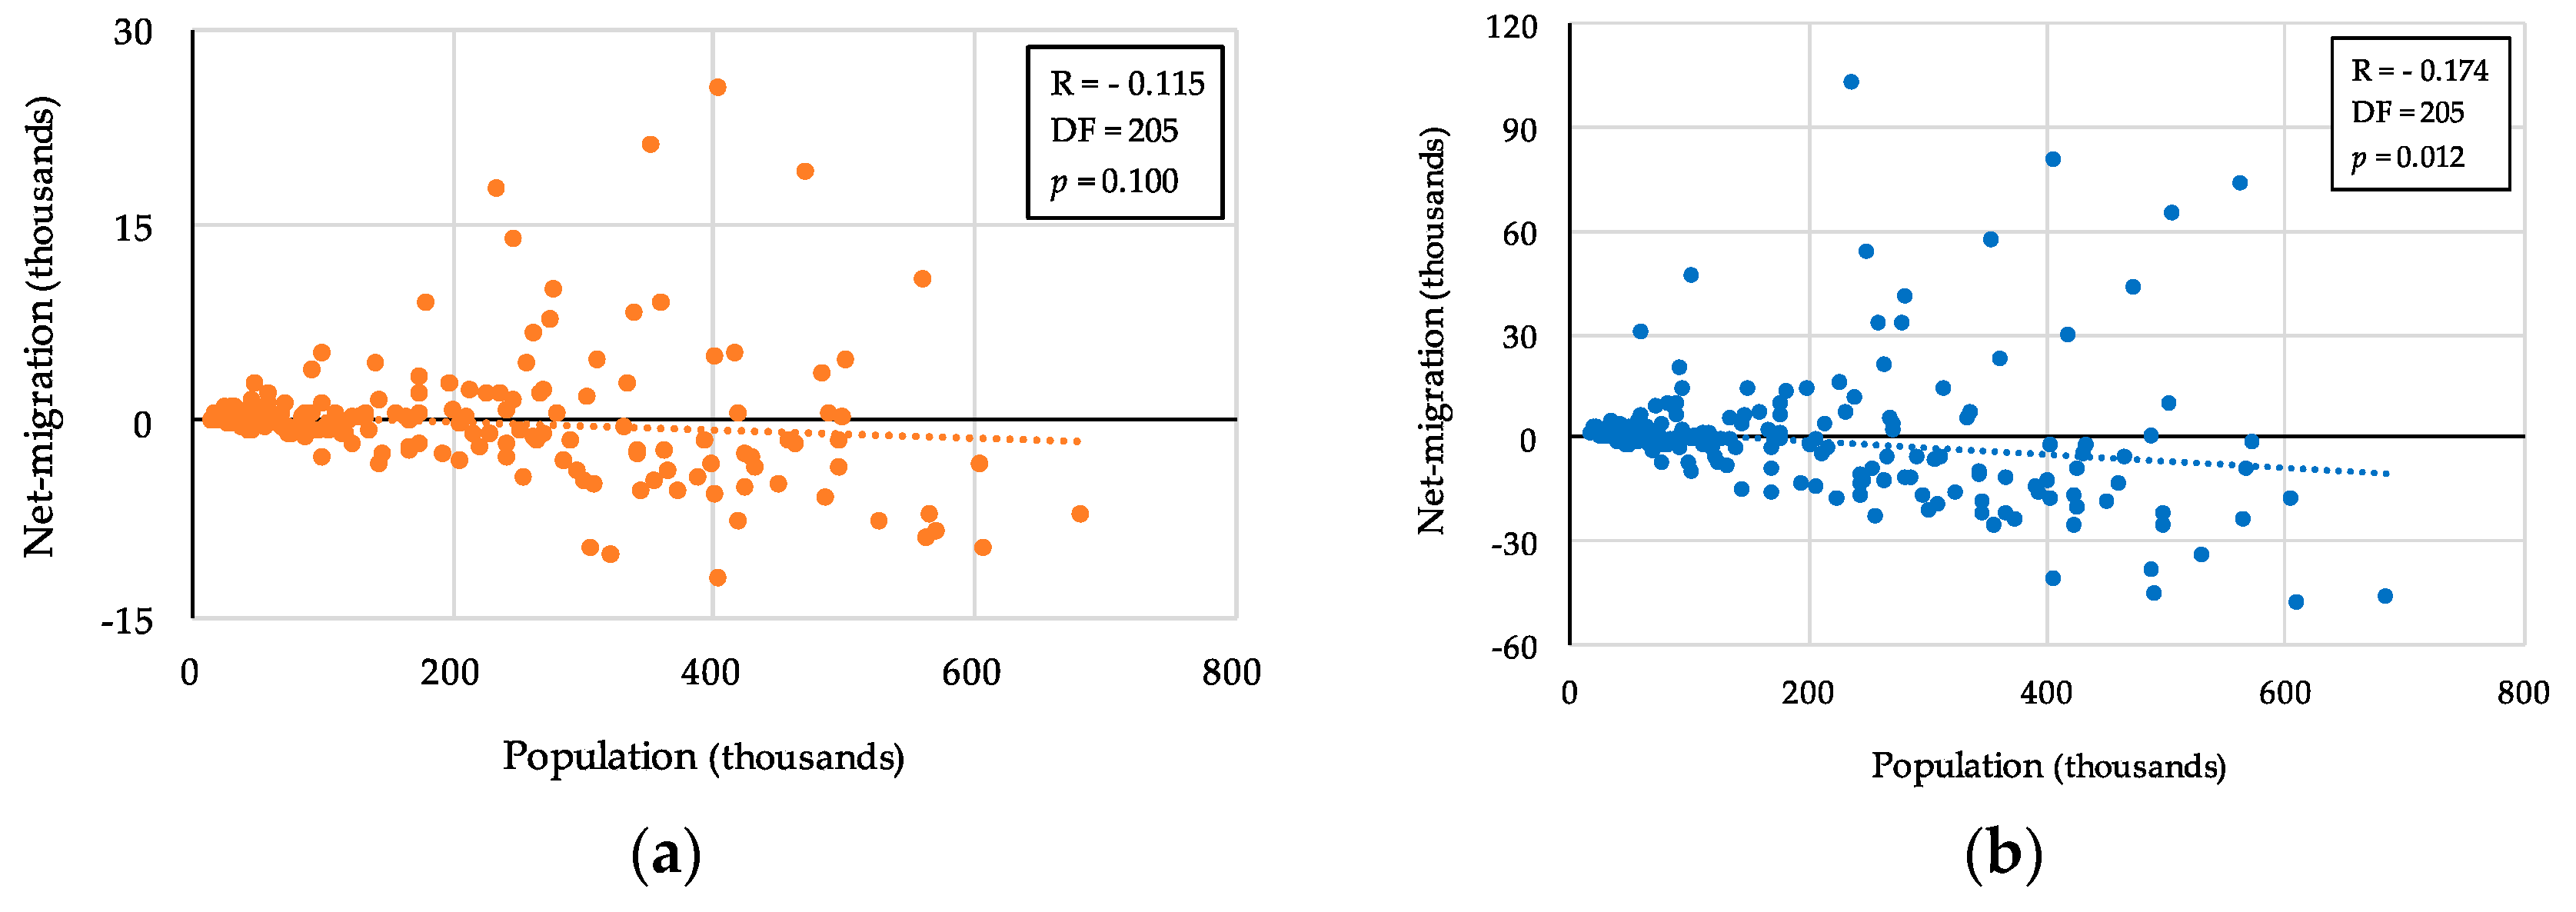
For comparison, correlations between net migration and factors of population, GRDP per capita, employment rate, and industrial diversity by SIC were also estimated. The values are presented in Table 1 and the detailed relationships are illustrated in Figure A1, Figure A2, Figure A3, Figure A4, Figure A5 and Figure A6 of Appendix A. The results show that the evaluated attraction force is the only factor that has a very significant correlation with the net migration in 2011 and during 2011–2015. The introduced factors of entropy and the average profit level of regional industry also have significant correlation with net migration. However, the value of the R coefficient is lower than that of the attraction force. This is interpreted to mean that the geographical disproportionality of the diversity and the profit level of regional industry explains the growth of regional population more significantly.
Compared with other gravity-based migration models, the explanation power of the introduced model is stronger than that of the traditional gravity models and weaker than that of the doubly-constrained models known for their high explanation power. This proves that the geographic condition of diversity in regional industry explains inter-regional migration better than population does, however, not better than previous inter-regional inflows and outflows does. Explanatory models explore the causality and predictive models investigate the statistical trends [55]. In the field of the inter-regional migration, the explanatory models explore what makes people move from one region to another and the predictive models estimate how many people will move. Generally, the predictive migration models show high correlation between their prediction results and the observations since they analyze the previous migration data, inflows, and outflows, of which correlations with observed migration are already high. On the other hand, explanation models related to human behavior show relatively low correlation. According to the results of Cohen [56], and Oswald and Wu [57], above a value of 0.3 for the Pearson R correlation related with human behavior means that there is a considerable relationship.
5. Conclusions
Proper population is essential for regional economic sustainability. However, population levels are suffering due to the depopulation in a large number of regions in South Korea. This decline is mainly caused by inter-regional migration. This paper focused on the cause of inter-regional migration and explored how the geographic conditions of regional industry affect the spatial interactions. Diversity is a major factor that explains the sustainability of the economic environment. Profit is a major reason why people move to another region. This paper combined these two elements as a factor affecting population inflow. It was assumed that a spatial imbalance of the diversity and profit caused the demographic spatial interactions. Based on this concept, a modified spatial interaction model was introduced to discover the effect of the geographic disproportionality of industrial diversity on inter-regional migration. The introduced model applied the entropy of information theory to quantify the diversity, and adopted the notion of virtual work to optimize its parameters. In the diversity estimation, a classification by industrial profit per employee was applied instead of the conventional SIC.
The 207 cases of regions, cities and counties in South Korea were applied to the introduced model and spatial interactions were simulated with the optimized function. The attraction force of the 207 regions were evaluated and these values were compared with real net migration. The results showed that there are significant correlations of net migration with the factors of diversity and profit efficiency. More remarkably, the correlation between the evaluated attraction force and net migration was very significant. Considering the attraction force was evaluated from uneven spatial conditions, the geographic disproportionality had a great effect on the spatial interactions. Correlations of net migration with factors of population, GRDP per capita, and employment rate were also estimated, but the relationships were not as significant as that of the introduced attractive force. These results prove that the diversity and profit of regional industries synthetically determine the multi-regional demographic interactions according to their geographic conditions. It will extend the understanding of the inter-regional migration from the previous works that focused on the relationship between economic factors and migration, and also from the works that explored spatial interactions with demographic factors.
Numerous regions suffering from depopulation are trying to encourage population growth for the sustainable development of regional economy. As the birthrate is renewing its lowest record in South Korea, migration is considered to be the only way to increase or maintain the population. A large number of regional industry policies are aimed at encouraging an influx of people. They are focusing on high-profit industries or various industries by SIC, not considering the situations of neighboring regions. However, the results show that the industrial diversity by profit level and its balance with neighbors are important. This finding can offer advice on the development of regional industry for local policy-makers, for example suggesting the development of middle profit-making industries not located in the vicinity of their regions, instead of an investment in a specific high-technology industry. This paper’s results also prove the effectiveness of the GIS based geographical approach for the investigation of the spatial interactions that lead to regional population change. They revealed potential depopulation regions in South Korea. These results can assist policy-makers of national government in the identification of potential problem regions that should be considered when planning regional development.
This paper concludes that the diversity of regional industry has an obvious effect on inter-regional migration and that the spatial disproportionality of that condition has a significant relationship with the spatial interactions. It does not deny the explanation of the conventional factors in relation to inter-regional migration. Instead, it puts emphasis on the significance of spatial balance and its consideration. The paper will extend the understanding of the explanation of the inter-regional migration and provide an additional dimension for the predictive migration models.
Supplementary Materials
The following are available online at www.mdpi.com/2220-9964/6/11/352/s1. Table S1: Properties of the regions; Table S2: Details of categories by SIC; Table S3: Estimated results; Code C1: InterectionSimulator.java.
Author Contributions
Jemyung Lee formulated and implemented this study and Satoshi Hoshino suggested and coordinated this study.
Conflicts of Interest
The authors declare no conflict of interest.
Appendix A
This appendix presents figures of correlations between net migration and factors of population, Gross Regional Domestic Product (GRDP) per capita, employment rate, and industrial diversity by SIC.
Figure A1.
Population in 2010 and observed net migration: (a) in 2011; and (b) during 2011–2015.

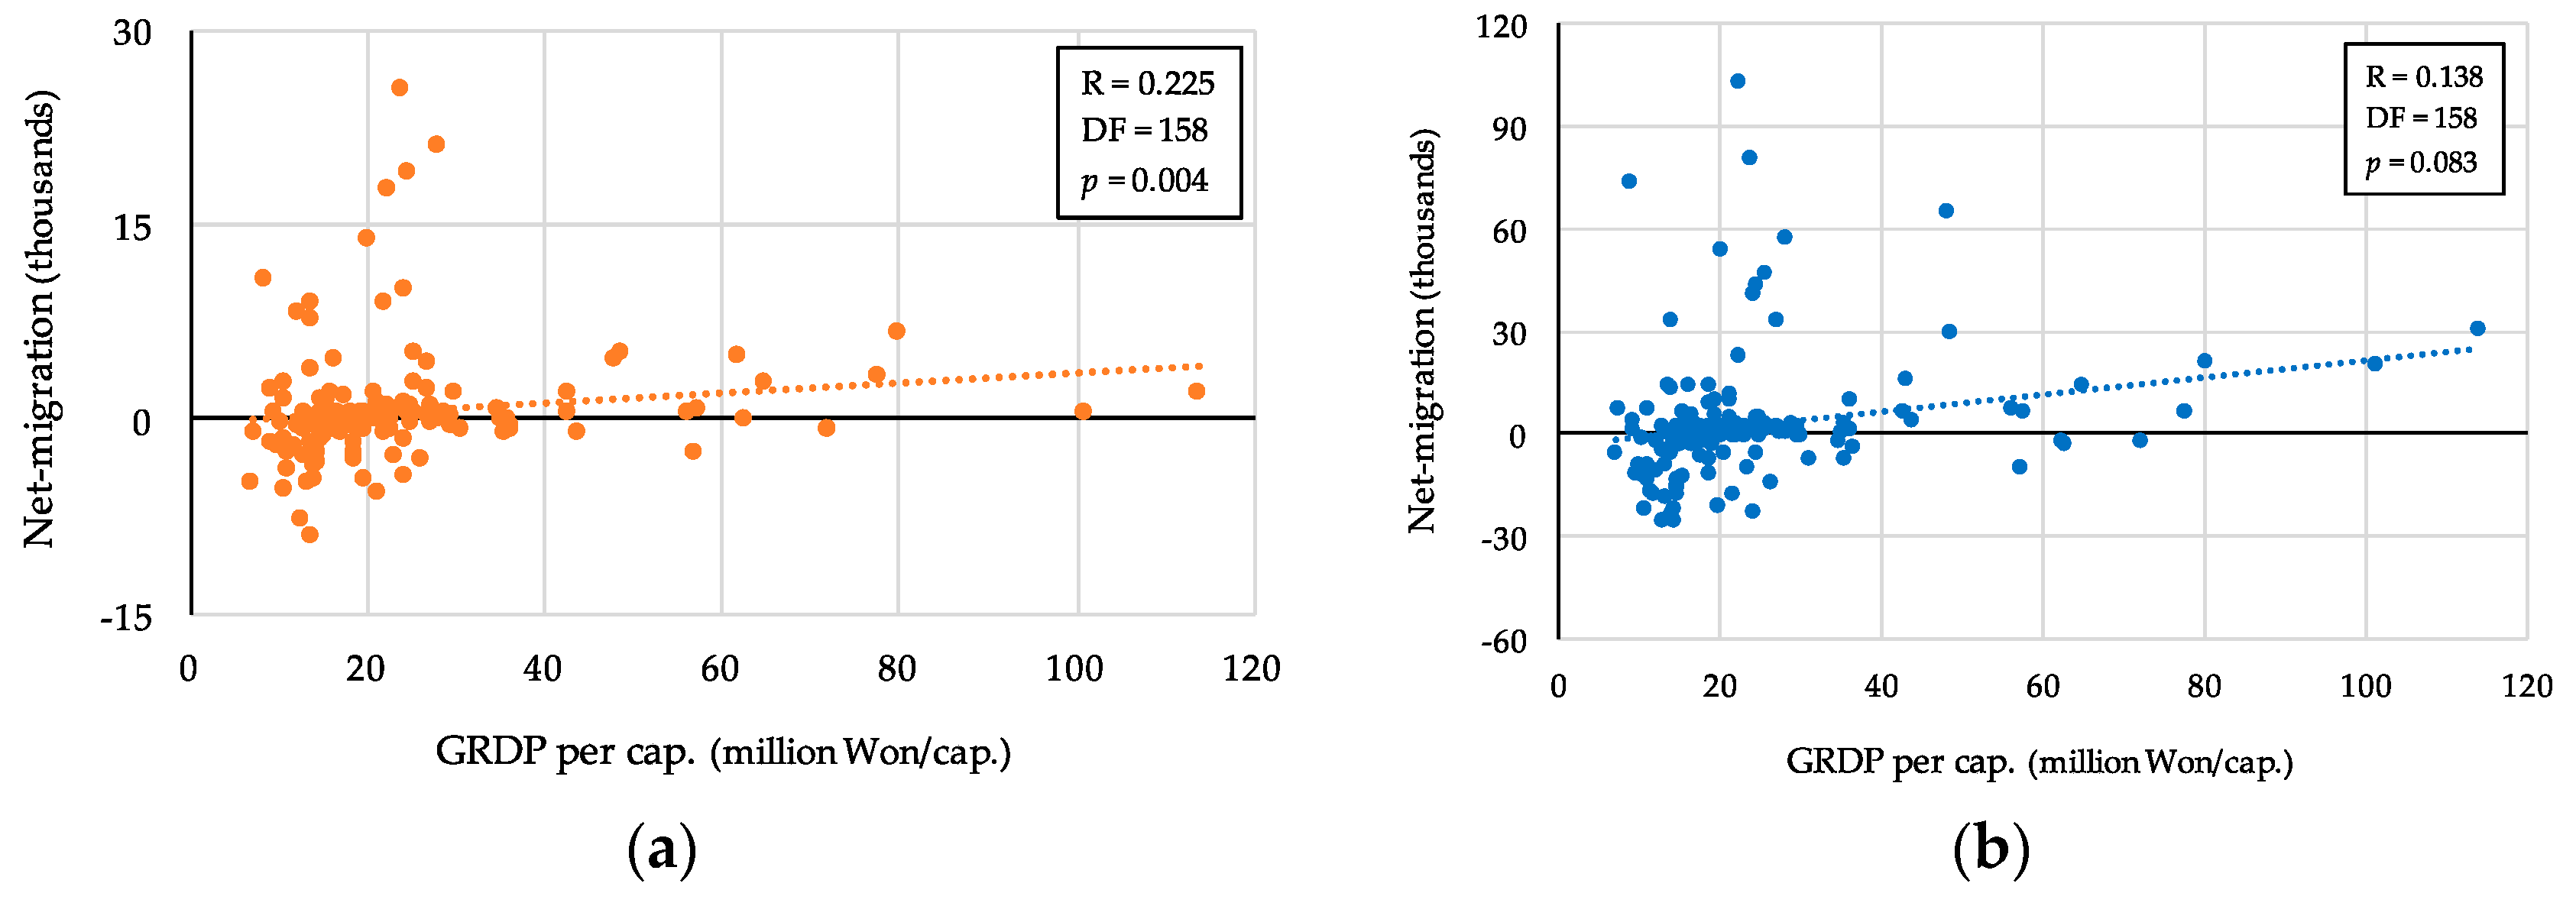
Figure A2.
Grose Regional Domestic Product (GRDP) per capita in 2010 and observed net migration: (a) in 2011; and (b) during 2011–2015.
Figure A2.
Grose Regional Domestic Product (GRDP) per capita in 2010 and observed net migration: (a) in 2011; and (b) during 2011–2015.

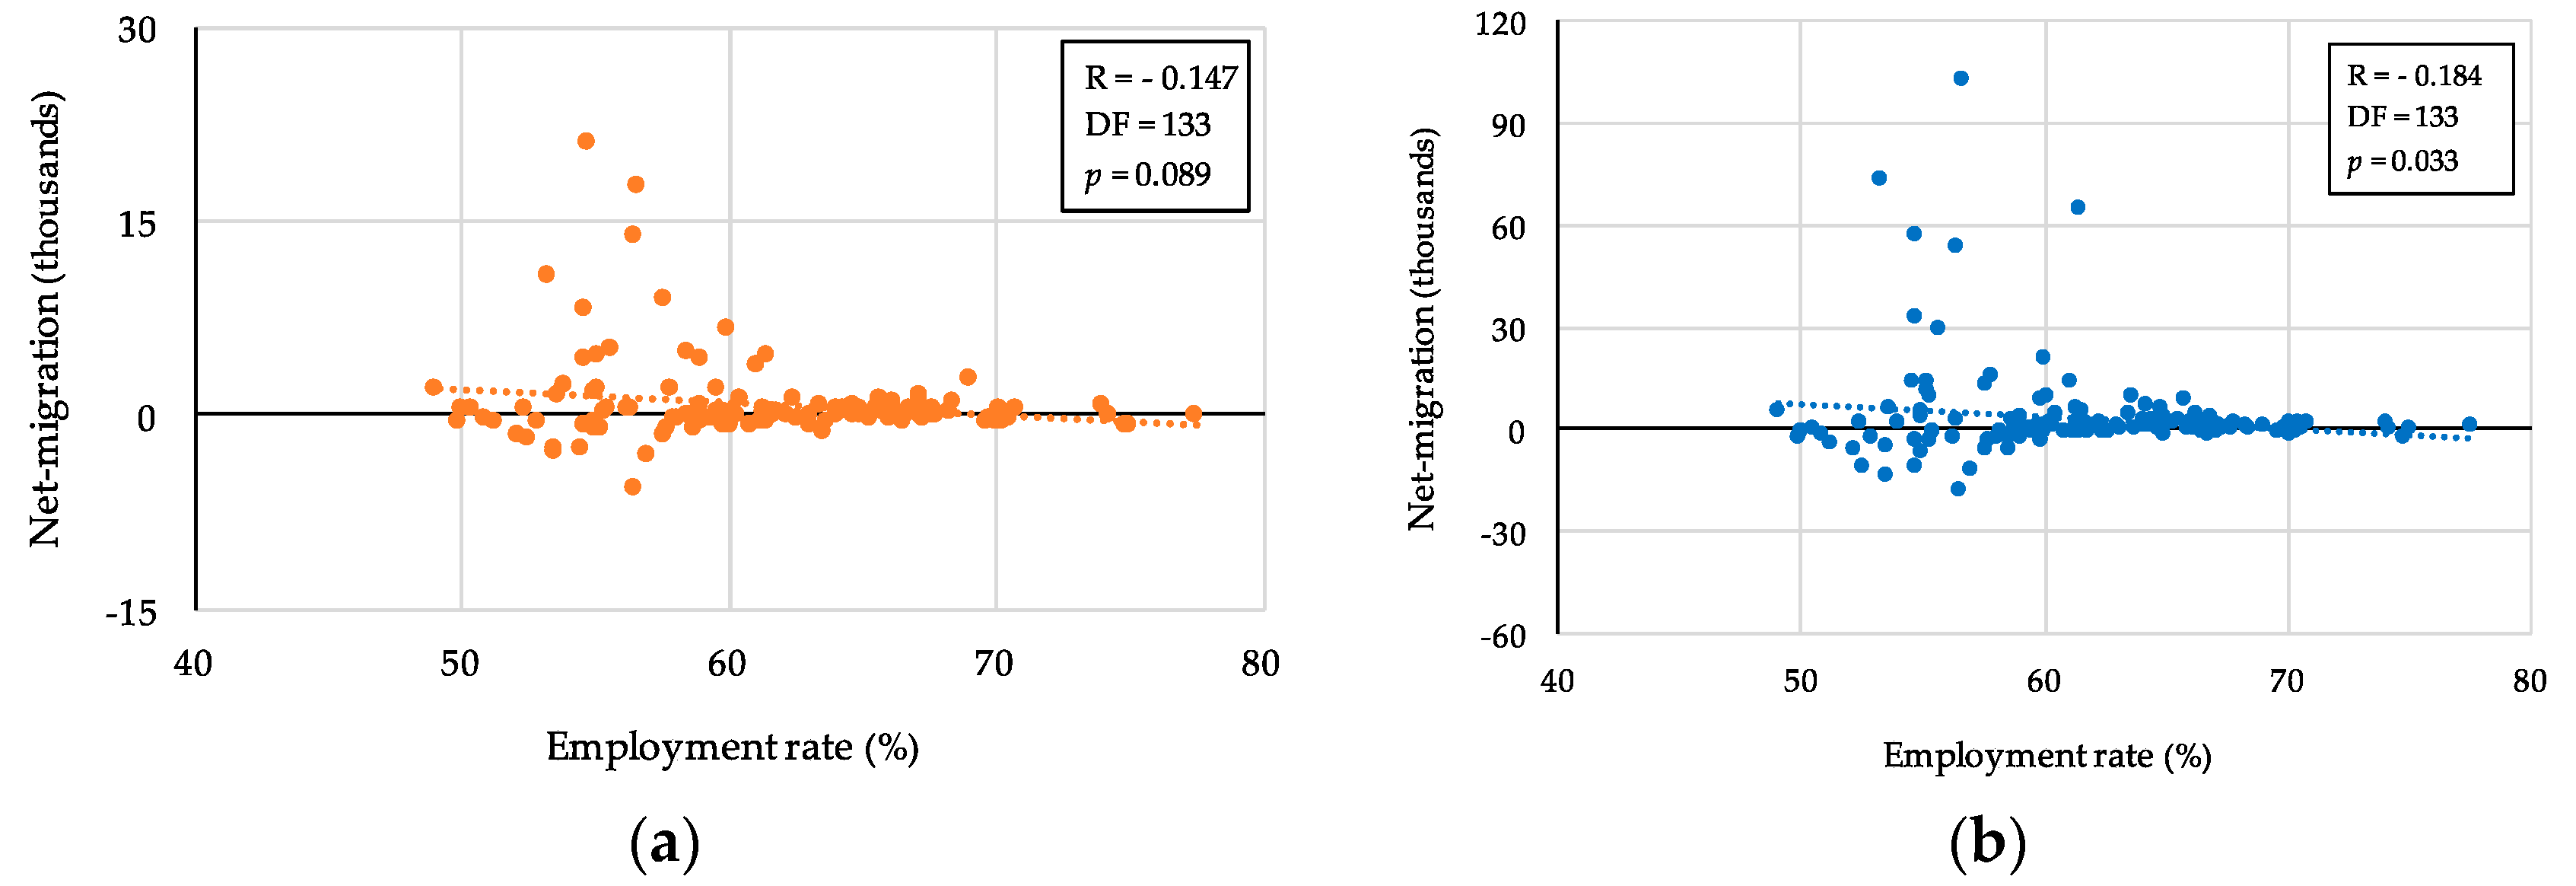
Figure A3.
Employment rate in 2010 and observed net migration: (a) in 2011; and (b) during 2011–2015.
Figure A3.
Employment rate in 2010 and observed net migration: (a) in 2011; and (b) during 2011–2015.

Figure A4.
Entropy of the industrial distribution in SIC in 2010 and observed net migration: (a) in 2011; and (b) during 2011–2015.
Figure A4.
Entropy of the industrial distribution in SIC in 2010 and observed net migration: (a) in 2011; and (b) during 2011–2015.

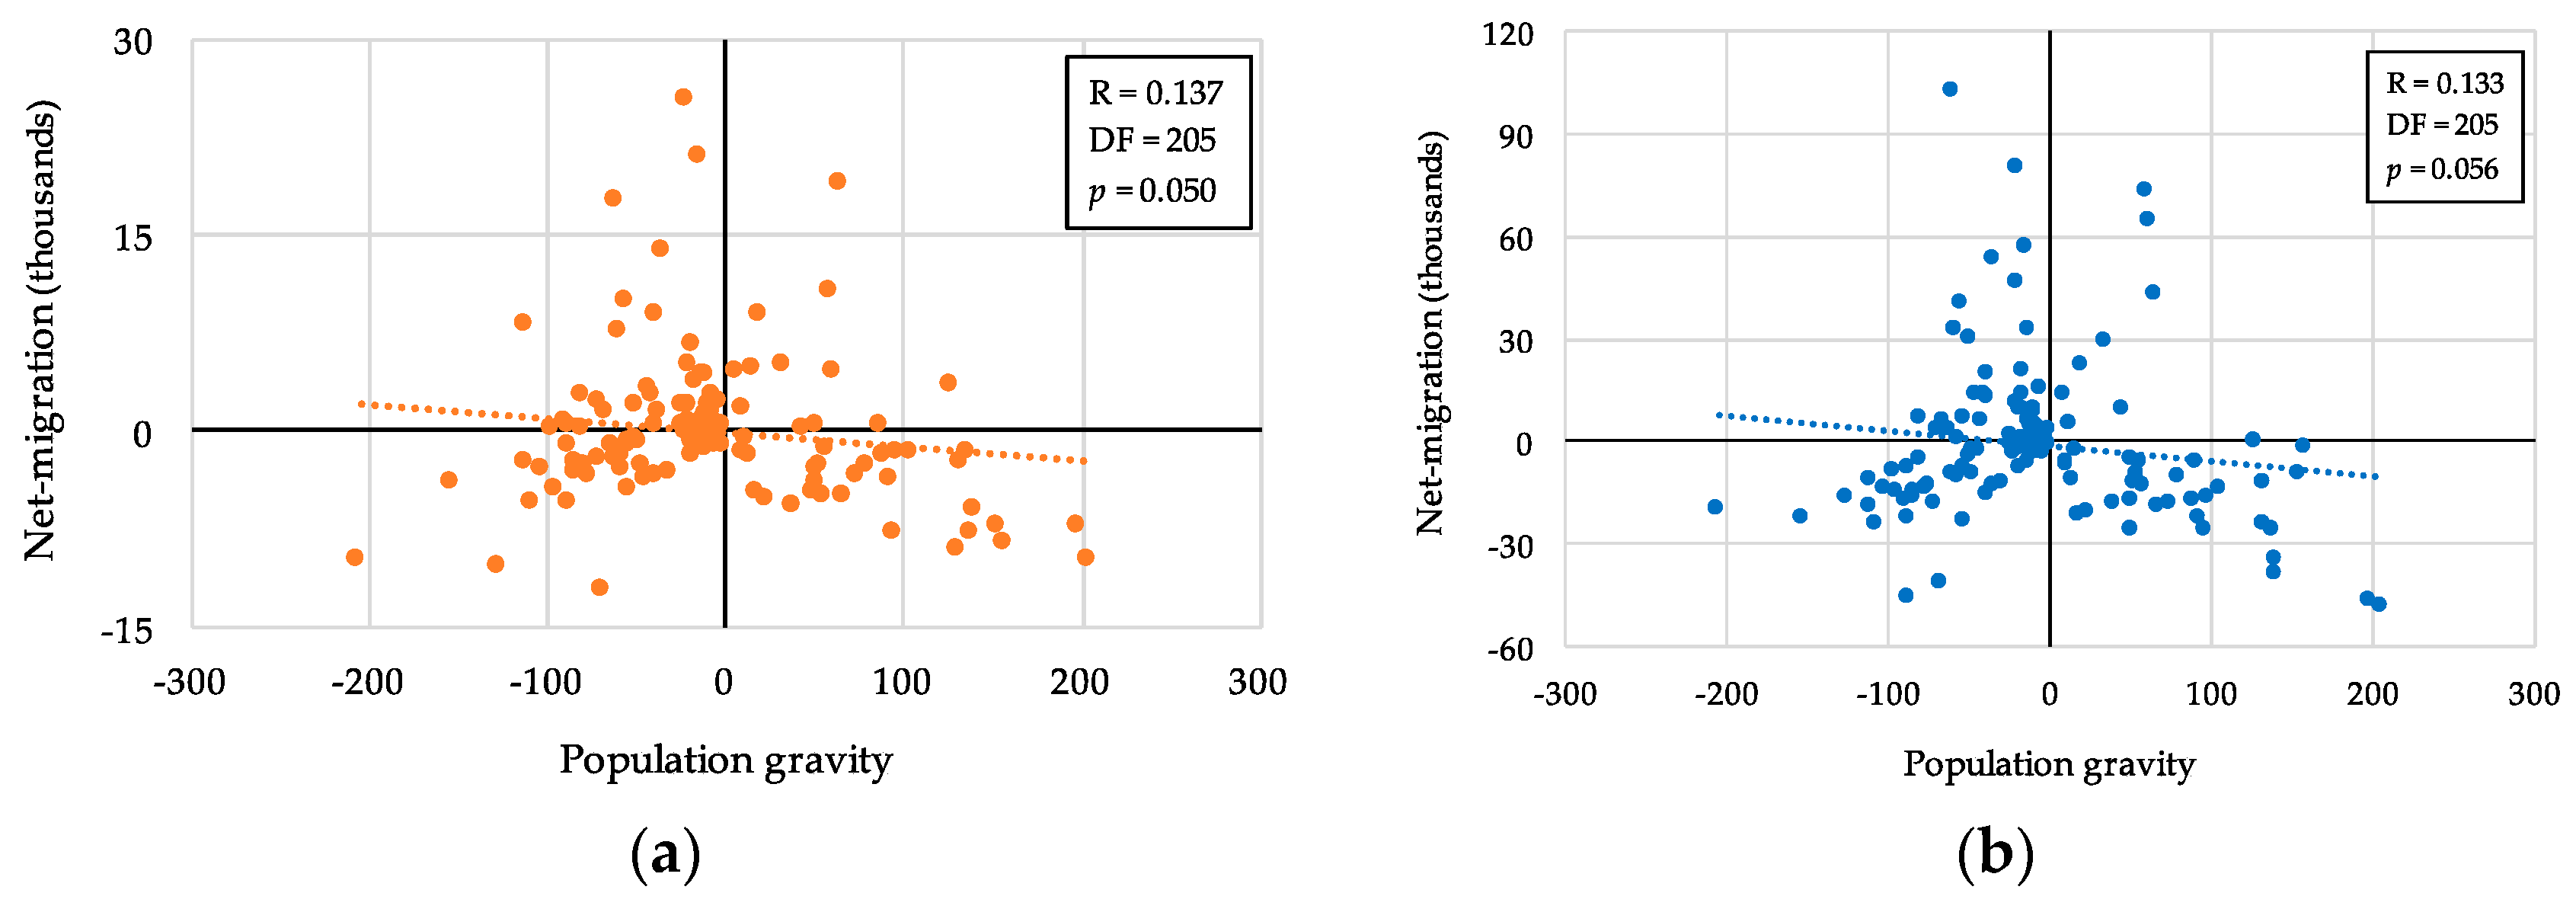
Figure A5.
Population gravity in 2010 by the traditional gravity model with a power function and observed net migration: (a) in 2011; and (b) during 2011–2015.
Figure A5.
Population gravity in 2010 by the traditional gravity model with a power function and observed net migration: (a) in 2011; and (b) during 2011–2015.

Figure A6.
Population gravity at 2010 by traditional gravity model with exponential function and observed net-migration: (a) in 2011; and (b) during 2011–2015.
Figure A6.
Population gravity at 2010 by traditional gravity model with exponential function and observed net-migration: (a) in 2011; and (b) during 2011–2015.

References
- David, W.E. Japan’s Shrinking Regions in the 21st Century: Contemporary Responses to Depopulation and Socioeconomic Decline. Reg. Stud. 2012, 46, 1275–1276. [Google Scholar] [CrossRef]
- Wegren, S.K. The Quest for Rural Sustainability in Russia. Sustainability 2016, 8, 602. [Google Scholar] [CrossRef]
- Farrell, K. The Rapid Urban Growth Triad: A New Conceptual Framework for Examining the Urban Transition in Developing Countries. Sustainability 2017, 9, 1407. [Google Scholar] [CrossRef]
- Li, Y.; López-Carr, D.; Chen, W. Factors Affecting Migration Intentions in Ecological Restoration Areas and Their Implications for the Sustainability of Ecological Migration Policy in Arid Northwest China. Sustainability 2014, 6, 8639–8660. [Google Scholar] [CrossRef]
- Mao, Y.; Liu, Y.; Wang, H.; Tang, W.; Kong, X. A Spatial-Territorial Reorganization Model of Rural Settlements Based on Graph Theory and Genetic Optimization. Sustainability 2017, 9, 1370. [Google Scholar] [CrossRef]
- Feser, E.; Sweeney, S. Out-migration, depopulation, and the geography of US economic distress. Int. Reg. Sci. Rev. 2003, 26, 38–67. [Google Scholar] [CrossRef]
- Puga, D. European regional policies in light of recent location theories. J. Econ. Geogr. 2002, 2, 373–406. [Google Scholar] [CrossRef]
- Bunting, T.; Filion, P. Uneven cities: Addressing rising inequality in the twenty-first century. Can. Geogr. 2001, 45, 126–131. [Google Scholar] [CrossRef]
- Commins, P. Socio-economic adjustments to rural depopulation. Reg. Stud. 1978, 12, 79–94. [Google Scholar] [CrossRef] [PubMed]
- Lee, B.K. The Potential Possibility and Practical Policy Implements for Attracting Enterprises in Rural Areas. J. Agric. Ext. Community Dev. 2013, 20, 173–203. (In Korean) [Google Scholar] [CrossRef]
- Park, S.H.; Jung, Y.H.; Park, G.H. Shrinking population in cities and urban planning for policy action. KRIHS Policy Brief 2013, 422, 1–6. (In Korean) [Google Scholar]
- Keeble, D. Spatial Policy in Britain: Regional or Urban? Area 1977, 9, 3–8. [Google Scholar]
- Biswas, T.; McHardy, J.; Nolan, M.A. Inter-Regional Migration: The UK Experience; Department of Economics, University of Sheffield: Sheffield, UK, 2009; pp. 3–11. ISSN 1749-8368. [Google Scholar]
- Lehmer, F.; Ludsteck, J. The returns to job mobility and inter-regional migration: Evidence from Germany. Pap. Reg. Sci. 2011, 90, 549–571. [Google Scholar] [CrossRef]
- Simini, F.; González, M.C.; Maritan, A.; Barabási, A.L. A universal model for mobility and migration patterns. Nature 2012, 484, 96–100. [Google Scholar] [CrossRef] [PubMed] [Green Version]
- Bhattacharya, C.B.; Moffitt, U. Migration, Sustainable Development and the Role of Business. UN Chron. 2013, 50, 22–25. [Google Scholar] [CrossRef]
- United Nations Conference on Sustainable Development (UNCSD). Migration and Sustainable Development. Rio+20 Issues Briefs 2012, 15, 1–7. [Google Scholar]
- Attaran, M. Industrial diversity and economic performance in U.S. areas. Ann. Reg. Sci. 1986, 20, 44–54. [Google Scholar] [CrossRef]
- Malizia, E.E.; Ke, S. The Influence of Economic Diversity on Unemployment and Stability. J. Reg. Sci. 1993, 33, 221–235. [Google Scholar] [CrossRef]
- Clarke, J.I. Population and Development Projects in Africa, 1st ed.; Cambridge University Press: Cambridge, UK, 2009; pp. 41–52. ISBN 978-0-521-12561-1. [Google Scholar]
- Yang, C.; Han, H.; Song, J. Spatial Distribution of Migration and Economic Development: A Case Study of Sichuan Province, China. Sustainability 2014, 6, 6509–6528. [Google Scholar] [CrossRef]
- Tan, R.; Zhou, K.; He, Q.; Xu, H. Analyzing the Effects of Spatial Interaction among City Clusters on Urban Growth—Case of Wuhan Urban Agglomeration. Sustainability 2016, 8, 759. [Google Scholar] [CrossRef]
- Rodrigue, J.P.; Comtois, C.; Slack, B. Transportation and Geography. In The Geography of Transport Systems, 3rd ed.; Routledge: New York, NY, USA, 2013; pp. 1–41. ISBN 978-0-415-48324-7. [Google Scholar]
- Haynes, K.E.; Fotheringham, A.S. Gravity and Spatial Interaction Models; Sage Publications: Beverly Hills, CA, USA, 1984; pp. 5–28. ISBN 978-0803923263. [Google Scholar]
- Reilly, W.J. The Law of Retail Gravity; William J. Reilly: New York, NY, USA, 1931; pp. 3–34. [Google Scholar]
- Alonso, W. A Theory of Movements. In Human Settlement Systems: International Perspectives on Structure, Change and Public Policy; Hansen, N.M., Ed.; Ballinger: Cambridge, MA, USA, 1978; pp. 197–211. ISBN 978-0884101765. [Google Scholar]
- Sen, A.; Smith, T.E. Gravity Models of Spatial Interaction Behavior; Springer: Berlin/Heidelberg, Germany, 1995; pp. 15–152. ISBN 978-3-642-79882-5. [Google Scholar]
- Westerlund, J.; Wilhelmsson, F. Estimating the gravity model without gravity using panel data. Appl. Econ. 2011, 43, 641–649. [Google Scholar] [CrossRef]
- De Vries, J.; Nijkamp, P.; Rietveld, P. Alonso’s Theory of Movements: Developments in Spatial Interaction Modeling. J. Geogr. Syst. 2001, 3, 233–256. [Google Scholar] [CrossRef]
- Griffith, D.A.; Fischer, M.M. Constrained variants of the gravity model and spatial dependence: Model specification and estimation issues. J. Geogr. Syst. 2013, 15, 291–317. [Google Scholar] [CrossRef]
- Shannon, C.E. A mathematical theory of communication. Bell Syst. Tech. J. 1948, 27, 379–423. [Google Scholar] [CrossRef]
- Attaran, M.; Zwick, M. Entropy and Other Measures of Industrial Diversification. Q. J. Bus. Econ. 1987, 26, 17–34. [Google Scholar]
- Fotheringham, A.S.; Webber, M.J. Spatial structure and the parameters of spatial interaction models. Geogr. Anal. 1980, 12, 33–46. [Google Scholar] [CrossRef]
- Champion, T.; Fotheringham, S.; Rees, P.; Boyle, P.; Stillwell, J. The Determinants of Migration Flows in England: A Review of Existing Data and Evidence; Report Prepared for the Department of the Environment, Transport and the Regions; The Department of Geography University of Newcastle upon Tyne: Newcastle upon Tyne, UK, 1998; pp. 31–128. ISBN 0-902155-39-3. [Google Scholar]
- Smith, S.K.; Tayman, J.; Swanson, D.A. State and Local Population Projections: Methodology and Analysis; Kluwer Academic: Norwell, MA, USA; Plenum Publishers: New York, NY, USA, 2001; pp. 97–136. ISBN 0-306-46493-4. [Google Scholar]
- Rogers, A. Demographic Modeling of the Geography of Migration and Population: A Multiregional Perspective. Geogr. Anal. 2008, 40, 276–296. [Google Scholar] [CrossRef]
- Ravenstein, E.G. The Laws of Migration. J. R. Stat. Soc. 1885, 48, 167–235. [Google Scholar] [CrossRef]
- Stouffer, S.A. Intervening opportunities: A theory relating mobility and distance. Am. Sociol. Rev. 1940, 5, 845–867. [Google Scholar] [CrossRef]
- Dodd, S.C. The interactance hypothesis: A gravity model fitting physical masses and human groups. Am. Sociol. Rev. 1950, 15, 245–256. [Google Scholar] [CrossRef]
- Rogerson, P.A.; Plane, D.A. Modeling Temporal Change in Flow Matrices. Pap. Reg. Sci. 1984, 54, 147–164. [Google Scholar] [CrossRef]
- Plane, D.A.; Rogerson, P.A. The Geographical Analysis of Population with Applications to Planning and Business, 1st ed.; Wiley: New York, NY, USA, 1994; pp. 91–126. ISBN 978-0471510147. [Google Scholar]
- Wilson, A.G. A statistical theory of spatial distribution models. Transp. Res. 1967, 1, 253–269. [Google Scholar] [CrossRef]
- Wilson, A.G. The use of entropy maximising models: In the theory of trip distribution, more split and route split. J. Transp. Econ. Policy 1969, 3, 108–126. [Google Scholar]
- Gordon, I.R. Entropy, Variety, Economics, and Spatial Interaction. Geogr. Anal. 2010, 42, 446–471. [Google Scholar] [CrossRef]
- O’Kelly, M.E. Entropy-based spatial interaction models for trip distribution. Geogr. Anal. 2010, 42, 472–487. [Google Scholar] [CrossRef]
- Constantin, D.L. The Use of Gravity Models for Spatial Interaction Analysis. Economy Inform. 2004, 1, 116–118. [Google Scholar]
- Li, J.; Qian, J.; Liu, Y. A Novel Analysis Method of Geographical Centrality Based on Space of Flows. ISPRS Int. J. Geo-Inf. 2017, 6, 153. [Google Scholar] [CrossRef]
- Wilson, A.G. Entropy in Urban and Regional Modelling: Retrospect and Prospect. Geogr. Anal. 2010, 42, 364–394. [Google Scholar] [CrossRef]
- Curry, L. A Spatial Analysis of Gravity Flows. Reg. Stud. 1972, 6, 131–147. [Google Scholar] [CrossRef]
- Plane, D.A. Migration space: Doubly constrained gravity model mapping of relative interstate separation. Ann. Assoc. Am. Geogr. 1984, 74, 244–256. [Google Scholar] [CrossRef]
- Boyle, P.J.; Flowerdew, R. Improving Distance Estimates between Areal Units in Migration Models. Geogr. Anal. 1997, 29, 93–107. [Google Scholar] [CrossRef]
- Statistics Korea (KOSTAT), Korean Statistical Information Service (KOSIS). Available online: http://kosis.kr/statisticsList/statisticsList_01List.jsp (accessed on 3 May 2017).
- Environmental Systems Research Institute (ESRI). ArcGIS Desktop: Release 10.3; Environmental Systems Research Institute: Redlands, CA, USA, 2014. [Google Scholar]
- Bastian, M.; Heymann, S.; Jacomy, M. Gephi: An open source software for exploring and manipulating networks. In Proceedings of the Third International AAAI Conference on Weblogs and Social Media, San Jose, CA, USA, 17–20 May 2009. [Google Scholar]
- Shmueli, G. To Explain or to Predict? Stat. Sci. 2010, 25, 289–310. [Google Scholar] [CrossRef]
- Cohen, J. Statistical Power Analysis for the Behavioral Sciences, 2nd ed.; Lawrence Erlbaum Associates: Mahwah, NJ, USA, 1988; pp. 109–143. ISBN 978-0-12-179060-8. [Google Scholar]
- Oswald, A.J.; Wu, S. Objective Confirmation of Subjective Measures of Human Well-Being: Evidence from the U.S.A. Science 2010, 327, 576–579. [Google Scholar] [CrossRef] [PubMed]
Figure 1.
Categories of industry by profit per employee (the negative value means loss).

Figure 2.
Process of attraction force evaluation.

Figure 3.
Distribution of regional industry with the classification by profit level: w is weight; H is entropy; and H′ is the weighted entropy; (a) a moderately low-profit-industry biased region; (b) a moderately high-profit-industry biased region; (c) a high-profit-industry biased region; and (d) a low-profit-industry biased region.

Figure 4.
Weighted entropy of cities and counties in South Korea (illustrated with ArcMapTM 10 [53]): (a) the capital, Seoul, and vicinity; and (b) the second metropolitan area, Busan, and vicinity.
Figure 4.
Weighted entropy of cities and counties in South Korea (illustrated with ArcMapTM 10 [53]): (a) the capital, Seoul, and vicinity; and (b) the second metropolitan area, Busan, and vicinity.

Figure 5.
Optimized distance–friction curve.

Figure 6.
Simulated spatial interactions between cities and counties in South Korea (illustrated with GephiTM [54]): each point is the center of a region.
Figure 6.
Simulated spatial interactions between cities and counties in South Korea (illustrated with GephiTM [54]): each point is the center of a region.

Figure 7.
Population attraction force (normalized) of cities and counties in South Korea (illustrated with ArcMapTM 10 [53]): (a) capital Seoul and vicinity; and (b) metropolitan Busan and vicinity.
Figure 7.
Population attraction force (normalized) of cities and counties in South Korea (illustrated with ArcMapTM 10 [53]): (a) capital Seoul and vicinity; and (b) metropolitan Busan and vicinity.

Figure 8.
Population attraction forces in 2010 and observed net migration in 2011.

Figure 9.
Population attraction forces in 2010 and observed net migration during 2011–2015.


Table 1.
Correlations between net migration and regional factors.
| Factors | D.F. | 2011 | 2011–2015 | ||
|---|---|---|---|---|---|
| R Coefficient | p-Value | R Coefficient | p-Value | ||
| Attraction Force (introduced) | 205 | 0.286 *** | (<0.0001) | 0.357 *** | (<0.0001) |
| Profit level (introduced) 1 | 205 | 0.179 ** | (0.010) | 0.195 *** | (0.005) |
| Entropy of dist. by p.l. (introduced) 2 | 205 | 0.139 ** | (0.045) | 0.139 *** | (0.045) |
| Entropy of dist. by SIC 3 | 204 | –0.018 | (0.793) | –0.061 | (0.381) |
| Population | 205 | –0.115 | (0.100) | –0.174 ** | (0.012) |
| GRDP level 4 | 158 | 0.138 * | (0.083) | 0.225 *** | (0.004) |
| Employment rate | 133 | –0.184 ** | (0.033) | –0.147 * | (0.089) |
| Gravity model (pow. func.) 5 | 205 | 0.137 ** | (0.050) | 0.133 * | (0.056) |
| Gravity model (exp. func.) 6 | 205 | 0.211 *** | (0.002) | 0.212 *** | (0.002) |
* p < 0.1, ** p < 0.05, *** p < 0.01, Note: 1 Average profit per employee; 2 Entropy of employees’ distribution by occupied industries’ profit level; 3 Entropy of employees’ distribution by occupied industries’ SIC; 4 Gross Regional Domestic Product per capita (unit: million Won per capita); 5 Values by the Gravity model with power function; 6 Values by the Gravity model with exponential function; 7 All the values of the factors are presented in Table S3.
© 2017 by the authors. Licensee MDPI, Basel, Switzerland. This article is an open access article distributed under the terms and conditions of the Creative Commons Attribution (CC BY) license (http://creativecommons.org/licenses/by/4.0/).
Share and Cite
MDPI and ACS Style
Lee, J.; Hoshino, S. GIS-Based Evaluation of Spatial Interactions by Geographic Disproportionality of Industrial Diversity. ISPRS Int. J. Geo-Inf. 2017, 6, 352. https://0-doi-org.brum.beds.ac.uk/10.3390/ijgi6110352
AMA Style
Lee J, Hoshino S. GIS-Based Evaluation of Spatial Interactions by Geographic Disproportionality of Industrial Diversity. ISPRS International Journal of Geo-Information. 2017; 6(11):352. https://0-doi-org.brum.beds.ac.uk/10.3390/ijgi6110352
Chicago/Turabian StyleLee, Jemyung, and Satoshi Hoshino. 2017. "GIS-Based Evaluation of Spatial Interactions by Geographic Disproportionality of Industrial Diversity" ISPRS International Journal of Geo-Information 6, no. 11: 352. https://0-doi-org.brum.beds.ac.uk/10.3390/ijgi6110352
Note that from the first issue of 2016, this journal uses article numbers instead of page numbers. See further details here.