Article

A Web-Based Visual and Analytical Geographical Information System for Oil and Gas Data

1
Department of Geomatics Engineering, University of Calgary, Calgary, AB T2N 1N4, Canada
2
School of Information and Technology, Northwest University, Xi’an 710069, China
*
Author to whom correspondence should be addressed.
ISPRS Int. J. Geo-Inf. 2017, 6(3), 76; https://0-doi-org.brum.beds.ac.uk/10.3390/ijgi6030076
Submission received: 8 November 2016 / Revised: 1 March 2017 / Accepted: 3 March 2017 / Published: 9 March 2017
(This article belongs to the Special Issue Web/Cloud Based Mapping and Geoinformation)

Abstract

:
With the development of strategic oil and gas assets, massive spatiotemporal oil and gas data have been accumulated. Application systems that assist in the storage and management of the voluminous and complex oil and gas datasets are in high demand. The voluminous and various data should be leveraged and turned into information for business decision-making and operation assistance. In this paper, we propose a set of visual analytic methods that specialize in oil and gas data; and, we develop a web-based oil and gas data management, visualization and analytical system, called Oil and Gas Visual Exploration System (OGVES). With OGVES, complex and multi-sourced oil and gas data can be stored, searched, filtered, and represented. As a web-based system, the OGVES provides more accessibility, convenience and efficiency than traditional desktop systems. Spatial scales and temporal primitives contained in oil and gas data are discussed. Different visualization methods are then presented to explore and represent spatiotemporal features of the oil and gas data. Various case studies demonstrate the usability of the system.

1. Introduction

The explosion of oil and gas related data accompanies exploration and production expansion. The utilization of the large amount of data accumulated over years is a new challenge and critical for efficient and sustainable exploitation. Application systems that assist in the storage and management of the voluminous and complex oil and gas datasets are in high demand [1]. Several data management services and products are currently on the market, such as GeoCarta [2], Accumap [3] and iGlass [4]; however, most of these commercial software products are standalone desktop software, which makes collaboration and reaction to the field operations inefficient. In addition, these systems only support limited data visualization and analytical functions. Specifically, the existing oil and gas data management systems have the following limitations:
(1)
Most systems were developed in traditional single-point access structure. Users usually purchase the software licenses and install standalone software on their desktops. The standalone software prevents engineers from collaborating toward some common goals, due to the limited access of the data.
(2)
More importantly, swift and agile oil and gas data visualization and analytic tools are absent. Data visualization and analytic methods are critical for production optimization, since multi-sourced, fast accumulating oil and gas data require diverse spatiotemporal handling methods to explore hidden patterns. The combination of the two methods is necessary to generate quantitative analytic results, as well present intelligible human-computer communication.
In this paper, we propose a set of visual analytic methods that specialize in oil and gas data; and, we provide a web-based oil and gas data management, visualization and analytical system, called the Oil and Gas Visual Exploration System (OGVES). Our discussion focuses on oil and gas well data, but does not include pipeline data.
The main contributions of this work are as follows:
(1)
The design and implementation of the web-based geographical information system (GIS) platform OGVES to visualize and analyze oil and gas data. This system provides functions to store, search, visualize and analyze large volumes of oil and gas data. As a web-based system, OGVES provides better accessibility and more convenient data exploration methods than traditional desktop systems.
(2)
The proposal and development of a set of visualization and analytic methods to explore spatiotemporal patterns in oil and gas data. Spatial scales and temporal primitives contained in oil and gas data are discussed. Different visualization and analytic methods are then presented to explore and represent oil and gas data.
The paper is organized as follows: Related works in oil and gas data management and visualization on spatiotemporal data are reviewed in Section 2. An overview of OGVES is provided in Section 3. Section 4 demonstrates the proposed diverse visualization and analytic methods in detail; and, two specific applications of OGVES under different scenarios are given in Section 5. Section 6 presents evaluations of OGVES, including a user study and functional comparison. Finally, the potential and deficiency of the system are described in Section 7, which also presents conclusions.

2. Related Works

2.1. Oil and Gas Data Management Systems

Huge amounts of oil and gas production related data have accumulated over the years. The ever-growing data consist of multiple types of data from various domains, such as geology, geophysics, business and administration. The sufficient and productive administration of these dynamic, diverse and extensive data demands powerful storage and management systems.
There are a variety of oil and gas data management services and products on the market. Some commercial software, such as GeoCarta by Divestco [2], Accumap by IHS [3], geoSCOUT by geoLOGIC [5], provide access to integrated public and proprietary data in different disciplines, also integrate GIS technology for storage, display and analysis of spatial and attribute information of production entities, including wells, pipelines and other facilities.
GeoCarta by Divestco is one of the most popular commercial oil and gas data management systems in Alberta, Canada [2]. This standalone desktop software enables project teams to explore, analyze, extract and map public and proprietary data. As an oil and gas data warehouse based on the ArcGIS platform, GeoCarta provides an intuitive mapping interface and query tools using the industry standard location descriptions; therefore, the workflows of querying and retrieving data are simplified.
Other oil and gas data management software systems have similar designs and functionalities. However, these systems require ArcGIS Desktop to be installed, thereby restricting the input data format. Moreover, the database needs to be updated manually.
The explosion of web-based applications has resulted in oil and gas information systems being built by web GIS technology, focusing on spatial data query [6], oil and gas industry news notification [7] and so on.
The iGlass solution by Katalyst [4] was designed to be scalable, allowing companies to manage their subsurface assets, including seismic interpretation and well data. Consistently across geographically dispersed locations, the iGlass incorporates a web-based Esri GIS map interface for direct access to digital geophysical data. Katalyst hosts the iGlass data management software as a service (SaaS) for clients. The platform benefits from widely accessible and conveniently available web-based technology: users can access and explore their data with more guaranteed synchronization anywhere via network connection, and extra software is unnecessary.
Although existing web-based platforms provide more flexible data access and updates, they still emphasize data storage and search; therefore, analytic exploration functions, such as data visualization and data mining, are insufficient.

2.2. Visualization of Spatiotemporal Data

Information visualization is the study of (interactive) visual representations of abstract data to reinforce human cognition [8]. It presumes that “visual representations and interaction techniques take advantage of the human eye’s broad bandwidth pathway into the mind to allow users to see, explore, and understand large amounts of information at once. Therefore, it focuses on the creation of approaches for conveying abstract information in intuitive ways.” [9]. Many new visualization tools have been proposed to aid in knowledge discovery activities under the auspices of visual data mining (VDM) [10]; and, research has recently progressed toward visually supported methods of knowledge discovery [11]. With the boom in big data analytics, information visualization is being widely used in a variety of data analysis application. Examples include visual analysis of business data [12], scientific data [13], student histories [14], sports data [15], images and videos [16], and search results [17].
Among various information visualization researches and applications, geovisualization relates to exploration and discovery using spatiotemporal datasets and has been applied in various applications. Landesberger et al. [18] analyzed data from movement tracking and meteorological areas using their originally designed Dynamic Categorical Data View (DCDV) and obtained an expressive visualization of both the overall understanding over time and abnormity. New York taxi trips data were visualized in [19] from different aspects, various spatiotemporal data were expressed in different aggregation and visualization methods after queries completed.
Wang et al. [20] handled sparse traffic trajectory data that contained the movements of almost all vehicles in specific regions, presented vehicle movements on a small scale and then applied aggregation techniques to explore macro-traffic patterns. Mazumdar and Kauppinen [21] proposed ELBAR explorer to visualize a vast amount of scientific observations, and its application on Brazilian Amazon Rainforest evaluated the use of illustrating heterogeneous phenomena over time and space.
Since spatiotemporal data are usually multi-source and complex, appropriate toolsets or systems can act as powerful instruments for researchers and administrators. Tatu et al. [22] proposed an automatic analysis method to help users locate effective visual representations from various candidates via extracting potentially relevant visual structures. TGRASS [23] is a temporal-extended GIS that aims at not only managing, analyzing, processing and visualizing large environmental spatiotemporal datasets, but also investigating and assessing the temporal relationships between them. Hengl et al. implemented plotKML [24], an R package that provides a simple interface to generate Keyhole Markup Language (KML) files, which allows users to visually explore various types of spatiotemporal data available in R, along with the results of diverse spatial analysis.
In terms of analyzing the large quantities of data in the oil and gas industry, visualization tools and other digital techniques have helped with exploring data, making decisions and improving production [25]. Classic visualization methods, such as different plots and charts, have been used to study shale gas production for different shale basins over time [26,27,28]. Some studies analyzed production trends by integrating transient analysis and plot analysis—log-log plot and square root time plot [26,28]. In [27], shale wells in the same basin were grouped by the years of their first production, and line charts were used to plot the average daily gas production of different well groups. The average production plots were compared over basins. The clear distinction in the production across different shale basins was attributed to the differences in reservoir properties and completion processes. Therefore, production analysis using data visualization tools is practical for characterizing wells and evaluating well performances for a single well or a group of wells.
Although visualization tools and other digital techniques have helped with exploring various spatiotemporal data, making decisions and improving production [28], to our best knowledge, there are currently very few comprehensive systems for oil and gas data visualization, not to mention further visual exploration. In addition, appropriate visualization methods are needed to present oil and gas data, which are a unique type of dynamically accumulating industrial data with various contents and spatiotemporal features.

3. Web-Based Oil and Gas Visual Exploration System (OGVES)

As mentioned, a web-based oil and gas data management system with advanced data visualization and analytical functions would be in great demand. Specifically, the system should be able to perform the following functions: (a) provide a web GIS platform, making the system accessible to users through web browsers; (b) render archived oil and gas data searchable by locations or attributes and searched results exportable; (c) visualize and explore attributive and time-series production and operational data in multi-forms such as tables, interactive charts and graphs; and, (d) provide practical data mining techniques and visualize mined spatial patterns. In this work, we have designed and implemented the web-based OGVES. The system architecture is presented in this following subsections.

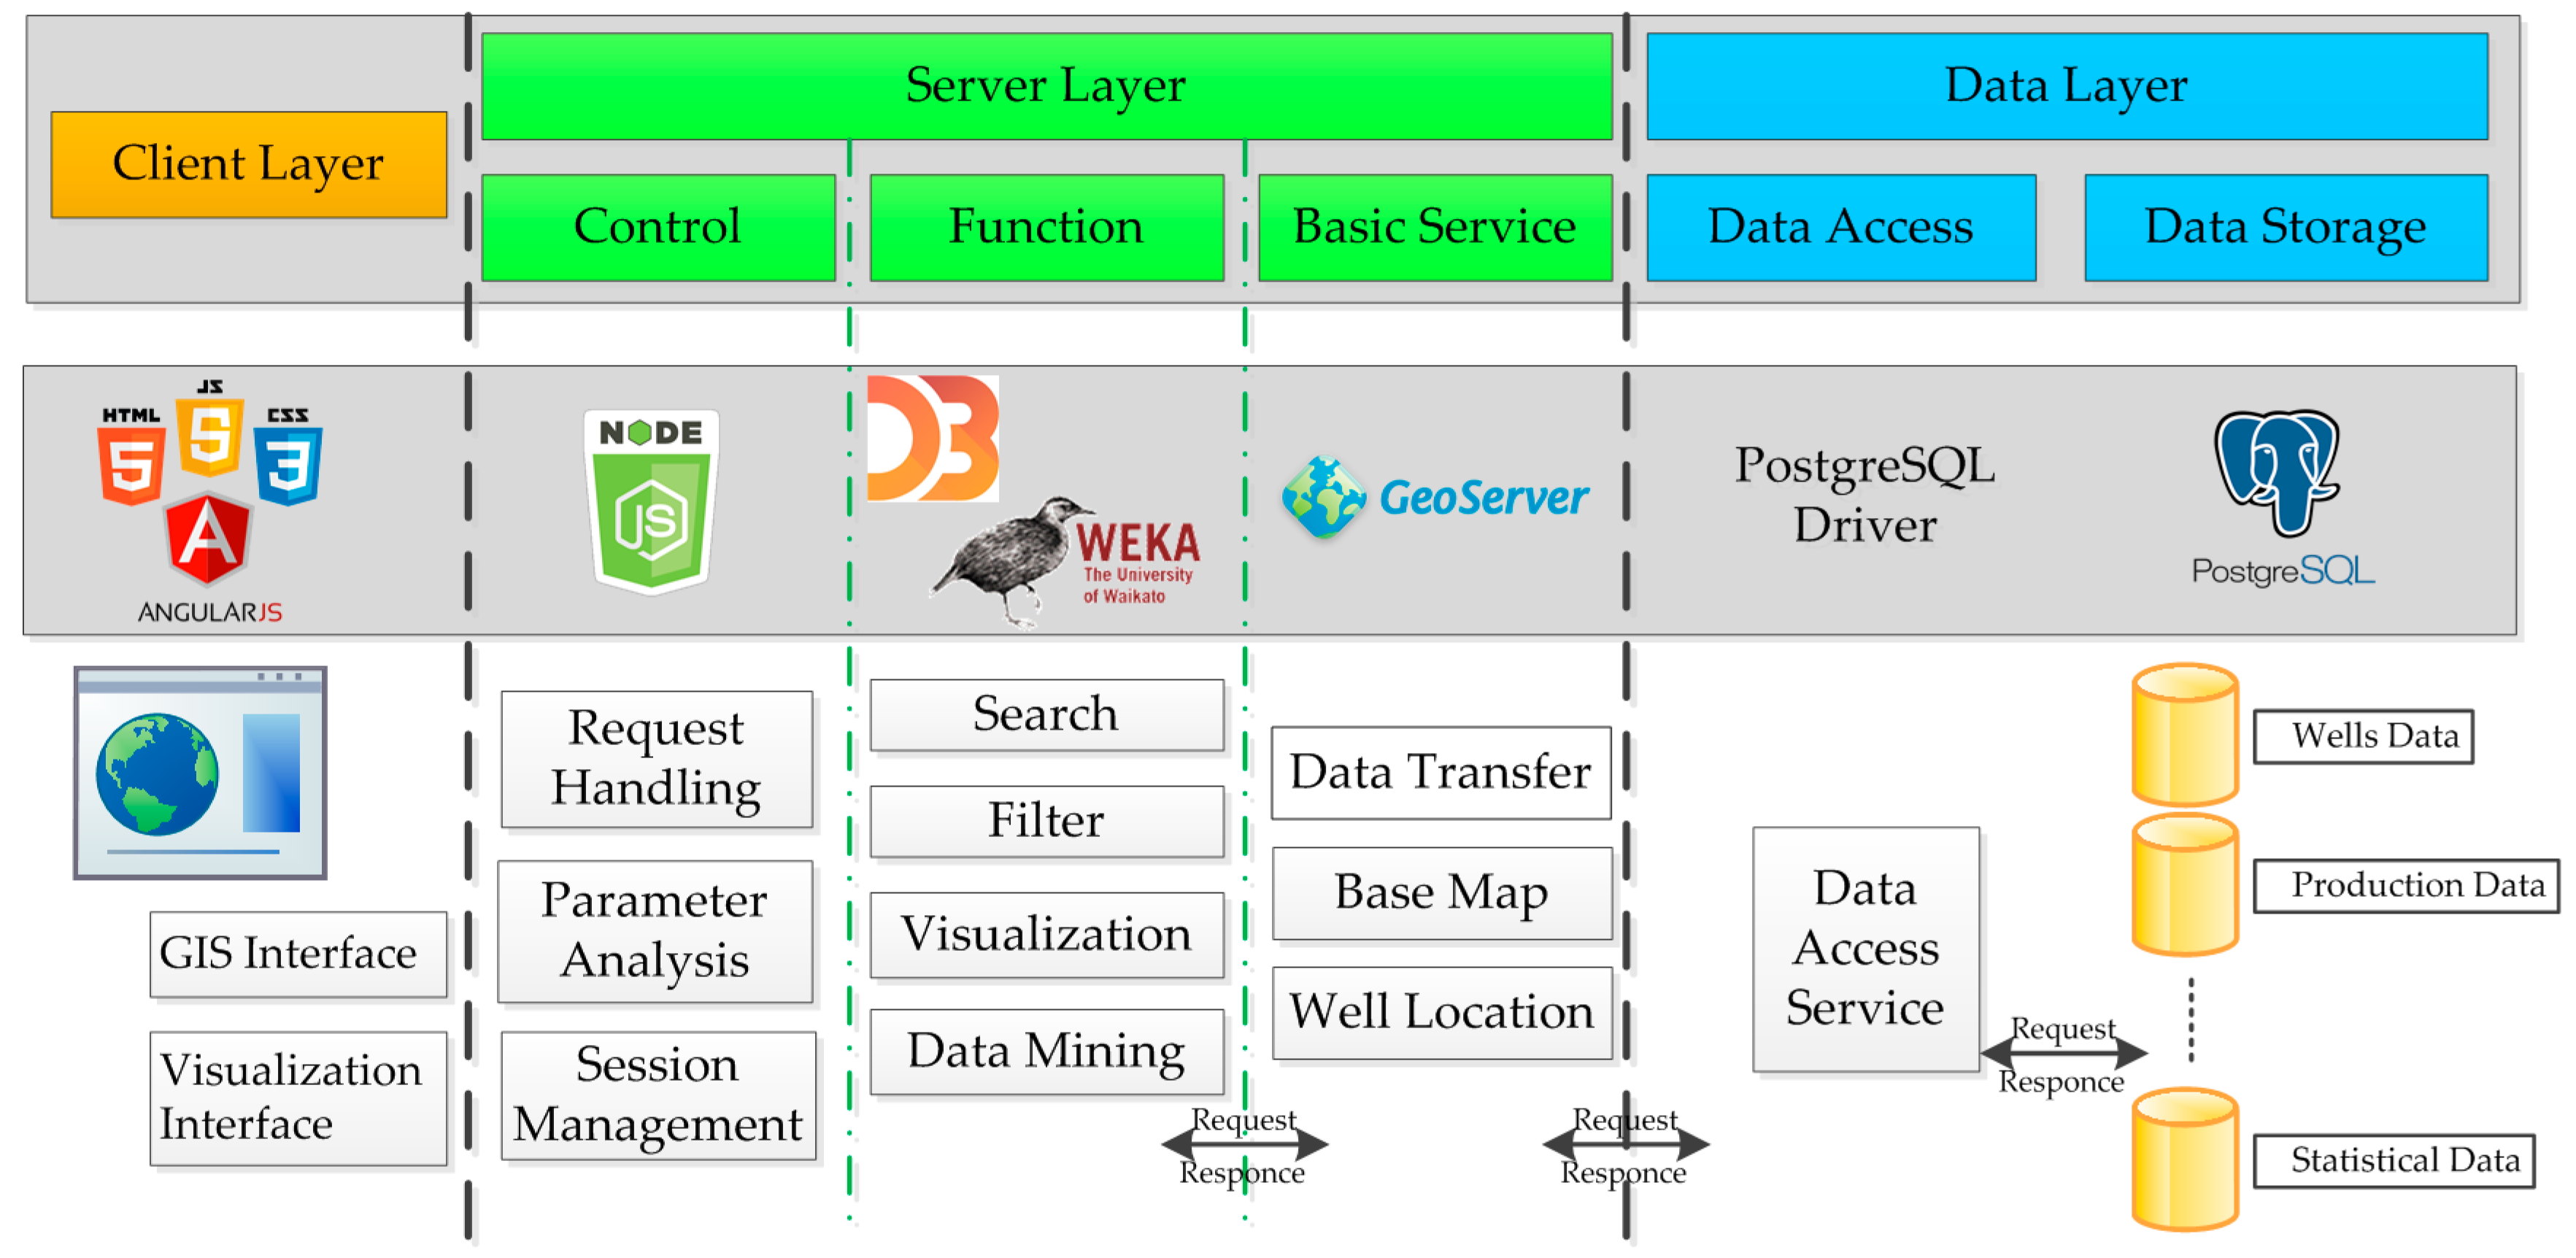
3.1. OGVES Framework

OGVES is established on a multi-tier distributed architecture. The system is web-based and consists of three logic layers: Client Layer, Server Layer, and Data Layer. The system architecture is illustrated in Figure 1.
The client layer provides the base map, well information and visualization results through a multifunctional and user-friendly interface. It interacts with users through maps and various visualization techniques.
The server layer is the application processing layer and consists of three sublayers: control, function and basic service sublayers. The control sublayer bridges user operations and function implementation; it captures users’ behaviors and communicates with the function sublayer, as well as transfers data search, visualization and mining results to the client layer for rendering in the browser. The function sublayer is the crucial business handling layer: After receiving the function request from the control sublayer, corresponding practical data processes will be operated here. We adopted several third-party open-source libraries, D3.js (Data-Driven Documents) [29] and Weka [30], for visualization and data mining, respectively.
The basic service sublayer retrieves all kinds of data (such as attributes, spatial locations, operation data, numerical production data) from databases, then packages and transfers these raw data to the function sublayer. This sublayer also maps well locations on the base map via GeoServer [31] and Google Maps [32] Application Programming Interface (API).
The data layer stores all data and provides data access service. Data requests from the server layer are answered here. Data update can be guaranteed by using APIs, e.g., GeoVista by Divestco [2], from the data providers and collectors.
The responsive design system benefits from the multi-tier distributed architecture. Data are stored in and obtained from the data layer, processed and visualized in the server layer, and finally displayed in the client layer. Three component layers communicate with each other, deliver and present user information according to requests. The clear structure helps OGVES possess flexibility, reliability, extendibility, and usability.
This system is built upon standard HTML5 and CSS3, and the webpages are structured and styled, respectively. The webpage elements can be flexibly modified and adjusted. JavaScript, as an object-oriented supporting programming language, was used in developing the system, since it can be executed on the client side to avoid excessive communication with the web server and reduce the processing time. Moreover, there is a rich amount of third-party JavaScript libraries, plugins and modules that can be used to accelerate the development, such as AngularJS, a toolset for building the framework [33]. Implementation of visualization methods and interfaces is accomplished through the adoption of D3.js. Other important software or open-source libraries that have been used in this system include PostgreSQL [34], Google Maps API, GeoServer API, JQuery and Node.js [35].

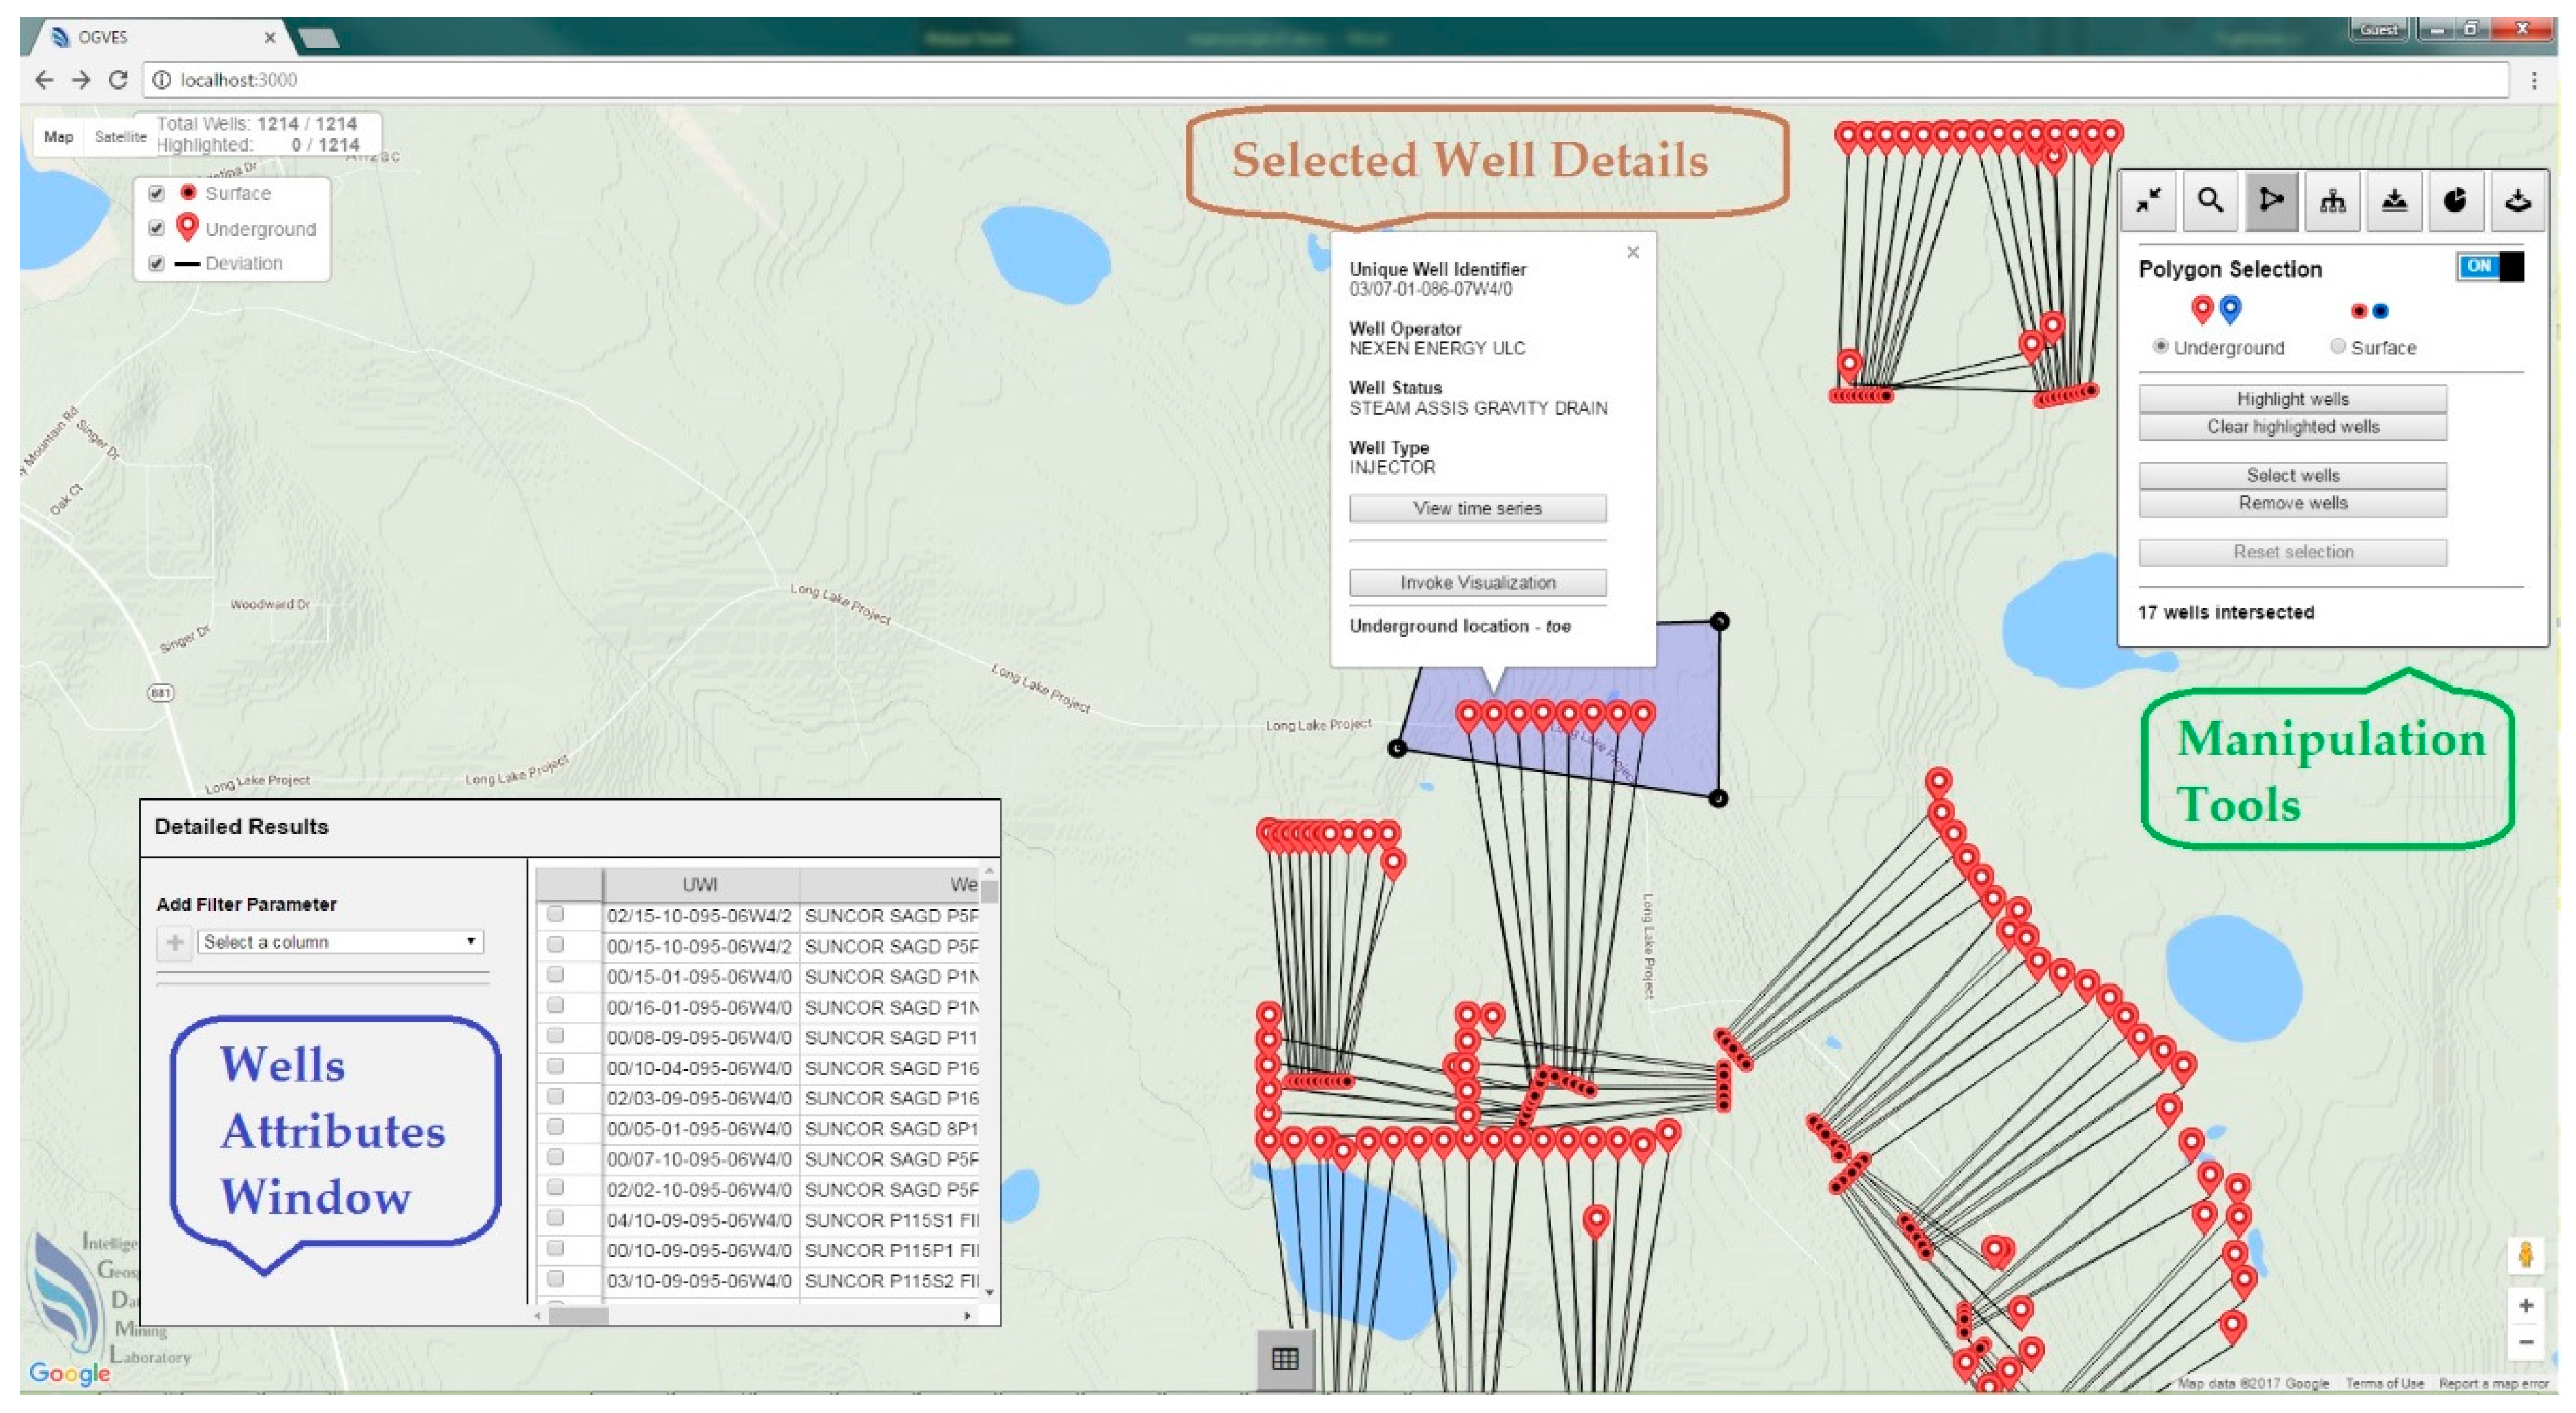
3.2. Web GIS User Interface

The web GIS user interface consists of four main components: (a) an interactive map representing the current objects; (b) a status bar indicating the selected map layers and the numbers of selected and highlighted objects on the map; (c) a table displaying the basic information of current objects; and, (d) manipulation tools leading to advanced functions, such as search, search by location, export, data visualization and data mining. Figure 2 represents the web GIS user interface with panels extended for map manipulation, searching for a particular project and highlighting wells of interest, an attribute table of the searched wells (bottom right), map navigation (top left), and manipulation tool bar (top right).

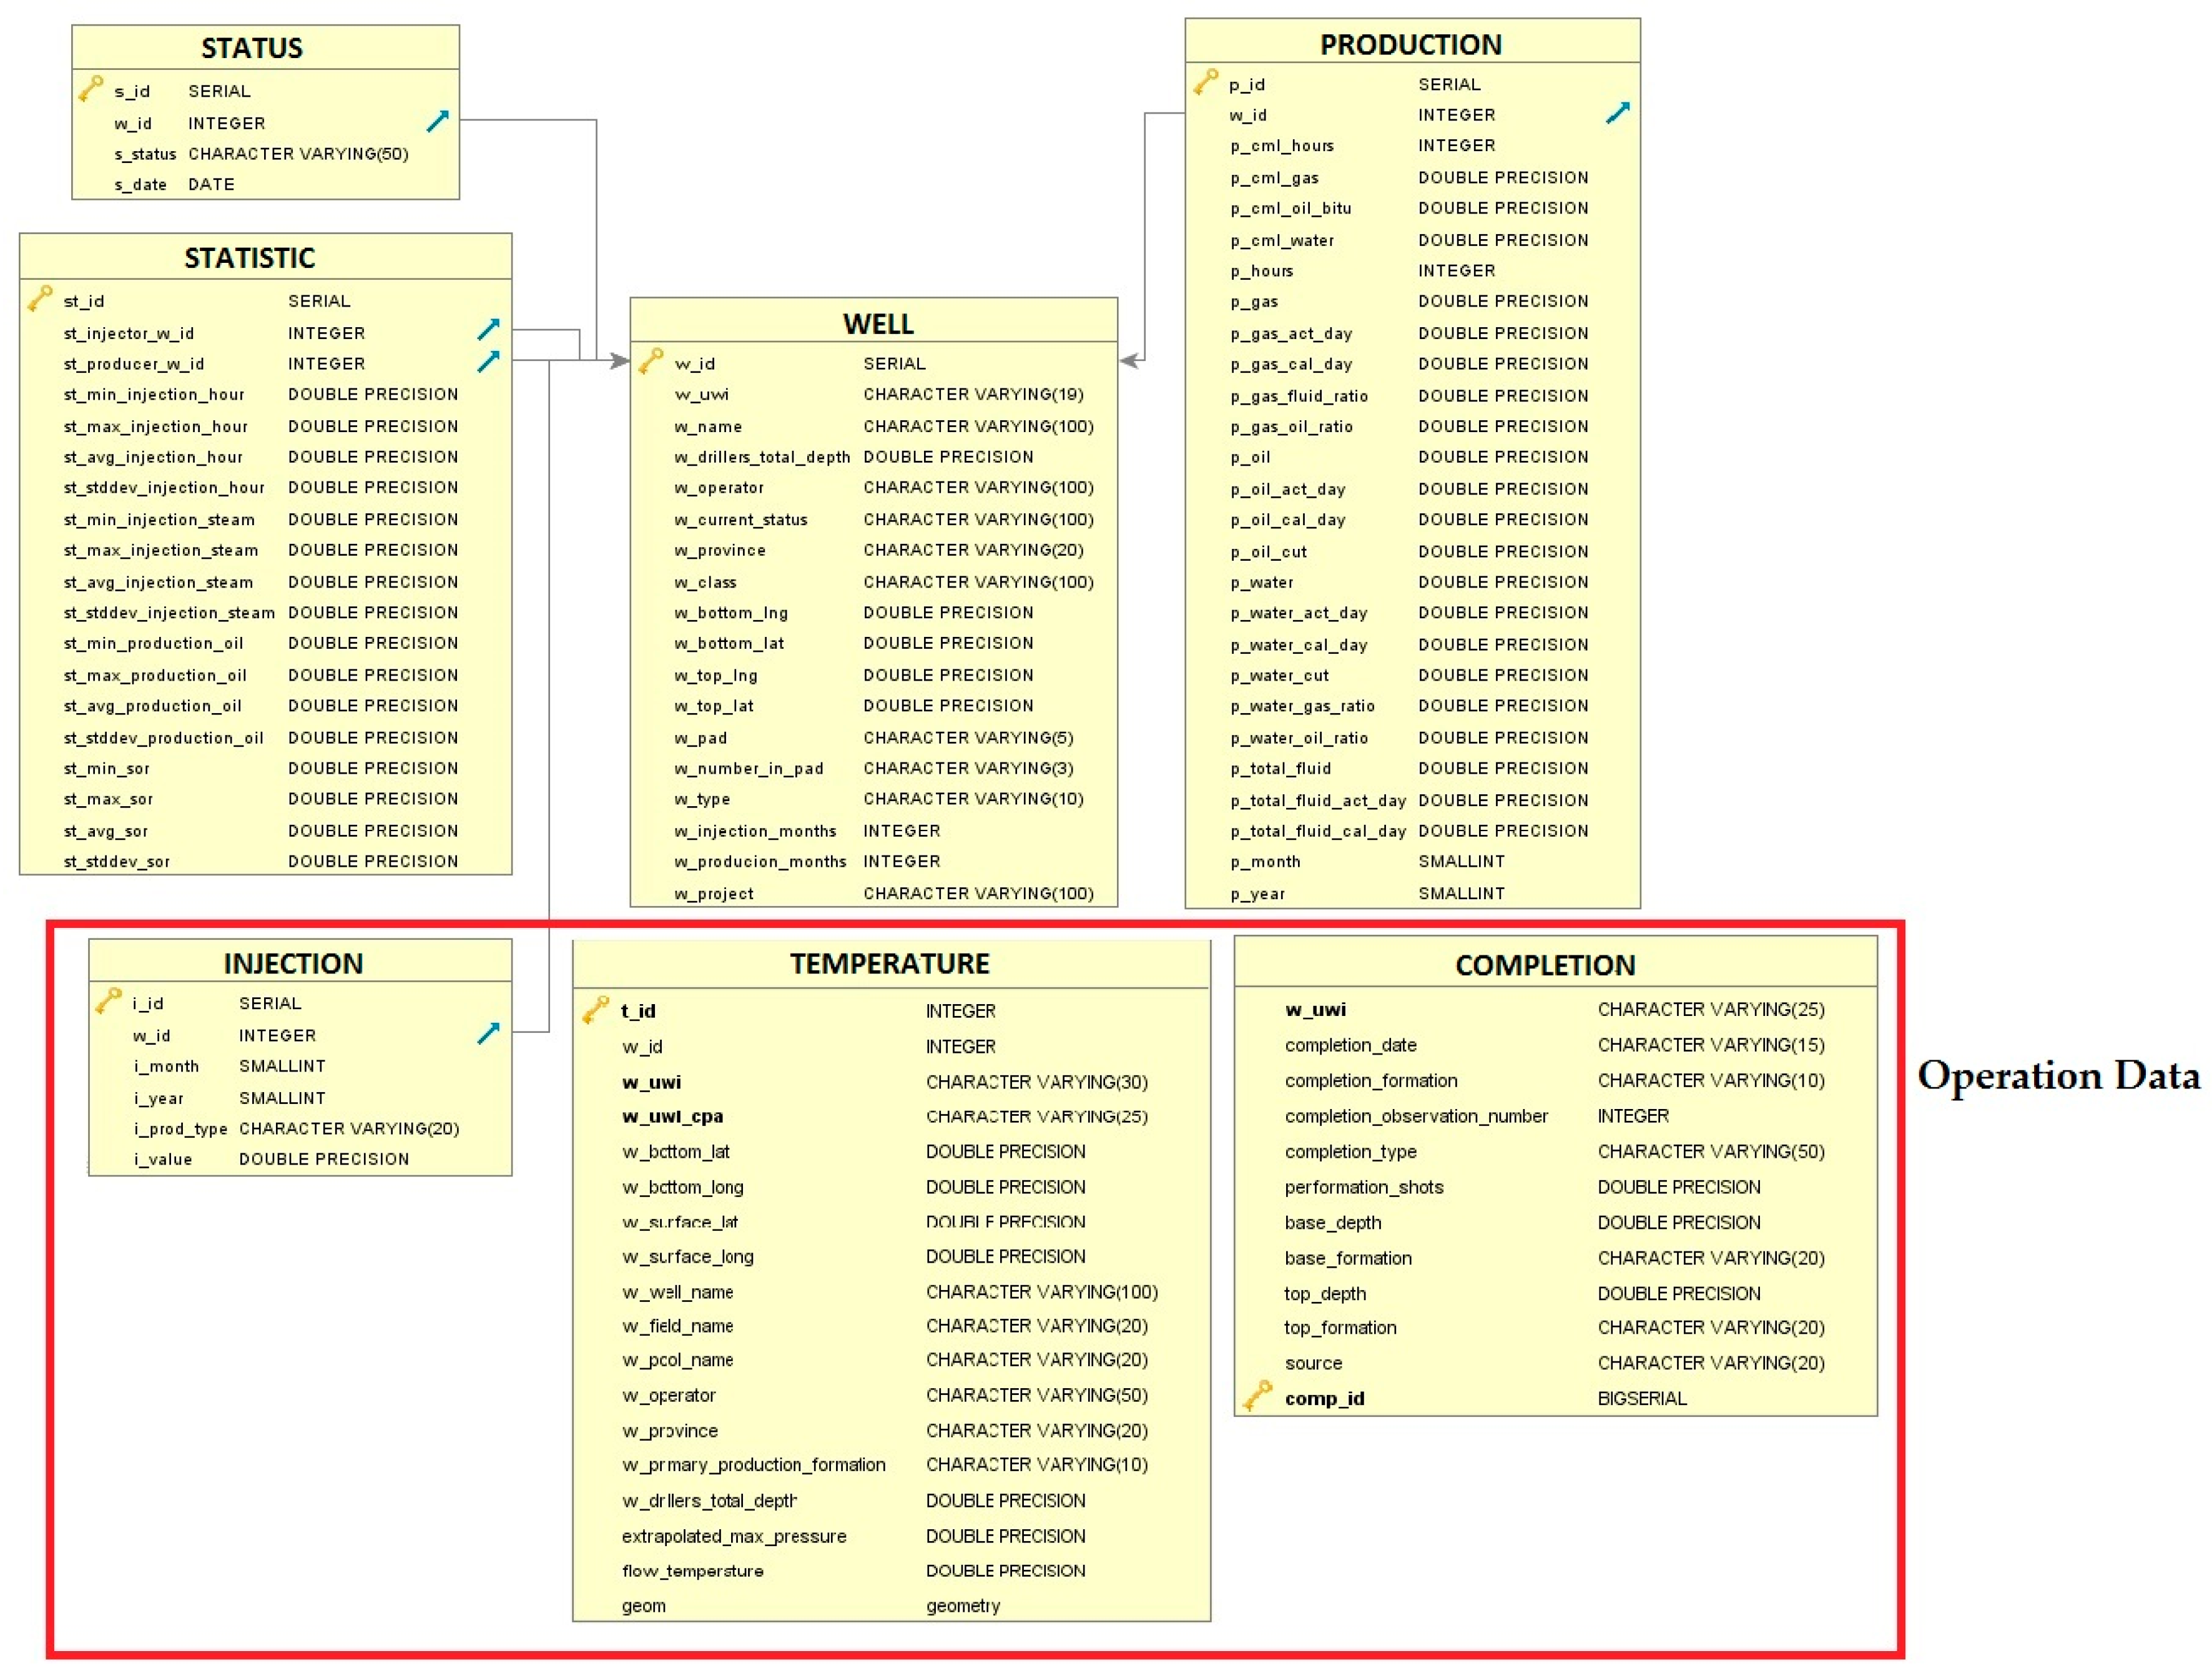
3.3. Data Description and Structure

Oil and gas data are complex spatiotemporal data. They contain attributes of wells, such as a unique well identifier (UWI, which is standard well identification containing 16 characters in four components sequentially), operation statuses, temporal data, such as monthly production value and operation hours, and spatial data, such as well locations and depths. The data include numerical or non-numerical, raw data or analytic results.
In this work, a relational database was designed based on the public available data sources, as shown in Figure 3. Generally, the WELL table is a fundamental table and UWI is the primary key linked to other tables. In the WELL table, most well attributes, such as UWI, well name, well operator or type, are recorded. The STATUS table indicates the general phases—observation, drilled and cased, abandoned—with the corresponding periods of time for an individual well. The STATISTIC table records statistical parameters, such as maximum and minimum production data and standard deviation.
The PRODUCTION and OPERATION tables record critical data values that present the operational performance of each well. They may contain diverse records, depending on the type of well or the technique applied and, therefore, involve multiple data tables, especially for operation data. For instance, for a SAGD (Steam Assisted Gravity Drainage) well, which is a widely used enhanced oil recovery technology for producing heavy crude oil in Alberta, Canada, the OPERATION table mainly contains INJECTION table, including steam injection volume (m3), injection time per month (hour) and date. PRODUCTION table will contain critical data, such as oil/gas/water production volume (m3), cumulative production volume (m3), and corresponding daily value. Different performance measurement data, such as oil-gas-ratio and water-oil-ratio, are also recorded for further analysis.
For other producing technology, such as shale gas, the PRODUCTION table will also record production volume, just as in the SAGD PRODUCTION table, while the OPERATION table consists of different tables, such as TEMPERATURE table in which gas flow temperature is stored or COMPLETION table, which stores corresponding completion information for shale gas production management, as shown in Figure 3. Please note the presented database schema are mainly based on public data sources and can be extended to include more detailed and complex spatiotemporal well data.

4. Analytical and Visualization Methods in OGVES

4.1. Analytical Methods

Data mining is the process to discover patterns and knowledge from large datasets [36]. By using data mining techniques, users can further analyze oil and gas production data to discover the hidden patterns. In OGVES, classification for numerical and categorical attributes, k-means clustering and association rule mining (ARM) are implemented. We also integrated the symbolic tree model for production prediction.

4.1.1. Cluster Analysis

Cluster analysis or clustering aims at grouping objects with similar properties and also partitioning objects with dissimilarity [36]. The consistency of the clustering result of geological properties and oil and gas resources can assist in oil and gas resource exploration and evaluation [37]. K-means is one of the most popular clustering methods. K is a user-defined variable that stands for the number of clusters or groups. The algorithm initializes k random objects representing the cluster centroids and iterates the process of assigning other objects to centroids with the closest distances and calculating new centroids, until there is no change in all the clusters. The k-means clustering algorithm can efficiently process large datasets, due to its relatively low computation complexity.

4.1.2. Classification Analysis

Users are allowed to map classified well attributes. For categorical attributes, such as current well status, well type and pad, wells belonging to different categories are represented by symbols in different colors. By using categorical classification for well pads, wells in different pads can be displayed in different colors. In numerical classification, wells can be classified either by equal interval or equal quantile for examining the distribution of attribute values. Users can observe the distribution of wells in each class, such as the aggregation of wells with high or low production.

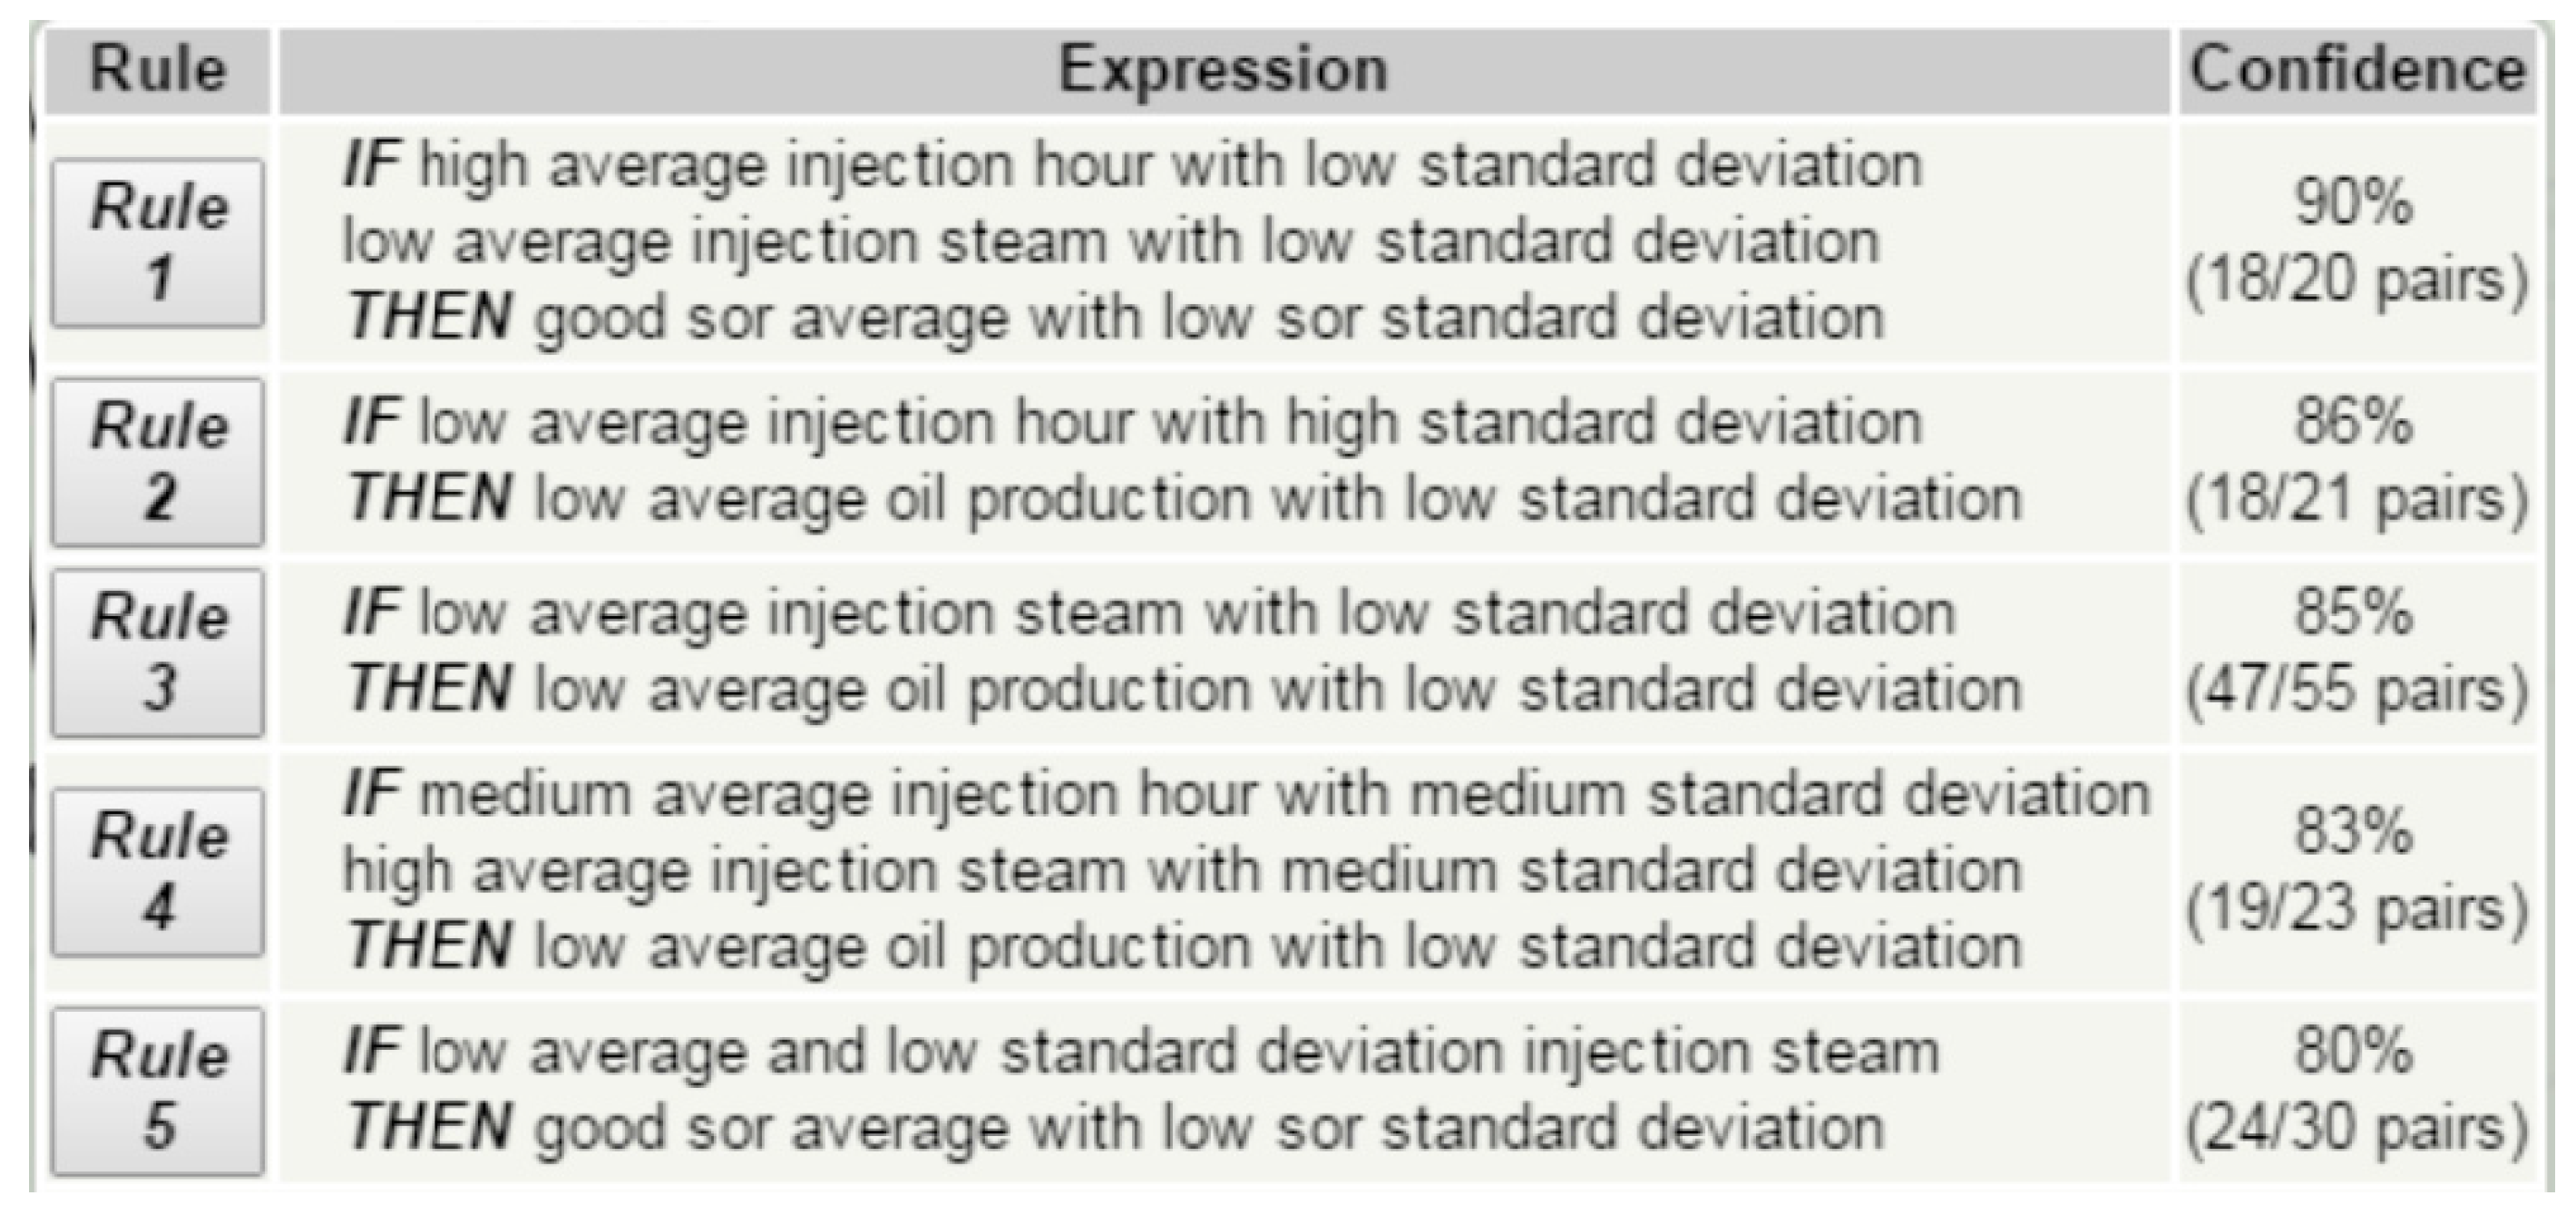
4.1.3. Association Rule Mining (ARM)

ARM is used to find frequent associations and correlations among different attributes from large datasets. In the oil and gas industry, ARM has been used in reservoir analysis and oil production [38,39]. An association rule is comprised of an antecedent part (if) and a consequent part (then). Two measures, support and confidence, are used to define rule interestingness. An example rule was described in [39]: if three reservoir properties match certain levels, then the well oil production is high (support = 5.1%, confidence = 85.7%). Support denotes the proportion of the items in the whole dataset that satisfy the rule; and, confidence denotes the proportion of the objects that satisfy the consequence among the objects satisfying the antecedent condition. Frequent if/then patterns satisfying defined minimum support and minimum confidence are identified as strong association rules. Apriori [40], a classic algorithm for ARM, is implemented in this system.

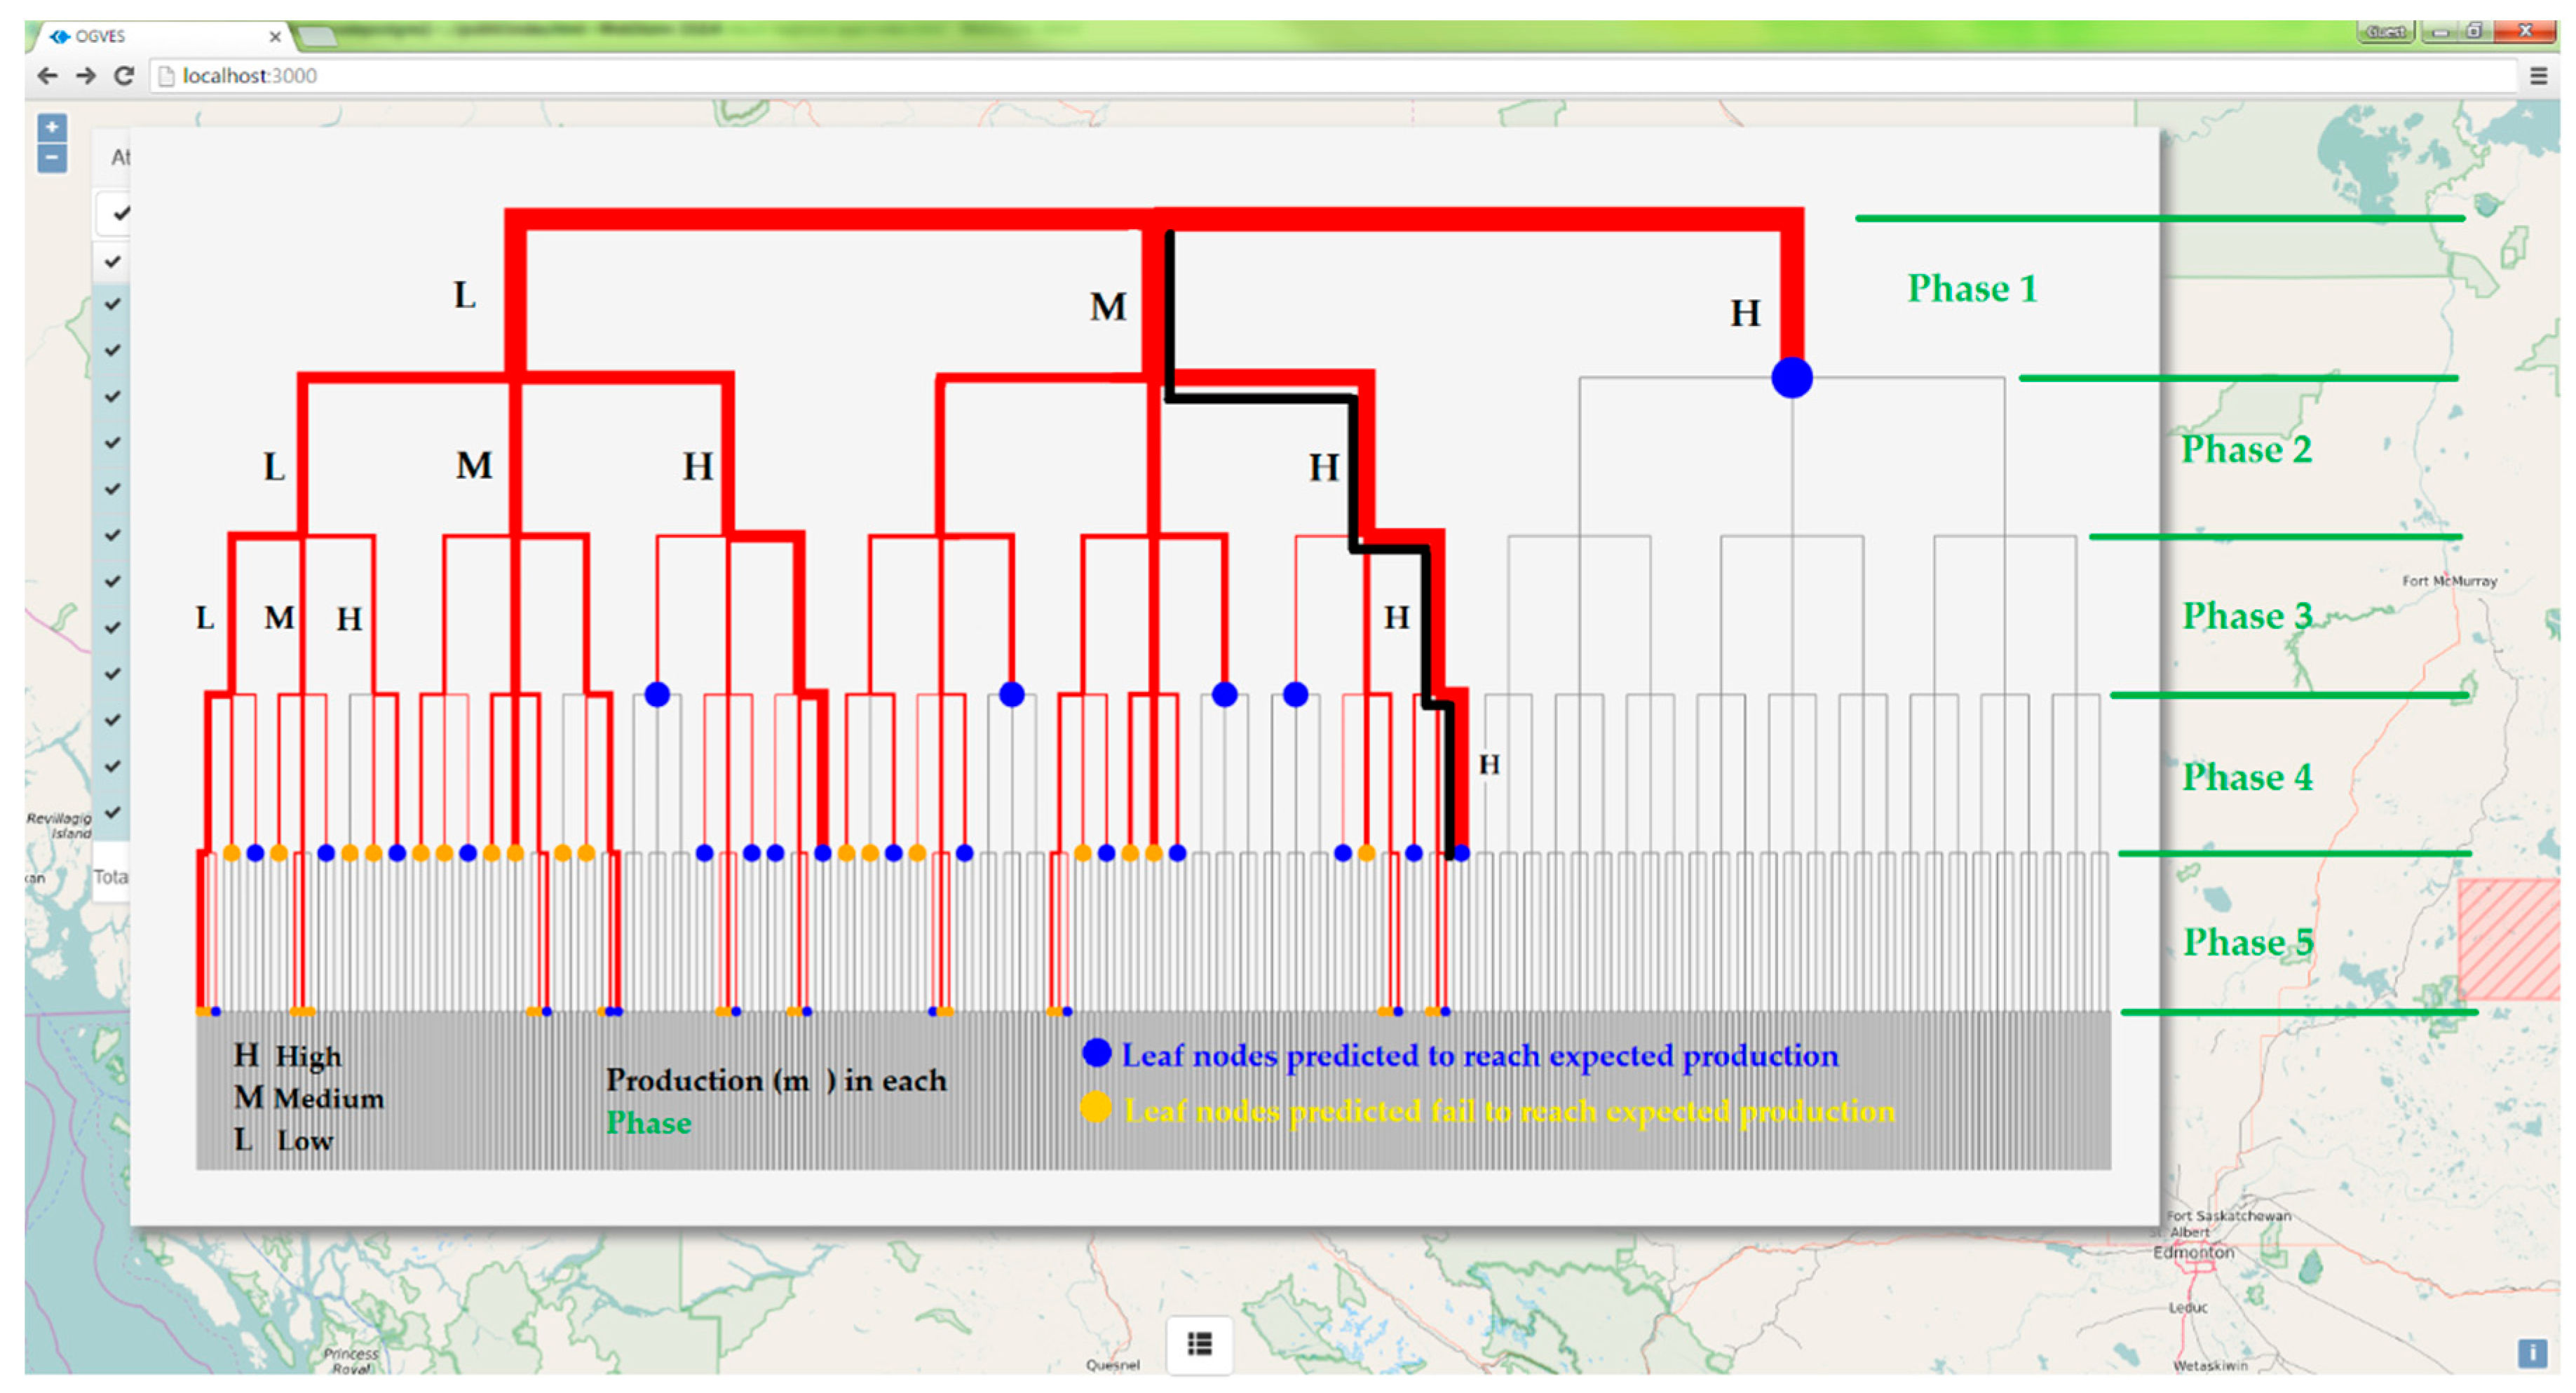
4.1.4. Symbolic Tree Model Prediction

The symbolic tree model can be used as a production prediction method in the oil and gas industry [41]. The symbolic tree is a flowchart-like tree structure, where the hierarchical levels in the tree correspond to chronological time periods and the tree nodes represent production symbols at particular periods. Production data are symbolized using the Piecewise Aggregate Approximation (PAA) method and a tree-like representation method. The symbolic tree is proposed and built on the symbolized production data of all the wells and their classes. For more information about symbolic tree construction, please see [41].

4.2. Visualization Design in OGVES

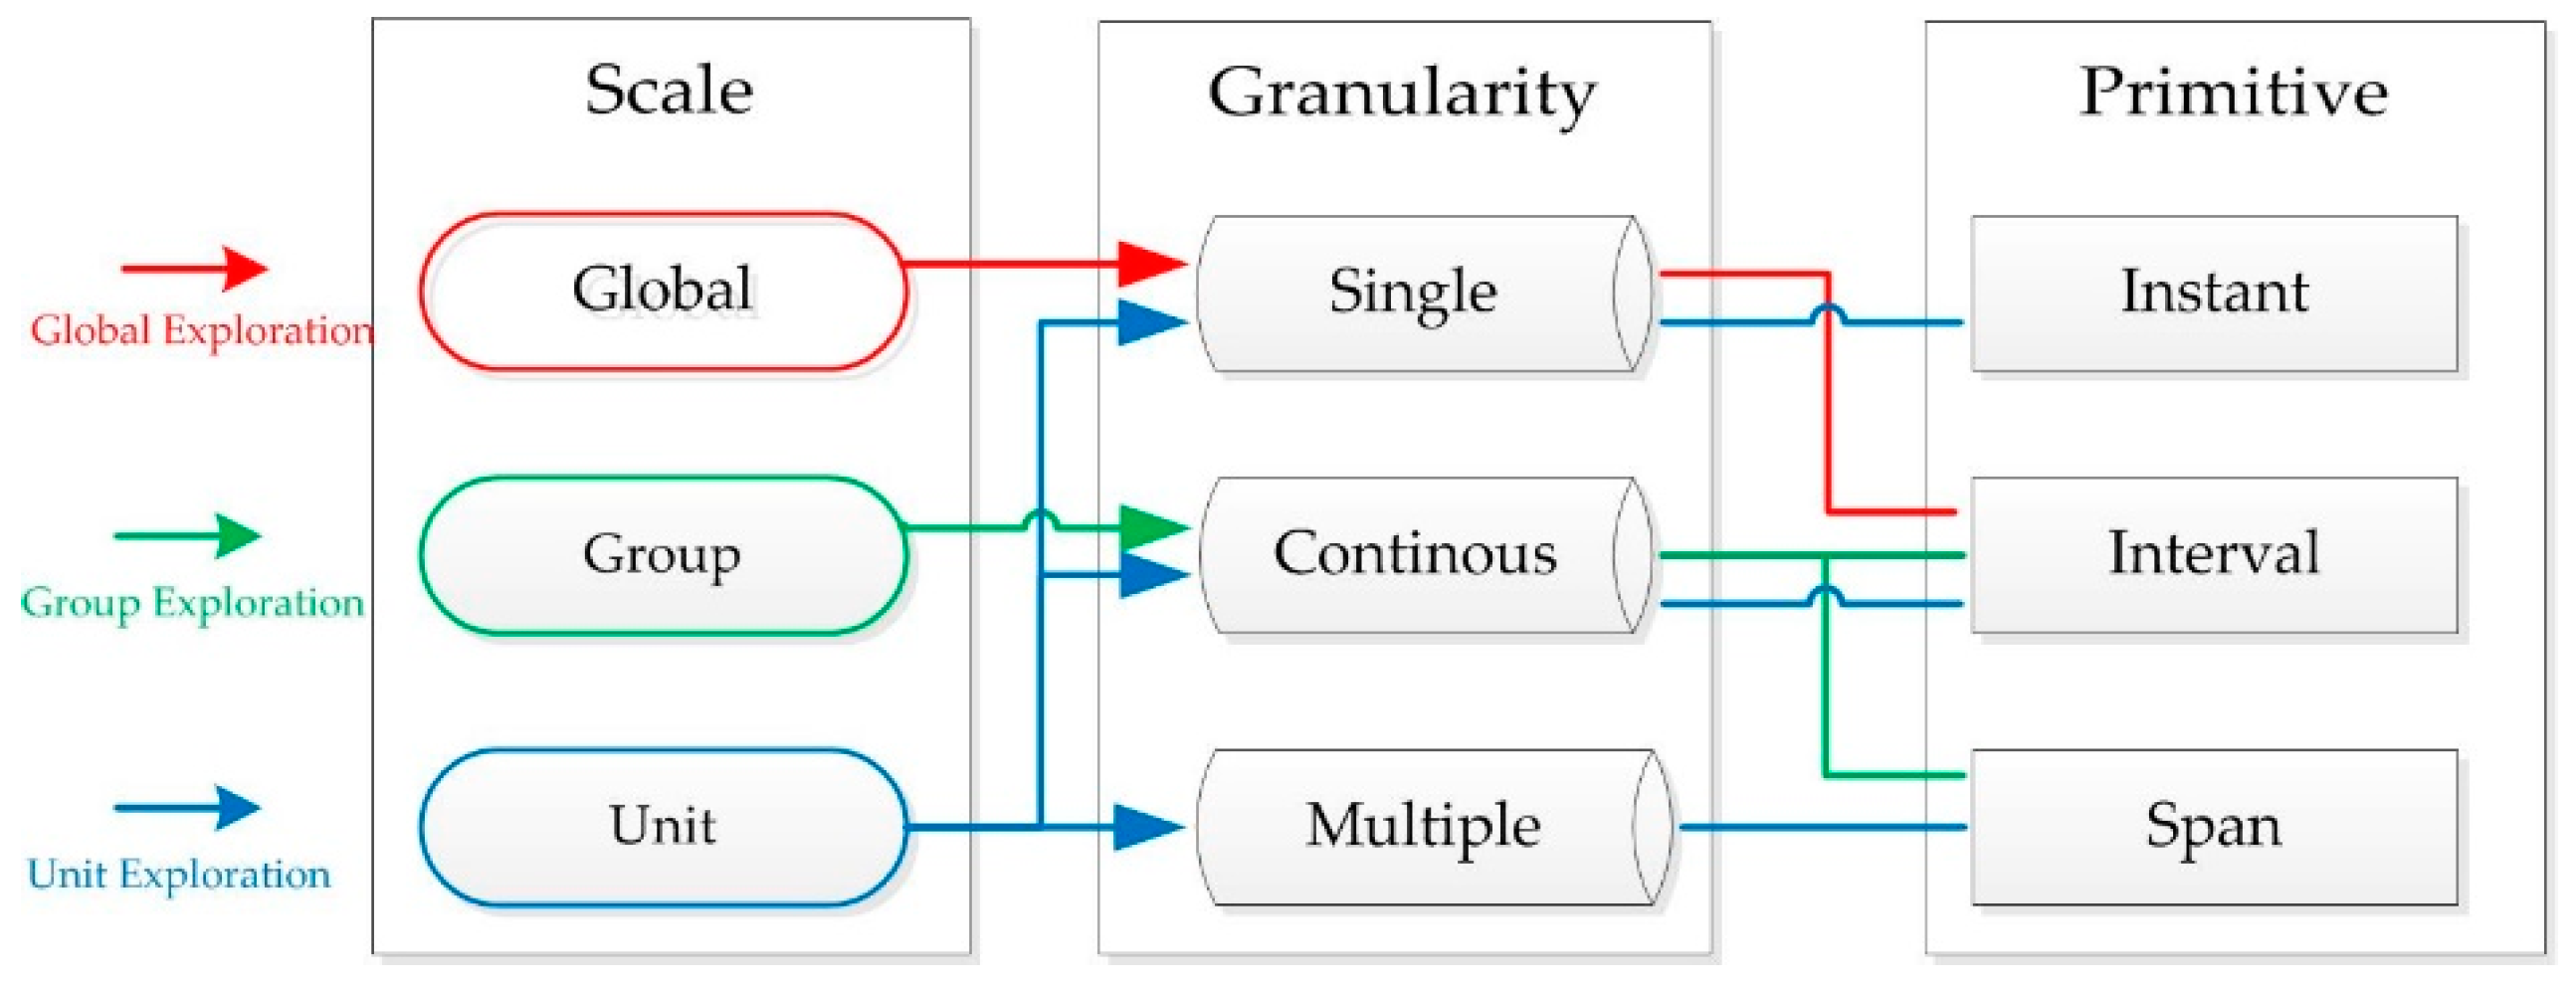
4.2.1. Visualization Based on Spatial Scale

Oil and gas exploitation is an essentially multiple spatial scale operation. A well is the basic unit in practical production, and engineers monitor and manage each well directly. At a higher level, several adjacent wells are drilled together in a large reservoir to share production facilities and improve exploitation efficiency; these wells combine to form a pad. Most oil and gas companies use the project as the largest management object. A project usually consists several or dozens of pads and, therefore, includes hundreds of wells.
Generally, well, pad and project are the three scale components considered in the spatial visualization design. Different designs at each scale level are proposed based on different demands. The level of well is the focus of engineers. All details are important in the extraction process; therefore, exhaustive information presentation methods are needed. On the other hand, engineers and field managers also care about the efficiency of the pad they operate. They expect to obtain information about the interaction among wells, i.e., more local spatial relationships between adjacent wells. In addition, project managers and executives are only interested on the performance of whole project; hence, methods providing comprehensive information (e.g., location of each project and corresponding efficiency measurements) simultaneously are expected.
To represent multiple scale features in oil and gas data, we adopt the Visual Information Seeking Mantra (VISM), which is Overview first, zoom and filter, then details-on-demand [42], as the design principle for the visualization. Basically, users first get an overview at the project scale. If they find some pads interesting, the system allows them to select the pads and continue examining the detailed information at the pad and well levels. If the users discover production patterns or abnormalities in a specific pad or well, they can compare with other pads or well. The three exploration steps are as follows:
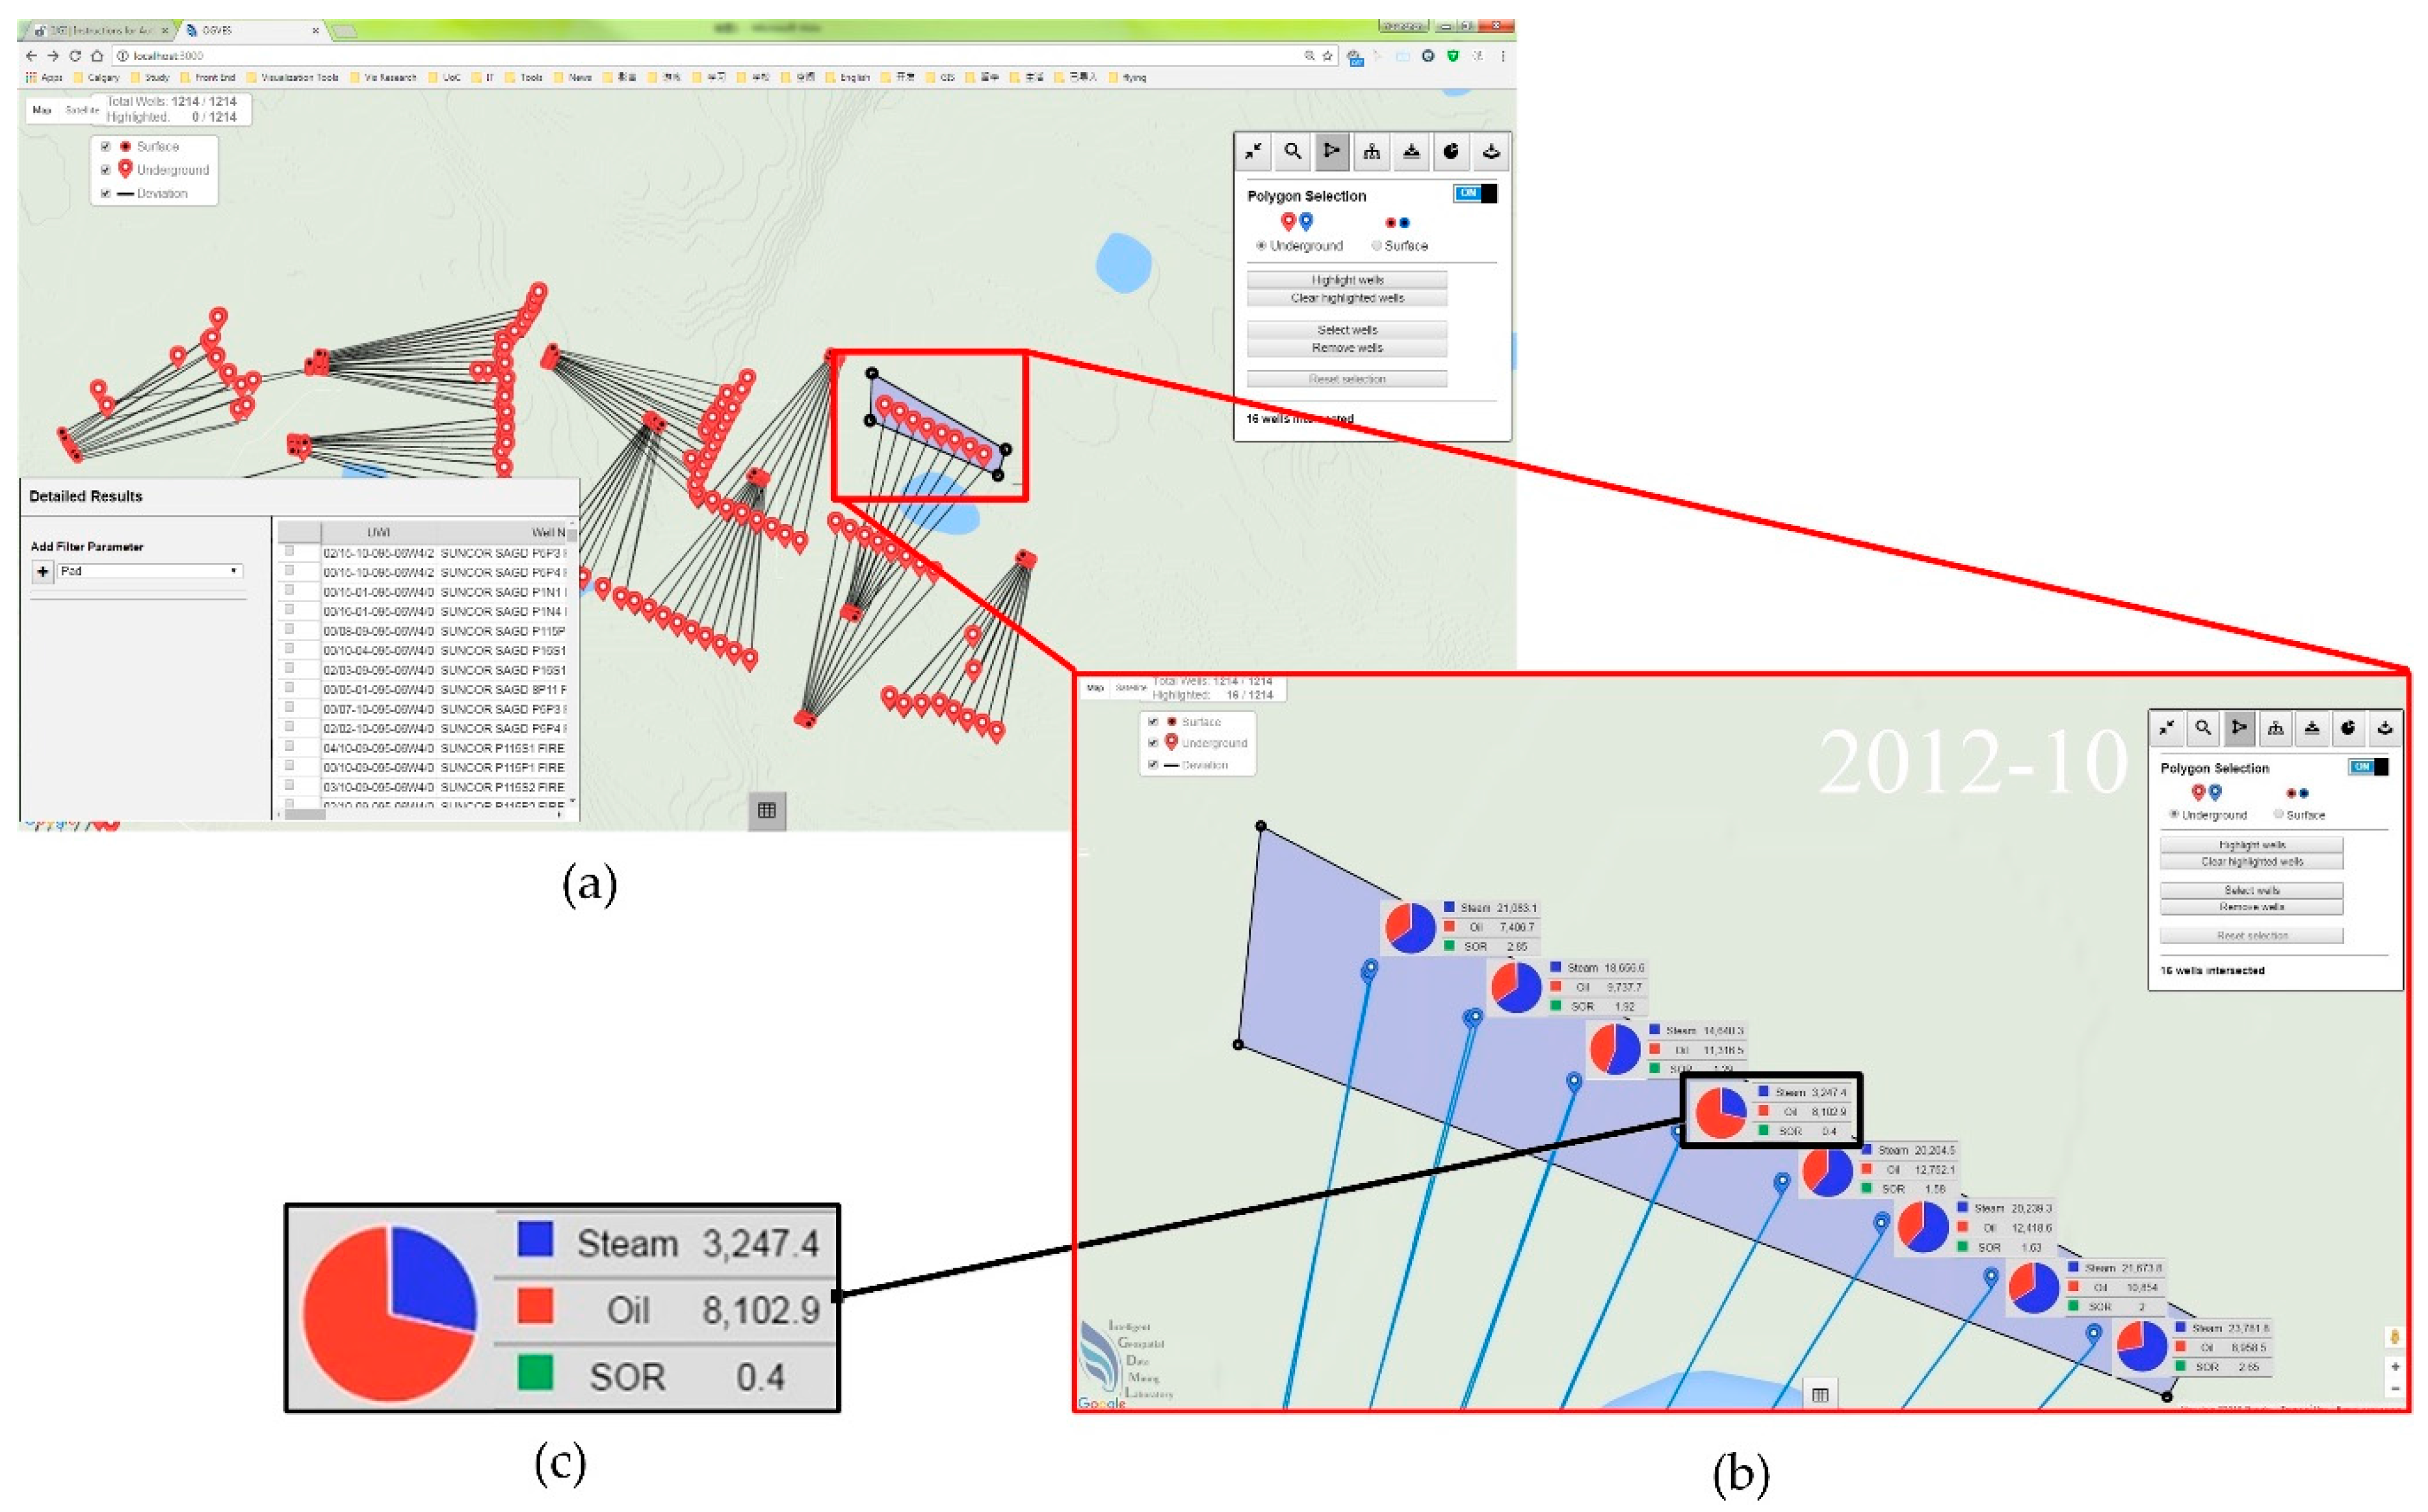
  • Global exploration focuses on presenting an intuitive overview of the whole study area. Data selection, query and location are also implemented in this phase. Users can filter interested projects, pads and wells, as well as check the status of all wells and the production data at a specific time. This phase also enables the display of comprehensive production data of the interested region, such as with a bubble map. This is the overview phase.
  • Group exploration focuses on revealing the production patterns for each pad or group of pads. After selecting variable pads, users can check how corresponding production, injection and steam-to-oil ratio (SOR, an important measure of efficiency for SAGD production) data change with time and try to discover trends and periodicity. Users can also see when the operation status presents abnormal, and compare multiple pads in a specified period. This is the zoom and filter phase.
  • Unit exploration focuses on discovering details of specific wells or pads. Users can use various visualization techniques and multidimensional charts or graphs to inspect selected detailed well data. This is the details-on-demand phase.

4.2.2. Visualization Based on Temporal Primitive

Time primitives are a set of basic elements used to relate data to time [43]. In this paper, three time primitives—instant, interval and span—have been taken from [43] to provide communications between the temporal features contained in data elements and the corresponding time domain.
Most oil and gas data are recorded based on an instant, which is a specific point in a time domain, such as 15 December 2015, and is denoted as t. Oil and gas data are recorded by in situ sensors at different instants continuously; e.g., production data can be obtained daily and then integrated to monthly statistical data for further analysis. Well status and performance at a specific instant are critical for further adjustment.
An interval is defined as a segment of the time domain denoted by beginning and end instants. Oil and gas production may reflect fluctuations in different stages; therefore, data visualization of different intervals is valuable in operation decision-making. For example, exploration into a particular stage and illustration of how the production change with operation adjustment are valuable to improve the performance within this stage. Usually, an interval {I} is denoted as:
{ I } = [ t b e g i n , t e n d ]   where   t b e g i n < t e n d .
Moreover, intervals can be modeled as [ t b e g i n + duration (positive span)], or as [duration (positive span) + t e n d ] using following a primitive span, which is defined as a directed amount of the time domain in a particular temporal descriptive unit, e.g., 15 days of production time. Span S is denoted as:
S = n = 1 N ( t n ) ,
As a high-level primitive, the span can describe most comprehensive characteristics of wells, pads, or projects.
Flexible time period definitions provide huge potentiality for time-series data analyses, such as production prediction based on historical data.

4.3. Visualization Methods for Oil and Gas Data

The features of the data visualization methods and interfaces (other than the web GIS user interface) are detailed in the following subsections.

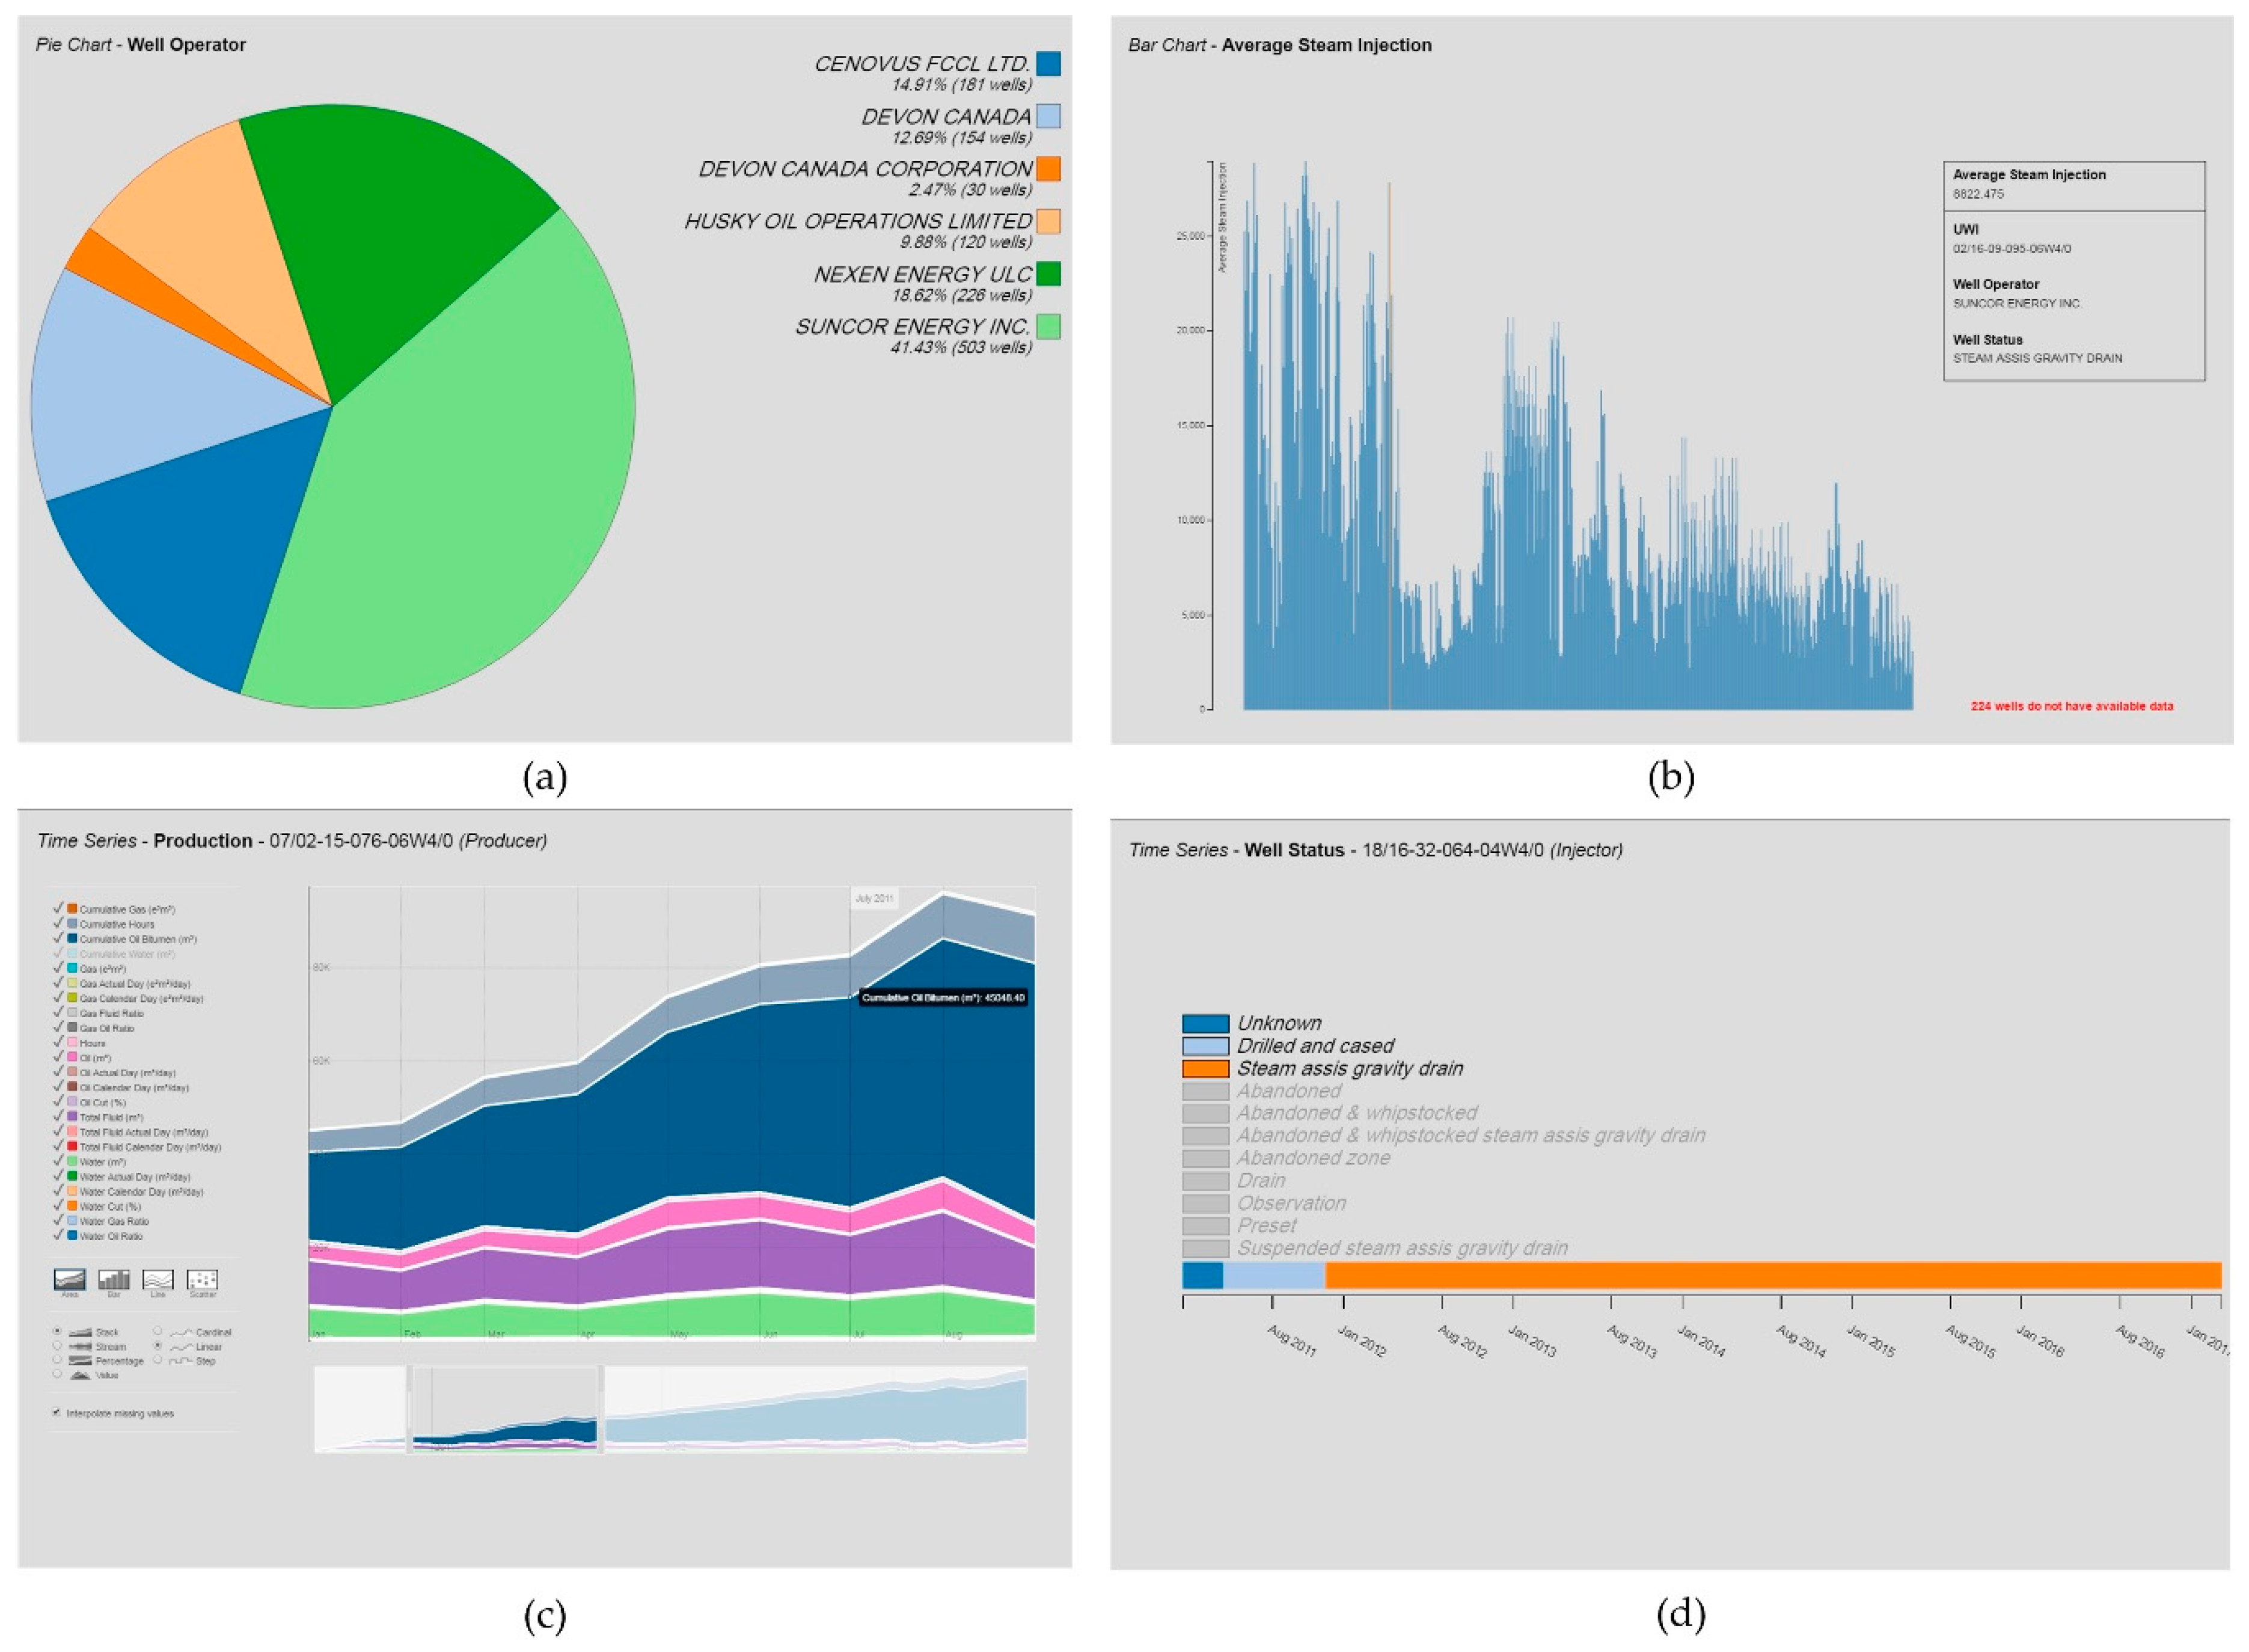
4.3.1. Classic Visualization Templates

Several classic visualization templates are provided in OGVES, such as pie, bar, multi-line and stream-line charts. With these templates, users can select projects, pads or wells and combine all types of data to generate customized charts for a basic information overview or a deep exploration of oil and gas data, including both value and attribute data. Figure 4 shows some example diagrams. The flexibility of this system makes these classic methods capable of handling all types of scales and primitives of oil and gas data. Although these methods are very useful, the limited usage of visual components leads to limited information expression, especially for spatial information.

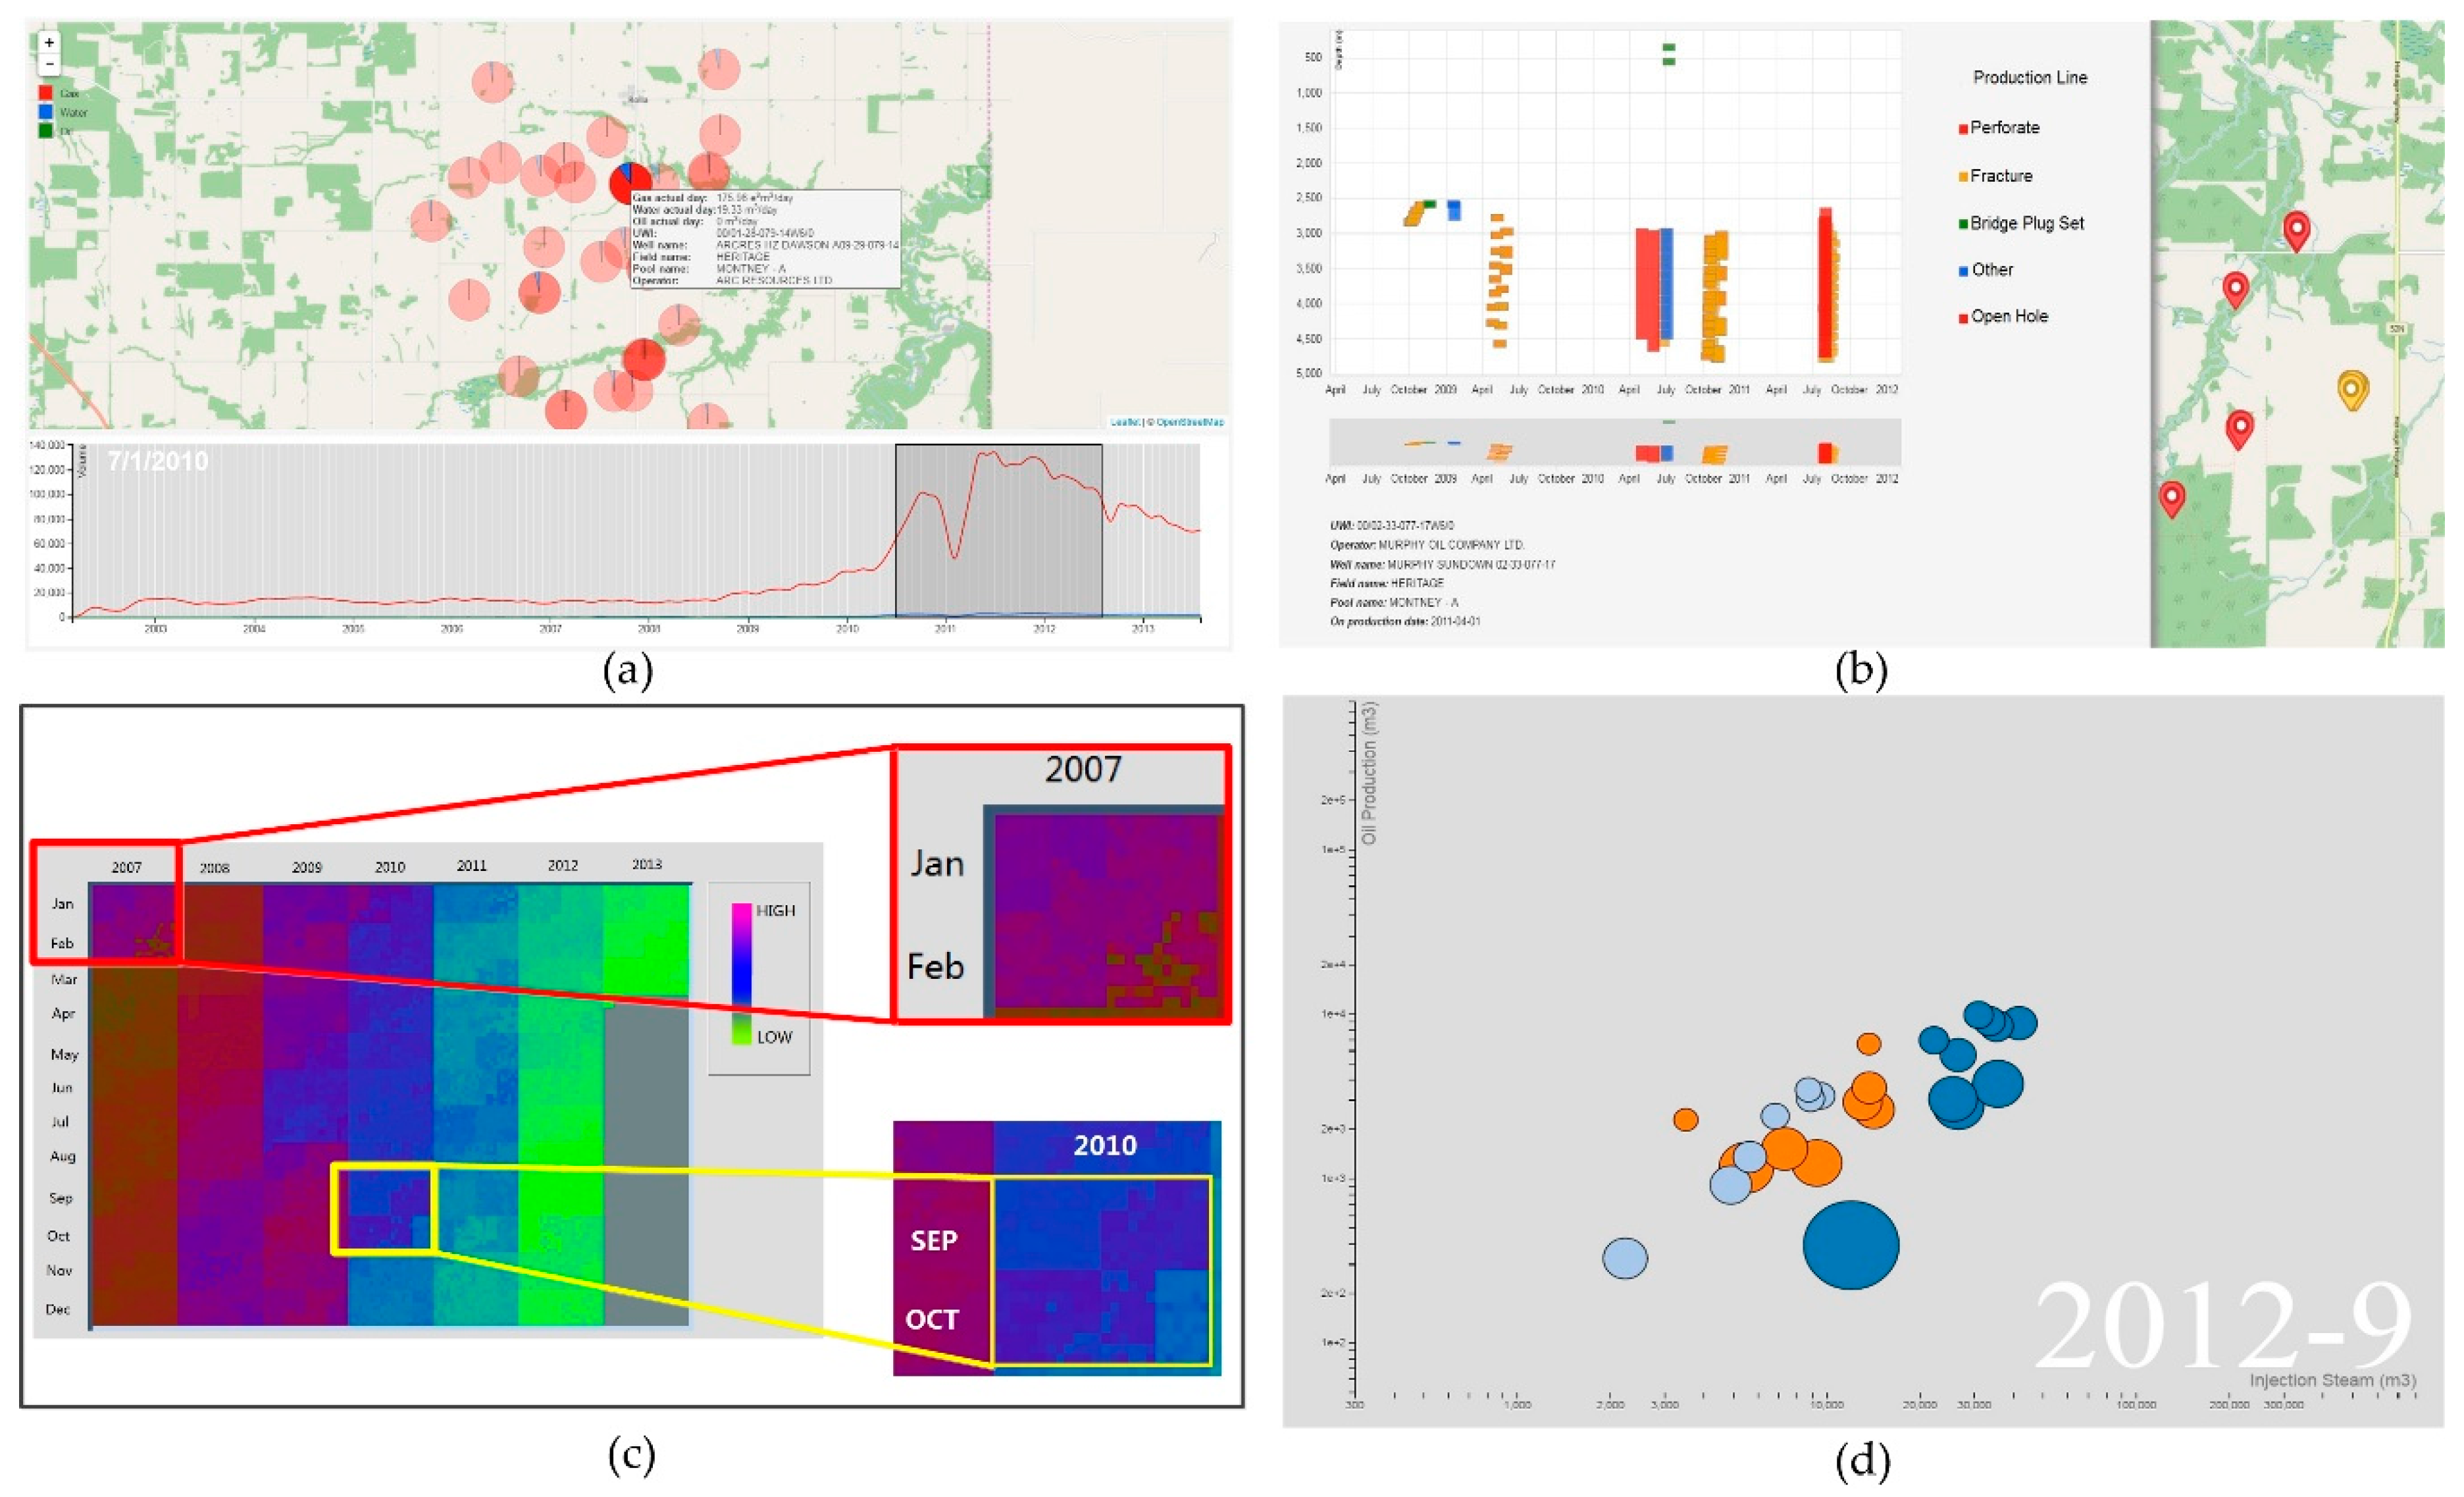
4.3.2. Visualization Based on VISM

We have implemented several effective visualization techniques to provide global, group and unit exploration. A bubble map has been designed for global exploration. A bubble map is a powerful method to present overview information when the scale that users are searching on is the whole area or a group of wells. The technique aims at providing an overview exploration and representing instant-based temporal information. By searching through the bubble map, users can explore locations of wells and their basic production-related attribute values, as well as their performance within a specific interval. Figure 5a shows an example of a bubble map using shale gas data.
Completion maps and pixel tables can be used for group exploration. A completion map was originally designed for completion data visualization, which is valuable for shale gas operation monitoring. It can also act as a project schedule, such as the classic Gantt chart [44], but with spatial extension. As shown in Figure 5b, the depth and time about where and when completions, including perforation, fracturing and open holes, that occur within one kilometer to a target shale gas well are demonstrated in the bar chart.
Pixels are one of the most abundant imaginative computer resources. By mapping data values into pixels, a pixel table can demonstrate the statistical production data of a particular pad or well in a flexible time period, making the method suitable for group exploration. In a pixel table, original data (both nominal and numeric data) are categorized and colored into pixels via classification methods. The pixels are then ordered into a tiling display. Usually, rows and columns illustrate different time primitives, and each pixel represents a specific data entity at an instant. Related objects can further be grouped into rectangles to show co-relationships or information at a larger scale. Figure 5c shows an example of pixel tables using oil production data.
Animation charts provide various practical conveniences. Users can compare these critical operation indexes among different pads or even projects in the same diagram. By dragging the time label at the right bottom, the chart displays corresponding data at each instant dynamically, thereby providing animation. Users can obtain detailed data with simple manipulation and complete particular tasks, such as finding wells with abnormal SOR, much easier with the assistance of the animation chart.

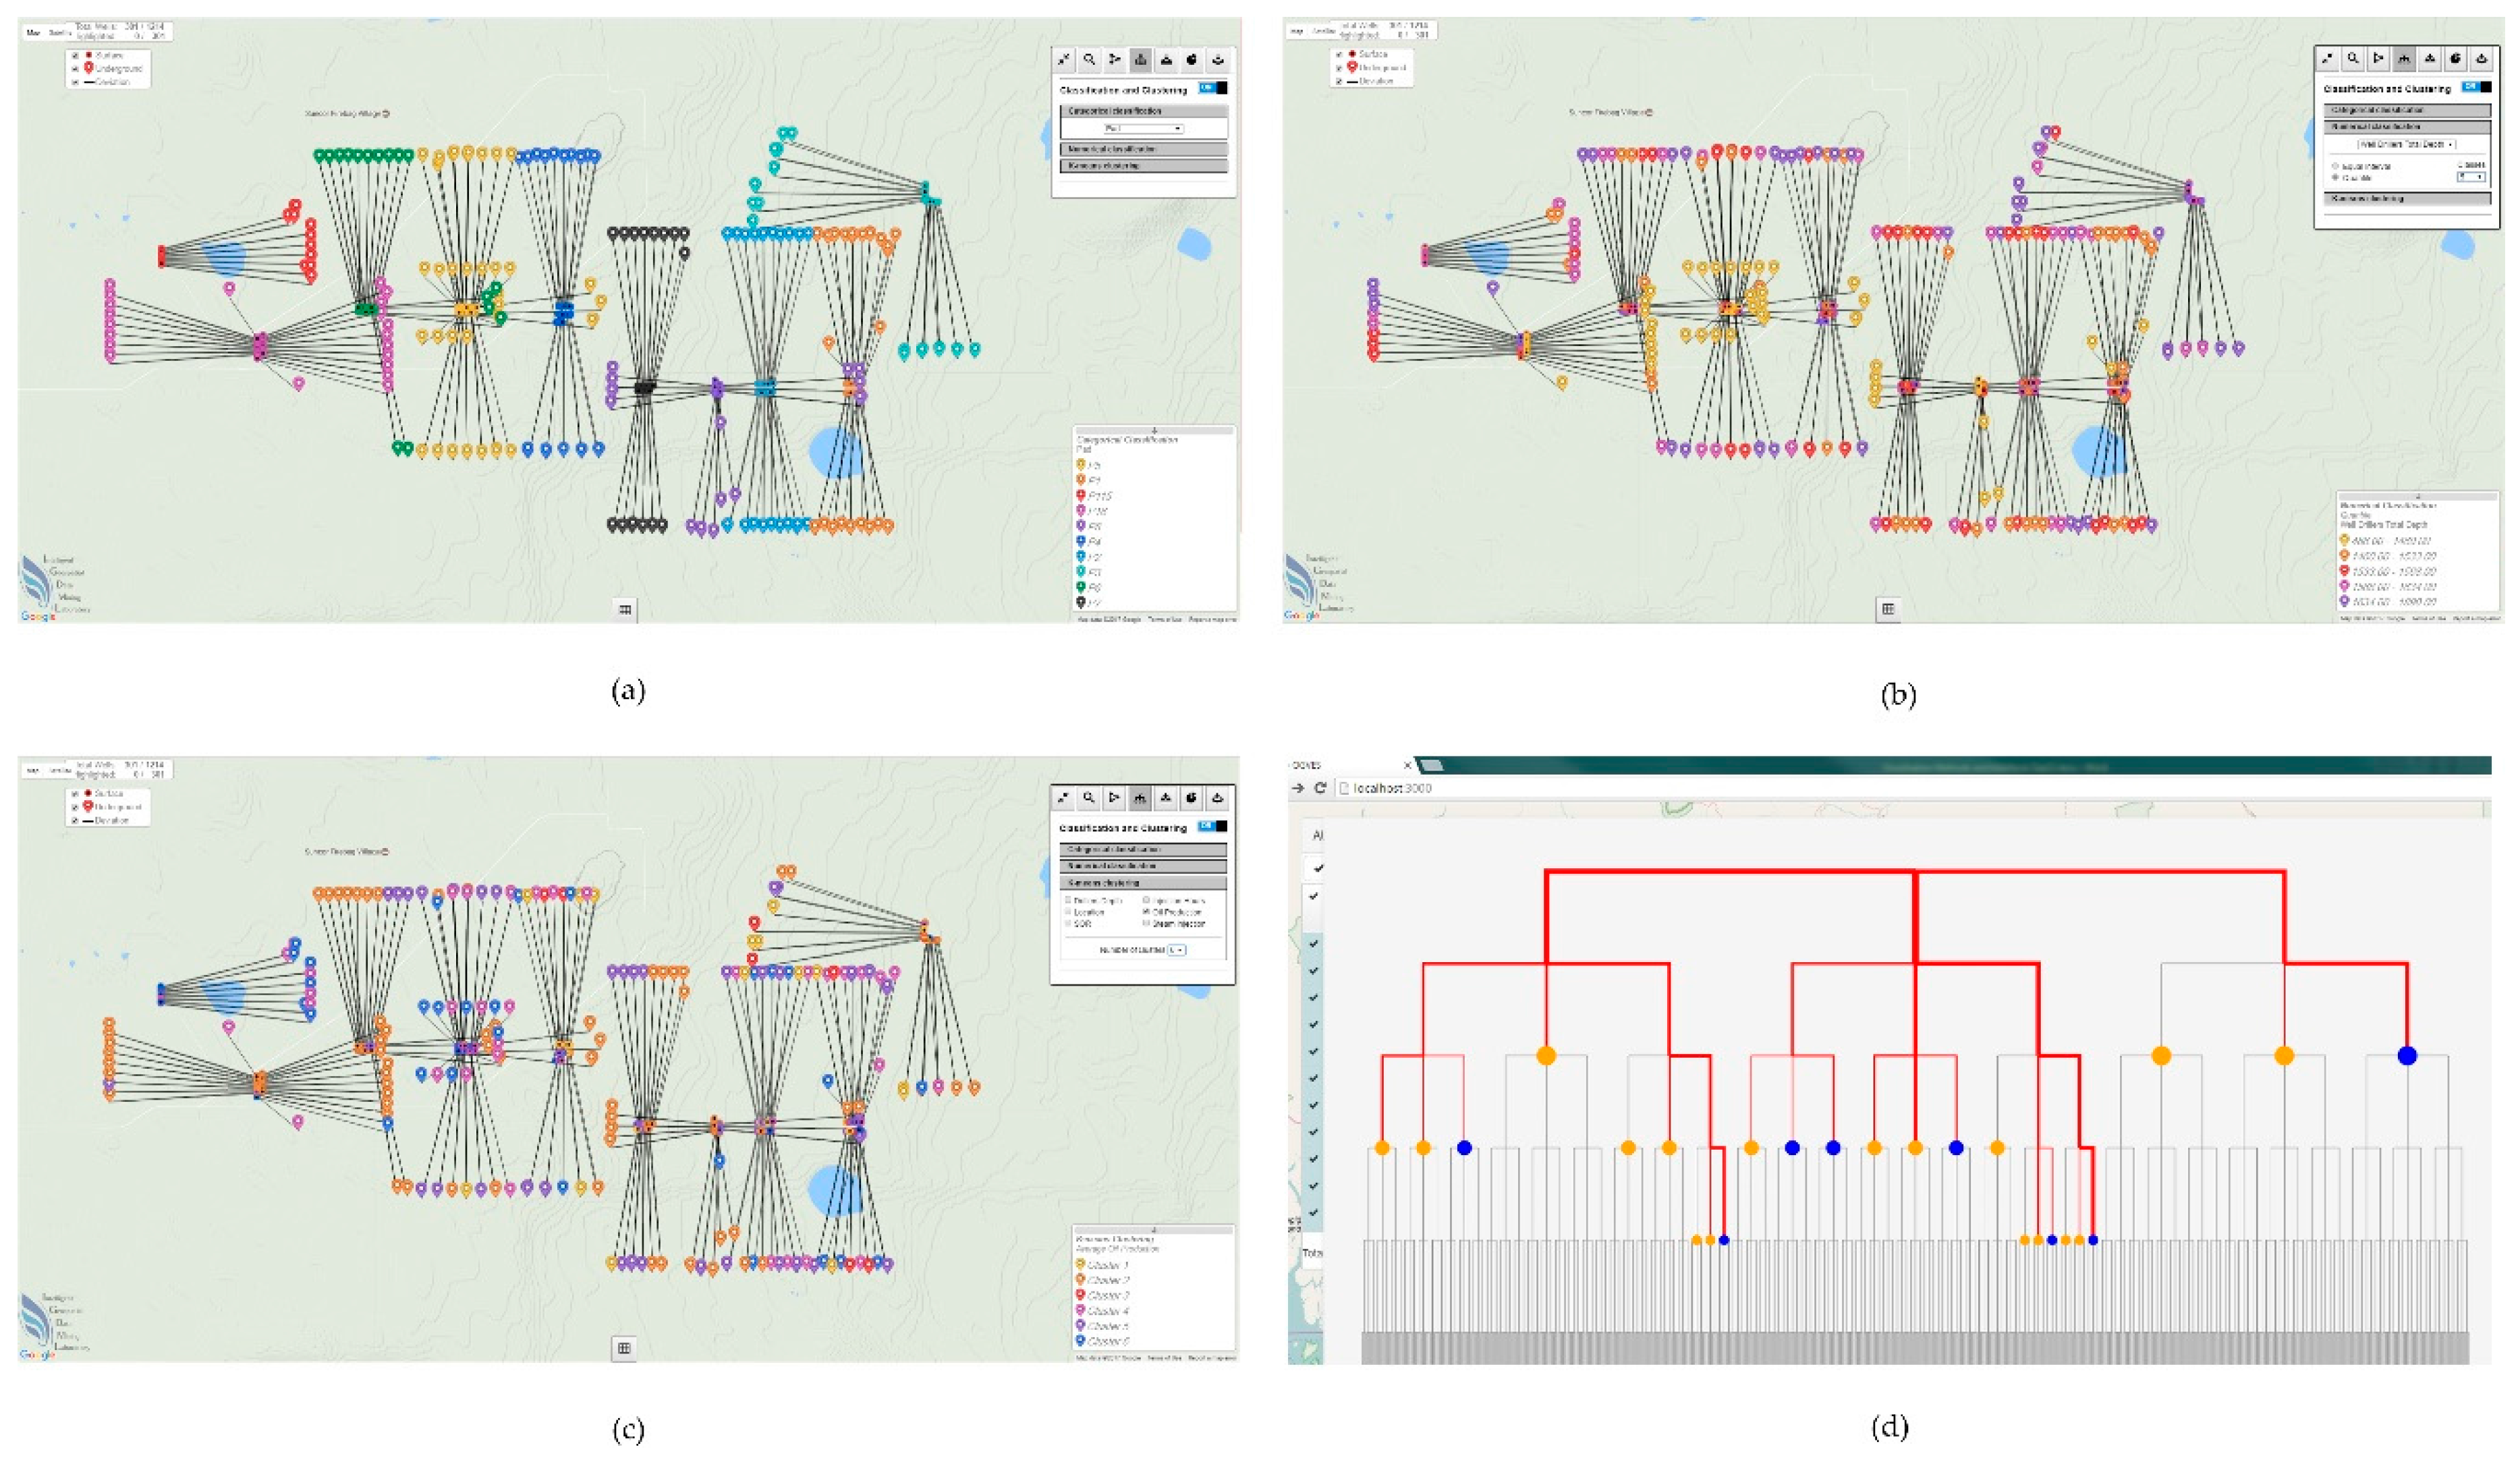
4.3.3. Visualization for Data Analytics Results

In addition to integrating previous methods designed for original data, OGVES can also perform data mining and visualize data mining results. By using data mining techniques introduced in Section 4.1, users can discover the hidden patterns in oil and gas data. Classification for numerical and categorical attributes, k-means clustering and ARM are implemented in OGVES. Moreover, the mapping interface displays the spatial patterns to not only communicate the mined results, but also provide the exploratory capability to users. The mined patterns associated with wells are shown in the map with an interactive map legend. The map legend explains the cartographic symbols, and clicking one symbol can result in the corresponding wells appearing.
By using categorical classification for well pads, wells in different pads are displayed in different colors, as shown in Figure 6a. Figure 6b presents an example of quantile classification on average oil production. Figure 6c displays the result of applying k-means clustering to SOR and oil production. Figure 6d shows the symbolic tree generated by using a symbol size of 3. In order to present the pruned trees with comparison to fully expanded trees, the branches of the pruned trees are colored in red, while the uncovered branches in full trees are colored in grey. The thickness of the branches indicates the number of wells included in the end nodes of the branches. For the nodes at end of those branches, a blue node represents that the wells in this leaf node are going to reach the expected production by a given time instant, while an orange node represents that the wells will fail to reach the expected production amount.

4.4. Summary of Visualization for Oil and Gas Production Data

Multiple visualization methods have been designed and implemented for oil and gas production data. Each method has its own features and satisfies different requirements. Considering various data types (nominal and numeric data) and sources (raw or analytic data), as well as complex spatial scale and temporal granularity, a universal technique that can perfectly display all those components is quite difficult or even impossible. Therefore, it is necessary to have an overall review of the methods. We summarize these methods from four aspects—spatial scale, temporal granularity, data type, and data source—based on their application in oil and gas production data. The results are shown in Table 1.
We can also observe how spatial scale and temporal primitive are combined in OGVES, as shown in Figure 7. The spatial scales in the system are categorized as global, group and unit, which are three types of data spatial organization forms. The global scale contains wells attribute information; a group conveys geographic group relations, while a unit is the basic element. Temporal primitive is separated into three primitives—instant, interval and span. Granularity reflects different temporal primitives of different exploration views, which can be seen as an intermediary layer between data elements and the time domain.
In general, global exploration focuses on illustrating information of the whole project at a specific interval with single granularity. In Figure 7, the red line presents global exploration; and, group exploration (green line) demonstrates further subsets of data of continuous time in multiple primitives, so that a specific pad with its whole continuous lifespan or part of a life cycle can be visualized. Unit exploration (blue line) can present the most detailed information, with all categories of granularity and primitive for an individual well or group of wells.

5. Case Studies

The data visualization of OGVES is illustrated with two case studies. In the first case, we demonstrate how OGVES assists engineers to determine an appropriate steam injection operation strategy. The capability of predicting production based on historical data of adjacent wells is illustrated in the second case study.

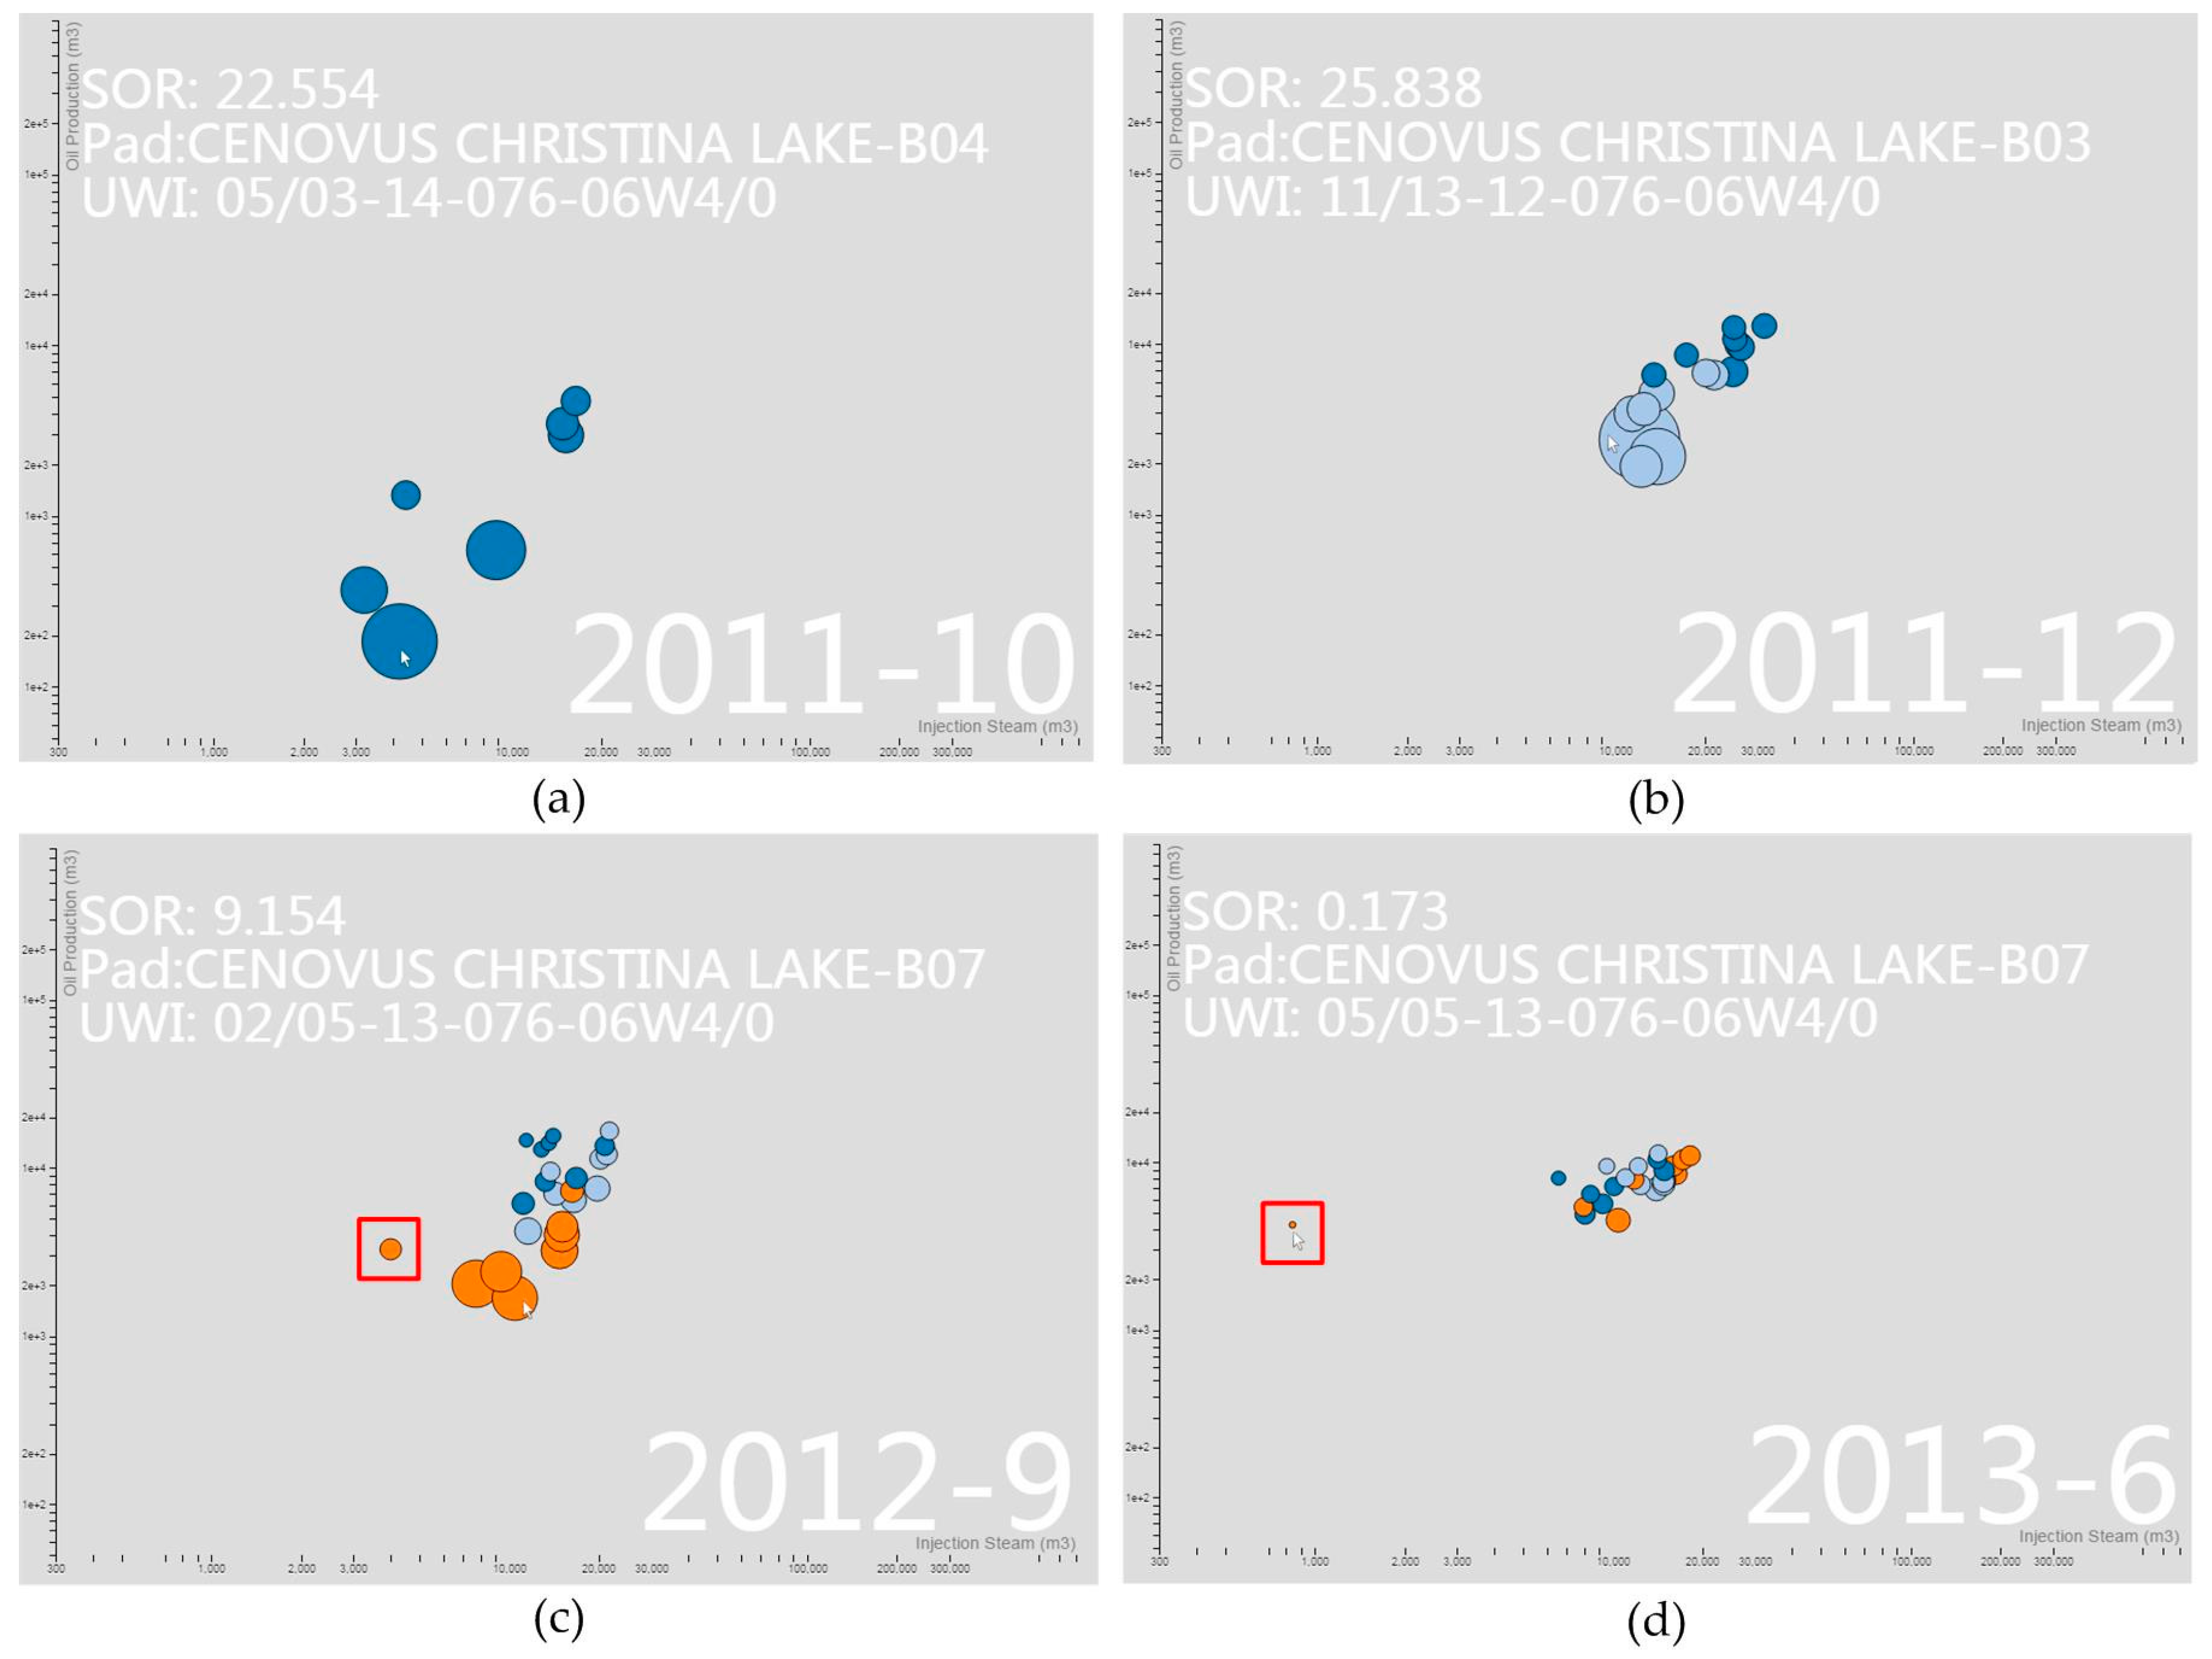
5.1. Case 1: What Steam Injection Strategies Should Be Adopted for SAGD Wells and How Will Each Strategy Affect Well Production?

In SAGD production, a large quantity of high-pressure steam is injected into an oil reservoir. The steam heats the producing formation and enables heated crude oil or bitumen to flow toward the production well. The injection process is a costly procedure, hence steam injection operation strategies are crucial for competitive production. OGVES can provide a data-driven workflow to assist engineers decide on a steam injection strategy from current practice.
In this case study, the SAGD dataset included 1214 wells and spanned 137 consecutive months, from August 2002 to December 2013, from the Alberta Energy Regulator and Divestco GeoCarta. The collected wells belonged to the following six projects: Project Firebag (with 15 pads) and MacKay River (12 pads) operated by Suncor Energy; Project Tucker (4 pads) by Husky Energy; Project Jackfish (13 pads) by Devon Energy; Project Christina Lake (11 pads) by Cenovus Energy; and Project Long Lake (13 pads) by Nexen Energy. This dataset contained five parts: well, status, production, injection and statistic data.
In order to obtain an overall understanding about the data, engineers used the map-based interface together with a bubble map to overview the basic information of wells, e.g., well locations and production status. For example, all wells in Project Cenovus Christina Lake were plotted on the base map, as shown in Figure 8a. As the organization of the three different spatial components of SAGD wells, the heels (red circle with black solid), toes (red pin with white hollow) and derived lines, standing for the well trajectory, were separately mapped. Each pad consisting of adjacent wells could be seen distinctly, and the layout could assist engineers comprehend overall spatial distribution. In addition, the key production data were integrated into the base map. Figure 8b presents an instance that, after selecting the wells of interest, engineers could directly obtain comprehensive knowledge of production indicators of a specific instant. Production data, injection data and SOR were displayed in multiple pie charts and rendered using red, blue and green individually, enlarged pie charts for more detail, as shown in Figure 8c. As shown in Figure 8b, in October 2012, the production of each well in Pad B-03 ranged from 7406.7 to 12,752.1 m3, with SOR fluctuating between 0.4 and 2.85. Noticeably, while the average SOR was around 2, there was a distinctive well with a much lower SOR, 0.4. This well was worthy of further exploration.
Since steam injection and oil production change over the time, engineers are interested in acquiring a deeper understanding of how the production and SOR change over time. In this case, an animation chart supported further comparison of the detailed production-related data. Three adjacent pads from the Christina Lake project—Pads B-04, B-03 and B-07—were selected, as shown in Figure 9. In Figure 9a, it is noted that Pad B-04, rendered in dark blue circles, was first exploited in October 2010 and appeared to have unstable performance. The highest SOR was noticeable, while the production of each well fluctuated obviously: this may have resulted from a high injection heating up the reservoir unevenly in the early stage.
Two months after Pad B-04 started, the heating up process was initiated in Pad B-03 (drawn in light blue circles in Figure 9b). It can be observed that the initial status of Pad B-03 was much more stable than that of Pad B-04, which means two months of continuously heating up could affect adjacent pads. Although the maximum SOR was even larger, the higher injection led to higher production. Additionally, the SOR of Pad B-04 decreased visibly over time.
Figure 9c verifies that an adjacent pad can benefit from previous injection. Pad B-07 performed better at the very early stage, with its maximum SOR much smaller than the Pads B-03 and B-04. The decline of SOR in mature pads was apparent.
Well 05/05-13-076-06W4/0 in Pad B-07 is marked with a red rectangle in Figure 9c,d. This well showed an impressive initial SOR (1.25), which was even smaller than the SOR of several mature wells. Furthermore, it exhibited abnormally outstanding production as time went by. In June 2013, nine months after the first injection, its SOR was 0.17, as shown in Figure 9d. Inevitably, after finding this attractive performance from detailed exploration, engineers could investigate its operation strategy and how the injection process impacted performance.
To solve these problems, OGVES provides analytical functions based on data mining. Figure 10 shows the ARM results for mining the relationship between injection (hour and steam amount) and production (oil production and SOR) using data from Christina Lake Pads B-04, B-03 and B-07. There were five significant rules discovered in the system. The first rule, with 90% confidence, stated that if one well had a high average injection hour with a low standard deviation and low average injection steam with a low standard deviation, the well may have a good SOR average with a low SOR standard deviation. This rule means that after sufficient steam injection, good production performance may be maintained by using a relatively lower, but continuously steady injection strategy. Rules 2 and 3 indicated that both erratic operation and inadequate steam may result in the reduction of oil production.
The mined rules can be referred to when new wells are to be developed near the existing wells. Engineers can make the steam injection operation decisions and expect the production efficiency from the new wells according to the rules that their adjacent wells have matched.

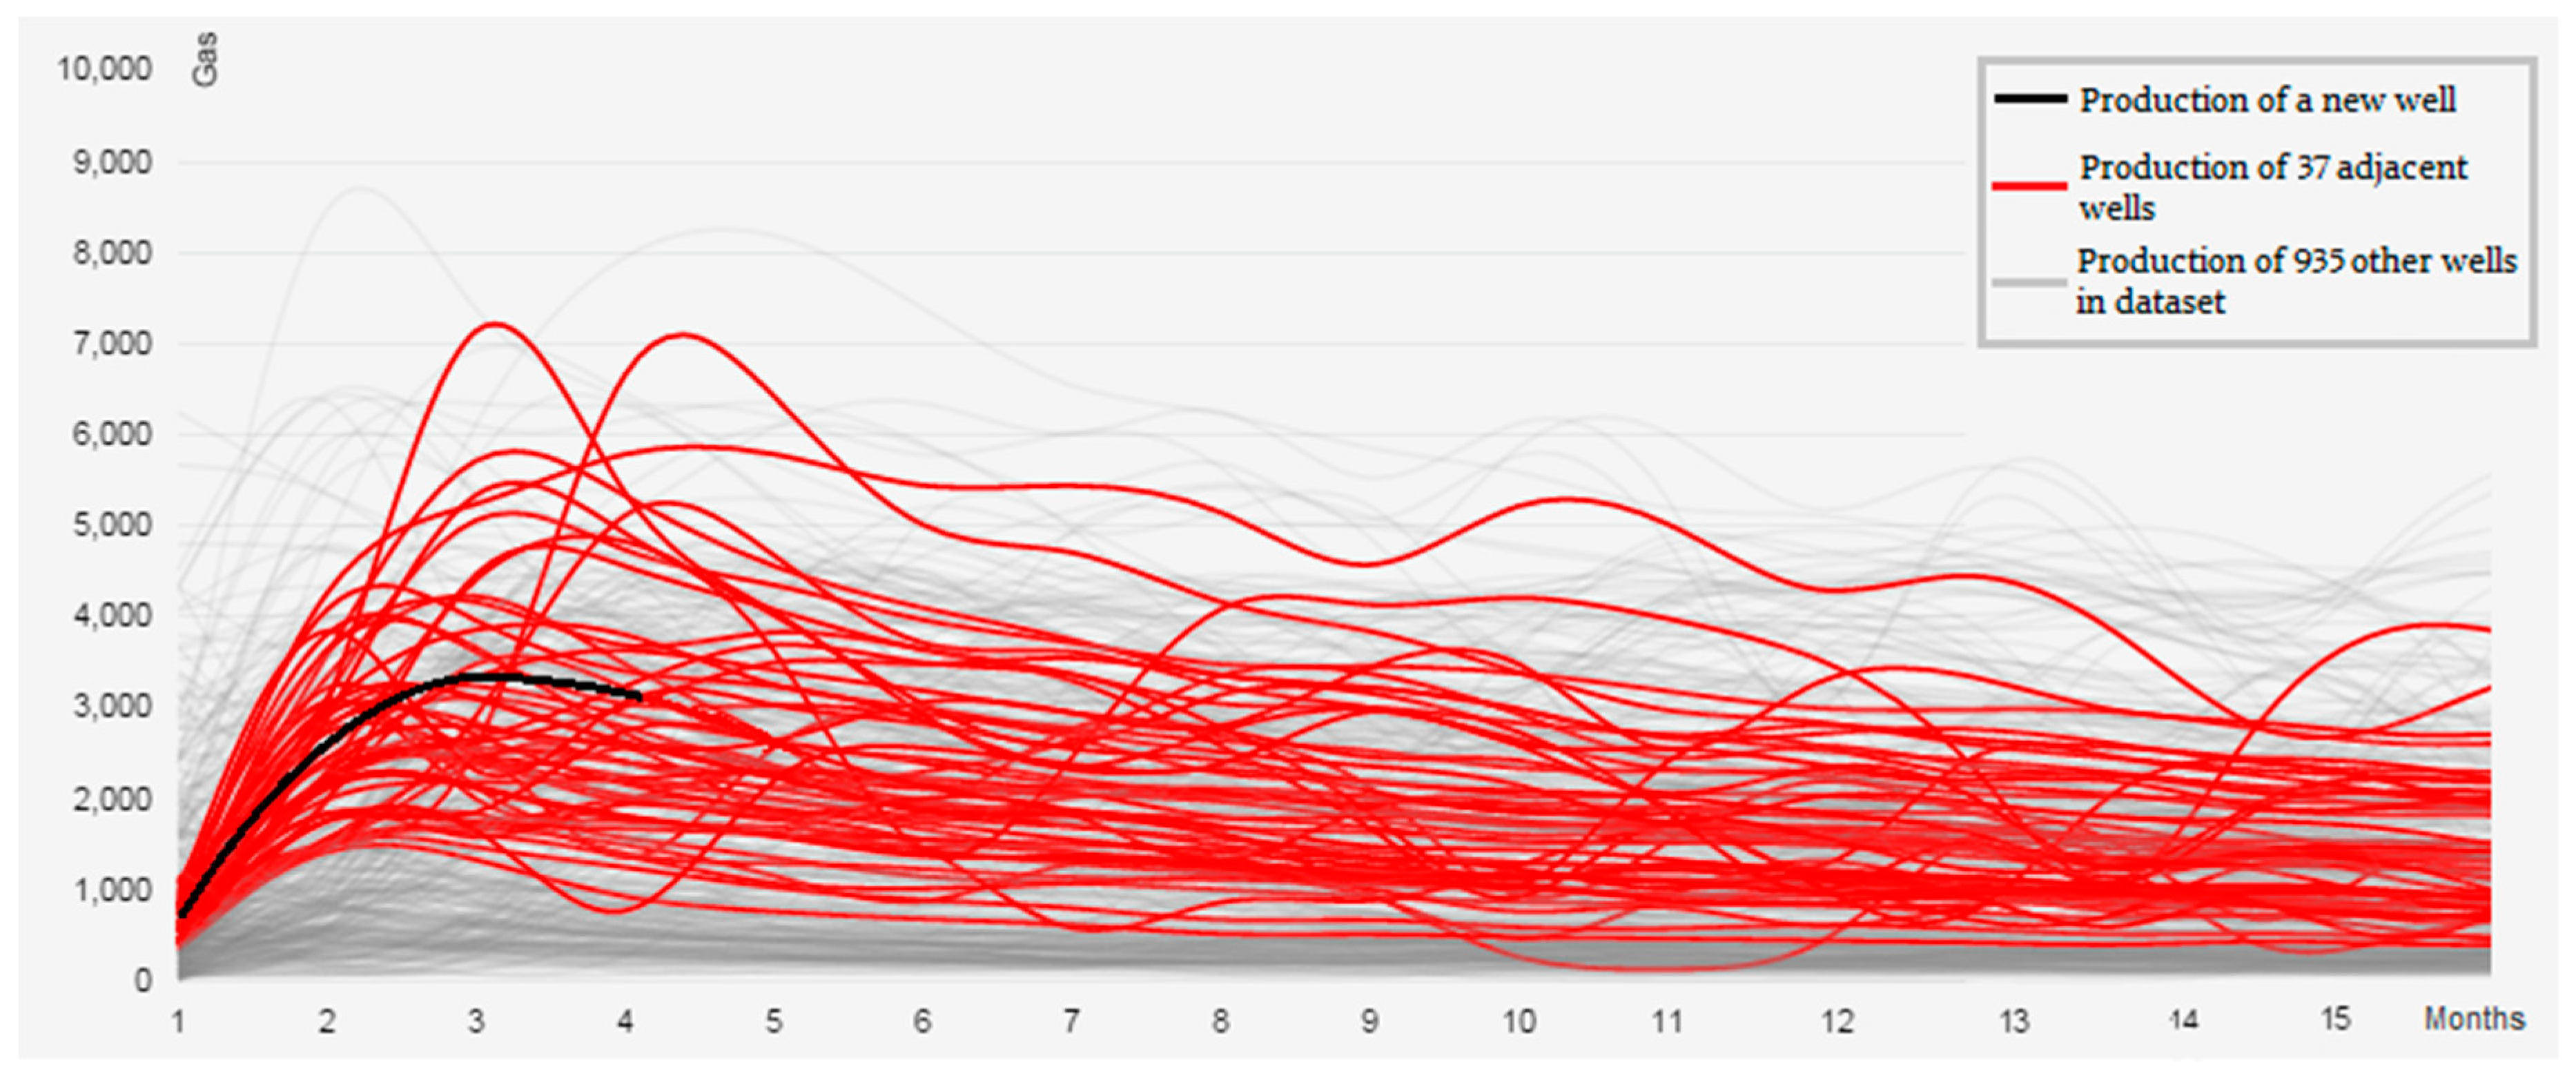
5.2. Case 2: Will a New Shale Gas Well Reach Expected Production at a Specific Instant?

Shale gas production prediction in the early stages of extraction is critical for future profitmaking. In this case, reservoir engineers and project managers from Heritage Field were interested in knowing whether a new well (02/B-084-A/093-P-09/X) would reach 10,000 m3 cumulative production in one year, according to the first four months production. Successful prediction is able to support project managers in making decisions, such as adjusting operation strategy or even shutting down unpromising wells. To accomplish this task, a shale gas dataset was used, which included 972 wells and spanned 137 consecutive months, from June 2000 to October 2011. This dataset contained six parts (well, status, geological, completion, temperature and production data) and supplied sufficient historical data for prediction in this case.
Although using historical production data of adjacent wells to predict a new well’s performance is common practice, some problems have to be solved. In this study, we focused on Montney play, located in British Columbia and Alberta, which is considered as the most active drilling area in Canada. From the Montney—A pool, 972 wells were selected. All of these wells had been producing for more than one year and could supply sufficient historical data. We plotted historical production data using a multi-line chart, as shown in Figure 11, where the black line displays the first four months’ production of the new well, while 37 red lines show historical production of adjacent wells.
Obviously, a production trend is difficult to derive from curves; even adjacent wells can make it very difficult to predict future production by simply comparing the curves, not to mention taking the other 935 wells (plotted as grey lines in background) into consideration. To assist managers in planning shale gas production, OGVES provided a symbolic tree model to predict early in the lifespan, as shown in Figure 12.
To build the symbolic tree model, the historical production of 972 wells was retrieved, 80% (777 wells) were categorized as the training set and used to construct the symbolic tree prediction model. All these production data were aggregated monthly and symbolized with a specific symbol size (we used 3 as the default), equiprobable data discretion was applied to symbolize the production data. Two 3-quantile data points (i.e., 336.55 and 1127.4) were calculated, so that the whole dataset could be cut into three equal-sized groups. Wells with monthly production under 336.55 m3 were categorized as low production; wells with high production had values above 1127.4 m3; and, the production of medium wells ranged between low and high production. Therefore, the production of a well could be reduced from a quantitative time-series data to a symbol sequence, such as “L M L H H”. A new well can be classified based on its symbol sequence and then be predicted by checking its end node in the symbolic tree.
To evaluate the symbolic tree prediction, the remaining 20% production data were used as a testing dataset. Symbolic trees with different symbol sizes (from 3 to 6) were constructed; and, three measurements (sensitivity, specificity and accuracy) were calculated. We found that the accuracy decreased when the symbol size increased, but all four models could reach accuracies above 90%, which means over 90% of the wells have been correctly classified in terms of their ability to reach 10,000 m3 gas production by the end of their first year.
After the whole predictive symbolic tree had been constructed, the production of well 02/B-084-A/093-P-09/X could be predicted. As shown in Figure 12, when we plotted the symbol sequence of this well in the interface as the black line, it ends with a blue node, which means the well is predicted to be able to achieve more than 10,000 m3 cumulative gas production within 12 months.

6. Evaluation

A user study was carried out to evaluate OGVES. Nine unpaid researchers and engineers in data mining or petroleum engineering were recruited for a user study of OGVES on a PC. Participants included five males and four females, with ages ranging from 24 to 42 (mean of 30.4, median of 28, standard deviation of 5.61). All participants had normal or corrected to normal vision.
The user study was conducted in a laboratory using the same PC (Intel 2700K 3.5GHz Quad-Core CPU, 16GB of RAM and Windows 7 Enterprise). Experiments were run on a 27-inch LCD monitor with 1920*1080 resolution and 32-bit sRGB color mode. For each experiment, the monitor was adjusted to the same brightness and level of contrast. Participants interacted with the software using a standard mouse at a desk in a dimmed experimental room. The absence of windows in the room maintained a constant and uniform lighting environment. Users were first introduced to OGVES, its goal, interfaces and main functions explained. They were then given 15 minutes for free exploration to get familiar with the system.
Four tasks (T1-T4) and five general questions were designed for the user study to evaluate the effectiveness of OGVES, as summarized in Table 2. Task 1 asked users to freely browse the whole dataset and enabled users to get familiar with the system and evaluate data management functions. Tasks 2 and 3 focused on evaluating the effect of visualization methods: Users were asked to visualize data of interest using multiple methods and then to compare them. Task 4 was designed for evaluating data analytic functions in OGVES.
Every task had several survey questions and write-in questions except T2, which consisted of only write-in questions. All the survey questions had the same set of choices on a 5-point Likert scale (1: strongly disagree; 2: disagree; 3: neutral; 4: agree; 5: strongly agree). users could perform the tasks whenever they felt comfortable and were informed that the tasks were not timed and their comments were important evaluation. Each study took about 1 hour to complete. The outcome of the user study is summarized in Table 2.
Further explanation on these outcomes is provided as follows. In terms of T1, the feedback was positive. All users stated that OGVES provided necessary data management functions with a user-friendly interface. Furthermore, diverse data searching and filtering were useful for different scenarios. However, one field engineer suggested that geological data could be added because they are also critical in practice.
As for T2 and T3, users were asked to visualize any data by any methods in OGVES and evaluate different methods. Various visualization techniques resulted in many comments. Generally, all participants stated that the effect of visualization methods designed based on VISM were better than classic ones, especially when multiple objects with multiple features were plotted, as multi-line charts showed redundant and confusing results, with too much information compressed in a small space, making identification of the object of interest very difficult. Users also commented the global-group-unit workflow could satisfy observation from different spatial levels, while temporal representations could be improved. One data analyst and one field engineer suggested that it is better to design a method that could represent and compare wells production data by the periods or stages of well life span rather than regular year/month.
In T4, we asked users to try to discover hidden information, such as the common characteristics among adjacent wells or production prediction. Seven participants stated that the integration of data mining technology was helpful, because it provided more aspects to explore oil and gas data. While two engineers insisted that although clustering and ARM represented reasonable patterns, solid geological and geophysical evidence should be combined with the data driven methods to persuade operators; however, they also approved of the effect of the symbolic tree production prediction model.
Finally, all participants were asked to evaluate OGVES as a data management and visual exploration system. All participants agreed that OGVES provided diverse data visualization methods and general data mining methods, as well as an objective-directed analytic model. Therefore, OGVES could help them find previously unknown production information.
We also compared OGVES with two popular existing oil and gas geographical information systems, GeoCarta by Divestco and iGlass by Katalyst. A functional comparison between OGVES and two systems is given in Table 3. As shown in the table, OGVES utilizes open-source development, thereby reducing the deployment requirement and cost; and, it can provide similar data management functions, except for less support on the cartographical functions. However, OGVES provides more data visualization and analytic functions to allow engineers to deeply analyze production data. For interested readers, we provide an online video demonstration for a limited version of OGVES [45].

7. Conclusions and Future Work

In this paper, we present the web-based data management and visualization system OGVES to explore oil and gas data. With the introduction of visual exploration, users are capable of examining the potential patterns from the view of visual analytics. A set of visualization techniques are introduced and designed based on classic VISM to demonstrate large production datasets and find noticeable and valuable patterns, while different spatial scales and temporal primitives are taken into consideration. For distinct scenarios in practical application, two case studies are provided using the proposed system and prove reliability, extendibility and usability of the proposed system.
Improvements to OGVES in the future are discussed in the following paragraphs.
More visualization techniques can be added into the system. Currently, the OGVES includes chart, pixel-based and symbol-based techniques. Other valuable techniques, such as Chorems [46], may benefit the system. A chorem is a synthetic spatial representation that shows a global view of the data of interest and emphasizes prominent aspects. For example, combining bubble and chorem maps to represent both critical spatial entities and nominal values may improve the usability of the system through elimination of unnecessary details. Moreover, integration of three-dimensional (3D) visualization into the system will improve the engineers’ ability to understand complicated geological and geophysical data. The current architecture of OGVES makes it possible to create new 3D visualization functions for well log or seismic data through WebGL API [47], a JavaScript API for rendering interactive 3D graphics. Visualization results in OGVES still need to be improved. Since oil and gas data are big spatiotemporal data, the improvement of the layout readability for a GIS interface and the use of proper spatiotemporal data structures will be further explored in the future [48,49].
Although the current system provides some analytical functions, more data mining algorithms should be developed and integrated into OGVES. First of all, the system would benefit from the inclusion of intelligent data preprocessing methods, such as data cleaning and data integration methods. Usually, oil and gas data are noisy. Data cleaning can help fill in missing values and remove noise, while data integration methods can combine oil and gas data from multiple sources to form coherent datasets. Additionally, reservoir characterization quantitatively assigns subsurface reservoir properties, which is a fundamental and critical process for reservoir engineers to make decisions. Although several advanced techniques, such as Artificial Neural Networks (ANN), have recently been introduced [50] in this field, the preprocessing of input parameters is still time-consuming and critical for ANN performance. Therefore, functions of correlation removal among input well log parameters and automatic well log feature selection are needed. OGVES can combine Fuzzy Ranking with the traditional ANN to provide optimized principal characteristic parameters. Moreover, oil and gas production data are essentially time-series data, new time-series data analytical methods should be proposed in the system for specific tasks. For example, a temporal motif-finding algorithm can be used to scale the hysteresis between steam injection and oil production for the SAGD process.
Only limited spatiotemporal information of oil and gas data is discussed in the system. With the rapid development of the sensor web in the future, OGVES will be able to retrieve and process real-time sensory data, such as online monitoring data, through the flexible data layer design. On the other hand, more complex spatiotemporal data will be considered and utilized in the system, such as facilities operation data and pipelines status data. More visualization and analytic functions will also be provided based on these detailed oil and gas production indicators; i.e., a Discrete Element Method (DEM) framework can be implemented to evaluate the impact of sand particles to pipeline walls and predict pipeline erosion in SAGD.

Acknowledgments

The research is supported by a Discovery Grant from the Natural Sciences and Engineering Research Council of Canada (NSERC) and by the China Scholarship Council.

Author Contributions

All the authors contributed to the development of OGVES and this manuscript. Yuanchen Li and Bingjie Wei designed and implemented OGVES and wrote the manuscript. Xin Wang proposed the research and revised the manuscript.

Conflicts of Interest

The authors declare no conflict of interest.

References

  1. Wei, B.; Silva, R.; Wang, X. A web-based Steam Assisted Gravity Drainage (SAGD) data visualization and analytical system. In Proceedings of the 14th International Symposium on Web and Wireless GIS (W2GIS 2015), Grenoble, France, 21–22 May 2015.
  2. Divestco. Available online: http://www.divestco.com (accessed on 21 October 2016).
  3. IHS. Available online: http://www.ihs.com (accessed on 21 October 2016).
  4. Katalyst Data Management. Available online: http://www.katalystdm.com (accessed on 21 October 2016).
  5. GeoLOGIC Systems Ltd. Available online: http://www.geologic.com (accessed on 21 October 2016).
  6. Government of Saskatchewan. Available online: http://www.infomaps.gov.sk.ca (accessed on 2 March 2017).
  7. Petrol Global News. Available online: https://petroglobalnews.com/ (accessed on 2 March 2017).
  8. Noah, S.A.; Yaakob, S.; Shahar, S. Application of information visualization techniques in representing patients’ temporal personal history data. In Visual Informatics: Bridging Research and Practice; Springer: Berlin/Heidelberg, Germany, 2009; pp. 168–179. [Google Scholar]
  9. Thomas, J.J.; Cook, K.A. A visual analytics agenda. IEEE Comput. Graph. Appl. Mag. 2006, 26, 10–13. [Google Scholar] [CrossRef]
  10. Lee, H.Y.; Ong, H.L. Visualization support for data mining. IEEE Intell. Syst. 2006, 11, 69–75. [Google Scholar]
  11. Miller, H.J.; Han, J. (Eds.) Geographic Data Mining and Knowledge Discovery; CRC Press: Boca Raton, FL, USA, 2009.
  12. Ko, S.; Maciejewski, R.; Jang, Y.; Ebert, D.S. Marketanalyzer: An interactive visual analytics system for analyzing competitive advantage using point of sale data. Comput. Graph. Forum 2012, 31, 1245–1254. [Google Scholar] [CrossRef]
  13. ElHakim, R.; ElHelw, M. Interactive 3d visualization for wireless sensor networks. Vis. Comput. 2010, 26, 1071–1077. [Google Scholar] [CrossRef]
  14. Trimm, D.; Rheingans, P.; desJardins, M. Visualizing student histories using clustering and composition. IEEE Trans. Vis. Comput. Graph. 2012, 18, 2809–2818. [Google Scholar] [CrossRef] [PubMed]
  15. Pileggi, H.; Stolper, C.D.; Boyle, J.M.; Stasko, J.T. Snapshot: Visualization to propel ice hockey analytics. IEEE Trans. Vis. Comput. Graph. 2012, 18, 2819–2828. [Google Scholar] [CrossRef] [PubMed]
  16. Tan, L.; Song, Y.; Liu, S.; Xie, L. Imagehive: Interactive contentaware image summarization. IEEE Comput. Graph. Appl. 2012, 32, 46–55. [Google Scholar] [CrossRef] [PubMed]
  17. Nocaj, A.; Brandes, U. Organizing search results with a reference map. IEEE Trans. Vis. Comput. Graph. 2012, 18, 2546–2555. [Google Scholar] [CrossRef] [PubMed]
  18. Von Landesberger, T.; Bremm, S.; Andrienko, N.; Andrienko, G.; Tekušová, M. Visual analytics methods for categoric spatio-temporal data. In Proceedings of the IEEE Symposium on Visual Analytics Science and Technology, Seattle, WA, USA, 14–19 October 2012; pp. 183–192.
  19. Ferreira, N. Visual exploration of big spatio-temporal urban data: A study of New York City taxi trips. IEEE Trans. Vis. Comput. Graph. 2013, 19, 2149–2158. [Google Scholar] [CrossRef] [PubMed]
  20. Wang, Z. Visual exploration of sparse traffic trajectory data. IEEE Trans. Vis. Comput. Graph. 2014, 20, 1813–1822. [Google Scholar] [CrossRef] [PubMed]
  21. Mazumdar, S.; Kauppinen, T. Visualizing and animating large-scale spatiotemporal data with ELBAR explorer. In Proceedings of the 2014 International Conference on Posters & Demonstrations Track; CEUR-WS.org: Aachen, Germany, 2014; Volume 1272, pp. 161–164. [Google Scholar]
  22. Tatu, A. Automated analytical methods to support visual exploration of high-dimensional data. IEEE Trans. Vis. Comput. Graph. 2011, 17, 584–597. [Google Scholar] [CrossRef] [PubMed]
  23. Gebbert, S.; Pebesma, E. A temporal GIS for field based environmental modeling. Environ. Model. Softw. 2014, 53, 1–12. [Google Scholar] [CrossRef]
  24. Hengl, T.; Roudier, P.; Beaudette, D.; Pebesma, E. plotKML: Scientific visualization of spatio-temporal data. J. Stat. Softw. 2015, 63, 1–25. [Google Scholar] [CrossRef]
  25. Evans, F.; Volz, W.; Dorn, G.; Frohlich, B.; Roberts, D.M. Future trends in oil and gas visualization. In Proceedings of the Conference on Visualization 2002 (VIS 2002), Boston, MA, USA, 27 October–1 November 2002; pp. 567–570.
  26. Anderson, D.M.; Nobakht, M.; Moghadam, S.; Mattar, L. Analysis of production data from fractured shale gas wells. In Proceedings of the SPE Unconventional Gas Conference, Pittsburgh, PA, USA, 23–25 February 2010.
  27. Baihly, J.D.; Altman, R.M.; Malpani, R.; Luo, F. Shale gas production decline trend comparison over time and basins. In Proceedings of the SPE Annual Technical Conference and Exhibition, Pittsburgh, PA, USA, 23–25 February 2010.
  28. Nobakht, M.; Mattar, L.; Moghadam, S.; Anderson, D.M. Simplified forecasting of tight/shale-gas production in linear flow. J. Can. Pet. Technol. 2012, 51, 476–486. [Google Scholar] [CrossRef]
  29. Bostock, M.; Ogievetsky, V.; Heer, J. D³ data-driven documents. IEEE Trans. Vis. Comput. Graph. 2011, 17, 2301–2309. [Google Scholar] [CrossRef] [PubMed]
  30. Hall, M.; Frank, E.; Holmes, G.; Pfahringer, B.; Reutemann, P.; Witten, I.H. The WEKA data mining software: An update. ACM SIGKDD Explor. Newsl. 2009, 11, 10–18. [Google Scholar] [CrossRef]
  31. Deoliveira, J. GeoServer: Uniting the GeoWeb and spatial data infrastructures. In Proceedings of the 10th International Conference for Spatial Data Infrastructure, St. Augustine, Trinidad, 25–29 February 2008.
  32. Google Maps APIs. Available online: https://developers.google.com/maps/ (accessed on 21 October 2016).
  33. Darwin, P.B.; Kozlowski, P. AngularJS Web Application Development; Packt Publishing: Birmingham, UK, 2013. [Google Scholar]
  34. Momjian, B. PostgreSQL: Introduction and Concepts; Addison-Wesley: New York, NY, USA, 2001. [Google Scholar]
  35. Tilkov, S.; Vinoski, S. Node.js: Using JavaScript to build high-performance network programs. IEEE Internet Comput. 2010, 14, 80–83. [Google Scholar] [CrossRef]
  36. Han, J.; Pei, J.; Kamber, M. Data Mining: Concepts and Techniques; Elsevier: Amsterdam, The Netherlands, 2011. [Google Scholar]
  37. Liu, S.; Xue, L. The application of fuzzy clustering to oil and gas evaluation. In Proceedings of the Fuzzy Systems and Knowledge Discovery, Fifth International Conference on Fuzzy Systems and Knowledge Discovery, Jinan, Shandong, China, 25–27 August 2008.
  38. Aulia, A.; Keat, T.B.; Maulut, M.S.; El-Khatib, N.; Jasamai, M. Smart oilfield data mining for reservoir analysis. Int. J. Eng. Technol. 2010, 10, 78–88. [Google Scholar]
  39. Cai, Y.; Wang, X.; Hu, K.; Dong, M. A data mining approach to finding relationships between reservoir properties and oil production for CHOPS. Comput. Geosci. 2014, 73, 37–47. [Google Scholar] [CrossRef]
  40. Agrawal, R.; Srikant, R. Fast algorithms for mining association rules in large databases. In Proceedings of the 20th International Conference on Very Large Data Bases, San Francisco, CA, USA, 12–15 September 1994; pp. 487–499.
  41. Wei, B.; Pinto, H.; Wang, X. A symbolic tree model for oil and gas production prediction using time-series production data. In Proceedings of the 2016 IEEE International Conference on Data Science and Advanced Analytics (DSAA2016), Montreal, QC, Canada, 17–19 October 2016.
  42. Shneiderman, B. The eyes have it: A task by data type taxonomy for information visualizations. In Proceedings of the IEEE Symposium on Visual Languages, Boulder, CO, USA, 3–6 September 1996; pp. 336–343.
  43. Aigner, W. Visualization of Time-Oriented Data; Springer: Berlin/Heidelberg, Germany, 2011. [Google Scholar]
  44. Maylor, H. Beyond the Gantt chart: Project management moving on. Eur. Manag. J. 2001, 19, 92–100. [Google Scholar]
  45. A Web-based System Prototype in Testing. Available online: https://www.youtube.com/watch?v=y3m5YzqJxwA (accessed on 20 January 2017).
  46. Brunet, R. La carte-modèle et les chorèmes. Mappemonde 1986, 4, 4–6. [Google Scholar]
  47. Parisi, T. WebGL: Up and Running; O’Reilly Media, Inc.: Sebastopol, CA, USA, 2012. [Google Scholar]
  48. Harrie, L. Analytical estimation of map readability. ISPRS Int. J. Geo-Inf. 2015, 4, 418–446. [Google Scholar] [CrossRef]
  49. Li, S.; Dragicevic, S.; Castro, F.A.; Sester, M.; Winter, S.; Coltekin, A.; Pettit, C. Geospatial big data handling theory and methods: A review and research challenges. ISPRS J. Photogramm. Remote Sens. 2016, 115, 119–133. [Google Scholar] [CrossRef] [Green Version]
  50. Al-Bulushi, N. Development of artificial neural network models for predicting water saturation and fluid distribution. J. Pet. Sci. Eng. 2009, 68, 197–208. [Google Scholar] [CrossRef]
Figure 1. System Architecture of Oil and Gas Visual Exploration System.
Ijgi 06 00076 g001
Figure 2. Web-based user interface of OGVES.
Ijgi 06 00076 g002
Figure 3. Five types of data are stored in the OGVES database: WELL, STATUS, STATISTIC, PRODUCTION and OPERATION tables.
Ijgi 06 00076 g003
Figure 4. Classic visualizationg templates: (a) pie chart of operators for 1214 wells, nominal data; (b) bar chart of average steam injection volume for Cenoves Christina Lake, numeric data; (c) multi-line chart of production related data for a producer well, multiple numeric data; (d) well status for an injector well, nominal data.
Ijgi 06 00076 g004
Figure 5. Visualization based on VISM: (a) bubble map for global exploration; (b) completion map for group exploration; (c) pixel table for group exploration; (d) animation chart for unit exploration.
Ijgi 06 00076 g005
Figure 6. Visualization of data mining results: (a) categorical classification of pad; (b) quantile classification of production; (c) k-means clustering to SOR and oil production; (d) hierarchical visualization for symbolic tree production prediction using a symbol size of 3.
Ijgi 06 00076 g006
Figure 7. Spatiotemporal combination in OGVES.
Ijgi 06 00076 g007
Figure 8. Overview of Project Cenovus Christina Lake with a bubble map: (a) overview of wells’ spatial distribution; (b) overview of multiple variables of Pad B-03; (c) enlarged individual bubble pie charts presenting production-related values.
Ijgi 06 00076 g008
Figure 9. Using animation charts to compare multiple pads (Project Cenovus Christina Lake Pads B-04, B-03 and B-07) and multiple variables. (ad) The oil production volume (m3), steam injection volume (m3) and SOR value on October 2011, December 2011, September 2012 and June 2013, respectively.
Ijgi 06 00076 g009
Figure 10. Analysis of operation strategy using ARM.
Ijgi 06 00076 g010
Figure 11. Production data of a new well relative to existing adjacent wells.
Ijgi 06 00076 g011
Figure 12. Symbolic tree for shale gas production using symbol size of 3.
Ijgi 06 00076 g012
Table 1. Summary of visualization methods in OGVES.
VISUALIZATION METHODSSPATIAL SCALETEMPORAL PRIMITIVEDATA TYPEDATA SOURCE
UnitGroupGlobalInstantIntervalSpanNumericNominalRaw DataAnalytic Results
Bubble Map
Completion Map
Pixel Table
Animation Chart
Production Data Mining Visualization
Note: Classic templates are not included, because they are a set of visualization methods.
Table 2. Four tasks in the user study and users’ responses to summarized questions.
Task DescriptionGeneral QuestionsAverage Rating
T1. Freely browse the whole oil and gas dataDoes OGVES provide sufficient data management functions?4.4
T2. Try to visualize data of interest based on user preferencesDoes the Global-Group-Unit workflow represent VISM?4.9
T3. Compare visualization methods designed on VISM with classic techniquesIs OGVES helpful in exploring oil and gas data in different levels?4.6
T4. Use data analytic functions to discover hidden production featuresIs OGVES helpful in discovering relationships among production-related data?4.6
Does OGVES help you find previously unknown or vague knowledge?4.7
Table 3. Features and functional comparison between OGVES, GeoCarta and iGlass.
OGVESGeoCartaiGlass
ArchitectureWeb-BasedDesktop-BasedWeb-Based
DeploymentOpen-SourceThird-Party Commercial PlatformThird-Party Commercial Platform
Cartography-
Data Management
Data VisualizationClassical
Bubble Map--
Pixel Tables--
Animation Chart--
Hierarchical Interface--
Data AnalysisStatistical
Classification
Clustering--
Association Rule Mining--
Prediction--
● Supported; - Unsupported.

