1. Introduction
Under the generic term of crowdsourcing, data collected from the public as volunteered geographical information (VGI) is becoming an increasingly important topic in many scientific disciplines. Social media and big data platforms often supply geolocated information gathered from the web using dedicated APIs (e.g., Twitter data). Other more participative data collection techniques identified as citizen science such as bespoke web services and the use of mobile apps allow citizens to contribute to environmental observations (e.g.,
www.ispotnature.org,
www.brc.ac.uk/irecord) and report events that can be used in scientific research and policy making [
1,
2,
3].
From providing timely information and cheap and densified observations, VGI brings opportunities for better understanding and monitoring of various societal and natural phenomena. This added value comes after merging, integrating, and combining the VGI data into a single view, while possibly reusing other data sources. In this paper, we term this latter process data conflation or data fusion (DCDF), with the idea of representing a range of methods according to the heterogeneity of the datasets used and the intended result. A considerable body of literature has discussed data quality issues associated with VGI data, along with their spatial and a-spatial characteristics [
4,
5]. Specificities of quality assurance (QA) when collecting crowdsourced or citizen science data [
6,
7,
8,
9,
10] are contributing to better designs on how to qualify data as a single observation or as part of a dataset. Quality assurance (QA) is defined as a set of data policy, controls and tests put in place in order to be able to meet specific requirements. In our context, quality controls (QC) are (geo)computational operations that output quality values according to specified measures and standards. What all the different approaches agree on is the multidimensional aspect of quality, essential in crowdsourcing and citizen science. Intrinsically this causes a tendency for the QA and DCDF processes to be entangled, as the ISO19157 usability criterion drives the data curation process (DCP). Usability is defined in the ISO19157 standard as the degree of adherence of a dataset to a specific set of requirements, involving the other quality elements or not, and is derived from an overall quality assessment. Data curation (DCP) is defined as the collection of organised settings and actions within a system that are in place along the data life cycle from its capture to its storage and management, including during its usage. Based on two well defined purposes taken from the literature with a few methodological approaches (see
Section 1.1 and
Section 1.2), the paper explores what this entanglement is and, whether or not remedies to it can be proposed if we can identify why and where these two processes may become entangled. We frame our discussion using the framework elaborated in the COBWEB (Citizens Observatory WEB) project and the experience gained from that [
11]. The European FP7 COBWEB project (
www.cobwebproject.eu) proposed a survey design tool including an authoring tool to combine different quality controls (QC) within a workflow that will serve as a QA for each particular case study [
9,
10,
11,
12]; the data collected and then qualified through the QA workflow is finally made available for a DCDF within a completed data curation process [
12,
13,
14,
15].
QA and DCDF are two fundamental processes, which form part of the DCP that can be performed by a human or a computer or a combination of the two through a series of steps, so each of them can be a represented by a workflow. Within the COBWEB framework these workflows are represented using the Business Process Modelling Notation (BPMN) standard and are composed of automated processes [
9,
11,
15,
16]. QA is devoted to ensuring data quality and produces metadata information either at the single record or full dataset level. For example, a QA can provide a classification correctness (ISO1957) value (e.g., percentage of agreement) for a land cover type given by a volunteer after looking at a picture of the area or a value for the absolute accuracy (ISO1957) (e.g., 68% circular error) for an inundation extent derived from the data capture of a flood limit from a citizen using a specific mobile app. The DCDF is devoted to the use the VGI data to derive a secondary data product. For the two studied examples this corresponds to determining a land cover map from historical data and changes observed by volunteers or the probability of a location being flooded at a chosen time using citizen’s evidence and the satellite imagery available, both around this chosen time. The QA and DCDF entanglement takes its source from the stakeholder conceptual approach to the study to be put in place, which is influenced by several semantic overlaps concerning quality, validity, goals of the study, etc. that we explore in the paper. In practice, even though generic QCs provide the logic and reasoning of attaching a quality that clarifies the uncertainty on data captured, the workflow composition of the QA is mainly driven by the future use of the data. It is also possible for the quality elements to be assessed within the DCDF algorithm itself, either included in the QA (the conflated data is a by-product) or completely separated (the data quality is a by-product). This is reminiscent of a statistical modelling approach in which, after or during the model fitting, the error distribution is derived and attached to each observation.
Acknowledging and trying to identify the sources of this entanglement, this paper discusses the advantages or disadvantages that may arise when integrating or separating the QA and DCDF processes and proposes recommendations. Reminding us that potentially more robust DCDFs will make use of the quality information established for the VGI data used, it can be understood that entanglement (of the QA and DCDF processes) may become problematic (it is not the purpose of this paper to describe these consequences). Two examples, described below, of VGI data collection and usage serve as the basis of exploring these possible entanglements. The interest is not in the results of the examples or to identify if one method is better but rather on the designs and approaches used and how these translate into the potential entanglement.
1.1. Land Cover Validation Example
This example is taken from a recent study of VGI for land cover validation [
17,
18,
19,
20] in which, using the Geo-Wiki platform [
21], volunteers were performing multiple ratings of satellite images as land cover classes. For this study on data quality [
19], the 65 volunteers labelled 269 sites from a series of images and, when attributing a land cover type, volunteers also declared how confident they were (input using a slider with a label, e.g., ‘sure’). The derivation of the land cover class-specific accuracies per volunteer (producer’s accuracies) and of the land-cover classes estimation from posterior probabilities were possible using a Latent Class Analysis (LCA) model estimation (see [
22] for a recent review on using LCA to assess the accuracies of new ‘diagnostic tests’ without a gold standard in the context of medical applications).
1.2. Flood Inundation Extent Estimation Example
This example concerns three different approaches for estimating flood inundation extent using VGI data. Two methods used crowdsourcing from social media, Twitter [
23] and Flickr [
24,
25]; the third used a citizen science approach for volunteered reporting of flood inundation via a mobile phone application originating from a case study from the COBWEB project. For the social media Twitter example, geo-tagged tweets were analysed to extract information of potential inundation and to look for inundated areas, e.g., ‘London road flooded!’, possibly combined with the geolocation of the tweets. Then, a flood model (shock-capturing hydrodynamic simulations, abbreviated to hydroDyn in
Section 4 using a terrain model (DEM) of the area was run to estimate an inundation extent. In the social media Flickr example [
25], a cumulative viewshed of the photo locations were used as evidence for flood extent alongside evidence from Earth Observation (EO) data, Modified Normalised Difference Water Index (MNDWI), and topography (slope and elevation) to give a posterior probability flood map.
For the COBWEB citizen science approach, a mobile app was designed to allow the capture of a geo-located estimation of a partial flood/inundation limit line (swipe-line) using the citizen’s drawing on the photo taken and the line of sight (LoS) base-point position derived from the DEM and the citizen’s mobile phone orientations [
16,
26]. This partial inundation limit (with its accuracy derived from LoS accuracy) was used within a pouring-rolling-ponding algorithm [
26,
27] until the water level reached that swipe-line, therefore giving an estimation of the inundation extent from that single observation with uncertainty from error propagation (using DEM and partial limit uncertainties). The QA workflow undertaken after each data capture is given in
Section 4, where after each QC (a ‘task’ in the workflow), metadata concerning quality were created or updated [
10,
13].
2. Semantic Discourse
Entanglement is apparent in language when commonly talking about quality and validity. The word ‘quality’ itself often refers to a level of quality, namely good quality or bad quality in relation to what the item is used for or how useful it I; ‘these tyres are of good quality as they will make 40,000 km’ or ‘these tyres are of good quality as they reduce the braking distance by 20%’. A QA is then designed to test those very features and set values to the quality indicators, which are, here, completely linked to the performance in the future usage. Note also that making 40,000 km may not be entirely compatible with reducing the braking distance by 20%, so good quality can be a relative concept. For the spatial data quality standard ISO19157, the usability criterion helps to define and quantify the level of quality based on specific requirements declared to meet a certain degree. Nonetheless, those requirements may appear within separate usability reports and not using all quality elements per se. Therefore, the DCDF, considered he future usage of the data, appears to be the determinant in the evaluation of specific quality elements, but not all are involved in usability quality reports.
Looking at spatial data such as Open Street Map data (OSM) (
www.openstreetmap.org) for a given area, one could declare OSM of good quality if, when using the map, a person did not get lost, say, between his/her house and another location, e.g., to a dentist appointment. So the quality would be evaluated without consideration of (i) the completeness of OSM for the road network that is not directly used during routing (considered as a DCDF of a crow-fly line and the road network) or of (ii) its absolute spatial accuracy (see the ISO19157) and ‘did not get lost’ being considered the quality or validity when using the DCDF. Only a relative accuracy (see the ISO19157) and a topological consistency (see the ISO19157) would be required in order ‘not to get lost’, and completeness is enough to find a path (though not necessarily the shortest).
2.1. Data Quality of the End-Result
The QA should be concentrating on evaluating qualities of the measurements attached to that tyre. A conclusion such as ‘this is a good tyre’ comes from estimating the value of a specific attribute after testing, e.g., how tender the rubber is. The value recorded can mean good or bad for braking or mileage. Note here the discourse is in danger of slipping away, as there is a mix between (a) the value of the attribute itself, which may mean good quality or bad quality intuitively; (b) the accuracy of that value, which is needed to be able to test the tenderness itself; and (c) the value of that statistical testing. The data, a feature or a characteristic of the feature may imply a conformance or a usability met (or not), but only by knowing the accuracy attached is it possible to decide if the quality requirement is met (or not).
The purpose of the QA is mainly this a posteriori evaluation of the accuracy of the data. It is the controlling aspect of the quality assurance (workflow of QCs). Concerning QA, the common language and the practice in manufacturing, both refer to an a priori set of procedures assuring a level of quality and an a posteriori set of controls and tests, assuring that the target values have been met within an acceptable level of variability, i.e., of uncertainty. Those target values define the validity with a confidence level defined, for example, by a marginal level of uncertainty. Good or bad quality should come only in the usability criterion as a degree of conformance to a set of requirements and depends on both a priori and a posteriori types of quality assurance settings.
Thus when considering the fitness for the purpose of conditioning the QA, one would need to put this in plural amongst a range of plausible purposes. Nevertheless, the discourse can also be: ‘I need this quality element to be evaluated to know the quality of the end-result’, i.e., the routing DCDF to the dentist appointment, requiring travel time, for which at least the distance and its accuracy would also be needed. This is where one can get a feel of the benefit of a disentanglement, which is where the good or bad input quality becomes linked to a specific purpose from error propagation estimation. More precisely, the data quality, the ‘error of measurement’, and the ‘uncertainty about the data’ impacts on this usability assessment (uncertainty analysis). Here the error propagation helps to point out a distinction between the intrinsic concepts within quality, accuracy, precision, and uncertainty.
Uncertainty analysis and sensitivity analysis will help to decide if the quality of VGI data is an important factor in the confidence of the DCDF end-result and therefore if it is important to be concerned about any entanglement at all. This therefore supposes that either a separate QA is able to estimate the data quality of the VGI data beforehand, or a rough estimate of this quality enables a test of the sensitivity. Then, uncertainty analysis, focusing on estimating the output uncertainty knowing the input uncertainty and sensitivity analysis, focusing on estimating the part of the output uncertainty due to a specific input uncertainty, can take place (see also
Section 3.2). Both, sensitivity analysis and uncertainty analysis can be viewed as paradigms of error propagation.
2.2. What Is Good and Bad Quality in Crowdsourcing for Environmental Spatial Data?
‘Good and bad tyres exist’. For spatial data, either for the land cover data or the flood inundation extent examples, each single VGI data observation is to be compared to a potential (current or historical) ground truth, which has its own uncertainty. Thus, the (in)accuracy may be due to a bad measurement and/or to an imprecise measurement. The classification made by a volunteer for each land cover was attached with a self-assessment of the ‘precision’ of the attribution. In the case of the flood inundation app, the citizen may aim a bit too far over the edge of the water line or move the device when taking the picture, e.g., shaking because of a cold wind. These represent types of inaccuracies that can be encoded using the thematic accuracy or relative position accuracy elements of the ISO19157 standard, but ambiguous definitions may incline the stakeholder to pool all into one quality when using the direct definition such as: “how close this is to what is accepted or known to be true”.
Section 4 discusses this aspect further.
Note that when using a DEM, the accuracy of position for a particular elevation collapses with the accuracy of that elevation. However, in practice only the vertical accuracy for a given resolution is used. This can have an impact on both the DCDF and on the QA for the inundation extent, but this is not of direct concern here.
For the land cover type classification, the potential confusion from the volunteer in understanding the different written descriptions of the land cover types refers to another type of uncertainty, namely the data quality due to the volunteer (the citizen sensor). ‘Trust’ often encapsulates the data quality from a volunteer; for the land cover validation example the self-assessment, e.g., “sure”, is part of a trust assessment. In the COBWEB QA, three different type of qualities are looked for: (i) the producer quality model (ISO1957 quality); (ii) the consumer quality model (
http://www.opengeospatial.org/projects/groups/gufswg), i.e., feedback qualities [
28]; and (iii) the stakeholder quality model (
Table 1).
These latter elements can be understood as qualifiers of a citizen as a sensor in ‘functioning’ and will impact on observations captured by this citizen now and later. They will also impact on other quality evaluations, i.e., a dependence sometimes precluding evaluations [
6]. Within the COBWEB QA system, a citizen volunteer can be registered (anonymously), and its quality values can be updated from her/his survey participations with the different QA workflows used.
Potentially, a trusted expert will be attributed with a lower uncertainty, say, in declaring the presence of a plant species in an unexpected area. However, if its reliability is low, this will increase the uncertainty. When raising concerns within a given QC about an observation getting low quality values for a range of quality elements, the CSQ values will be updated in consequence and similarly when a QC reveals greater confidence in the captured observation.
It is also common sense that a large (‘bad’) position uncertainty of the point where a volunteer is standing may not be a problem when assessing a land cover type during a field survey session for a citizen science study (different from the example in
Section 1.1) if the area was retrospectively considered homogeneous (e.g., after an image segmentation). For the flood app inundation extent, the vagueness of the annotation associated with the picture of the water line may be less important than the line itself. In contrast, if the same citizen is capturing land cover classes, his/her past vagueness values may make this data more uncertain. Thus there may be also entanglement due to the dependencies in the quality dimensions according to the data captured.
2.3. Trustworthiness and Data Quality
There is agreement in the literature that VGI data quality usually lacks a defined quality and this limits the use of citizen science data [
2,
4,
5,
8,
29,
30]. Hence, there is often an attempt to bypass data quality from trustworthiness. This is as if the trust encapsulates the entire potentiality of quality. As experts are trusted, the trusted volunteer may change status and become an ‘expert’, making the stakeholder have a new view on the VGI data, as all now coming from experts. This is notwithstanding findings that even when trust is important, experts also make mistakes [
20]. In citizen science projects, peer participants and trusted participants often help in identifying and validating the observations provided by new volunteers [
31,
32]. This peer verification enables some control and constitutes a form of QA by crowdsourcing [
8] the data and indirectly the volunteer who captured the data. Peer verification and expert verification, as potential mechanisms to generate or increase trust, are not without issues [
20,
33]. When the volume of data to be verified becomes too large, peer verification or expert verification is likely to introduce human errors. A parallel can be made with Wikipedia, which allows successive editing of an article with the objective of ensuring convergence to a common shared vision. In this latter mechanism, the ‘data’ itself is subject to improvement and the information about quality is somehow left in the series of multiple edits [
33,
34]. For citizen science, most of the time the data will not be as modifiable as in Wikipedia, it will have a quality identifiable from the used QA, and then, depending on the levels of quality and reliability attributed, the data will be re-used or not and validated or not. Even so multiple citizen science observations about the same realm (geolocated and time stamped) can allow a similar process as Wikipedia’s successive editing, by then increasing the trustworthiness of the data this time (OSM data follow this principle [
29]). Along this specific data curation process there is, therefore, an implicit quality assurance process [
10,
35]. Note that the consumer quality model, based on feedback (intentional or not), can contribute to establishing or modifying the trust in the data and therefore the trustworthiness of the volunteers who contributed to the data.
Trust and trustworthiness are therefore qualities highly correlated to the other data quality elements. When an expert or a volunteer is trusted, so is the data captured by this trustee person, and reversely the trust accumulated on data, crowdsourced quality, or from other evidences, feeds back to the trust in the volunteers who contributed [
6,
30,
36,
37].
2.4. Evidence, Provenance and Confidence
These three terms echo the decision-making process and the necessary elements that are looked for to perform it [
6,
28,
38]. Providing evidence can be compared to a DCDF as contextualising different sources of information into compelling, intelligible, unified new information. Implicitly the evidence conveys an improved quality as the process of gathering this evidence contains the idea of validating the information during the conflation (DCDF). Another DCDF may be involved in fact when ‘confronting multiple evidence’, which implies a knowledge of the quality of each evidence linked to their provenances or a targeted quality that increases the confidence. From this viewpoint, the DCDF would need the QA to have been operated, and, vice versa, a DCDF may be needed within the QA process itself. Confronting different pieces of information however, may appear distinct from the decision-making process and so from a DCDF too.
These different situations correspond to the general approach chosen in COBWEB [
19,
24,
25,
27], with a QA workflow composition from a repository of QCs belonging to the seven pillars of quality controls (see
Table 2). Each observation captured is successively confronted with other pieces of information in order to explore and improve the various dimensions of data quality. The QA workflow can be considered a metaquality of information, constituting a provenance for the metadata on data quality of the VGI data. Even though chaining of the QCs can be different from the ordering in
Table 2 (and more complex workflows can be used), it conveys the idea of refining the quality elements and therefore increasing the confidence throughout the workflow, e.g., the QA workflow in
Section 4 for the citizen science’s flood inundation extent case study.
For example, in Pillar 3, ‘Automatic Validation’, an attribute value can be compared to a ‘range of values’ given by an expert, and then, in Pillar 4, ‘Authoritative Data Comparison’, can be matched to a previously observed distribution. Moreover, the rejection or acceptation of the measurement as valid (assigning an accuracy), performed in the last QC, will take into account the previous assessment.
The stakeholder authoring the QA will decide whether to chain these specific QCs from Pillar 3 to Pillar 4, or vice versa, as well as any other available QC from all pillars. As part of the whole data curation process, the chosen QA workflow designed can be traced back to the series of QCs within these pillars.
The process of providing and selecting the evidence is strongly linked to the quality assessment but also illustrates the entanglement with a DCDF, as this QA is designed as supporting the evidence (for the DCDF). This data curation step is only a weak entanglement, as the pieces of evidence are kept apart (no fusion is yet taking place). Therefore, registering the whole provenance of the data obtained after the DCDF, entailing the list of data evidence and their data quality, encompasses the QA workflow process as well. Within this data curation process, the VGI data are part of the evidence, e.g., different citizen sciences surveys in the same area.
As discussed in the previous section, the
a priori QA and therefore the ‘design of experiment’ is also part of the provenance. Both
a priori QA and
a posteriori QA comprehend the provenance and, as such, would be recorded in the metaquality (ISO 19157). The QA workflow will produce values for the quality elements from all three quality models (see
Section 2.2) but relates itself to a metaquality from a producer viewpoint.
Obviously reusing the crowdsourced data for a DCDF or reusing the data produced by this DCDF will carry the provenance and confidence in the new evidence, the conflated evidence by then perpetuating the metadata chain and therefore entangling the quality information retrospectively, i.e., propagating any previous entanglement into the new usage. This is important as we suppose that any DCDF will make use of the established quality of the data to perform its algorithm (‘best estimation’). The traceability of quality using the provenance encoded using the QA workflow and the DCDF workflow may become quite complex with multiple entanglements, while still providing the necessary information.
3. Data Curation Process
However entangled the QA and DCDF processes are, they take place as part of the data curation process (DCP). The data lifecycle can be very different depending on the crowdsourcing study and the potential reuse of the data in the short and longer term. Therefore, enabling easy data and metadata access at various stages is important. At this point some questions arise concerning the status of a single data point captured by a citizen and a collection of citizen captured data as part of the same or a similar survey, i.e., a dataset. As an example of Quality Assurance used in biological monitoring, the National Biological Network (NBN) in the UK (
www.nbn.org.uk) has in place the ‘NBN Record Cleaner’ (
http://www.nbn.org.uk/Tools-Resources/Recording-Resources/NBN-Record-Cleaner.aspx). This corresponds to some aspects in cleaning (Pillar 2 in
Table 2) and conformance (Pillar 7 in
Table 2). Several of these ‘controls’ may be better seen as part of the data capture tool, e.g., a mobile app, such as for the date format. These types of QCs are often relatively independent of the future usage of the data, as either their aim is ‘correcting’ mistakes or using standards of encoding (including ontology of the domain and species thesaurus, for example).
3.1. Design of Experiment
Crowdsourcing surveys are performed for specific objectives; therefore, the information to be collected is often designed with those objectives in mind. A protocol of an experiment would contribute to identify sources of variability and quality with several constraints and requirements. This leads to a QA needing to be implemented either: (1) at the data capture level
, e.g., within the mobile app; (2) as a QA
a priori, controlling within a preventative manner; or (3) within a QA
a posteriori, thus controlling and assessing under a correcting and comparing manner. For social media crowdsourcing, part of the experimental design appearing as an
a priori QA is the crawling and mining required to extract the data according to chosen relevance criteria, e.g., keyword matching and bounding box queries. This is the case for the flood inundation examples using Twitter [
23] and Flickr [
25]. Depending on the completeness of the semantic matching put in place, this a priori QA may be inseparable conceptually from a DCDF. Note that here the lack of control of the design of the experiment is compensated by the intrusion of this DCDF and by the greater number of observations expected than in a citizen science study (see also
Section 4.1), i.e., expecting to get a better quality level from say ‘averaging’ over a large sample.
For citizen science studies, a driver for quality of the data will also be reflected in the simplicity or complexity of the study design and the design of the interface used [
3,
39]. A human factor is to be considered here and will also be captured using the quality elements in
Table 1. A pilot study designed to capture these elements would help to minimise them in the real study, i.e., to improve the quality from the a priori QA.
A third type of QA occurs in between the
a priori and
a posteriori stages: the
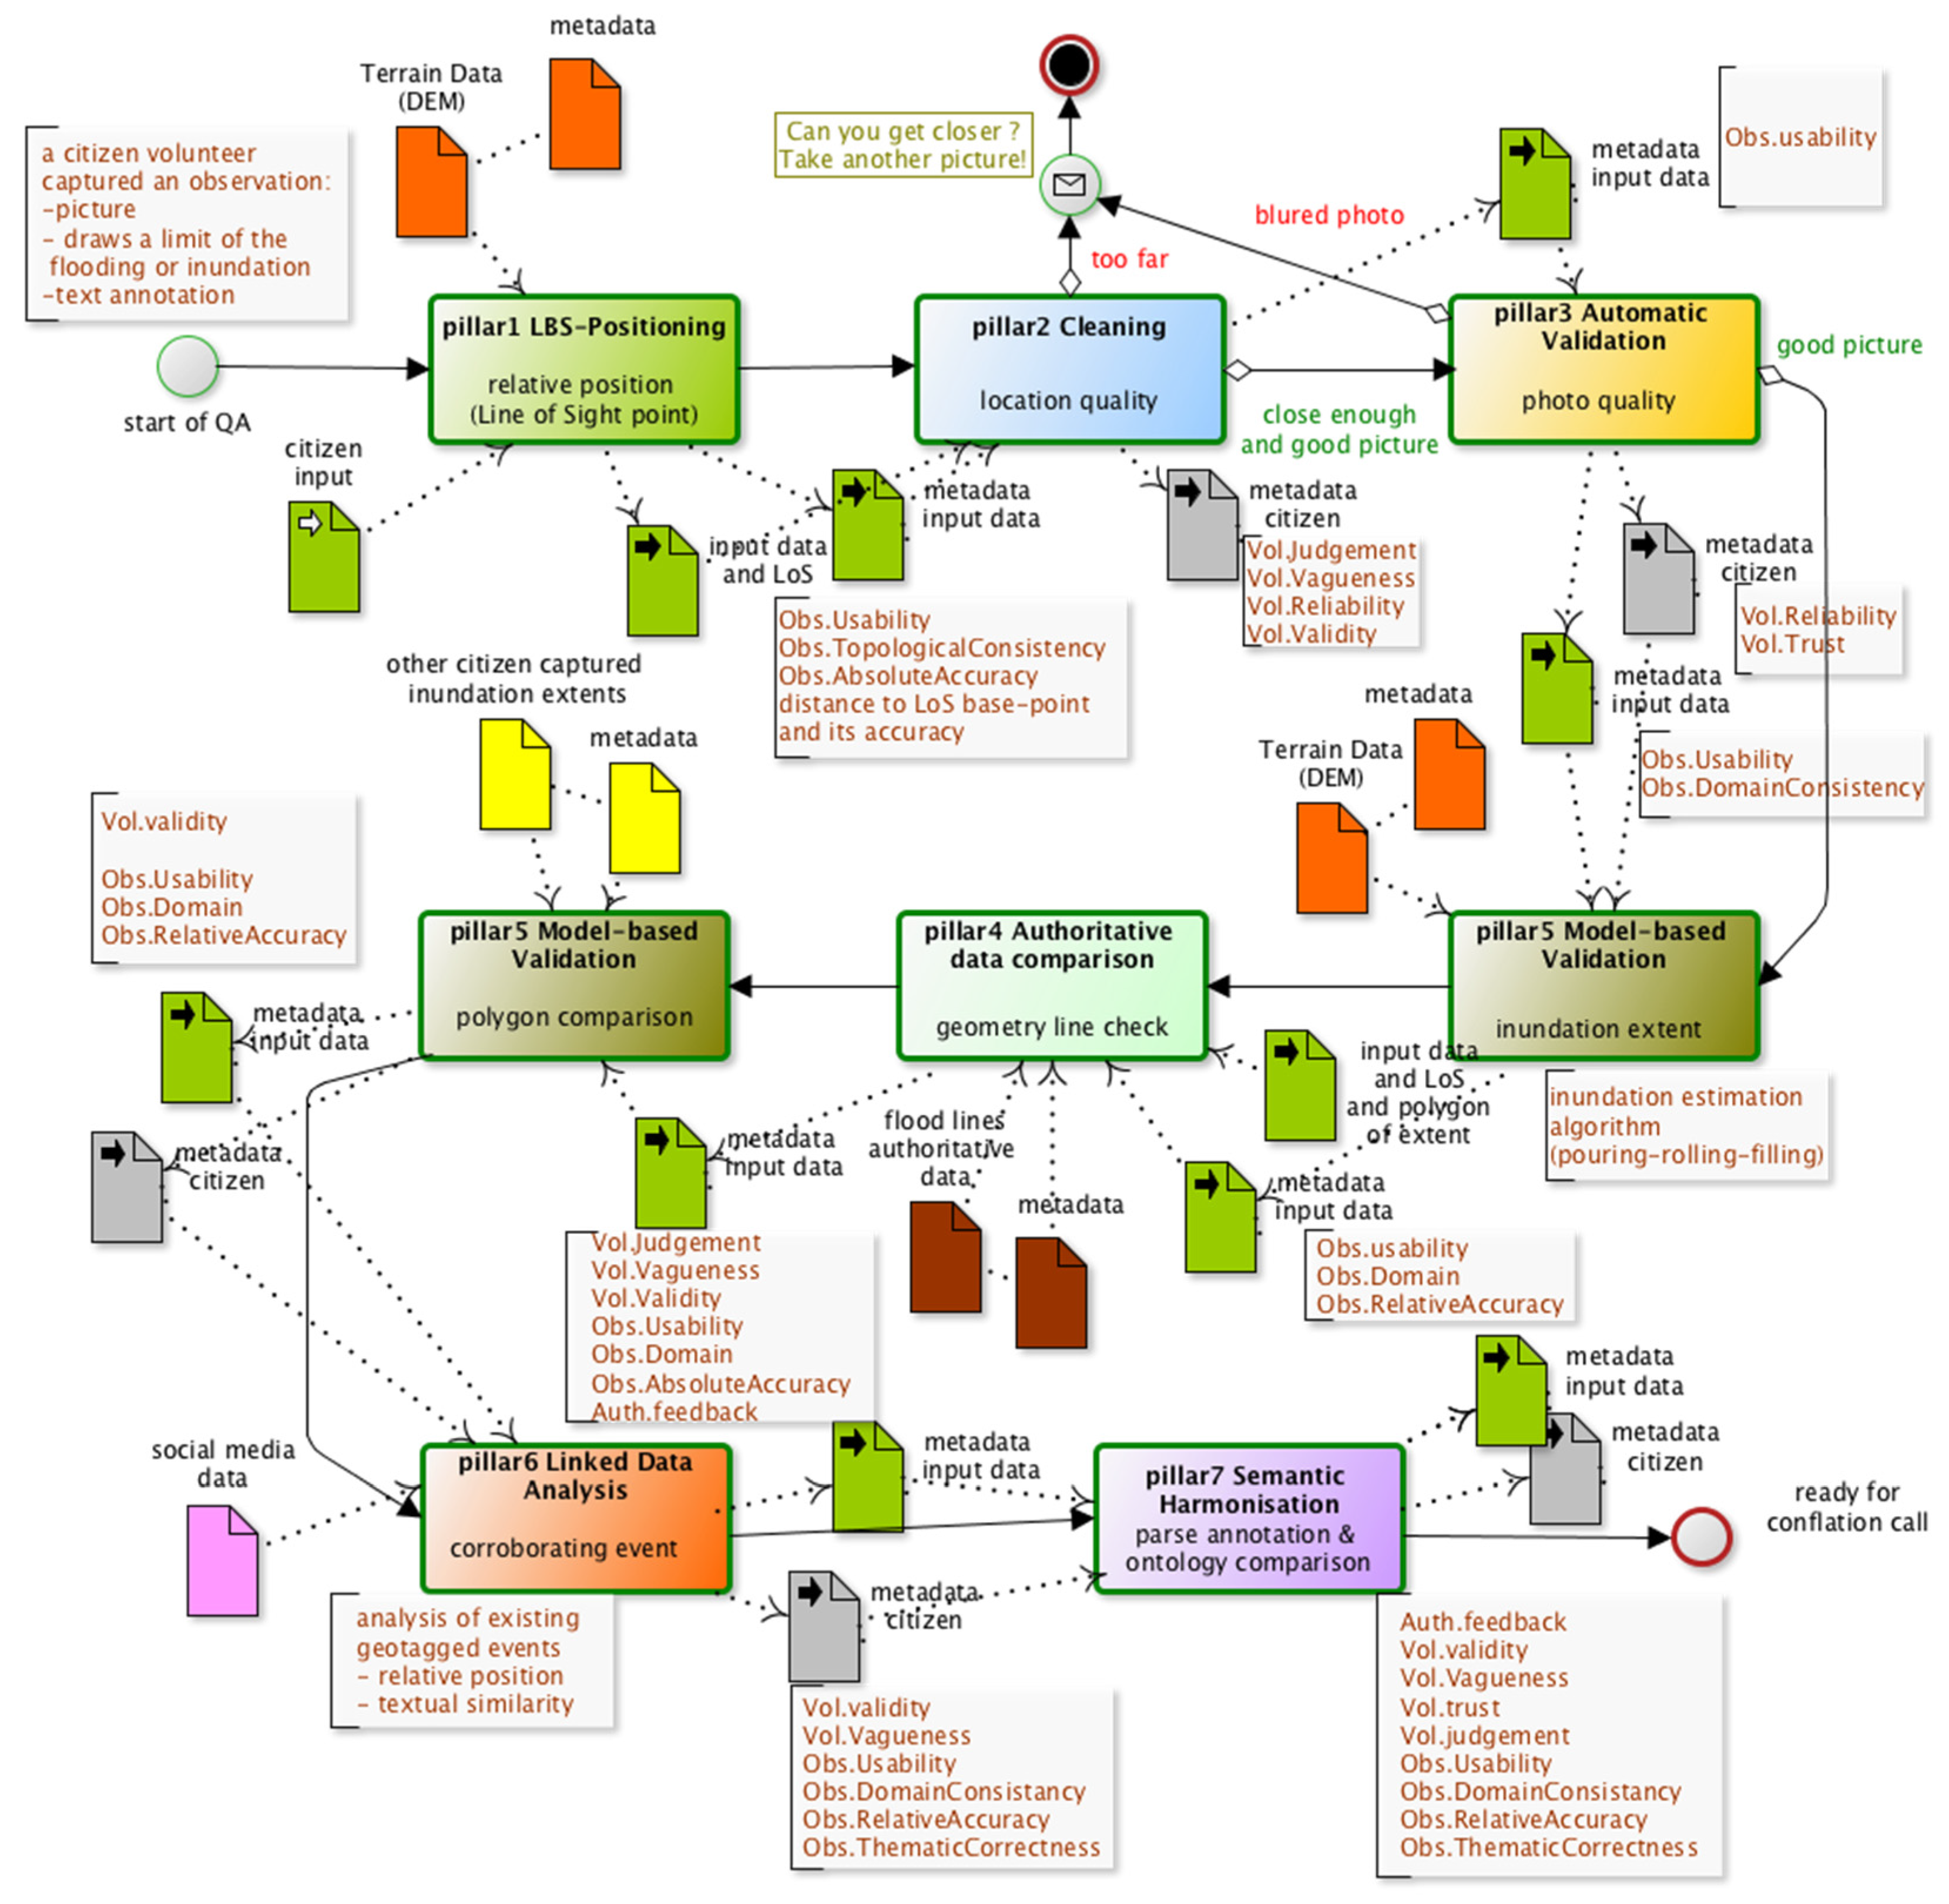
hic et nunc or interactive QA [
40,
41]. Two simple QCs providing interactivity are illustrated in Figure 3 for citizen science. One QC analyses either the distance to the nearest river or detects a large enough patch of water on the captured photo (Pillar 2 ‘cleaning’ for location quality) and asks the volunteer to get closer if required (if safe to do so). A second QC then tests the level of contrast in the image (Pillar 3 ‘automatic validation’ for photo quality) and may ask the citizen to take another picture. Some of these
hic and nunc QC may also need to be run exclusively on a server due either to the computational resources needed or to access timely information from other sources (precluding its use in poor connectivity areas) [
40].
As the defined objectives within a design of experiment may imply a range of DCDF already planned, the various QA can also be entangled with them, as described in
Section 2. With the land cover classification example, the LCA can be performed within an
a posteriori QA once the study is finished, e.g., using a sample size stopping rule. It can also be performed just
a posteriori, each time the current volunteer has finished the survey but using an existing sample of super-raters for comparison, e.g., using the top ten raters ranked according to their achieved averaged accuracy (i.e., their producer’s accuracy, see Section 4.1, [
18]) obtained for the same study.
3.2. Storage, Usage, Re-Usage
Data access at various stages of the DCP along with the evolution of the metadata, including spatial data quality, would be desirable. As mentioned in
Section 2, this is of importance when reusing data with its quality determinants under different contexts. Being aware of the quality elements and associated metaquality that have already been derived means they then be re-evaluated or utilised under the new context. A provenance management may be facilitating this flexibility from which the potential entanglement of QA and DCDF can be identified. For citizen science, it would be beneficial to be able to assess and have access to the quality elements listed in
Table 1, which are evaluated at the record level for each individual. These elements may be conditioning a QA for newly captured data or used when conflating with the citizen data (e.g., in Pillar 5 or Pillar 6) but also provide confidence in the derived data from the DCDF.
In a similar modus operandi, DCDF and error propagation make use of a range of spatial data quality elements, but DCDF is mostly interested in providing an end-result, an estimate, whereas error propagation focuses on the achieved accuracy of this estimated end-result. Both make use of the initial quality evaluation provided by a QA process. Therefore, if the DCP is disentangled, a Bayesian metaphor could be used to establish prior quality variations from an initial QA of the VGI data that is then used in a DCDF to provide a series of conditional end-result datasets with the associated error propagated. Then, two possible follow-up DCPs can be performed: (1) under an ergodicity assumption (the spatial variation provides an estimate of the point-wise variation), wherein the best matched a posteriori uncertainty would lead to updating the initial quality for the VGI data for an updated DCP; and (2) selecting spatially the VGI data with lowest uncertainty of the outcome (but introducing potential bias), i.e., giving a quasi-null usability for the unselected records, and then a re-iteration of the DCP. These two situations represent a controlled re-entanglement of QA and DCDF, which hopefully would converge.
The first iteration represents a sensitivity analysis (see initial discussion in
Section 2.1), i.e., looking at the propagated uncertainty for a range of input quality levels. For example, in the Flickr inundation extent scenario, some results on a multiway sensitivity analysis seem to suggest that position accuracy alone can be an important factor in decision-making [
23]. Therefore, a proper initial QA can be paramount to whatever single DCDF is to be performed or whatever iterative DCP process takes place (see
Section 4).
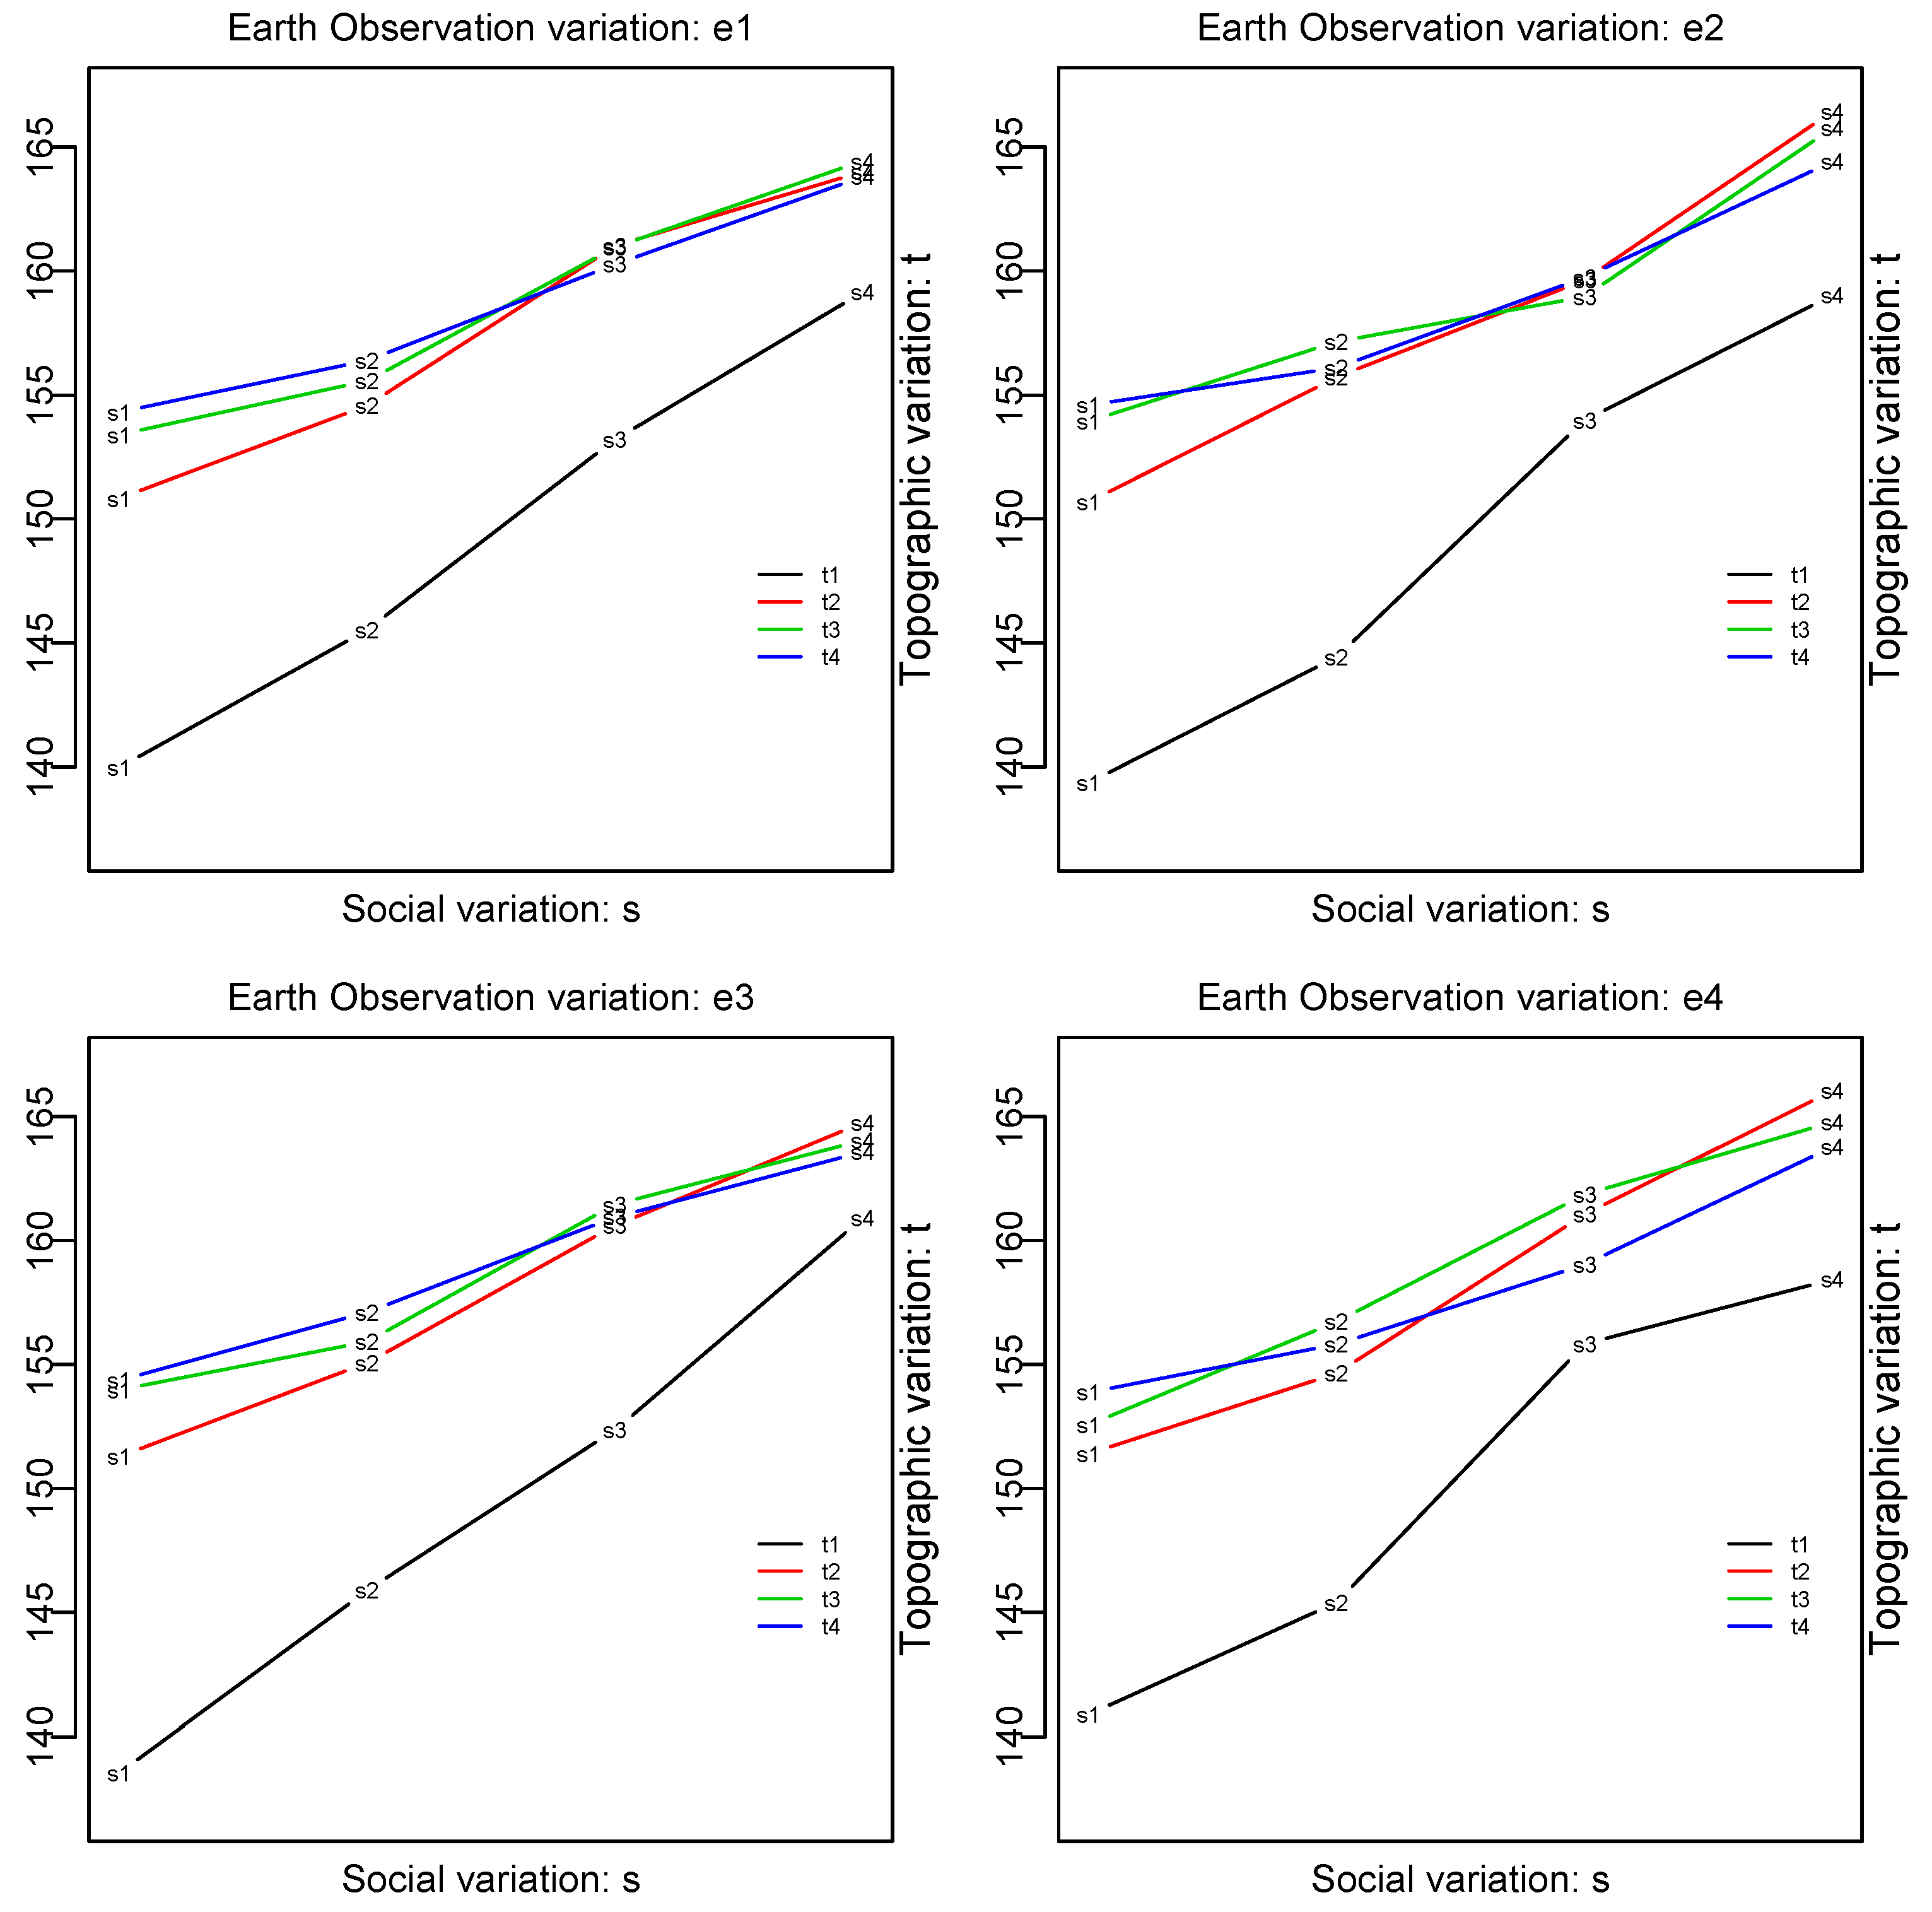
Figure 1 highlights the output variations obtained for each combination of uncertainty levels set up for the multiway sensitivity analysis [
23] of the Flickr inundation extent workflow DCDF [
31]. A Monte Carlo uncertainty was run for each combination of input uncertainty. Namely, for each of the three dimensions of earth observation (MNDWI), topological characteristics (slope and elevation), and social data (Flickr position), four levels of uncertainty were chosen; level 1 was
0.5 × sd, level 2 was
1 × sd, level 3 was
2 × sd, and level 4 was
3 × sd, where
sd is an initial estimate of the standard deviation for the current variable of interest.
From a visual examination, earth observation uncertainty (
e) shows very similar patterns across its four chosen levels. The topological factor (
t) appears to separate
t1 from the others (main effect) with also a slight interaction with social variation (steepest variation for
t1), and social variation (
s) shows gradient effect. This illustrative example demonstrates the role of social variation (Flickr position accuracy) in the end-result uncertainty assessment of the DCDF of flooding inundation extent estimation. The multiway multidimensional analysis of the spatial variations in the sensitivity results showed that the cumulative viewshed has a high uncertainty only at the edges of the view threshold but mostly for high position uncertainty [
24]. Retrospectively, this was greatly dependent on the local amount of Flickr data (metaquality) with an acceptable position accuracy (
1 × sd).
Considering a DCDF with an uncertainty assessment of the results to be a good practice, the better we can perform the QA to estimate the input uncertainty, the more confidence we can put into the output uncertainty. Therefore, either a disentangled situation or eventually a re-entanglement iterative process, as described above, is desirable.
4. Is a Disentanglement Possible?
In the previous sections, entanglement situations have been identified as taking source either from the underlined semantics when describing and designing a case study or when implementing a case study and focusing primarily on its goal and usage. Whilst QA principles and the usage of the data within a DCDF mean that these two curation steps operate in tandem, the multiple dimensions of quality and time of assessment (
a priori QA,
a posteriori QA, and
hic et nunc QA) offer flexibilities to the curator. He or she may choose to make the crowdsourced citizen science data of narrow usage, that is specifying its quality only for a narrow focus, or of larger focus when looking for a larger quality spectrum when describing the data (including its fitness for purpose). Under narrow focus, entanglement may be less problematic, reducing the QA to a few qualities with very specific requirements (usability on this narrow usage), though reducing the usability (see
Section 3.2 example). However, limiting the future usage of the VGI data in this narrow focus may bring us back to the initial statement of ‘lack of credibility for VGI data’, in the sense of a lack of metadata on data quality. Trying to qualify the data with a large spectrum of qualities may naturally dis-entangle QA and DCDF, as some quality assessments will occur without future usages at hand.
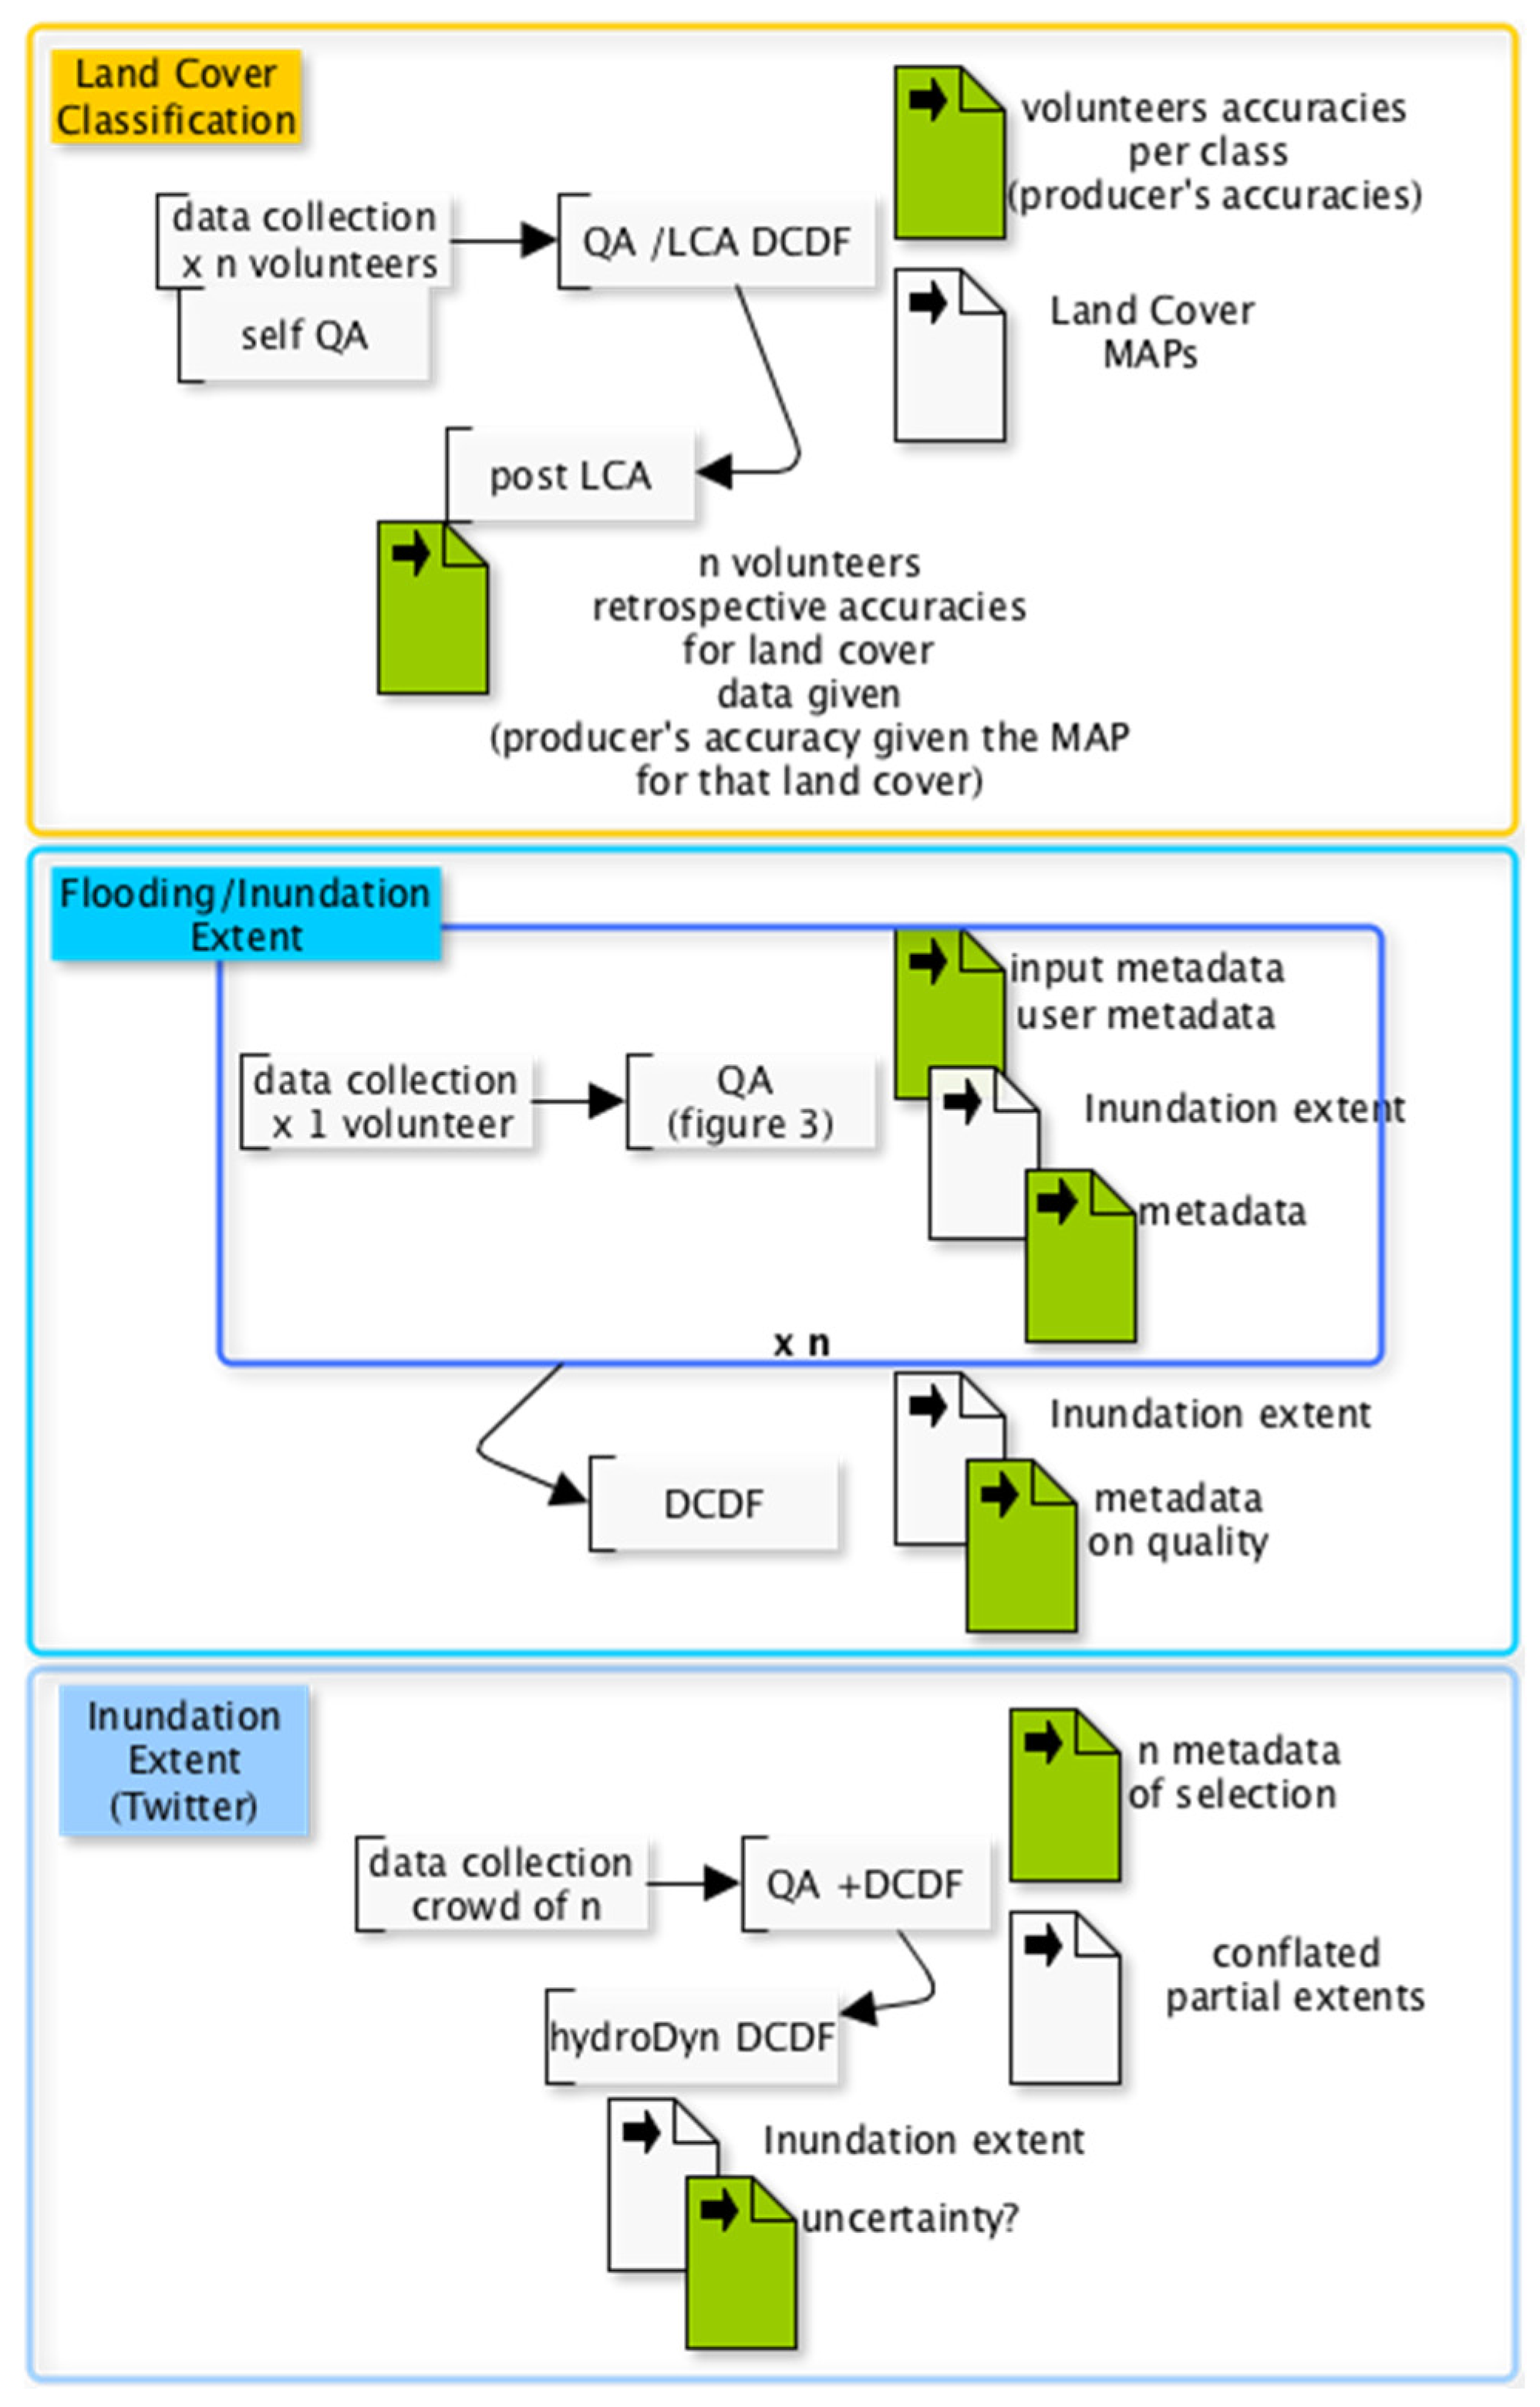
Coming back to the usage of the data and of its metadata on data quality, the two types of examples chosen (of relatively narrow focus) are driven apparently from different ends: (1) the land cover classification (
Section 1.1), using LCA as a means to generate the accuracies for each rater (a volunteer) but in the meantime estimating the land cover classes for each photo from its observed pattern of agreements and maximum
a posteriori (MAP) probabilities; and (2) the flood inundation extent (
Section 1.2), estimated after an uncertainty evaluation of the input takes place, leading to an uncertainty attached to the inundation extent using error propagation. Note that each single data captured (the land cover type given per each volunteer for a land cover) can be retrospectively given an uncertainty, and the accuracy for that volunteer is given the consensus obtained from the LCA model for that land cover (the MAP). The descriptions for these two types of example seem similar, but the data life cycles present different situations (see
Figure 2). The Twitter example does not explicitly refer to the propagated uncertainty, but a similar paradigm was achieved with the Flickr example.
In
Figure 2, for the land cover classification, the LCA model provides
a posteriori QA of the whole VGI survey collection and, following our categorisation in
Table 2, could be a QC belonging to Pillar 5 (“model-based validation”). Yet, the LCA approach appears to entangle QA and DCDF strongly, as both accuracies and consensus land cover classes are produced within the same algorithm. However, from the self-QA taking place, part of the QA can be disentangled, e.g., “selecting” data only with the label “sure”. As already discussed in
Section 3.1, another curation process (DCP) could potentially perform a QA for each single volunteer once his/her survey is finished, e.g., running the LCA with a selection of previous super-raters and him/her as the new rater. Nevertheless, it cannot be used to give an uncertainty of the new single observation (the attributed land class at that location) captured from this volunteer except if using a posterior uncertainty derived from a “previous reference study” (see the LCA derived accuracies [
18,
19]). This “previous reference study”, representing a pseudo-authoritative data (for a Pillar4 QC) or modelled reference data (for a Pillar5 QC), can be past observations of that current study, therefore using the (past) posterior probability for the class attributed by this new rater at that location. This reference study can also be a study judged similar to that of the current study, this time using a sort of modelled uncertainty of observing that class from a majority of the raters agreeing on it.
The inundation extent from the citizen science example presents a more typical DCP with a pre-established QA, as in
Figure 3. Uncertainty evaluation from direct QCs (Pillar 1, Pillar 2, and Pillar 4) are used, followed by a QC in Pillar 5 based on a physical process model. The latter can be seen as an internal single-observation DCDF using a DEM with its uncertainty to output as an inundation extent with an uncertainty. This elaborated single-observation (an inundation extent) is not a real DCDF as it is using only one single record and taking it to derive an uncertainty using error propagation from the position accuracy, which is attached to the estimated extent for this single observation. In the DCP, the “real” DCDF comes when “aggregating” the
n estimations of inundation extents once the QA of
Figure 3 is performed for each of the
n citizen’s captured data. This was done by ensemble estimation, intersecting
N times the
n volunteer flood inundation extents estimated (each time modulated from their own uncertainty) [
26]. For this DCP workflow, the QA and DCDF are well separated and so disentangled.
The Twitter example is more a DCP reducing to a DCDF, as the QA operated is mostly an
a priori QA, linked here to a wide selection of Tweets (Pillar 2). An
a posteriori QA refining this selection (Tweets with a potentially wrong GPS reading and semantic analysis that would fit in Pillar 7 and Pillar 2) could also be taking place. This would result in a “cleaning” driven QA, i.e., in or out of the dataset. Then the estimation of the inundation extent after the conflation of partial extents derived from the selected Tweets would be performed. Thus no real entanglement and a more traditional approach to selecting relevant data for the analysis is performed without a return to the qualification of the initial data. This study was focused on checking retrospectively the potential validity of the method of estimating the inundation extent from tweets and the hydrodynamic model [
23]. In
Figure 2, the QA existing for the Twitter data example is a second selection of tweets from testing wrong GPS readings and semantic analysis for the categorisation/elimination of some tweets [
23]. The data life cycle for the Flickr data example is similar to this latter in terms of the QA approach.
The Statistical Analysis Viewpoint
When performing a statistical analysis, the setting is more like a DCDF as we build estimates by fitting functions on the basis of a collection of information. An a priori QA takes place as part of the protocol to collect the data, but unlike a data cleaning step that does not retain the quality of a record but either accepts, corrects, or rejects it, there is no qualifying of each observation or record a posteriori. A hypothesis on the distribution(s) of the observations may belong to the QA environment, but the classical hypothesis of independent identically distributed (i.i.d.) is not of ‘interest’ in QA for crowdsourcing, assuming there exists ‘good’ and ‘bad’ quality data. The situation may be more like an error measurement model with unequal variances and outlier detection. However, outlier detection and change detection methods belonging to the statistical domain may be appropriate for a range of QCs in Pillar 4 and Pillar 5. These QCs would validate a single observation (and quantify the validation) as belonging to some authoritative data expectation without performing a DCDF per se, thereby creating no entanglement.
The generic methodology of meta-analysis in medical statistics [
42] is similar to a QA followed by a DCDF approach. The purpose of a meta-analysis is to combine the results from a range of studies on the same topic. Here, adding a quality based on the designs used, along with the confidence of a particular outcome estimated within each study, the meta-analysis computes a new bounded estimate of that outcome with better power (i.e., “sensitivity index” or producer’s accuracy).
In general, within a statistical DCP approach, the semantic discourse about the QA and DCDF entanglement can be illustrated statistically by the fact that when taking the measurement of the volunteers as estimating the ‘truth’, the mean squared error is:
where the equation stands both for
being the observation captured by one volunteer or the resulting conflation of
n volunteers;
E(.) is the expectation operator. Optimising or evaluating the accuracy takes both bias and precision into account, such that:
where (in)accuracy is the root mean squared error and precision is the standard error. The bias is something with which DCDF is most concerned, and the precision comes first when looking at quality, but both aspects are entangled in this equation. Crowdsourcing relies on a statistical property that would assure that Equations (1) or (2) are well balanced (when using a so-called sufficient statistic), according to the law of large numbers (as the sample size increases, the observed bias reduces and the precision is divided by
). This is an ideal situation when all sampling assumptions are met (
i.i.d.). In the VGI world, [
19] it is concluded that for the LCA model applied to volunteers as raters, increasing their sample size may not be the best solution in achieving high accuracy in estimating the land cover classes (DCDF aspect), as a few well selected volunteers according to their uncertainty (producer’s accuracy) could be better. This, raises a potential intrinsic entanglement issue due to the conditional independence assumption in the LCA model. This constraint, independence of the raters conditionally to the land cover classes, is not verified for example when «easy land cover type» are correctly labelled by all but «hard ones» being labeled correctly only by few. Note that in citizen science a smaller sample size will be expected than in crowdsourcing but usually with better quality (influence of the
a priori QA) and/or with a lot more information as measurements, i.e., collecting more variables that could help reduce the uncertainty.
5. Final Comments and Conclusions
Designers of scientific studies that make use of citizen volunteers to collect data face a difficult challenge; credibility comes with being able to critically identify the characteristics of the whole data curation process. Within this context, Quality Assurance (QA) and Data Conflation or Data Fusion (DCDF) are two processes that need greater attention with respect to defining their role and analysing their combined use. QA concerns how data meets a set of requirements, whereas DCDF is the modelling task that derives a new product or result. Through investigating the conditions that can often make these two processes entangled, this paper advocates for their separation as the goal of any data curation design. Even though the usability, one or more reports in the metadata, drives the need to assess several other quality elements, these quality elements should, as much as possible, be evaluated without being “entangled” with the DCDF (seen as the future usage). Striving to achieve this goal will enhance the understanding of the limits of each of these processes in acquiring evidence and confidence in the data for the designed study.
When designing the whole curation process, a conceptual approach that considers the various facets of entanglement in modelling and authoring the respective workflows would increase control for (re-)usability. By providing increased flexibility, greater complexity can be achieved, thereby enabling more effective use of crowdsourcing and volunteered or citizen derived geographical information. To this end, a metaquality service orchestrating the interrelation of the QA and the DCDF workflows could constitute a feedback interface to the scientist and decision-maker organising the data management requirements and new data collection surveys.
Dis-entanglement of QA and DCDF appeared beneficial on a rhetorical basis using two illustrative examples of land cover validation and flood extent estimation, but this could become particularly useful when considering that data flows are becoming more continuous, forcing regular updates in the data quality and in the conflated data. As citizen science data may act as timely evidence for various decisions, including environmental policy, it is only with good management of data and metadata, and particularly data quality, that citizen science data can fulfil its role of empowering citizens [
2,
43]. With the rise of the Internet of Things and embedded sensors, citizen science can maximise its impact from its human dimension only if its data curation is not questionable and is at least transparent.


