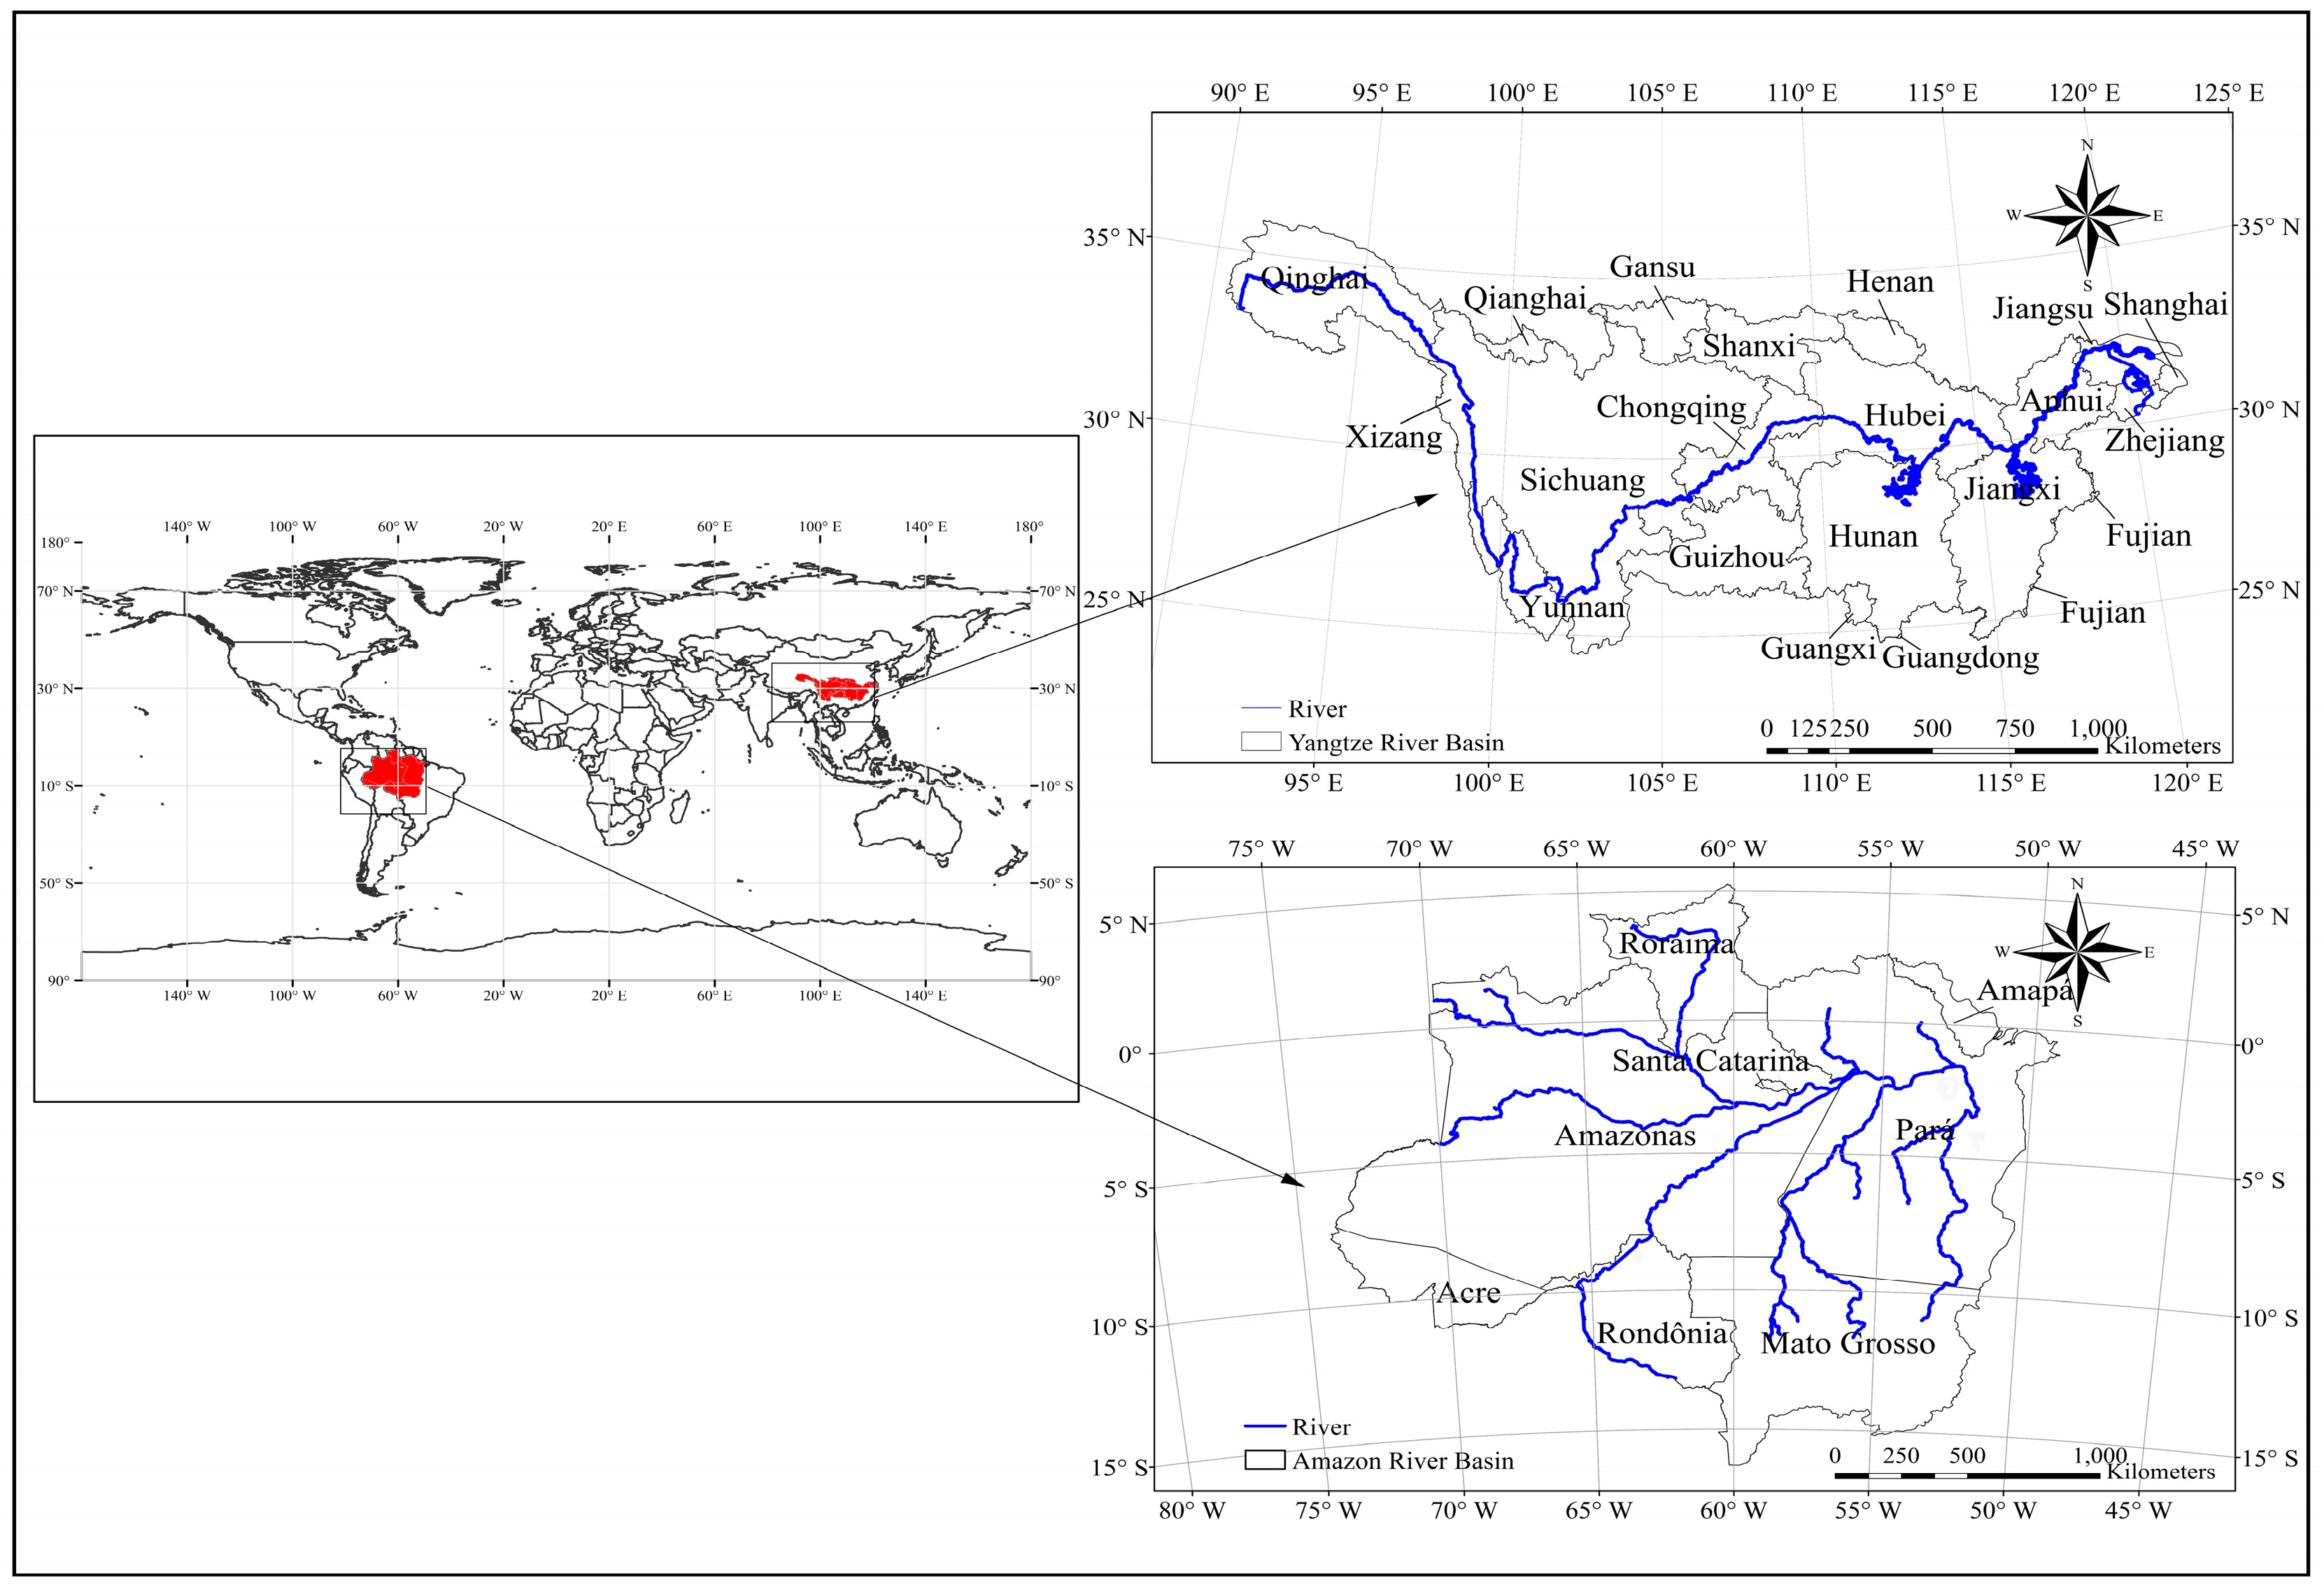
Article

Assessment of Wetland Ecosystem Health in the Yangtze and Amazon River Basins

1
State Key Laboratory of Remote Sensing Science, Institute of Remote Sensing Science and Engineering, Faculty of Geographical Science, Beijing Key Laboratory of Environmental Remote Sensing and Digital City, Beijing Normal University, Beijing 100875, China
2
Center for School of Environment and Natural Resources, Renmin University of China, Beijing 100872, China
*
Author to whom correspondence should be addressed.
ISPRS Int. J. Geo-Inf. 2017, 6(3), 81; https://0-doi-org.brum.beds.ac.uk/10.3390/ijgi6030081
Submission received: 26 December 2016 / Revised: 18 February 2017 / Accepted: 8 March 2017 / Published: 14 March 2017
(This article belongs to the Special Issue Analysis and Applications of Global Land Cover Data)

Abstract

:
As “kidneys of the earth”, wetlands play an important role in ameliorating weather conditions, flood storage, and the control and reduction of environmental pollution. With the development of local economies, the wetlands in both the Amazon and Yangtze River Basins have been affected and threatened by human activities, such as urban expansion, reclamation of land from lakes, land degradation, and large-scale agricultural development. It is necessary and important to develop a wetland ecosystem health evaluation model and to quantitatively evaluate the wetland ecosystem health in these two basins. In this paper, GlobeLand30 land cover maps and socio-economic and climate data from 2000 and 2010 were adopted to assess the wetland ecosystem health of the Yangtze and Amazon River Basins on the basis of a pressure-state-response (PSR) model. A total of 13 indicators were selected to build the wetland health assessment system. Weights of these indicators and PSR model components, as well as normalized wetland health scores, were assigned and calculated based on the analytic hierarchy process method. The results showed that from 2000 to 2010, the value of the mean wetland ecosystem health index in the Yangtze River Basin decreased from 0.482 to 0.481, while it increased from 0.582 to 0.593 in the Amazon River Basin. This indicated that the average status of wetland ecosystem health in the Amazon River Basin is better than that in the Yangtze River Basin, and that wetland health improved over time in the Amazon River Basin but worsened in the Yangtze River Basin.

1. Introduction

Wetlands are biologically diverse and productive transitional areas between the land and open water. They are characterized by waterlogged soil overlaid by shallow water with interspersed submerged or emergent vegetation [1]. Wetlands play an important role in flood prevention, water purification and control, air purification, climate regulation, nutrient cycling, and biodiversity conservation. The world’s wetlands are also pit stops for migratory birds, offering protection and food before the birds continue on to their final destination [2]. The health of inland wetlands has significant influence on the health of associated terrestrial and aquatic ecosystems by affecting the ecological stability of regional river basins [3]. The ecosystem health of inland wetlands is, therefore, of global importance.
The term ecosystem health was first proposed by Rapport et al. [4]. They defined it as ecosystem stability and sustainability, or the ability to maintain organizational structure, self-regulation, and resiliency. The assessment of wetland health has evolved from using only qualitative methods to using both qualitative and quantitative means of assessment. Commonly used methods include the evaluation of LDI (landscape development intensity) [5], synoptic [6], and HGM (hydrogeomorphic) approaches [7], indices of biological integrity (IBI) [8], landscape pattern indices [9], and pressure-state-response (PSR) modeling methods [10]. The PSR model, first proposed by Rapport and Friend [10] and later fully developed by the Organization for Economic Cooperation and Development [11], provides a systematic mechanism to monitor the status of an environment or the sustainable development of natural resources and environmental ecology. By dividing the factors in terms of pressure, state, and response, the PSR model considers both natural and socio-economic factors, clearly describes cause and effect relationships, and involves indicators that are relatively easy to obtain, so we used the PSR model to assess wetland ecosystem health in this paper.
Traditionally, ecosystem health assessment had been conducted using field observation data or models. Water birds [12,13], macro-invertebrates and fish [14,15], plants [16], and water quality [17] data have been used to reflect wetland health conditions. These field observation data cannot be widely applied on a large spatial scale [18] and have difficulty providing spatially and temporally explicit assessments [19]. Instead, remote sensing data have a high potential for assessing and monitoring ecosystem health at different temporal and spatial scales across extensive areas [19,20]. Therefore, they are increasingly being used to assess wetland ecosystem health; for example, Jiang et al. [21] assessed the wetland ecosystem health of the Liaohe River Delta in China using the PSR model, remote sensing, and GIS technology at the watershed scale. Recently, Chen et al. [22] produced global land cover maps (GlobeLand30) for 2000 and 2010 with a spatial resolution of 30 m, which are extremely useful for the evaluation of regional ecosystems.
The Amazon and Yangtze Rivers are the second and third longest rivers in the world, respectively, and both river basins are struggling with the proper coordination of ecological, environmental, and economic development. China and Brazil are both developing countries, and with the development of their economies, wetlands in both the Amazon and Yangtze River Basins are affected and threatened by human activities, such as urban expansion, reclamation of land from lakes, and large-scale agricultural development in wetlands. A comparison of wetland ecosystem health between the Yangtze River Basin and Amazon River Basin could provide references for the protection of wetlands in both basins. To deeply understand the status of the wetlands and protect the wetland ecosystem, some studies have used different methods to evaluate the wetland ecosystem health in the Yangtze River Basin. For example, with the PSR model and remote sensing data, Jiang et al. [3] and Sun et al. [23] evaluated the wetland ecosystem health in Dongting Lake and Hangzhou Bay, respectively, which are located in the middle and lower reaches of the Yangtze River Basin. Mo et al. [17] used a back propagation artificial neural network approach to evaluate the ecosystem health of the Honghu Lake wetland in the middle reaches of the Yangtze River Basin. However, little work has been done to evaluate wetland health for the whole Yangtze and Amazon River Basins. The objective of this paper is to establish a wetland ecosystem health assessment model using the PSR method to quantitatively evaluate and compare wetland ecosystem health in the Yangtze and Amazon River Basins between 2000 and 2010.

2. Materials and Methods

2.1. Study Area

The study area includes the Yangtze River Basin in China and the Amazon River Basin in Brazil (Figure 1). The Yangtze River Basin is the third largest river basin in the world, with a total area of 1,800,000 km2. It is in multistage ladder terrain, flowing through the Qinghai-Tibetan Plateau, Hengduan Mountains, Sichuan Basin, and the middle-lower portion of the Yangtze plain. The climate in the basin is a typical subtropical monsoon climate, making it hot and rainy in the summer and warm and humid in the winter. The annual average rainfall is 1067 mm, decreasing from southeast to northwest. The Yangtze River flows through 19 provinces in China, and the basin includes the whole area of Sichuan, Chongqing, Hubei, Hunan, and Jiangxi provinces and part of the area of Qinghai, Xizang, Gansu, Shanxi, Yunnan, Guizhou, Guangxi, Guangdong, Henan, Anhui, Jiangsu, Shanghai, Fujian, and Zhejiang provinces. There are approximately 400 million people in the Yangtze River Basin, accounting for one-third of the Chinese population. The average population density is more than 220 people·km−2, and with its rapid economic development, the per capita gross domestic product (GDP) in the Yangtze River Basin was more than $3000 in 2010.
The Amazon River is 6400 km in length, making it the second longest river in the world. The Amazon River Basin (6° N–20° S, 79° W–48° W) is located in the northern part of South America, has an area of 6,915,000 km2, and flows through Peru, Brazil, Bolivia, Ecuador, Columbia, Venezuela, and other countries. The area of the Amazon River Basin makes it the largest basin in the world. Approximately 2/3 of the basin, an area of 3,900,000 km2, is in Brazil. The Amazon River Basin has plenty of water throughout the year; the average annual flow is 220,000 m3s−1 at the mouth, and during the flood period it is up to 280,000 m3s−1. Most parts of the basin have a tropical rain forest climate, meaning it is warm, humid, and rainy. The average annual rainfall in the Amazon River Basin is 2000 mm or more. The Amazon’s tropical rainforest accounts for 1/3 of the total tropical rainforests in the world. The Amazon River Basin in Brazil includes the whole area of Acre, Amazonas, Santa Catarina, Rondônia, and Roraima states and part of the area of Amapá, Mato Grosso, and Pará states. The average population density is less than 10 people·km−2, and the per capita GDP in the Amazon River Basin in Brazil was more than $10,000 in 2010.
Wetlands in both the Amazon and Yangtze River Basins are largely affected by human activities. Since the 1950s, approximately 1100 km2 of the intertidal land in the Yangtze River Delta has been embanked, resulting in the disappearance of saltmarshes and even the entire intertidal zone along some sections of the coastline [24]. Using satellite images, the latest analysis of the Amazon River Basin found that an average of 15,550 km2 of forest has been selectively cut down. Selective cutting intensifies erosion processes [25] and directly or indirectly affects the health of wetlands in river basins. Part of Brazil’s Pantanal wetland, the world’s largest wetland, is in the southwest of the Amazon River Basin. In recent years, nearly 99% of Pantanal land has been occupied by human beings and has been used particularly for farmland and pasture. Therefore, the protection of Pantanal land has become an imminent problem. The Pantanal wetland ecosystem is facing a crisis caused by human activity, including unregulated fishing, hunting, endangered species smuggling (e.g., alligators, leopards, lynx, and parrots), unregulated tourism activities, and deforestation [26].

2.2. Selection of Indicators

According to the PSR model, the indicators can be divided into three categories: pressure, state, and response. Taking into account the data availability, we chose 13 ecosystem indicators in total to establish the wetland ecosystem health evaluation model. Details of these indicators are shown in Table 1.
The pressure factors include indirect pressure (such as human activities) and direct pressure (such as resource utilization and pollution emission). Pressure is a measure of the intensity of wetland utilization and the rate of change in wetland resources within a particular period. Human economic activities play a much greater role in wetland change. This pressure is caused by the population density, GDP, urbanization rate, and pressure of cultivated land. Jiang et al. [3] and Jia et al. [27] have indicated that it is reasonable to assume that greater population densities increase the negative impact to the health of wetlands. Jiang et al. [21] and Jia et al. [27] used GDP data to evaluate the health conditions of their study area. Therefore, in this paper, we chose population density and GDP to indicate ecosystem pressure. The urbanization rate and pressure of cultivated land were selected based on previous studies [28]. The urbanization rate is calculated as the ratio of artificial land area to the total area. The pressure of cultivated land is calculated as the ratio of cultivated land to the total area.
The state factors indicate the current situation of the ecological system and natural environment, which were used to describe the structure of the wetland ecosystem composition and the function of the wetland under pressure. Water state transformation and movement are the most important processes in wetland ecosystems, which are determined by the landscape, flooding, rainfall, and evaporation. Therefore, we chose the average annual rainfall [29,30], net primary productivity (NPP) [31], and terrain slope to evaluate the state of wetland ecosystem health [32]. Because a landscape index can be used to convey pattern information about wetland landscapes [33,34] and the landscape metrics are sensitive to scale [35], we chose patch density, perimeter area fractal dimension, Shannon’s diversity index, and the contagion index to quantify the state of wetland ecosystem health [36]. We obtained these landscape indices from GlobeLand30, added the areas of wetland and water as the total wetland area, and then used the landscape index formula through Fragstats 4.4.
Human pressure can cause changes in wetland environments and natural resources, which were used as the response indicators. The proportion of wetland area and the ecosystem services value were chosen as the response indicators. We obtained the wetland area from GlobeLand30, and the ecosystem services value was calculated using the coefficient of ecosystem services value from Costanza [37].

2.3. Data and Pre-Processing

We used raster and socio-economic data to evaluate wetland ecosystem health. The raster data included the GlobeLand30 land cover map [22], net primary productivity (NPP), a digital elevation model (DEM), and rainfall data. The GlobeLand30 land cover map at 30 m was produced from 10,000 Landsat-like satellite images based on the integration of pixel- and object-based methods with knowledge (POK-based) [22]. A split-and-merge strategy was employed to handle the classification process of land cover types [22]. In this study, we choose the GlobeLand30 land cover map for the years 2000 and 2010. The land cover types of GlobeLand30 include cropland, forest, grass, shrub, wetland, water, artificial cover, bare cover, and permanent ice or snow.
The land cover maps were resampled at 1 km resolution by calculating the proportion of each land cover type within each 1 km grid cell. We processed the GlobeLand30 land cover using the following method: first, we determined the ratio statistics of different land cover types at 30 m resolution in a 1 km grid; then, we resampled the 30 m resolution data to 1 km resolution and extracted the land types from the resampled data, including croplands, forest, grass, artificial cover, water, and wetlands. The 1 km resolution MODIS NPP data were downloaded from the website https://ladsweb.nascom.nasa.gov/data/search.html. The 1 km resolution DEM data were obtained from http://www.gscloud.cn/. The average annual rainfall data between 2000 and 2010 were obtained from the global weather data databases for SWAT (Soil and Water Assessment Tool) data sharing platforms (http://globalweather.tamu.edu).
The socio-economic data included population and GDP. The gridded population and GDP data in the Yangtze River Basin were downloaded from the website http://www.geodata.cn. The population of the Yangtze River Basin was divided into 1 km grid cells according to the linear relationship between population and croplands, forest, grass, and urban and rural areas [38,39,40]. The GDP grid was also based on the relationship between GDP and land cover, including croplands, forest, grass, and artificial cover, and was disaggregated into a 1 km grid based on the methods in Liu et al. [41]. In the Amazon River Basin, the population density grid data were downloaded from the website http://beta.sedac.ciesin.columbia.edu/data/collection/gpw-v4/sets/browse. We disaggregated the GDP data into a 1 km grid based on the relationship between GDP and land cover, including croplands, forest, grass and artificial cover in the Amazon River Basin.
Because the indicators differ in units and dimensionality, we used a linear scale transformation of the max–min method [42] to normalize the data and scale the value of all indicators from 0 to 1.

2.4. Weight of Evaluation Factors

The analytic hierarchy process (AHP) method was used to determine the weight of factors; this is a multi-criteria decision-making (MCDM) approach that was developed by Saaty [43,44,45]. To determine the weight of factors, four AHP matrixes were created by pairwise comparison of every two factors according to the relative importance of the factors to a higher-level indicator. By referring to the studies of Junk [46] and Cui and Yang [28], we determined the relative importance as follows: (1) pressure: urbanization rate > pressure of cultivated land > population density > GDP; (2) state: NPP > average annual rainfall > patch density > perimeter area fractal dimension > Shannon’s diversity index > contagion index > terrain slope; (3) response: wetland area > ecosystem services value. Then, we generated the final AHP matrixes (Table 2) based on Satty’s scale [43].
The weights of different indicators were computed using the Yet Another AHP 9.0 software (Beijing Xinshengyun Software Company, Beijing, China), which is based on eigenvector values. The last column of Table 2 shows the weight of each indicator.

2.5. Assessment of Wetland Ecosystem Health

The integrated indicators of pressure, state, effect, and response for each unit were obtained by the following linear function according to the standardized value and weight of each indicator:
H I = i = 1 n W i × C i
where HI is the value of the pressure, state, and response indicator. Wi is the weight of the i-th indicator, and Ci is the standardized value of the i-th indicator. The wetland ecological health index (WEHI) is the sum of pressure, state, and response, HI. The reclassified standards of WEHI are given in Table 3.

3. Results

3.1. Dynamic Changes in the Wetland Ecological Health Index in the Yangtze River Basin

The wetlands in the northwestern areas and the central and eastern urban areas, including Chongqing, Wuhan, and Shanghai, are in poor health (Figure 2). The wetlands in the northwestern areas were unhealthy because of the poor natural environment. In Chongqing, Wuhan, and Shanghai, high urbanization rates, the degree of landscape fragmentation, and low NPP were the main reasons for poor wetland health.
In Qinghai and Xizang provinces, the values of pressure indices were high, and the state indices were low both in 2000 and 2010 (Table 4). Because economic development in Qinghai and Xizang provinces was slow, the GDPs in these two provinces were the lowest in the entire Yangtze River Basin. Furthermore, the natural conditions in Qinghai and Xizang provinces were poor; the elevation is high, the terrain is mountainous, and rainfall and NPP were low. The values of the state indices in Fujian and Jiangxi provinces were high (Table 4) owing to high NPP and rainfall rates (Table 5). The response values were high in Jiangsu provinces because of their relatively large wetland areas and high ecosystem values (Table 4).
Table 5 shows that the areas with the fastest growth rate were Shanghai (10.37%), Fujian (5.22%) and Jiangxi (4.34%), and the areas with the most rapid reduction rate were Guangdong (−5.07%), Yunnan (−4.95%),, Chongqing (−4.65%), and Guizhou (−3.51%). Because of extreme drought in 2010, the average rainfall significantly declined in Guizhou (−5.15%), Chongqing (−5.82%) and Yunnan (−12.86%) (Table 5). This contributed to reduced wetland ecosystem health in these provinces.
The total wetland area in the Yangtze River Basin decreased from 43,397.150 km2 in 2000 to 42,589.728 km2 in 2010, the average wetland ecosystem health slightly decreased from 0.482 to 0.481, indicating poorer wetland ecosystem health from 2000 to 2010.

3.2. Dynamic Changes in the Wetland Ecological Health Index in the Amazon River Basin

In 2000 and 2010, the wetlands with poor ecosystem health were mostly distributed in the central and southern regions of the Amazon River Basin (Figure 3). Table 6 shows that the value of the state index for Santa Catarina, in the central region of the Amazon River Basin, was low both in 2000 and 2010. In the southern region, Mato Grosso had a similarly low value for the response index in 2000 and 2010. High population density and the degree of landscape fragmentation were the main reasons for these low response index values. The pressure index value was low in Mato Grosso because of the lower population. The state indices in Acre and Rondônia were high owing to the high NPP values in these two states. Finally, the response index was high in Amazonas and Pará due to the high ecosystem values and large wetland areas (Table 6).
Table 7 shows that the growth rate of wetland health is largest in Mato Grosso (4.94%) and Pará (3.93%), while the greatest reduction rates were found in Acre (−4.90%), Rondônia (−2.49%), and Amapá (−1.19%). Rondônia, in the southwest of the Amazon Basin, suffered an extreme drought in 2010. The annual rainfall decreased by approximately 12.59% from 2000 to 2010, which contributed to the decrease in wetland ecosystem health in 2010 (Table 7).
Generally, wetland ecosystem health improved from 2000 to 2010 in the Amazon River Basin in Brazil, with the average value increasing from 0.582 to 0.593.

4. Discussion

The reduction in wetland ecosystem health in the Yangtze River Basin may largely be attributed to urban expansion and intertidal land. First, rapid urban expansion occupied part of the wetlands, particularly in the middle and lower reaches of the basin. According to the GlobeLand30 data, the area of artificial land increased from 26,349.94 km2 to 31,506.49 km2 between 2000 and 2010, with 281.44 km2 transformed from wetlands and water to artificial land. Second, approximately 1100 km2 of the intertidal land had been embanked since the 1950s, resulting in the disappearance of saltmarshes and even the entire intertidal zone along some sections of the coastline [24]. Rapid urban expansion and intertidal land embankment brought great benefits to the local economy in the short term but exposed the wetland ecosystem to strong pressures that resulted in a reduction of wetland habitat areas and an increase in landscape fragmentation, water pollution, and coastal wetland vulnerability. Wang et al. [47] evaluated the collective threat from natural pressures and human activity and concluded that the combined effects of these factors created a high risk of large reductions, and possibly even the total loss, of coastal wetland habitat. The third change in the Yangtze River Basin due to human interference was the construction of deep-waterway structures at the river mouth bar, which greatly modified local hydrodynamics and morphology. Sediment accretion increased significantly in these areas as a result of sheltering by these deep-waterway structures [24].
Other studies have evaluated wetland ecosystem health in parts of the Yangtze River Basin, and the results were the same as those in this study. Sun et al. [23] found that wetland ecosystem health in Hangzhou Bay (south of Shanghai and northeast of Zhejiang Province) was slightly restored from 2000 to 2010. The main reasons for wetland restoration during this period were improvements in wetland ecosystem state and response, the establishment of wetland reserves and parks, amended regulations, and increased protection efforts [48,49,50]. In this study, the average wetland ecosystem health increased from 0.409 in 2000 to 0.451 in 2010 in Shanghai (Table 5). Jiang et al. [3] evaluated the wetland ecosystem health of Dongting Lake (Hubei Province), and they discovered that the wetland area shrunk by almost 1460 hm2 from 1995 to 2000 as the wetlands were transformed into other land use types. In this study, the wetland area in Hubei Province decreased from 9896.31 km2 to 9100.26 km2, a 736.05 km2 change in this land use type from 2000 to 2010.
The Amazon region has the highest deforestation rates on earth, and changes in land cover caused by deforestation can lead to a series of hydrological impacts, among which is an increase in discharge. However, although large areas have already been deforested in the Amazon River Basin, the balance between deforestation and conservation is still positive from the perspective of ecological processes and conservation [51]. On the scale of large watersheds, the area delimited by conservation areas is more than three times larger than the deforested areas [51]. These conservation measures might improve the status of wetland ecosystem health. Castello and Macedo [52] found that hydrological alterations are rapidly degrading water ecosystems, causing, for example, biodiversity loss, change in biogeochemical cycles, transport of organic and inorganic materials, and changes to freshwater community structure and function. How deforestation and conservation impact the health of the wetland ecosystem in the Amazon River Basin needs to be further studied.
Because the GlobeLand30 land cover data are for 2000 and 2010, we chose 2000 and 2010 as our study years. However, there was an extreme drought in both the Yangtze River Basin [53] and Amazon River Basin [54] in 2010, which may have resulted in an underestimation of wetland ecosystem health in 2010. Meanwhile, limited by the data acquisition, we did not consider pesticide utilization, chemical fertilization, or government investment in wetland protection in this study. To more reasonably reflect the health status of the wetlands, future studies should add more indicators and choose normal climatic years to evaluate wetland ecosystem health in the Yangtze and Amazon River Basins.

5. Conclusions

Based on the PSR model and AHP method, a wetland ecosystem health assessment model was established in this paper. There were a total of 13 indicators in the model, and most of the indicators were extracted or derived from GlobeLand30 land cover maps. The model was then tested in the Yangtze and Amazon River Basins to evaluate the wetland ecosystem health in 2000 and 2010. The results showed that the model could reflect the status of wetland ecosystem health in both the Yangtze and Amazon River Basins. There was a slight reduction in wetland ecosystem health in the Yangtze River Basin, while wetland ecosystem health improved in Brazil’s Amazon River Basin from 2000 to 2010. In addition, because of its lower population density, less cropland and built-up land coverage, higher annual rainfall, and better vegetation conditions, the status of wetland ecosystem health in the Amazon River Basin was better than that in the Yangtze River Basin in both 2000 and 2010.

Acknowledgments

This work was supported by the National Department Public Benefit Research Foundation (GYHY201512028), the State’s Key Project of Research and Development Plan (2016YFB0501502), and the National Natural Science Foundation of China (41471349). We would like to express our sincere gratitude to anonymous reviewers who provided excellent comments and valuable suggestions that have greatly helped with the improvement of this manuscript.

Author Contributions

Rui Sun, Pingping Yao, and Wen Wang carried out the data analysis and wrote the paper. Pingping Yao finished the data processing. Bing Yue and Gang Liu processed the Globeland30 data.

Conflicts of Interest

The authors declare no conflict of interest.

References

  1. Lee, S.Y.; Dunn, R.J.K.; Young, R.A.; Connolly, R.M.; Dale, P.E.R.; Dehayr, R.; Lemckert, C.J.; Mckinnon, S.; Powell, B.; Teasdale, P.R.; et al. Impact of urbanization on coastal wetland structure and function. Austral Ecol. 2006, 31, 149–163. [Google Scholar] [CrossRef]
  2. Huang, G.L.; He, P.; Hou, M. Present status and prospects of estuarine wetland research in China. Chin. J. Appl. Ecol. 2006, 17, 1751–1756. [Google Scholar]
  3. Jiang, W.G.; Pan, Y.Z.; Huo, P.; Li, X.; Ji, W.; Zheng, J.R. Assessment and analysis of wetland ecosystem health in Dongting Lake. Geogr. Res. 2009, 28, 1665–1672. [Google Scholar]
  4. Rapport, D.J.; Regier, H.; Hutchinson, T. Ecosystem behavior under stress. Am. Nat. 1985, 125, 617–640. [Google Scholar] [CrossRef]
  5. Brown, M.T.; Vivas, M.B. Landscape development intensity index. Environ. Monit. Assess. 2005, 101, 289–309. [Google Scholar] [CrossRef] [PubMed]
  6. Bedford, B.L.; Preston, E.M. Developing the scientific basis for assessing cumulative effects of wetland loss and degradation on landscape functions: Status, perspectives, and prospects. Environ. Manag. 1988, 12, 751–772. [Google Scholar] [CrossRef]
  7. Smith, R.D.; Ammann, A.; Bartoldus, C.; Brinson, M.M. An Approach for Assessing Wetland Functions Using Hydrogeomorphic classification, Reference Wetlands, and Functional Indices; Technical Report WRP-DE-9; U.S. Army Engineer Waterways Experiment Station: Vicksburg, MS, USA, 1995. [Google Scholar]
  8. DeKeyser, E.S.; Kirby, D.R.; Ell, M.J. An index of plant community integrity: development of the methodology for assessing prairie wetland plant communities. Ecol. Indic. 2003, 3, 119–133. [Google Scholar] [CrossRef]
  9. Bornette, G.; Amoros, C.; Piegay, H.; Tachet, J.; Hein, T. Ecological complexity of wetlands within a river landscape. Biol. Conserv. 1998, 85, 35–45. [Google Scholar] [CrossRef]
  10. Rapport, D.J.; Friend, A.M. Towards a Comprehensive Framework for Environmental Statistics: A Stress-Response Approach; Statistics Canada: Ottawa, ON, Canada, 1979; Volume 11, p. 87. [Google Scholar]
  11. OECD. OECD Core Set of Indicators for Environmental Performance Reviews: A Synthesis Report by the Group on the State of the Environment; Environment Monographs, OECD: Paris, France, 1993. [Google Scholar]
  12. Ogden, J.C.; Baldwin, J.D.; Bass, O.L.; Browder, J.A.; Cook, M.I.; Frederick, P.C.; Frezza, P.E.; Galvez, R.A.; Hodgson, A.B.; Meyer, K.D.; et al. Water-birds as indicators of ecosystem health in the coastal marine habitats of southern Florida:1. selection and justification for a suite of indicator species. Ecol. Indic. 2014, 44, 148–163. [Google Scholar] [CrossRef]
  13. Péron, G.; Ferrand, Y.; Leray, G.; Gimenez, O. Waterbird demography as indicator of wetland health: the French-wintering common snipe population. Biol. Conserv. 2013, 164, 123–128. [Google Scholar] [CrossRef]
  14. Colin, N.; Porte, C.; Fernandes, D.; Barata, C.; Padrós, F.; Carrassón, M.; Monroy, M.; Cano-Rocabayera, O.; Sostoa, A.; Piñac, B.; et al. Ecological relevance of biomarkers in monitoring studies of macro-invertebrates and fish in Mediterranean rivers. Sci. Total Environ. 2016, 540, 307–323. [Google Scholar] [CrossRef] [PubMed]
  15. Sharma, R.C.; Rawat, J.S. Monitoring of aquatic macroinvertebrates as bio indicator for assessing the health of wetlands: A case study in the central Himalayas, India. Ecol. Indic. 2009, 9, 118–128. [Google Scholar] [CrossRef]
  16. Albert, D.A.; Minc, L.D. Plants as regional indicators of Great Lakes coastal wetland health. Aquat. Ecosyst. Health Manag. 2004, 7, 233–247. [Google Scholar] [CrossRef]
  17. Mo, M.H.; Wang, X.L.; Wu, H.J.; Cai, S.M.; Zhang, X.Y.; Wang, H.L. Ecosystem health assessment of Honghu Lake wetland of China using artificial neural network approach. Chin. Geogr. Sci. 2009, 19, 349–356. [Google Scholar] [CrossRef]
  18. Chen, Z.H.; Wang, J. Establishing an ecosystem health model in arid and semi-arid area by using remote sensing data. In Proceedings of the 2005 IEEE International Geoscience and Remote Sensing Symposium, Seoul, Korea, 19 July 2005.
  19. Kerr, J.T.; Ostrovsky, M. From space to species: Ecological applications for remote sensing. Trends Ecol. Evol. 2003, 18, 299–305. [Google Scholar] [CrossRef]
  20. Ludwig, J.A.; Bastin, G.N.; Chewings, V.H.; Eager, R.W.; Liedloff, A.C. Leakiness: A new index for monitoring the health of arid and semiarid landscapes using remotely sensed vegetation cover and elevation data. Ecol. Indic. 2007, 7, 442–454. [Google Scholar] [CrossRef]
  21. Jiang, W.G.; Li, J.; Li, J.H.; Xie, Z.R.; Wang, W.J. Assessment of wetland ecosystem health in the Liaohe River Delta. Acta Ecol. Sin. 2005, 25, 408–414. [Google Scholar]
  22. Chen, J.; Chen, J.; Liao, A.P.; Cao, X.; Chen, L.J.; Chen, X.H.; He, C.Y.; Gang, H.; Shu, P.; Miao, L.; et al. Global land cover mapping at 30 m resolution: a pok-based operational approach. ISPRS J. Photogramm. Remote Sens. 2014, 103, 7–27. [Google Scholar] [CrossRef]
  23. Sun, T.T.; Lin, W.P.; Chen, G.S.; Guo, P.P.; Zeng, Y. Wetland ecosystem health assessment through integrating remote sensing and inventory data with an assessment model for the Hangzhou Bay, China. Sci. Total Environ. 2016, 566, 627–640. [Google Scholar] [CrossRef] [PubMed]
  24. Du, J.L.; Yang, S.L.; Feng, H. Recent human impacts on the morphological evolution of the Yangtze River delta foreland: A review and new perspectives. Estuarine Coast. Shelf Sci. 2016, 181, 160–169. [Google Scholar] [CrossRef]
  25. Si, Y. The destruction and protection of Amazon rainforest. Ecol. Econ. 2008, 12, 8–10. [Google Scholar]
  26. Junk, W.J.; Cunha, C.N.D.; Wantzen, K.M.; Petermann, P.; Strüssmann, C.; Marques, M.I.; Adis, J. Biodiversity and its conservation in the Pantanal of Mato Grosso, Brazil. Aquat. Sci. 2006, 68, 278–309. [Google Scholar] [CrossRef]
  27. Jia, H.C.; Pan, D.H.; Zhang, W.C. Health assessment of wetland ecosystems in the Heilongjiang River basin, China. Wetlands 2015, 35, 1185–1200. [Google Scholar] [CrossRef]
  28. Cui, B.S.; Yang, Z.F. Establishing an indicator system for ecosystem health evaluation on wetlands I. A theoretical framework. Acta Ecol. Sin. 2002, 22, 1005–1011. [Google Scholar]
  29. Hu, C.; Wang, H.C.; Luo, Y. Application of PSR model to evaluation of wetland ecological security in Haihe Basin. Water Resour. Prot. 2012, 4, 9. [Google Scholar]
  30. Wu, J.H.; Yang, H.; Yang, F.S.; Lu, H.; Su, S.Z. Assessment of wetland ecosystem health in Irtysh river. J. Arid. Land Resour. Environ. 2014, 28, 149–154. [Google Scholar]
  31. Sun, R.; Zhu, Q.J. Net primary productivity of terrestrial vegetation-a review on related researches. Chin. J. Appl. Ecol. 1999, 6, 757–760. [Google Scholar]
  32. Wang, Z.B.; Fang, C.L.; Wang, J. Evaluation on the coordination of ecological and economic systems and associated spatial evolution patterns in the rapid urbanized Yangtze Delta region since 1991. Acta Geogr. Sin. 2011, 66, 1657–1668. [Google Scholar] [CrossRef]
  33. Fabrig, L.; Mernam, G. Habitat patches connectivity and population survival. Ecology 1985, 66, 1762–1768. [Google Scholar]
  34. Costa, M.; Telmer, K.H.; Evans, T.L.; Diakun, M.T. The lakes of the Pantanal: inventory, distribution, geochemistry, and surrounding landscape. Wetl. Ecol. Manag. 2015, 23, 19–39. [Google Scholar] [CrossRef]
  35. Li, X.; Lu, L.; Cheng, G.; Xiao, H. Quantifying landscape structure of the Heihe River basin, north-west China using FRAGSTATS. J. Arid Environ. 2001, 48, 521–535. [Google Scholar] [CrossRef]
  36. Lu, L.; Li, X.; Cheng, G.D.; Xiao, H.L. Analysis on the landscape structure of the Heihe River Basin, Northwest China. Acta Ecol. Sin. 2001, 21, 1217–1225. [Google Scholar]
  37. Costanza, R.; Groot, R.D.; Sutton, P.; Ploeg, S.; Anderson, S.J.; Kubiszewski, I.; Farber, S.; Turner, R.K. Changes in the global value of ecosystem services. Glob. Environ. Chang. 2014, 26, 152–158. [Google Scholar] [CrossRef]
  38. Li, Y.J.; Yang, X.H.; Wang, J. Grid size suitability of population spatial distribution in Shangdong Province based on landscape ecology. Geogr. Geo-Inf. Sci. 2014, 30, 97–100. [Google Scholar]
  39. Wang, J.; Yang, X.H.; Shi, R.X. Spatial distribution of the population in Shandong Province at multi-scales. Prog. Geogr. 2012, 31, 176–182. [Google Scholar]
  40. Ye, J.; Yang, X.H.; Jiang, D. The grid scale effect analysis on town leveled population statistical data spatialization. J. Geo-Inf. Sci. 2010, 12, 40–47. [Google Scholar] [CrossRef]
  41. Liu, H.H.; Jiang, D.; Yang, X.H.; Luo, C. Spatialization approach to 1 km grid GDP supported by remote sensing. Geo-Inf. Sci. 2005, 7, 120–123. [Google Scholar]
  42. Celen, A. Comparative analysis of normalization procedures in TOPSIS method: with an application to Turkish deposit banking market. Informatica 2014, 24, 185–208. [Google Scholar] [CrossRef]
  43. Saaty, T.L. The Analytic Hierarchy Process: Planning, Priority Setting, Resource Allocation; McGraw-Hill International: New York, NY, USA, 1980. [Google Scholar]
  44. Saaty, T.L. Fundamentals of Decision Making and Priority Theory with the AHP; RWS Publications: Pittsburgh, PA, USA, 1994. [Google Scholar]
  45. Saaty, T.L. Decision making with the analytic hierarchy process. Int. J. Serv. Sci. 2008, 1, 83–98. [Google Scholar] [CrossRef]
  46. Junk, W.J. Current state of knowledge regarding South America wetlands and their future under global climate change. Aquat. Sci. 2013, 75, 113–131. [Google Scholar] [CrossRef]
  47. Wang, H.; Ge, Z.M.; Yuan, L.; Zhang, L.Q. Evaluation of the combined threat from sea-level rise and sedimentation reduction to the coastal wetlands in the Yangtze Estuary, China. Ecol. Eng. 2014, 71, 346–354. [Google Scholar] [CrossRef]
  48. Peng, P.B. Development of ecological economy, accelerate wetland conservation. Sustain. Dev. 2013, 3, 41–47. [Google Scholar] [CrossRef]
  49. Zhang, M.X.; Dong, Y. Study on changes of coastal wetland landscape in Shuangtaihekou nature reserve and its management measures. Sci. Geogr. Sin. 2002, 22, 119–122. [Google Scholar]
  50. Gao, J.Q.; Zheng, Y.M.; Zhang, M.X.; Cui, G.F. The GAP analysis of wetland conservation in central Yangtze ecoregion. Wetl. Sci. 2011, 9, 42–46. [Google Scholar]
  51. Trancoso, R.; Filho, A.C.; Tomasella, J.; Schietti, J.; Forsberg, B.R.; Miller, R.P. Deforestation and conservation in major watersheds of the Brazilian Amazon. Environ. Conserv. 2009, 36, 277–288. [Google Scholar] [CrossRef]
  52. Castello, L.; Macedo, M.N. Largescale degradation of Amazonian freshwater ecosystems. Glob. Chang. Biol. 2016, 22, 990–1007. [Google Scholar] [CrossRef] [PubMed]
  53. Wang, W.; Xu, Z.L.; Cai, X.J.; Gao, J. Aridity characteristic in middle and lower reaches of Yangtze River area based on Palmer drought severity index analysis. Plateau Meteorol. 2016, 35, 693–707. [Google Scholar]
  54. Saatchi, S.; Asefi-Najafabady, S.; Malhi, Y.; Aragão, L.E.; Anderson, L.O.; Myneni, R.B.; Nemani, R. Persistent effects of a severe drought on Amazonian forest canopy. Proc. Natl. Acad. Sci. USA 2013, 110, 565–570. [Google Scholar] [CrossRef] [PubMed]
Figure 1. Study Area.
Ijgi 06 00081 g001
Figure 2. Spatial pattern of wetland ecosystem health in the Yangtze River Basin in 2000 and 2010. (a) 2000; (b) 2010; (c) Change in wetland ecological health index from 2000 to 2010.
Ijgi 06 00081 g002
Figure 3. Spatial pattern of wetland ecosystem health in the Amazon River Basin in 2000 and 2010. (a) 2000; (b) 2010; (c) Change in wetland ecological health index from 2000 to 2010.
Ijgi 06 00081 g003
Table 1. Indicators of wetland ecosystem health in the Yangtze and Amazon River Basins.
CriteriaIndicatorHealth-Related
PressurePopulation density (people·km−2)
Gross domestic product (GDP) (RMB Yuan·km−2)
Urbanization rate (%)
Pressure of cultivated land (%)
StateAverage annual rainfall (mm)+
Net primary productivity (NPP) (gC·m−2)+
Terrain slope (°)
Patch density+
Perimeter area fractal dimension+
Shannon’s diversity index+
Contagion index+
ResponseWetland area (km2)+
Ecosystem services value (RMB Yuan)+
“+” means positive, “−” means negative.
Table 2. Analytic hierarchy process (AHP) matrix and weight of indicators.
Higher Level IndicatorLower Level IndicatorAHP MatrixPriorityWeight
ABCDEFG
Wetland ecosystem healthA. Pressure11/330.2583
B. State3150.6370
C. Response1/31/510.1047
PressureA. Population density131/51/30.11750.030
B. GDP1/311/71/50.05530.014
C. Urbanization rate57130.56500.146
D. Pressure of cultivated land351/310.26220.068
StateA. Average annual rainfall11/3734560.24480.156
B. NPP31945670.39390.251
C. Terrain slope1/71/911/61/51/41/30.02250.014
D. Patch density1/31/4613450.15180.097
E. Perimeter area fractal dimension1/41/551/31340.09350.060
F. Shannon’s diversity index1/51/641/41/3130.05760.037
G. Contagion index1/61/731/51/41/310.03590.023
ResponseA. Wetland area150.83330.087
B. Ecosystem services value1/510.16670.017
Each value in the AHP matrix represents the relative importance of an indicator in a row compared with an indicator in a column. The value 1 means that the indicator in the row is equally important to the indicator in the column, while the value 9 means that the indicator in the row has absolute importance over the indicator in the column.
Table 3. Wetland ecological health index (WEHI) reclassified standard.
RankBestGoodModeratePoor
WEHIWEHI > 0.710.70 > WEHI > 0.510.50 > WEHI > 0.310.30 > WEHI
Table 4. The average PSR (pressure-state-response) values in different provinces of the Yangtze River Basin.
ProvinceP2000P2010S2000S2010R2000R2010
Shanghai0.1710.1710.2270.2560.0130.012
Zhejiang0.1910.1930.2640.2510.0080.009
Jiangsu0.2070.2050.2440.2450.0290.018
Anhui0.2120.2120.2650.2660.0170.013
Henan0.2100.2100.2150.2080.0120.012
Chongqing0.2110.2120.2540.2300.0080.010
Hubei0.2150.2160.2470.2570.0170.015
Jiangxi0.2250.2250.2880.3180.0160.011
Hunan0.2260.2240.2680.2770.0140.012
Shanxi0.2320.2350.2230.2100.0050.006
Sichuang0.2250.2240.2260.2120.0060.007
Yunnan0.2290.2310.2310.2100.0090.007
Guangdong0.2420.2290.2890.2760.0100.010
Guizhou0.2290.2300.2420.2240.0050.005
Gansu0.2350.2360.2020.2000.0040.005
Guangxi0.2300.2260.2540.2450.0040.004
Fujian0.2450.2450.2910.3190.0030.003
Xizang0.2550.2550.1450.1450.0070.006
Qinghai0.2580.2580.1220.1170.0110.008
Table 5. The average health of the wetland ecosystem and rainfall in different provinces of the Yangtze River Basin.
ProvinceAverage Health in 2000Average Health in 2010Rate of Increase in Wetland HealthRainfall in 2000 (mm)Rainfall in 2010 (mm)Rate of Increase in Rainfall
Shanghai0.4090.45110.37%1043.11059.41.56%
Jiangxi0.5280.5514.34%1379.91758.127.41%
Fujian0.5400.5685.22%1471.41877.027.56%
Zhejiang0.4630.455−1.74%1085.61240.614.27%
Hubei0.4780.4841.35%991.91083.49.22%
Hunan0.5080.5100.45%1180.51356.114.87%
Gansu0.4410.441−0.11%686.1702.42.37%
Henan0.4360.425−2.51%883.8836.2−5.39%
Anhui0.4930.484−1.74%1007.61331.132.10%
Shanxi0.4590.451−1.84%863.5816.6−5.44%
Xizang0.4050.4050.02%570.0521.4−8.53%
Qinghai0.3900.382−2.11%366.1375.22.48%
Sichuang0.4560.442−2.95%752.5755.90.45%
Guangdong0.5420.514−5.07%1347.81368.31.53%
Jiangsu0.4770.458−3.92%982.01031.85.07%
Guizhou0.4760.459−3.51%974.1924.0−5.15%
Chongqing0.4720.450−4.65%1034.8974.5−5.82%
Guangxi0.4870.474−2.65%1165.71186.91.82%
Yunnan0.4690.446−4.95%820.3714.9−12.86%
Table 6. The average PSR (pressure-state-response) value in different Amazon River Basin states.
StateP2000P2010S2000S2010R2000R2010
Acre0.2570.2560.3020.2720.0190.022
Amapá0.2580.2580.2370.2340.0480.045
Amazonas0.2580.2580.2750.2820.0660.070
Mato Grosso0.2520.2500.2550.2810.0290.030
Pará0.2580.2580.2340.2470.0610.063
Rondônia0.2570.2570.2800.2550.0410.051
Roraima0.2580.2580.2520.2530.0420.045
Santa Catarina0.2580.2580.2390.2680.0500.043
Table 7. The average health of wetland ecosystem and rainfall in different Amazon River Basin states.
StateAverage Health in 2000Average Health in 2010Growth Rate of Wetland HealthRainfall in 2000 (mm)Rainfall in 2010 (mm)Growth Rate of Rainfall
Mato Grosso0.5350.5624.94%1988.672946.8248.18%
Santa Catarina0.5470.5693.93%2218.942539.9714.47%
Pará0.5530.5672.70%2227.872928.1831.43%
Amazonas0.6000.6101.77%2900.182794.46−3.65%
Roraima0.5530.5570.74%2747.351910.81−30.45%
Amapá0.5430.537−1.19%2640.071461.14−44.66%
Rondônia0.5760.561−2.49%2777.152427.59−12.59%
Acre0.5790.550−4.90%2091.952016.89−3.59%

