Article

A Procedural Construction Method for Interactive Map Symbols Used for Disasters and Emergency Response

1
Key Laboratory of Virtual Geographic Environment (Ministry of Education), Nanjing Normal University, Nanjing 210023, China
2
State Key Laboratory Cultivation Base of Geographical Environment Evolution (Jiangsu Province), Nanjing 210023, China
3
Jiangsu Center for Collaborative Innovation in Geographical Information Resource Development and Application, Nanjing 210023, China
4
Department of Civil Engineering, Faculty of Engineering and Architectural Science, Reyson University, Toronto, ON M5B 2K3, Canada
*
Author to whom correspondence should be addressed.
ISPRS Int. J. Geo-Inf. 2017, 6(4), 95; https://0-doi-org.brum.beds.ac.uk/10.3390/ijgi6040095
Submission received: 11 January 2017 / Revised: 19 March 2017 / Accepted: 22 March 2017 / Published: 24 March 2017

Abstract

:
The timely and accurate mapping of dynamic disasters and emergencies is an important task that is necessary for supporting the decision-making that can improve the efficiency of rescue and response efforts. The existing emergency symbol libraries are primarily composed of point symbols and simple line symbols, focusing on the representation of disasters, related facilities, and operations. However, various existing response factors (e.g., the distribution and types of emergency forces) are also important for further decision-making and emergency responses; there is a need to design complex and diverse symbols to represent this rich information. Moreover, traditional mapping systems only provide static map symbols that cannot be easily edited after creation, making it difficult to support interactive editing after the symbols are mapped, thus hindering the representation of dynamic disasters and response factors. This article targets a solution of the above issues by proposing a procedural construction method of interactive map symbols for dynamic disasters and emergency responses. There are two primary research points. First, an emergency response and decision symbol library was classified and integrated into the existing attachments to form a richer symbol library for comprehensively representing disasters and emergencies. Second, an interactive map symbol procedural construction method was designed based on (1) primitive geometric compositions and geometric graphics algorithms to construct the map symbol graphics; (2) an interactive graphics control and drawing attributes configuration method to support user interactive editing of the visual variables of the mapped symbols; (3) and a dynamic updating and drawing strategy to support the real-time refreshing of the changing visual variables. The experiment was conducted using the Wenchuan earthquake as a case study, and the results demonstrate a powerful capacity of the produced interactive map symbols, which will contribute to the improvement of the mapping efficiency and representation capability of disasters and emergency response.

1. Introduction

With the global environment changing and the increase in human activities, natural disasters and man-made accidents are increasing in frequency, which is a serious threat to the safety of human lives and property [1,2,3]. Studies on disasters are often devoted to improving the efficiency and capabilities of disaster responses and decision-making, to reduce the enormous losses caused by disasters [3,4,5,6,7]. After disasters and incidents occur, the timely representation and sharing of the disaster and response situations using modern technology is a useful approach for supporting emergency decision-making and response efforts. Many existing studies on, and applications for, disaster mapping have already produced useful results, such as Copernicus EMS and International Disasters Charter [8,9,10,11,12,13,14]. Disasters and the corresponding responses have temporal-spatial characteristics, and mapping methods based on geographic information technology have the potential to represent these events in a visual and well-perceived way [15,16,17,18,19,20,21].
To date, many researchers have devoted themselves to the study of emergency mapping methods using different types of emergency map symbols combined with basic geographic information for emergency response and disaster reduction efforts [22,23]. The disasters and emergency map symbol library, which is used to create, store, and manage map symbols, is the foundation of emergency mapping. The classification and content of symbol libraries are key factors that affect mapping capabilities [24,25,26]. Existing research on the disasters and emergency symbol library has mainly focused on two aspects. First, disaster-specific mapping symbols, including cartographic earthquake emergency map symbols, landslide symbols, debris flow disaster symbols, and other symbols for specific applications, have been developed [27,28]. Second, classification standards for symbol management have been designed. Some researchers have classified the emergency symbols into four categories, including incident, natural event, infrastructure, and operation, to represent man-made incidents, natural disasters, affiliated infrastructures, and emergency facilities, respectively [29,30]. Other researchers have classified the symbol library into three categories according to the disaster category and characteristics, including the geological disaster symbol set, the hydro-meteorological disaster symbol set, and the biological and social disaster symbol set [31]. However, disaster infrastructures, facilities, and operations have not been included. The response situations and emergency decisions are also important information for emergency management and disaster reduction, and they are helpful for appropriate decision-making [32]. For example, the plan for the emergency dispatching of forces and the distribution of supplies should be made with the consideration of existing response situations and decisions. Currently, there is an increasing number of public participants and volunteers joining emergency and rescue services under un-unified command; it is important for them to be aware of the actual situations [33]. Although attachments related to the abovementioned symbol libraries have made great progress, there is still an urgent need to develop a symbol library that can be used to represent response situations and emergency decisions.
The method of construction of map symbols is also a key factor that affects the representation capabilities of dynamic disasters, response situations, and emergency decisions. In previous studies, some point symbols were created using corresponding pictures, such as Scalable Vector Graphics (SVG)—produced pictures [34]. In some GIS software, point symbols can be custom constructed, and associated map symbol editors are convenient for creating various point symbols [35,36]. Some researchers have employed Shader language to build linear map symbols based on the OGC Styled Layer Descriptor (SLD) specifications [37]. Additionally, some existing line symbols and area symbols are constructed by series coordinates and are then directly drawn on the screen [38,39]. The abovementioned methods mainly focus on the representation of symbols and pay less attention to interactive editing during response and decision-making processes. However, the attributes and statuses of disasters, response situations, and decisions are changing dynamically, such as the degree of the disaster, the range of affected areas, the number and distribution of affected people, the status of potential secondary disasters, the evacuation status of affected people, the re-dispatched emergency forces according to real situations, and the level of the emergency [40]. Therefore, a rich interactive map symbol construction method supporting the interactive editing of visual variables [41], which are mainly used to express the different means and attributes of different map symbols, will allow for the dynamic representation of visual variables using one symbol and further contribute to the reduction of redundant symbols and the cost of emergency mapping.
In this article, an interactive map symbol procedural construction method is discussed for mapping dynamic disasters, and emergency response situations and decisions. The remainder of this article is organized as follows. Section 2 introduces the basic idea of interactive map symbol construction and its framework. Section 3 illustrates the essential construction method of interactive map symbols, while Section 4 provides a description of the strategy of symbol dynamic updating and drawing. Using the Wenchuan earthquake and the related emergency process as a case study, Section 5 describes an experiment that shows the capacity of the produced interactive map symbols and their contribution to mapping efficiency and representation capability.

2. Basic Idea of Interactive Map Symbol Construction

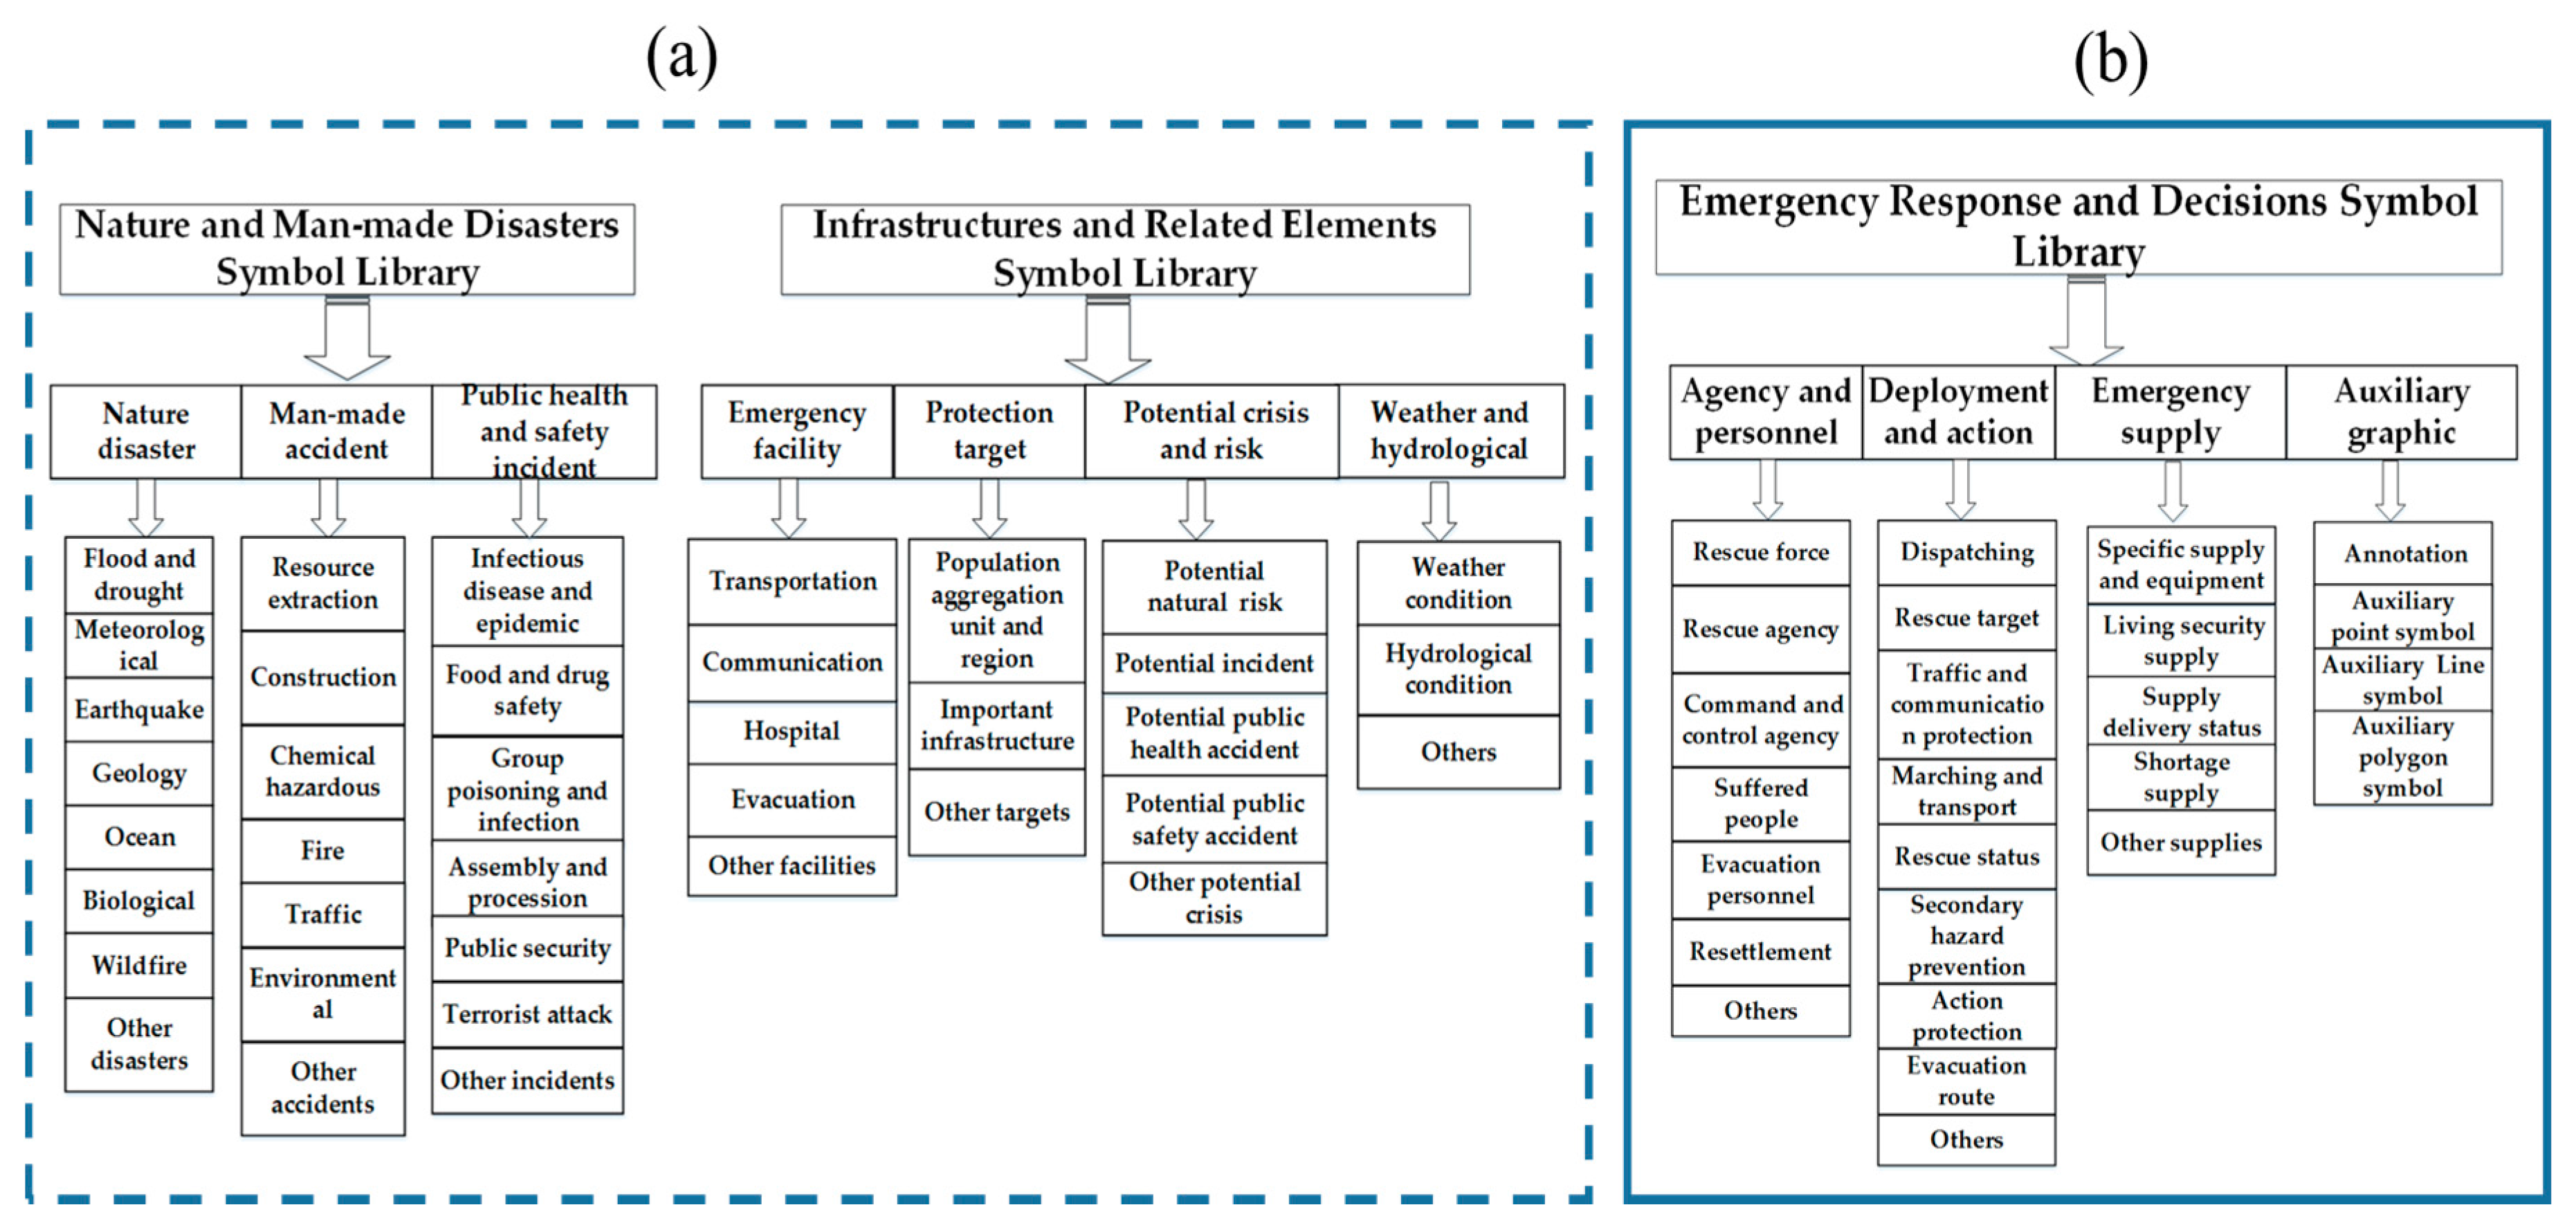
2.1. Classification of Emergency Map Symbol Libraries

Disaster and emergency mapping often uses digital maps or satellite images as the background and symbols to represent disasters, emergency situations, and decisions. The content of symbol libraries is the foundation of emergency mapping. It is important to design comprehensive and reasonable symbol libraries, used to represent both disaster and emergency responses. The disaster-oriented symbol libraries are used to aid the understanding of the attributes and characteristics of a disaster, and to support disaster assessment, decision-making, work, etc. Also the representation of emergency decisions, existing response situations, dispatch, and command are key factors in efficient and effective emergency management. Therefore, in this article, the symbol library contains two parts: the disaster and related libraries, and the emergency response and decisions library. The classification of disaster and related libraries is summarized from existing related research, and the proposed emergency response and decisions symbol library is based on the discussions and analysis of actual emergency management work.

2.1.1. Disaster and Related Map Symbol Libraries

Disasters can be divided into three components: disaster-inducing factors, disaster-bearing bodies, and the disaster pregnant environment [42,43]. Disaster-inducing factors are extreme events that have serious effects on human life, property, or activities in a natural or artificial environment, such as storms, floods, earthquakes, landslides, serious traffic accidents, and epidemics. Disaster-bearing bodies are the human and social subjects affected by the disaster and damage, such as human life, educational facilities, industrial facilities, emergency facilities, and life service facilities. The disaster pregnant environment is comprised of high-risk areas, including objects or factors such as landslide vulnerability areas, dangerous chemical plants, and abnormal weather and hydrological conditions, which are potential risk sources. The disaster and related element libraries were classified based on the aforementioned disaster components.
According to the National Emergency Plan of China, emergency incidents are classified into four categories: natural disasters, man-made disasters, public health incidents, and social security incidents. Some researchers have classified natural hazards and disasters by categories [30], including geological (e.g., earthquake, volcanic eruption, landslide, erosion), hydro-meteorological (e.g., hurricane, tornado, storm), and biological and social (e.g., famine, pestilence, fire, oil spills, explosion). Some researchers have free classified the Canadian and American emergency management map symbols into four categories, namely, Incident for man-made disasters, Natural Event for natural disasters, Infrastructures, and Operations for public sites and emergency facilities [24,29]. According to these research achievements, the existing symbol classifications and corresponding libraries are expressed in Figure 1a. The Natural and Man-made Disasters Symbol Library has three sub-sets, named natural disaster, man-made accident, and public health and safety incident. These designations help to understand and describe the causes of disasters and accidents, and the corresponding symbols were used to represent the disaster-inducing factors. The Infrastructures and Related Elements Symbol Library can be divided into four subsets, including emergency facility, protection target, potential crisis and risk, and weather and hydrological. This library increases the awareness of available facilities, key protection targets, potential crises, and weather and hydrological conditions. These categories represent the basic information for decision-making and emergency rescue efforts, and the corresponding symbols were used to represent the disaster-bearing bodies and disaster pregnant environment.

2.1.2. Emergency Response and Decisions Symbol Library

For representing emergency situations and decisions, this article proposes an additional Emergency Response and Decisions Symbol Library. The basic process of emergency response and decision-making usually includes disaster analysis, emergency agencies and personnel information acquisition, deployment and action planning, emergency supply, and resettlement. This symbol library is based on these basic emergency response processes. The emergency response and decisions symbol library includes four subsets: an agency and personnel symbol set, a deployment and action symbol set, an emergency supply symbol set, and an auxiliary graphic symbol set. The agency and personnel symbol set represents rescue forces and agencies, command and control agencies, affected and evacuated people, and resettlement status. The deployment and action symbol set is used to represent the dispatch, movement, and transportation status of rescue forces, the rescue targets of affiliated tasks, and the protection action of traffic and communication, etc. The emergency supply symbol set is used to represent the detailed shortage of supplies in disaster areas, and the supply progress. The auxiliary graphic symbol set is prepared for the representation of other emergency statuses and objects that were not included in existing symbol sets. The additional Emergency Response and Decisions Symbol Library is expressed in Figure 1b, and these symbols can be created through a combination of basic graphics and annotation.
Moreover, each symbol set may contain many different symbols. For example, the advancing and transportation symbol set belongs to the Deployment and action parent category. This set includes symbols to represent advancing and transportation on foot, and by motorcycle, boat, automobile, train, airplane, and helicopter. The symbols are designed to be visually intuitive, so that the user can easily understand the meaning of the symbol, especially in urgent and complicated emergency environments. The weather symbols belonged to the Weather Condition symbol set in the Infrastructures and Related Elements symbol library. Example symbols are shown in Figure 2.

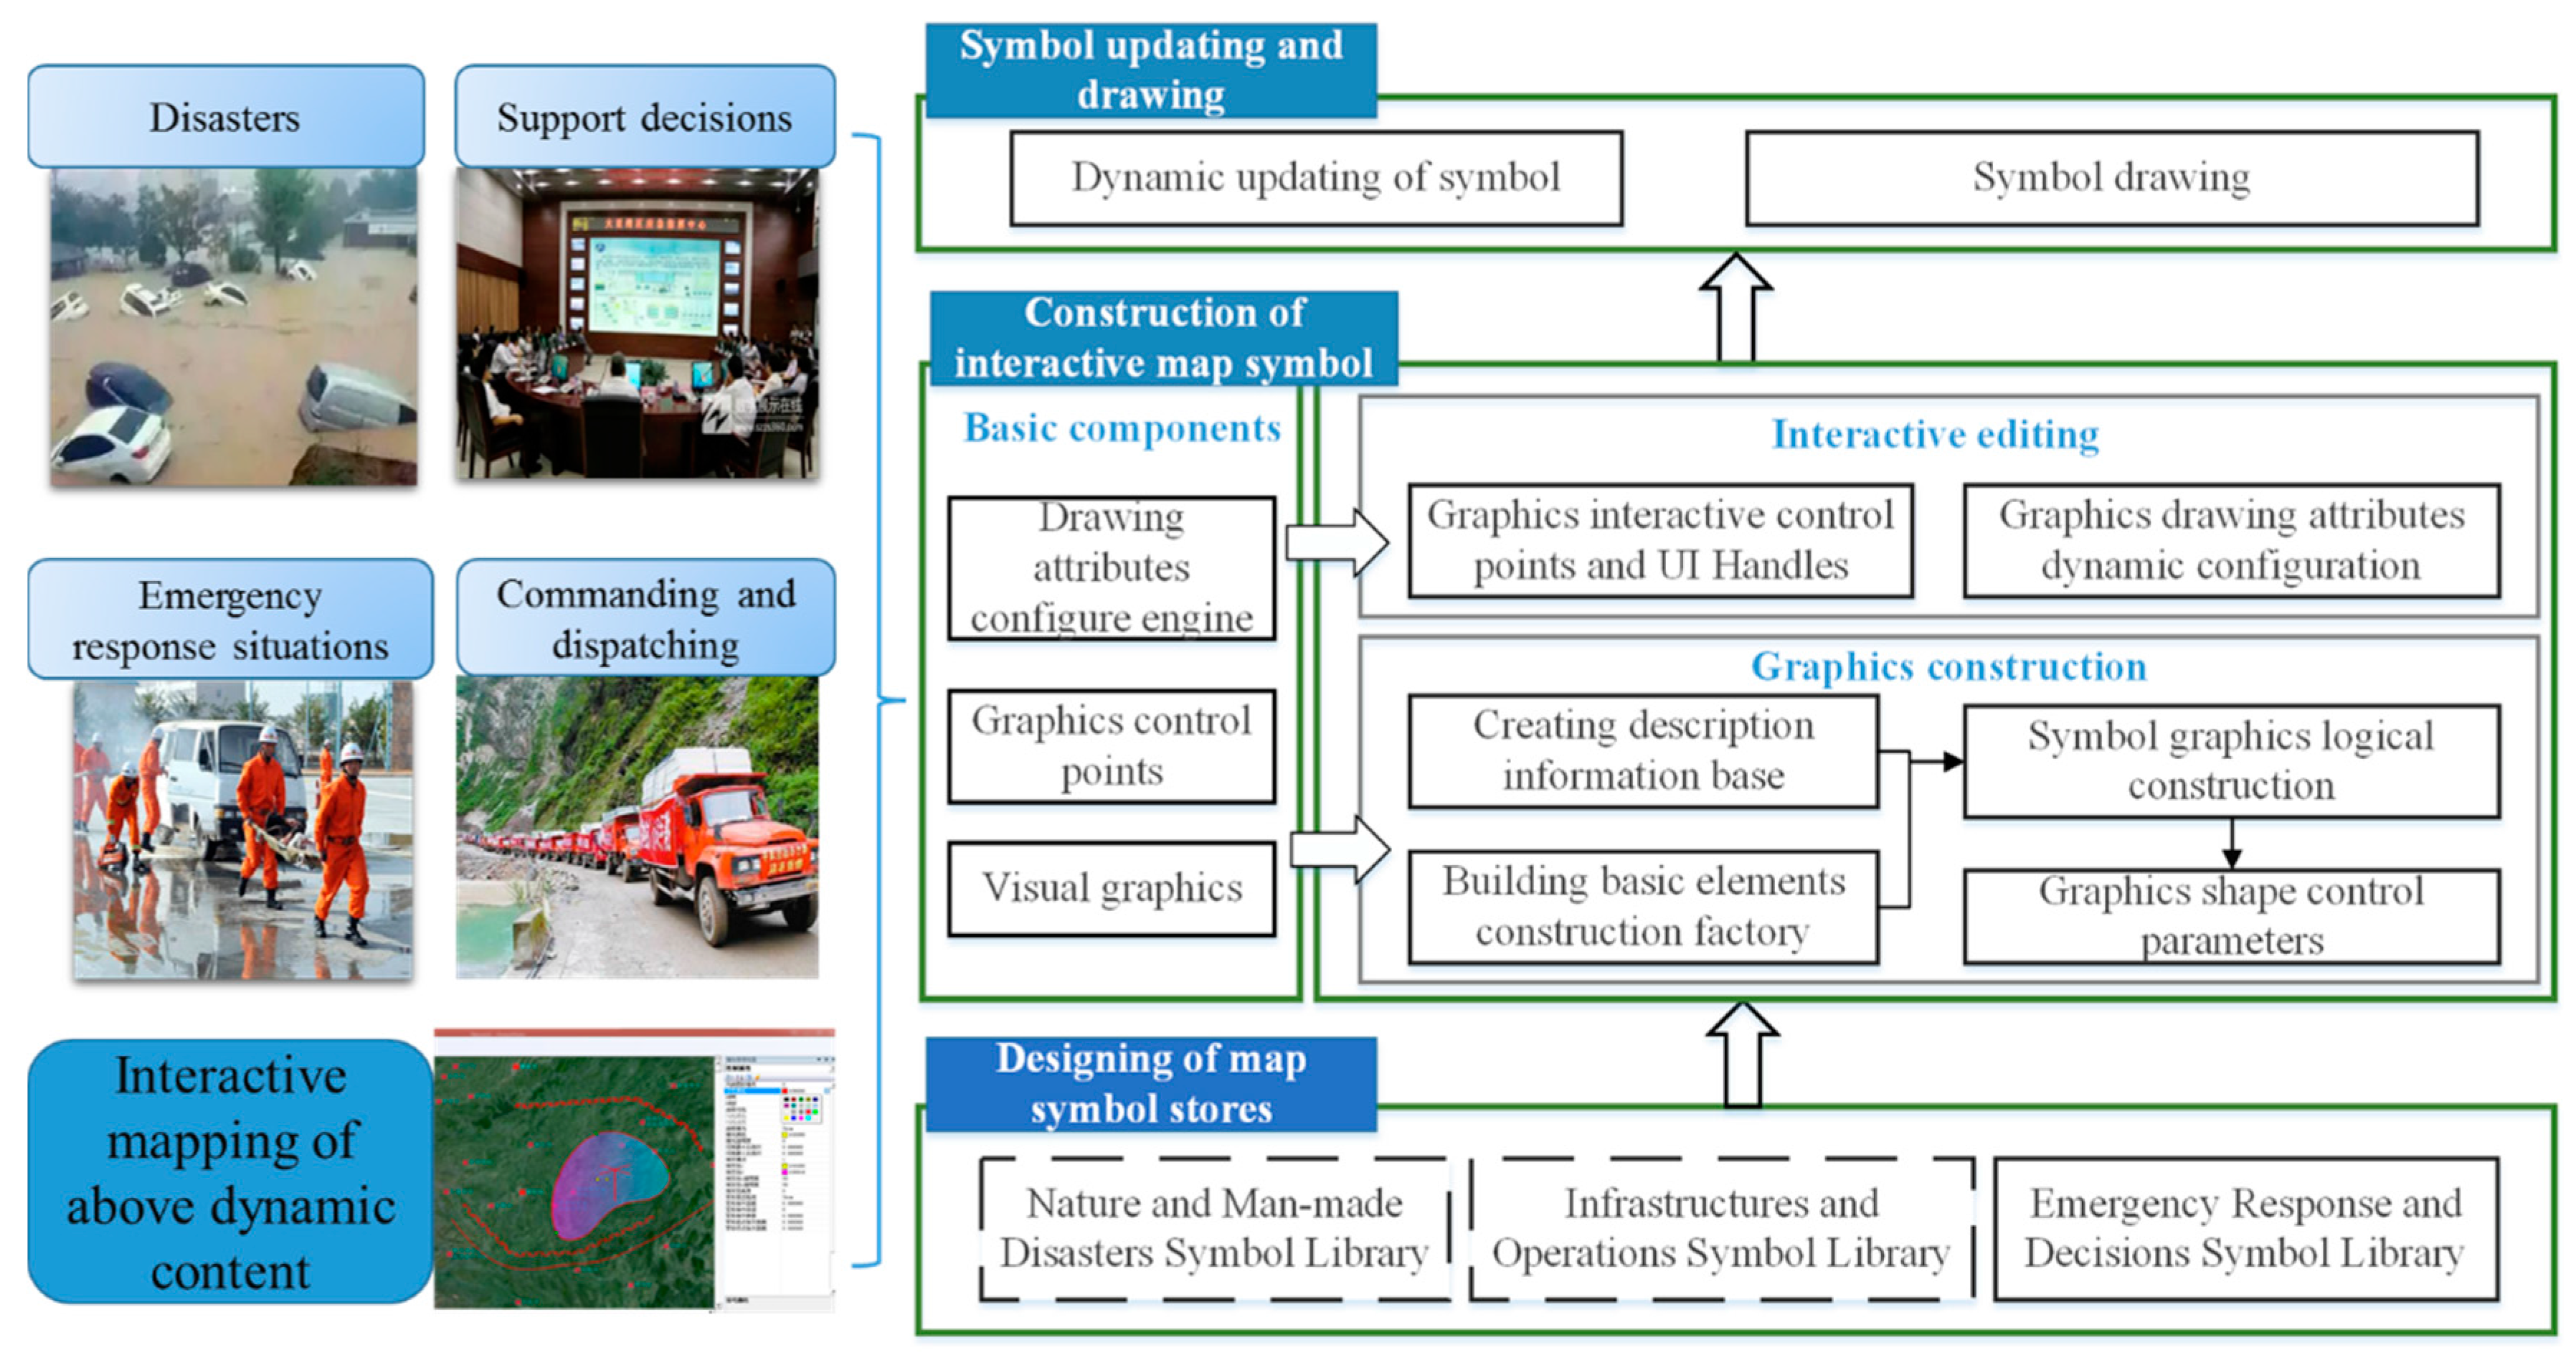
2.2. Framework of Interactive Map Symbol Construction Method

Disaster and emergency responses evolve in dynamically changing environments [44]. Typically, there is a need for a variety of prepared map symbols to represent, for instance, the different attributes, status, positions, and coverage area. However, current representational methods lack a convenient interactive mapping approach. Additionally, based on the thematic disaster map making approach, symbol editing usually affects the entire map layer, but disaster mapping and emergency response efforts are usually heterogeneous and diversified, so each mapped symbol has a specific meaning. To support the independent interactive mapping of each map symbol, the map symbol should contain a corresponding editing procedural logic. The procedure must allow the creation of symbols with different attributes and shapes to represent different meanings. The attributes setting and the shape parameter should have independent modes. The attributes are typically controlled by configuration parameters, whereas changes to the shapes usually involve editing the vertex of the graphics. This design is more consistent with people’s habits and expectations. Therefore, the interactive editing procedural logic should include two independent parts: a drawing attributes setting and a graphics editing capability.
Based on the analysed demands of disasters and emergency response mapping, the framework of the proposed interactive map symbol construction method focuses on mapping dynamic disasters and emergency responses, as shown in Figure 3. The framework includes designing the map symbol libraries, constructing interactive symbols, and updating and drawing symbols. First, for a comprehensive mapping of disasters and emergency responses, the three symbol libraries discussed in the previous section should be designed. Second, to construct an interactive symbol, three basic components need to be considered: the visual graphics used to represent the content of the map symbol, the graphics control points used to support the interactive editing of the geometric structure of the graphics (e.g., shape and location), and the drawing attributes editor used to support the interactive modification of the attributes of the graphics (e.g., colour, fill type and line type). Using these three components, complex symbols can be drawn and interactively edited. Third, the strategy of symbol updating and drawing is designed, to satisfy the timely changing and redrawing of symbols based on real-time editing and configuration. For the map symbol to be implemented on different platforms, the symbol drawing layer is separated from the construction layer, so that the symbol drawing interface can be freely implemented by different technical drawing APIs. Based on the proposed framework, the symbols for the representation of disasters and emergency responses can be effectively and conveniently constructed, edited, drawn, and refreshed.

3. Construction of Interactive Map Symbols

The construction of interactive map symbols includes creating visual graphics, generating graphics control points, and designing the attribute editor. To realize these functions, the symbol procedural class CCartoSymbol, which is designed to create symbols, contains three members named CCartoGraphics, CCartoUiHandle, and CCartoAttribute, which are used to implement the construction of the symbol graphics, the interactive editing of the graphic shapes, and the interactive editing of the graphic drawing attributes, respectively. Figure 4 shows the class diagram of the interactive symbols.
Normally, the construction of graphics is based on source points and construction methods. The source points contain geographical coordinates that can be used to describe the basic skeleton of the graphics, and construction methods help generate the complete graphics with specific shapes, sizes, and contents. The class CCartoGraphics is designed as a base class for all types of symbol graphics. The graphics of point symbols are different from line and area symbols; there is only one source point in a point symbol, but multiple source points in line and area symbols. A point symbol can be scaled, moved, styled, and otherwise edited as a whole, but line and area symbols can support rich interactive edits on the sub-graphics. For the above reason, two kinds of classes are designed to individually construct point graphics and line (area) graphics. The graphic construction class of a point symbol is defined as CCartoGraphics_Point, and all point graphics are constructed with this class. The basic primitive geometries and constraint semantics of point symbols can be stored in a configuration document and can then be used when constructing the point symbols using detailed shapes and combination rules. In contrast to point graphics, the graphic construction class of line symbols and area symbols is defined as CCartoGraphics_xxx (xxx is the symbol ID), and each symbol is constructed by a specific CCartoGraphics_xxx, because different symbols require different construction algorithms.
To support the flexible editing of the shape and drawing attributes of symbol graphics, the interactive editing process should also be considered to be a key part of graphic construction. The CCartoUiHandle class creates various specific control points, and the user edits the graphic shapes by moving these corresponding control points (the source points would be generated as default control points used to change the basic skeleton of the graphics). The attributes, e.g., colour, line width, and fill type, are managed by a CCartoAttribute class. Before each action, the graphic drawing engine obtains the attribute configuration from CCartoAttribute and then conducts the drawing tasks.

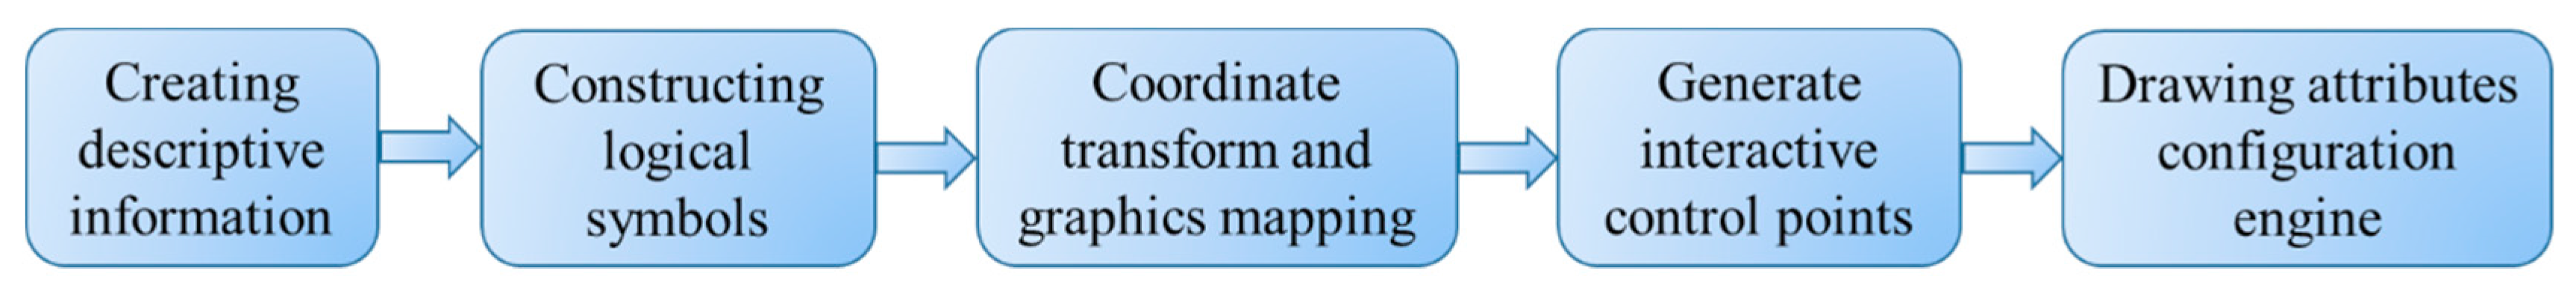
3.1. Construction of Point Symbols

Most point symbols are used to represent natural disasters, man-made incidents, infrastructures, and related elements. The point symbols in this article are implemented based on vector graphics. The point symbols support user editing, such as size change, position change, rotation, and other interactive operations.
The detailed construction processes of point symbols include creating descriptive information (e.g., primitive graphics, constraint semantics), constructing logical symbols, setting coordinate transformation and graphic mapping rules, generating interactive control points, and drawing the attributes editor. Figure 5 shows the process of point symbol construction.

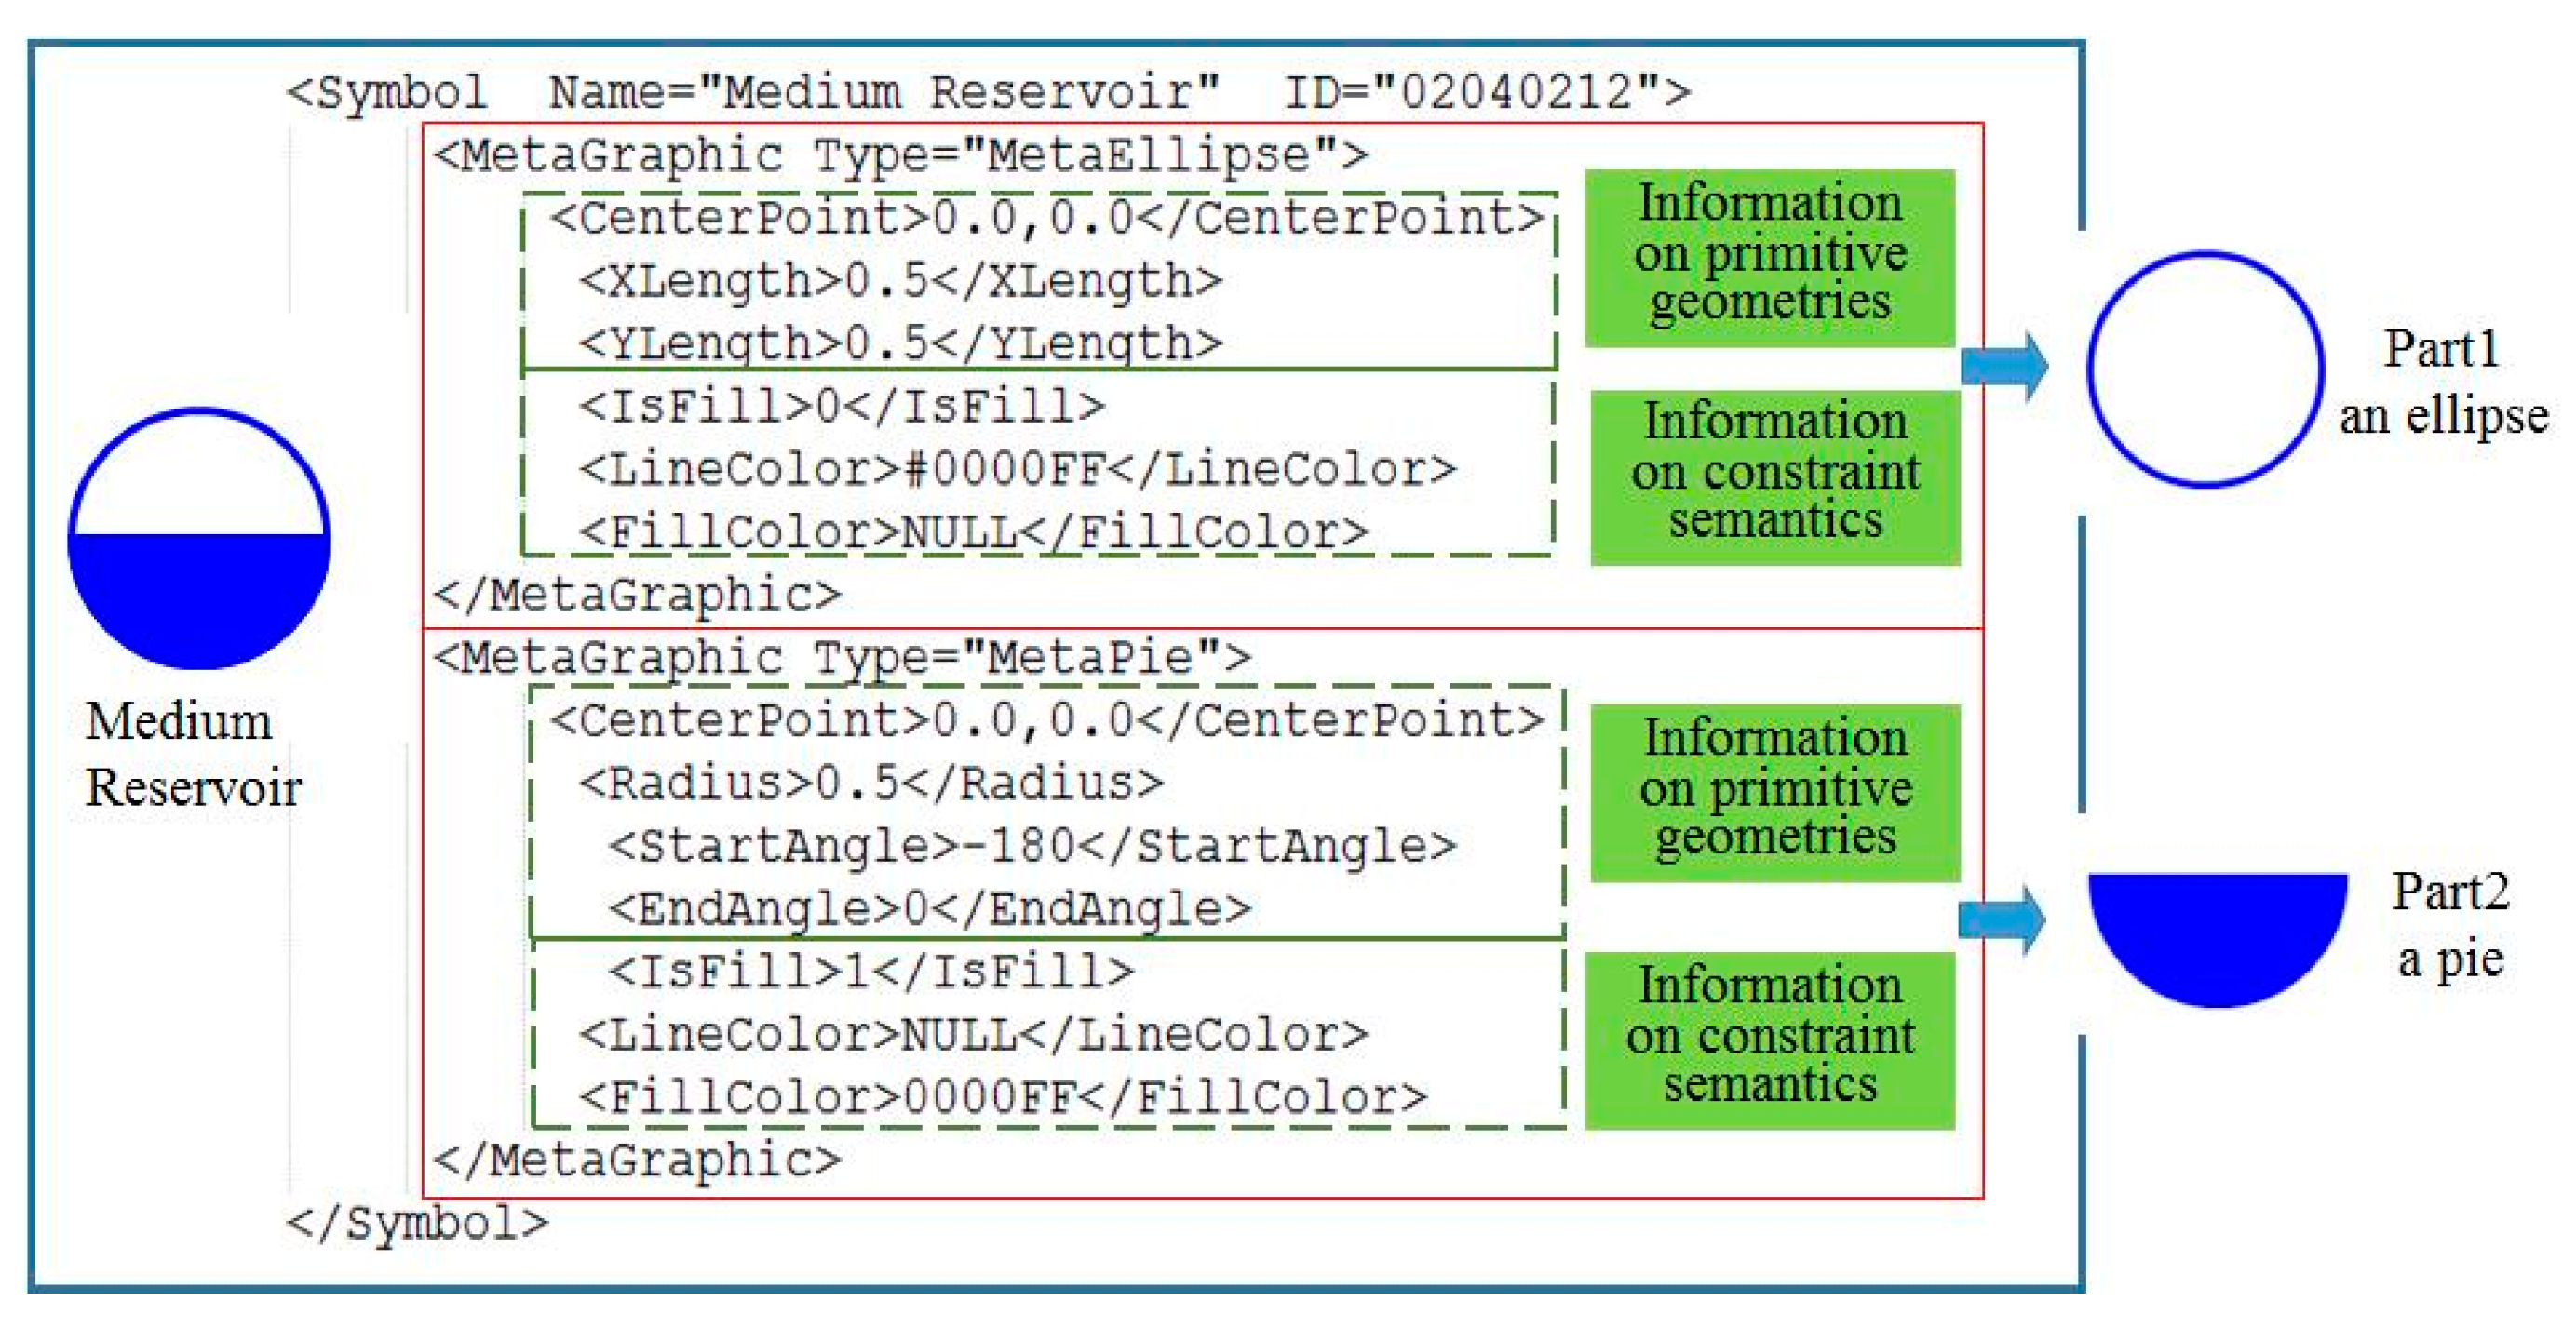
3.1.1. Creating Descriptive Information

The point symbol graphics can be constructed by a combination of primitive geometries, such as a semicircle, a short line, and a triangle. These primitive geometries are generated using pre-defined types and parameters related to features such as relative coordinates and radius lengths. Moreover, constraint semantics are also used to describe the attribute parameters, such as line width, line colour, and fill type. All of this information for a point symbol graphic can be formed and stored in a data file. The existing studies on symbology focus on the description of symbol attributes (such as line width, line type, colour), such as OGC SLD [45] and CartoCSS [46], which are not convenient for implementing the interactive editing. For a more convenient way of implementing interactive editing, a specific design of the description must be conducted, where the coordinates and length parameter have a relative value, because the parameters of the meta graphic are designed to support the graphics and can be dynamically constructed based on the graphic algorithms. The symbol shown in Figure 6 is contained in the Hydrology conditions symbol set, a sub-set of the Meteorology and hydrology symbol set, belonging to the Infrastructures and Related Elements Symbol Library, and is used to represent a medium reservoir. Its description information contains two parts, including an elliptical shape and a pie shape. Every symbol contains a unique ID so that the symbol can be correctly searched for.

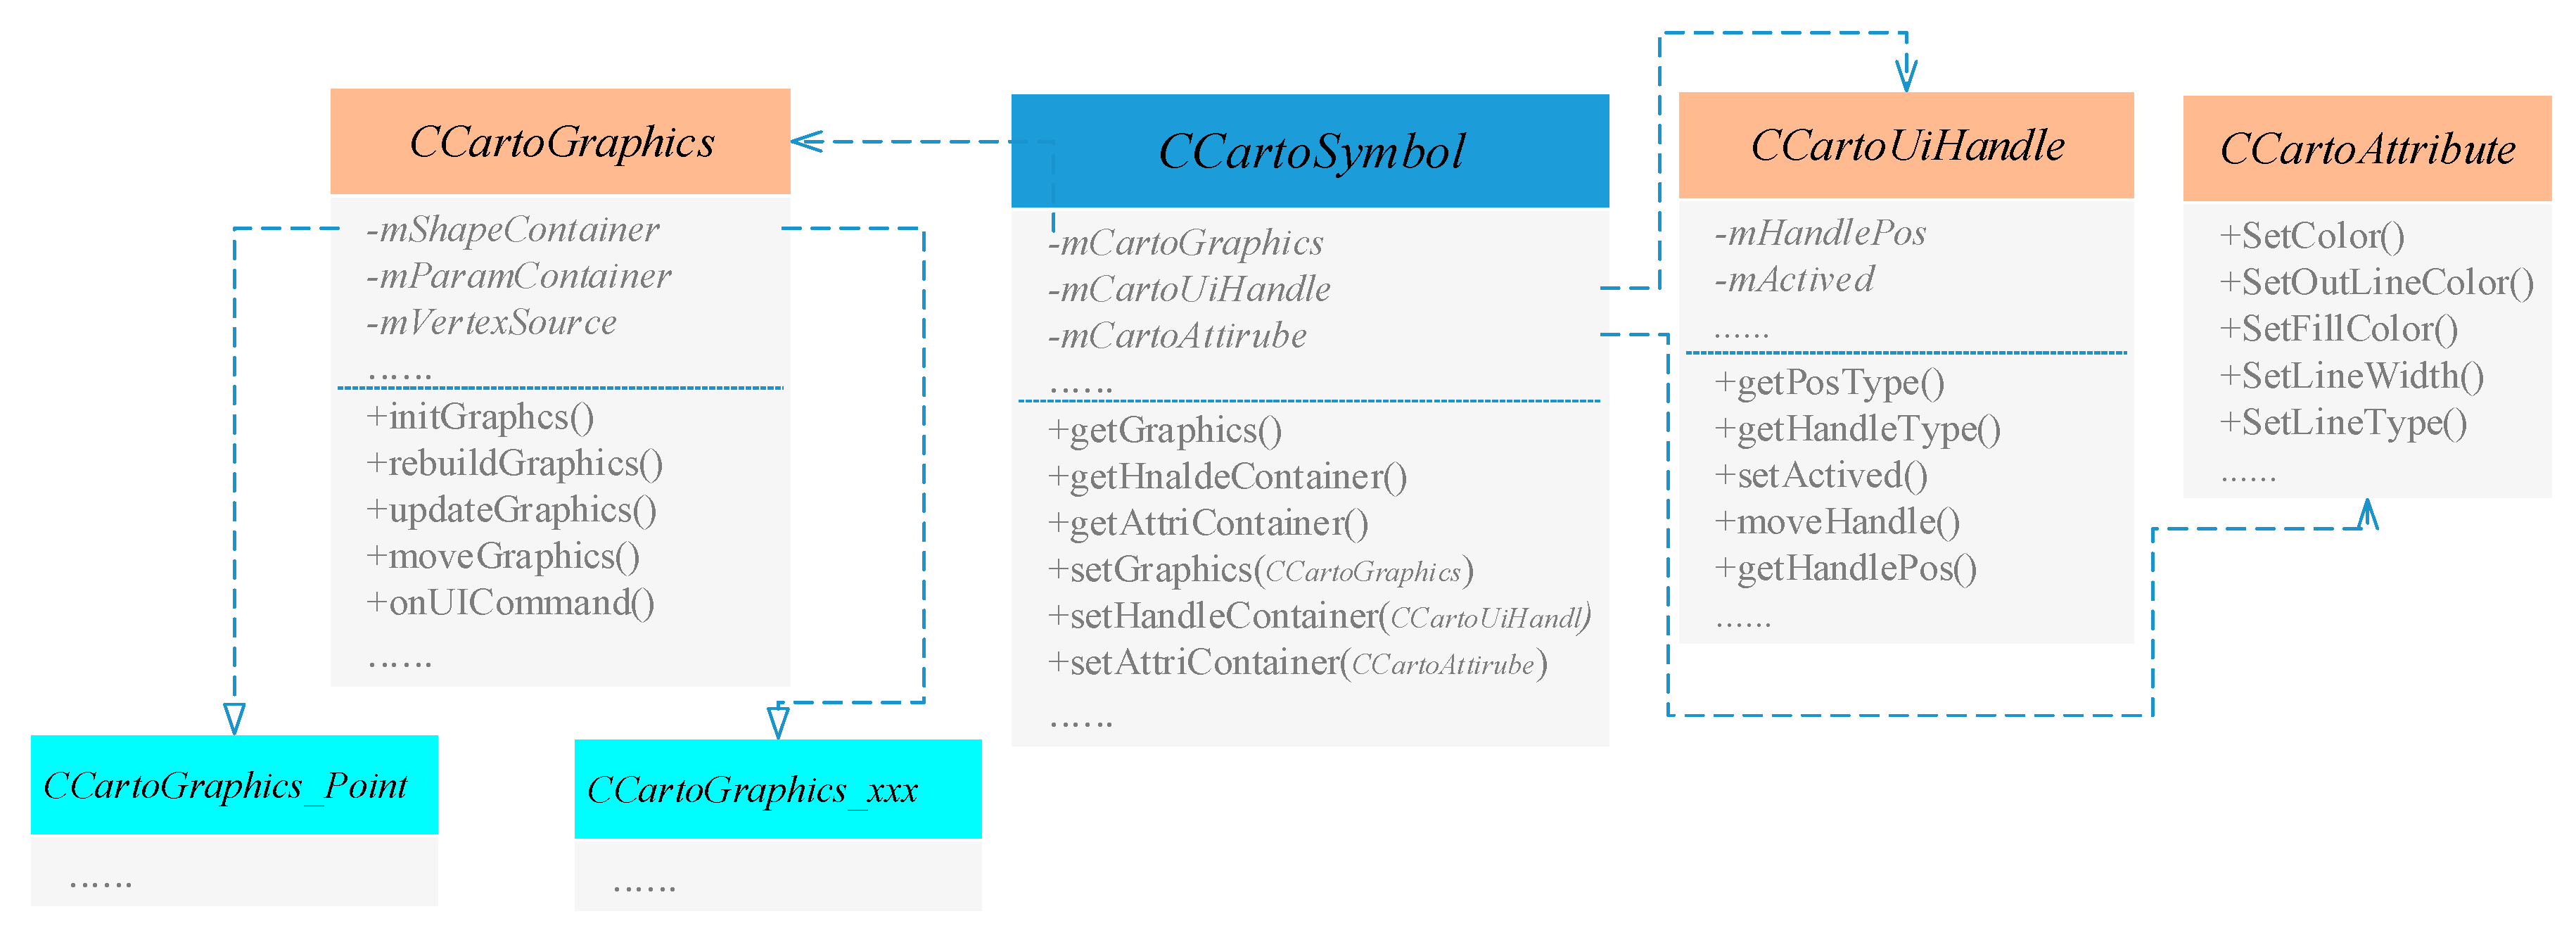
3.1.2. Creating Logical Model of a Point Symbol

To create a logical model for the point symbol, the first step is to parse descriptive information from related files. It is necessary to determine how many MetaGraphic are in one symbol and put these MetaGraphic into a created procedural object named MetaGraphicContainer, which is used to create and manage different MetaGraphic classes. Each MetaGraphic fragment in the descriptive information data file helps create a MetaGraphic class, with the type being defined by the keyword Type in the MetaGraphic node. Each MetaGraphic class contains one source point which is used to mark the location of the setting point used by the mouse or other tools on the map. Following this, the MetaGraphicContainer is moved to the class CCartoGraphics_Point, and a logical model of the point symbol is formed.

3.1.3. Setting Coordinate Transformation and Graphics Mapping Rules

The primitive geometric parameters stored in each MetaGraphic class in the MetaGraphicContainer are relative values (e.g., coordinates and length). Without the steps of coordinate transformation and graphics mapping, symbol graphics cannot be correctly displayed on a map. In this case, the symbol graphics must be given a real geographic location, to form the source point, and a scale of the current map, both of which help to calculate the exact location and shape using the source point, scale, and relative parameters.

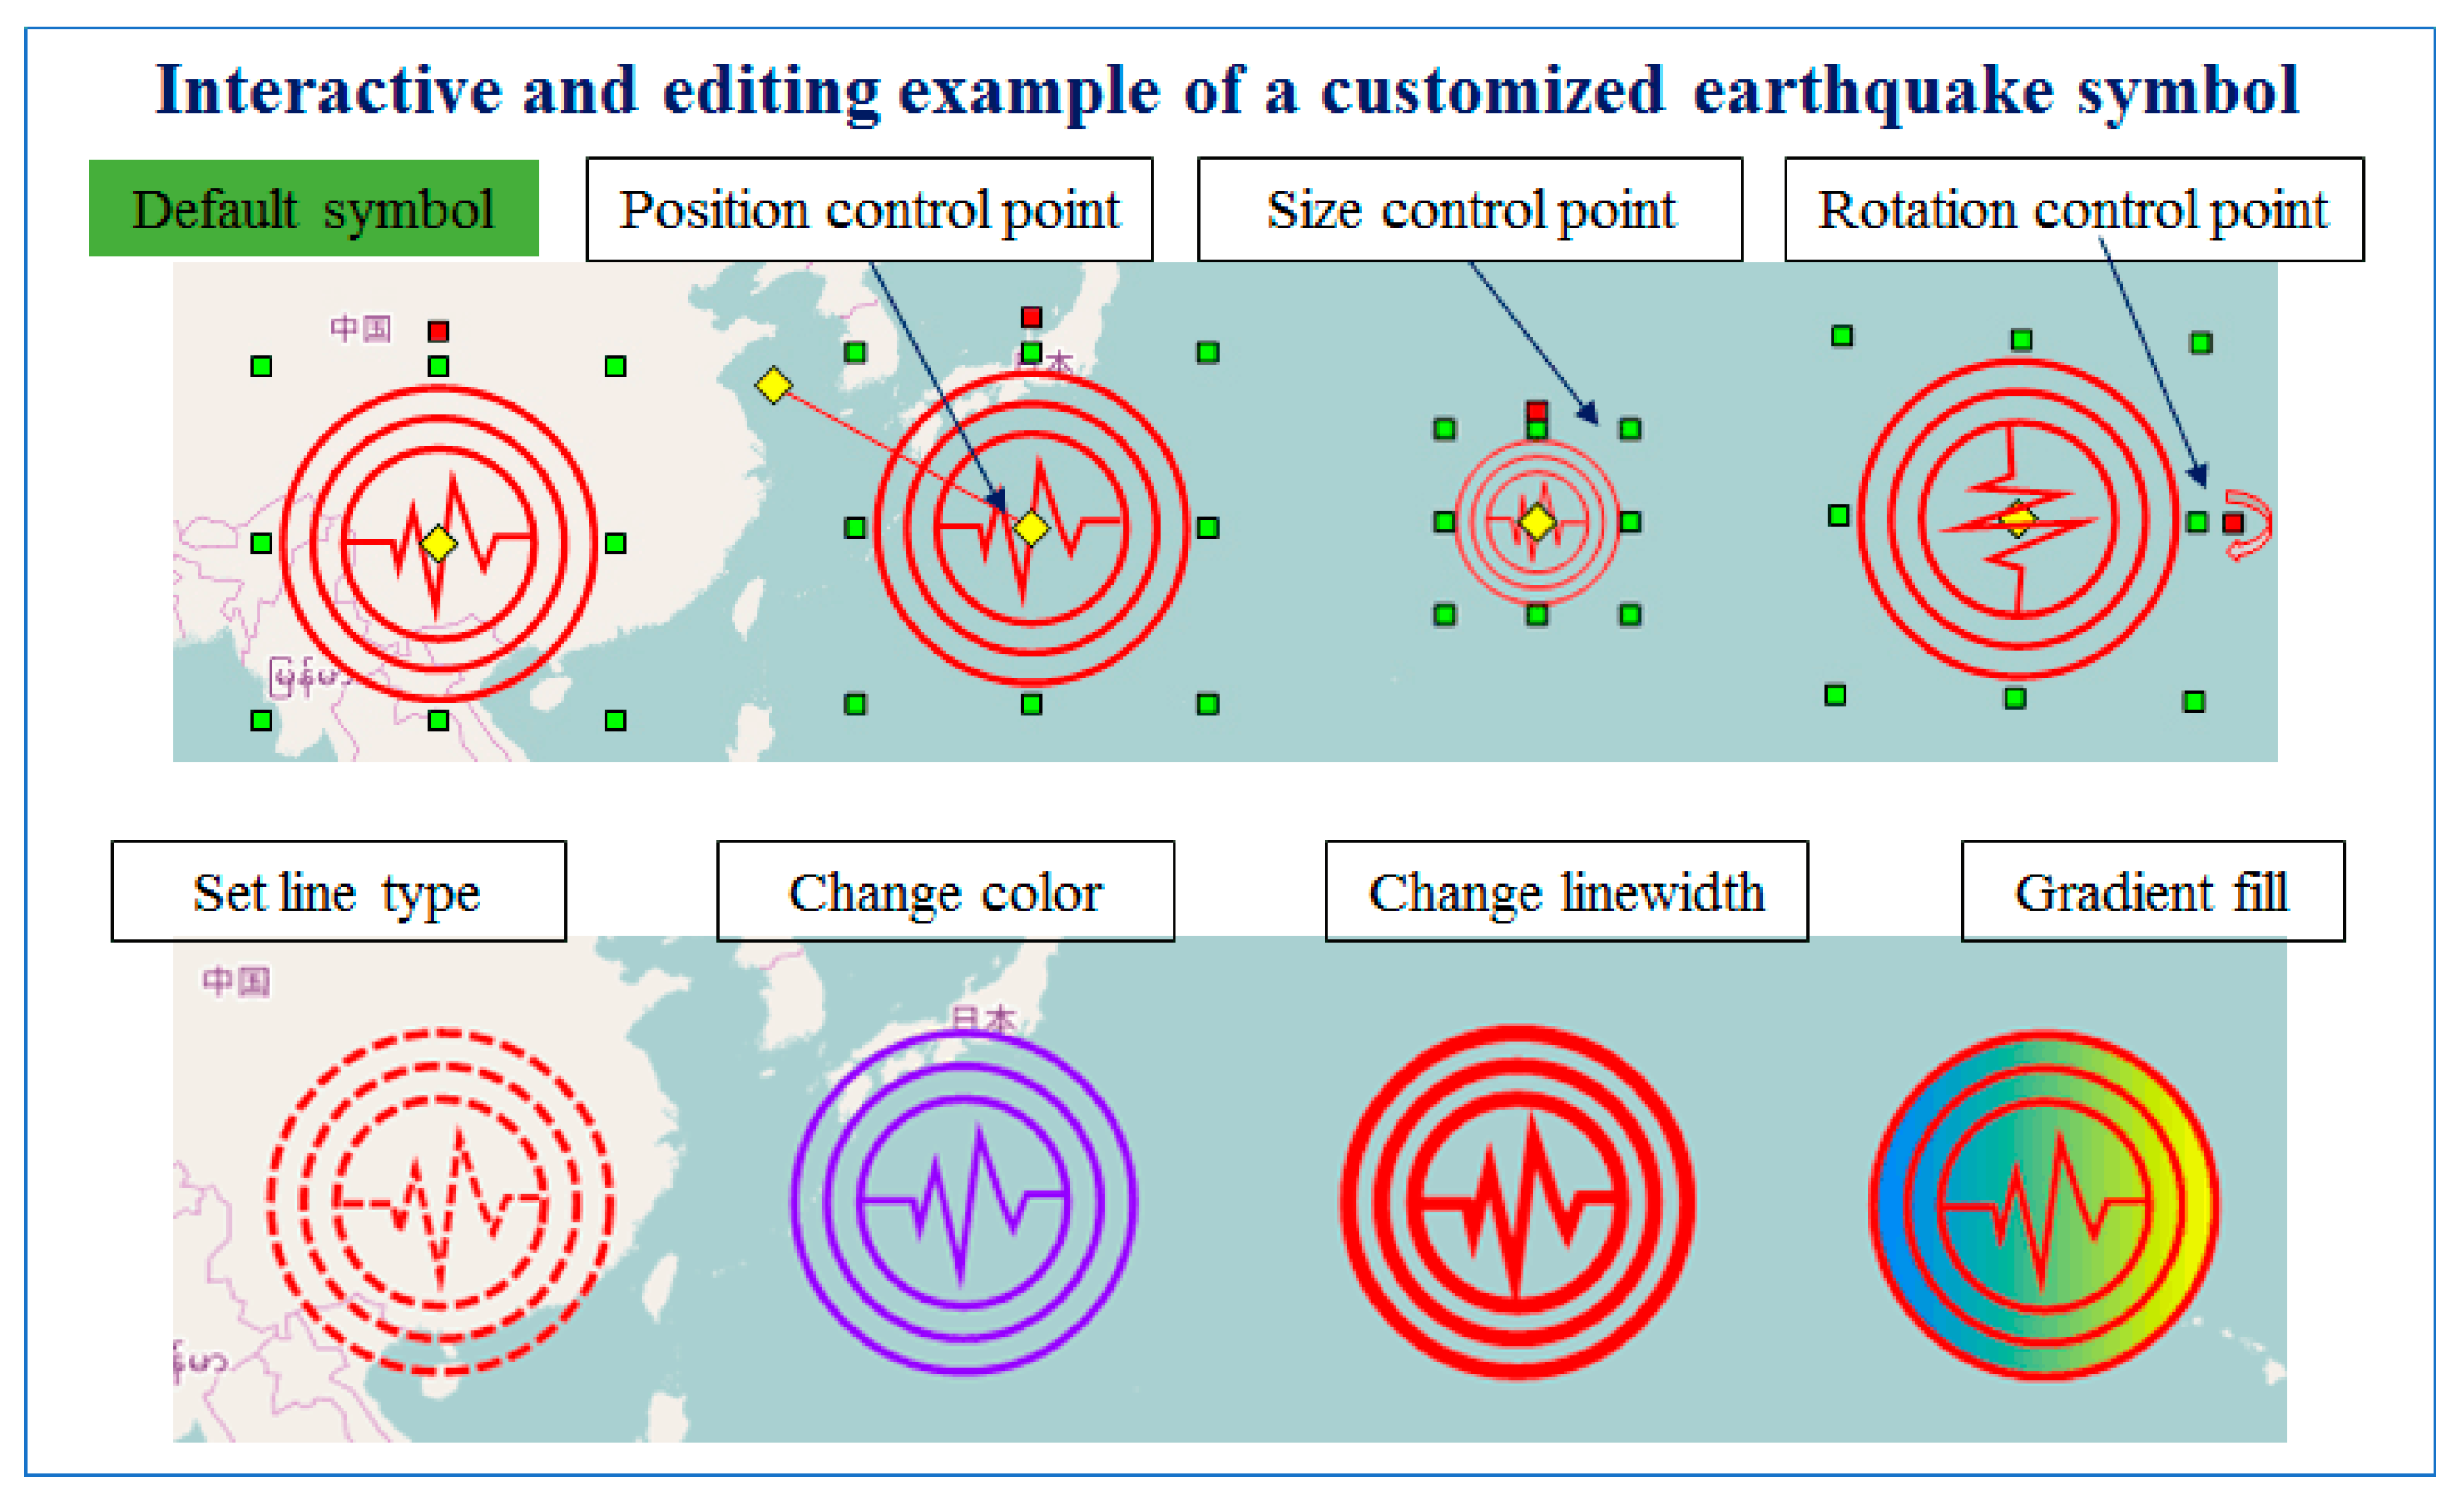
3.1.4. Generate Interactive Control Points and Drawing Attributes Editor

Traditionally, after point symbols are constructed and displayed, it is difficult for them to support rich interactive editing. However, disasters and related features continuously change, making it important for the users to be able to interactively edit symbol graphics and dynamically set drawing attributes. To accomplish this function, the classes named CCartoUiHandle and CCartoAttribute are designed. The CCartoUiHandle class was used to support the rich interactive control of point symbol graphics by creating various specific control points. The CCartoAttribute class helps implement the dynamic settings of the drawing attributes. Each point symbol graphic contains ten control points, including eight size control points that change the size of the graphics in eight directions, one position control point (the same point as the source point) that is used to locate the position of the point graphic, and one rotation control point that is used to rotate the point graphic. The CCartoAttribute class manages the drawing attributes (e.g., colour, line width, fill type) through a designed drawing attributes editor. Before each drawing action, the graphics drawing engine obtains the drawing attributes from the drawing attributes editor and performs each drawing task. Figure 7 shows examples of the point symbol interactive controls and attribute settings.

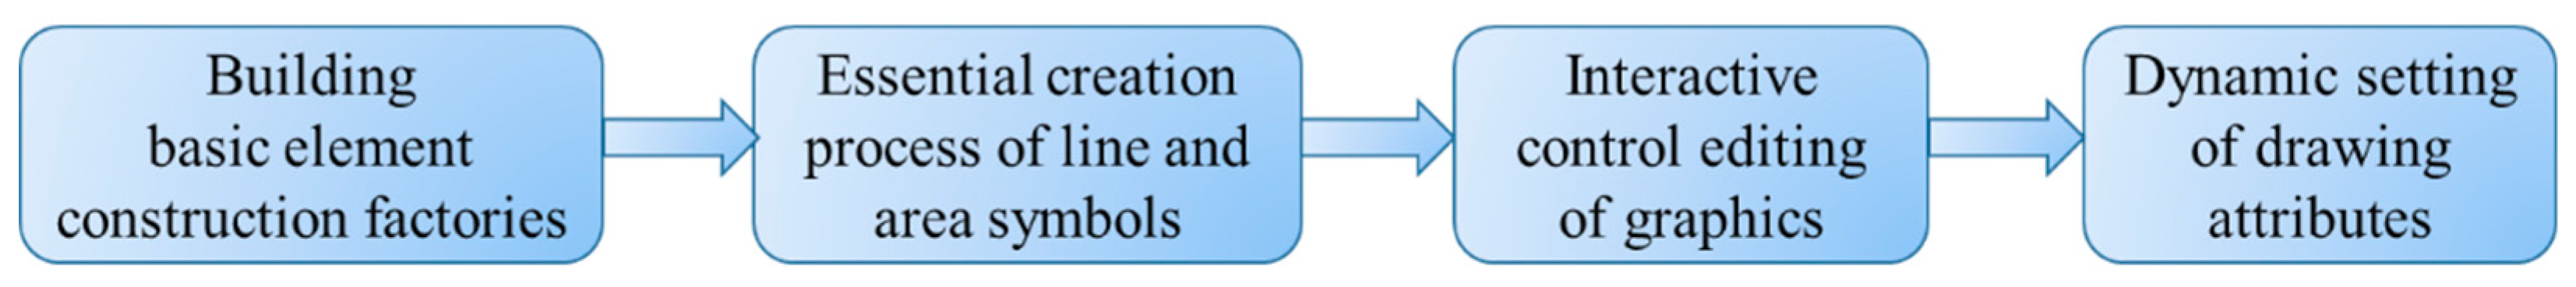
3.2. Construction of Line Symbols and Area Symbols

It is evident that line and area symbols play important roles in the representation of response situations and decisions, such as the distribution of affected people, the transportation route of supplies, and the areas of disasters. Similarly, emergency response situations and decisions are dynamic; therefore, line symbols and area symbols should also support interactive editing and timely refreshing. The construction of line symbols and area symbols is based on the procedural graphics algorithm, and each symbol requires a different procedural graphics algorithm. According to this idea, each line and area symbol is created using an independent implementation class, which is named CCartoGraphics_xxx (xxx is the symbol ID). The basic process of the construction of line and area symbols is shown in Figure 8.

3.2.1. Building Basic Element Construction Factories

The basic element construction factories for line and area symbols provided the basic elements to support the construction of complex graphics and rich interactive map symbols. These construction factories include a source point construction factory, a graphic control parameter construction factory, and a primitive geometry construction factory. The source point construction factory is used to create, store, and manage source points. For line and area symbols, all of their source points are set through interactive inputs by users. The graphic control parameter construction factory creates graphic control parameters that help to dynamically reshape and change symbol shapes (e.g., zoom in and zoom out). The primitive geometry construction factory provides primitive geometries (e.g., a line and a curve) to represent the symbol graphics. The class diagram for these three factories is shown in Figure 9, and Figure 10 shows how the control parameter works for the construction of a line symbol.

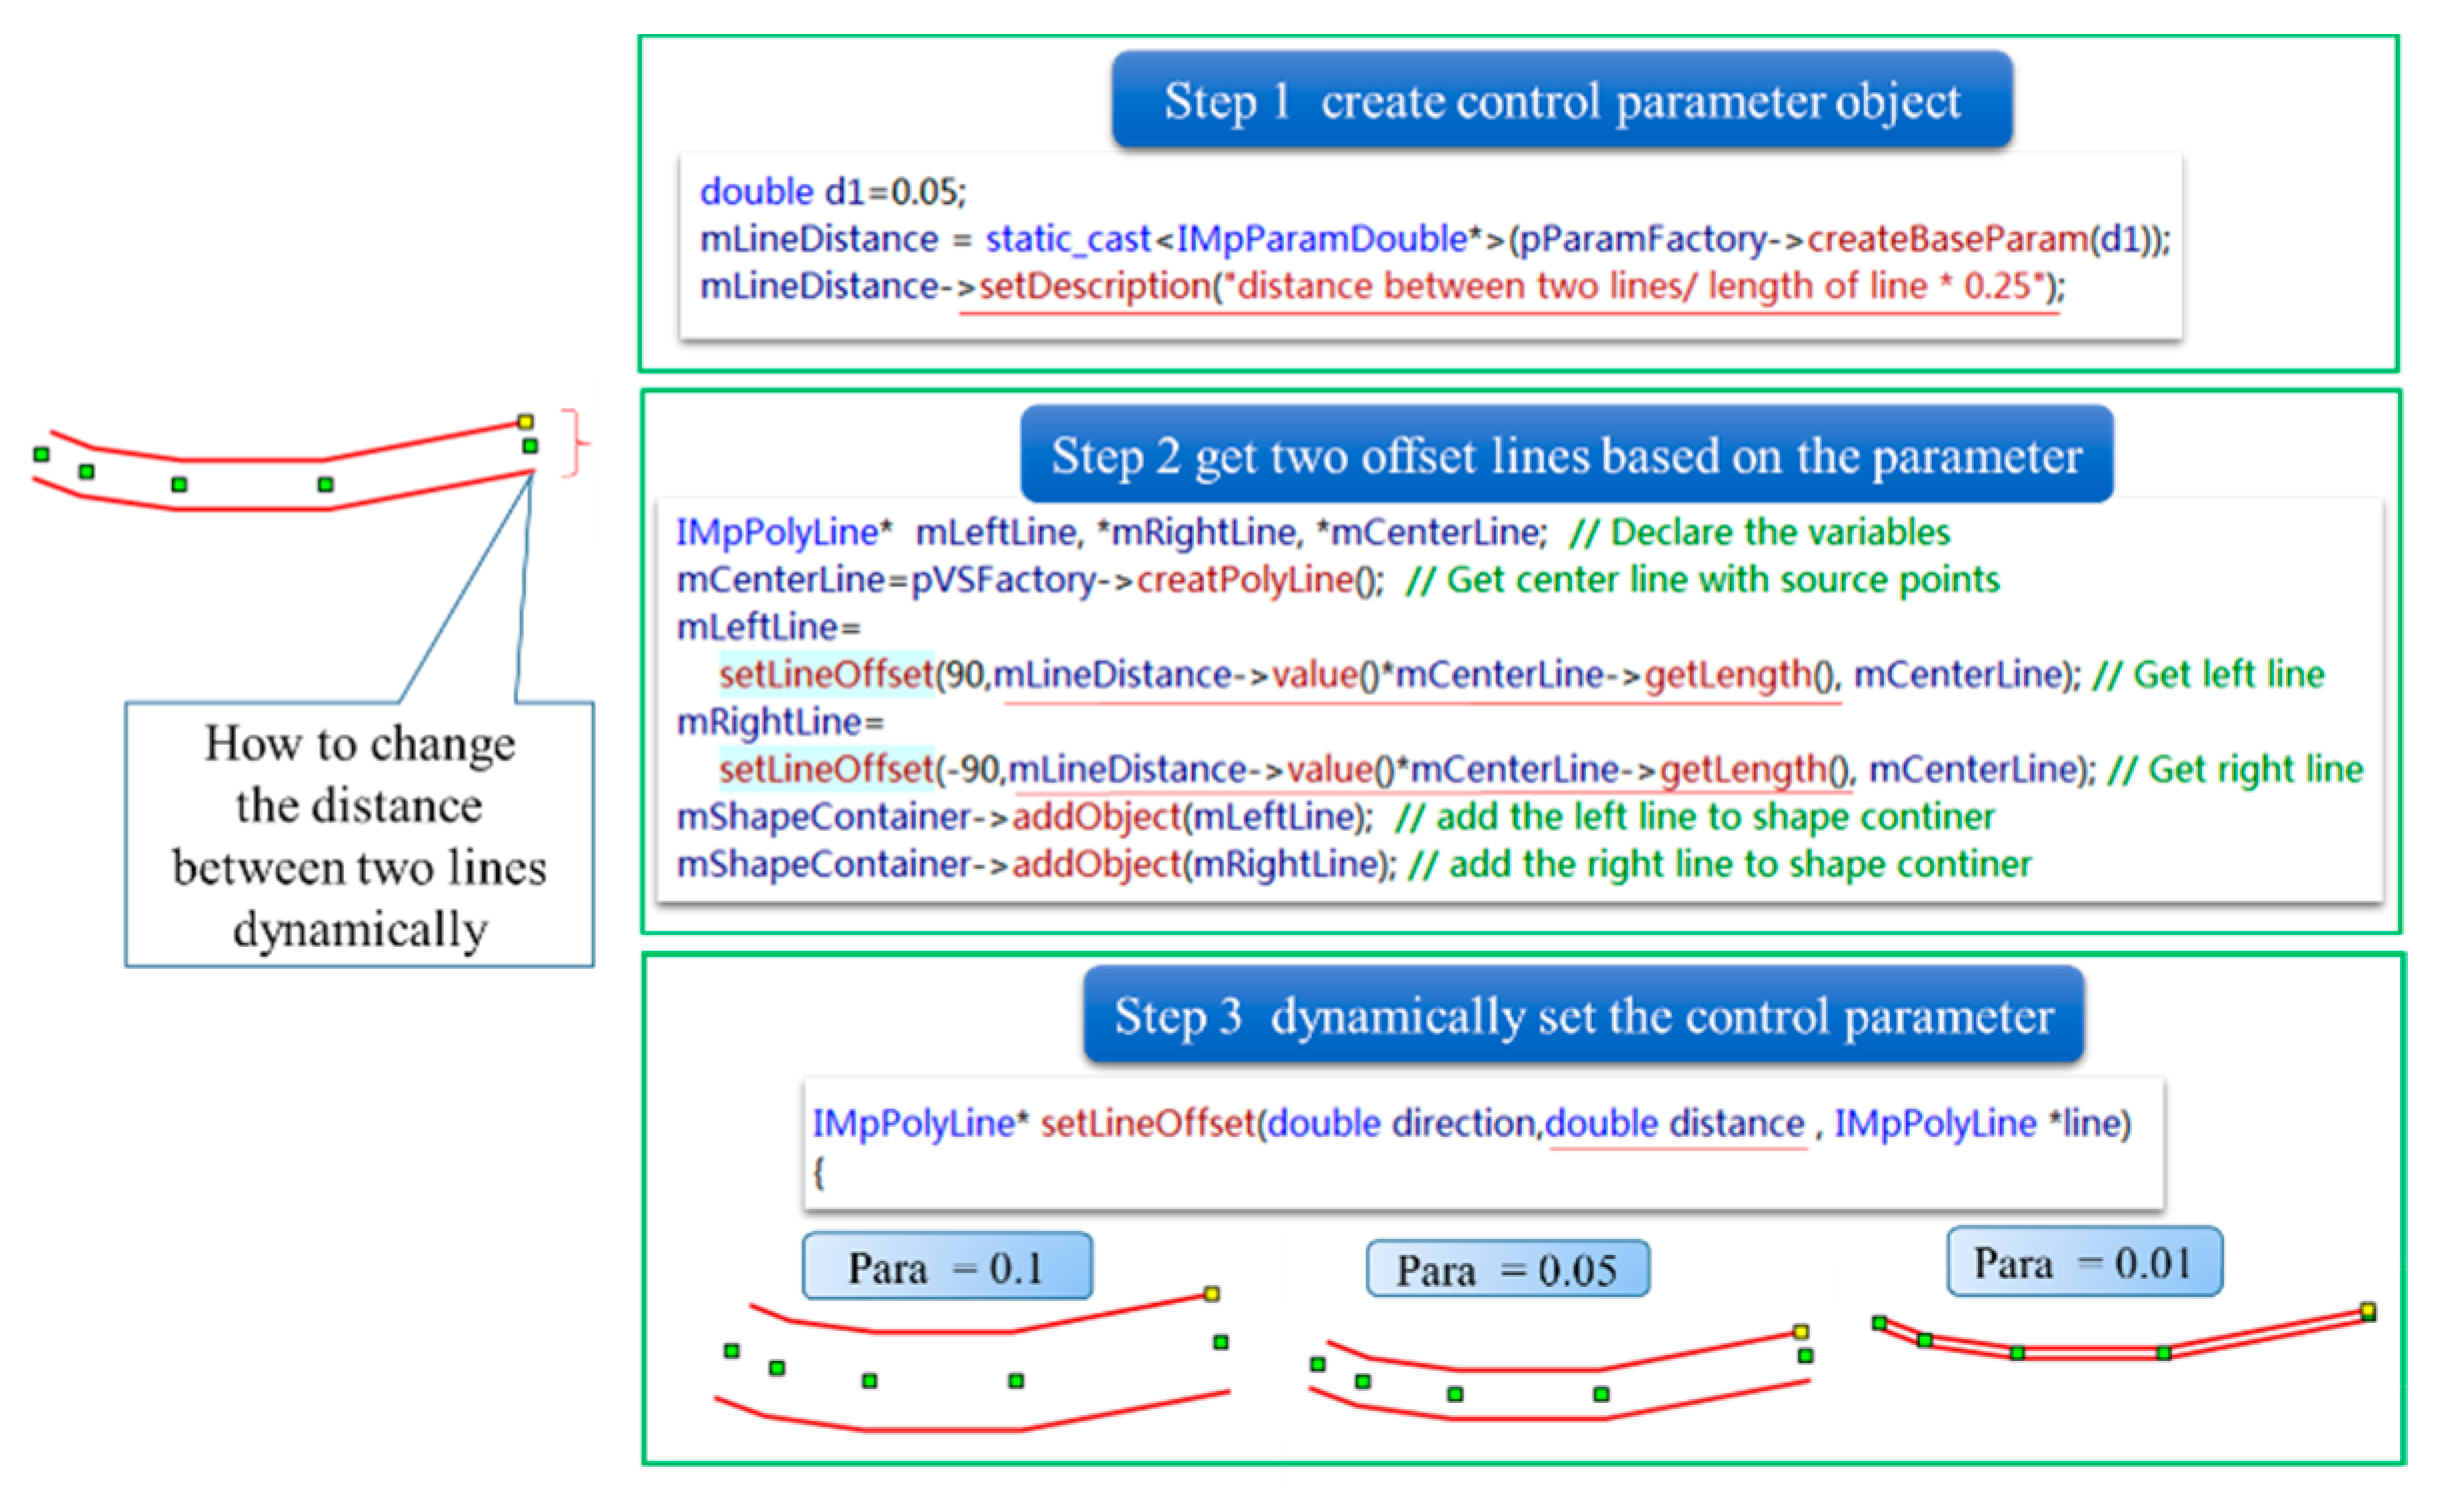
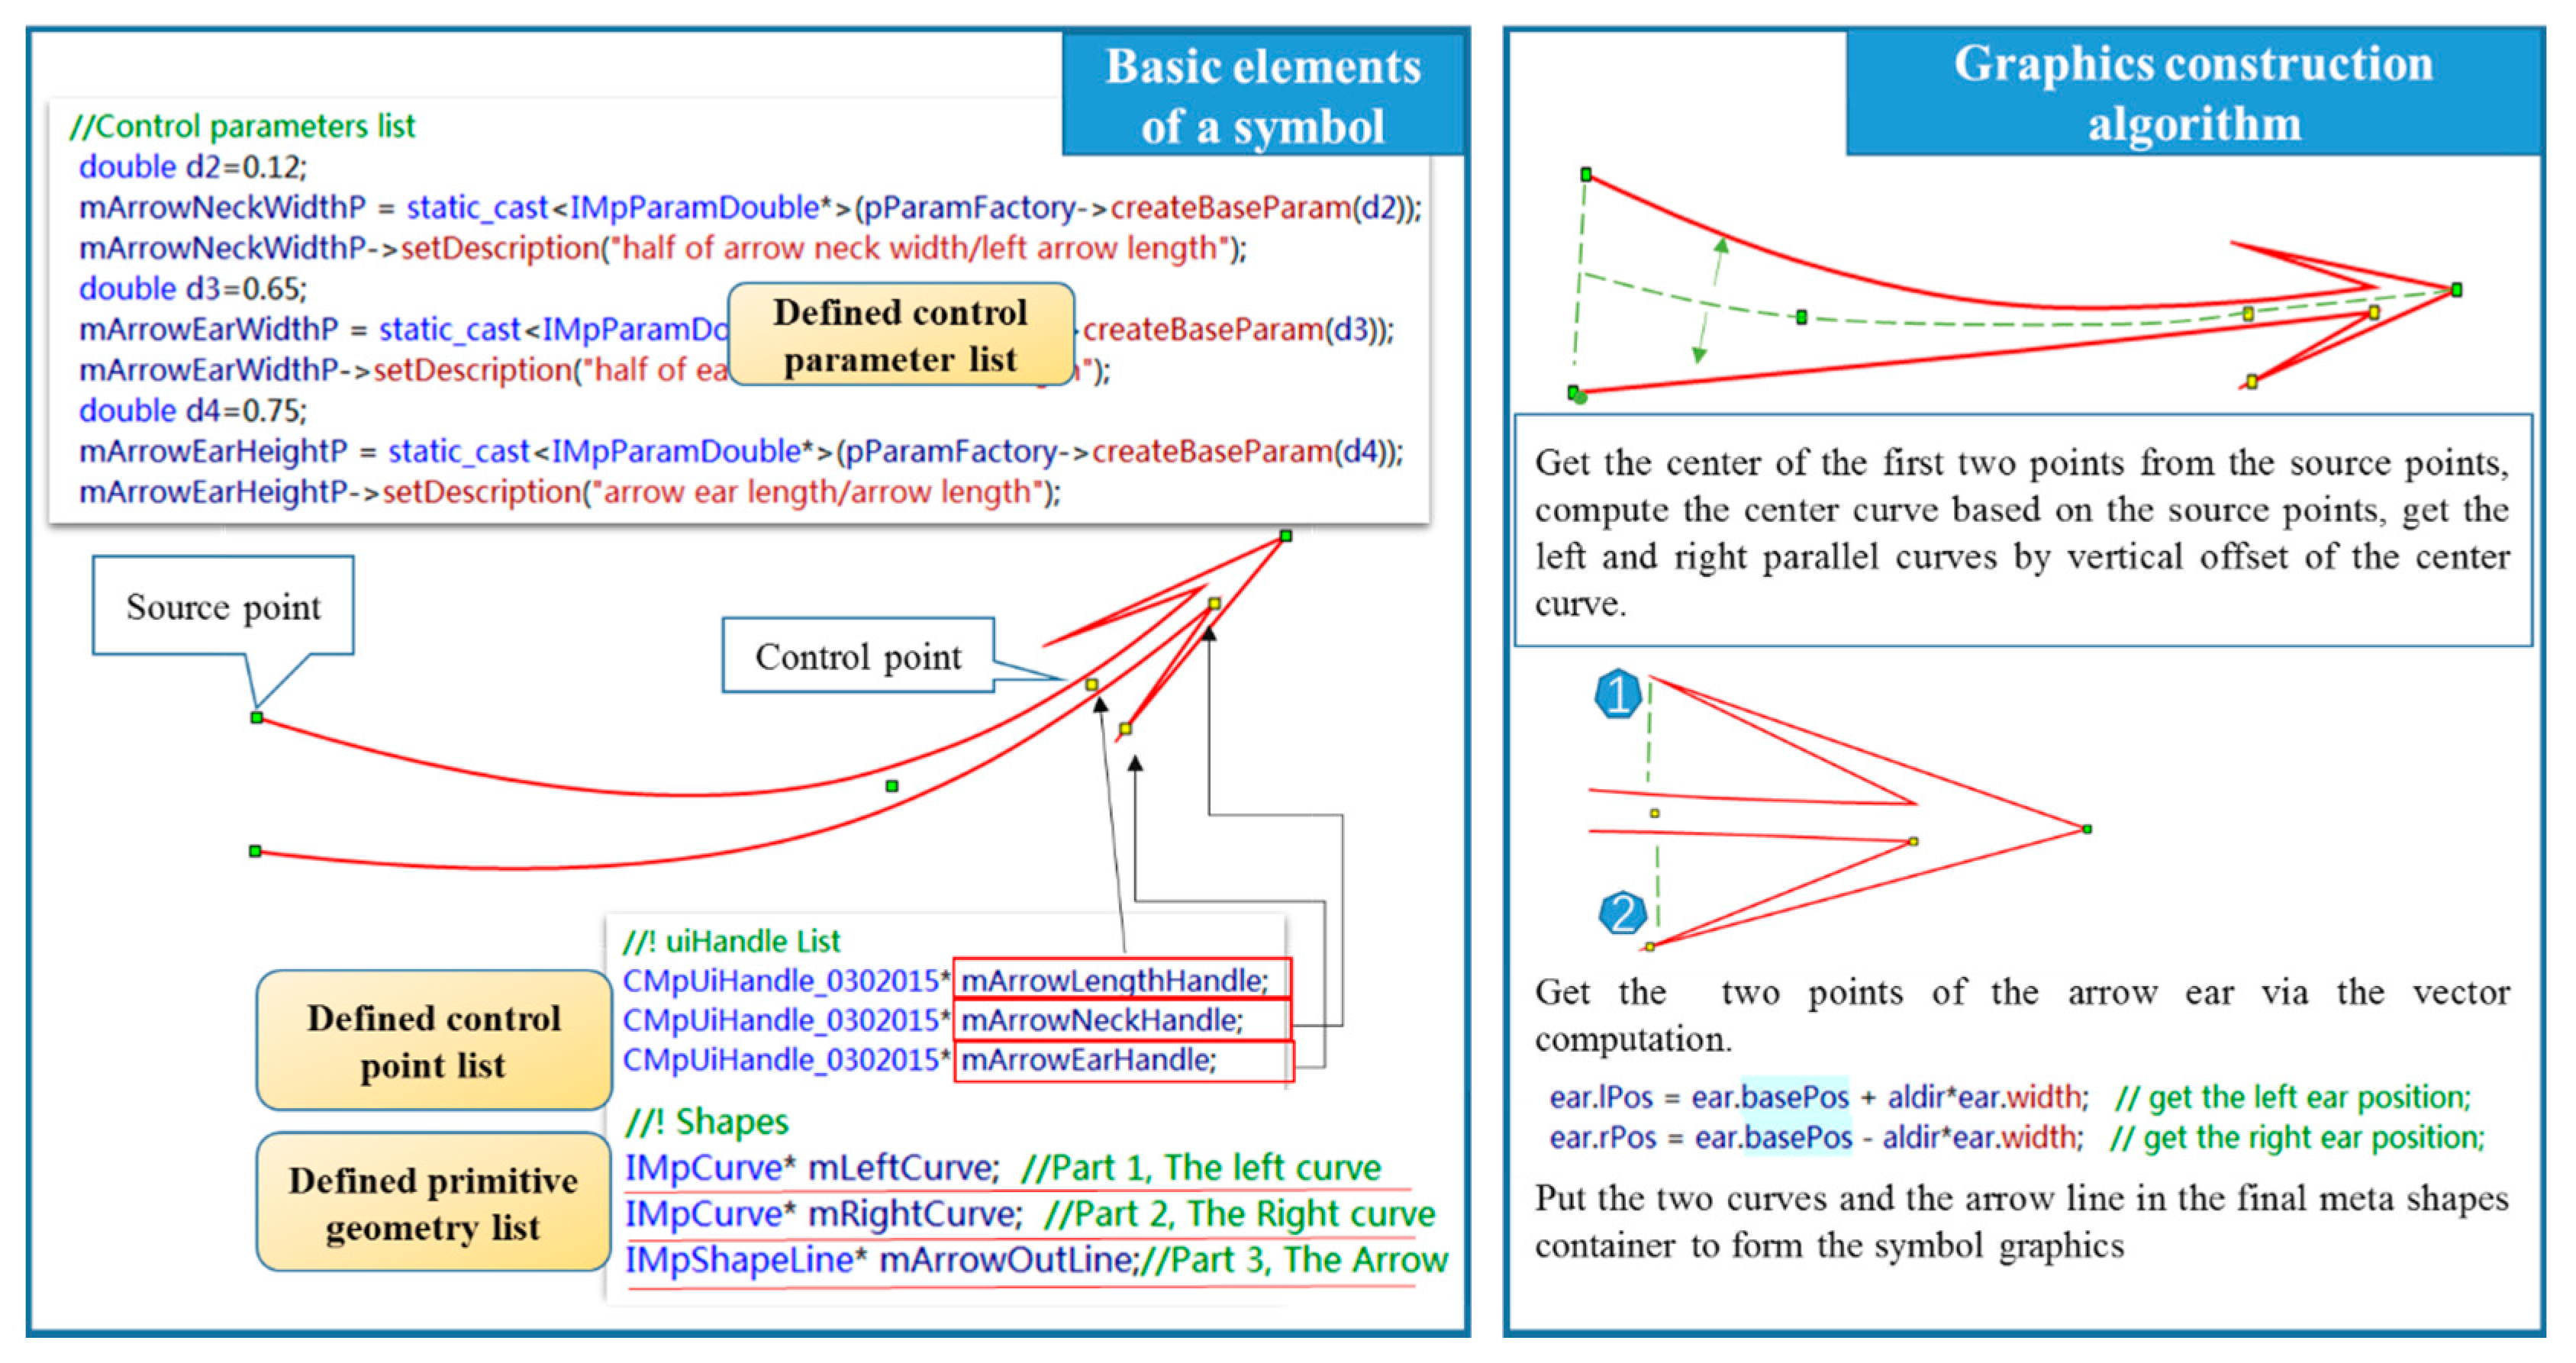
3.2.2. The Essential Creation Process of Line and Area Symbols

Although each symbol graphic is created using a specified graphics construction algorithm, the basic processes are the same: (1) Defining the primitive geometries for graphic construction, such as polylines, curves, circles, and arcs; (2) Defining and initializing the graphic control parameters using control points; (3) Creating real graphics using defined primitive geometries and parameters combined with various graphics construction algorithms, such as length calculation, angle calculation, fitting a curve with multi-point, vector operations, and line intersections. Figure 11 shows an example of the creation process for a specific symbol.

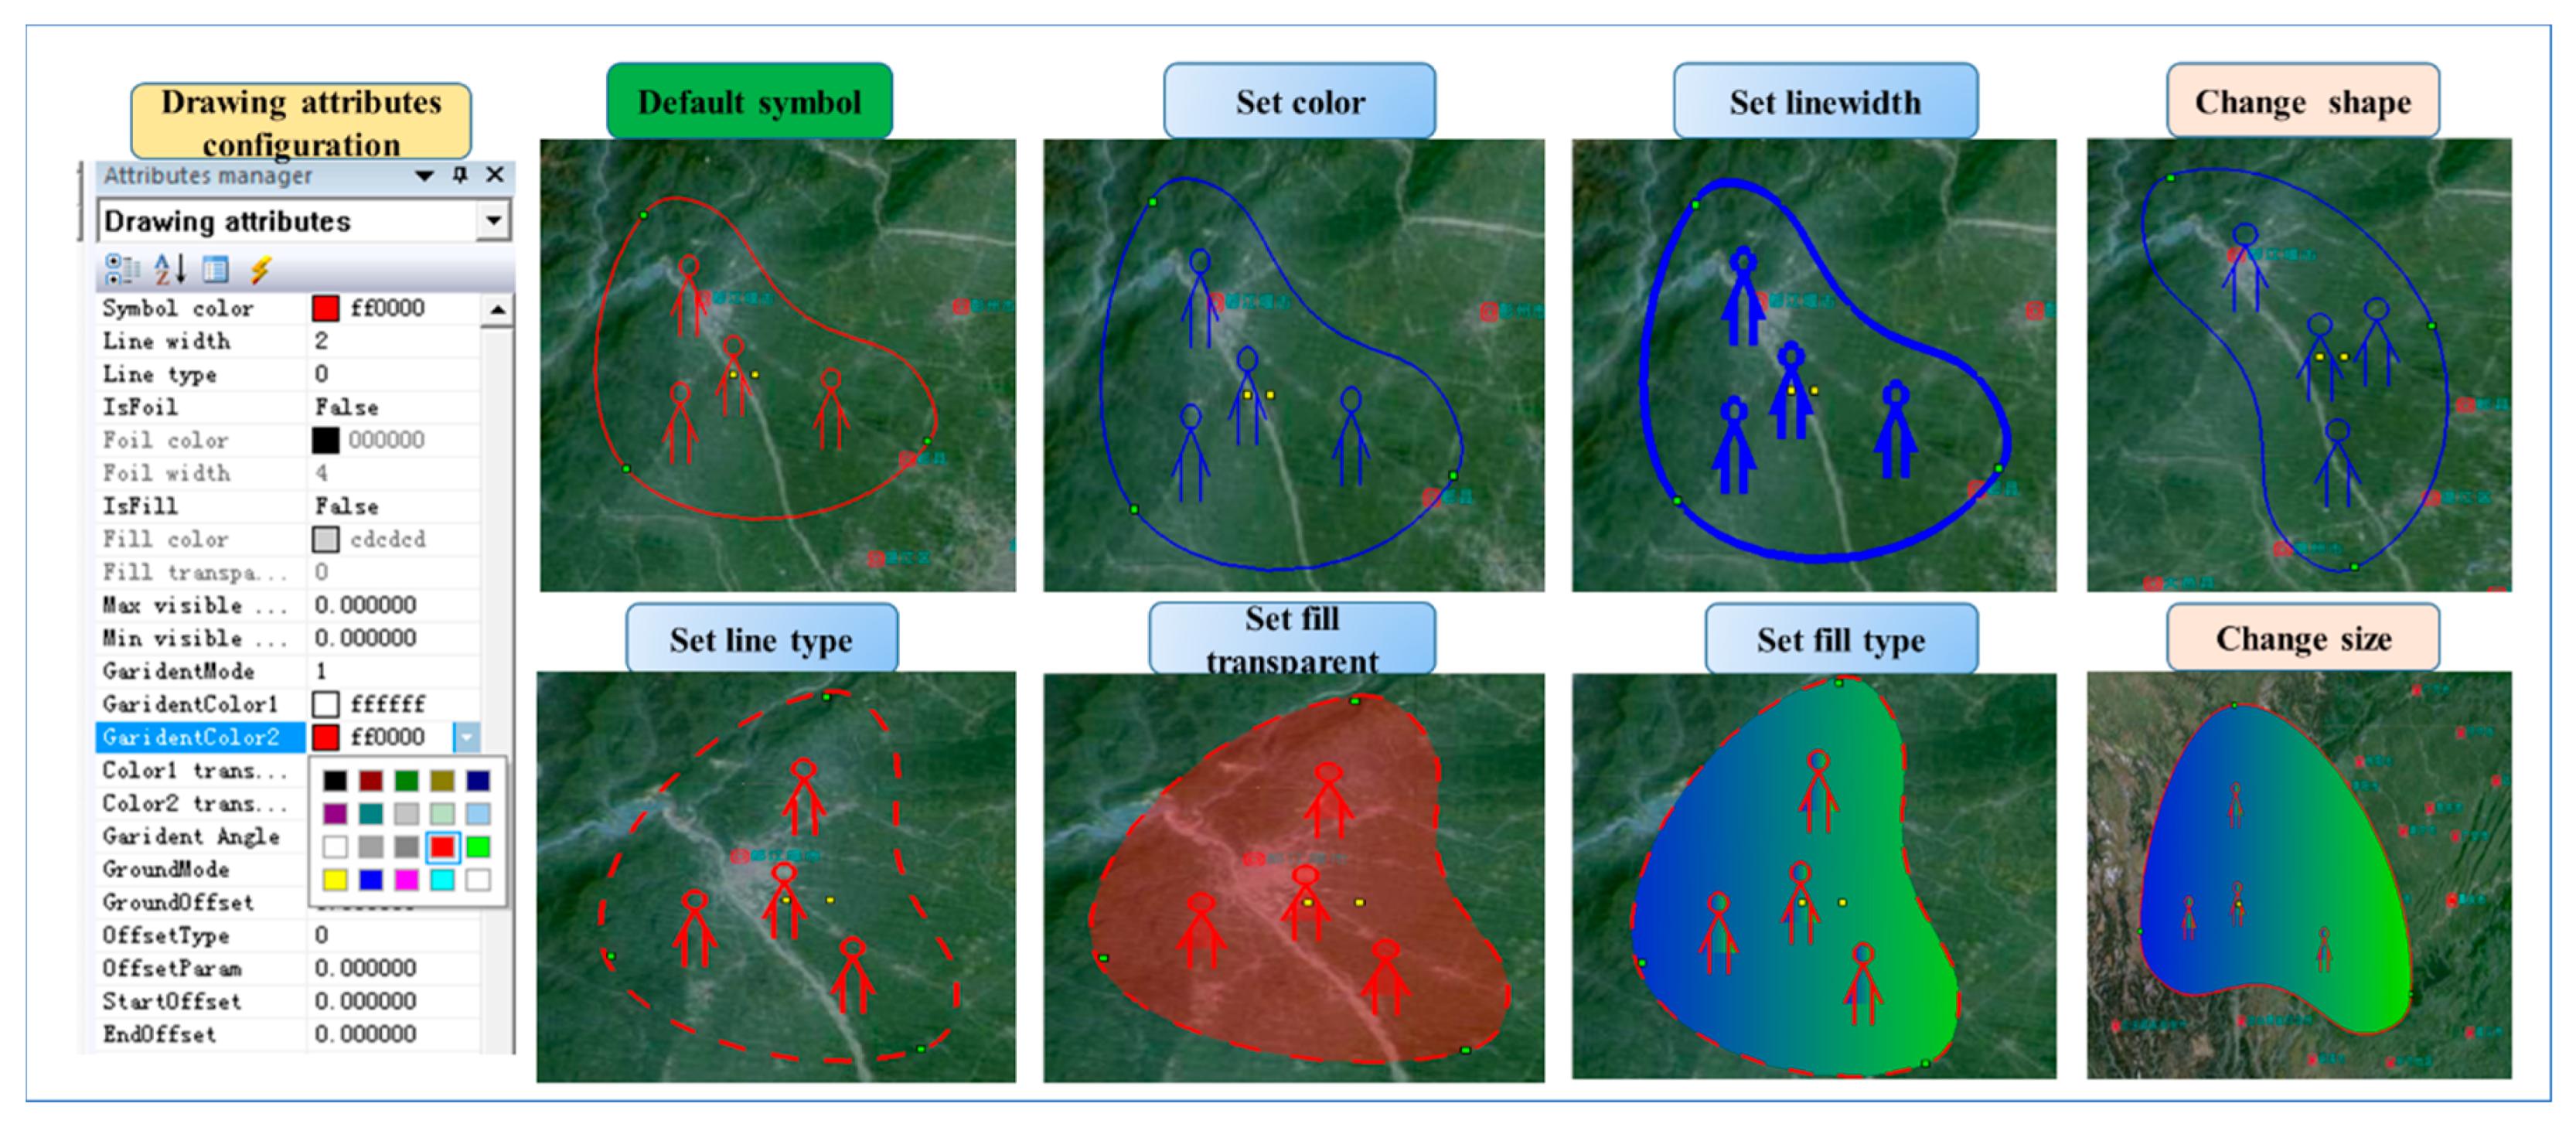
3.2.3. Interactive Control and Dynamic Setting of Drawing Attributes

The setting methods for the graphic control points for line and area symbols are different from point symbols. Line and area symbols may have several primitive geometries and thus require more source points and control points to generate and control the skeleton of the graphics. Using the CCartoGraphics_0302015 (the symbol shown in Figure 11) as an example, this symbol has four source points and three graphic control points (the source points are shown in green, while the control points are shown in yellow). If a green point is moved, the graphic would be reconstructed based on the new source point. If the yellow points are moved, the graphic control parameters will be calculated accordingly, and the graphics will also be reconstructed with the new control parameters. The detailed process is shown in Figure 12.
For line and area symbols, the attributes of the editor are also required to implement the dynamic setting of the drawing attributes. The drawing attributes include symbol colour, line width and type, and fill type, etc. Before executing the drawing functions, the drawing style of the painter will be set using the attributes acquired from the engine. Figure 13 shows several examples of interactive control and the attribute settings of area symbols.

4. Symbol Updating and Drawing

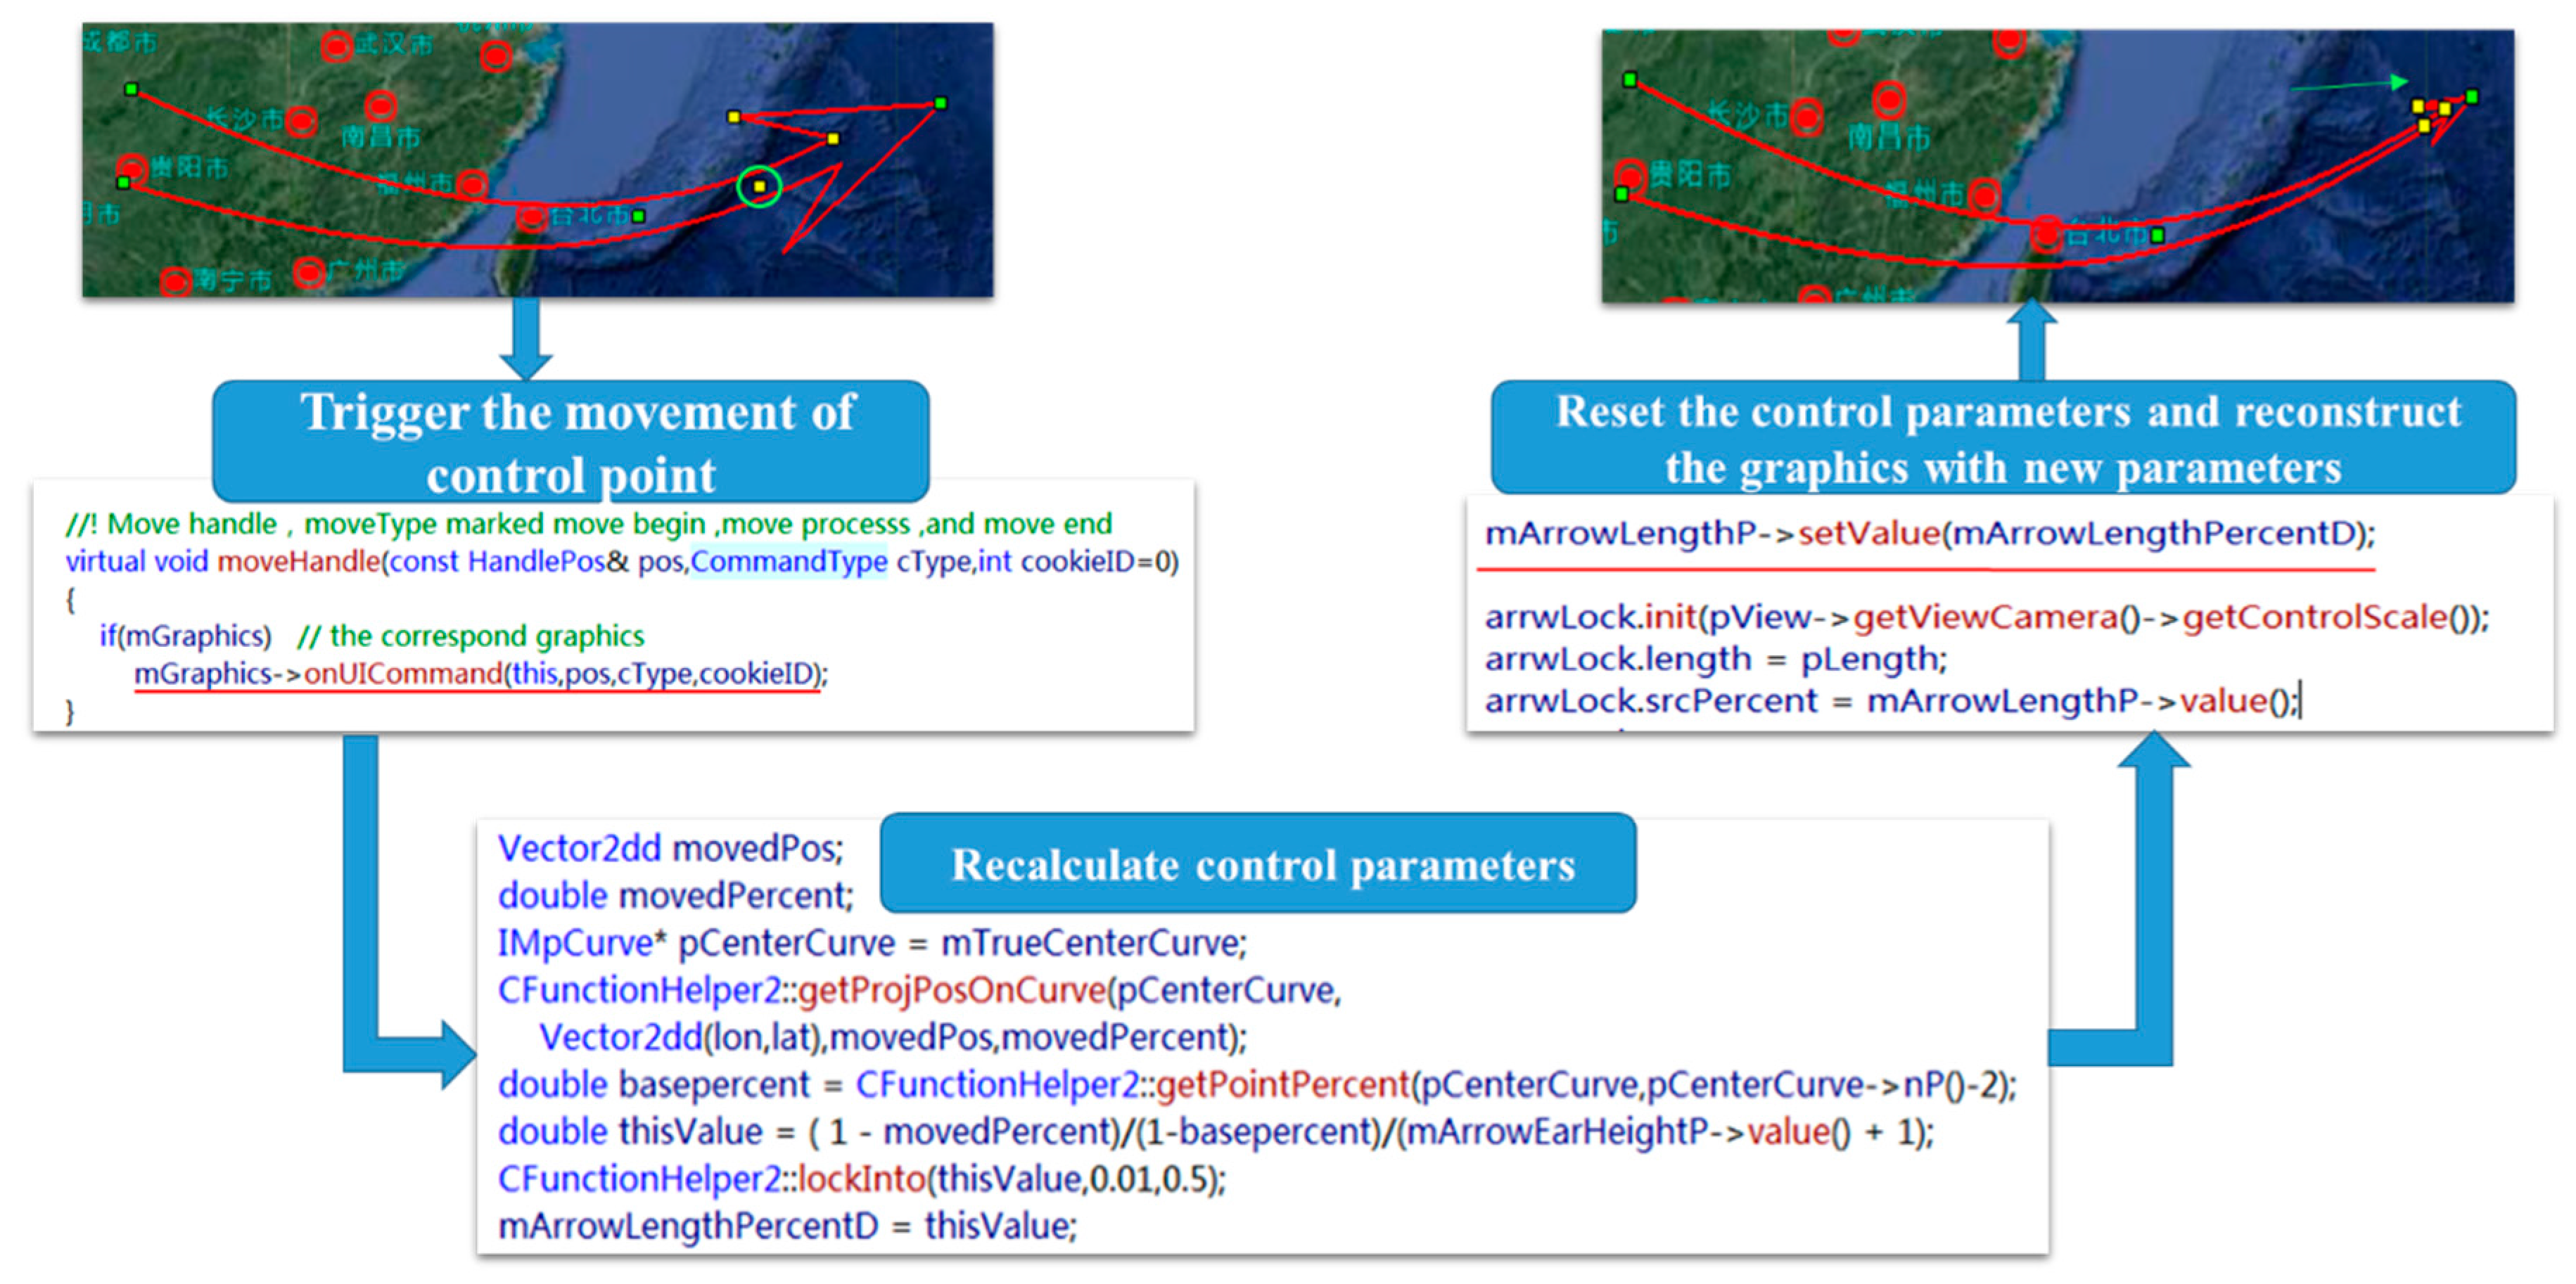
4.1. Dynamic Updating of Symbol
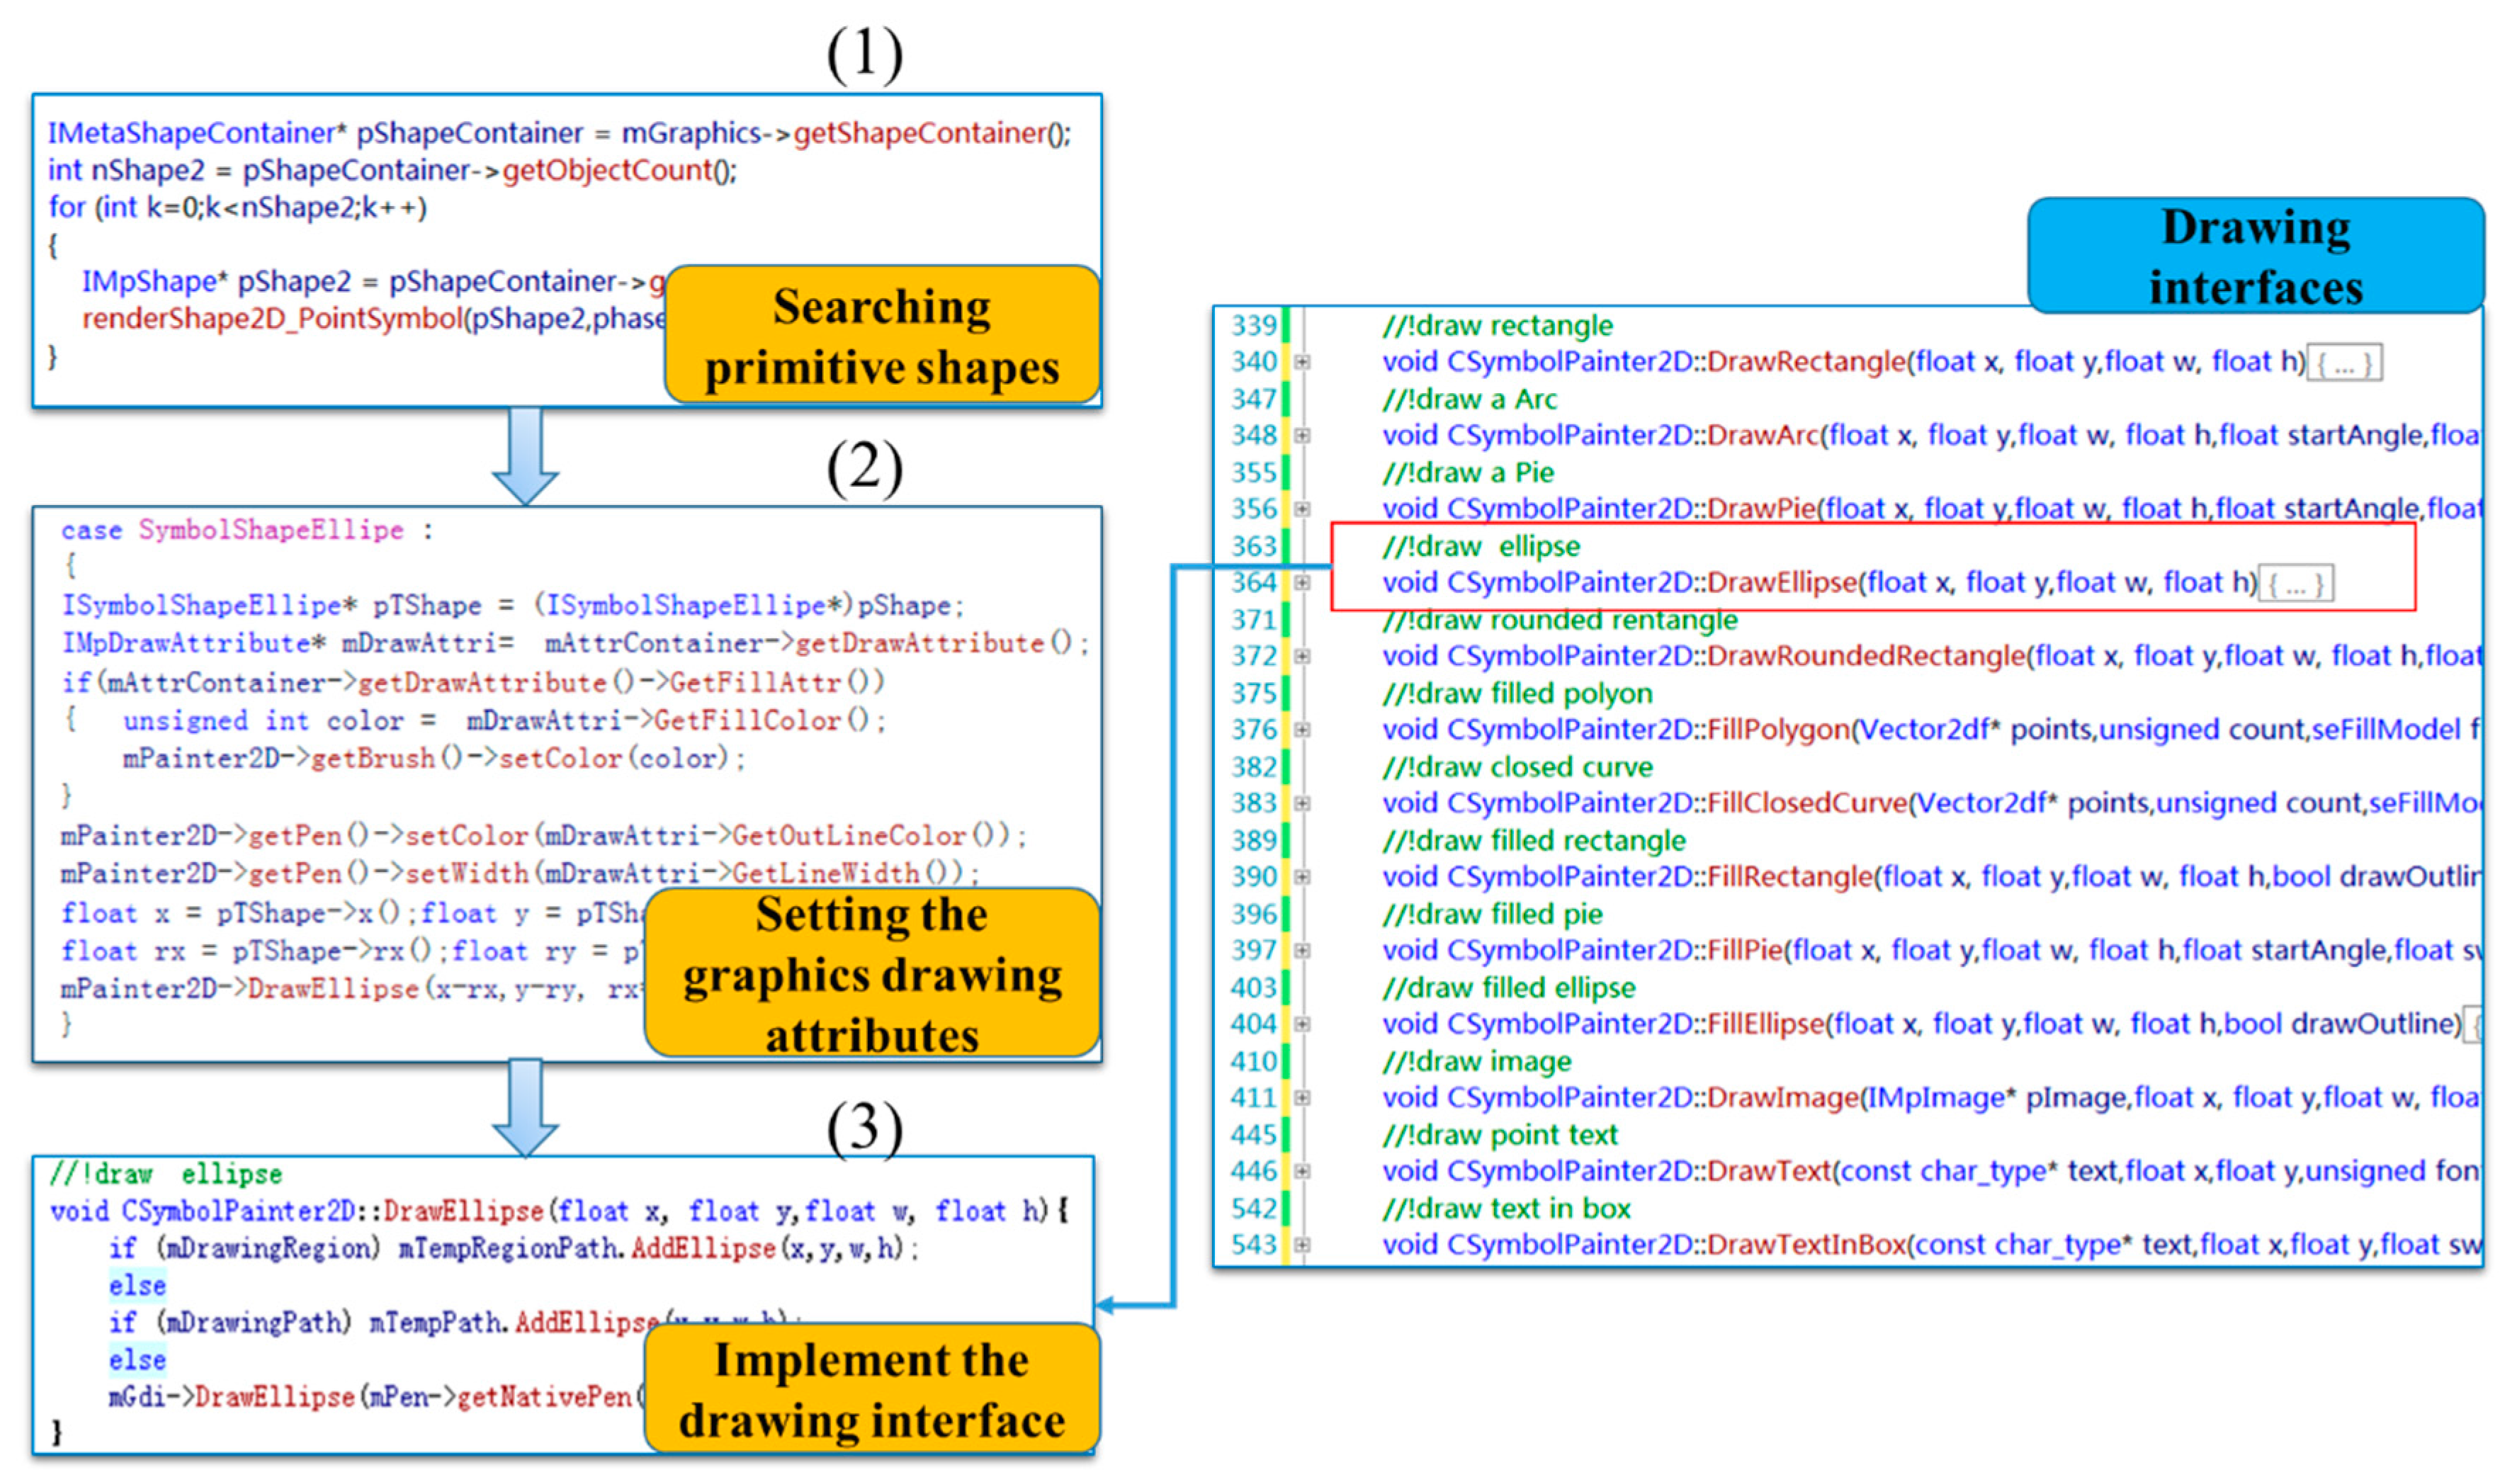
The proposed symbol construction method in this article focuses on the representation of dynamic disasters, response situations, and decisions. Therefore, the symbols must support dynamic changes of the drawing attributes and refresh the graphics in real-time. To accomplish this, the class for point symbol construction (CCartoGraphics_Point), and the class for line symbol and area symbol construction (CCartoGraphics_xxx), are designed with an updating function for dynamically constructing the graphics of symbols. The action used to trigger an update of the tasks includes moving the control and source points, and changing the graphic drawing attributes. Once the symbol graphics are reconstructed, the symbol will be re-drawn according to new points and drawing attributes.

4.2. Symbol Drawing

As graphic construction and interactive editing are independent of graphic drawing, the proposed drawing interface can be accessed from different graphic rendering APIs, such as GDI, D3D, OpenGL, and AGG. This design mode is useful for performing cross-platform drawing tasks. Because symbol graphics are a composition of primitive geometries such as line, polygon, arc, and pie, every application based on this strategy should implement interfaces that can be used to draw these primitive geometries.
Three steps are employed to draw the symbols, including searching the primitive geometries from MetaGraphicContainer, setting the graphic drawing attributes, and calling the drawing interface to finish the drawing tasks. Figure 14 shows the steps of symbol graphics drawing and some drawing interfaces.

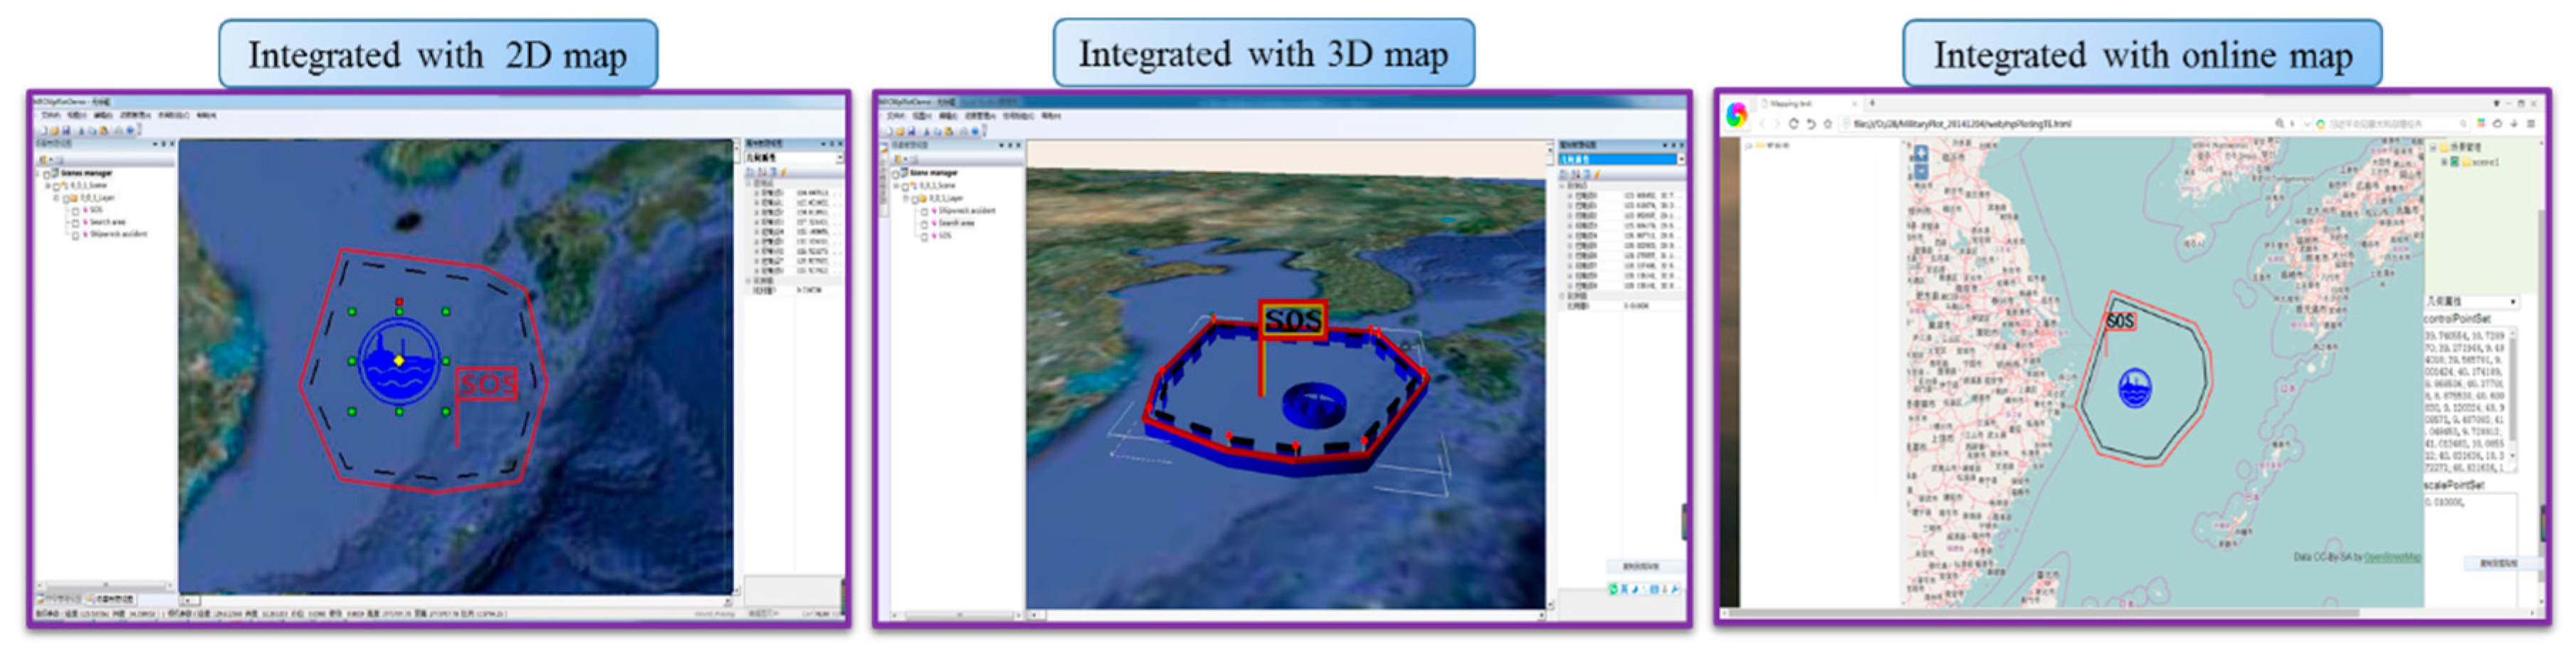
5. Prototype System and Experiments

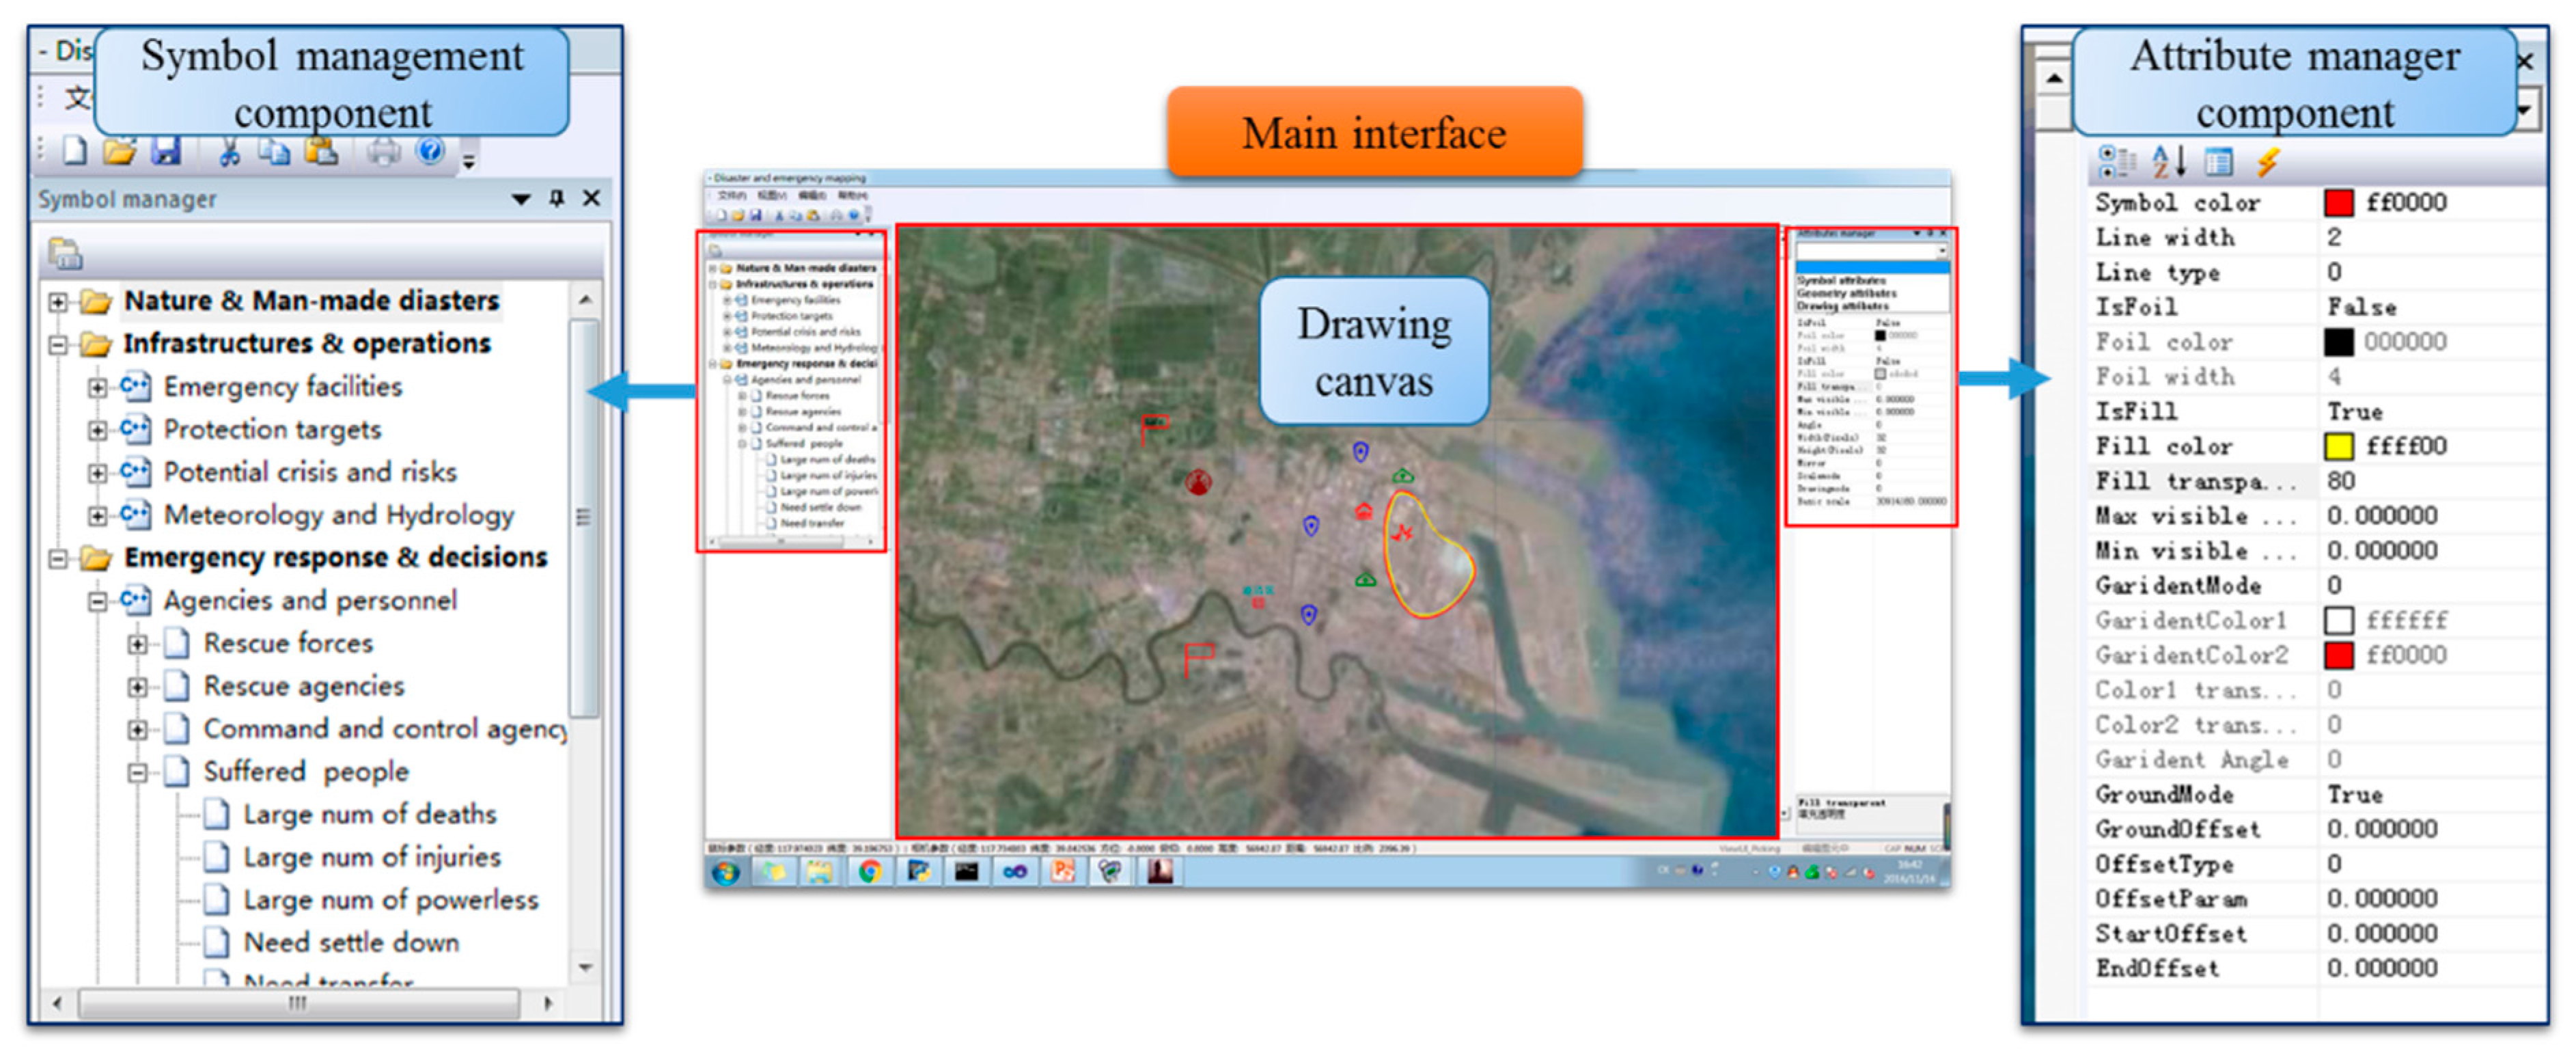
5.1. Development of the Prototype System
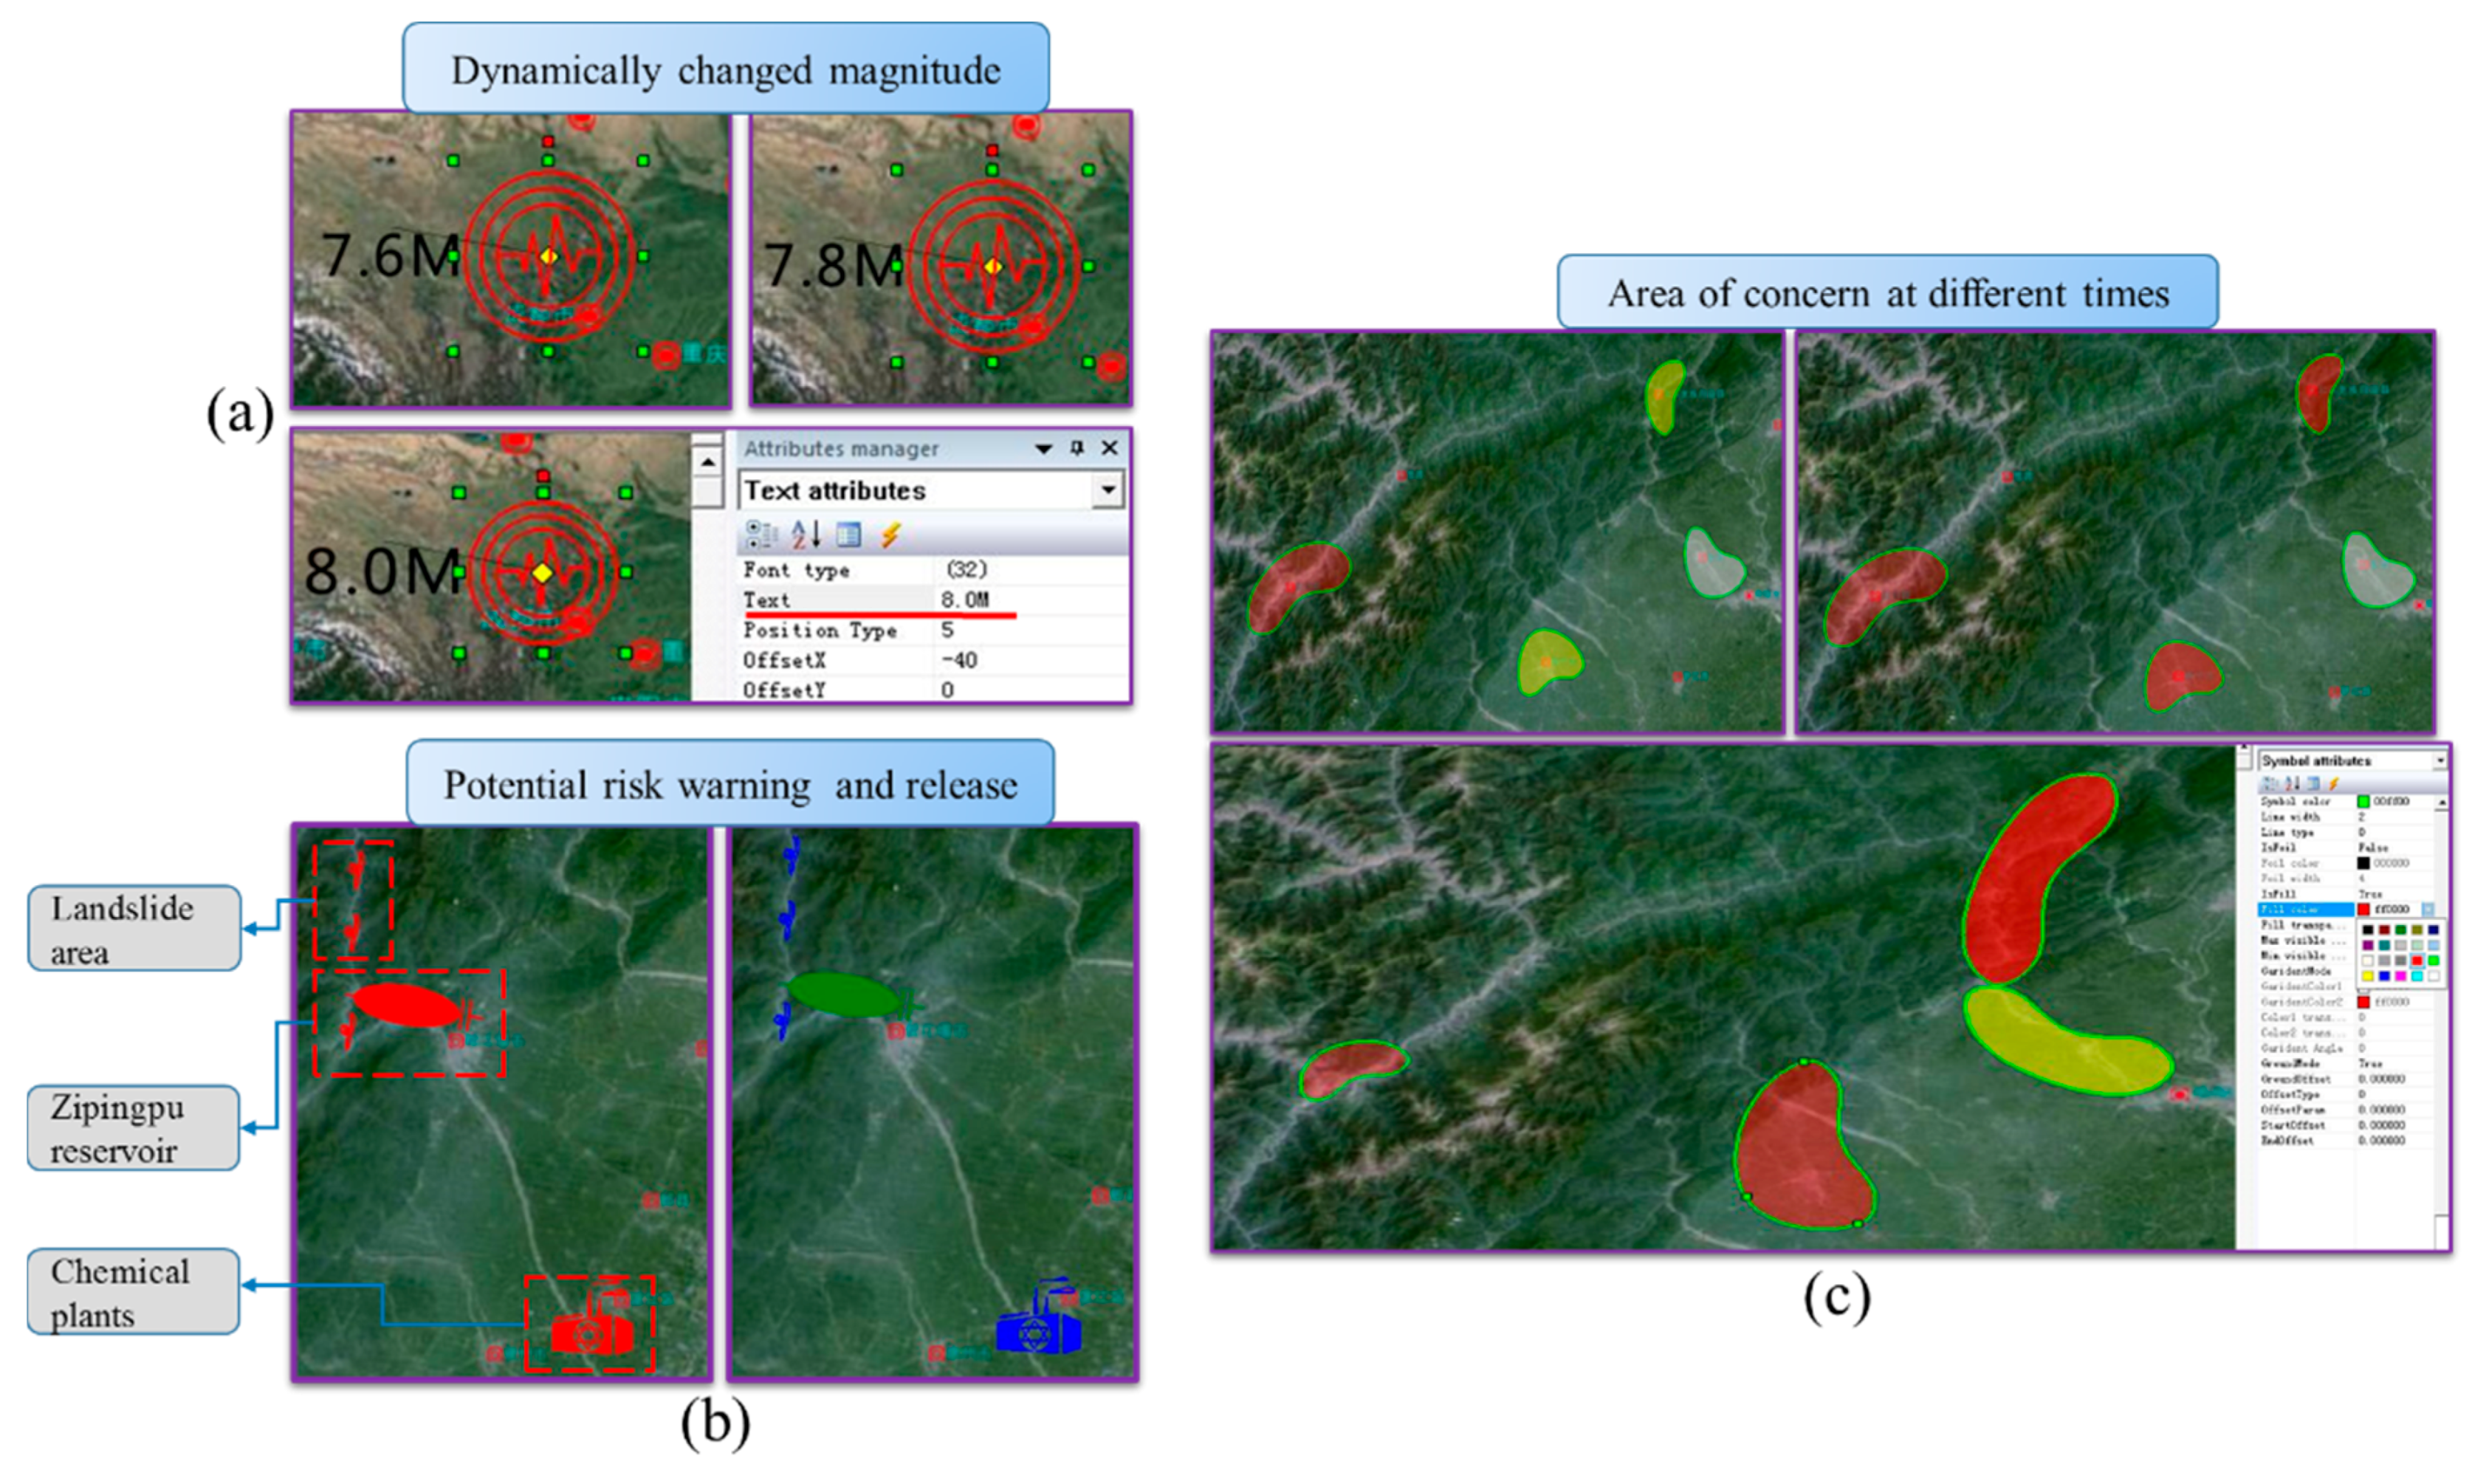
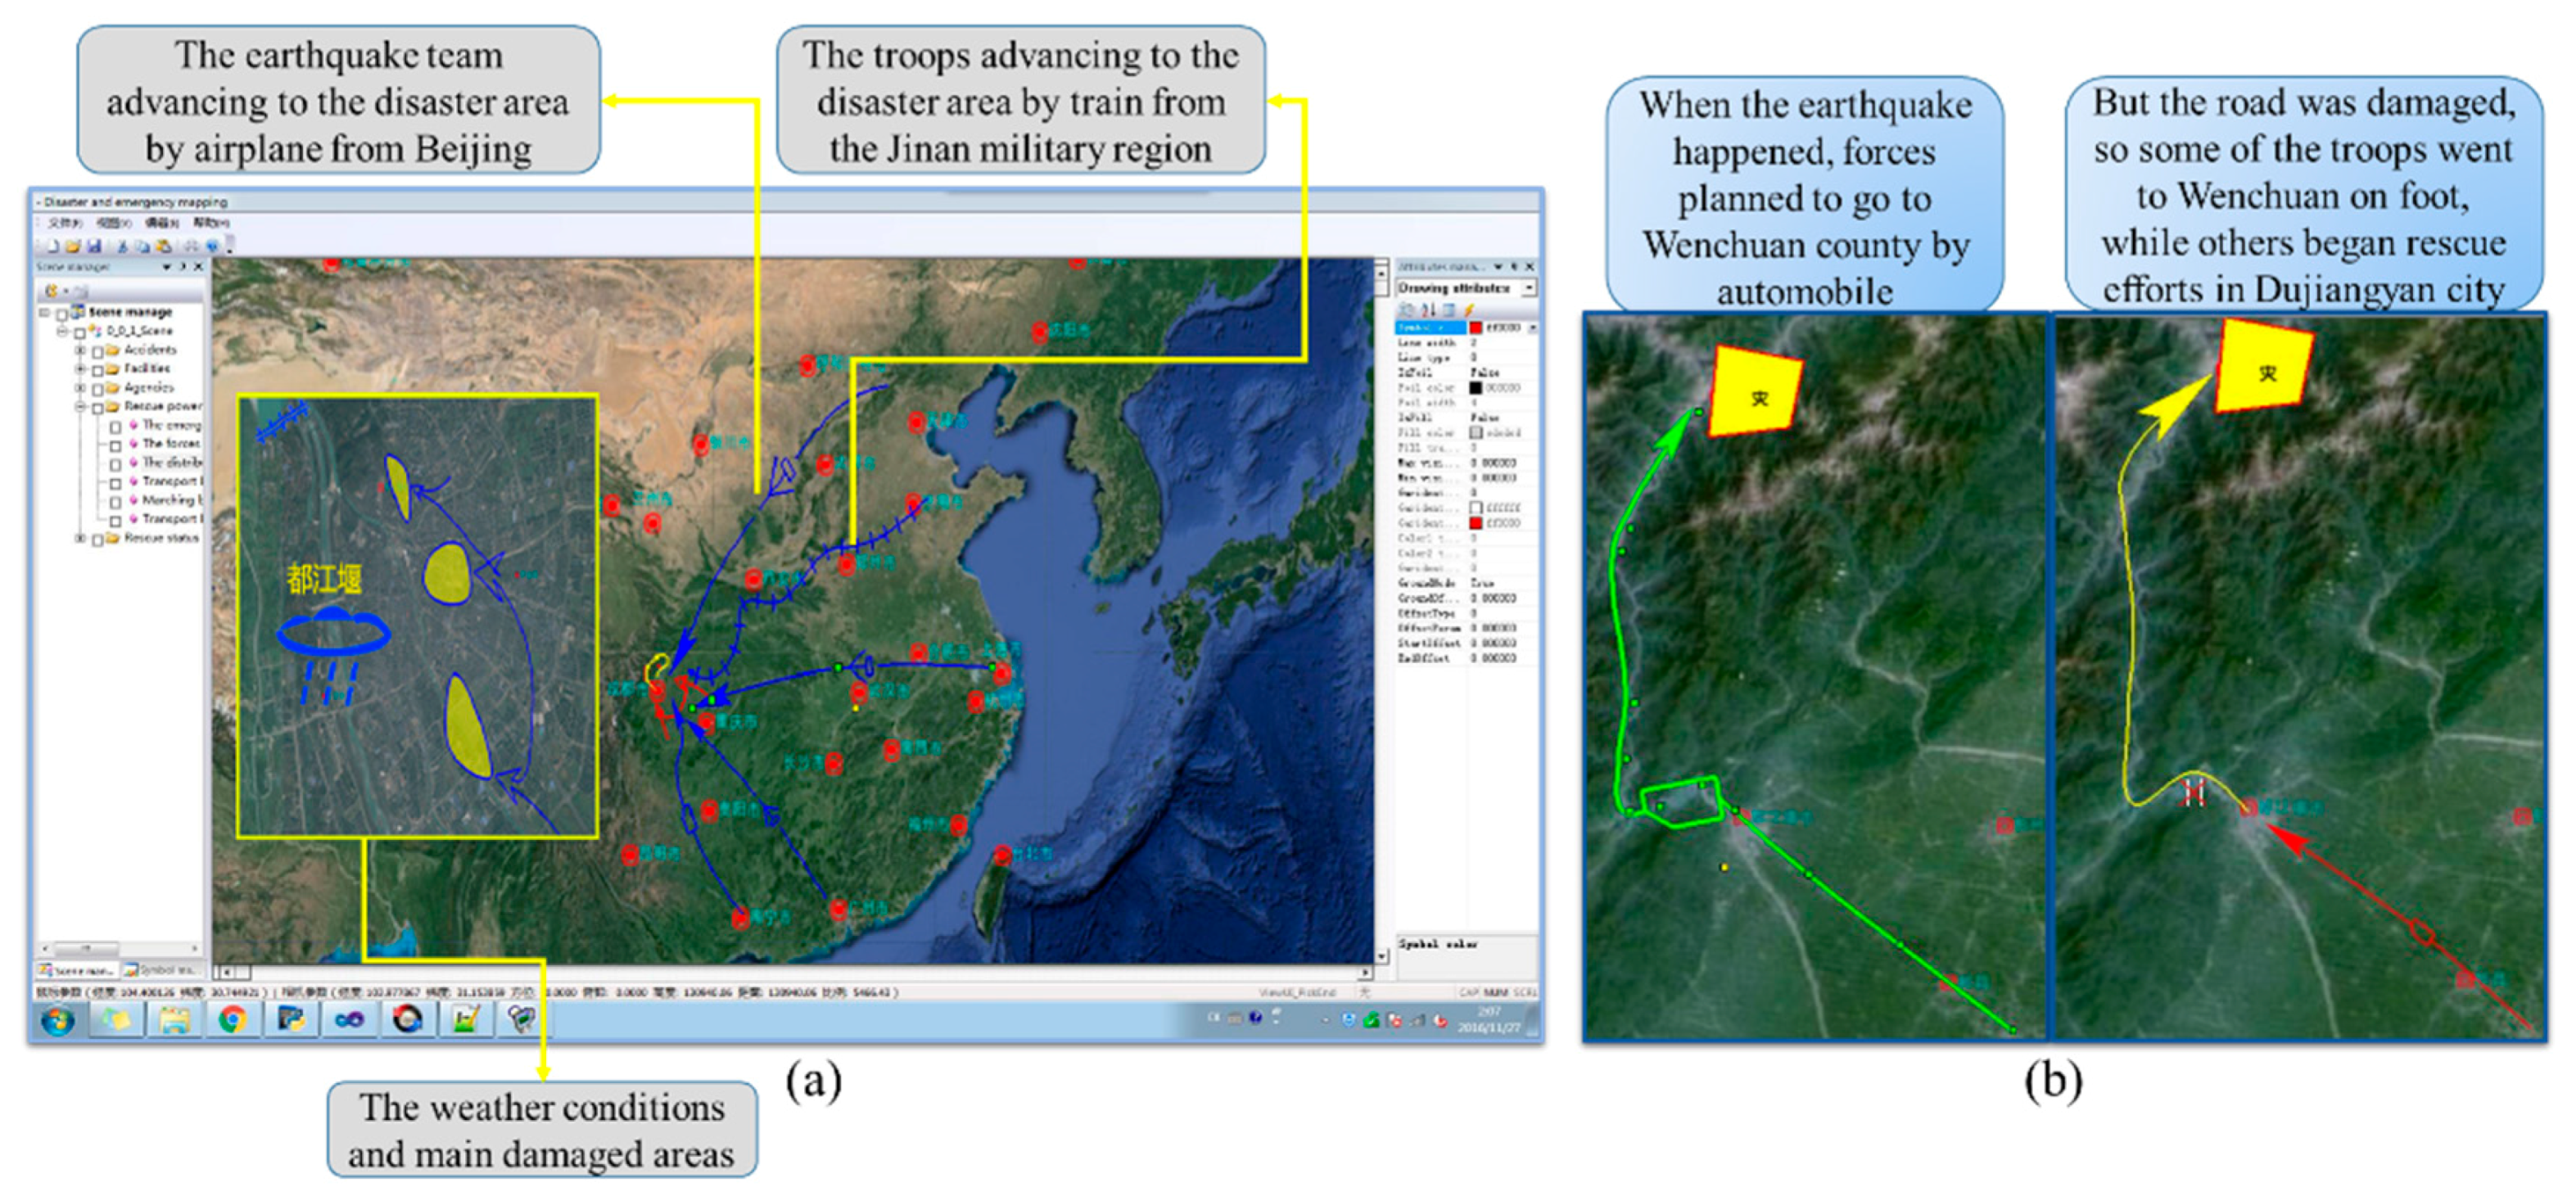
According to the methods mentioned above, C++ STL was employed to create the interactive map symbol construction and management, MFC 2010 was used to develop the graphical user interface (GUI), and GDI was used to develop the drawing interfaces. There are three modules in the main interface of the developed prototype system (Figure 15). First, there may be many symbols in the symbol libraries; the main function of the symbol manager module includes the initialization, symbol indexing, and searching of symbol libraries. Second, an attribute manager module is responsible for the editing of graphic drawing attributes, which is conducted through an attribute editor. Lastly, the drawing canvas is used for the response to mouse interactive events and displays the disasters and emergency mapping results.

5.2. Experiments

To demonstrate the capabilities and practicality of the proposed method, this article uses the disaster and response of the Wenchuan earthquake as an example. The Wenchuan earthquake, which occurred in 2008, impacted a wide area and caused a large number of casualties and extensive property damage. During the first few days of this disaster, the reported severely afflicted and damaged areas gradually increased, which required real-time responses and decision-making. The emergency work during the Wenchuan earthquake also involved a large number of rescue forces, and different organizations and institutions. A powerful mapping system was required to represent the continuously changing disaster situation, as well as the emergency work, and was used for information sharing, exchanging, and decision-making. The experiments are designed based on the disaster and the responses that occurred 72 h after the earthquake. Most of this information is queried from Guangming Online (http://tech.gmw.cn/2013-04/22/content_7396011.htm), which is the authoritative official media of China, and the rest of the information is gathered from other authoritative reports.
The disaster information was dynamically updated after the earthquake occurred. The Richter magnitude scale was revised three times. It is essential to dynamically update the information. First, the user should select the earthquake symbol from the symbol manager, which is managed in the natural disaster symbol set, which belongs to the Nature and Man-made Disasters Symbol Library. Second, the user can create the earthquake symbol in the correct position with a mouse click. Third, when the earthquake Richter magnitude is revised, the user can use the attributes manager to modify the text to represent the new Richter magnitude (Figure 16a). The key potential risk areas include the Zipingpu Reservoir, which is a large water conservancy project (contained in the Hydrology conditions symbol set, belonging to the Infrastructures and Related Factors Symbol Library), the chemical plants around Chengdu city (contained in the Potential crisis and risk symbol set, belonging to the Infrastructures and Related Factors Symbol Library), and the landslide vulnerability areas from Dujiangyan to Wenchuan. After the earthquake occurred, these were major concerns. If the large water conservancy project was damaged in an earthquake, it would cause a large secondary disaster. The same is true for the chemical plants and landslide vulnerability areas. First, these possible hazards should be marked as a high-level risk for early warning (in red colour). Second, once the status of the potential crisis and risk is determined, the disaster mapping content should be modified accordingly, such as by discharging the warning or lowering the risk grade (Figure 16b). The areas of greatest concern changed over time as the emergency situation developed, starting in Dujiangyan and Wenchuan county to Mianzhu city, and then moving to Beichuan county. First, the user should select the disaster area symbol from the symbol manager, which is managed in the rescue target symbol set belonging to the Emergency Response and Decisions Symbol Library. Second, the user can interactively create these symbols in different areas. Third, the user can modify the drawing attributes such as the fill colour and border colour, and change the shape of the disaster area by moving the control points to represent the different disaster degrees (Figure 16c).
After the Wenchuan earthquake had occurred, many organizations and agencies organized a large number of emergency forces to address the disaster and conduct rescue missions, such as the People’s Liberation Army, armed police, an earthquake rescue team, medical corps, and volunteers. The groups originated from different places, and arrived via different advancing and transportation methods such as on foot, and by motorcycle, boat, automobile, train, airplane, and helicopter. Faced with such complicated emergency response situations, those who can see the situation can better represent the rescue actions. Figure 17a shows the timely and various advancing and transportation methods using the interactive map symbols. Figure 17b shows the interactive mapping of an emergency approach. At first, the troops planned to go to Wenchuan county by automobile, so the user places the corresponding advancing symbol on the interactive map of the disaster area. However, when the troops advanced to Dujiangyan, they found that the road was damaged, preventing their advance by automobile. Therefore, some of the troops went to Wenchuan on foot, while others began rescue efforts in Dujiangyan city. The user can then delete the pre-mapped symbol and map the new response status with the correct symbols.
The cross-platform capability and practicality of the proposed interactive symbols are also a judgement factor for the evaluation of the interactive map symbols. As discussed in section 4, these proposed interactive map symbols can support cross-platform representation. Figure 18 shows an example using the 2D C/S platform (GDI rendering APIs), the 3D C/S platform (OpenGL rendering APIs), and an online map. This online experiment was implemented by plug-in technology (NPAPI), which supports the export of the C++ interfaces into JavaScript functions.

6. Conclusions and Future Work

This research article addressed an interactive map symbol construction method for mapping dynamic disasters, response situations, and decisions. The design processes for the proposed interactive map symbols include constructing visual graphics and graphic control points, drawing attributes using the graphics editor, performing interactive editing of map graphics, and configuring drawing attributes. The experiment demonstrates a powerful capacity of the produced interactive map symbol, and these symbols will contribute to the improvement of mapping efficiency and representation capability.
However, this proposed method still presents limitations. First, to date, the graphics, control points, and source points are created by user interaction, making it difficult to perform a quantitative analysis based on these symbols, and there is a need to link the construction process with quantitative calculation-oriented rules to simplify the construction process and make the representation of symbols more reasonable. Second, the interactive modes of symbols are freely designed by experience or consultation with domain experts, but each symbol has a specific meaning, and the editing mode of each symbol may be linked to a standard interactive mode according to its specific meaning, to improve the efficiency and standardization of the line (area) map symbol interaction.
The effectiveness of information sharing and public involvement are key factors affecting emergency management. Therefore, an online emergency management service and mapping system can be of great help to disaster and emergency management operations [8,9]. However, the procedural construction method for interactive map symbols was implemented in C++ native code, which is not easy to integrate with an online system. In the experiments, we used a plug-in technology to integrate the interactive map symbol library with OpenLayers maps. The experiment was successful and we now understand the key factors required to suitably integrate the library with an online framework. However, the integration methods based on the plug-in technology are not good for online applications. In the future, we would like to convert the C++ native code into JavaScript, based on the archived construction method. Since all the interactive symbols were dynamically constructed by various graphics description information (point symbol) and construction procedural algorithms (line and area symbol), and the symbols were rendered by customized drawing interfaces, the symbols cannot be organized by a specific data structure and cannot be integrated with other online applications that are based on data exchange. In the future, we will endeavour to provide a JavaScript (JS) library that contains the symbol construction and drawing interfaces, so that online emergency frameworks can rely on the JS library to implement the online interactive map symbol library, wherein the interactive map would be drawn on a fixed HTML5 canvas over a base map.

Acknowledgments

The work described in this article involves many geo-analysis models and was supported by the following research programs: The National Basic Research Programme of China (973 Program) [grant number 2015CB954102]; the National Natural Science Foundation of China [grant number 41231173], [grant number 41471317].

Author Contributions

Yongning Wen provided the initial idea for this study; Guoqiang Peng and Songshan Yue designed and performed the experiment; Zhiyao Song and Yuting Li analysed the results of the experiment; Guoqiang Peng wrote the paper.

Conflicts of Interest

The authors declare no conflict of interest.

References

  1. Van Aalst, M.K. The impacts of climate change on the risk of natural disasters. Disasters 2006, 30, 5–18. [Google Scholar] [CrossRef] [PubMed]
  2. Bergholt, D.; Lujala, P. Climate-related natural disasters, economic growth, and armed civil conflict. J. Peace Res. 2012, 49, 147–162. [Google Scholar] [CrossRef]
  3. Loayza, N.V.; Olaberria, E.; Rigolini, J.; Christiaensen, L. Natural disasters and growth: Going beyond the averages. World Dev. 2012, 40, 1317–1336. [Google Scholar] [CrossRef]
  4. Wu, A.; Convertino, G.; Ganoe, C.; Carroll, J.M.; Zhang, X.L. Supporting collaborative sense-making in emergency management through geo-visualization. Int. J. Hum. Comput. Stud. 2013, 71, 4–23. [Google Scholar] [CrossRef]
  5. Faulkner, B. Towards a framework for tourism disaster management. Tour. Manag. 2001, 22, 135–147. [Google Scholar] [CrossRef]
  6. Kwan, M.P.; Lee, J. Emergency response after 9/11: The potential of real-time 3D GIS for quick emergency response in micro-spatial environments. Comput. Environ. Urban Syst. 2005, 29, 93–113. [Google Scholar] [CrossRef]
  7. Kulawiak, M.; Lubniewski, Z. SafeCity—A GIS-based tool profiled for supporting decision making in urban development and infrastructure protection. Technol. Forecast. Soc. Chang. 2014, 89, 174–187. [Google Scholar] [CrossRef]
  8. Copernicus EMS Team. Available online: http://emergency.copernicus.eu/ (accessed on 10 February 2017).
  9. The International Charter Team. Available online: https://www.disasterscharter.org/web/guest/home (accessed on 10 February 2017).
  10. Wiatr, T.; Suresh, G.; Gehrke, R.; Hovenbitzer, M. opernicus—Practice of Daily Life in a National Mapping Agency. ISPRS Int. Arch. Photogramm. Remote Sens. Spat. Inf. Sci. 2016, XLI-B1, 1195–1199. [Google Scholar] [CrossRef]
  11. Jiang, J.; Wang, P.; Lung, W.S.; Guo, L.; Li, M. A GIS-based generic real-time risk assessment framework and decision tools for chemical spills in the river basin. J. Hazard. Mater. 2012, 227, 280–291. [Google Scholar] [CrossRef] [PubMed]
  12. Lin, H.; Chen, M. Managing and sharing geographic knowledge in virtual geographic environments (VGEs). Ann. GIS 2015, 21, 261–263. [Google Scholar] [CrossRef]
  13. Chen, M.; Lin, H.; Kolditz, O.; Chen, C. Developing dynamic virtual geographic environments (VGEs) for geographic research. Environ. Earth Sci. 2015, 74, 6975–6980. [Google Scholar] [CrossRef]
  14. Lin, H.; Batty, M.; Jørgensen, S.E.; Fu, B.; Konecny, M.; Voinov, A.; Torrens, P.; Lu, G.; Zhu, A.; Wilson, J.P.; et al. Virtual Environments Begin to Embrace Process-based Geographic Analysis. Trans. GIS 2015, 19, 493–498. [Google Scholar] [CrossRef]
  15. Nourbakhsh, I.; Sargent, R.; Wright, A.; Cramer, K.; McClendon, B.; Jones, M. Mapping disaster zones. Nature 2006, 439, 787–788. [Google Scholar] [CrossRef] [PubMed]
  16. Friedmannová, L.; Konečný, M.; Staněk, K. An adaptive cartographic visualization for support of the crisis management. In Proceedings of the AutoCarto, Vancouver, WA, USA, 25–26 June 2006. [Google Scholar]
  17. Bandrova, T.L.; Konečný, M.; Zlatanova, S.; Friedmannová, L. Cartography and Geoinformatics for Early Warning and EmergencyManagement: Towards Better Solutions. Kartografija I Geoinformacije 2009, 8, 180. [Google Scholar]
  18. Lin, H.; Chen, M.; Lu, G. Virtual Geographic Environment: A Workspace for Computer-Aided Geographic Experiments. Ann. Assoc. Am. Geogr. 2013, 103, 465–482. [Google Scholar] [CrossRef]
  19. Chen, M.; Lin, H.; Hu, M.; He, L.; Zhang, C. Real geographic scenario based virtual social environment: Integrate geography with social research. Environ. Plan. B Plan. Des. 2013, 40, 1103–1121. [Google Scholar] [CrossRef]
  20. Lin, H.; Chen, M.; Lu, G.; Zhu, Q.; Gong, J.; You, X.; Wen, Y.; Xu, B.; Hu, M. Virtual Geographic Environments (VGEs): A New Generation of Geographic Analysis Tool. Earth Sci. Rev. 2013, 126, 74–84. [Google Scholar] [CrossRef]
  21. Boccardo, P. New perspectives in emergency mapping. Eur. J. Remote Sens. 2013, 46, 571–582. [Google Scholar] [CrossRef]
  22. Kostelnick, J.C.; Dobson, J.E.; Egbert, S.L.; Dunbar, M.D. Cartographic Symbols for Humanitarian Demining. Cartogr. J. 2008, 45, 18–31. [Google Scholar] [CrossRef]
  23. Korpi, J.; Ahonen-Rainio, P. Effect of Cultural Differences and Referent Characteristics on the Design of Pictographic Map Symbols. In Proceedings of the 27th International Cartographic Conference, Riode Janeiro, Brazil, 23–28 August 2015. [Google Scholar]
  24. Robinson, A.C.; Roth, R.E.; Blanford, J.; Pezanowski, S.; MacEachren, A.M. Developing map symbol standards through an iterative collaboration. Environ. Plan. B Plan. Des. 2012, 39, 1034–1048. [Google Scholar] [CrossRef]
  25. Robinson, A.C.; Pezanowski, S.; Troedson, S.; Bianchetti, R.; Blanford, J.; Stevens, J.; Guidero, E.; Roth, R.E.; MacEachren, A.M. Symbol Store: Sharing map symbols for emergency management. Cartogr. Geogr. Inf. Sci. 2013, 40, 1–12. [Google Scholar] [CrossRef]
  26. Wang, F.; Yang, R. Major concerns of defining the map symbol standard in emergency management. In Proceedings of the International Conference on Geoinformatics, Kaifeng, China, 20–22 June 2013. [Google Scholar]
  27. Li, X.L.; Li, Z.Q.; Huang, M.; Dai, B.Y. A preliminary research on symbol for earthquake disaster situation. J. Nat. Disasters 2010, 2, 24. [Google Scholar]
  28. Lucieer, A.; Jong, S.M.D.; Turner, D. Mapping landslide displacements using Structure from Motion (SfM) and image correlation of multi-temporal UAV photography. Prog. Phys. Geogr. 2014, 38, 97–116. [Google Scholar] [CrossRef]
  29. Bianchetti, R.A.; Wallgrün, J.O.; Yang, J.; Blanford, J.; Robinson, A.C.; Klippel, A. Free Classification of Canadian and American Emergency Management Map Symbol Standards. Cartogr. J. 2012, 49, 350–360. [Google Scholar] [CrossRef]
  30. Akella, M.K. First Responders and Crisis Map Symbols: Clarifying Communication. Cartogr. Geogr. Inf. Sci. 2009, 36, 19–28. [Google Scholar] [CrossRef]
  31. Konecny, M.; Bandrova, T. Proposal for a Standard in Cartographic Visualization of Natural Risks and Disasters. Int. J. Urban Sci. 2006, 10, 130–139. [Google Scholar] [CrossRef]
  32. Kerle, N.; Hoffman, R.R. Collaborative damage mapping for emergency response: The role of Cognitive Systems Engineering. Nat. Hazards Earth Syst. Sci. 2013, 13, 97–113. [Google Scholar] [CrossRef]
  33. Hu, Y.; Janowicz, K.; Couclelis, H. Prioritizing Disaster Mapping Tasks for Online Volunteers Based on Information Value Theory. Geogr. Anal. 2016. [Google Scholar] [CrossRef]
  34. Zhou, L.; Xie, Z.; Huang, B. Sharing of Map Symbol Based on SVG. In Proceedings of the IEEE International Conference on Information Engineering and Computer Science, Wuhan, China, 19–20 December 2009. [Google Scholar]
  35. Hagens, D.; Montgomery, J.; Moore, C. Developing custom 3D visualization applications for defense using ARCGIS. In Proceedings of the 2005 Developer Summit, San Diego, CA, USA, 25–30 October 2005. [Google Scholar]
  36. Yang, L.B.; Zhou, M.; Feng, Y.P.; Liu, Y.L.; Chen, Y.H. The Establishment of the Map Symbol Database Based on ArcGIS. Sci. Tech. Inf. Dev. Econ. 2007, 22, 120. [Google Scholar]
  37. Yue, S.; Yang, J.; Chen, M.; Lu, G.; Zhu, A.X.; Wen, Y. A function-based linear map symbol building and rendering method using shader language. Int. J. Geogr. Inf. Sci. 2016, 30, 1–25. [Google Scholar] [CrossRef]
  38. Neis, P.; Singler, P.; Zipf, A. Collaborative mapping and emergency routing for disaster logistics-case studies from the haiti earthquake and the UN Portal for Afrika. In Proceedings of the Geoinformatics Forum Salzburg, Salzburg, Austria, 6–9 July 2010. [Google Scholar]
  39. Esposito, G.; Salvini, R.; Sacchi, M.; Matano, F. A geomatic approach for emergency mapping of shallow landslides. Rend. Online Soc. Geol. Ital. 2015, 35, 121–123. [Google Scholar] [CrossRef]
  40. Zhang, N.; Huang, H.; Su, B.; Zhang, H. Population evacuation analysis: Considering dynamic population vulnerability distribution and disaster information dissemination. Nat. Hazards 2013, 69, 1629–1646. [Google Scholar] [CrossRef]
  41. Garlandini, S.; Fabrikant, S.I. Evaluating the Effectiveness and Efficiency of Visual Variables for Geographic Information Visualization. In International Conference on Spatial Information Theory; Springer: Berlin/Heidelberg, Germany, 2009; pp. 195–211. [Google Scholar]
  42. Xia, S.; Xiaolei, C.; Haiyang, Y.; Liang, Z.; Jiao, L.; Center, H.M.D.P. Analysis of Wind Disaster and Its Hazard Regionalization in Hebei Province. Chin. Agric. Sci. Bull. 2016, 1, 34. [Google Scholar]
  43. Ni, Z.J.; Rong, L.L.; Lu, R.H. Study on foundational logical relations for constructing ontology of disaster-pregnant environment. Syst. Eng. Theory Pract. 2013, 3, 21. [Google Scholar]
  44. Zhang, C.; Chen, M.; Li, R.; Fang, C.; Lin, H. What’s going on about geo-process modeling in virtual geographic environments (VGEs). Ecol. Model. 2016, 319, 147–154. [Google Scholar] [CrossRef]
  45. OGC. Styled Layer Descriptor. Open Geospatial Consortium Inc. Available online: http://www.opengeospatial.org/standards/sld (accessed on 12 February 2017).
  46. CartoCSS. Available online: http://tilemill-project.github.io/tilemill/docs/manual/carto/ (accessed 12 February 2017).
Figure 1. Emergency symbol libraries. (a) The existing symbol libraries; (b) The additional symbol library.
Ijgi 06 00095 g001
Figure 2. Example symbols from the proposed symbol library.
Ijgi 06 00095 g002
Figure 3. Framework of the interactive map symbol construction method.
Ijgi 06 00095 g003
Figure 4. Class diagram for the construction of interactive map symbols.
Ijgi 06 00095 g004
Figure 5. Process of point symbol construction.
Ijgi 06 00095 g005
Figure 6. Data file fragment for the medium reservoir point symbol.
Ijgi 06 00095 g006
Figure 7. Examples of the point symbol interactive controls and attribute settings.
Ijgi 06 00095 g007
Figure 8. Basic process of the construction of line and area symbols.
Ijgi 06 00095 g008
Figure 9. Class diagrams of the basic element construction factory.
Ijgi 06 00095 g009
Figure 10. Example of how a control parameter works for altering line distance.
Ijgi 06 00095 g010
Figure 11. Example of the creation process for a specific symbol.
Ijgi 06 00095 g011
Figure 12. Shape change based on the movement of graphic control points.
Ijgi 06 00095 g012
Figure 13. Interactive editing of a customized symbol to represent the distribution of affected people.
Ijgi 06 00095 g013
Figure 14. Symbol graphics drawing and interfaces.
Ijgi 06 00095 g014
Figure 15. Main interface of the prototype system.
Ijgi 06 00095 g015
Figure 16. Examples of interactive mapping through editing corresponding parameters. (a) Dynamically change of magnitude; (b) Dynamically change of the status of potential risk; (c) Dynamically change of the area of concern.
Ijgi 06 00095 g016
Figure 17. Examples of response situations. (a) Various advancing and transportation actions; (b) Interactive mapping of dynamically changing responses.
Ijgi 06 00095 g017
Figure 18. Cross-platform capabilities of the interactive map symbols.
Ijgi 06 00095 g018

