1. Introduction
Natural disasters such as earthquakes can take thousands of human lives, cause extensive destruction to infrastructure, flatten buildings, and dramatically change the land surface. After a disaster occurs, knowing the location and extent of damaged buildings over a large affected area is vital for emergency response actions and rescue work. In recent decades, various kinds of remote sensing data, such as aerial or satellite images, Lidar and SAR, have been widely used to identify, detect, and assess disasters. Specifically, high-resolution aerial images can be obtained in a much more controlled fashion, both in terms of time and flight planning and at much higher geometric, spectral, and radiometric resolution. This is more suitable for fast and reliable post-disaster damage assessment due to accessibility and rapid acquisition [
1]. Detecting damaged building region using high-resolution aerial images can support faster and more effective decision making and disaster management.
Many approaches for detection and estimation of building damage by earthquakes have been proposed. These approaches can be categorized into four types. The visual interpretation method [
2,
3,
4] is employed to detect and assess building damage using various remote sensing images and GIS data, but depends on many auxiliary tools (e.g., ArcGIS10.2). Visual interpretation is the most widely used for building damage detection as currently it is the most accurate method. Unfortunately, it is time-consuming and requires trained operators, which is not appropriate for rapid damage assessment. The single post-disaster data method is another method to detect building damage using only one set of remote sensing data collected after a seismic event [
5,
6,
7,
8]. Post-disaster data can be quickly and directly acquired by various remote sensing technology, such as satellite, aerial and SAR images. The approach uses feature extraction to detect the building damage supported by auxiliary pre-earthquake GIS vector data. This method is more suitable for detecting the extent of building damage in real time. The change detection method [
9,
10,
11], compares various pre- and post-earthquake features, can lead to more accurate and reliable results. This method includes the height feature change from Lidar and stereo images, the texture feature change from optical images and backscattering, and correlation coefficients and coherence from SAR images. Owing to its speed and automation, this approach is the most commonly employed technique for damaged building detection. This method is more suitable for detecting building damaged regions for emergency response actions and rescue work. Finally, the multi-data fusion method [
12,
13,
14] has been employed to detect the building damage. For example, ortho-image and Lidar fusion, optical image and SAR fusion, and ortho-image and oblique image fusion methods have been proposed and used. As these types of building damage are complex, multi-data fusion methods are well suited for detailed classification of building damage.
These studies have obtained satisfactory results for building damage detection. Due to the abundant and detailed spatial information provided by high-resolution imagery, a great deal of research has focused on detecting the detailed damage information on individual buildings for later reconstruction in disaster areas. This increases computation cost since various features of buildings are extracted such as height, area, and texture. If disaster managers can timely and accurately extract the location information and extent of the damage at an early stage of a disaster, fast response and rescue actions will save more lives. Therefore, rapidly and accurately obtaining the damaged building region is a problem requiring further research.
Based on initial work, we proposed a quick and accurate approach based on semantic scene change for damaged building regions detection. The approach uses pre-disaster satellite images and post-disaster aerial images to extract the damaged building regions, because the post-disaster aerial images can quickly be obtained in a manned controlled fashion, while pre-disaster satellite images are obtained from historical dataset. Our study employed the following strategies to detect the damaged building regions: the visual Bag-of-Words (BOW) model is used to classify the scene for pre-disaster images, and building region can be obtained. Pre-disaster building regions are superimposed over the post-disaster images, and pre- and post-disaster building regions are uniformly encoded based on a visual BOW model. The semantic scene change of damaged and non-damaged regions is discriminated using the SVM classifier. The advantage of our proposed method utilizes semantic and multi-temporal information to detect the damage, rather than pixel-by-pixel or object-oriented comparison between pre- and post-disaster, which can overcome the “semantic gap” problem and not set the threshold value of change detection. Our method uses parallel implementation for speed optimization, particularly given the time pressure in post-disaster response. The proposed method was applied on high-resolution satellite and aerial images from the 2014 Ludian area, Yunnan, China. Experimental results show the proposed method is a stable and effective way to detect damaged building regions.
2. Study Area and Data Sources
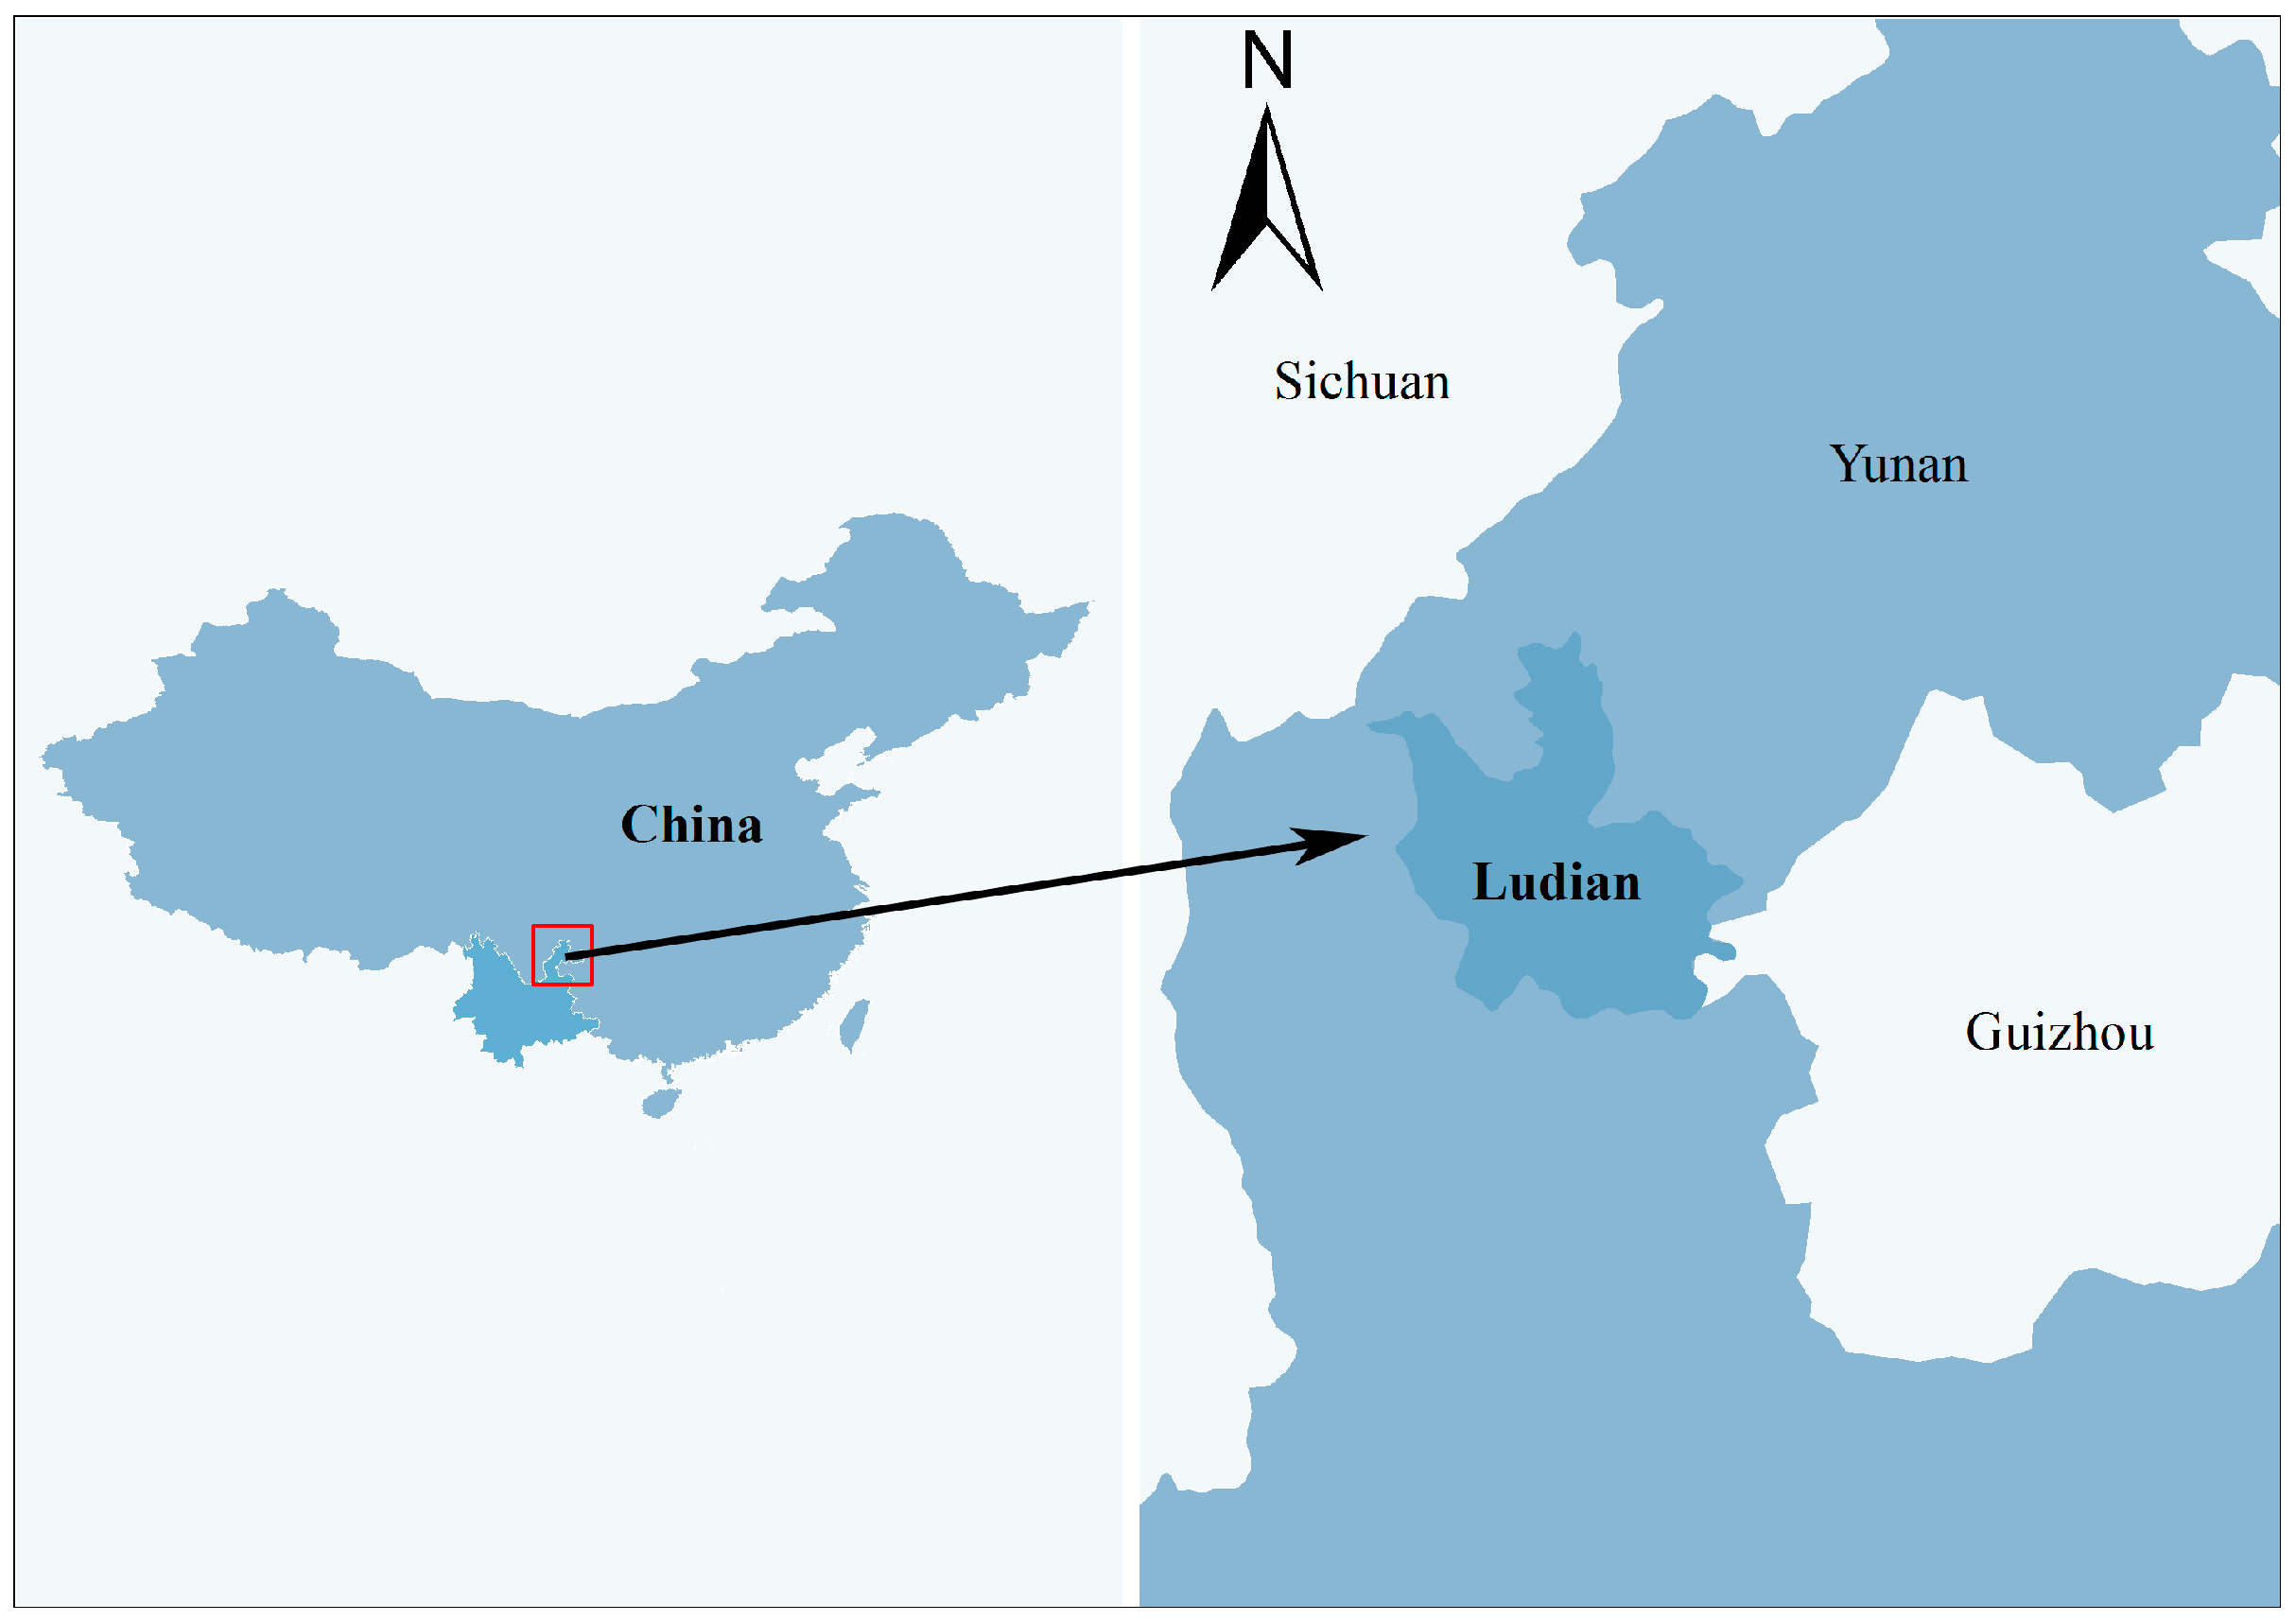
The Ludian earthquake with a magnitude of 6.1 struck Yunnan Province of China at 16:03:01 China Standard Time (CST) on 3 August 2014. According to the official report issued by the Ministry of Civil Affairs of the People’s Republic of China, the Ludian earthquake killed at least 617 people, injured more than 2400, with approximately 181 missing. At the same time, there was tremendous damage to buildings, infrastructure and the environment.
In order to evaluate the effectiveness of the proposed method, researchers selected the urban area of the Longtou hill town of Ludian in Yunnan province as the study area, shown in
Figure 1. The pre-disaster images were multi-spectral Worldview-2 images acquired on 14 March 2013, with a spatial resolution of 0.5 m. The post-disaster images were obtained via manned aircraft with a SWDC-5 camera platform on 5 August 2014 at a flying height of approximately 900 m. The spatial resolution was 0.2 m. The post-disaster images were quickly acquired only three days after the earthquake. The study used two types of remote sensing images to detect the damaged building regions for our paper.
3. Methodology
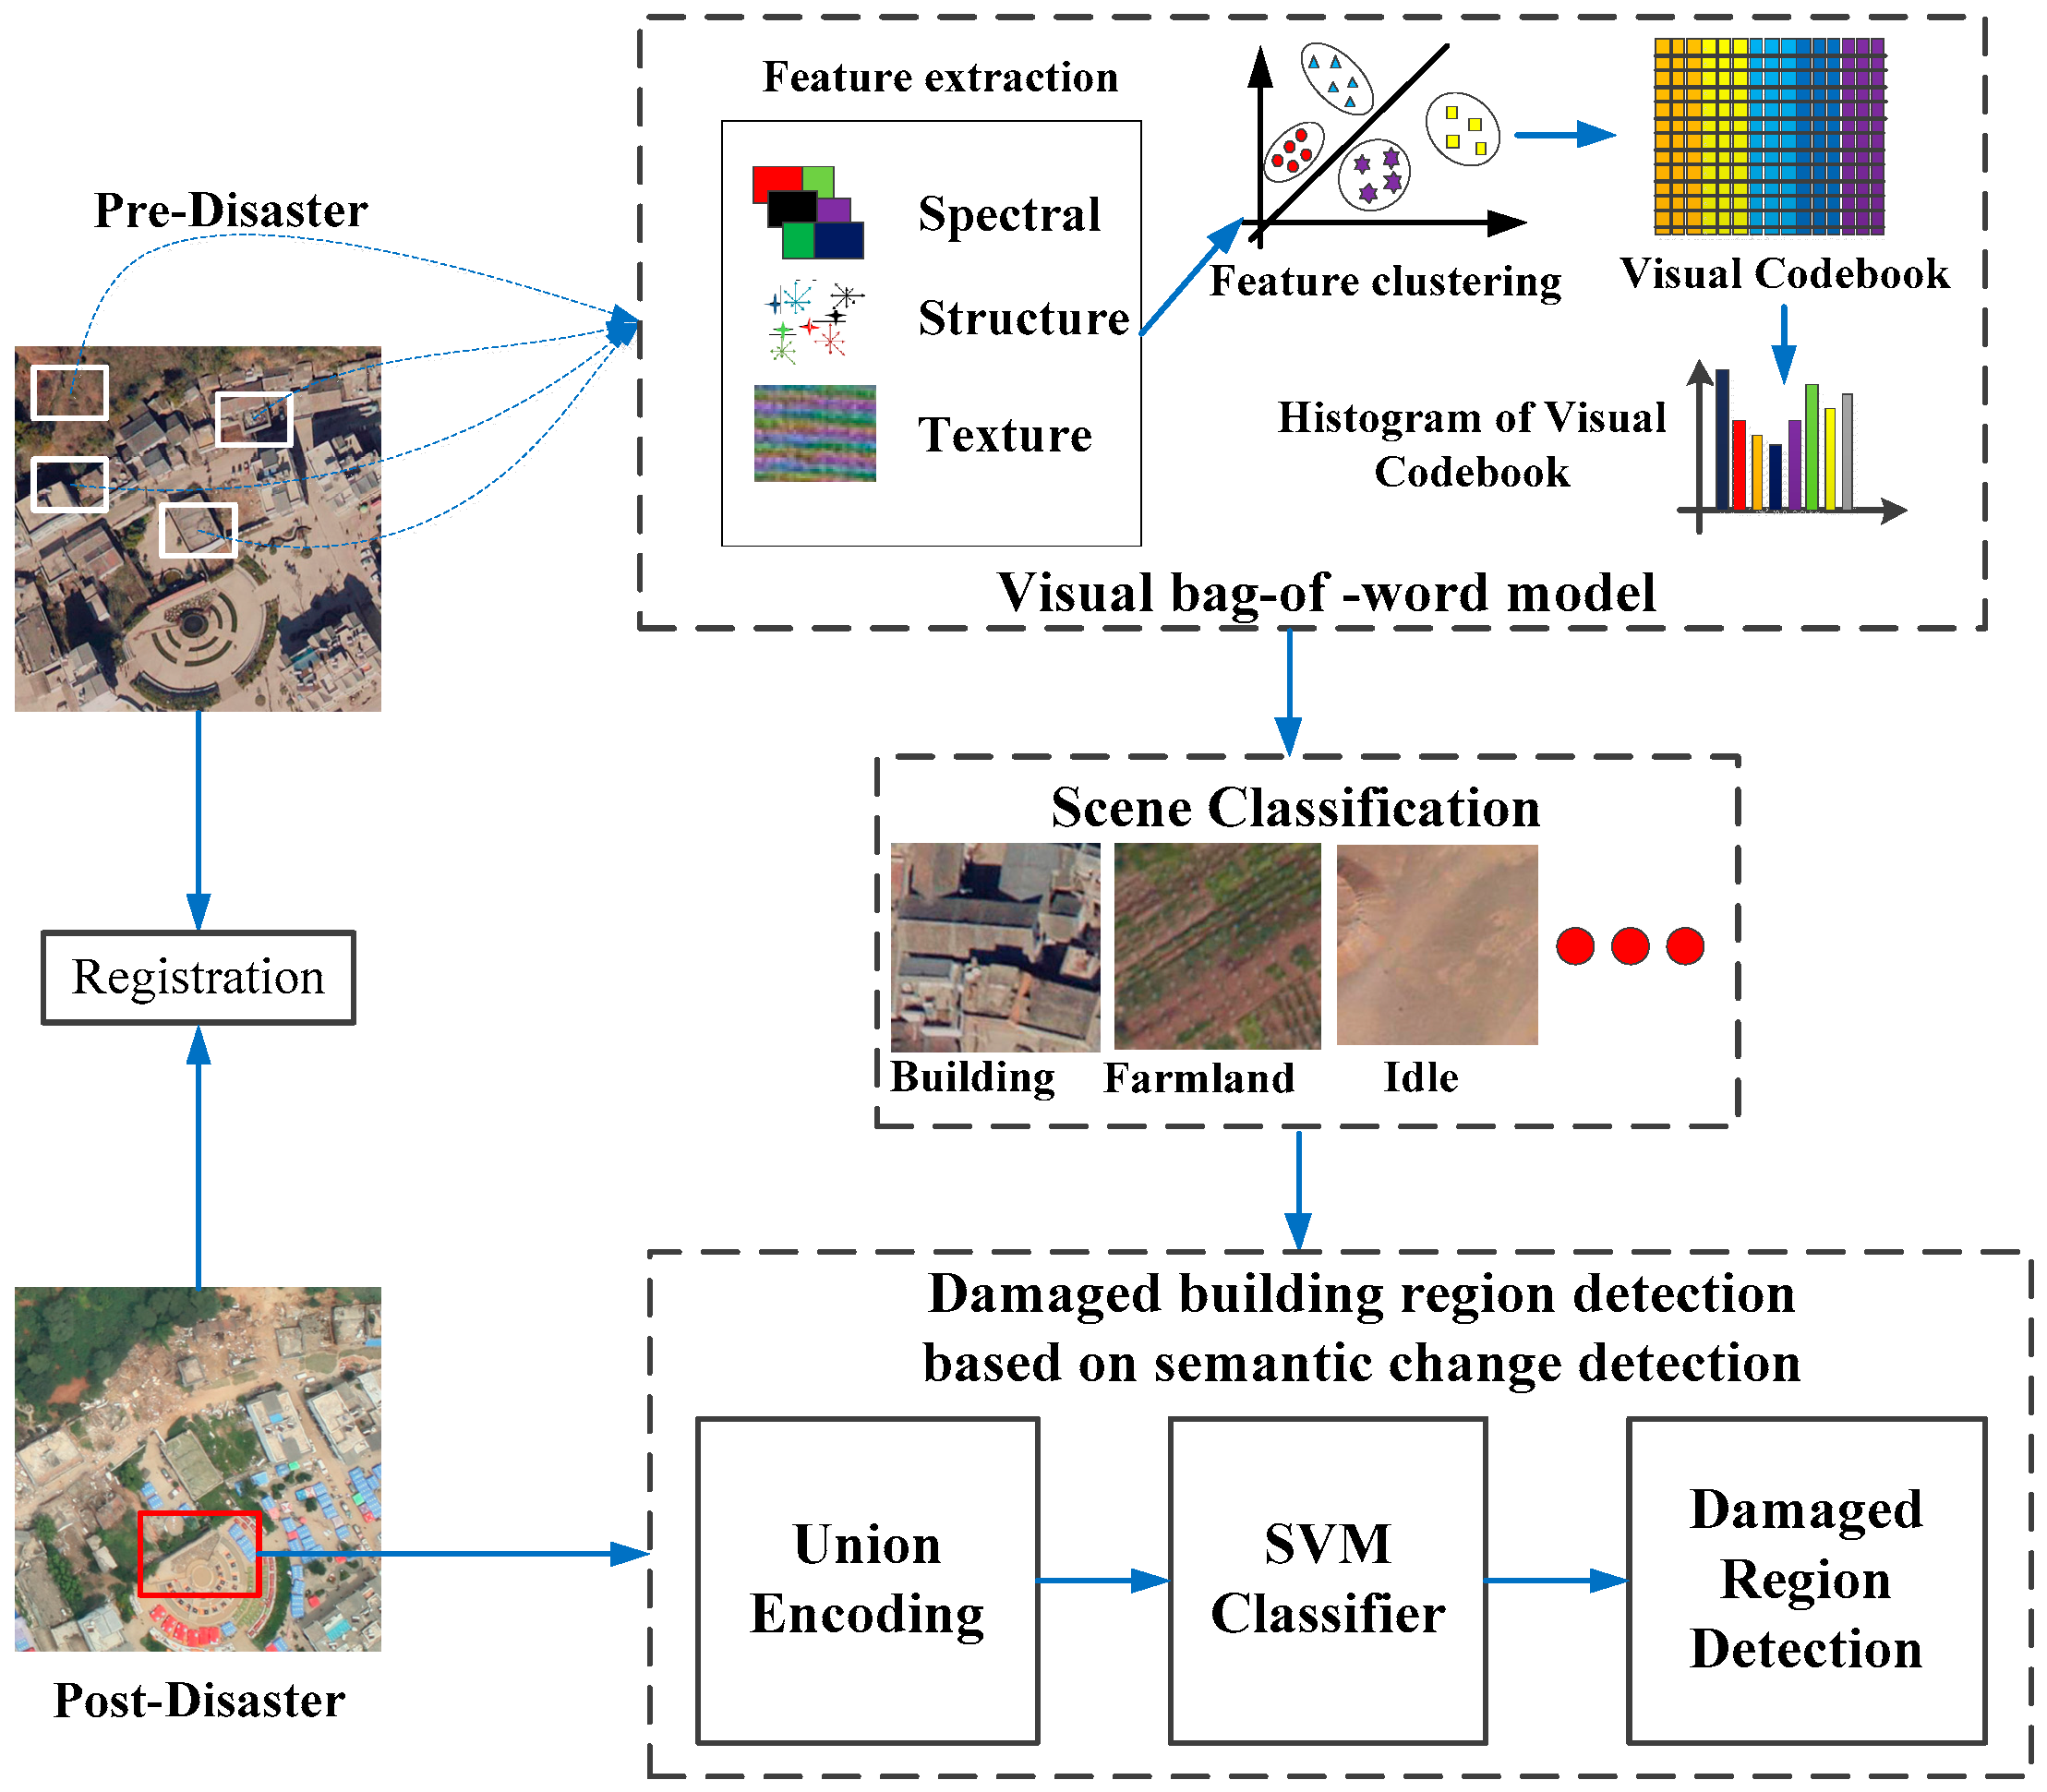
In this section, our method for detecting damaged region of building is described in detail. The framework of the proposed method is shown in
Figure 2, including the following steps: (1) preprocessing; (2) scene classification of pre-disaster image based on visual BOW model; and (3) detection of damaged building regions based on semantic scene change.
3.1. Preprocessing
The preprocessing stage consisted of two steps: registration and radiometric correction. First, aerial images are mosaicked with Agisoft PhotoScan and the Position and Orientation System (POS) information, the aerial images were geo-referenced. Scene changes between the pre-disaster satellite image and post-disaster aerial images should be co-registered, and the spatial resolution of pre-disaster image is 0.5 m, while the spatial resolution of post-disaster image is 0.2 m. This study resampled post-disaster images to 0.5 m using a bilinear interpolation method, giving the two temporal images the same spatial resolution. Geo-referencing and accurate co-registration guaranteed that the corresponding scenes covered the same area. Second, the method in [
15] is used to correct for radiation distortion through the decrease or elimination of radiation difference between multi-temporal images.
3.2. Scene Classification Based on the Visual BOW Model
Bag of Words (BOW) was initially used for natural language processing and information retrieval from documents that are considered unordered sets of words. Recently, in computer vision, the visual BOW model has been employed as an effective and robust feature encoding approach to obtain the statistical characteristics of thematic objects for remote sensing scenes [
16]. It can provide a mid-level representation to bridge the semantic gap between low-level features extracted from the image and the high-level concepts of humans [
17]. This model has been successfully applied in areas such as image classification [
18], object recognition [
19], and image retrieval [
20].
In the visual BOW model, object semantic information in the image is represented by the statistical feature frequency, allowing a scene of remote sensing images to be classified by the thematic objects it contains. The processing of the scene classification based on visual BOW includes the following steps: (1) Extract feature as visual words from the scene images; (2) generate a codebook for the visual BOW model; (3) represent each scene with the codebook frequency; and (4) classify the image scenes into semantic scene classes. The description and related background of each step is provided below.
3.2.1. Feature Extraction
High-resolution remote sensing images contain abundant spectral, structural and textural characteristics. The extracted features from an image patch can describe the different thematic objects for the visual BOW model. In this paper, researchers employ three descriptive features for the scene classification of high-resolution remote sensing image: color feature, dense SIFT (Scale-invariant feature transform) feature, and shape-distributions feature, respectively.
Color can be used to distinguish the spectral difference for the thematic objects, such as vegetation and water. The Hue-Saturation-Value (HSV) color space is more advantageous than Red-Green-Blue (RGB) for extracting color features, as it separates the luminance and brightness component from the hue. Hence, the HSV space is uniformly quantized using H, S and V in the scene. This includes n1 levels in H, n2 levels in S, and n3 levels in V, then the three color components are combined into one, one-dimensional vector: L = n2 × n3 × H + n3 × S + V(L∈[0, (n1 × n2 × n3 − 1)]). Therefore, the histogram of vector L is the color feature obtained from each scene, and the number of dimensions of color feature is n1 × n2 × n3.
Dense SIFT can be used to distinguish the structural difference for the thematic objects, such as storage tanks and dense residential areas. The SIFT descriptor is invariant to translation, rotation, and scaling in the image domain and is robust with regard to illumination variation [
21]. The dense SIFT descriptor is more effective for feature extraction. Therefore, based on the previous work discussed in [
22], we used the gray dense SIFT descriptor with 128 dimensions to represent structural features.
The final features used were shape-distributions [
23], which were employed to distinguish the texture difference for the thematic objects, such as the elongation and the compactness of a shape. Shape-distribution features can describe local edge and global shape characteristics for each scene. The study employed the elongation histogram (EH), the compactness histogram (CpH), the scale ratio histogram (SRH), and the contrast histogram (CtH) as the feature descriptor. These features are defined as the “similarity invariant local features” (SI) in [
23]. EH, CpH, SRH, and CtH of shape-distributions are calculated in the following equations:
where
λ1 and
λ2 are the eigen values of the inertia matrix,
μ00(
s) is the area of the shape
s,
is the mean operator on
M, and
M is the partial neighborhood of the order M of s. At each pixel
x, s(
x) is the smallest shape of the topographic map containing
x, and mean
s(x)(
u) and var
s(x)(
u) are, respectively, the mean and variance of u over
s(
x).
To these extracted features, we use local and global feature fusion in the visual BOW to detect the damaged building regions, where Dense SIFT is adopted as the local feature, color and shape-distributions feature are adopted as the global feature.
3.2.2. Codebook Generation
Let F = [f1, f2, …, fN] be feature descriptors extracted from each scene as calculated, where each fi is M dimensional feature vectors and N is the number of features in each scene. This study clustered the feature descriptors F with a k-means algorithm, where the number of k-means clusters was the size of the codebook. A generated codebook was denoted by W = [w1, w2, …, wK], where K is the size of the codebook.
3.2.3. Scene Representation with the Codebook Frequency
In the visual BOW model, a scene is represented by different frequency codebooks. Therefore, the codebook histogram of scene regions can be obtained. Let
N = [
n1,
n2,
n3, …,
ni, …,
nK] be a histogram statistical vector. Due to the different effects on the image representation from the different visual words, results are unsatisfactory when directly using the histogram vector for recognition. Hence, we employed the weight scheme as presented in [
24] and normalized it with the L2 norm [
25] to generate a different weight histogram vector. The weight vector is represented by a
K-vector
T = [
t1,
t2,
t3, …,
ti, …,
tK]. The weight
ti can be computed as:
where
nid is the number of occurrences of word
i in the scene,
nd is the total number of words in the scene region,
ni is the number of occurrences of word
i in the whole scene regions, and
N is the number of the whole scene regions.
3.2.4. Scene Classification Based on SVM
Based on the features, a SVM classifier [
26] is trained to process the samples that were manually collected as different scene regions. Given a set of labeled training samples, SVM can learn a linear decision boundary to discriminate discrete scenes.
3.3. Damage Region Detection of Buildings Based on Semantic Scene Change Detection
Scene change detection is different from traditional change detection, as this approach considers land-use transition from a semantic point of view. Damaged building regions can be viewed as a land-use transition because damaged building regions represent a change from a region of buildings to debris or rubble. Therefore, our study employs the semantic scene change concept to detect the damaged building region.
Traditional strategies for detection of damaged building regions based on semantic scene change is summarized as follows: first, pre-disaster images were classified using the method detailed in
Section 3.2. Then, building regions acquired by scene classification were superimposed over post-disaster images to obtain the post-disaster region buildings. Finally, researchers compared the semantic information of the same region of pre- and post-disaster to detect the scene change. If the scene has changed and the land-use transition type is from building region to debris or rubble region, damaged building regions are detected. The key problem of using a traditional strategy is the determination of the semantic information change of the same region of pre- and post-disaster. Traditional methods directly compares semantic information, namely, computing the Euclidean or cosine distance between semantic information, and using this threshold to determine scene change. Selecting a suitable threshold value is subjective and empirical. Inspired by scene change detection discussed in [
27], the study team utilized a multi-temporal codebook learning method to detect change for the detection of damaged building regions. This detection procedure is self-adaption and have no subjective factors.
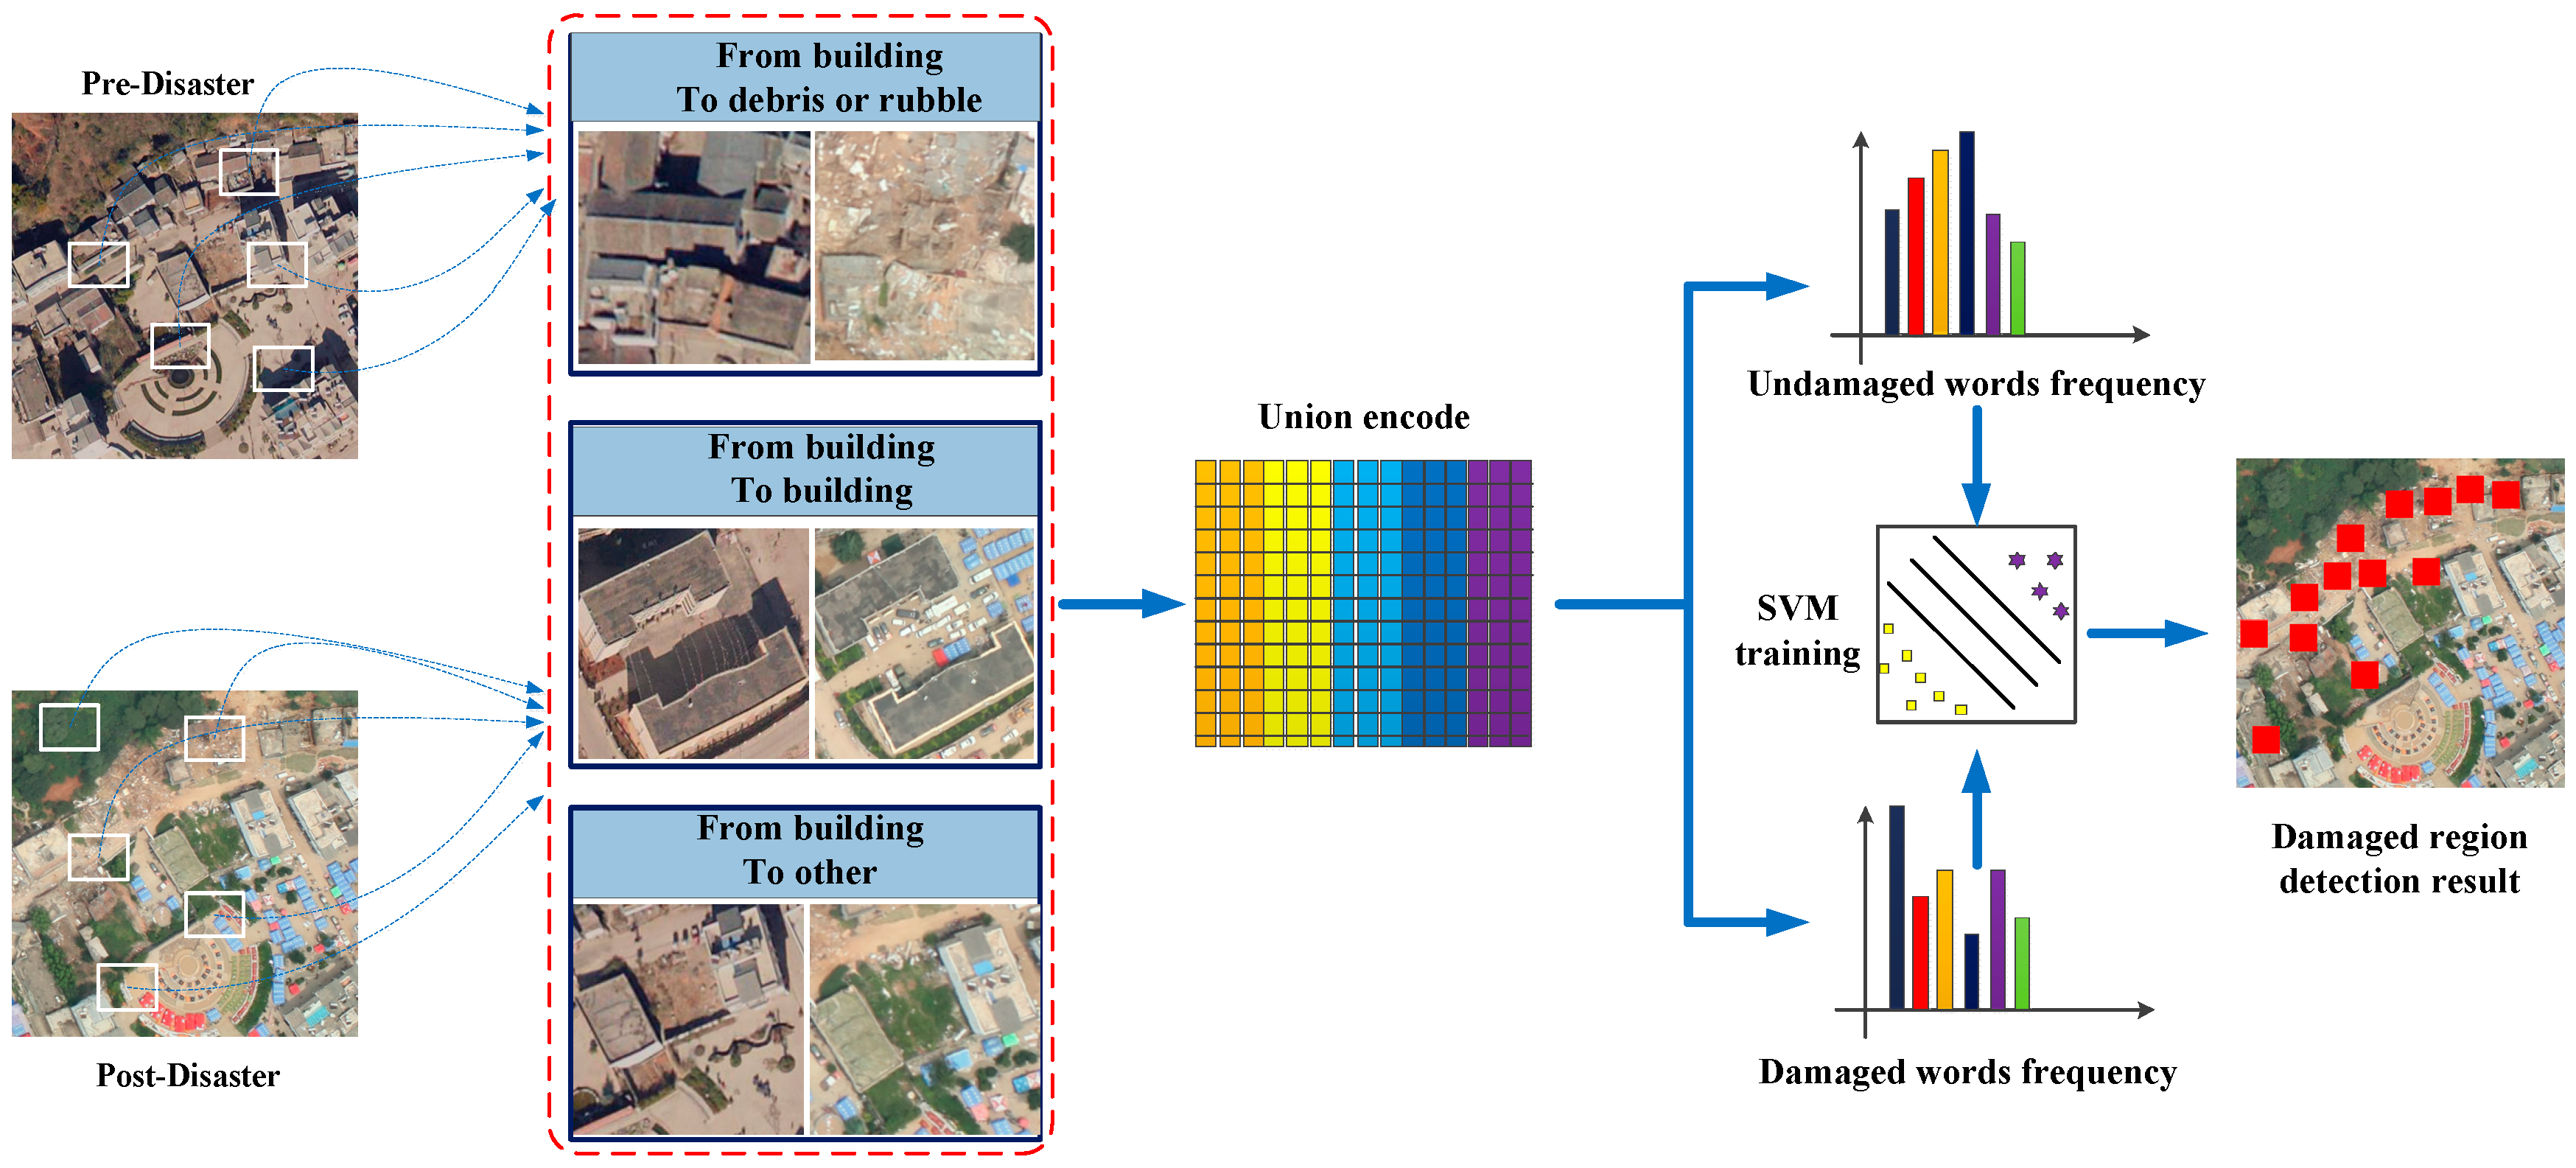
The entire procedure of the proposed method is shown in
Figure 3. Pre- and post-disaster building scenes cover the same study region at different times. After a disaster, building regions show three cases: some buildings become debris, some buildings remain unchanged, and some buildings are changed but undamaged. These cases are classified into two types: unchanged and change related to a disaster event. The damaged building region belongs to the latter type. Therefore, scene information of pre- and post-disaster was built upon a unified codebook based on visual BOW model, then these change regions are classified into two types using the SVM classifier: damaged and undamaged. Note that buildings that are changed but undamaged are classified as undamaged in this method. In the first step of the procedure, three types of multi-temporal samples are selected: (1) pre-disaster scene is building region and post-disaster scene are rubble or debris region; (2) pre- and post-disaster scene are building regions; and (3) pre-disaster scene is a building region, but the post-disaster scene includes other land uses, such as vegetation. These two regions are used to uniformly encode [
27] in the visual BOW model. The first type samples as positive and the latter two types as negative samples are trained using the SVM classifier. The precondition of the unified codebook is that pre- and post-disaster training samples must be at the same scale.
3.4. Procedure of Damaged Building Region Detection
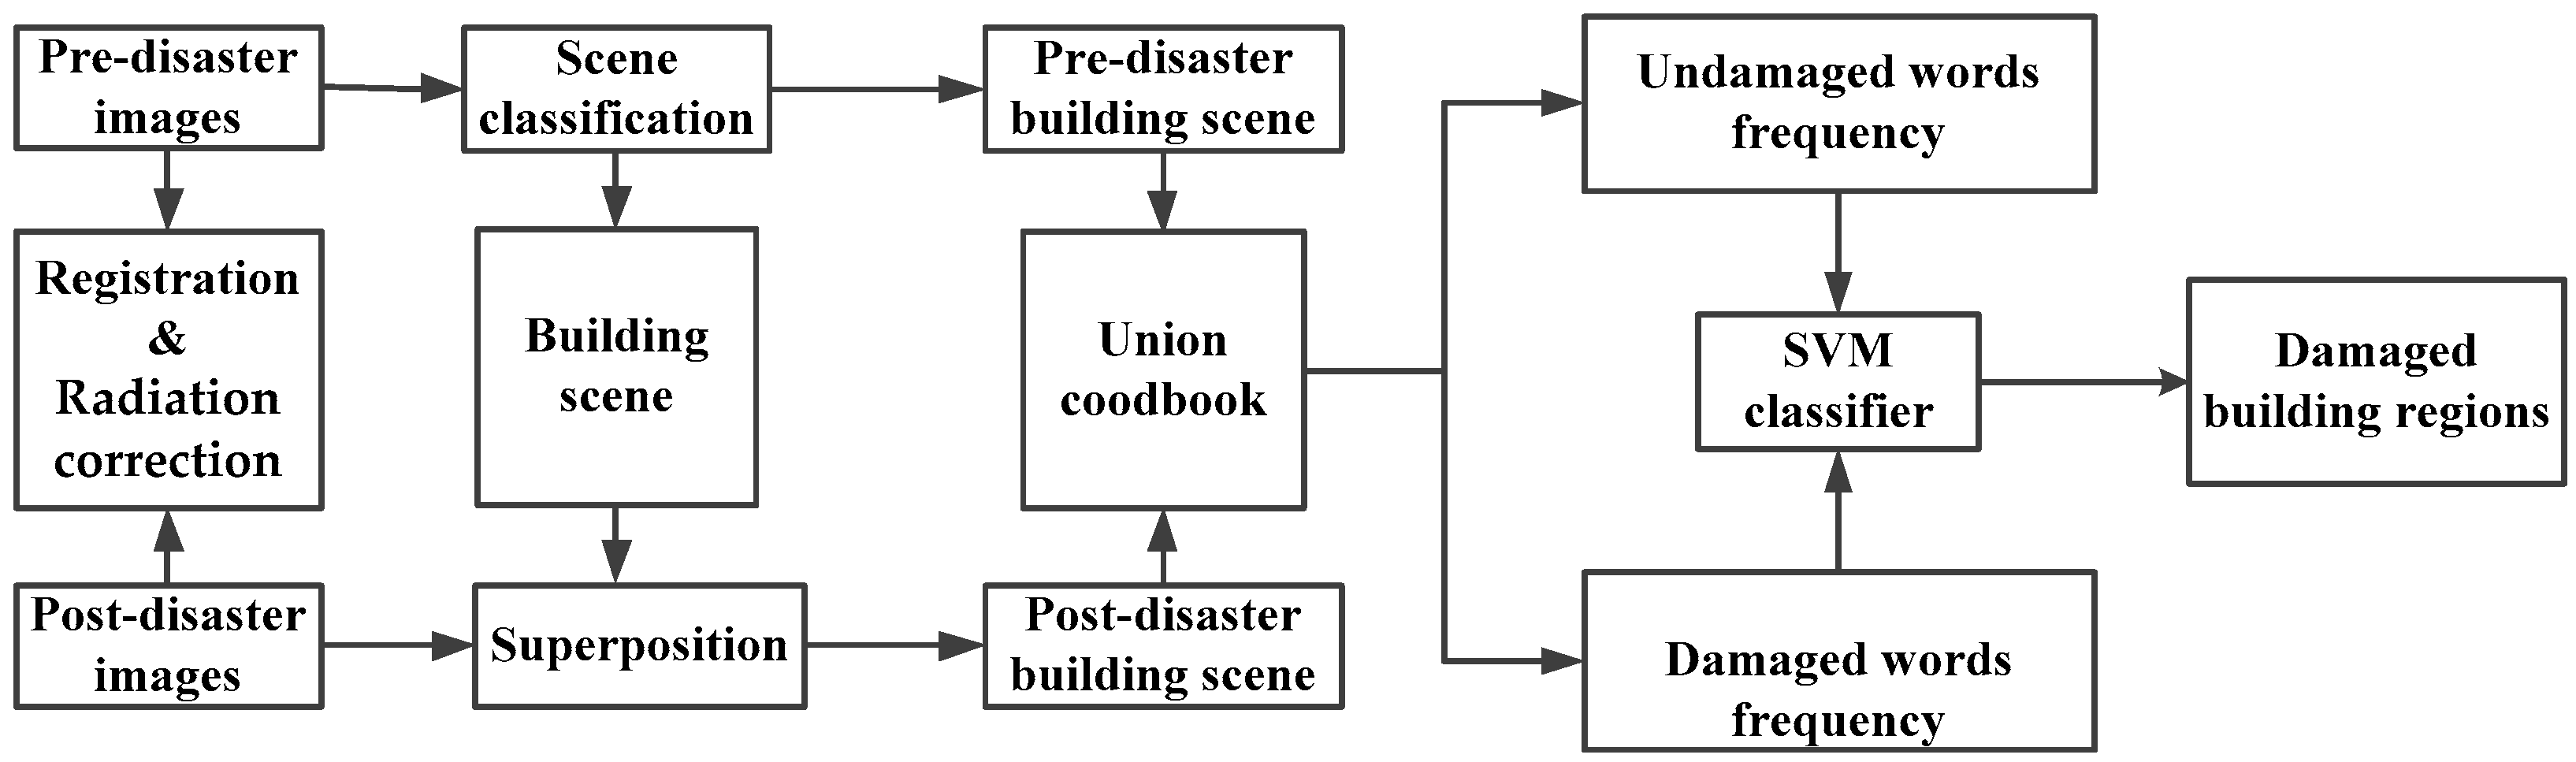
As shown in
Figure 4, the total procedure of damaged building region detection can be summarized. Preprocessing includes two steps: registration and radiation correction; patches are randomly selected from the pre- and post-disaster datasets as training samples; the visual words model is trained using the method detailed in
Section 3.3; the pre-disaster image is classified using the method detailed in
Section 3.2; and pre-disaster building regions acquired by scene classification are superimposed over post-disaster images. Multi-temporal regions are uniformly encoded in the visual BOW model, and then damaged and non-damaged building regions are classified using the SVM classifier. In order to increase optimization and meet the time pressures in post-disaster response, our method is implemented following a task parallel computation based on multi-CPU and GPU. Assuming that the number of building damaged regions is N, this method will then allocate these N tasks to the idle CPUs, N CPUs for instance. It is logical that the processing could be speeded up N times this method also uses siftGPU [
28] to extract features for speed optimization.
4. Results and Discussion
A comprehensive experiment was conducted to test the proposed method for detecting damaged building regions using pre- and post-disaster remote sensing images of Ludian. The pre- and post-disaster image sizes were 7000 × 3600 with red, green, and blue bands. We segmented a 3200 × 3000 patch to test the method. In the first phase of the experiment, we evaluated scene classification qualitatively and quantitatively using representative examples to determine whether the results satisfied the demands of damaged building region detection. We also evaluated damaged building detection methods qualitatively and quantitatively on several representative examples. The size of the visual words is a key parameter in the visual BOW model. Our study examines the effect of the number of visual words for damage region detection of buildings.
To evaluate the quality of damaged building detection, the precision, recall, and accuracy were calculated as Precision = TP/(TP + FP), Recall = TP/(TP + FN), and Accuracy = (TP + TN)/(TP + FP + TN + FN), where TP was true positive, FP was false positive, TN is was true negative, and FN was false negative. Experiments were carried out on a PC with 32 gigabyte (G) memory and Intel Xeon® CPU, E3-1220 with 3.10 GHz on VS2010 and opencv3.0, GPU based implementations were used on an NVidia Tesla K20 card.
4.1. Evaluation of Scene Classification Results
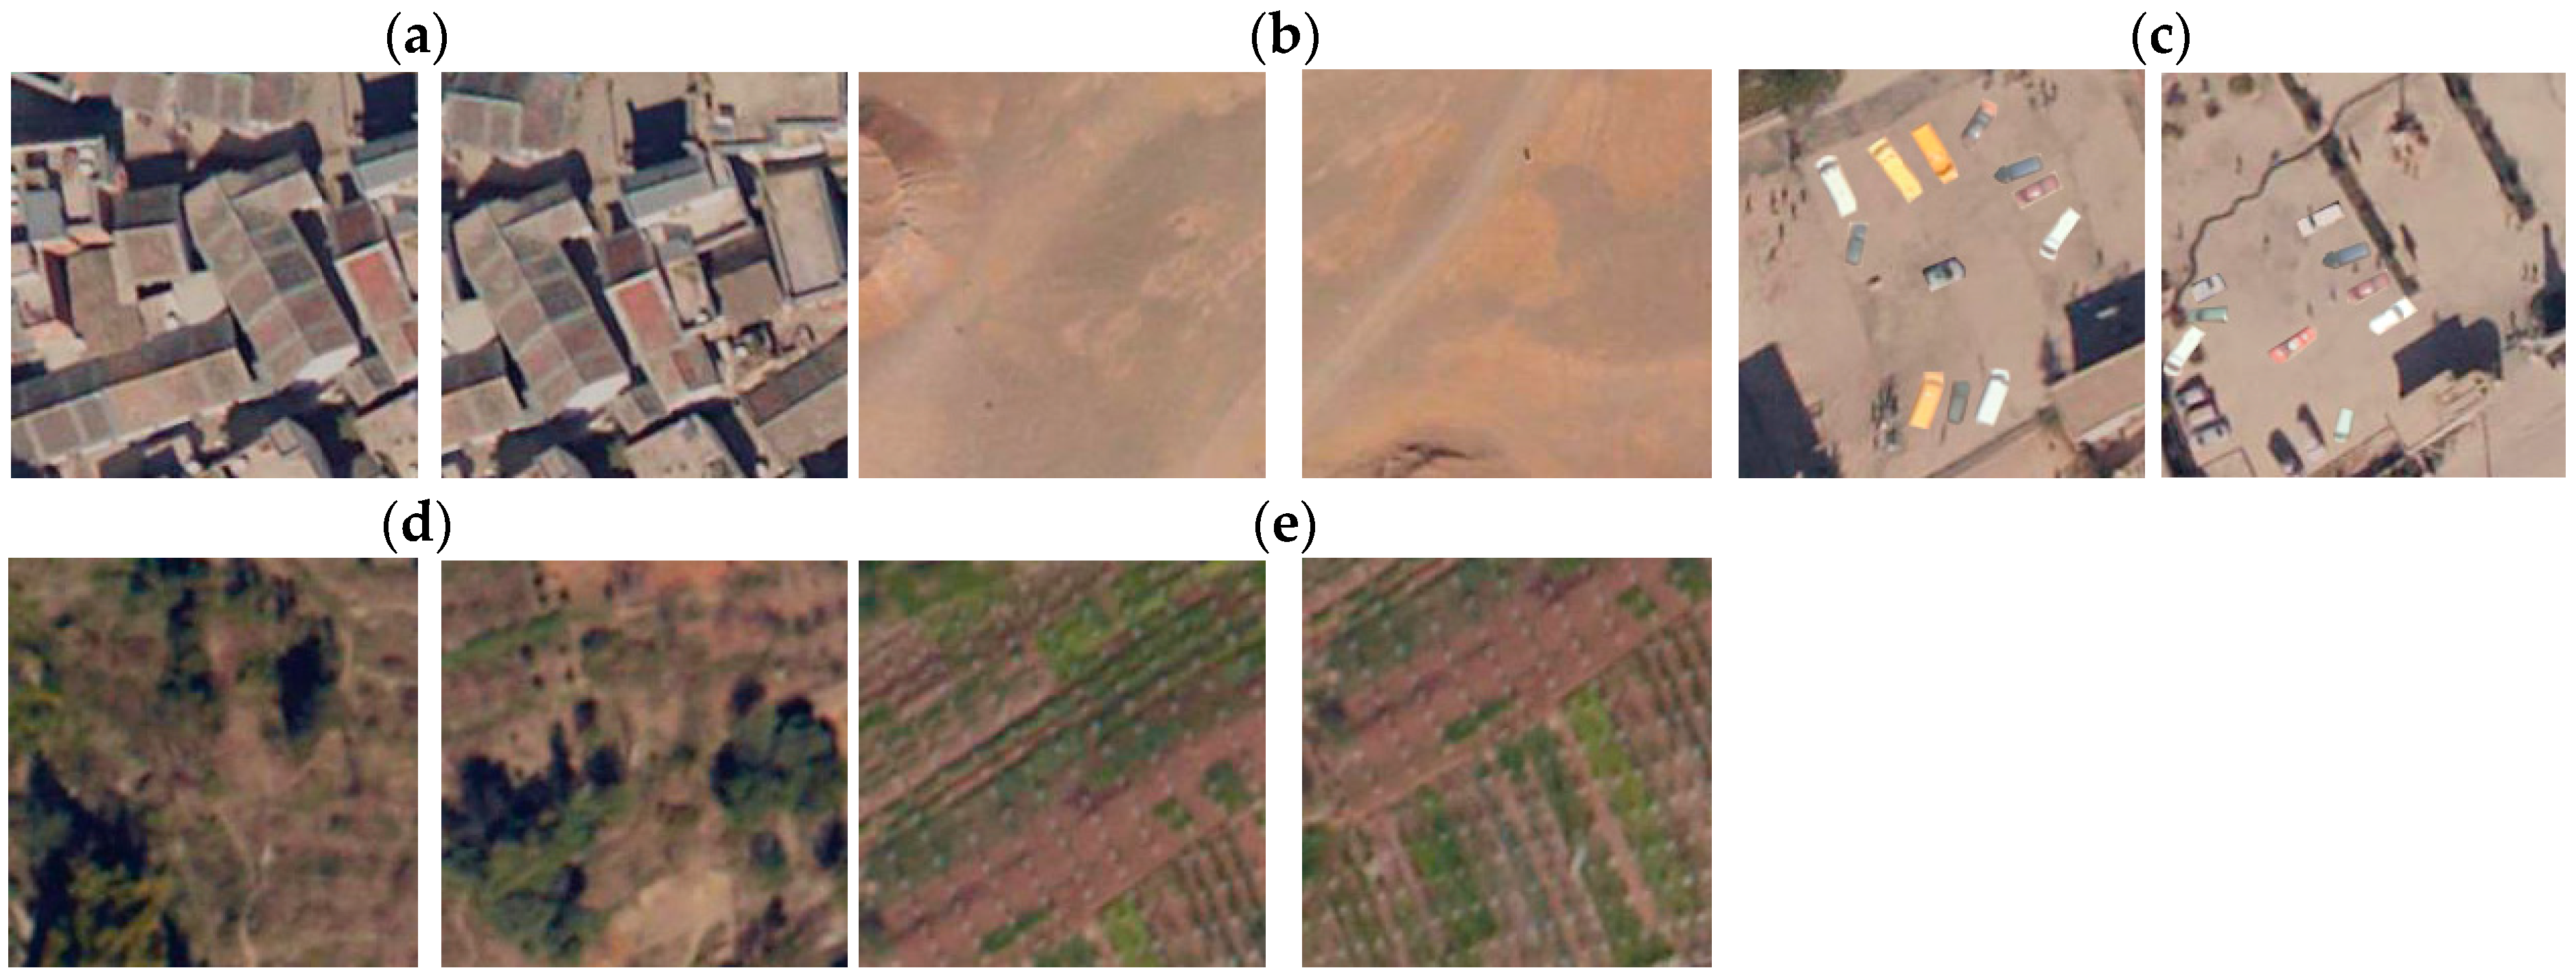
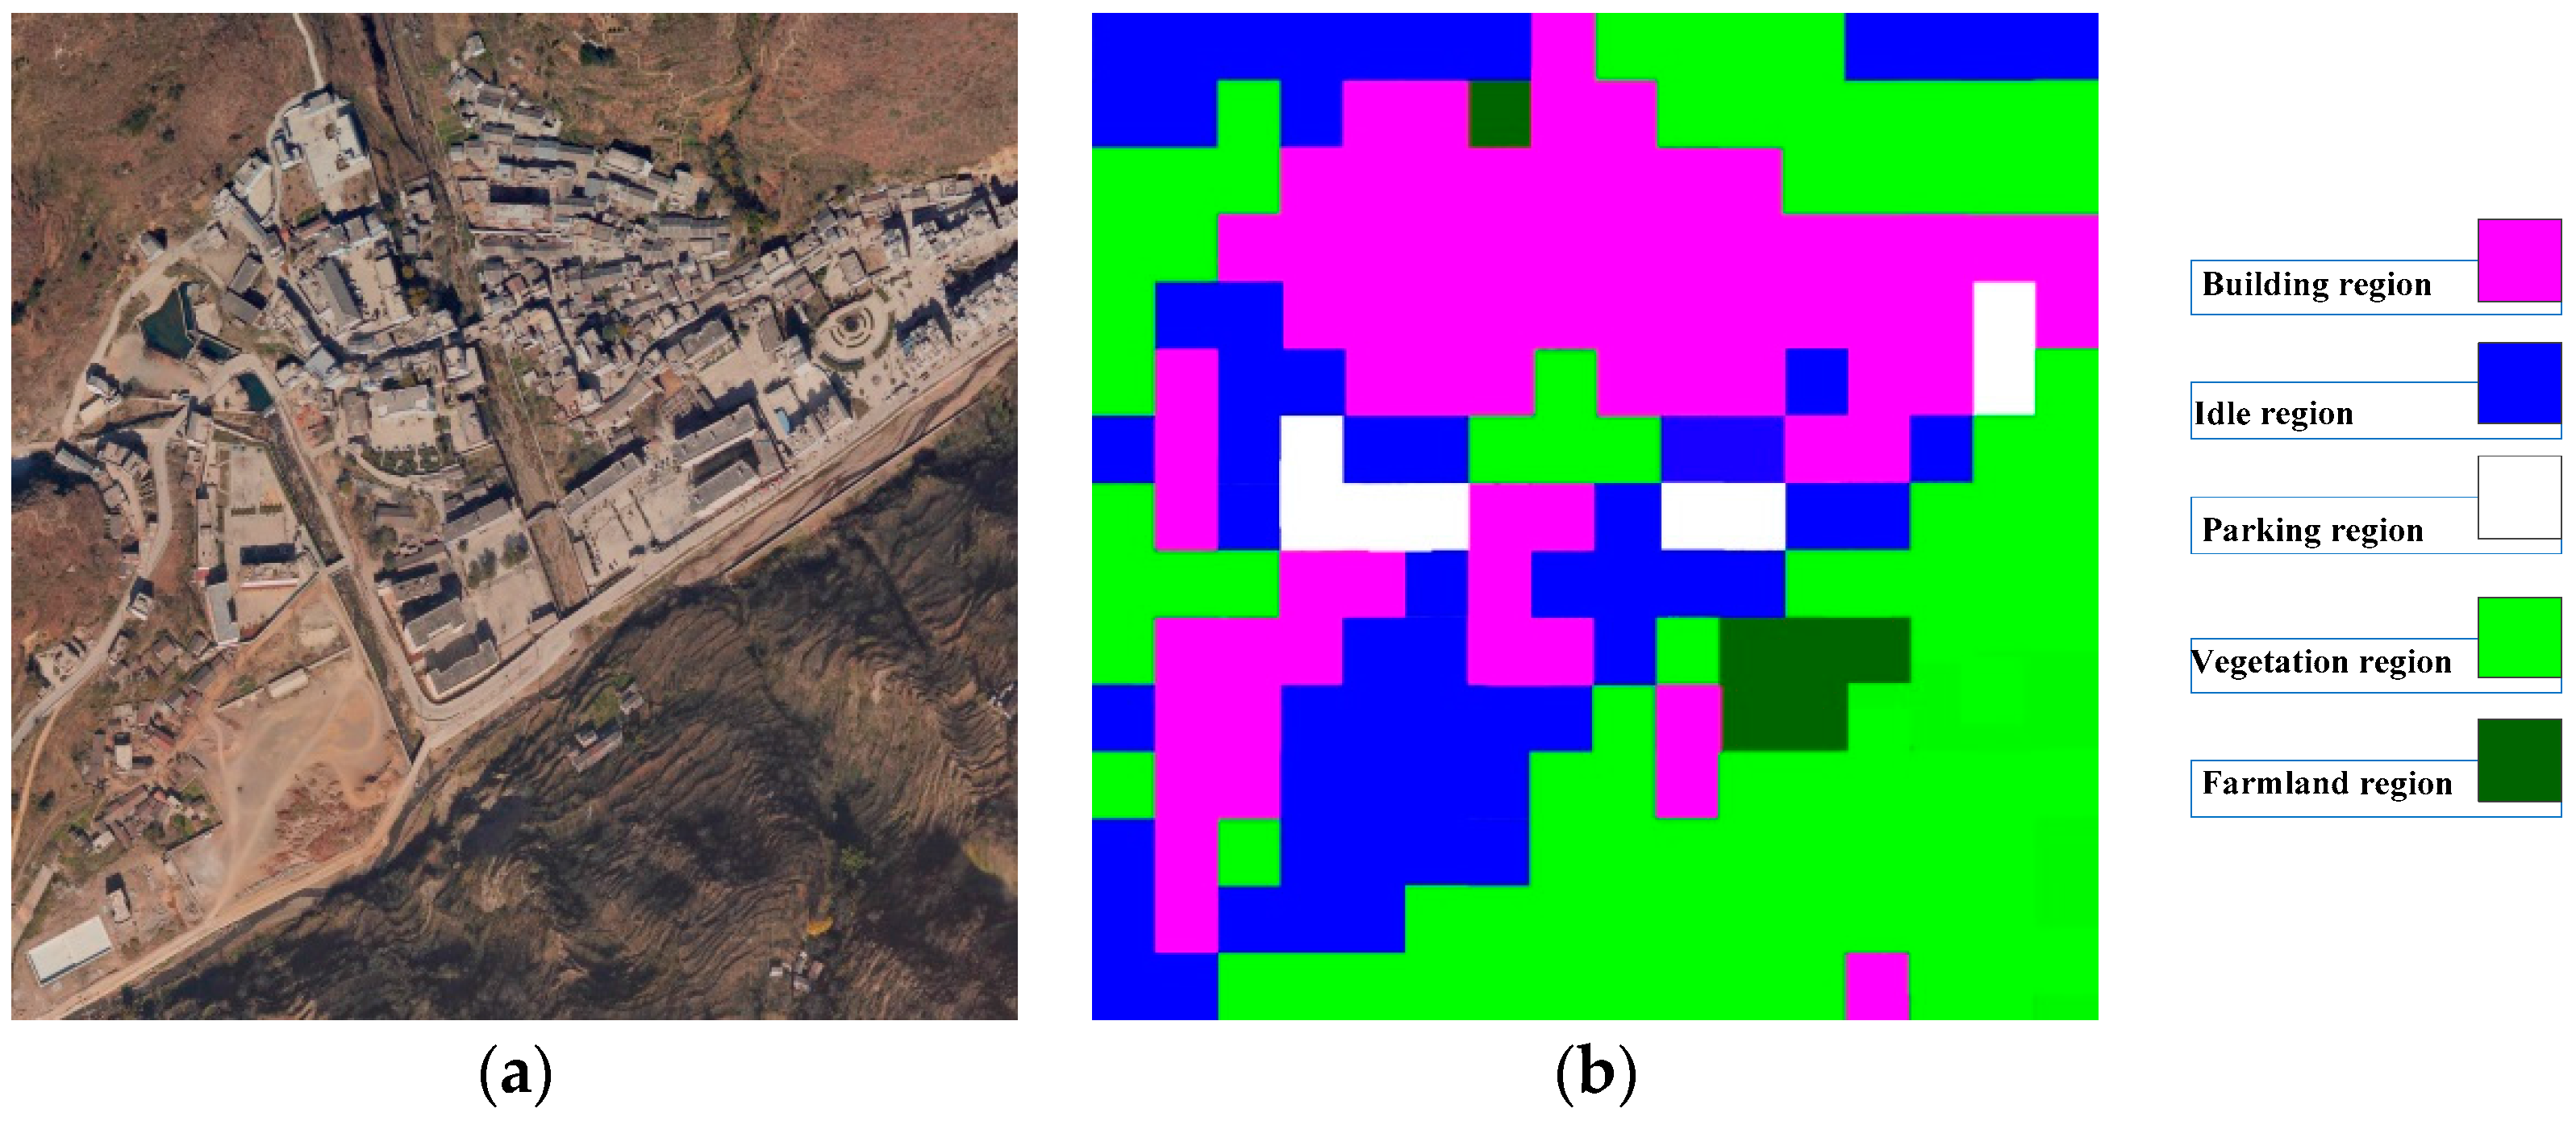
The scene classification method was evaluated using the pre-disaster image. The pre-disaster image was segmented to a cell size of 200 × 200 by a non-overlapping grid, obtaining 630 test scenes (35 × 18). As shown in
Figure 5, five classes were manually selected from the study scene. As shown in
Table 1, 575 samples were selected from the whole study scene for training and testing. Scene classification results are shown in
Figure 6.
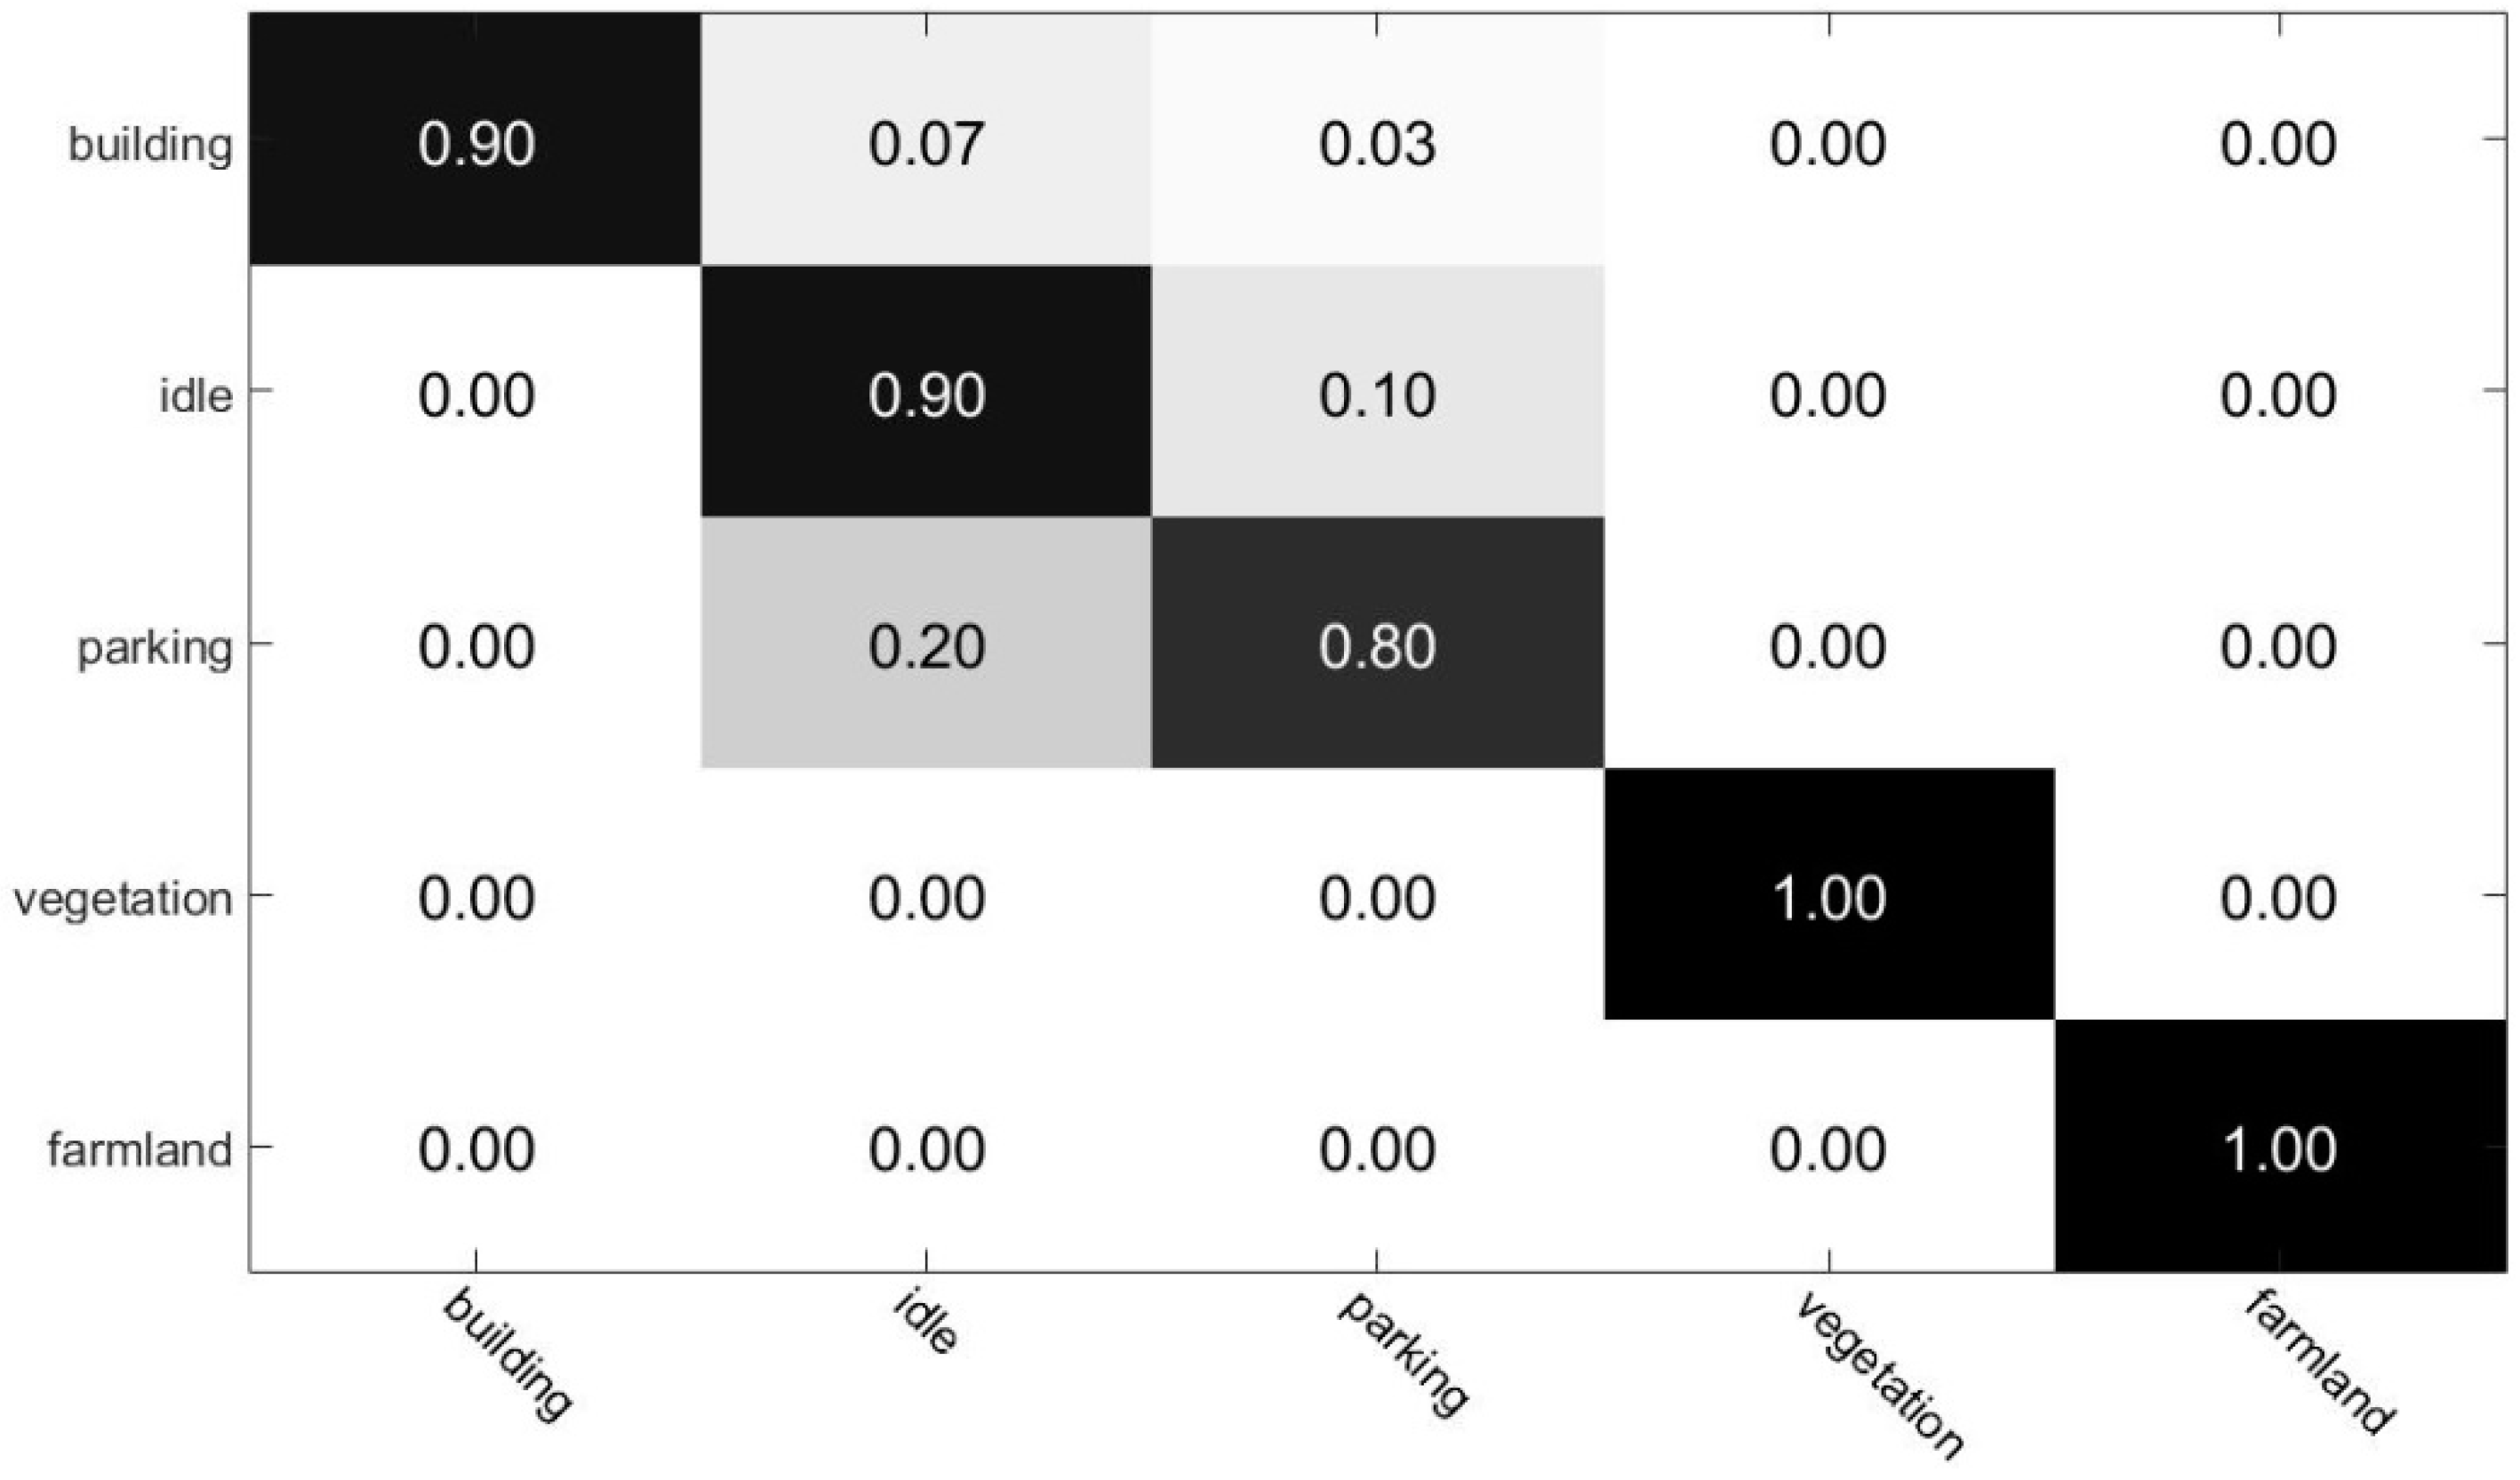
Figure 7 displays the confusion matrix for the scene classification method. As can be seen in the confusion matrix, farmland and vegetation are fully recognized; while accuracy of building, parking, and idle land recognition are 90%, 90%, and 80%, respectively. These building region classification processing results were the input for damaged the building region detection executed in the next step.
4.2. Evaluation of Damaged Building Region Detection Results
The proposed damaged building region detection method was evaluated using regions selected manually from pre- and post-disaster images. We selected 160 building regions, 100 building regions were used for training, where 60 regions were positive samples and 40 regions were negative samples; and 60 regions were used as test data, where 30 regions were damaged regions and 30 regions were undamaged regions.
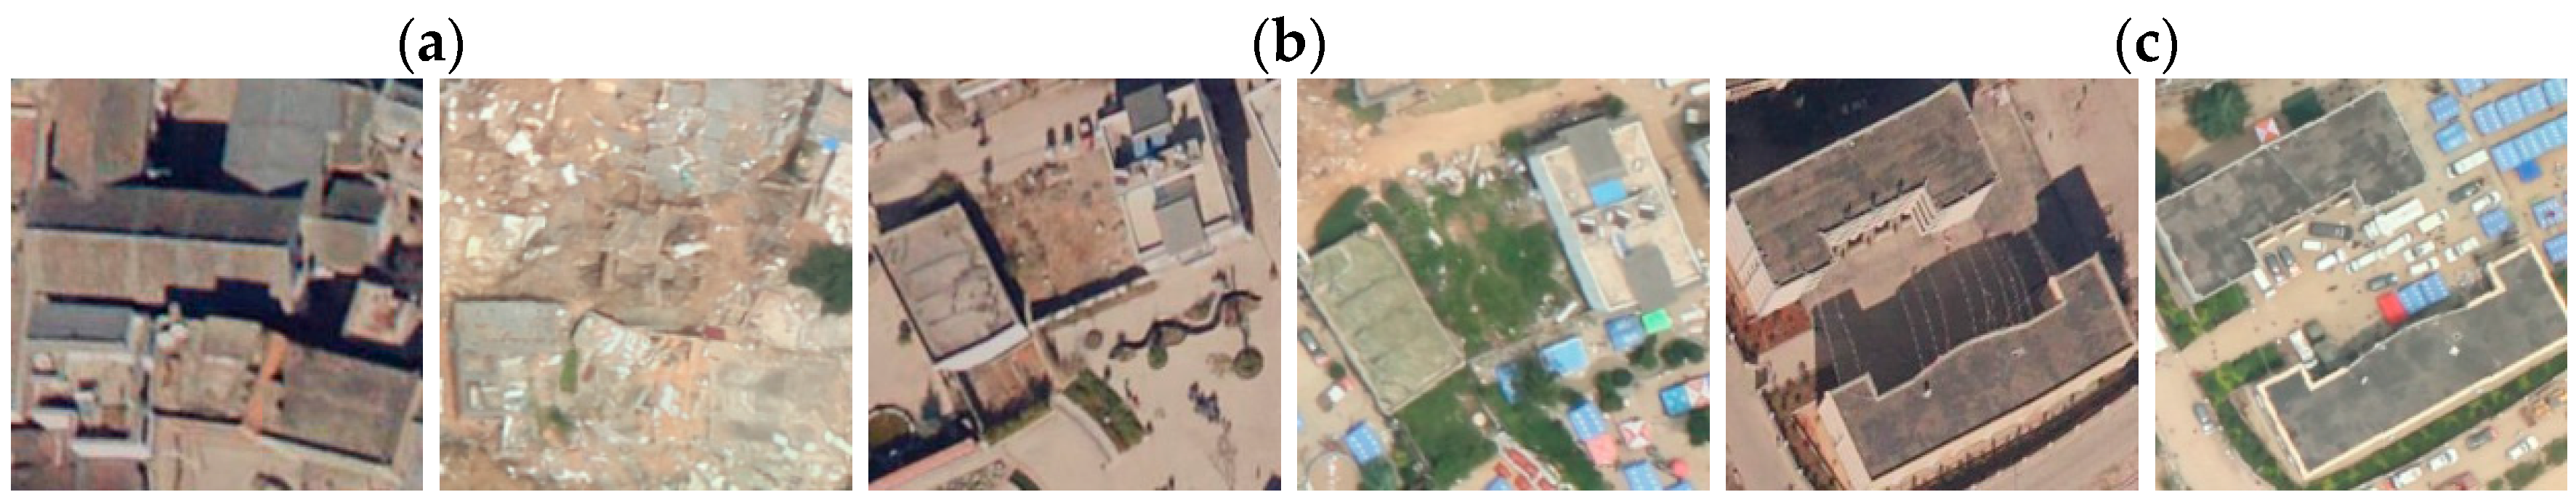
Figure 8 shows three examples of image pairs.
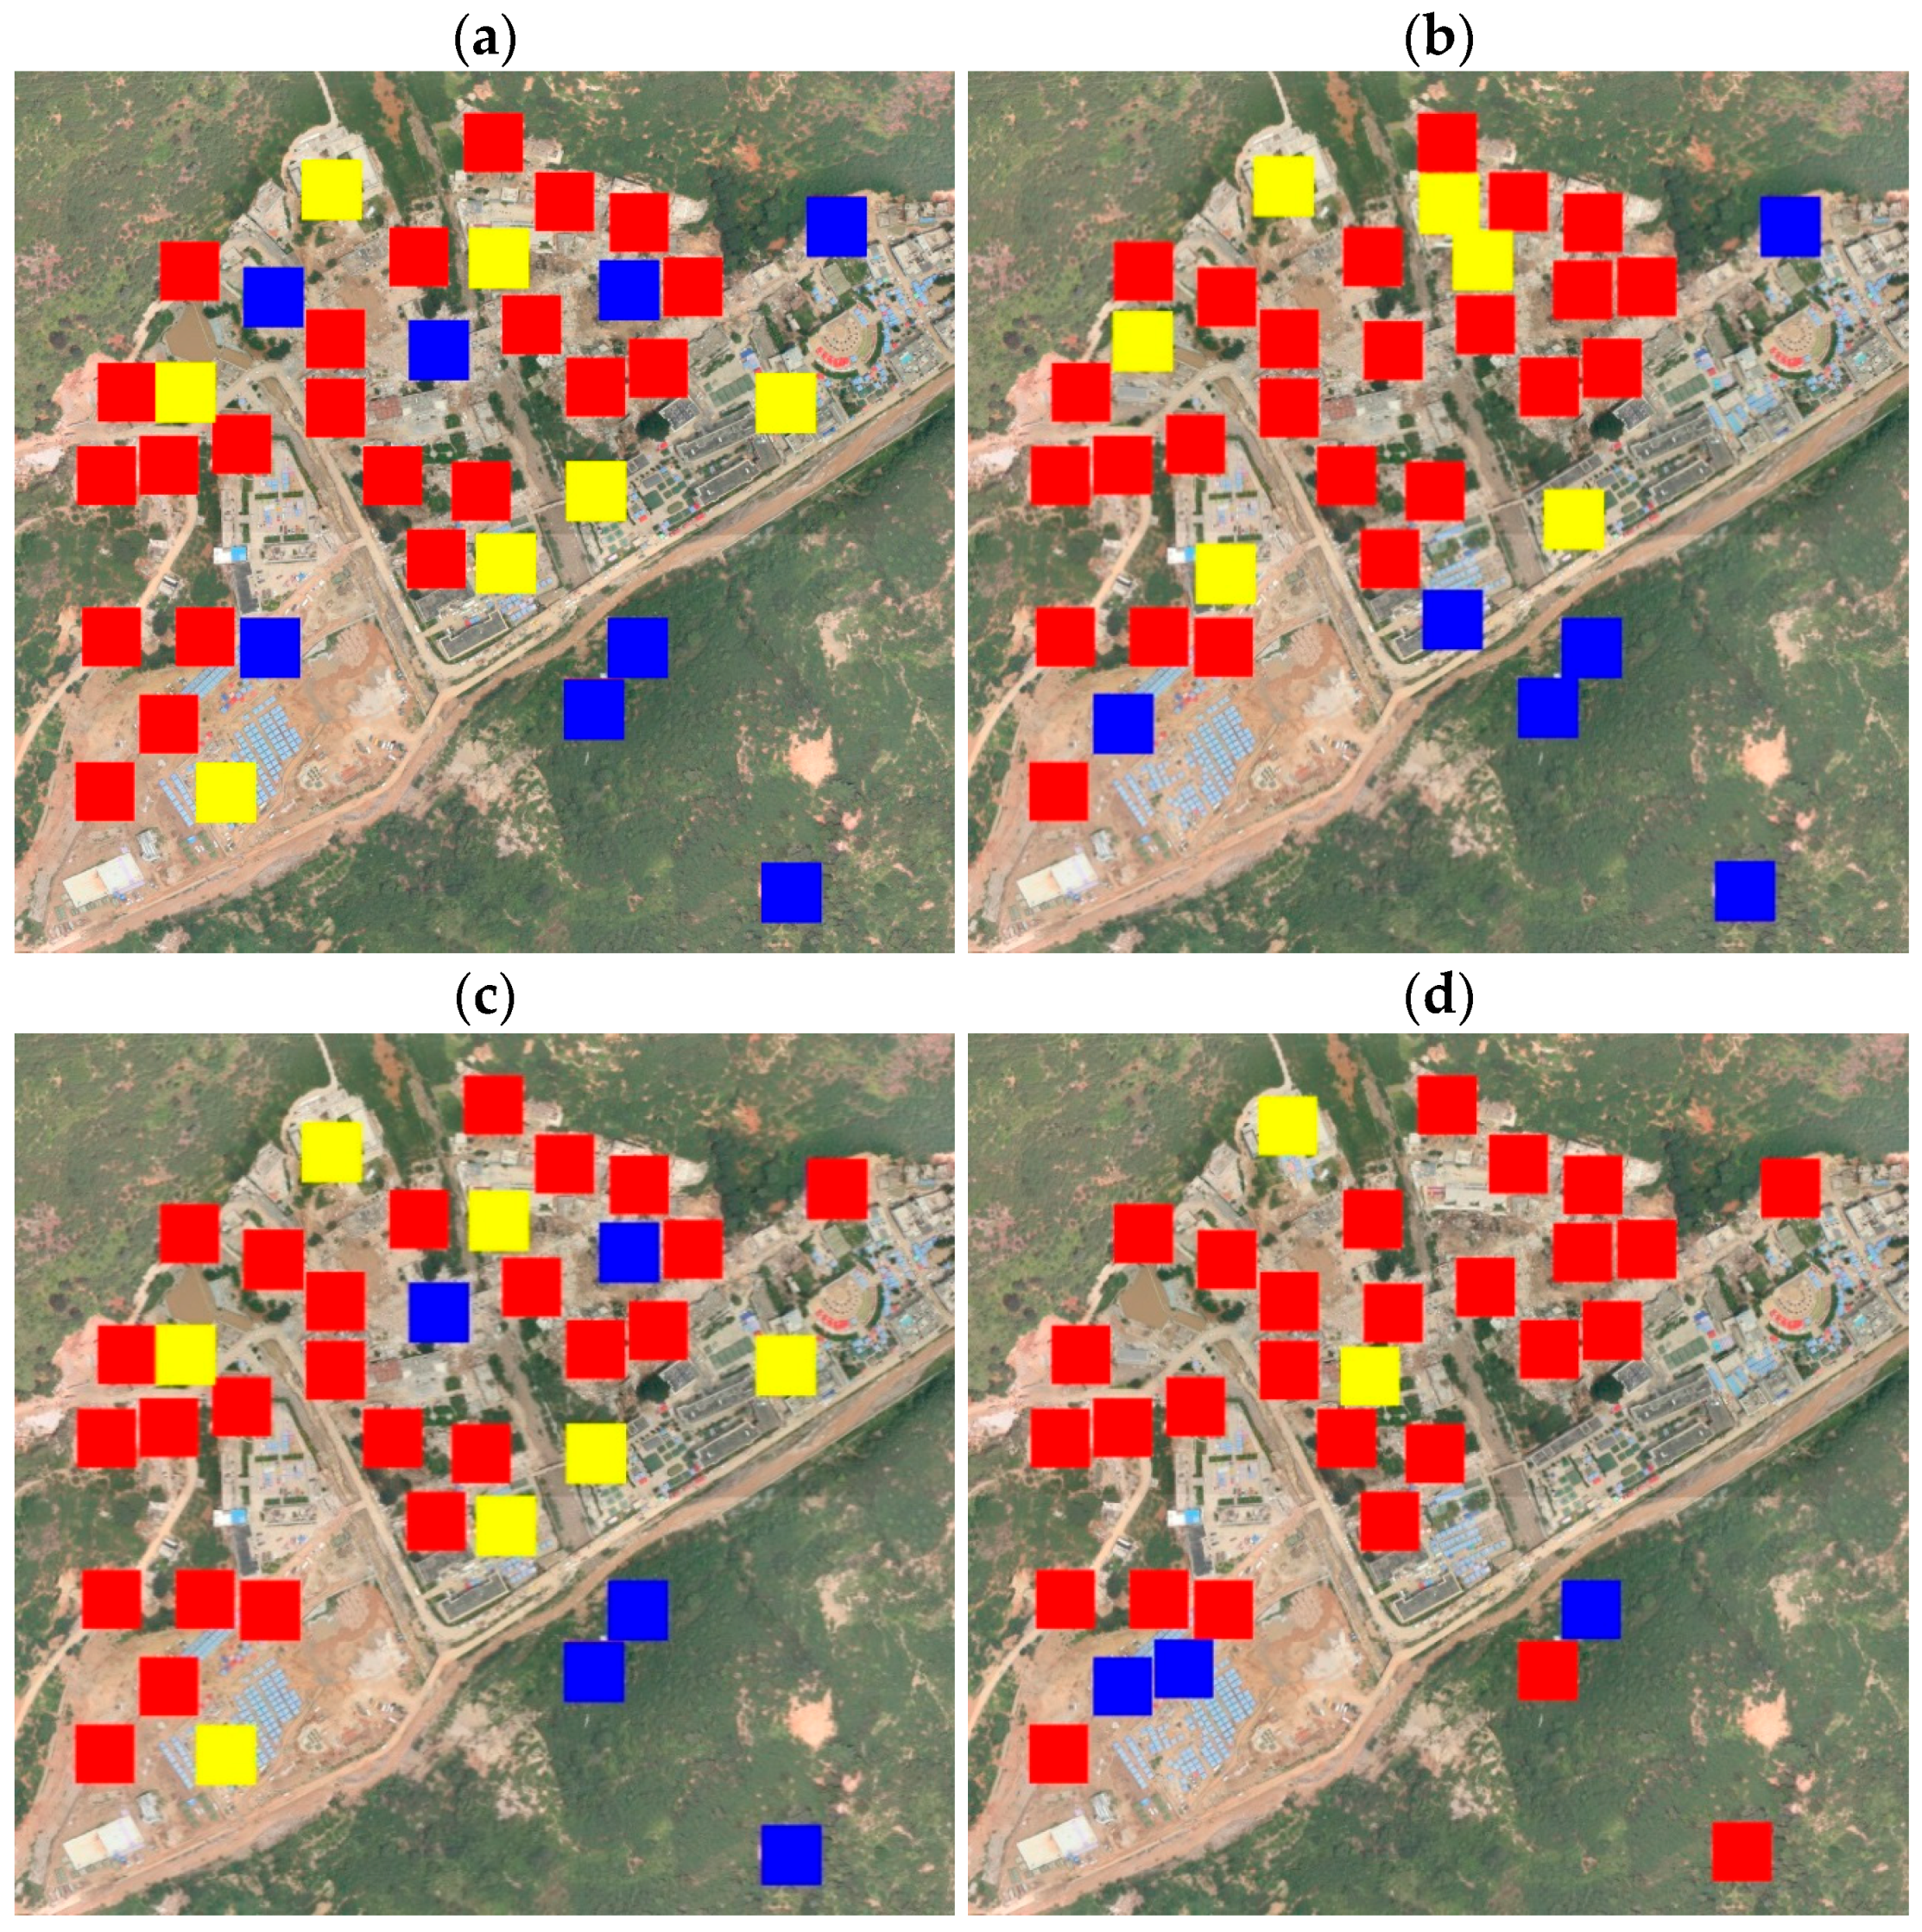
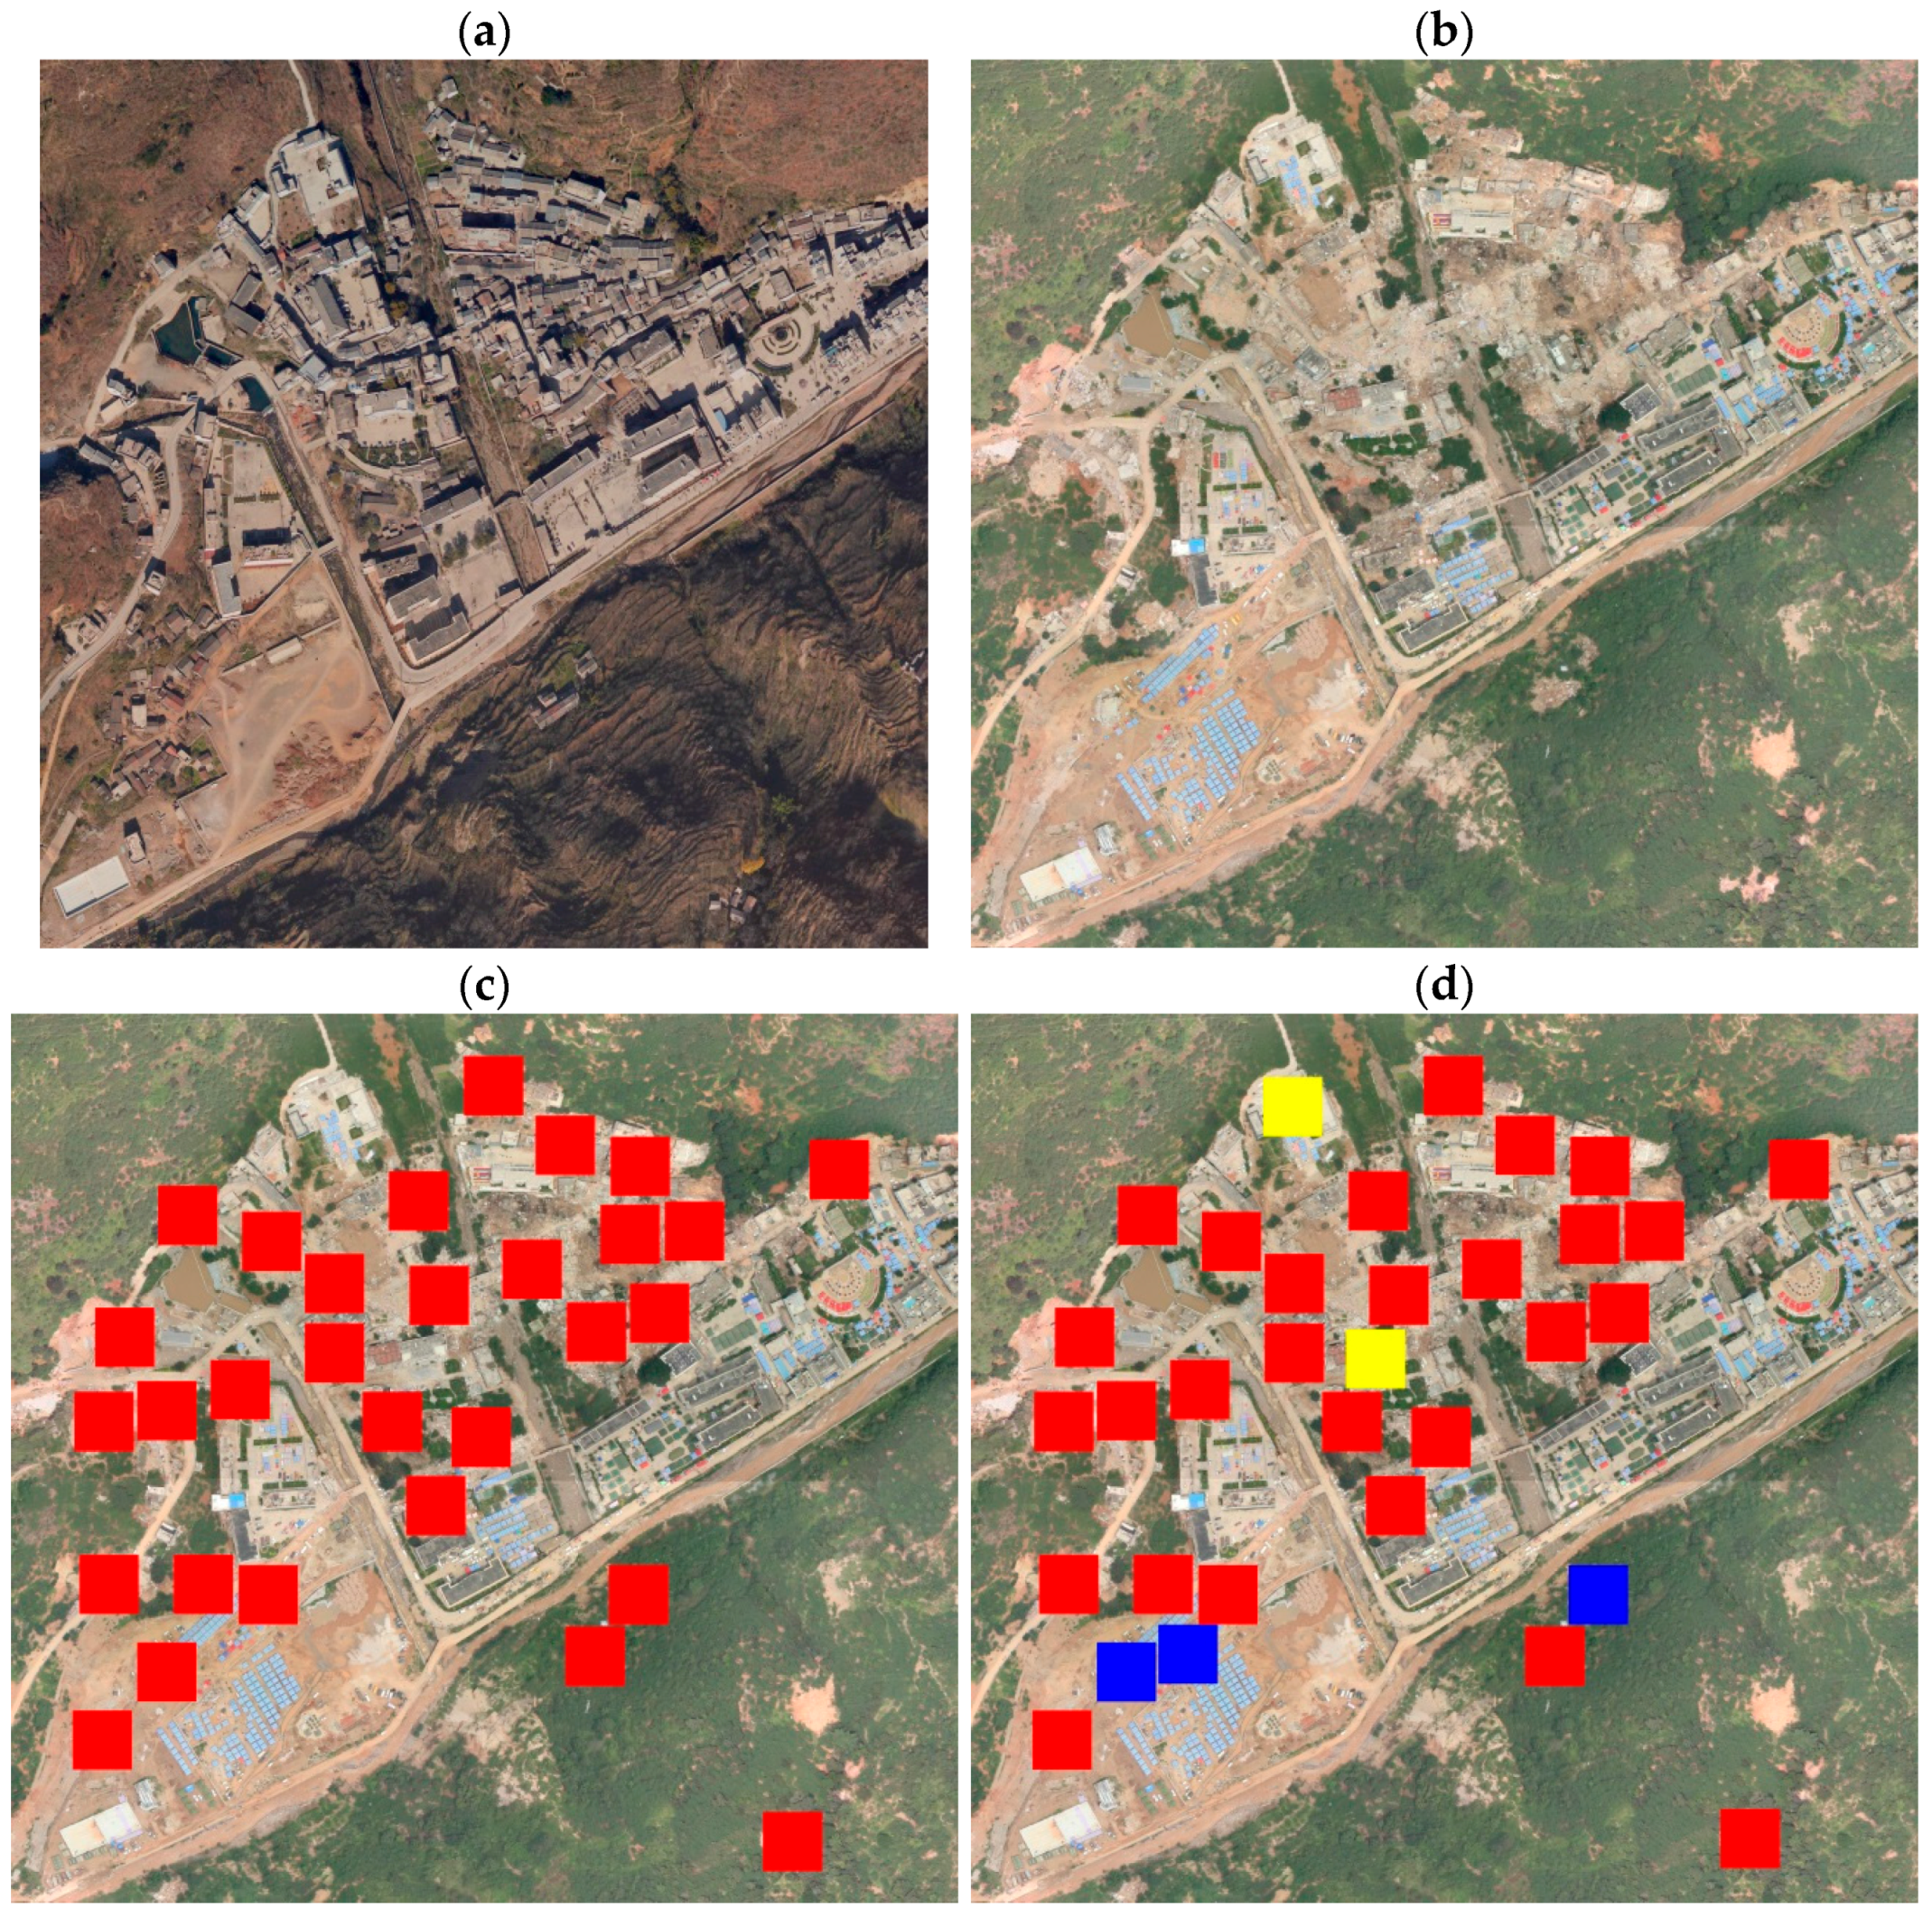
Figure 9 shows the detection results of damaged building regions. Three regions are false negative regions, marked by a blue square label; two regions are false positive regions, marked by a yellow square label, accuracy of detection result is 91.7%. The proposed method yields satisfactory detection results. However, a few falsely detected damaged regions still exist in some regions. For example,
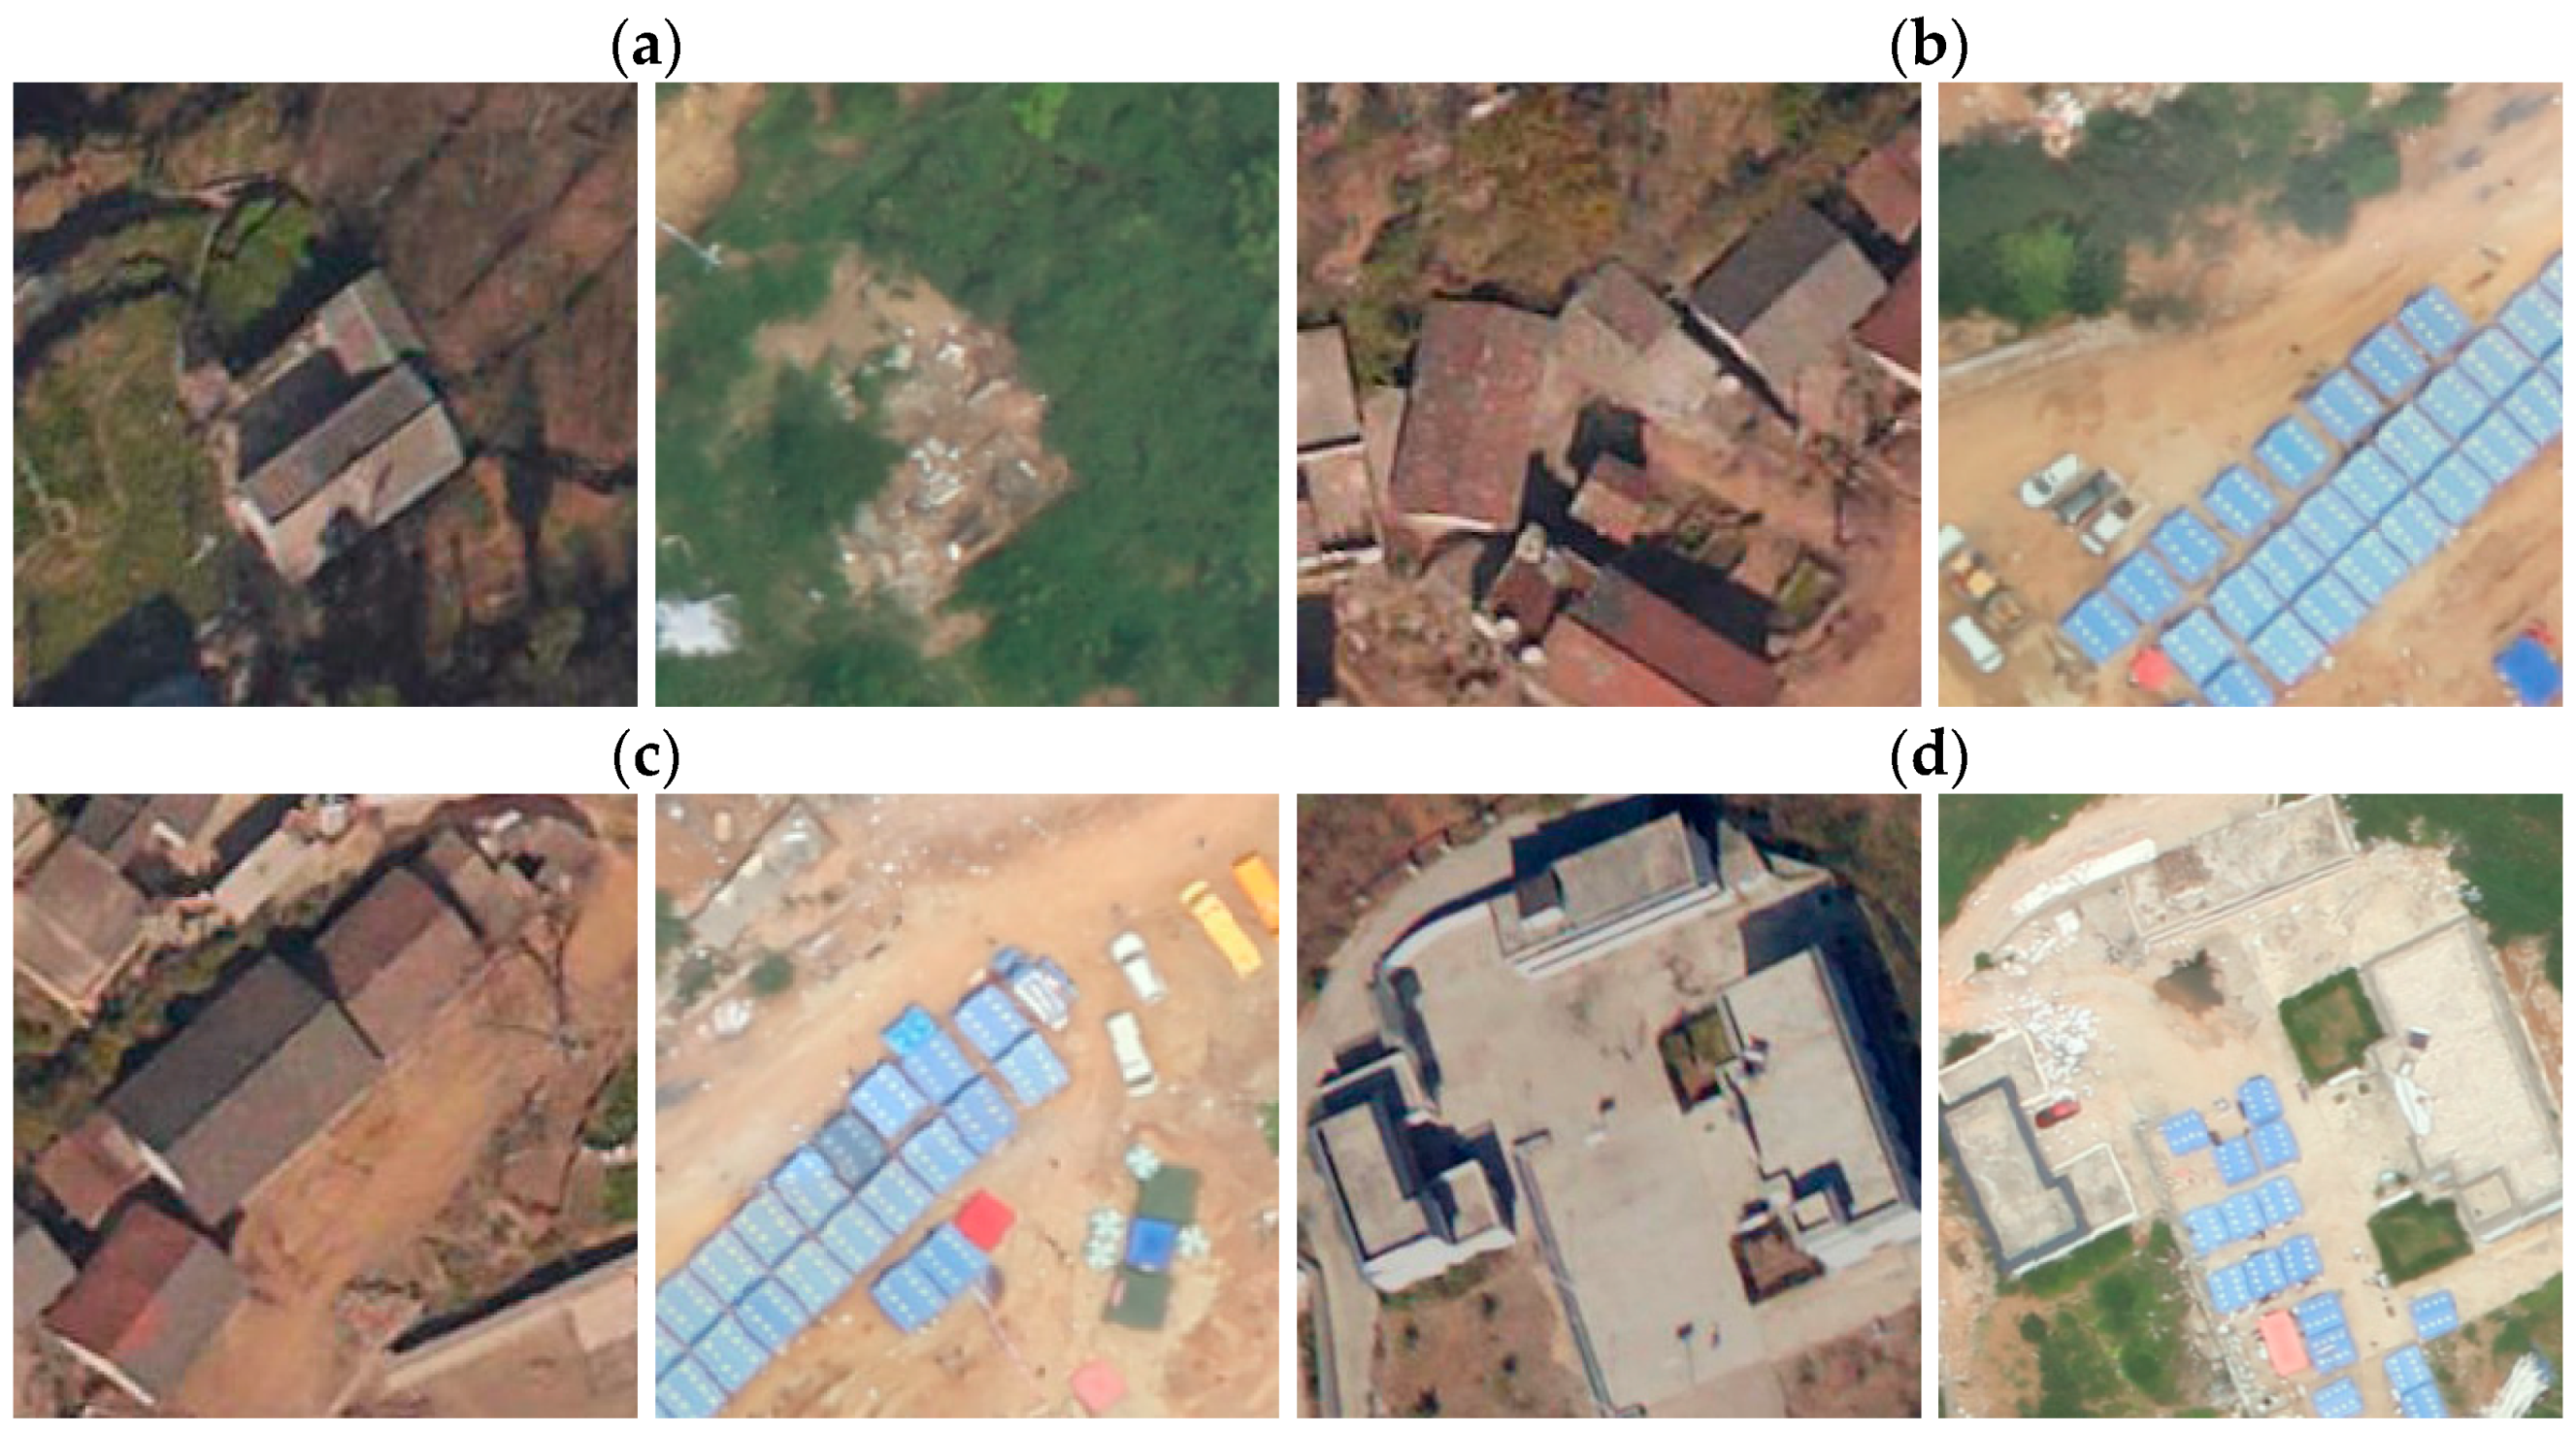
Figure 10 shows four image pairs of falsely detected regions.
Figure 10a shows that a damaged building region is surrounded by vegetation, our method determining this case as a change from building scene to vegetation scene, so this case cannot be detected.
Figure 10b,c shows change from a building to tent scene, so our method cannot also detect this case as damaged regions.
Figure 10d shows that buildings are undamaged, but existing debris or rubble is on the ground, so the method classifies this case as damage, when in fact damage does not exist in the example. The cases of
Figure 10a–c were treated as undamaged regions, but the case of
Figure 10d was treated as a damaged region.
To further evaluate the performance of this method, we utilized two indices to describe the performance of the proposed method. Precision and recall were compared to methods based on the spectral and SIFT features, the spectral and the gray-level co-occurrence matrix (GLCM) [
29], and the spectral and pyramid features [
30].
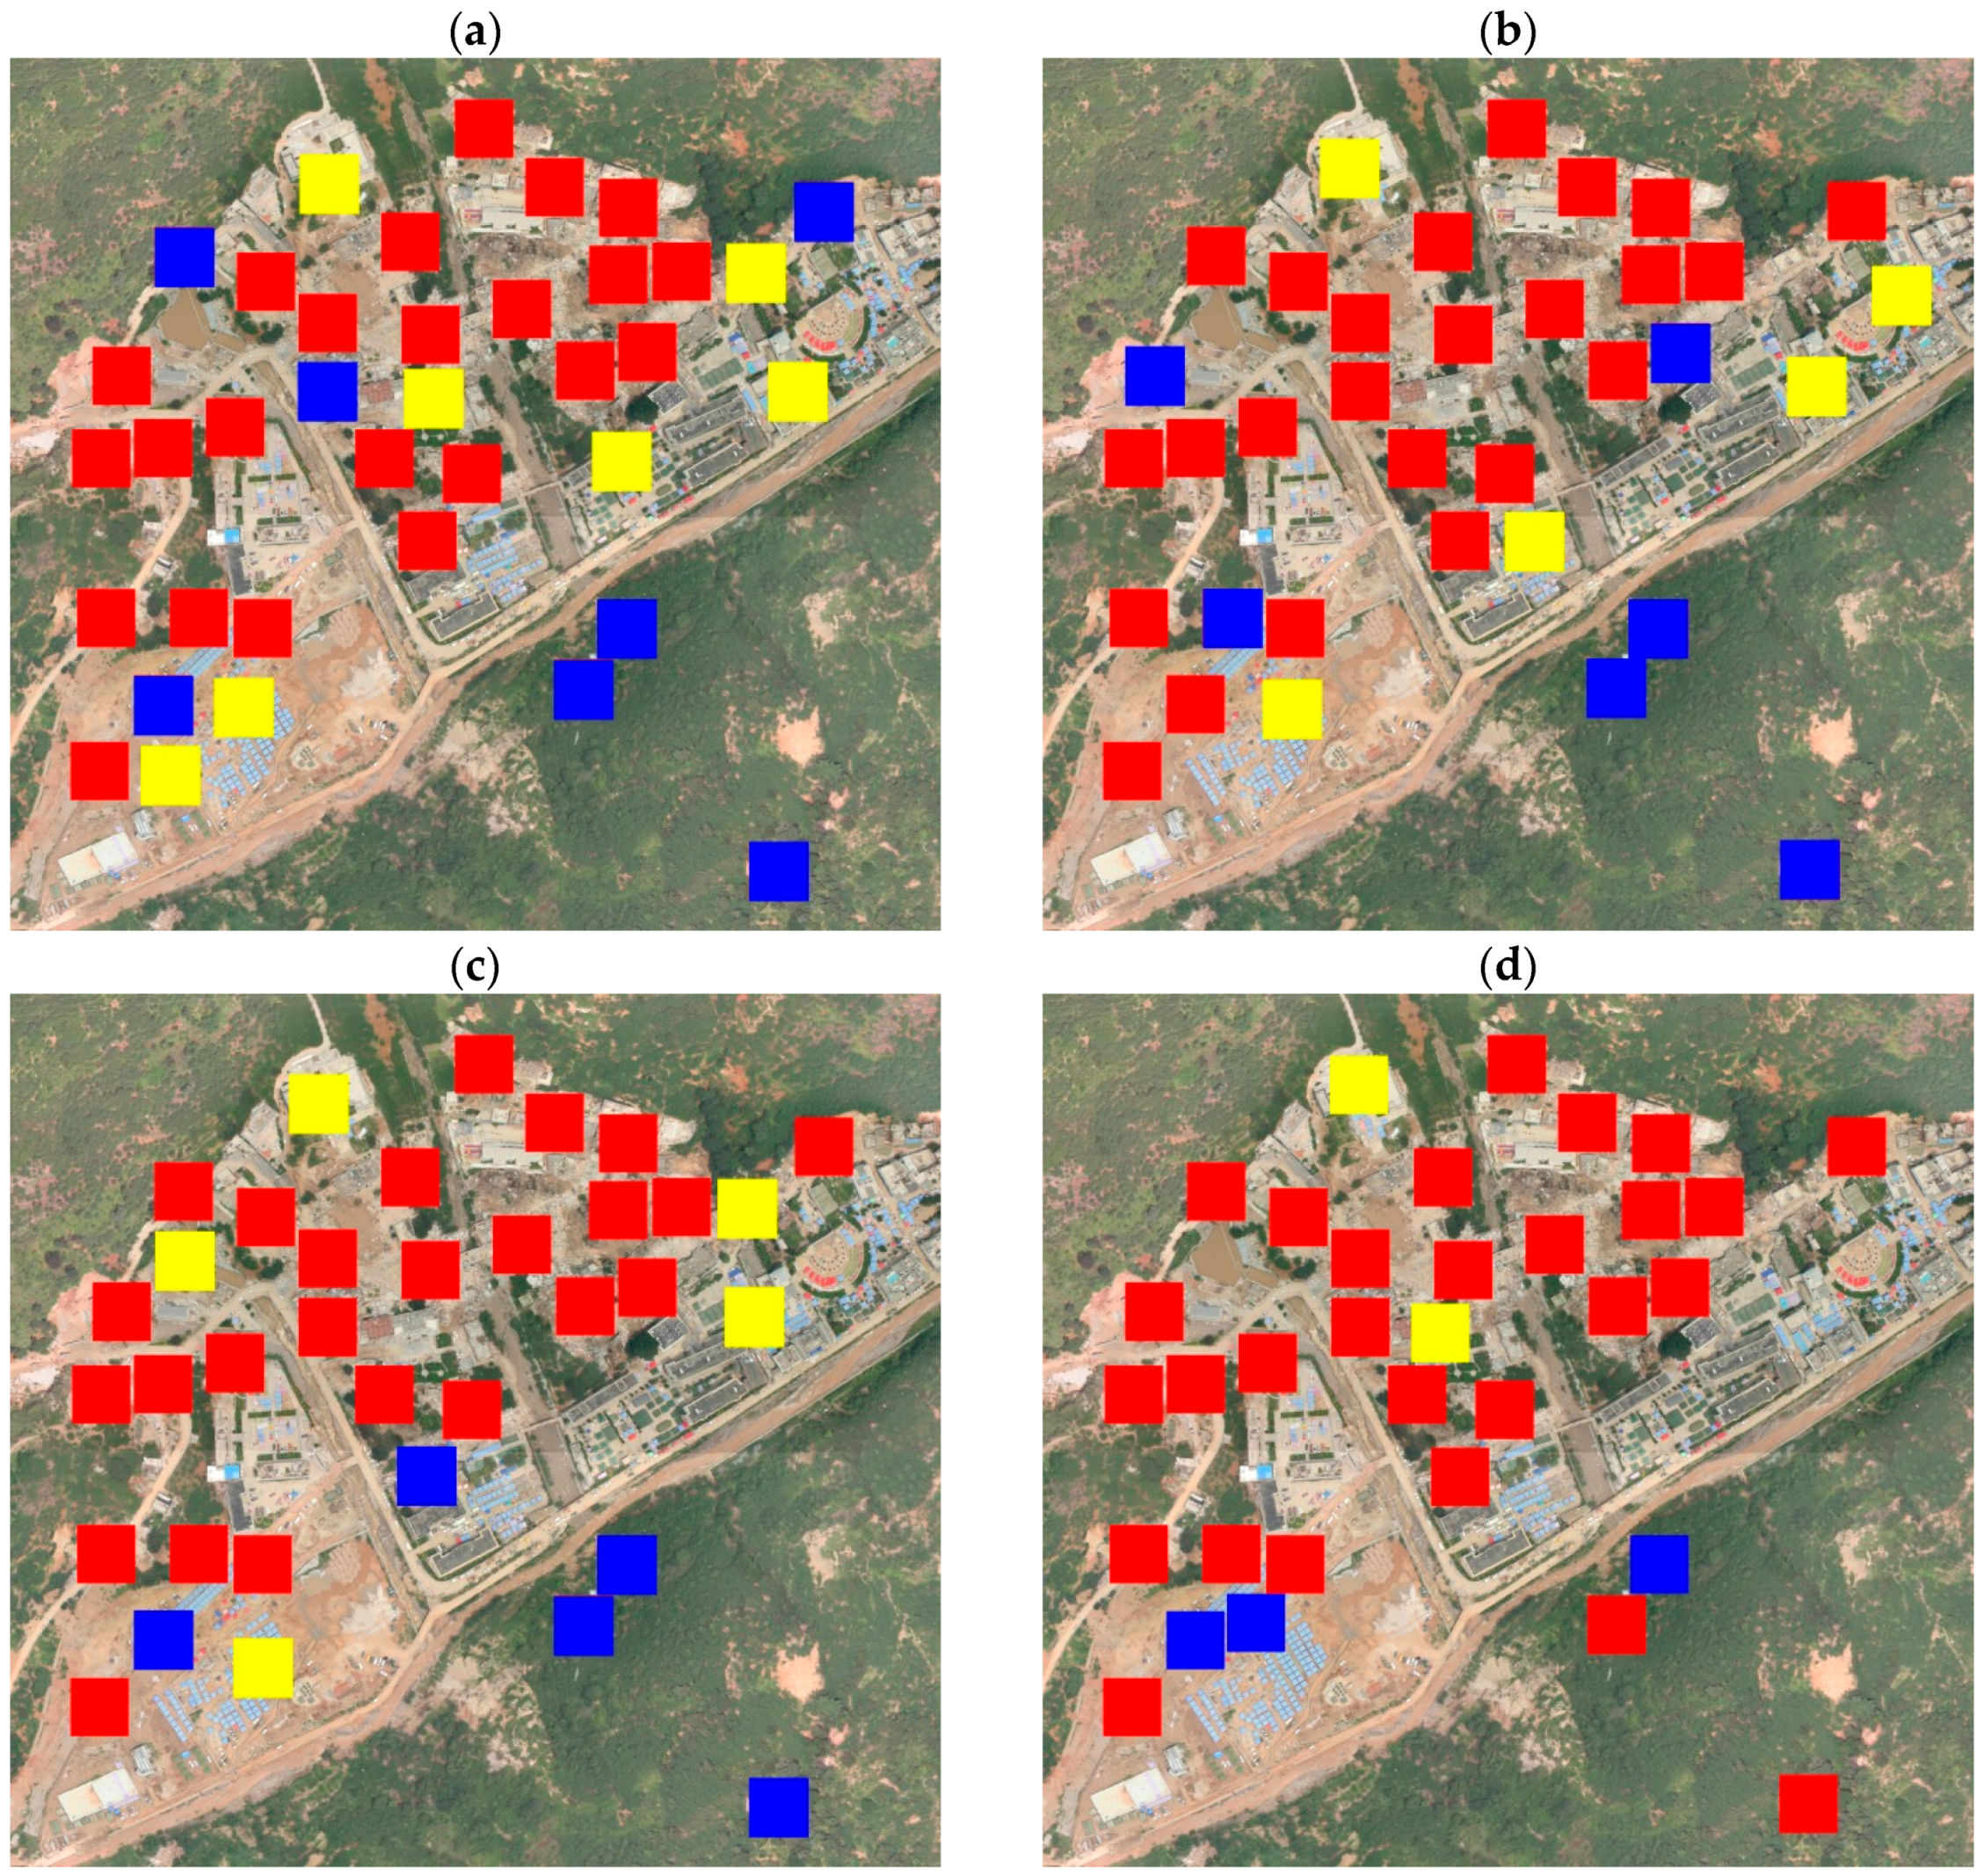
Figure 11 shows the detection results of damaged building regions using a variant combination of features. As shown from
Table 2, there were 60 sample results of precision and recall using various combinations of features. The results show that the proposed method produces better precision and recall. Note that the color + GLCM method is the fastest to compute, but accuracy suffers. The color + pyramid method is more accurate than color + GCLM and color + SIFT methods, but its performance is less efficient. The computation time of the proposed method and color + SIFT is similar, but our method has better accuracy than all alternate features. With damaged regions such as debris or rubble, the texture is more chaotic than undamaged regions. SITI can capture more texture details than GLCM and pyramid, suggesting that the proposed method can obtain better results.
We also compared the proposed method to damaged building region detection with other methods of scene change detection. The study tested the proposed method against the latent dirichlet allocation (LDA) method in Reference [
31], the probabilistic latent semantic analysis (PLSA) method in [
32], and the Euclidean distance between multi-temporal visual words frequencies method in [
33].
Figure 11 shows the visual results of damaged building region detection.
Table 3 shows the accuracy results compared to the other methods. Based on
Figure 12 and
Table 3, the proposed method was the most accurate. The threshold method in [
33] needed to select a suitable threshold value, which is a difficult problem, compromising self-adaption and robustness. Both PLSA and LDA use the probabilistic methods to classify, and SVM classifier is a binary supervised classifier, which can accurately combine many features to find an optimal separating hyperplane. This also takes into account each example in the entire feature space when creating the separating hypersurface. The visual BOW model uses the visual words frequency to describe the object, SVM is a more suitable classifier. This is the main reason that our study obtained better results.
The proposed method detects the damaged building region rather than the details of damaged areas. The main reason for this is that emergency managers need to know the approximate region of a damaged building for emergency response actions and rescue work. Detailed damaged building detection is used to reconstruct after the initial disaster response is over. Therefore, the proposed method is an effective method to detect the damaged region of a building in both the qualitative and quantitative aspects.
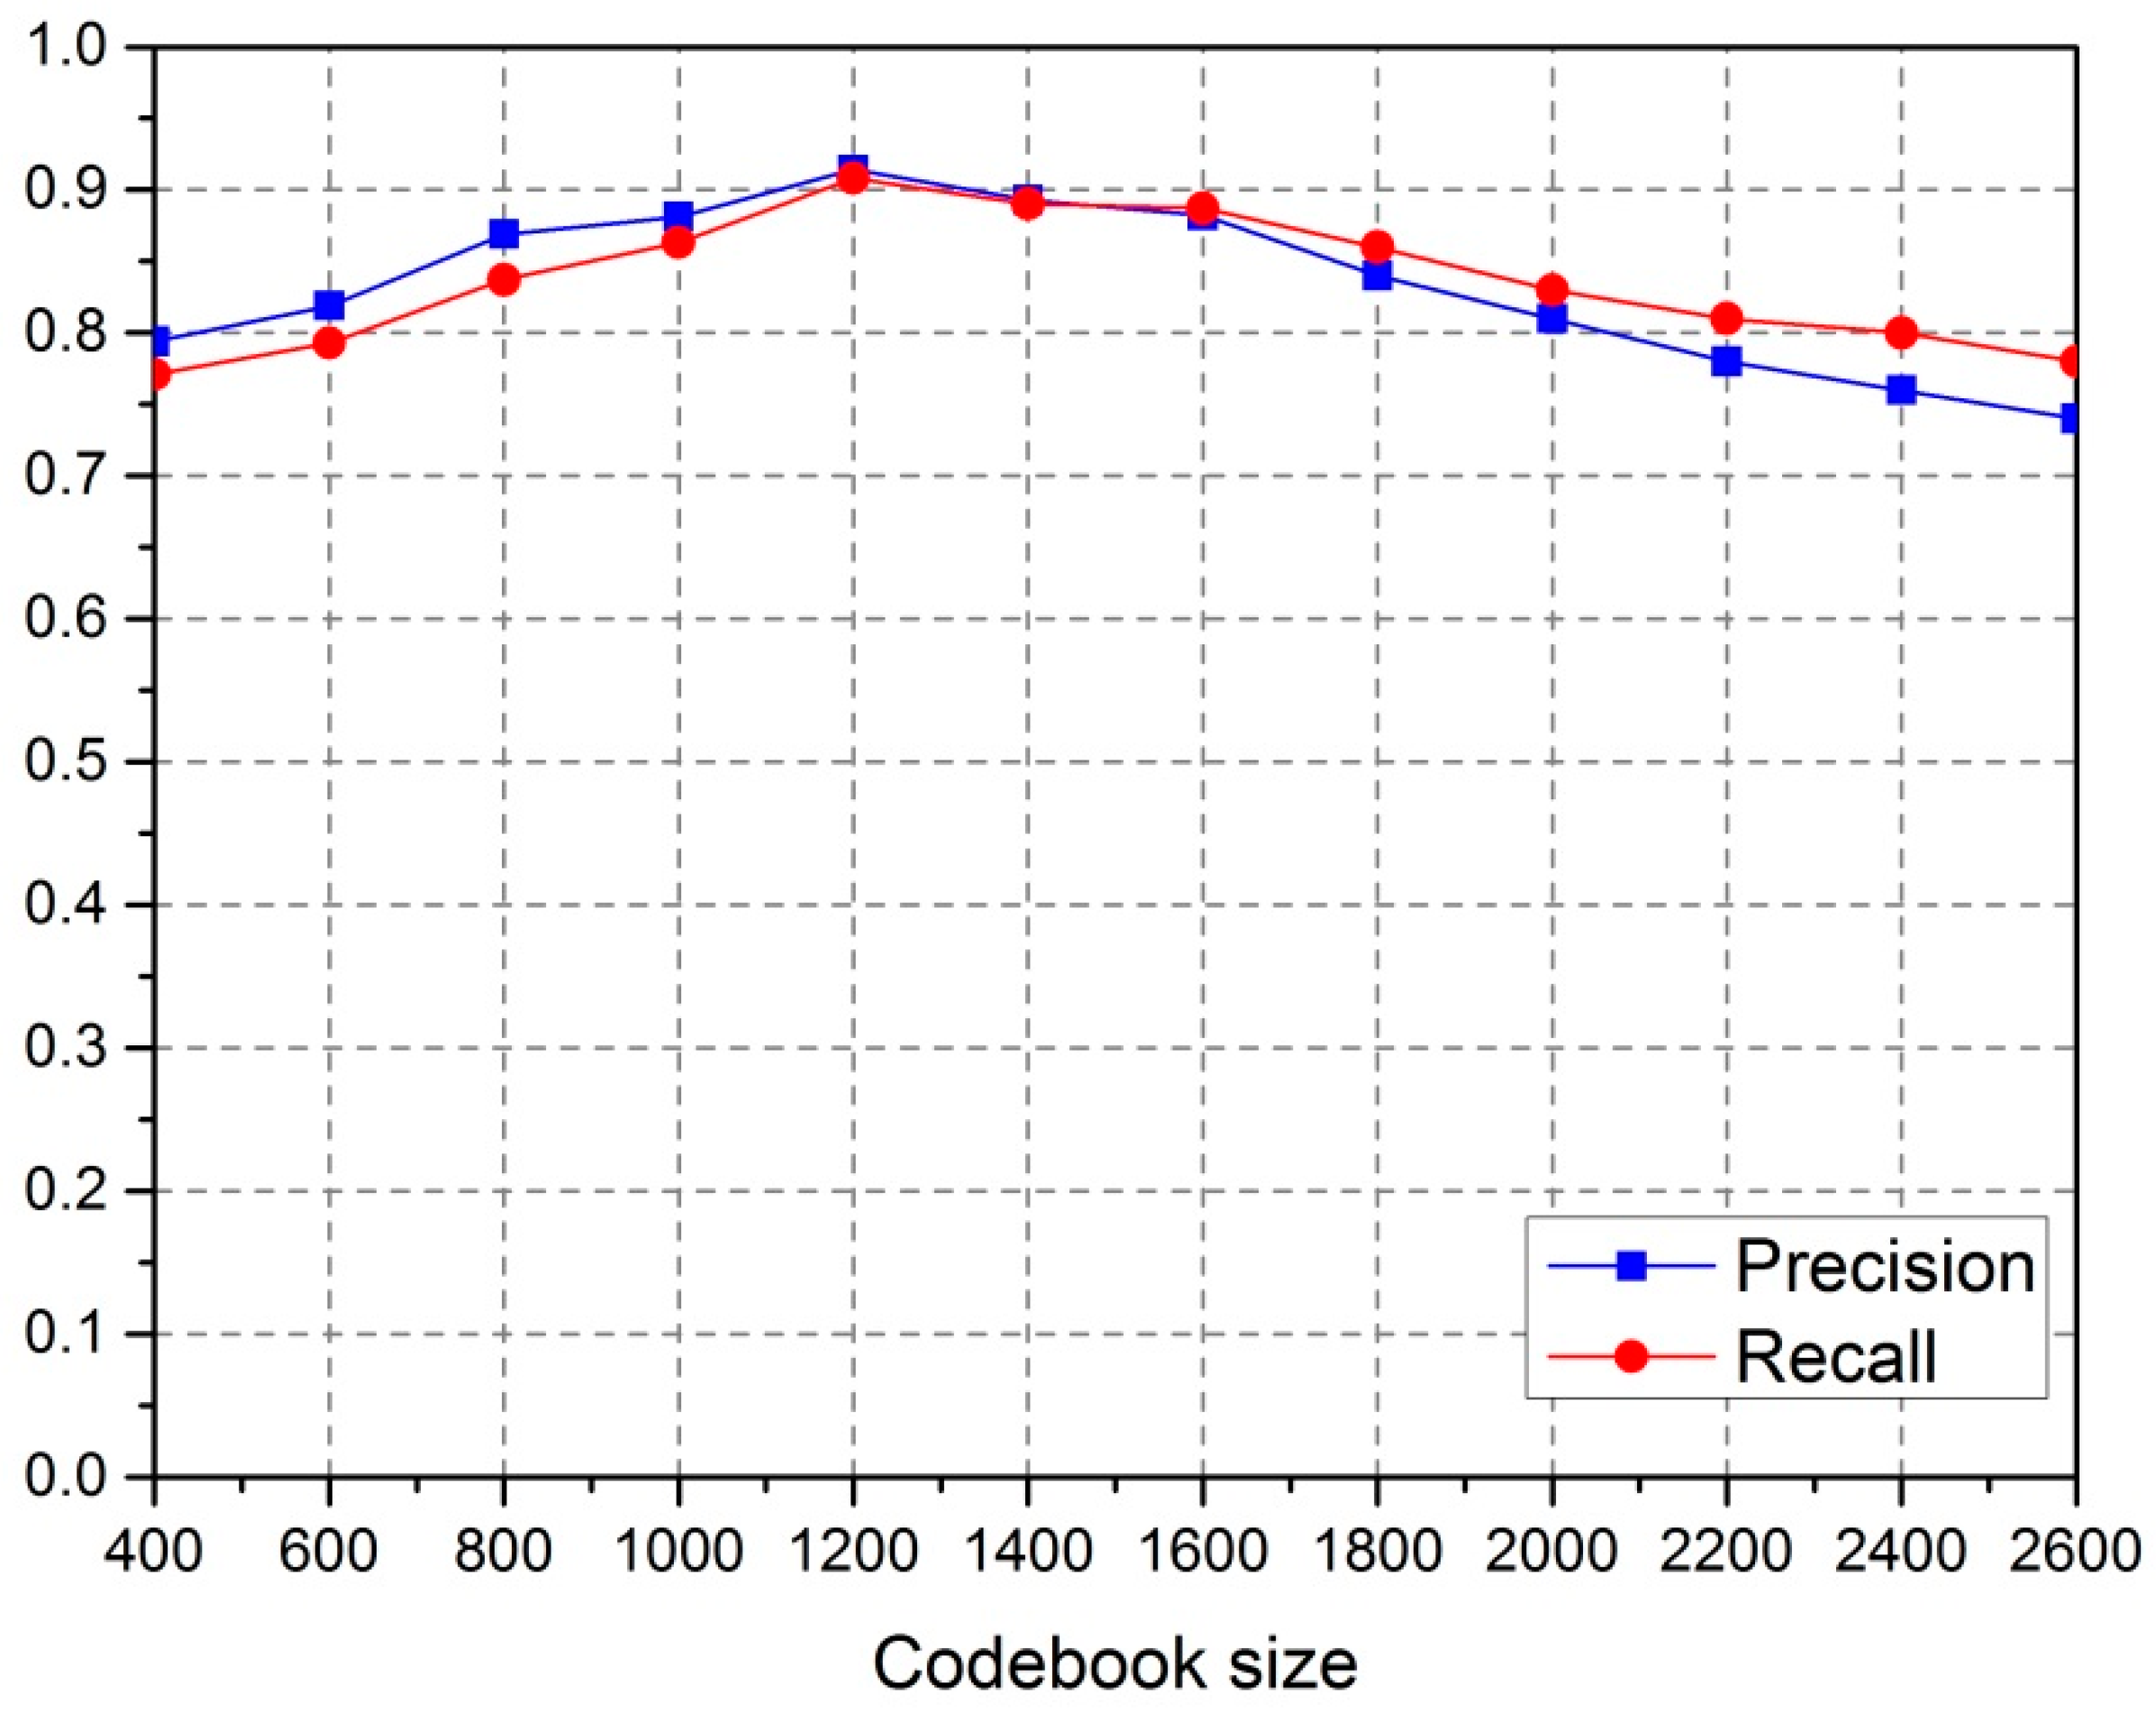
4.3. Sensitivity Analysis
The size of the codebook
K is a key parameter in the visual Bag-of-Words model, which determines the number of visual words for the object in training and classification. In the experiments, we tested the different values of
K suitable for detection precision and recall, which were used to evaluate the sensitivity of
K during detection. The experimental results are shown in
Figure 13. The highest overall quality was achieved when the value of
K was 1200.
5. Conclusions
In this paper, we proposed a novel method of damaged building region detection based on the visual BOW model and classification method, which is beneficial for emergency response actions and rescue work after a disaster. Firstly, the building regions in the pre-disaster image are acquired by scene classification based on visual BOW. Then, pre- and post-disaster change in building scenes are uniformly encoded as the visual words frequency and trained using the SVM classifier. Finally, pre-disaster building regions are superimposed over post-disaster images, and two regions were uniformly encoded to the visual words frequency, while damaged and non-damaged regions were discriminated using the SVM classifier. The experimental results show that the proposed method is feasible and effective in detecting the damaged building regions, and demonstrate a practical significance to the study of building damage detection techniques.
The proposed damaged building region detection method based on semantic scene change has great potential in building damage detection for emergency response actions and rescue work after disasters. In the future, the proposed method will be adapted to building damage region detection based on different scales and data sources.


